the Creative Commons Attribution 4.0 License.
the Creative Commons Attribution 4.0 License.
 | 01 Oct 2024
Tracking slow-moving landslides with PlanetScope data: new perspectives on the satellite's perspective
Bodo Bookhagen
PlanetScope data with daily temporal and 3 m spatial resolution hold an unprecedented potential to quantify and monitor surface displacements from space. Slow-moving landslides, however, are complex and dynamic targets that alter their topography over time. This leads to orthorectification errors, resulting in inaccurate displacement estimates when images acquired from varying satellite perspectives are correlated. These errors become particularly concerning when the magnitude of orthorectification error exceeds the signal from surface displacement, which is the case for many slow-moving landslides with annual velocities of 1–40 m yr−1. This study provides a comprehensive assessment of orthorectification errors in PlanetScope imagery and presents effective mitigation strategies for both unrectified Level 1B (L1B) and orthorectified Level 3B (L3B) data. By implementing these strategies, we achieve sub-pixel accuracy, enabling the estimation of realistic and temporally coherent displacement over landslide surfaces. The improved signal-to-noise ratio results in higher-quality displacement maps, allowing a more detailed analysis of landslide dynamics and their driving factors.
- Article
(17248 KB) - Full-text XML
-
Supplement
(39152 KB) - BibTeX
- EndNote


Optical image offset tracking is a standard method for quantifying horizontal surface displacement caused by landslides (e.g., Stumpf et al., 2014, 2017; Lacroix et al., 2019; Dille et al., 2021), glaciers (e.g., Kääb et al., 2016; Gardner et al., 2018; Lei et al., 2021; Aati et al., 2022a), earthquakes (e.g., Leprince et al., 2007; Kääb et al., 2017; Feng et al., 2019; Socquet et al., 2019; Aati et al., 2022a), and other geomorphic processes that offset land surfaces over time. The conceptual approach relies on two or more consecutive images of a common area of interest (AOI) and detects displacements between them. Optical offset measurements are complementary to line-of-sight measurements from radar interferometry: they are sensitive to both north–south (NS) and east–west (EW) components and can track meter-scale displacements in the image plane without losing coherence. Images with a high spatial resolution of < 5 m enable the detection of small offsets, and extensive satellite and air photo archives allow analyses of ground motions to be extended to the last decades (Milliner et al., 2016; Andreuttiova et al., 2022). Recent advancements in satellite technologies, especially CubeSat, have led to an increase in the number of high-quality instruments in orbit (Mehrparvar et al., 2014). CubeSats can provide optical images at high spatial and temporal resolutions, reducing the limitations inherent to optical data: higher spatial resolution allows the detection of finer-scale movements, while daily coverage increases the likelihood of obtaining cloud-free imagery. Remotely sensed data hold great potential for studying Earth surface processes in remote and challenging terrain, where installing permanent Global Navigation Satellite System (GNSS) stations or cameras is impractical due to access difficulties. In these regions, image cross-correlation is a cost-effective technique to provide insights into past and recent surface displacement.
In this study, we explore the potential of optical PlanetScope data to study surface displacements related to slow-moving landslides. PlanetScope currently represents the largest commercial Earth observation satellite constellation in orbit and provides daily optical acquisitions at 3 m spatial resolution (Planet, 2022b). PlanetScope data offer new opportunities for understanding landslide dynamics and land deformation processes (Mazzanti et al., 2020; Hermle et al., 2021; Dille et al., 2021; Muhammad et al., 2022; Amici et al., 2022; Lacroix et al., 2023). However, the use of high-resolution optical data in displacement analysis poses various technical challenges, particularly when precise sub-pixel measurements and high accuracies are required. One of the main limitations in utilizing optical data for displacement analysis is the inherent relative geolocation accuracy. Relative geolocation accuracy refers to the positional alignment of scenes capturing the same area and can be affected by specific geometric distortions, sensor noise, and calibration errors of the acquiring instruments. While the relative geolocation accuracy of PlanetScope images is typically below 2 pixels (6 m) (Planet, 2022a), landslides that have significantly altered the landscape over time are prone to orthorectification errors that locally degrade the co-registration between scenes, resulting in substantial biases in derived displacement estimates in these areas. Orthorectification errors are not exclusive to the PlanetScope constellation and have been documented for other satellite systems, such as Sentinel-2 cross-track pairs (Kääb et al., 2016; Chudley et al., 2022). PlanetScope scenes, however, are acquired by different sensors at different view angles and positions, which makes their offset tracking results highly susceptible to bias related to outdated digital elevation model (DEM) heights.
Several studies have worked on improving the relative geolocation accuracy of PlanetScope scenes, focusing largely on data acquired by the older PS2 generation. The proposed mitigation strategies include registering PlanetScope scenes to high-resolution reference imagery (Dille et al., 2021), subtracting the median displacement estimated over stable terrain (Lacroix et al., 2023), efficiently removing global shifts, and the fitting of polynomials (Kääb et al., 2017, 2019; Feng et al., 2019). Lacroix et al. (2023) additionally used a strategy of time series inversion of the displacement field to reduce the global uncertainties, leading to an error of about one-quarter of a pixel. A recent study by Aati et al. (2022a) proposed an unsupervised learning technique to separate true displacement signals from artifacts and noise based on maximum spatiotemporal coherence from a stack of correlations derived from orthorectified Level 3B (L3B) mosaic images, applicable to all PlanetScope generations (Aati et al., 2022a). Additionally, Aati et al. (2022a) suggested refining the rational function model (RFM) of Level 1B (L1B) data based on pointing error minimization. Aati et al. (2022a) used the refined RFMs to construct DEMs out of PS2 scenes and assess elevation changes. They also showed that PS2 images rectified with refined rational polynomial coefficient (RPC) models exhibited displacements following a zero-centered Gaussian distribution with a standard deviation of ∼ 1 pixel when correlated. PS2.SD and PSB.SD scenes were regarded as unsuitable for stereo reconstruction due to their strong striping related to the misalignment of sub-frames and other artifacts (Aati et al., 2022a).
Our research contributes to these existing approaches and sets out to achieve the following:
-
examine the different sources of error compromising co-registration accuracy between PlanetScope scenes, particularly those captured by the generation of instruments launched since 2020 (PSB.SD);
-
present a workflow to mitigate the orthorectification error through a careful selection of correlation pairs based on a common satellite perspective (jointly determined by the satellite's look direction, view angle, and motion direction) for orthorectified L3B data;
-
enable the use of images acquired from different perspectives through manual orthorectification of unrectified L1B data based on an updated DEM derived from coincident Planet imagery;
-
propose corrections of the displacement maps through fitting polynomials to further diminish co-registration errors.
In this way, we can improve the signal-to-noise ratio and bring the estimated accuracy for displacement measurements into the sub-pixel range. This improvement in accuracy is essential for a more comprehensive assessment of the dynamics of slow-moving landslides through image cross-correlation. Slow-moving landslides typically exhibit annual velocities that are below the uncertainties introduced by orthorectification errors and other factors that compromise the relative geolocation accuracy. By addressing and minimizing these sources of error, image cross-correlation can provide valuable information on the behavior and movement of slow-moving landslides.
Slow-moving landslides are an important component of the geomorphic and natural hazard system. Due to ongoing climate changes and stochastic earthquake occurrences, they have large impacts on local communities, infrastructure, and sediment transport regimes (e.g., Mansour et al., 2011). Of particular interest are the driving factors for landslide generation and acceleration – these are often coupled to extreme rainfall or seismic events (e.g., Keefer, 2002; Hilley et al., 2004; Lacroix et al., 2015; Handwerger et al., 2019, 2022). Insights on the mechanisms controlling slow-moving landslides can be translated to catastrophic landslides whose physical parameters can rarely be studied during failure (Lacroix et al., 2020b). In this work, we exemplify the analysis of surface displacement rates with PlanetScope imagery for two geographic locations: the Siguas landslide located in Peru near Arequipa on the Pacific coast (Hermanns et al., 2012; Lacroix et al., 2019, 2020a; Graber et al., 2021) and the Del Medio landslide in the eastern Andes in northwestern Argentina near the town of Jujuy (Savi et al., 2016; Purinton and Bookhagen, 2018).
We investigate two exemplary slow-moving landslides with velocities between ∼ 2–40 m yr−1 (Lacroix et al., 2019), located on the western flank of the central Andes in southern Peru and in the eastern central Andes in northwestern Argentina (Fig. 1). To test and validate our approaches, we rely on previously identified and described settings. Both landslides have experienced substantial elevation changes since the acquisition of the SRTM DEM in the year 2000 (Fig. 2), making these sites particularly vulnerable to orthorectification errors.

Figure 1Copernicus 30 m topography of the Del Medio (a, b) and Siguas (c, d) landslides. Major cities are indicated by white stars, and the extent of the study area is shown by the white-outlined inset box. Black lines show the major road networks, and the white line in panels (a) and (b) outlines the eastern border of the internally drained central Andean Plateau. Hillslope angles derived from the Copernicus DEM show the steep terrain in the eastern Andes (b) and the low-sloping alluvial plain in southwestern Peru (d).

Figure 2Elevation difference between the SRTM DEM (reprocessed version now called NASADEM) from 2000 (NASA JPL, 2021) and the Copernicus DEM from 2011–2015 (European Space Agency, 2021) across the Siguas landslide (a) and the Del Medio landslide (b). Both landslides have accumulated elevation changes of more than 75 m as a result of rapid rockfall events and gradual landslide motion. The DEMs were aligned using demcoreg (Shean et al., 2016).
The Del Medio landslide is situated at the southern end of the Humahuaca Basin at approximately −65.56° longitude and −23.93° latitude (Fig. 1a, b). The transition from the Andean foreland (∼ 1500 m) to the internally drained Altiplano–Puna plateau with elevations above ∼ 4000 m is characterized by steep terrain with high erosion rates, sparse vegetation cover, and frequent rainstorm events (e.g., Bookhagen and Strecker, 2012; Castino et al., 2017). These conditions, in combination with pre-existing fault structures and active tectonic deformation (Strecker et al., 2007; Figueroa et al., 2021), are ideal for slope movement processes, including debris flows and landslides (e.g., Savi et al., 2016; Purinton and Bookhagen, 2018; Mueting et al., 2021). The Del Medio landslide failed catastrophically in 2009 and has continued to creep downhill after the initial rockfall incident.
The Siguas landslide is located in southern Peru at approximately −72.15° longitude and −16.37° latitude (Fig. 1c, d) and has previously been described by Hermanns et al. (2012), Lacroix et al. (2019, 2020a), and Graber et al. (2021). It sits at the rim of the Siguas River valley, which is deeply incised into a wide, low-sloping alluvial plateau. The Majes-Siguas irrigation project has transformed the region since the 1980s, bringing water to the plateau above the river valley and converting the otherwise arid surface into agricultural land. The increased infiltration has affected groundwater conditions, and it triggered several large landslides in the early 2000s, including the Siguas landslide (Hermanns et al., 2012; Lacroix et al., 2020a; Graber et al., 2021). Since its initiation in 2005, the Siguas landslide has continued to move downhill at temporally variable rates (Lacroix et al., 2019).
The PlanetScope constellation, operated by Planet (Planet Labs PBC, San Francisco, CA, USA), consists of multiple generations of 3U CubeSats, called “Doves”. Approximately 130 of these Doves fly in a sun-synchronous orbit at 475–525 km height and continuously monitor the Earth's surface (Planet, 2022b). Their unique in-sequence arrangement captures consecutive images while the Earth rotates below (Kääb et al., 2017; Planet, 2022b). PlanetScope satellites carry a telescope and a charge-coupled device (CCD) array, which converts electromagnetic radiation into electronic signals (Kääb et al., 2017). Images are captured in a push-frame acquisition mode – a technique where filters are used to divide the CCD array into sub-frames, only allowing electromagnetic radiation of specific spectral wavelengths to pass. For the oldest generation of PlanetScope Doves with the instrument ID PS2 (also known as Dove-C), the CCD array is divided by a visible and near-infrared (NIR) bandpass filter (Planet, 2022a, 2023). A Bayer pattern filter, covering the entire CCD sensor, allows the separation of red, green, and blue (RGB) bands (Planet, 2022a). The final four-band scene is obtained by merging the RGB image acquired by the top half of the image with the NIR acquisition from an adjacent frame covering the same area (Planet, 2023) and will therefore be half the size of the original CCD array. The RGB bands are acquired simultaneously from the same satellite position, while the NIR band is captured a few seconds later and at a slightly different satellite position (Kääb et al., 2017; Planet, 2022a). This is an important consideration for image distortion and misalignment.
For the newer PlanetScope generations, PS2.SD (Dove-R) and PSB.SD (SuperDove), the Bayer pattern filter was replaced with a butcher block filter for improved optical quality (Aati et al., 2022a; Planet, 2023). The filter divides the image frame into four (PS2.SD) or eight (PSB.SD) homogeneous sub-frames capturing reflected electromagnetic radiation at different wavelengths. A composite scene is then produced by aligning and merging sub-frames of a common wavelength on both sides of a given frame (Aati et al., 2022a; Planet, 2023). In contrast to PS2 scenes, the newer-generation images are not acquired at a single camera position. PS2.SD and PSB.SD scenes are a composite of stripes acquired by a moving satellite that were aligned using a homography estimated from matching features across an ∼ 8 % overlap, assuming flat terrain (Aati et al., 2022a). While this stitching process allows the production of larger and sharper images (Bayer pattern interpolation is avoided), it may also introduce artifacts which will be further discussed in this work. The archive of PS2 data dates back to 2016; PS2.SD data have been available since March 2019. Both generations were decommissioned in April 2022, leaving PSB.SD as the only active imaging PlanetScope instrument in orbit at the time of writing (September 2024). The earliest available PSB.SD images are from March 2020 (Planet, 2022b).
PlanetScope scenes are available as rectified and unrectified assets. Level 1B (L1B) data represent the rawest form accessible for download to the general user. The image is stored as scaled top-of-atmosphere radiance as seen from the satellite in space (Planet, 2022b). Geometric adjustments at the sensor are limited to the correction of spacecraft-related effects through attitude telemetry and ephemeris data and through refinement using ground control points (GCPs) (Planet, 2022b). GCPs are derived by matching PlanetScope scenes to optical reference images (e.g., the National Agriculture Imagery Program (NAIP), the sensor on board the Advanced Land Observing Satellite (ALOS), Landsat, and other high-resolution images) (Planet, 2022b). L1B scenes are not projected to a cartographic projection – users are provided with rational polynomial coefficients (RPCs) to enable orthorectification without revealing the intrinsic sensor parameters. RPCs are the coefficients of the rational function model (RFM) (or RPC model), which is a replacement model for the physical sensor model (Tao and Hu, 2001). The RFM allows the transformation between 2D image and 3D object space coordinates by modeling the transformation as a ratio of two third-order polynomials (Tao and Hu, 2001; Grodecki and Dial, 2003). It is important to note that the RFM is only an approximation of the true transformation and may not be sufficiently accurate for tasks such as 3D extractions or precise georeferencing (Aati and Avouac, 2020). The current RPCs supplied with PlanetScope L1B data provide a positional accuracy that is typically below 2 pixels (6 m) (Planet, 2022a).
For users seeking pre-processed and ready-to-use georeferenced imagery, Planet provides the Level 3B (L3B) data product. L3B scenes underwent a correction for terrain distortions and were projected to a cartographic coordinate reference system. For orthorectification, Planet uses DEMs derived from different sensors, e.g., SRTM, Intermap, and local elevation datasets (Planet, 2022b).
3.1 Relative geolocation accuracy
In the most recent quality report, the relative geolocation accuracy of PlanetScope scenes was reported as 6.15 m at the 90th percentile of RMSEs for PSB.SD and 1.72 m for PS2 instruments (Planet, 2022a). While an ∼ 6 m geolocation accuracy will be sufficient for many applications, inherent pixel shifts exceeding the annual displacement rate of many slow-moving landslides will severely affect the estimated displacement. Additional geometric corrections are therefore necessary to obtain more accurate results through improved scene-to-scene alignment (Frazier and Hemingway, 2021). Displacement maps obtained from image cross-correlation of two PlanetScope scenes reveal several factors that compromise the co-registration accuracy, each with unique spatial patterns.
3.1.1 Orthorectification errors
In many displacement maps of the Siguas and Del Medio sites, we observe lateral distortion across the landslide surfaces (Fig. 3a). These errors are introduced during orthorectification and are related to errors in the reference DEM. When a DEM used for orthorectification does not represent the topography seen in the PlanetScope acquisition, a common observation in two images acquired from different perspectives will be projected to different locations in the orthoimage (Fig. 4). This creates a false offset signal that often exceeds the ∼ 2-pixel relative geolocation accuracy between two PlanetScope scenes and introduces significant bias to any attempt to quantify landslide movement through optical image correlation. Landslides are particularly vulnerable to orthorectification errors: they are commonly found in mountainous terrain where cliffs may be smoothed in a global DEM with 30 m resolution (e.g., Hirt, 2018; Purinton and Bookhagen, 2021). Additionally, mountainous regions are prone to DEM errors resulting from effects like foreshortening or occlusions (e.g., Purinton and Bookhagen, 2017). Even more important is the fact that landslides naturally alter the topography over time. Although slow-moving landslides with velocities of 1–10 m yr−1 change the terrain at a slower pace than rapid events, a DEM obtained years before the optical imagery may not reflect the current topography unless the movement is very slow or purely translational.

Figure 3Spatial patterns of different error types across the Del Medio landslide: orthorectification errors (a), stereoscopic effects (b), ramp errors (c), and striping (d). Displacement maps are derived from exemplary PlanetScope L3B image pairs, all with short temporal baselines of only a few days, so the surface can be assumed to be stable. For each pair, we show the strongest displacement component affected by the respective error.
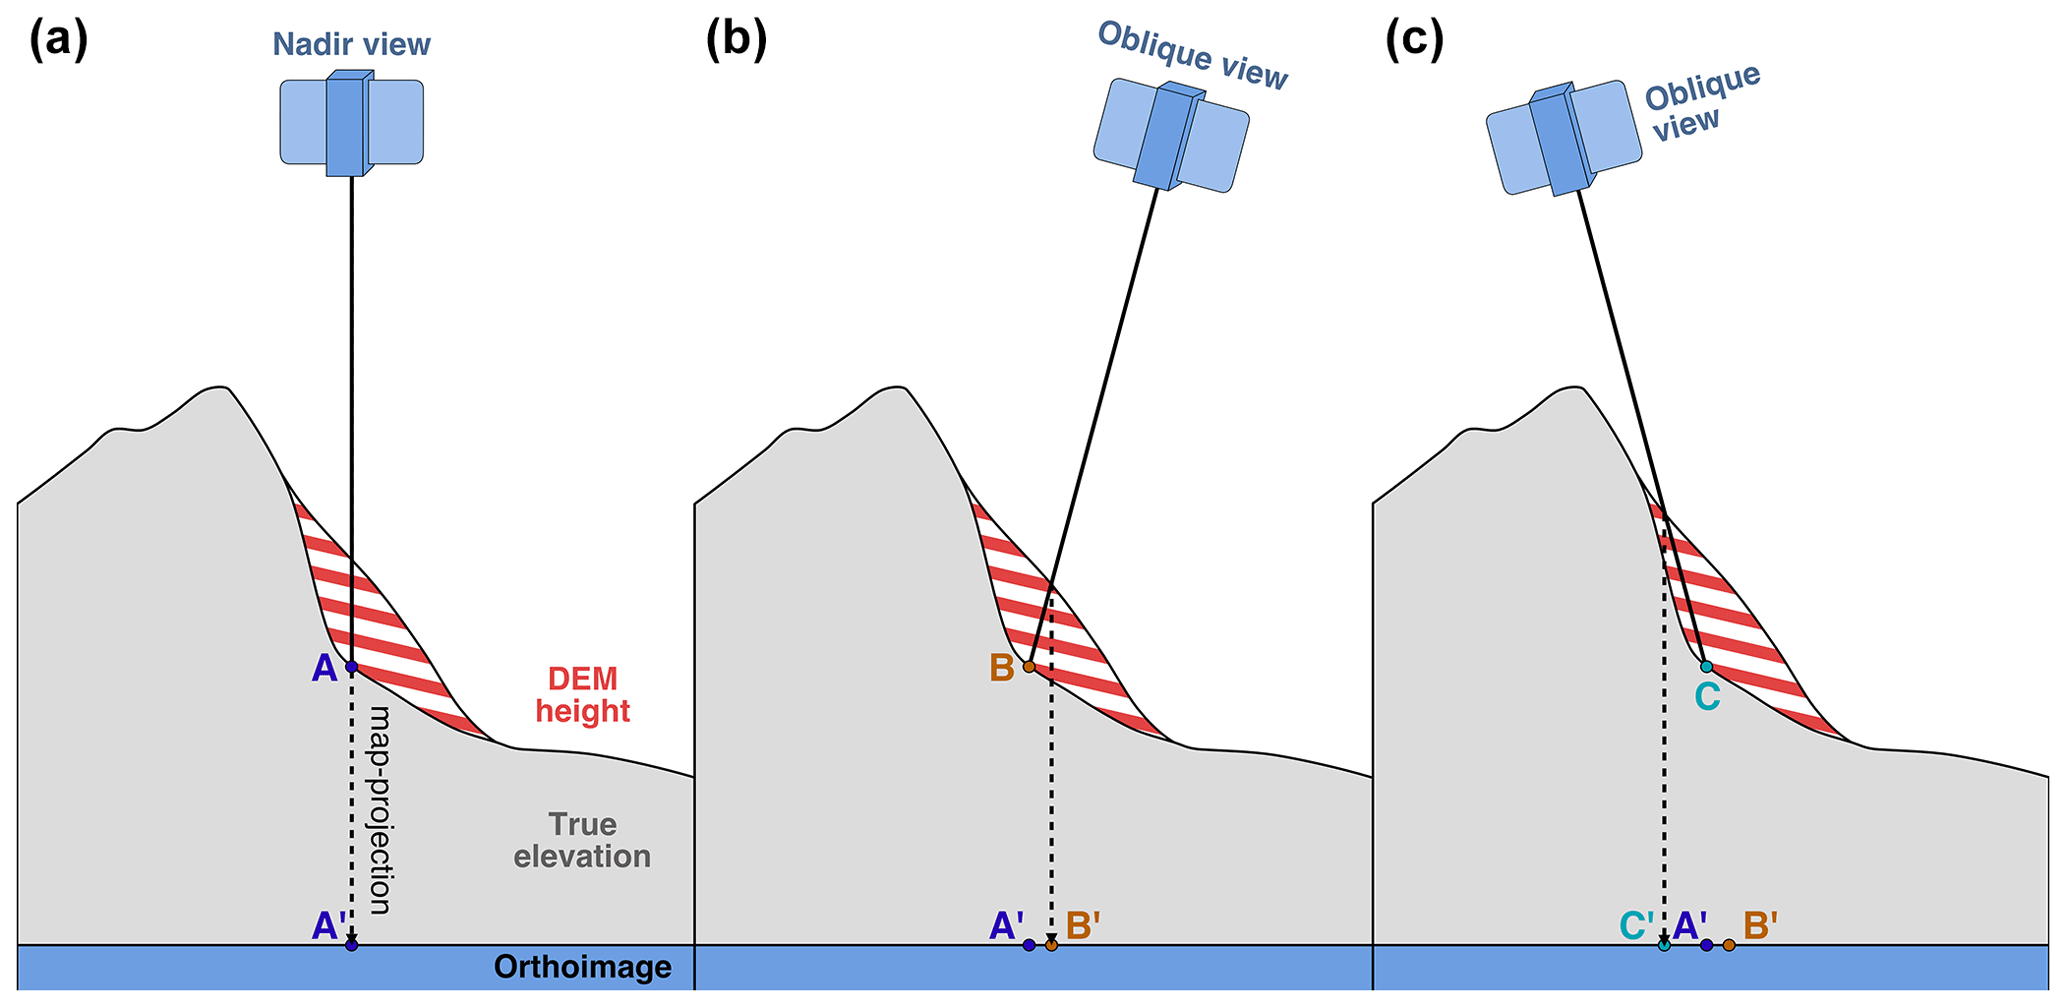
Figure 4Conceptual sketch of the orthorectification error resulting from outdated DEM heights for nadir (a) and oblique (b, c) views. When the DEM used to correct for geometric distortions no longer reflects the true topography at the time of image acquisition, e.g., due to landsliding, a common point seen in the image pair (a–c) may be projected to the wrong ground locations. Scenes with oblique views are more susceptible to this effect due to increased geometric distortions that the orthorectification aims to compensate for. Also, the misprojection scales with the elevation difference between present topography and DEM height. The misprojection of a common point leads to an apparent offset signal that interferes with the true displacement related to landslide motion.
Orthorectification errors are a particular problem at the Siguas and Del Medio landslides because the initial failures in 2005 and 2009, together with subsequent displacement, caused significant elevation changes to the terrain (Fig. 2) that are not recorded in DEMs acquired before that date. L3B data are orthorectified using terrain models from different sources, which are periodically updated (Planet, 2022b). Observations from our test sites indicate that scenes were orthorectified based on the SRTM DEM from 2000, so there is an ∼ 20-year gap between the DEM acquisition and the images that are projected onto it. The elevation changes that occurred during that time resulted in significant lateral distortions in the across-track (EW) component: displacement maps derived from L3B data show an apparent displacement signal at the order of ±3 pixels (9 m) across the landslide area (Fig. 3a), even in pairs with minimal temporal baseline. Distortions of this magnitude lead to large uncertainties as to the horizontal displacement.
3.1.2 Errors due to stereoscopic effects
Stereoscopic errors often exhibit a distinctive pattern that mirrors the topography within the imaged area (Fig. 3b). Stereoscopic errors are most pronounced in regions with steep terrain, such as the Del Medio site, and commonly, but not exclusively, affect the dy component. We also find that topographic effects are more commonly associated with specific scenes rather than image pairs with significant differences in view angle and consequently parallax. For instance, all correlation pairs involving a scene from 26 September 2022 over the Del Medio landslide (as depicted in Fig. 3b) show strong topographic errors in an NS direction. We attribute this to inaccuracies in the estimation of the satellite's roll and pitch angles, which affect the dx and dy components, respectively.
3.1.3 Global shift and ramp errors
PlanetScope scenes frequently exhibit global misalignments, typically within an expected geolocation accuracy of ∼ 2 pixels. Several displacement maps also manifest ramp errors, causing a progressive increase or decrease in displacement throughout the scene (Fig. 3c). These errors can result from a variety of factors, including quality, the distribution of tie points identified between PlanetScope and reference imagery, and the roll angle of the satellite during acquisition (Planet, 2019).
3.1.4 Striping effects
Another artifact unique to the PlanetScope PS2.SD and PSB.SD instruments are stripes that appear in the displacement maps, particularly in the NS direction, due to misregistration of the sub-frames that make up the composite scene (Aati et al., 2022a) (Fig. 3d). These stripes are absent from PS2 images, as the entire scene corresponds to a single frame. Specifically, scenes acquired by the earliest PSB.SD instruments launched in 2020 are affected. In more recent PSB.SD imagery, the sub-frame alignment has significantly improved and the transition appears much smoother. For some image pairs, subtle striping is still visible, causing artificial offsets at the order of ∼ 1 pixel. We also find certain cases where the alignment of sub-frames has been revised for the L3B data but not for the L1B scenes, which still exhibit severe striping (Supplement Fig. S1).
4.1 Data selection and pre-processing
In this study, we worked with both orthorectified L3B scenes and unrectified L1B data acquired by the newest generation of PlanetScope Doves (PSB.SD). For both study regions, we selected cloud-free images only. We also required scenes to have a minimum overlap of 99 % with the area of interest (AOI) and pass all GCP checks imposed by Planet so that they are geometrically aligned. A list of all scene IDs and acquisition parameters can be found in Tables S1 and S2 in the Supplement. In the case of L3B data, we took advantage of the option to download pre-clipped scenes that match the AOI. For L1B data, where the clipping option is not available, we downloaded the full scenes and locally cropped the image. Clipping extents were determined by converting the longitude and latitude of the AOI's upper-left corner to pixel positions via the RPCs and specifying a clip size in pixels.
The PlanetScope constellation acquires multi-band data, but only a single band is needed for image correlation. Rather than creating a pseudo-panchromatic image from the RGB channels, we chose to work with a single band only due to inter-band misalignment between spectral bands for PS2.SD and PSB.SD instruments, especially in steep, rugged terrain or across moving objects (Aati et al., 2022a; Planet, 2022a). We selected the green band, as it is least affected by atmospheric effects and vegetation. Detailed information and code for all data selection and pre-processing steps can be found on GitHub (Mueting and Bookhagen, 2024).
4.2 General processing scheme
With the overall goal of measuring landslide displacement, we used pairs of orthorectified PlanetScope scenes and estimated the offset between them via image cross-correlation. Raw L1B scenes need to be manually orthorectified before image correlation, while pre-orthorectified L3B images can be correlated right away. The resulting displacement maps are corrected for different errors to improve offset measurement accuracy. Global shifts, ramp errors, and stereoscopic errors are removed after the correlation through a subtraction of the median displacement and a polynomial fit from the initial displacement map. To mitigate orthorectification errors, we apply different strategies depending on the processing level of the data: for L3B data, we only correlate scenes acquired from similar perspectives, while L1B scenes are orthorectified using an updated reference DEM. We show a visual representation of the general processing scheme (Fig. 5) and provide a more detailed description below.

Figure 5Overview of the processing steps taken in this study to derive an estimate of landslide velocity from a PlanetScope image pair. Blue parallelograms indicate inputs and outputs, gray rectangles indicate processes, and red diamonds indicate decisions.
4.3 Image correlation
Image correlation was performed using Ames Stereo Pipeline, but there are other tools for image offset tracking available, e.g., COSI-Corr (Leprince et al., 2007), geoCosiCorr3D (Aati et al., 2022b), autoRIFT (Gardner et al., 2018; Lei et al., 2021), MicMac (Rupnik et al., 2017), and other techniques such as optical flow (e.g., Muhammad et al., 2022). Finding correspondences between two images is one of the key steps in stereo reconstruction. Since the release of version 3.1.0 (Beyer et al., 2022), Ames Stereo Pipeline has introduced the option to perform stereo correlation in correlator mode, which identifies the offset between two given scenes without requiring camera information and by performing a triangulation of pixel correspondences. We make use of this tool to compare two PlanetScope scenes and find the displacement between them. Processing parameters were largely left at or close to the default settings. We used block matching (BM) as a correlation algorithm with a kernel of 35×35 pixels, a sub-pixel kernel of 45×45 pixels, and sub-pixel mode 2 (affine adaptive window with Bayes expectation–maximization weighting) for sub-pixel refinement. Block matching extracts a small window centered around a pixel in the left (reference) image and slides it over the right (secondary) image within a specified search distance. The offset is determined by minimizing a cost function, which is computed using normalized cross-correlation (Beyer et al., 2018). We experimented with the Ames Stereo Pipeline implementation of the more global matching (MGM) algorithm (Facciolo et al., 2015) instead of BM, as it has shown improved matching capabilities, especially in low-texture areas (Purinton et al., 2023), but we did not recognize significant changes in the derived landslide velocity.
Correlation results comprise a three-band output grid storing shifts in an EW (dx) direction (positive values indicate movement to the east), displacements in an NS (dy) direction (positive values indicate movement to the south), and a good pixel map indicating which pixels were successfully matched.
4.4 Mitigation of orthorectification errors
4.4.1 L3B data
For L3B data, where geometric, radiometric, and atmospheric corrections have already been applied, it is infeasible to correct for erroneous orthoprojections, as orthorectification introduces a nonlinear transform. However, in cases where scenes are acquired from a similar perspective, the lateral misplacement of pixels is expected to be consistent (Fig. 6). When correlating these scenes, the pixels may be wrongly positioned, but the artificial displacement introduced by orthorectification errors is of similar magnitude. By limiting the correlation analysis to scenes captured from a common perspective, the influence of DEM errors on the true displacement signal can be minimized. This was verified by the analysis of 136 correlation pairs across the Siguas landslide involving 17 acquisitions from varying perspectives, all taken within the time frame of approximately 1 month (Fig. S2 and Table S3). For finding suitable image pairs, we considered the acquisition parameters view_angle and satellite_azimuth. The view angle refers to the spacecraft's across-track off-nadir viewing angle in degrees (Planet, 2022b) and is always given in positive numbers. The satellite azimuth, on the other hand, describes the spacecraft's off-track pointing direction and is given as an angle to true north (Planet, 2022b) (Fig. S3). Both parameters need to be jointly examined to determine the true view angle difference between two acquisitions that consider whether a satellite is left- or right-looking. Based on the true view angle difference, we form groups of PlanetScope L3B scenes acquired between 2020 and 2023 to trace displacement across the Siguas and Del Medio landslides (three groups each). Scenes within a group have a view angle difference of 0.6° or less. Within these groups, misplacement related to orthorectification error is expected to be consistent and remaining displacement signals can be attributed to landslide motion, unless the relative geolocation accuracy is lacking due to other error sources. Correlation pairs are formed among all scenes within a group that have a temporal baseline of 6 or more months (180 d). We impose this limit to eliminate image pairs where the estimated landslide displacement at the Siguas and Del Medio sites will fall below the detection limit. For comparison, we also select a set of random scenes for a fourth group to compare the derived displacement to a naive selection of PlanetScope scenes with various view and satellite azimuth angles (Fig. 7).
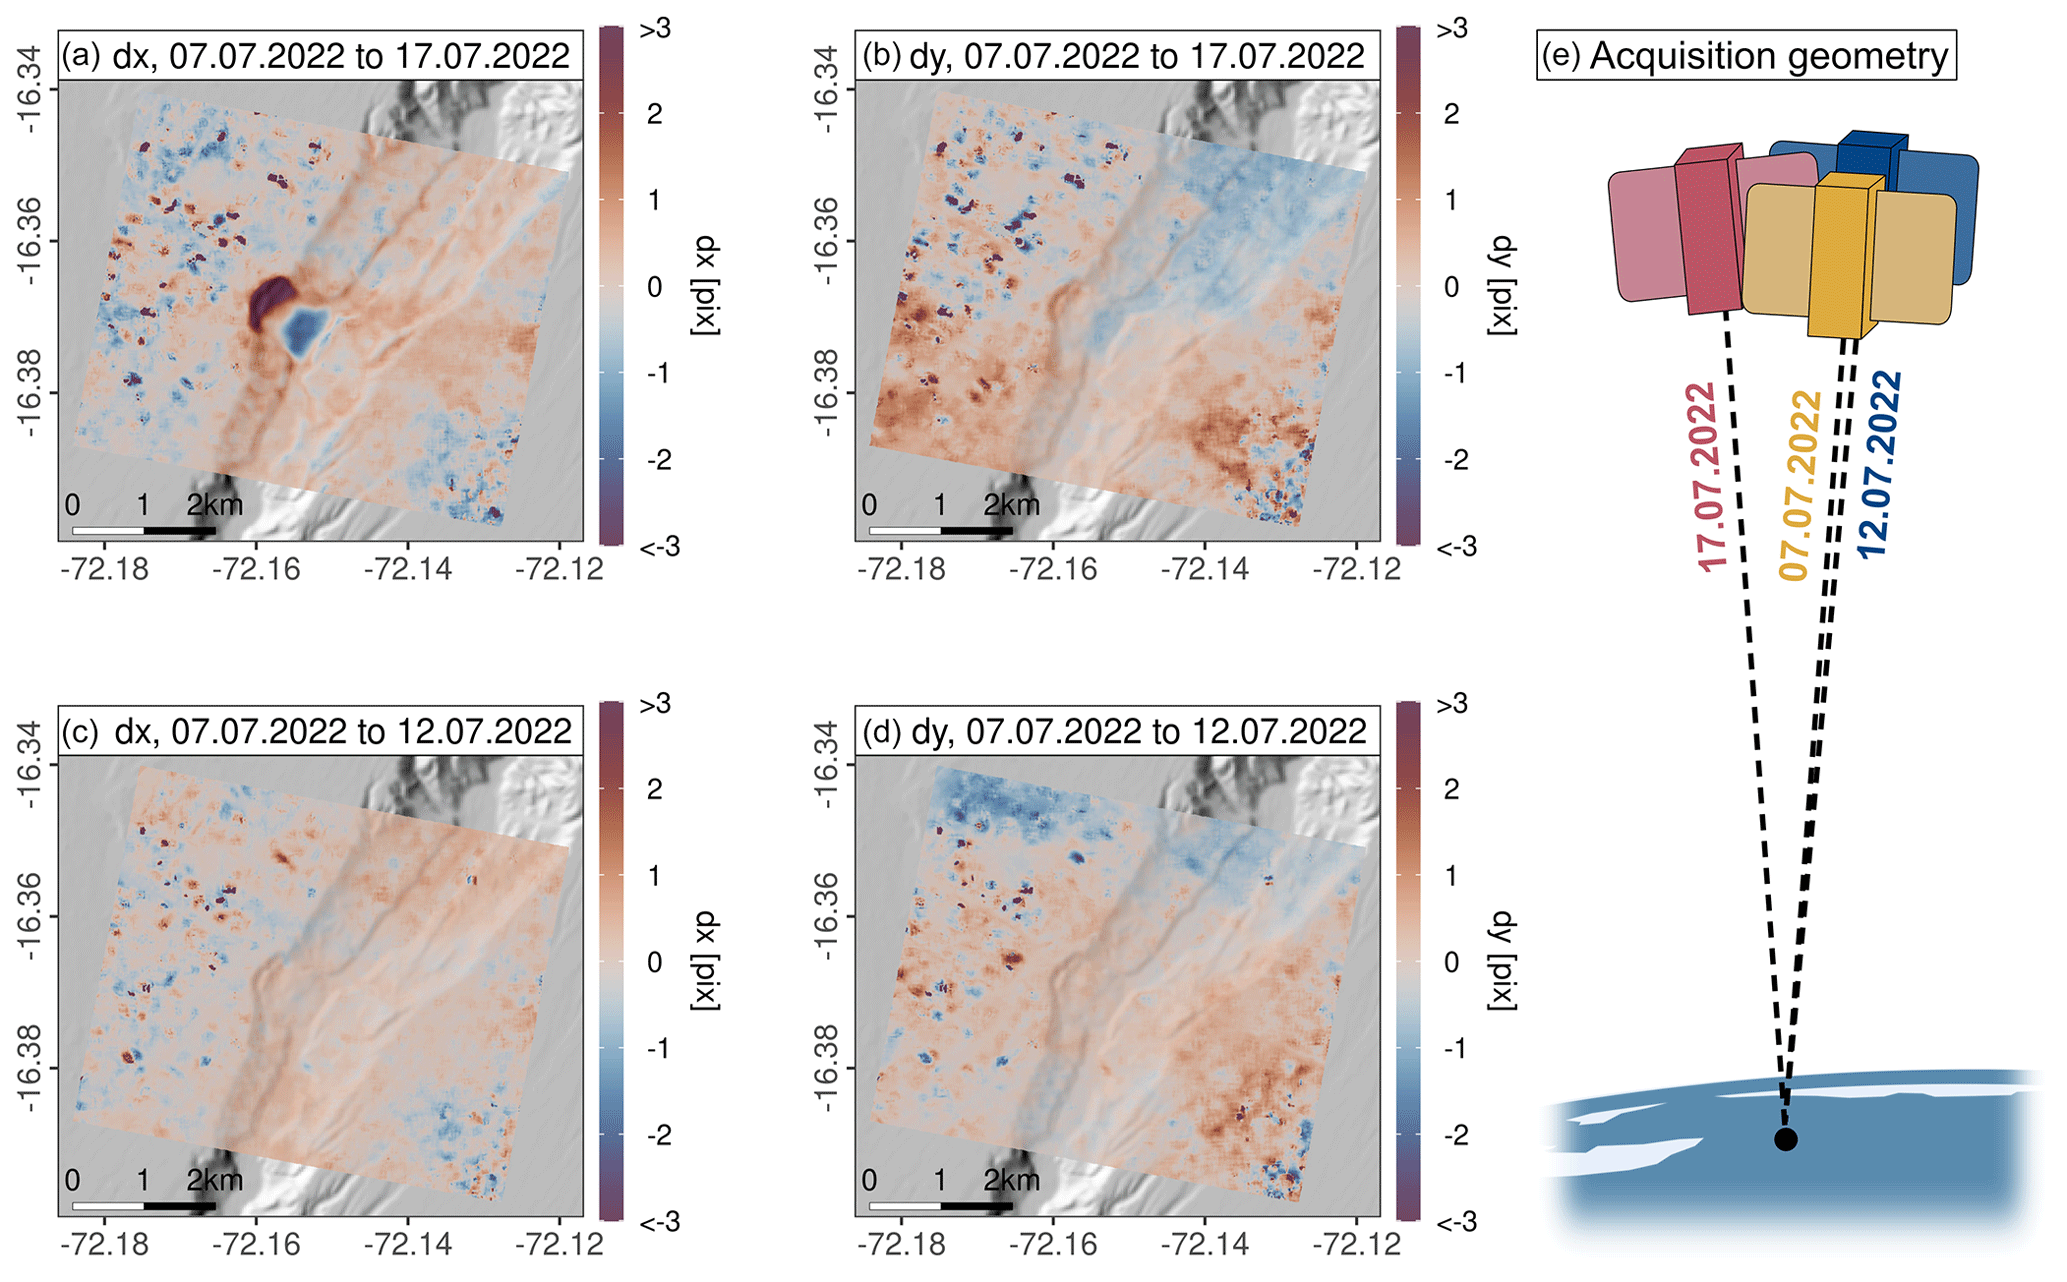
Figure 6Displacement maps generated from two PlanetScope image pairs across the Siguas landslide. Panels (a) and (b) show the displacement in an EW direction (dx) and in an NS direction (dy) for PlanetScope scenes acquired between 7 and 17 July 2022 with a perspective difference of 8.1° in the view angle. Despite the short temporal baseline, there is a strong offset signal that correlates with the elevation difference between the topography at the time of image acquisition and the DEM used during the orthorectification process (see Fig. 2). The apparent displacement signal disappears when the scene from 7 July is paired with a scene from 12 July 2022 (c, d) with a view angle difference only 0.9°. Panel (e) shows a sketch of the acquisition geometry of all three scenes.

Figure 7Satellite azimuth and view angle of the PlanetScope scenes that were grouped based on their true view angle differences for the Siguas (a) and Del Medio (b) landslides. Additionally, we used a group of randomly selected scenes (group 4) to showcase correlation results as they would be obtained if acquisition parameters were not considered. Note the large spread of view angles in group 4. IDs and acquisition parameters of all scenes are listed in Tables S1 and S2 in the Supplement.
4.4.2 L1B data
When working with the raw L1B data, the user gains control over the choice of reference DEM used for orthorectification. Selecting a reference DEM that closely matches the acquisition time can minimize the impact of DEM errors for scenes acquired from opposite viewing directions, as the magnitude of the error scales with the elevation difference. In our analysis of the Siguas and Del Medio landslides, we observed a significant reduction in the apparent offset signal in the displacement maps when the raw scenes were projected onto the Copernicus DEM (acquired between 2011 and 2015) instead of the NASADEM (acquired in 2000) (Fig. 8a–b, d–e). The orthorectification process was carried out using the mapproject tool from Ames Stereo Pipeline (Beyer et al., 2018), with the raw image data, RPCs, and a reference DEM as inputs. Through the use of the Copernicus DEM, the orthorectification error signal was reduced but not eliminated, as the Copernicus DEM is also outdated for the topography seen in the PlanetScope scenes. With no newer high-quality publicly available global elevation dataset at hand (Purinton and Bookhagen, 2021), we explored the possibility of generating DEMs from PlanetScope data alone to more accurately model the terrain at the time of acquisition. Several authors have shown the potential of exploiting the small B : H ratios of PlanetScope acquisitions with opposite view angles for 3D surface reconstruction (Ghuffar, 2018; Aati and Avouac, 2020; d'Angelo and Reinartz, 2021; Aati et al., 2022a; Huang et al., 2022). However, these studies mostly focused on imagery acquired by the PS2 instruments that are no longer operational, as these scenes (except for the NIR band) represent a single frame in contrast to PSB.SD bands, which are composed of individual sub-frames (see Sect. 3). PSB.SD data were regarded as unsuitable for multi-view stereo reconstruction due to their inherent geometric errors, which can severely bias the derived surface model (Aati et al., 2022a). However, with improved sub-frame alignment in many PSB.SD scenes and a substantial parallax visible in L1B data derived from displacement maps acquired from oblique (5°) view angles and opposite satellite viewing directions, we suggest that it is possible to derive low-resolution stereo DEMs that are sufficiently accurate for orthorectification. We emphasize that our objective is not to generate DEMs that are of comparable quality to other elevation datasets, such as the Copernicus DEM or NASADEM, but to allow us to produce a smooth, low-resolution (30 m) representation of the terrain that minimizes orthorectification errors (Fig. 8c, f).

Figure 8Displacement in an EW direction estimated across the Siguas (a–c) and Del Medio (d–f) landslides, with PlanetScope L1B scenes orthorectified using the NASADEM (a, d), the Copernicus DEM (b, e), and a DEM generated from PlanetScope L1B scenes (c, f). Displacement maps were generated using scene pairs with a minimal temporal baseline: 10 d (7 to 17 July 2022) for panels (a)–(c) and 16 d (8 to 24 September 2022) for panels (d)–(f), and the surface can be assumed to be stable. Outdated DEM heights in the reference DEMs produce lateral offset signals in the displacement maps. Projecting PlanetScope scenes onto a newer reference surface (i.e., Copernicus DEM, panels b and d) reduces but does not fully eliminate the apparent displacement related to DEM error. A reference DEM acquired at a similar time to the PlanetScope scenes would be needed to fully resolve the DEM-related effects in the derived displacement maps. We suggest that such a surface can be generated from the PlanetScope data alone. Displacements in an NS direction (dy) can be found in Fig. S4 in the Supplement.
For DEM generation, we used the tools provided by the Ames Stereo Pipeline (Beyer et al., 2018). For both the Siguas and Del Medio sites, we chose scenes with maximum view angles (5°), opposite satellite azimuths (resulting in an ∼ 10° convergence angle), and a minimal temporal baseline as stereo pairs: 2 and 6 July 2022 (Siguas) and 7 and 12 September 2022 (Del Medio) (see Table S4). The full DEM generation workflow comprised the following steps:
-
Images were clipped to a common area using the provided RPCs. Because matching image pixels along the image margins tends to be less reliable, these are often eroded when the final elevation model is generated. We extracted a region larger than the initial area of interest to ensure full DEM coverage.
-
The re-projection error resulting from the camera position and orientation errors was minimized through bundle adjustment.
-
Through an initial execution of the stereo correlation tool using the unprojected images, we obtained a first-order reference surface. The resulting point cloud image was gridded to a 90 m resolution.
-
Images were map-projected onto the previously generated 90 m DEM. Transferring images to object space increases the chance of finding reliable matches in the subsequent correlation step, as images appear more similar and search distances are reduced.
-
The final DEM was obtained through stereo correlation of the map-projected images. For triangulation, pixel correspondences are back-projected into image space. The obtained point cloud was gridded to 30 m spatial resolution.
For full details on the processing steps, we refer the reader to the corresponding code available on GitHub (Mueting and Bookhagen, 2024) and to the Ames Stereo Pipeline documentation (https://stereopipeline.readthedocs.io/en/latest/index.html, last access: 1 May 2023) for a detailed description of the individual tools.
Stereo processing parameters were largely left at default settings. For sub-pixel refinement, we used sub-pixel mode 2 as this results in the best-quality matches at the expense of a longer runtime (Beyer et al., 2018). Correlation kernels were set to 35×35 pixels for the Del Medio landslide where variable terrain provided sufficient image texture for reliable matching (Purinton et al., 2023). At the Siguas site, we chose a larger kernel of 65×65 pixels to compensate for the low image texture of the low-slope surroundings. Hillshades of the resulting DEMs are displayed in Fig. 9a and d.

Figure 9(a) Hillshade of the DEM generated from two PlanetScope acquisitions (2 and 6 July 2022) over the Siguas landslide. The DEM was placed at a position that minimized the offset between pixel correspondences between two PlanetScope scenes when transferred into object space using the given DEM. Panels (b) and (c) show elevation differences between the PlanetScope DEM, the NASADEM, and the Copernicus DEM which largely reflect the elevation changes that occurred due to landsliding. (d) Hillshade of the DEM generated from two PlanetScope acquisitions (7 and 12 September 2022) over the Del Medio landslide. Panels (e) and (f) show elevation differences between the PlanetScope DEM, the NASADEM, and the Copernicus DEM.
PlanetScope DEMs for both test sites were aligned to the NASADEM (NASA JPL, 2021) using demcoreg (Shean et al., 2016) according to the algorithm described by Nuth and Kääb (2011). The alignment worked well for the steep mountainous terrain surrounding the Del Medio landslide but proved to be much more difficult for the low-relief Siguas site. To minimize the remaining horizontal offset, we relied on the displacement estimated from a stable (short temporal baseline) PlanetScope image pair acquired from different perspectives (view angles and satellite azimuth). When two unprojected L1B scenes are correlated in image space (pixel coordinates, i.e., rows and columns) and the obtained correspondences are transferred into object space (geographic coordinates, i.e., longitude and latitude) using the given RPCs and a DEM, the displacement between the projected pixels should be zero. If, however, there is a mismatch between the topography seen in the images and the topography they are projected on, the pixel correspondences will indicate an offset related to wrong DEM heights (orthorectification error). To minimize this error, we iteratively shift the misaligned DEM. At every new position, we use the RPCs from both images to project pixel correspondences and determine the displacement between them. The final position of the DEM is determined by the minimal sum of displacement between matching points. Vertical shifts and tilts are corrected by approximating and subtracting the elevation difference between the PlanetScope DEM and the reference DEM through a first-order polynomial. The remaining elevation differences (Fig. 9b–c, e–f) reflect terrain changes due to landsliding and correspond well to the lateral displacement seen in Fig. 8. We observe a slight relation between DEM difference and topography, particularly for the Del Medio site. We attribute this to the low B : H ratio of PlanetScope acquisitions, which enables only limited depth perception. While this elevation mismatch will introduce orthorectification errors (see Fig. 8e), the resulting offset signal is systematic and can be compensated for as described in Sect. 4.5.
The final aligned DEMs were used to orthorectify (map-project) all PlanetScope L1B acquisitions from group 4 at the Siguas and Del Medio sites (see Fig. 7) in order to compare the results with displacement estimated from L3B data. The orthorectified L1B scenes (processing level equal to L3B data) were then correlated with each other with the same processing parameters as the L3B data.
4.5 Removal of global shifts, ramp errors, and remaining stereoscopic effects
To correct for global shifts in the displacement maps derived from L3B and orthorectified L1B data, we subtracted the median displacement of both EW and NS components. However, even after this correction, we observed remaining systematic displacement signals on the order of ±1–2 pixels in several displacement maps that cannot be compensated for with a simple translation. Signals related to long-wavelength ramp errors (Feng et al., 2019) with opposite displacement measures towards the AOI margins and remaining stereoscopic effects, particularly in the area of the Del Medio landslide (Fig. 10a), can be compensated for by approximating the estimated offset with a second-order polynomial fit including an elevation (topographic) component:
where dx and dy are the estimated displacements in an EW and NS direction, X and Y are the corresponding pixel locations, Z is the elevation, and a–j are the coefficients which are estimated using least-squares optimization. The X, Y, and Z positions were linearly scaled between 0 and 1 using min–max normalization to ensure common value ranges. The approximated offset was then subtracted from the original displacement, eliminating topographic signals and ramp effects (Figs. 10, S5). To reduce the impact of outliers and noise on the polynomial fit, we excluded displacements below and above the 5th and 95th percentiles. Alternatively, offsets over the landslide could be removed by applying an external landslide mask before the least-squared optimization step. To find an appropriate fit, the displacement map must cover a substantial portion of the terrain surrounding the landslide so that the majority of the scene contains stable ground.

Figure 10Displacement maps and value distributions estimated across the Del Medio landslide based on an orthorectified L1B scene pair from 8 and 24 September 2022 (same as shown in Fig. 8) before and after the removal of systematic co-registration errors through a polynomial fit. Panels (a)–(c) show results for the dx component, and panels (d)–(f) show results for the dy component. The application of a polynomial fit results in zero-centered offset distribution with a largely reduced spread of estimated displacement. Colored labels correspond to the median and IQR of the distribution. An example of the correction of the Siguas site can be found in Fig. S5 in the Supplement.
4.6 Handling of stripes
Striping induced by misalignment of sub-frames, especially in the NS component, cannot be rectified using a polynomial fit. We refrained from employing further correction methods, as it is largely unpredictable where and how many sub-frames were misaligned. The PSB.SD scene composition pipeline appears to be enhanced for newer acquisitions: most recent captures exhibit no or minimal striping, with smoother sub-frame transitions. Scenes from early 2020 producing displacement maps with pronounced stripes were excluded from our analyses.
4.7 Velocity estimation
Displacement in EW and NS directions as obtained from the image correlation can be translated to annual velocity by calculating the magnitude of the offset and converting it into meters per year:
where v is the velocity in m yr−1, dx and dy are the estimated displacement in an EW (dx) and NS (dy) direction in pixel units, r is the raster resolution (3 m), and dt is the temporal baseline between the correlated images in days. To show the average landslide movement over the entire monitoring period, we stacked all velocity grids within a group and calculated the mean and standard deviation for each pixel. To obtain a velocity time series, we calculated the mean velocity across the landslide surface, which was manually outlined. As a quality metric, we utilized the interquartile range (IQR) of velocity of stable terrain, which we refer to as all pixels outside the landslide mask.
4.8 Assessment of displacement bias as a function of DEM error and view angle difference
To evaluate the impact of erroneous DEM heights on the magnitude of orthorectification errors at variable perspectives, we conducted an experiment using a stable and predominantly low-slope area located east of the Siguas landslide (Fig. S6). In this controlled setting, we took a set of L1B acquisitions (n=11) captured within an approximately 2-month time frame (see Table S5), with variable view angles ranging from −5.1 to 5.1°. Among these scenes, we formed 51 correlation pairs. For every correlation pair, we projected the reference and secondary image onto a modified version of the Copernicus DEM, where we added an artificial elevation gradient simulating a −50 to +50 m ramp (Fig. 13a). This modification aimed to replicate an elevation mismatch between DEM and current-day topography resulting from landslide movements or inherent DEM inaccuracies. Because the targeted area can be assumed to be stable, displacements observed between the projected L1B image pairs will largely reflect errors resulting from the orthorectification based on outdated DEMs. To remove any effect from additional factors compromising co-registration (e.g., global shifts, ramp errors), we subtracted the displacement estimated when the same image pair is projected onto the original Copernicus DEM. The remaining offsets were then compared to the synthetic elevation ramp, and their relationship was approximated through a linear fit (Fig. S7).
5.1 L3B data
For PlanetScope L3B data, we find that a careful selection of correlation pairs based on common perspectives (similar viewing and satellite azimuth angles) can substantially reduce erroneous displacement signals related to the use of outdated DEMs during orthorectification. Figure 11 shows the standard deviation of velocity magnitude and direction calculated from all L3B data correlation pairs in a group for the Siguas (panels a–h) and Del Medio (panels i–p) test sites. We observe that groups 1–3, which were selected based on similar view angles, show a very similar displacement signal across the landslide surface. This is indicated by low standard deviations in estimated magnitudes and directions throughout the correlation pairs. Slightly higher standard deviations for groups 1–3 at the landslide toe are likely related to transient changes in velocity. In contrast, when PlanetScope scenes are selected randomly (group 4), variations in view angle and satellite azimuth, combined with outdated DEM surfaces used for orthorectification, result in misprojections over the landslide surface. This orthorectification error biases velocity estimates because artificial offset signals mix with true displacements. When averaged, velocity measurements from group 4 are overall higher and show a high standard deviation in areas where elevation changes have occurred since the acquisition of the SRTM DEM (Fig. 9). Orthorectification errors also affect the estimated motion trajectories. While the displacement vector fields derived from correlation pairs in groups 1–3 show a coherent downhill motion, average results from group 4 suggest a trajectory parallel or are even opposite to the steepest descent (Figs. S8 and S9). We emphasize that the results presented in these figures represent average offset estimates obtained from 15 to 33 stacked displacement maps per group. Individual correlation results from group 4 exhibit even more unrealistic motion patterns, depending on the severity of the orthorectification errors. The high variability among individual displacement maps may lead to erroneous assumptions of a more dynamic landslide movement. Conversely, carefully selected correlation pairs enable a detailed investigation of the true temporal variability, as these correlation pairs can be considered individually due to their high quality.
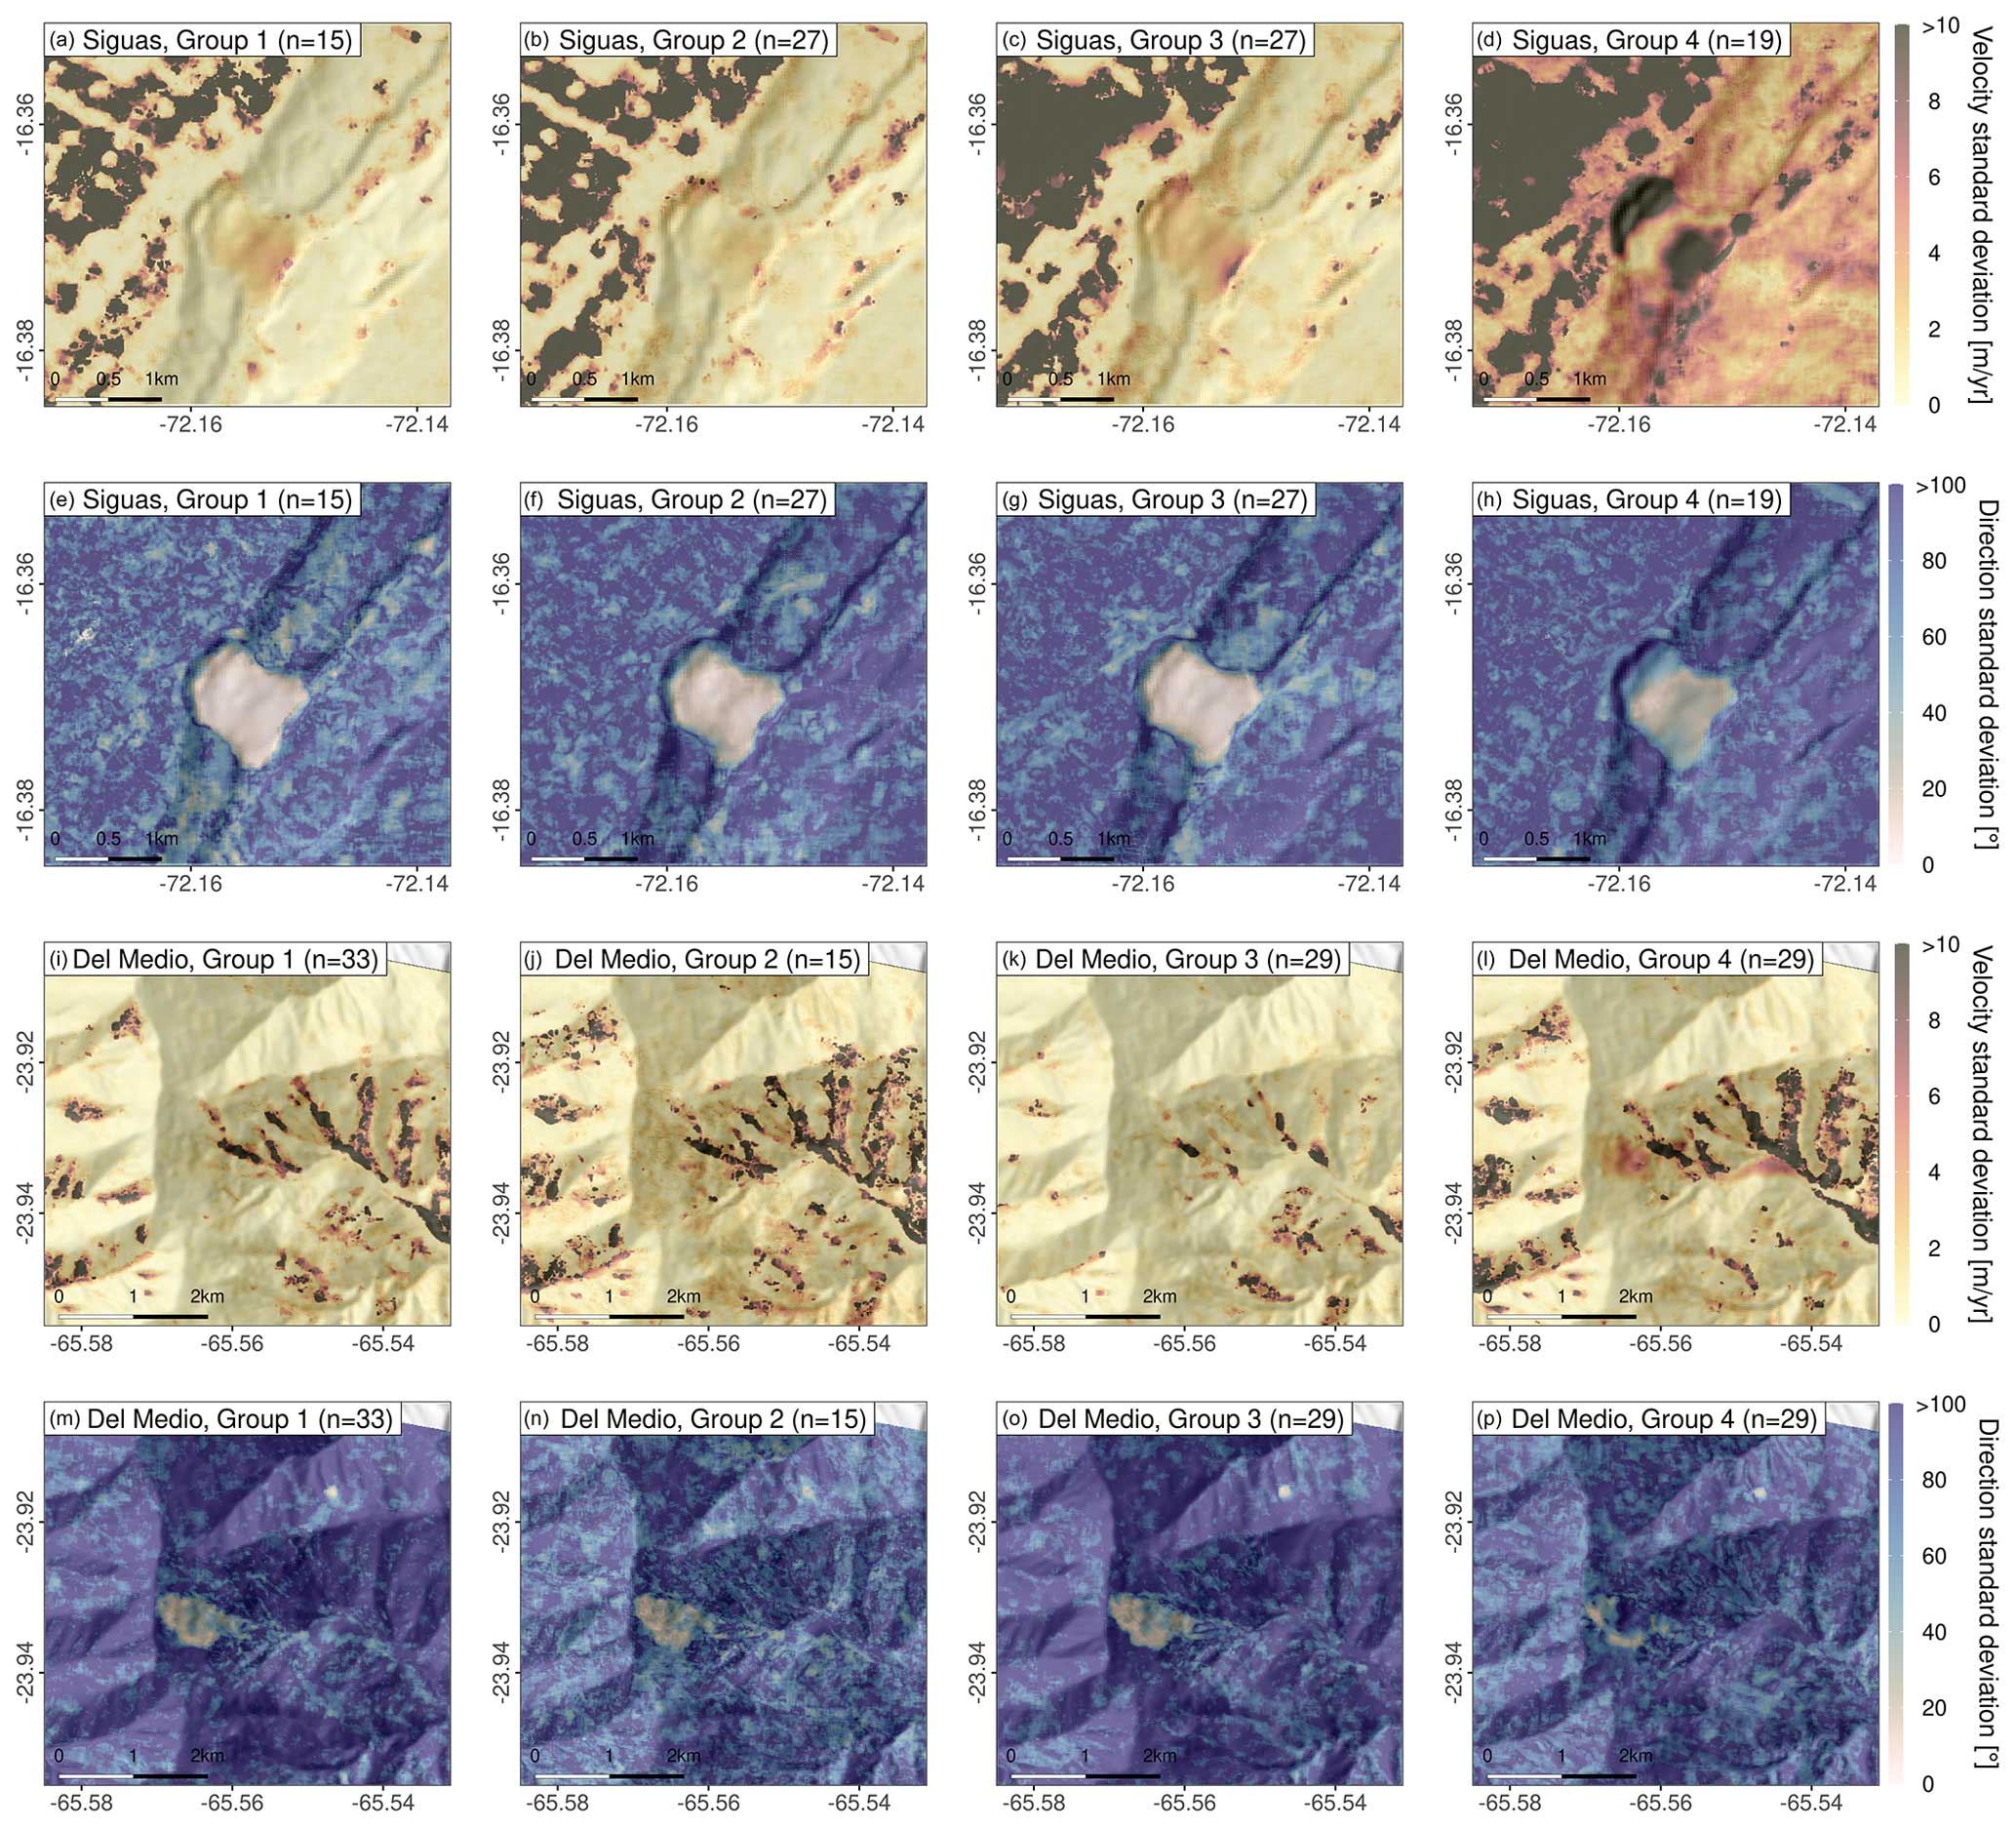
Figure 11Standard deviation of velocity magnitude and direction within each L3B data correlation group for the Siguas (a–h) and Del Medio (i–p) landslides. Velocity measurements are highly variable over agricultural areas (Siguas) and shadowed areas in steep terrain (Del Medio). Displacement directions show high standard deviations throughout stable terrain, where low-magnitude displacement vectors will point in variable directions. Across the landslide surface, however, pixels will move coherently in a common direction, resulting in low standard deviations. For both test sites, groups 1–3 were selected based on common viewing and satellite azimuth angles, and estimates of velocity magnitude and direction of landslide motion are largely coherent. For the randomly selected scenes (group 4), magnitude and direction estimates are much more variable and show a strong correlation with elevation changes that have occurred since the acquisition of the SRTM DEM (Fig. 9). This is a strong indication that displacement maps are biased by orthorectification errors which will mix with the true displacement signal.
5.2 L1B data
For L1B data, we minimized the misprojection error introduced during orthorectification by using a reference surface that reflects the topography at or close to the time of image acquisition to correct for geometric distortions. We find that orthoprojecting L1B data onto a DEM derived from PlanetScope data alone greatly reduces the artificial displacement signal related to orthorectification errors. The reference DEM, however, needs to be smooth, void-free, and well aligned with the PlanetScope data. Figure 12 displays the standard deviation of velocity, the standard deviation of direction, and the average velocity derived from all correlation pairs in group 4 (variable viewing and satellite azimuth angles) for the Siguas (panels a–c) and Del Medio (panels d–f) landslides when using manually orthorectified L1B data instead of L3B data. Through the use of a reference surface that much more closely resembles the topography at the time of acquisition, common points in two images are projected to the same location when orthorectified. Therefore, the orthorectification error signal that appeared in group 4 at the L3B level (Fig. 11d, h, l, p), is significantly reduced. Both magnitude and movement direction are much more coherent (low standard deviation) and resemble the measurements retrieved within groups 1–3. Also, the derived displacement fields show a much more realistic downhill motion compared to the L3B data (Figs. S8 and S9).
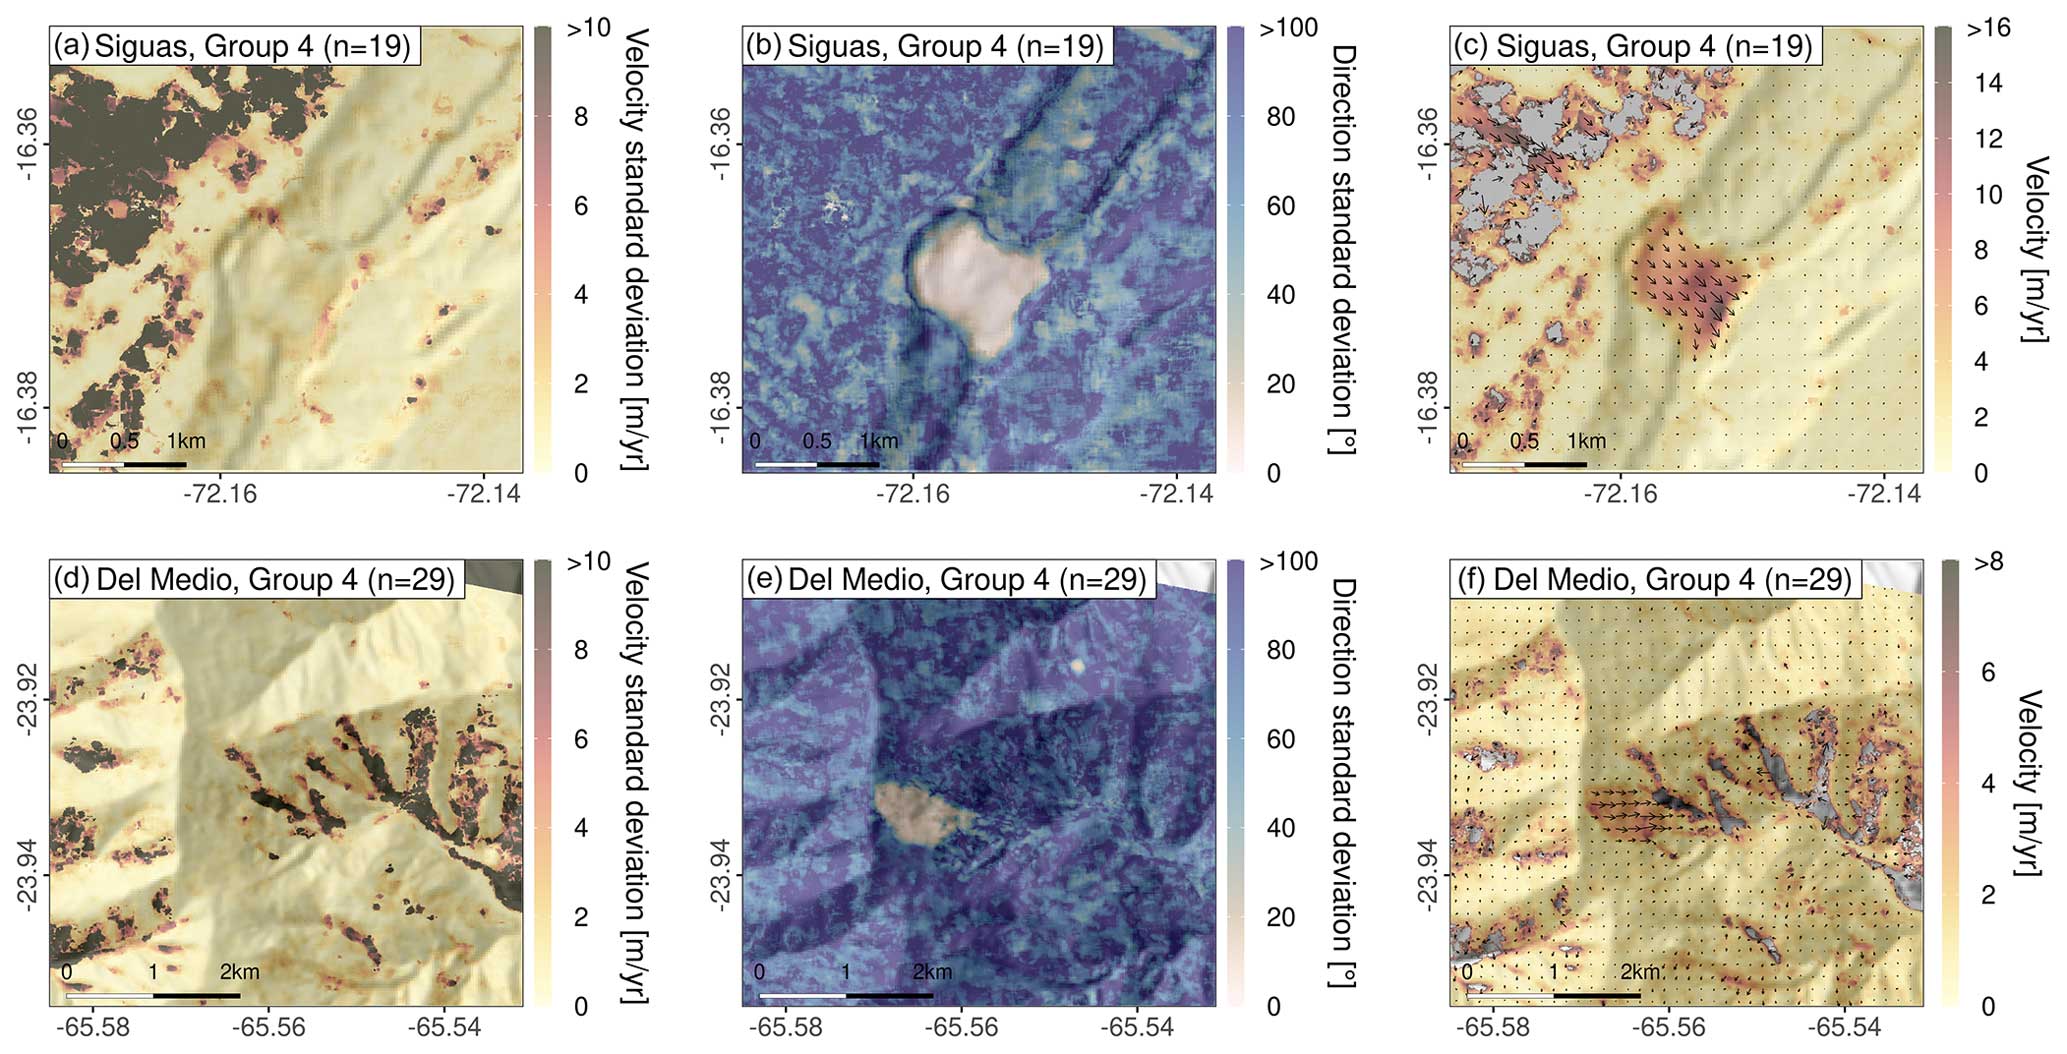
Figure 12Standard deviation of velocity magnitude and direction, along with mean velocity, as vector plots derived from correlation pairs of orthorectified L1B data. Here, we chose the same scenes as in group 4, which comprised randomly selected PlanetScope scenes with variable viewing and satellite azimuth angles. In contrast to Fig. 11, which showed average measurements derived from L3B data, we find that orthorectification errors are minimized when the same scenes are downloaded in L1B format and orthorectified using a smooth, low-resolution reference DEM generated from PlanetScope data alone: the velocity magnitude and direction are much more consistent among correlation pairs, and the vector plot indicates a realistic downhill motion.

Figure 13Artificial elevation ramp applied to the orthorectification DEM (a) and the resulting difference in displacement bias in an EW (b) and NS (c) direction for a single image pair with 10.1° view angle difference. We observe a strong correlation between DEM error and offset in the EW component, while the NS component remains unaffected. The relationship between observed displacement (displacement bias) and DEM error can be approximated by a linear relationship (see Fig. S7). Regression lines for all 51 correlation pairs are shown in panels (d) and (e) for each component. The slope of the linear fit (m) is connected to the view angle difference between the correlated image pair, at least for the EW component. This relationship is plotted in panels (f) and (g).
5.3 Magnitude of displacement bias introduced by DEM errors
Our analysis of the magnitude of displacement bias resulting from erroneous DEMs used for orthorectification (Sect. 4.8) reveals a positive relationship between the DEM error and the displacement measured from an image pair projected onto the erroneous DEM. This relationship is only observed in the EW component (dx) (Fig. 13b, d) because the view angle of the satellite is varied across track. Meanwhile, the NS component (dy) (flight direction of the satellite) remains largely unaffected (Fig. 13b, d). The relationship between the DEM error and the resulting displacement bias can be well approximated by a linear regression (Fig. S7). Regression fits for all 51 image pairs are shown in Fig. 13d and e. As expected, the slope of the fitted regressions linearly scales with the view angle difference between the reference and secondary images (Fig. 13f and g), confirming our strategy of minimizing the impact of orthorectification errors in L3B pairs by keeping view angles close. To summarize: (1) a higher DEM error is associated with larger displacement bias, and (2) larger view angle differences between image pairs increase the rate at which displacement bias grows with increasing DEM error. Assuming that there will be no bias when there is no DEM error or when the view angles of the satellites are identical (zero intercept) we can estimate the magnitude of displacement bias for the EW component through the following equation:
where errordx is the displacement bias of the EW component in pixels, errorDEM is the DEM error in meters, and δview angle is the view angle difference between the reference and secondary image in degrees. The value of 0.006 in units of pixels per meter degree was empirically determined and corresponds to the slope of the regression fit in Fig. 13f. In this way, expected displacement errors for other targets can be estimated when using PlanetScope scenes acquired from different perspectives for image offset tracking. Knowing the error potential will help to set a threshold for how similar view angles of correlation pairs need to be, depending on the estimated DEM error and required measurement precision (particularly important for slow-moving targets).
5.4 Impact of the polynomial fit
We evaluated how well the polynomial fit modeled systematic co-registration errors related to ramp errors and stereoscopic effects by examining offset estimated over stable terrain. Stable terrain was defined as any area outside the manually outlined landslide areas. The application of a polynomial fit centers the median displacement over stable terrain in all correlation pairs over the Siguas (n=88) and Del Medio (n=106) at zero, which could also be achieved by a simple subtraction of the median displacement (correction of global shift). The polynomial fit additionally tightens the range of estimated displacement over stable ground, resulting in more values close to zero than before. This effect is illustrated by the IQR of displacement over stable terrain derived from all pairs before and after the polynomial fit correction (Fig. 14). For almost all correlation pairs, the IQR was reduced to the sub-pixel range (< 3 m). The improvement is particularly strong at the Del Medio site. The lower IQR at the Siguas site relates to the large presence of agricultural fields towards the NW of the scene, resulting in a large number of false matches. Despite the effective reduction in displacement estimated across stable terrain, the polynomial fit does not mitigate the orthorectification errors. The use of a reference DEM that closely resembles the topography during image acquisition remains essential to improving matching accuracy across unstable terrain when images are acquired from different angles and directions (Figs. S10 and S11).

Figure 14IQR of displacement across stable terrain, derived from pixels outside the landslide mask (see Fig. 15a and c) for all correlation pairs from all four groups before and after polynomial fit application. Colors indicate NS and EW components. The black line denotes the 1:1 correlation, i.e., no change.
5.5 Landslide dynamics
The displacement maps derived from PlanetScope imagery within each correlation group provide valuable insights into the dynamics of the Siguas and Del Medio landslides between 2020 and 2023. Figure 15 illustrates averaged velocities within the landslide boundaries for each correlation pair. The timeline indicates that the Siguas site in 2020 exhibited average velocities between 10–15 m yr−1. Velocities gradually decreased to approximately 5–7 m yr−1 by 2023. We also observe a spatially variable displacement pattern with higher velocities at the landslide toe compared to the head scarp (Fig. 15a). These observations align with the self-entrainment process at the Siguas landslide described by Lacroix et al. (2019). The authors suggested that the landslide dynamics are controlled by sediment supply resulting from the retrogressive motion of the head scarp. Following this, we assume that the higher velocities in 2020 are related to a failure at the head scarp that caused an acceleration of the landslide body below and then gradually decayed. The Del Medio landslide (Fig. 15c and d) maintained a relatively constant and spatially coherent motion, with average velocities ranging from 2–5 m yr−1 between 2020 and 2023. In addition, the velocity time series indicates a slight seasonal pattern: peak velocities coincide with the months characterized by highest rainfall (∼ December to March). It is well known that precipitation can drive seasonal velocity changes of slow-moving landslides through increasing pore water pressure and reducing friction (Handwerger et al., 2013). Especially in the Del Medio catchment, repeated landslides and rockfalls have been described during the rainy season (Savi et al., 2016). This suggests that the monsoonal climate could be a contributor to the movement of the Del Medio landslide. We note, however, that satellite-derived displacement estimates can be affected by seasonally variable illumination conditions introducing a seasonal bias to the displacement estimates (Lacroix et al., 2019). Further insights into the dynamics and drivers of the Del Medio landslide require additional data, such as in situ or radar interferometric measurements.

Figure 15Mean velocities and velocity time series at the Siguas (a–b) and Del Medio (c–d) landslides. Velocity measurements plotted in panels (b) and (d) correspond to the mean value of all pixels within the landslide area as outlined in panels (a) and (c); vertical bars are uncertainties calculated as the IQR of velocity over stable terrain (all pixels outside the landslide mask). Measurements are placed in the center of the temporal baseline between the reference and secondary acquisitions and indicate the average velocity over the monitored period. Colors represent correlation groups of L3B data with common viewing and satellite azimuth angles (groups 1–3). We also included group 4 but used the measurements from the orthorectified L1B data, as L3B data are biased by orthorectification errors and are not usable in this context.
6.1 Challenges and limitations
6.1.1 Field of view
For the selection of optimal L3B correlation pairs, we have only considered view angles and the satellite azimuth. For frame images with a larger footprint, an additional factor to take into account is the local incidence angle at the location of the landslide. This angle can vary depending on whether the landslide is situated close to the center or the margins of a scene. To investigate the potential impact of the local incidence angle, we compared the orthorectification error signal with the overlap between the reference and secondary images for a set of stable (short temporal baseline) pairs over the Siguas landslide but found no observable correlation (Fig. S12). The overlap serves as a rough indicator of whether the landslide occupies a similar position in both acquisitions. Based on this finding, we argue that, given the flight altitude of approximately 500 km and the relatively small scene size of 32.5×19.6 km, the variation in incidence angle within a scene can safely be neglected for the current constellation.
6.1.2 Sub-frame misalignment
While we accounted for DEM errors, global shifts, and margin effects through the polynomial fit, one source of distortion that remains challenging to fully address is the misalignment of sub-frames in PSB.SD scenes. Although image processing by Planet seems to have made improvements to the pipeline for PSB.SD scene composition in more recent acquisitions, slight striping is still visible in some displacement maps even after correction, particularly in the NS component (Fig. 10e). Without access to the original L1A data, it is difficult to correct for these effects because the GCPs and homography that went into the alignment process are unknown and impossible to reconstruct. As such, the current option is to acknowledge the inherent limitations and tolerate a marginally lower, but still < 1 pixel, accuracy in the NS component.
6.1.3 Variable shading and changing land cover
Illumination conditions, which can vary significantly between different seasons, pose a well-known challenge for image cross-correlation, especially in rugged mountainous terrain (e.g., Lacroix et al., 2019). Variable shadows across the scene can result in wrong matches that introduce erroneous lateral offsets in the estimated displacement grid. Similarly, rapid land cover changes, e.g., due to farming or seasonal vegetation changes, complicate the matching process because the two scenes become increasingly dissimilar. Figure 16 shows the influence of different illumination conditions (difference in sun elevation and sun azimuth angle) and the temporal baseline between the acquisition of the reference and secondary image on the IQR of derived displacement in EW and NS directions. The mountainous terrain of the Del Medio catchment is characterized by steep slopes and narrow ridges that throw complex shadow patterns on the landscape, which complicates the matching process. The compromised matching capabilities are reflected in the IQR of displacement estimated across stable terrain: variable illumination conditions between the reference image and the secondary image result in a higher spread of estimated displacement. As illumination conditions typically vary between seasons, we also see elevated IQRs for image pairs spanning 6 months, 1.5 years, and 2.5 years (Fig. 16c). At the Siguas site, the influence of the illumination difference on the quality of displacement maps is less pronounced due to the flatter terrain surrounding the river valley (Fig. S13).
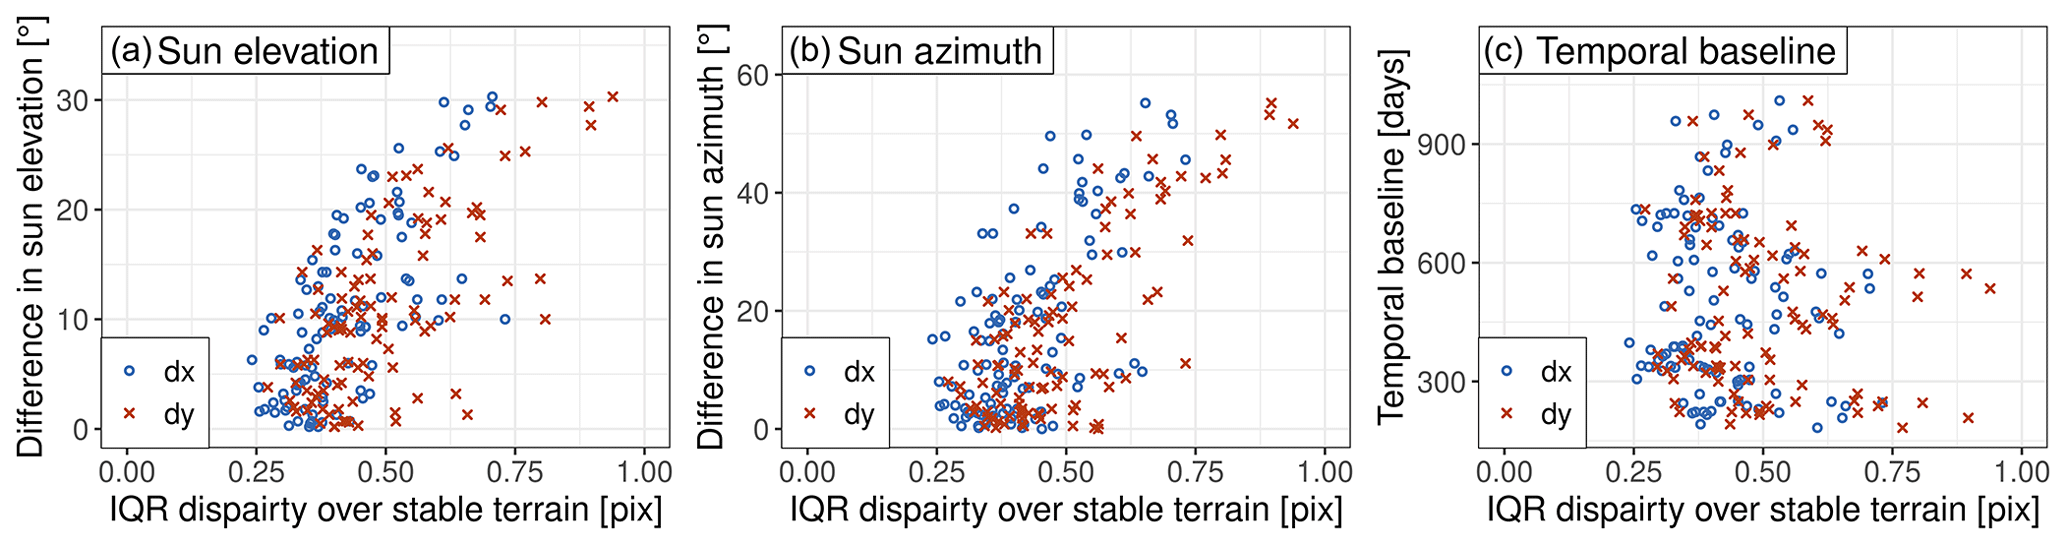
Figure 16IQR of estimated displacement across stable terrain (all pixels outside landslide mask) for all L3B correlation pairs at the Del Medio (n=106) test site, plotted against differences in sun elevation angles (a), sun azimuth angles (b), and temporal baselines between reference and secondary images (c). In the mountainous terrain surrounding the Del Medio landslide, the displacement strongly depends on the sun's position, due to varying illumination conditions that generate different-looking shadows, often resulting in an apparent elevated displacement signal. This results in cross-season pairs typically having higher uncertainties (c). A plot for the Siguas site can be found in Fig. S13 in the Supplement.
The presence of changing land cover or shaded areas may negatively impact the correction capacities of the polynomial fit if these are not filtered properly or may dominate a significant portion of the area studied. Similarly, terrains with widespread movement, e.g., glaciated zones, present challenges for ramp correction through a polynomial fit. Given these considerations, we recommend choosing a study area that covers mostly stable terrain with relatively steady land cover to apply this method.
Shadows and changing land cover can further introduce high uncertainties when affecting the landslide surface. In such cases, only scenes with a short temporal baseline and/or from similar seasons should be considered for correlation. In the case of the Siguas and Del Medio test sites, the landslide surface is mostly shade- and vegetation-free, and we can assume that the velocity measurements over the landslide body are not compromised by poor matching capabilities.
6.2 Comparison of L1B and L3B approaches
This study outlines two methodologies for reducing offset bias resulting from orthorectification errors observed in displacement maps derived from PlanetScope imagery acquired from different perspectives. If and how these errors need to be addressed is dependent on the specific characteristics of the study area. For sites exhibiting only minor topographic changes or where landslide movement substantially outpaces the uncertainty induced by DEM errors, correction efforts may be disregarded. On the other hand, for scenarios involving slow motions (1–40 m yr−1) combined with significant mismatches between the NASADEM and current-day topography, as is the case with the Siguas and Del Medio landslides, mitigation of these errors is crucial.
Using PlanetScope L3B data acquired from common perspectives can simplify error mitigation by reducing processing time and data needs, especially when obtaining images on a limited quota. However, correlating only same-perspective pairs does not fully guarantee the absence of orthorectification errors. Our findings suggest that the roll and pitch angles of the satellites may not always be precise, leaving the potential for small-scale orthorectification errors even if the scenes' metadata suggest common view angles and directions. Utilizing L1B in combination with an updated reference surface instead offers the great advantage that pixels will be correctly projected independent of the satellite's perspective. This also greatly increases the number of potential correlation pairs. Despite the daily temporal resolution of PlanetScope data, image pairs with a common perspective that cover the entire region of interest might be scarce during rainy seasons, for older generations with smaller footprints (Fig. S14), or when monitoring more rapid changes. Finally, the ability to cross-correlate all images is particularly valuable for reconstructing displacement through time series inversion (e.g., Lacroix et al., 2023). Here, a fully connected network of orthorectified L1B image pairs avoids the pitfalls of working with isolated processing groups.
6.3 Transferability to other regions and targets
The proposed approaches are generally transferable to other study sites and moving targets. We provide a list of items to consider when using image cross-correlation methods:
-
Vegetated terrain. Matching capabilities are expected to decrease in areas with dense or seasonally variable vegetation cover, as large dissimilarities between reference and secondary scenes will cause the correlation to fail or produce false matches. Here, only scenes with a short temporal baseline may be eligible for matching, which in turn requires the target to have moved more than the detection limit during this time. If this is not the case, cross-correlation based on optical imagery is likely not the method of choice.
-
Rapid events. Catastrophic landslide failures or co-seismic displacement may cause significant topographic changes that in turn result in orthorectification errors if scenes acquired from different viewing and satellite azimuth angles are correlated. As this work suggests, this bias can be avoided if correlation pairs are limited to scenes acquired from similar perspectives. If pre- and post-event scenes acquired from different perspectives need to be compared, the user should generate a pre- and post-event DEM to ensure correct orthoprojection. Similarly, if motion is monitored over several years, the cumulative elevation changes may at some point affect displacement maps, depending on the speed and vertical component of the landslide movement. In such a case, it may be useful to periodically update the reference DEM and to project reference and secondary images onto different well-aligned DEMs so that the orthorectification error is minimized.
-
Large study areas. The extent of a single PlanetScope scene, together with the need for sufficient overlap between reference and secondary images, restricts the size of targets that can be studied. PSB.SD scenes have a larger footprint (∼ 637 km2) than PS2 scenes (∼ 192 km2) (Planet, 2022b). Regional-scale study areas, however, will require the mosaicing of several subsequent PlanetScope scenes. Planet allows the user to generate custom composites to cover larger areas through the Planet Explorer. Correlation results based on these data, however, reveal artificial displacements at the order of 2 pixels along the margins of the stitched scenes (see Fig. S15). For tracking motions with a magnitude below this margin displacement signal, we recommend not using the currently available composite products and separately carrying out alignment and correction steps to refine the co-registration of subsequent scenes.
PlanetScope data with daily temporal and 3 m spatial resolution hold great potential for capturing and analyzing surface displacements based on optical image correlation. Landslides, however, are particularly susceptible to orthorectification errors, leading to local misregistrations between subsequent scenes, which introduces severe bias in offset estimates. To mitigate orthorectification errors, this study proposes the following approaches:
-
For orthorectified L3B data, we suggest that only image pairs acquired from common perspectives should be considered for correlation. Here, it is important to consider both the view angle and the satellite azimuth angle, as provided in the scenes' metadata, to determine the satellite's viewing direction. By selecting correlation pairs taken from a common perspective, the misprojections introduced by outdated DEM heights during orthorectification remain consistent and do not manifest as apparent displacement in the displacement maps. This approach limits the number of eligible correlation pairs but yields reliable and coherent offset estimates.
-
For unprojected L1B data, the orthorectification error can be reduced even for correlation pairs with different perspectives by orthorectifying the PlanetScope data based on a DEM that more closely reflects the topography at the time of image acquisition. When no external elevation dataset is available, we suggest exploiting the stereo capabilities of PlanetScope scenes with large convergence angles and short temporal baselines to generate a low-resolution reference DEM.
Additional factors compromising the relative geolocation accuracy, such as ramp errors and stereoscopic effects that are not fully removed during orthorectification, can be efficiently modeled through a polynomial fit that takes into account x and y positions and local elevations. Considering these mitigation strategies, we can mitigate bias from co-registration errors and reduce the estimated displacement across stable terrain to an interquartile range of zero pixels and < 1 pixel. Improved co-registration between image pairs yields higher-quality displacement maps that allow a more detailed study of the dynamics of landslide processes. At the Siguas test site, we observe temporally and spatially variable velocities which declined from 10–15 to 5–7 m yr−1 between 2020 and 2023. The Del Medio landslide exhibited a more uniform motion pattern, with velocities from 2–5 m yr−1 between 2020 and 2023 and a low-amplitude seasonal oscillation pattern, potentially driven by high precipitation during the South American summer monsoon.
The observations and processing strategies developed based on these two test sites can be transferred to other regions and dynamic targets, increasing the application potential for studying surface displacement with PlanetScope data to monitor Earth surface processes.
The full Python code for processing and correcting PlanetScope data as conducted in this study can be found on GitHub: https://github.com/UP-RS-ESP/PlanetScope_landslide_tracking (last access: 24 September 2024; https://doi.org/10.5281/zenodo.13826198, Mueting and Bookhagen, 2024).
The PlanetScope scenes used in this study are listed in the Supplement. PlanetScope data can be accessed via Planet's Education and Research Program for non-commercial and academic usage.
The supplement related to this article is available online at: https://doi.org/10.5194/esurf-12-1121-2024-supplement.
Conceptualization: AM and BB. Methodology: AM and BB. Software: AM. Formal analysis and investigation: AM. Resources: BB. Data curation: AM. Writing (original draft preparation): AM. Writing (review and editing): AM and BB. Visualization: AM and BB. Both authors have read and agreed to the published version of the paper.
The contact author has declared that neither of the authors has any competing interests.
Publisher’s note: Copernicus Publications remains neutral with regard to jurisdictional claims made in the text, published maps, institutional affiliations, or any other geographical representation in this paper. While Copernicus Publications makes every effort to include appropriate place names, the final responsibility lies with the authors.
We acknowledge Planet Labs PBC for granting us access to the PlanetScope data through the Education and Research Program (Planet Team, 2022) and thank the Planet Support Team for answering technical questions. We thank our reviewers, Pascal Lacroix and Shashank Bhushan, for their comments which helped to improve the paper. We thank the members of the Geological Remote Sensing group at the University of Potsdam and everyone who contributed to the improvement of this work with their feedback and suggestions. Scientific color maps used throughout this paper are from Crameri et al. (2020).
This research has been supported and the article processing charges have been covered by the Deutsche Forschungsgemeinschaft (grant nos. DFG BO 2933/3-1 and 491466077).
This paper was edited by Giulia Sofia and reviewed by Pascal Lacroix and Shashank Bhushan.
Aati, S. and Avouac, J.-P.: Optimization of Optical Image Geometric Modeling, Application to Topography Extraction and Topographic Change Measurements Using PlanetScope and SkySat Imagery, Remote Sensing, 12, 3418, https://doi.org/10.3390/rs12203418, 2020. a, b
Aati, S., Avouac, J.-P., Rupnik, E., and Deseilligny, M.-P.: Potential and Limitation of PlanetScope Images for 2-D and 3-D Earth Surface Monitoring With Example of Applications to Glaciers and Earthquakes, IEEE T. Geosci. Remote, 60, 1–19, https://doi.org/10.1109/TGRS.2022.3215821, 2022a. a, b, c, d, e, f, g, h, i, j, k, l, m, n
Aati, S., Milliner, C., and Avouac, J.-P.: A new approach for 2-D and 3-D precise measurements of ground deformation from optimized registration and correlation of optical images and ICA-based filtering of image geometry artifacts, Remote Sens. Environ., 277, 113038, https://doi.org/10.1016/j.rse.2022.113038, 2022b. a
Amici, L., Yordanov, V., Oxoli, D., Truong, X. Q., and Brovelli, M. A.: MONITORING LANDSLIDE DISPLACEMENTS THROUGH MAXIMUM CROSS-CORRELATION OF SATELLITE IMAGES, Int. Arch. Photogramm. Remote Sens. Spatial Inf. Sci., XLVIII-4/W1-2022, 27–34, https://doi.org/10.5194/isprs-archives-XLVIII-4-W1-2022-27-2022, 2022. a
Andreuttiova, L., Hollingsworth, J., Vermeesch, P., Mitchell, T. M., and Bergman, E.: Revisiting the 1959 Hebgen Lake Earthquake Using Optical Image Correlation; New Constraints on Near-Field 3D Ground Displacement, Geophys. Res. Lett., 49, e2022GL098666, https://doi.org/10.1029/2022GL098666, 2022. a
Beyer, R., Alexandrov, O., ScottMcMichael, Broxton, M., Lundy, M., Husmann, K., Edwards, L., Nefian, A., SmithB, Shean, D., Smith, T., mstyer, Annex, A., Moratto, Z., harguess, Aravkin, A., Meyer, J., PicoJr, Bhushan, S., and jlaura: NeoGeographyToolkit/StereoPipeline 3.1.0, Zenodo [software], https://doi.org/10.5281/zenodo.6562267, 2022. a
Beyer, R. A., Alexandrov, O., and McMichael, S.: The Ames Stereo Pipeline: NASA’s open source software for deriving and processing terrain data, Earth and Space Science, 5, 537–548, https://doi.org/10.1029/2018EA000409, 2018. a, b, c, d
Bookhagen, B. and Strecker, M. R.: Spatiotemporal trends in erosion rates across a pronounced rainfall gradient: Examples from the southern Central Andes, Earth Planet. Sc. Lett., 327–328, 97–110, https://doi.org/10.1016/j.epsl.2012.02.005, 2012. a
Castino, F., Bookhagen, B., and Strecker, M. R.: Rainfall variability and trends of the past six decades (1950–2014) in the subtropical NW Argentine Andes, Clim. Dynam., 48, 1049–1067, https://doi.org/10.1007/s00382-016-3127-2, 2017. a
Chudley, T. R., Howat, I. M., Yadav, B., and Noh, M.-J.: Empirical correction of systematic orthorectification error in Sentinel-2 velocity fields for Greenlandic outlet glaciers, The Cryosphere, 16, 2629–2642, https://doi.org/10.5194/tc-16-2629-2022, 2022. a
Crameri, F., Shephard, G., and Heron, P.: The misuse of colour in science communication, Nat. Commun., 11, 5444, https://doi.org/10.1038/s41467-020-19160-7, 2020. a
d’Angelo, P. and Reinartz, P.: DIGITAL ELEVATION MODELS FROM STEREO, VIDEO AND MULTI-VIEW IMAGERY CAPTURED BY SMALL SATELLITES, Int. Arch. Photogramm. Remote Sens. Spatial Inf. Sci., XLIII-B2-2021, 77–82, https://doi.org/10.5194/isprs-archives-XLIII-B2-2021-77-2021, 2021. a
Dille, A., Kervyn, F., Handwerger, A. L., d'Oreye, N., Derauw, D., Mugaruka Bibentyo, T., Samsonov, S., Malet, J.-P., Kervyn, M., and Dewitte, O.: When image correlation is needed: Unravelling the complex dynamics of a slow-moving landslide in the tropics with dense radar and optical time series, Remote Sens. Environ., 258, 112402, https://doi.org/10.1016/j.rse.2021.112402, 2021. a, b, c
European Space Agency, S.: Copernicus Global Digital Elevation Model, OpenTopography [data set], https://doi.org/10.5069/G9028PQB, 2021. a
Facciolo, G., Franchis, C. D., and Meinhardt, E.: MGM: A Significantly More Global Matching for Stereovision, in: BMVC 2015, edited by: Press, B., Swansea, United Kingdom, https://bmva-archive.org.uk/bmvc/2015/papers/paper090/paper090.pdf (last access: 24 September 2024), 2015. a
Feng, Z., Feng, G., Chen, H., Xu, W., Li, Z., He, L., and Ren, Z.: A Block Ramp Errors Correction Method of Planet Subpixel Offset: Application to the 2018 Mw 7.5 Palu Earthquake, Indonesia, IEEE Access, 7, 174924–174931, https://doi.org/10.1109/ACCESS.2019.2956198, 2019. a, b, c
Figueroa, S., Weiss, J. R., Hongn, F., Pingel, H., Escalante, L., Elías, L., Aranda-Viana, R. G., and Strecker, M. R.: Late Pleistocene to Recent Deformation in the Thick-Skinned Fold-and-Thrust Belt of Northwestern Argentina (Central Calchaquí Valley, 26° S), Tectonics, 40, e2020TC006394, https://doi.org/10.1029/2020TC006394, 2021. a
Frazier, A. E. and Hemingway, B. L.: A Technical Review of Planet Smallsat Data: Practical Considerations for Processing and Using PlanetScope Imagery, Remote Sensing, 13, 3930, https://doi.org/10.3390/rs13193930, 2021. a
Gardner, A. S., Moholdt, G., Scambos, T., Fahnstock, M., Ligtenberg, S., van den Broeke, M., and Nilsson, J.: Increased West Antarctic and unchanged East Antarctic ice discharge over the last 7 years, The Cryosphere, 12, 521–547, https://doi.org/10.5194/tc-12-521-2018, 2018. a, b
Ghuffar, S.: DEM Generation from Multi Satellite PlanetScope Imagery, Remote Sensing, 10, 1462, https://doi.org/10.3390/rs10091462, 2018. a
Graber, A., Santi, P., and Meza, P.: Constraining the critical groundwater conditions for initiation of large, irrigation-induced landslides, Siguas River Valley, Peru, Landslides, 18, 3753–3767, https://doi.org/10.1007/s10346-021-01767-6, 2021. a, b, c
Grodecki, J. and Dial, G.: Block Adjustment of High-Resolution Satellite Images Described by Rational Polynomials, Photogram. Eng. Rem. S., 69, 59–68, https://doi.org/10.14358/PERS.69.1.59, 2003. a
Handwerger, A., Huang, M.-H., Fielding, E., Booth, A., and Burgmann, R.: A shift from drought to extreme rainfall drives a stable landslide to catastrophic failure, Sci. Rep., 9, 1569, https://doi.org/10.1038/s41598-018-38300-0, 2019. a
Handwerger, A. L., Roering, J. J., and Schmidt, D. A.: Controls on the seasonal deformation of slow-moving landslides, Earth Planet. Sc. Lett., 377–378, 239–247, https://doi.org/10.1016/j.epsl.2013.06.047, 2013. a
Handwerger, A. L., Fielding, E. J., Sangha, S. S., and Bekaert, D. P. S.: Landslide Sensitivity and Response to Precipitation Changes in Wet and Dry Climates, Geophys. Res. Lett., 49, e2022GL099499, https://doi.org/10.1029/2022GL099499, 2022. a
Hermanns, R., Valderrama Murillo, P., Fauqué, L., Penna, I., Sepúlveda, S., Moreiras, S., and Zavala, B.: Landslides in the Andes and the need to communicate on an interandean level on landslide mapping and research, Revista de la Asociacion Geologica Argentina, 69, 321–327, https://revista.geologica.org.ar/raga/article/view/518 (last access: 24 September 2024), 2012. a, b, c
Hermle, D., Keuschnig, M., Hartmeyer, I., Delleske, R., and Krautblatter, M.: Timely prediction potential of landslide early warning systems with multispectral remote sensing: a conceptual approach tested in the Sattelkar, Austria, Nat. Hazards Earth Syst. Sci., 21, 2753–2772, https://doi.org/10.5194/nhess-21-2753-2021, 2021. a
Hilley, G. E., Bürgmann, R., Ferretti, A., Novali, F., and Rocca, F.: Dynamics of Slow-Moving Landslides from Permanent Scatterer Analysis, Science, 304, 1952–1955, https://doi.org/10.1126/science.1098821, 2004. a
Hirt, C.: Artefact detection in global digital elevation models (DEMs): The Maximum Slope Approach and its application for complete screening of the SRTM v4.1 and MERIT DEMs, Remote Sens. Environ., 207, 27–41, https://doi.org/10.1016/j.rse.2017.12.037, 2018. a
Huang, D., Tang, Y., and Qin, R.: An evaluation of PlanetScope images for 3D reconstruction and change detection – experimental validations with case studies, GISci. Remote Sens., 59, 744–761, https://doi.org/10.1080/15481603.2022.2060595, 2022. a
Kääb, A., Altena, B., and Mascaro, J.: Coseismic displacements of the 14 November 2016 Mw 7.8 Kaikoura, New Zealand, earthquake using the Planet optical cubesat constellation, Nat. Hazards Earth Syst. Sci., 17, 627–639, https://doi.org/10.5194/nhess-17-627-2017, 2017. a, b, c, d, e
Kääb, A., Altena, B., and Mascaro, J.: River-ice and water velocities using the Planet optical cubesat constellation, Hydrol. Earth Syst. Sci., 23, 4233–4247, https://doi.org/10.5194/hess-23-4233-2019, 2019. a
Keefer, D.: Investigating Landslides Caused by Earthquakes – A Historical Review, Surv. Geophys., 23, 473–510, https://doi.org/10.1023/A:1021274710840, 2002. a
Kääb, A., Winsvold, S. H., Altena, B., Nuth, C., Nagler, T., and Wuite, J.: Glacier Remote Sensing Using Sentinel-2. Part I: Radiometric and Geometric Performance, and Application to Ice Velocity, Remote Sensing, 8, 598, https://doi.org/10.3390/rs8070598, 2016. a, b
Lacroix, P., Berthier, E., and Maquerhua, E. T.: Earthquake-driven acceleration of slow-moving landslides in the Colca valley, Peru, detected from Pléiades images, Remote Sens. Environ., 165, 148–158, https://doi.org/10.1016/j.rse.2015.05.010, 2015. a
Lacroix, P., Araujo, G., Hollingsworth, J., and Taipe, E.: Self-Entrainment Motion of a Slow-Moving Landslide Inferred From Landsat-8 Time Series, J. Geophys. Res.-Earth, 124, 1201–1216, https://doi.org/10.1029/2018JF004920, 2019. a, b, c, d, e, f, g, h
Lacroix, P., Dehecq, A., and Taipe, E.: Irrigation-triggered landslides in a Peruvian desert caused by modern intensive farming, Nat. Geosci., 13, 1–5, https://doi.org/10.1038/s41561-019-0500-x, 2020a. a, b, c
Lacroix, P., Handwerger, A., and Bièvre, G.: Life and death of slow-moving landslides, Nat. Rev. Earth Environ., 1, 404–419, https://doi.org/10.1038/s43017-020-0072-8, 2020b. a
Lacroix, P., Huanca, J., Albinez, L., and Taipe, E.: Precursory Motion and Time-Of-Failure Prediction of the Achoma Landslide, Peru, From High Frequency PlanetScope Satellites, Geophys. Res. Lett., 50, e2023GL105413, https://doi.org/10.1029/2023GL105413, 2023. a, b, c, d
Lei, Y., Gardner, A., and Agram, P.: Autonomous Repeat Image Feature Tracking (autoRIFT) and Its Application for Tracking Ice Displacement, Remote Sensing, 13, 749, https://doi.org/10.3390/rs13040749, 2021. a, b
Leprince, S., Ayoub, F., Klinger, Y., and Avouac, J.-P.: Co-Registration of Optically Sensed Images and Correlation (COSI-Corr): an operational methodology for ground deformation measurements, in: 2007 IEEE International Geoscience and Remote Sensing Symposium, Barcelona, Spain, 23–28 July 2007, 1943–1946, https://doi.org/10.1109/IGARSS.2007.4423207, 2007. a, b
Mansour, M., Morgenstern, N., and Martin, D.: Expected damage from displacement of slow-moving slides, Landslides, 8, 117–131, https://doi.org/10.1007/s10346-010-0227-7, 2011. a
Mazzanti, P., Caporossi, P., and Muzi, R.: Sliding Time Master Digital Image Correlation Analyses of CubeSat Images for landslide Monitoring: The Rattlesnake Hills Landslide (USA), Remote Sensing, 12, 592, https://doi.org/10.3390/rs12040592, 2020. a
Mehrparvar, A., Pignatelli, D., Carnahan, J., Munakat, R., Lan, W., Toorian, A., Hutputanasin, A., and Lee, S.: Cubesat design specification rev. 13, The CubeSat Program, Cal Poly San Luis Obispo, US, 1, https://static1.squarespace.com/static/5418c831e4b0fa4ecac1bacd/t/56e9b62337013b6c063a655a/1458157095454/cds_rev13_final2.pdf (last access: 1 May 2023), 2014. a
Milliner, C., Sammis, C., Allam, A., Dolan, J., Hollingsworth, J., Leprince, S., and Ayoub, F.: Resolving Fine-Scale Heterogeneity of Co-seismic Slip and the Relation to Fault Structure, Sci. Rep., 6, 27201, https://doi.org/10.1038/srep27201, 2016. a
Mueting, A. and Bookhagen, B.: UP-RS-ESP/PlanetScope_landslide_tracking: Initial Release (v0.1.0), Zenodo [code], https://doi.org/10.5281/zenodo.13826198, 2024. a, b, c
Mueting, A., Bookhagen, B., and Strecker, M. R.: Identification of Debris-Flow Channels Using High-Resolution Topographic Data: A Case Study in the Quebrada del Toro, NW Argentina, J. Geophys. Res.-Earth, 126, e2021JF006330, https://doi.org/10.1029/2021JF006330, 2021. a
Muhammad, M., Williams-Jones, G., Stead, D., Tortini, R., Falorni, G., and Donati, D.: Applications of Image-Based Computer Vision for Remote Surveillance of Slope Instability, Front. Earth Sci., 10, 909078, https://doi.org/10.3389/feart.2022.909078, 2022. a, b
NASA JPL: NASADEM Merged DEM Global 1 arc second V001, OpenTopography [data set], https://doi.org/10.5069/G93T9FD9, 2021. a, b
Nuth, C. and Kääb, A.: Co-registration and bias corrections of satellite elevation data sets for quantifying glacier thickness change, The Cryosphere, 5, 271–290, https://doi.org/10.5194/tc-5-271-2011, 2011. a
Planet: What does the “ground_control” field in the metadata signify?, https://support.planet.com/hc/en-us/articles/360016420313-What-does-the-ground-control-field-in-the-metadata-signify- (last access: 1 May 2023), 2019. a
Planet: Planet L1 Data Quality Q3 2022 Report, https://support.planet.com/hc/en-us/articles/360037649554 (last access: 1 May 2023), 2022a. a, b, c, d, e, f, g
Planet: Planet Imagery Product Specifications, https://assets.planet.com/docs/Planet_Combined_Imagery_Product_Specs_letter_screen.pdf (last access: 1 May 2023), 2022b. a, b, c, d, e, f, g, h, i, j, k, l
Planet: Understanding PlanetScope Instruments, https://developers.planet.com/docs/apis/data/sensors/ (last access: 1 May 2023), 2023. a, b, c, d
Planet Team: Planet Application Program Interface: In Space for Life on Earth, San Francisco, CA, https://api.planet.com (last access: 1 May 2023), 2022. a
Purinton, B. and Bookhagen, B.: Validation of digital elevation models (DEMs) and comparison of geomorphic metrics on the southern Central Andean Plateau, Earth Surf. Dynam., 5, 211–237, https://doi.org/10.5194/esurf-5-211-2017, 2017. a
Purinton, B. and Bookhagen, B.: Measuring decadal vertical land-level changes from SRTM-C (2000) and TanDEM-X (∼ 2015) in the south-central Andes, Earth Surf. Dynam., 6, 971–987, https://doi.org/10.5194/esurf-6-971-2018, 2018. a, b
Purinton, B. and Bookhagen, B.: Beyond Vertical Point Accuracy: Assessing Inter-pixel Consistency in 30 m Global DEMs for the Arid Central Andes, Front. Earth Sci., 9, 758606, https://doi.org/10.3389/feart.2021.758606, 2021. a, b
Purinton, B., Mueting, A., and Bookhagen, B.: Image Texture as Quality Indicator for Optical DEM Generation: Geomorphic Applications in the Arid Central Andes, Remote Sensing, 15, 85, https://doi.org/10.3390/rs15010085, 2023. a, b
Rupnik, E., Daakir, M., and Deseilligny, M.: MicMac – a free, open-source solution for photogrammetry, Open Geospatial Data, Software and Standards, 2, 1–9, https://doi.org/10.1186/s40965-017-0027-2, 2017. a
Savi, S., Schildgen, T. F., Tofelde, S., Wittmann, H., Scherler, D., Mey, J., Alonso, R. N., and Strecker, M. R.: Climatic controls on debris-flow activity and sediment aggradation: The Del Medio fan, NW Argentina, J. Geophys. Res.-Earth, 121, 2424–2445, https://doi.org/10.1002/2016JF003912, 2016. a, b, c
Shean, D. E., Alexandrov, O., Moratto, Z. M., Smith, B. E., Joughin, I. R., Porter, C., and Morin, P.: An automated, open-source pipeline for mass production of digital elevation models (DEMs) from very-high-resolution commercial stereo satellite imagery, ISPRS J. Photogramm., 116, 101–117, https://doi.org/10.1016/j.isprsjprs.2016.03.012, 2016. a, b
Socquet, A., Hollingsworth, J., Pathier, E., and Bouchon, M.: Evidence of supershear during the 2018 magnitude 7.5 Palu earthquake from space geodesy, Nat. Geosci., 12, 192–199, https://doi.org/10.1038/s41561-018-0296-0, 2019. a
Strecker, M. R., Alonso, R. N., Bookhagen, B., Carrapa, B., Hilley, G. E., Sobel, E. R., and Trauth, M. H.: Tectonics and climate of the southern central Andes, Annu. Rev. Earth Pl. Sc., 35, 747–787, https://doi.org/10.1146/annurev.earth.35.031306.140158, 2007. a
Stumpf, A., Malet, J.-P., Allemand, P., and Ulrich, P.: Surface reconstruction and landslide displacement measurements with Pléiades satellite images, ISPRS J. Photogramm., 95, 1–12, https://doi.org/10.1016/j.isprsjprs.2014.05.008, 2014. a
Stumpf, A., Malet, J.-P., and Delacourt, C.: Correlation of satellite image time-series for the detection and monitoring of slow-moving landslides, Remote Sens. Environ., 189, 40–55, https://doi.org/10.1016/j.rse.2016.11.007, 2017. a
Tao, C. and Hu, Y.: A Comprehensive study of the rational function model for photogrammetric processing, Photogramm. Eng. Rem. S., 67, 1347–1357, 2001. a, b
- Abstract
- Introduction
- Test cases and their geographic setting
- The PlanetScope constellation
- Data and methods
- Results
- Discussion
- Conclusions
- Code availability
- Data availability
- Author contributions
- Competing interests
- Disclaimer
- Acknowledgements
- Financial support
- Review statement
- References
- Supplement