the Creative Commons Attribution 4.0 License.
the Creative Commons Attribution 4.0 License.
A method based on structure-from-motion photogrammetry to generate sub-millimetre-resolution digital elevation models for investigating rock breakdown features
Mary Carol Bourke
We have generated sub-millimetre-resolution DEMs of weathered rock surfaces using SfM photogrammetry techniques. We apply a close-range method based on structure-from-motion (SfM) photogrammetry in the field and use it to generate high-resolution topographic data for weathered boulders and bedrock. The method was pilot tested on extensively weathered Triassic Moenkopi sandstone outcrops near Meteor Crater in Arizona. Images were taken in the field using a consumer-grade DSLR camera and were processed in commercially available software to build dense point clouds. The point clouds were registered to a local 3-D coordinate system (x, y, z), which was developed using a specially designed triangle-coded control target and then exported as digital elevation models (DEMs). The accuracy of the DEMs was validated under controlled experimental conditions. A number of checkpoints were used to calculate errors. We also evaluated the effects of image and camera parameters on the accuracy of our DEMs. We report a horizontal error of 0.5 mm and vertical error of 0.3 mm in our experiments. Our approach provides a low-cost method for obtaining very high-resolution topographic data on weathered rock surfaces (area < 10 m2). The results from our case study confirm the efficacy of the method at this scale and show that the data acquisition equipment is sufficiently robust and portable. This is particularly important for field conditions in remote locations or steep terrain where portable and efficient methods are required.
- Article
(61091 KB) - Full-text XML
-
Supplement
(593 KB) - BibTeX
- EndNote
Rock breakdown describes a range of geomorphic processes that transform rock masses into soil or regolith and unconsolidated rock materials. It plays a vital role in climate control via atmosphere–lithosphere interaction, biogeochemical cycling, and landform evolution on a planetary scale (Goudie and Viles, 2012). The scale of features range from micrometre (e.g. fractures, weathering pits, fractures) to metre scale (e.g. tafoni, scaling, and blisters) (Viles, 2001; Bourke and Viles, 2007). In addition, many active rock breakdown processes that operate over a short geological timescale (100–102 years) produce observable micro-scale (millimetre to centimetre) breakdown features. To better understand the weathering processes, high-resolution (sub-millimetre to millimetre) microtopographic data are necessary for in situ measurement of small-scale weathering features (Viles, 2001). To date, the inability to measure the general geomorphometry of small-scale breakdown features has inhibited our understanding of the causal links at relevant scales. Many small-scale (millimetre to centimetre) breakdown features are ambiguous, and it remains challenging to distinguish between similar-looking features (e.g. aeolian pits vs. dissolution pits) and therefore to establish a clear link between weathering feature form and the formative process. Even for homogenous forms on a surface, it may be difficult to understand the role of individual weathering mechanisms (Viles, 2005, 2010; Viles et al., 2018; Warke, 2007). In addition, extending analysis routines between rock breakdown sites, to better understand features that often show considerable complexity in their intensity, size, and shape depending on lithological, geological, and micro-environmental factors (Viles, 2001), has been limited by the application of different techniques at different scales and in different locations. Using the same technique (i.e. SfM) across scales will permit similar analysis routines for different scale landscapes (Cullen et al., 2018).
This will facilitate the investigation of potential feedbacks across various scales boundaries. The morphometric analysis of topography at different scales will aid interpretation of the complex interrelationship of weathering processes and landscapes and facilitate a better understanding of the multi-scale weathering system (Viles, 2013).
Quantitative analysis of landforms is necessary for the identification and interpretation of landform genesis and history. In the past few decades, a range of microtopographic data collection methods have been used in rock breakdown and soil erosion studies. These include (1) laser scanning techniques (Fardin et al., 2001, 2004; Bourke et al., 2007; Bourke et al., 2008; Aguilar et al., 2009; Sturzenegger and Stead, 2009; MŁynarczuk, 2010; Medapati et al., 2013; Chen et al., 2014; Ge et al., 2014; Lai et al., 2014), (2) stereophotogrammetry (Rieke-Zapp and Nearing, 2005; Taconet and Ciarletti, 2007; Aguilar et al., 2009; Bui et al., 2009; Sturzenegger and Stead, 2009; Kim et al., 2015), and (3) micro-roughness meters (MRMs) (McCarroll, 1992; McCarroll and Nesje, 1996; White et al., 1998). However, there are significant logistical, technical, and, for some, financial constraints that have hindered the adoption of these methods, particularly in physically challenging terrains such as remote, difficult to access, and steep terrains.
Laser scanning permits the collection of high-resolution topographic data at the relevant scale for the study of small-scale rock breakdown features. However, due to difficulties associated with transporting the often-cumbersome instrument in the field (Ehlmann et al., 2008), this technology has rarely been used to collect data on rock surfaces in situ (Fardin et al., 2004). Additionally, laser scanners require a stable platform on which to operate, and this can be difficult to find in steep terrain (e.g. crater and canyon walls, mountainous terrain). There are handheld portable laser scanners available which do not require a stable platform to operate, but the resolution offered by them is currently insufficient to resolve millimetre- to centimetre-scale rock breakdown features (Chan et al., 2016).
Stereophotogrammetry is a method of DEM generation using stereo images of an object or surface. It is widely applied in terrestrial and planetary terrains (Kim and Muller, 2009; Li et al., 2011). Knowledge of camera internal geometry (i.e. sensor type and size), camera calibration parameters, and ground control points (GCPs) with known coordinates along with inertial measurement parameters (i.e. yaw, pitch, and roll) is a critical requirement for stereophotogrammetry to solve the collinearity equation and orient photogrammetric models (Taconet and Ciarletti, 2007; Aguilar et al., 2009).
While both methods have been effectively used to analyse rock breakdown at larger scales, both require expensive software (e.g. SocetSet, PHOTOMOD, FARO Scene, Trimble RealWorks, Leica CYCLONE, VisionLidar) and expert knowledge to process data and generate DEMs, the cost of which may push this technology beyond many academic research budgets.
The micro-roughness meter (MRM) (McCarroll, 1992; McCarroll and Nesje, 1996; White et al., 1998) is operated manually and has been used to characterise and quantify breakdown on rock surfaces. Direct physical access to the rock surface is required, which limits sampling in out-of-reach locations (McCarroll and Nesje, 1996). While the resolution, precision, and accuracy of MRM (∼0.001 to 0.005 mm) is higher than laser scanning and photogrammetry techniques (sub-millimetre to millimetre), the topographic data obtained from MRM are two-dimensional and limit the analysis to the calculation of profile roughness parameters. The profile roughness parameters only provide information along a profile, not the entire rock surface, which often makes it difficult to determine the exact nature of a topographic feature (Leach, 2013). In comparison, 3-D data from laser scanners and photogrammetry enable the calculation of areal surface roughness parameters. These parameters have advantages over traditional profile roughness parameters and have more statistical significance than equivalent profile measurements (Leach, 2013).
Structure from motion (SfM)
Structure from motion (SfM) is an established and widely used method to generate 3-D models in the geosciences (Favalli et al., 2012; Westoby et al., 2012; Smith et al., 2016). It is increasingly used in geomorphology for the characterisation of topographic surfaces and analysis of spatial and temporal geomorphic changes, with an accuracy comparable to existing laser scanning and stereophotogrammetry techniques in close-range scenarios (Aguilar et al., 2009; Thoeni et al., 2014; Smith et al., 2016; Wilkinson et al., 2016). SfM photogrammetry utilises a sequence of overlapping digital images of a static subject taken from different spatial positions to produce a 3-D point cloud. Image metadata for image matching are used to estimate 3-D geometry and camera positions using a bundle adjustment algorithm (Smith et al., 2016). The workflow uses an automated scale-invariant feature transform (SIFT) image matching method (Smith et al., 2016). The advancement in new image matching algorithms has eased and automated the SfM workflow compared to stereophotogrammetry (Remondino et al., 2014; Smith et al., 2016).
Applications in geomorphology include laboratory flume experiments (Morgan et al., 2017), rockslides and landslides (Niethammer et al., 2012; Russell, 2016), eroding badlands (Smith and Vericat, 2015), fluvial morphology (Javernick et al., 2014; Dietrich, 2015; Bakker and Lane, 2016; Dietrich, 2016a, b), peatland microforms (Mercer and Westbrook, 2016), glacial process dynamics (Piermattei et al., 2016; Immerzeel et al., 2017), river restoration (Marteau et al., 2016), mapping coral reefs (Casella et al., 2016), beach surveying (Brunier et al., 2016), soil erosion (Snapir et al., 2014; Balaguer-Puig et al., 2017; Prosdocimi et al., 2017; Vinci et al., 2017; Heindel et al., 2018), volcanic terrains (James and Robson, 2012; Bretar et al., 2013; Carr et al., 2018), porosity of river bed material (Seitz et al., 2018), grain size estimation of gravel bed rivers (Pearson et al., 2017), and coastal erosion (James and Robson, 2012). In addition, SfM has also been widely used in archaeology for photogrammetric recording of small-scale rock art and artefacts and large-scale archaeological sites (Sapirstein, 2016, 2018; Sapirstein and Murray, 2017; Jalandoni et al., 2018).
The increased uptake of this method is primarily due to its relatively low cost, high portability, and ease of data processing workflow. Much of the SfM workflow is automated in a range of relatively affordable commercial software (e.g. Agisoft PhotoScan, SURE, Photomodeler), closed source-free software (e.g. VisualSfM, CMPMVS), and open-source software (e.g. Bundler, OpenMVG, OpenMVS, MicMac, SFMToolkit).
There is a considerable amount of available literature on SfM techniques and workflows. A detailed discussion of the technique is found in several available papers: e.g. Westoby et al. (2012); Fonstad et al. (2013); Thoeni et al. (2014); Micheletti et al. (2015a, b); Eltner et al. (2016); Ko and Ho (2016); Smith et al. (2016); Schonberger and Frahm (2016); Bedford (2017); Zhu et al. (2017); Ozyesil et al. (2017).
Several studies have reported high accuracy in 3-D topographic data obtained using SfM when compared to methods such as terrestrial laser scanning (TLS) or RTK-GPS surveys (Harwin and Lucieer, 2012; Favalli et al., 2012; Andrews et al., 2013; Fonstad et al., 2013; Nilosek et al., 2014; Caroti et al., 2015; Dietrich, 2015; Palmer et al., 2015; Clapuyt et al., 2016; Koppel, 2016; Piermattei et al., 2016; Panagiotidis et al., 2016; Wilkinson et al., 2016). A detailed comparison of cost–benefit, data acquisition rate, spatial coverage, operating condition, resolution, and accuracy analysis between TLS and SfM techniques is found in Smith et al. (2016) and Wilkinson et al. (2016). The recent advances in structure-from-motion approaches (SfM) have yet to be been widely applied to micro-scale landforms, such as rock breakdown features.
Here we test the use of SfM for very high-resolution (sub-millimetre) application. Our approach uses high-resolution digital photography (from consumer-grade camera) combined with SfM workflow. We evaluate errors in our DEMs using checkpoints in the field and validate our approach through a series of controlled experiments. We also assess the error propagation with distance from the control target in DEMs generated in our experiment. We find that SfM offers a robust approach for rock breakdown studies.
Our work provides an alternative and/or additional cost-effective, transportable, and fieldwork-friendly method for use in geomorphological studies that require the production of high-resolution topographic models from field sites. Below, we outline the development and test of our approach in the field and under controlled conditions. We provide a detailed guide so that others may adopt our approach in their research.
2.1 Equipment
The quality of image data collection can be improved by careful camera system selection, configuration, and image acquisition. The camera system plays a vital role in effective resolution, signal-to-noise ratio, and distortion (Mosbrucker et al., 2017). For this work, a low-cost, consumer-grade, ultra-compact, and lightweight Nikon D5500 DSLR camera was used. A digital single-lens reflex (DSLR) camera system includes a camera body and a lens. This camera has an Advanced Photo System type-C (APS-C) sensor (366.6 mm2) with no anti-aliasing filter and captures an image with an effective resolution of 24.2 megapixels (MP). A DSLR camera provides flexibility in selecting different kinds of lenses and captures high-resolution images in raw format. Images in raw format store more red–green–blue (RGB) pixel information than in joint photographic experts group (JPEG) format. We used a zoom lens with a variable focal length of 18–55 mm and a 35 mm prime- or fixed-focal-length lens in this study. A more comprehensive discussion of the camera system consideration and configuration for SfM photogrammetry is found in Bedford (2017), Mosbrucker et al. (2017), and Sapirstein and Murray (2017).
2.2 Control target and local coordinate system
The dense point cloud generated by SfM is not scaled or oriented to real-world dimensions. Therefore, registration to a known coordinate system (geographic or local) using ground control points (GCPs) is required to reference and scale the model. GCP refers to a point with known coordinates (x, y, z). Incorporating GCPs in the SfM workflow is known to reduce systematic errors such as doming and dishing (Javernick et al., 2014; James and Robson, 2014) and permits a check on the accuracy of DEMs. At least three GCPs are required to generate a DEM from a dense point cloud.
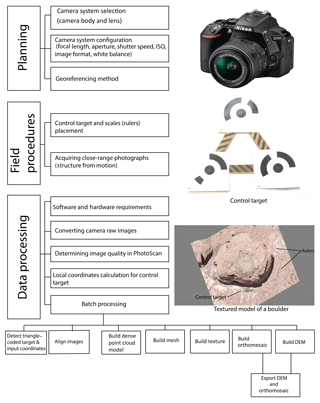
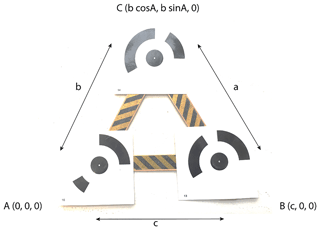
For our study, we designed and built a new portable control target (Fig. 2). The triangle control target was made from 13 cm long craft sticks covered with textured plastic tape to protect it from shrinking and swelling in humid conditions (Fig. 2). Each vertex served as a GCP. A set of three 12-bit coded markers were printed from Agisoft PhotoScan software, laminated, and attached at each vertex (Fig. 2). The advantage of using coded markers is that they can be automatically identified in PhotoScan, which minimises the time and reduces error. Goldstein et al. (2015) found that the number and the placement of GCPs affect the accuracy of SfM-derived DEMs. In this work, our area of interest was small (< 10 m2), and hence we determined that three GCPs would be sufficient.
We used our triangle-coded control target (GCPs) to calculate local coordinates to scale and reference our DEMs (Fig. 2). The length of the triangle sides to the GCP centre was measured using an engineer's scale with 0.5 mm accuracy. The sides of the triangle were 0.133, 0.132, and 0.131 m, respectively, for a, b, and c (Fig. 2). The angle A (54.03∘ or 1.06 radians) was determined using the cosine rule, and the coordinates of each vertex of the triangle were determined using trigonometry (Fig. 2 and Table 1).
2.3 Data processing
Following image data acquisition (described below) the data were processed using an Intel Xeon workstation with 32 GB of RAM and a 2 GB Nvidia Quadro 4000 graphics card. We used commercially available software (Adobe Lightroom CC) to process raw images and Agisoft PhotoScan for DEM generation. PhotoScan is a “blackbox” software, so the exact SfM algorithm used remains unclear.
PhotoScan does not support NEF file format (raw) images generated by the Nikon camera, and they were converted to tiff format. While this step increases processing time, the benefit of capturing images in raw format is that any photometric corrections (i.e. exposure correction) can be performed without losing metadata (Guidi et al., 2014). Raw images were imported into Lightroom and exported as uncompressed tiff image files with AdobeRGB (1998) colour space (Süsstrunk et al., 1999; Korytkowski and Olejnik-Krugly, 2017) and a bit depth of 16 bits per component. Image histograms generated in Lightroom confirmed that the images were well exposed, and no photometric correction was required. Each raw file was 25–30 MB. When converted to uncompressed tiff, this increased to 130–140 MB per image file. Exporting tiff images from Lightroom took about 5–10 min in total.
2.4 DEM generation workflow in PhotoScan
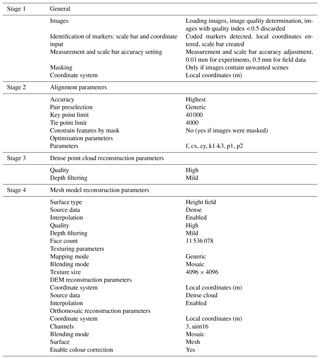
Agisoft PhotoScan is a popular software for generating DEMs from the SfM photogrammetry technique. Many published studies have already described the DEM production workflow in PhotoScan (e.g. Leon et al., 2015; James et al., 2017a) so we only summarise the parameters used in our study here. A detailed step-by-step guideline for this study is presented in Sect. S1 (Supplement). For a more detailed explanation of workflow in PhotoScan, we refer readers to Agisoft (2016) and Shervais K. (2016).
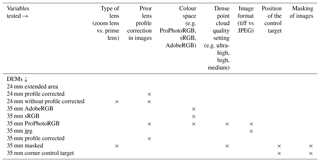
A series of controlled image acquisition experiments were conducted to evaluate the horizontal and vertical errors of the DEMs generated using the GCP developed in this study (Figs. 3 and 4). In addition, we tested the influence of a range of other variables on the accuracy and quality of DEMs. These include (1) type of lens, (2) prior lens profile correction, (3) colour space of images, (4) dense point cloud quality setting in PhotoScan, (5) image file format, (6) the position of the control target with respect to the subject, and (7) masking of images (Table 3).
3.1 Experiment design
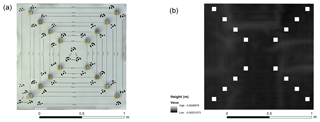
In order to validate the sub-millimetre horizontal and vertical accuracy of the DEM generated, a calibrated error evaluation chart was designed in Adobe InDesign and printed as a 1.4×1.4 m poster (Fig. 3). This chart contains four concentric squares and 16 coded scale bars of known length (Fig. 3). This chart was laid on the relatively flat ground ( from the centre of the poster), and 16 wooden cubes of dimension ∼5 cm were placed on the vertices of each square (Figs. 3 and 5a). We chose wooden blocks because of their non-homogeneous texture, which is easily reconstructed using photogrammetry. Sixteen coded scale bars were used as checkpoints to estimate horizontal (XY) errors, and 16 wooden blocks were used to determine vertical (Z) errors. Two triangle-coded control targets were designed in the centre and the left corner of the poster (Fig. 3). An additional four, 25 cm long, coded scale bars were placed 60 cm away from the outer scale bar on each side of the poster. The coordinates of the triangle-coded target were determined as described in Sect. 2.2. The experiment was undertaken outside in overcast lighting conditions.
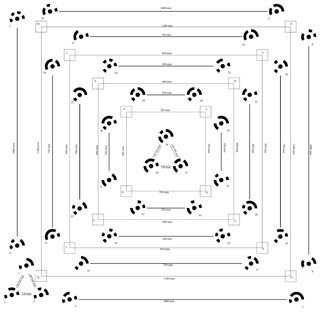
Figure 3Error evaluation chart (1.4×1.4 m). Coded scale bars are horizontal checkpoints. Wooden blocks (small squares) at each vertex of bigger squares are vertical checkpoints. Two triangle-coded control targets were used to georeference DEMs.
Three sets of images of the poster and the nearby ground surface made up of concrete paving stones with visible edges were acquired using a zoom lens set at 24 and a 35 mm prime- or fixed-focal-length lens. Two sets of images were taken by the zoom lens set at 24 and a 35 mm prime lens. The third set of images was acquired using a zoom lens set at 24 mm to cover the extended area where four additional scale bars were placed outside the poster on the cement surface. All the images were acquired using a Nikon D5500 in manual mode. Camera settings were adjusted for the best result for the lighting conditions during the experiment. Aperture was set at f∕7.1, shutter speed was fixed at 1∕200 s, and ISO was kept at 100. The focus was set to autofocus during image acquisition. Images were acquired in raw and then converted into an uncompressed tiff in Adobe Lightroom (Sect. 2.3).
Raw images were processed to change a few parameters in the image sets. Ten models were run in PhotoScan from the three sets of images acquired. The DEMs were generated using the workflow described in Sect. 2.4. Table 3 summarises the variables tested in the 10 DEMs.
3.2 Estimating errors
The error evaluation chart (Fig. 3) was used to estimate errors in the following way. The coded scale bars were used as horizontal checkpoints. The distance between coded markers and the centroid of the triangular control target was measured with an accuracy of 0.01 mm in Adobe InDesign. The scale bars were automatically detected in PhotoScan. These scale bars were not used to scale or optimise the sparse point cloud in PhotoScan. PhotoScan estimated the length of coded scale bars based on the referencing information from the control target. The known length of coded scale bars was subtracted from the estimated length in PhotoScan to calculate the horizontal error.
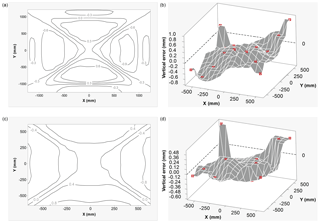
Figure 4(a) Horizontal error contour plot for a DEM generated using images acquired with the zoom lens. Contours represent horizontal (XY) error (in mm) in the DEM. (b) Vertical errors in DEM generated using images from a zoom lens. Red cubes on the surface in the plot show the location of wooden blocks (vertical checkpoints). (c) Horizontal error contour plot for a DEM generated using images from a prime lens. Contours represent horizontal (XY) error (in mm) in the DEM. (d) Vertical errors in DEM generated using images from a prime lens. Red cubes on the surface in the plot show the location of wooden blocks (vertical checkpoints).
To determine the vertical error of the DEMs, the wooden blocks were used as checkpoints (Fig. 5a). The DEMs and orthophotos were imported in ArcMap 10.4.1 (Fig. 5). The height of wooden blocks was measured in ArcMap using the Interpolate Line tool (3-D Analyst tool) by drawing a straight line across one of the sides of the wooden block and extending it to the ground surface. Height was estimated as the difference in mean elevation between the wooden block top surface and the surrounding ground surface on each side. The actual height of wooden blocks was measured by an electronic digital Vernier caliper. The Vernier caliper has an accuracy of 0.03 mm and measurement repeatability of 0.01 mm. We obtained five measurements along the same side of the wooden block measured in ArcMap. We take the mean of these five measurements to calculate the height of the wooden block. The measured height was subtracted from the estimated DEM height to calculate the vertical error. The distance between the centre of wooden blocks and the centroid of the triangle-coded target was determined in Adobe InDesign. We used horizontal and vertical checkpoint errors with their distance from the control target to visualise error propagation in DEMs with distance (Sect. 3.3.1).
3.3 Experiment results
3.3.1 Distribution of horizontal and vertical errors
Error propagation with distance was estimated, and the data are shown in Tables S1–S2 in the Supplement. The horizontal checkpoint errors for the 24 mm extended area and 35 mm masked DEMs (Table S1) were used to visualise errors over an area of 6.14 and 1.96 m2, respectively, as a contour plot (Fig. 4a and c). The data show that horizontal errors are almost symmetrical in the X and Y direction (Fig. 4a and c). We used vertical checkpoints for the 24 mm extended area and 35 mm masked DEMs (Table S2) to visualise vertical errors as the surface plot over an area of 1.96 m2 (Fig. 4b and d).
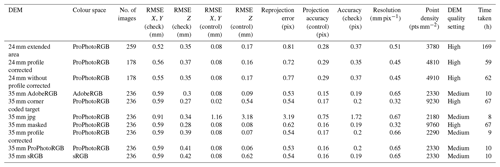
Table 4Summary experimental DEM data. Reprojection error is the root mean square reprojection error (RMSE) averaged over all tie points on all images. In some publications, reprojection error is also referred to as RMS image residual (James et al., 2017a). In the Agisoft manual, reprojection error is defined as the distance between the point on the image at which a reconstructed 3-D point can be projected and the original projection of that 3-D point detected on the photo (Agisoft, 2016). It is used to quantify how closely an estimate of a 3-D point recreates the point's original projection and as a basis for the 3-D point reconstruction procedure. Root mean square error (RMSE) XY is the root mean square error for X and Y coordinates for the control location or checkpoint. Root mean square error (RMSE) Z is the root mean square error for X and Y coordinates for the control location or checkpoint. Projection accuracy (in pixels) is the root mean square error for X, Y coordinates on an image for the control location or checkpoint averaged over all the images.
3.3.2 Role of image variables in DEM error
In this section, we present the findings from our DEM error evaluation experiment. The orthophoto and DEM of the error evaluation chart are shown in Fig. 5. The summary of 10 DEMs produced in the error evaluation experiment is presented in Table 4.
Below we also explore the role of several parameters in the accuracy of DEMs, and the detailed results are in Sect. S2. Horizontal and vertical checkpoint errors are used to compare these DEMs.
Although our experiment suggests that there is no statistically significant difference in the accuracy of DEMs generated from prime and zoom lenses, we find that the use of the prime lens will yield lower errors compared to a zoom lens for SfM photogrammetry. Our results also indicate that prior lens profile correction, placement of the control target relative to the subject of interest, and masking of images had no statistically significant effect on the accuracy of the DEM. However, we report that using Adobe RGB colour space and tiff file compression reduced error in DEMs (Table 4). We obtained better resolution and accuracy using the “high” dense point cloud quality setting in PhotoScan. Based on our findings, we use these parameters in our field survey.
3.3.3 Repeatability
We used two independent image surveys to test the repeatability of our DEM generation method. We obtained a very high intraclass correlation for horizontal (ICC =0.999) and vertical (ICC =0.911) checkpoint errors between two DEMs produced from two different set of images (24 mm extended area and 24 mm without the profile corrected). These DEMs were generated using identical image parameters and settings in PhotoScan. Therefore, this method of DEM generation can easily be repeated.
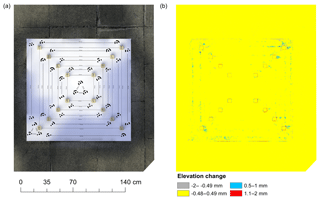
Additionally, we performed a DEM of difference (DoD) on these two DEMs (24 mm extended area – 24 mm without the profile corrected) of the same subject generated from two independent image surveys. The change in vertical elevation for the evaluation chart and the surrounding ground surface made up of concrete paving stones was calculated from the DoD (Fig. 7). The change in elevation (E) is within the limit of detection (LoD) and is interpreted as no change (±0.49 mm) and the change above the LoD value is interpreted as change (−0.49 > E > 0.49 mm). We find that the nearby textured concrete ground surface, which had a good number of key points during sparse point cloud generation, shows no change. The shadow areas within the sides of wooden blocks, the edges of wooden blocks, and the flat and textureless evaluation chart area that had poor image match, and thus low key points, show changes. Cullen et al. (2018) have demonstrated that the reliability of SfM to detect sub-millimetre changes depends on the texture and complexity of the rock surface. SfM is known to be less reliable in reconstructing non-textured, reflective, and flat objects or scenes (Agisoft, 2016). We notice that these changes are not related to the distance from the control target but areas with poor image matching due to homogeneous texture and shadows. The rock surface with non-homogeneous texture will produce better image matches and thus improve model quality and accuracy. The results show that with our control target approach it is possible to generate DEMs with sub-millimetre accuracy, but this will depend on the complexity and texture of the surface. Using our approach Cullen et al. (2018) successfully generated DEMs of simulated rock surface (∼100 cm2) with sub-millimetre accuracy.
We tested the approach on eight Moenkopi sandstone outcrops (intermediate axis m) at a field site near Meteor Crater, Arizona. Meteor Crater is located in a relatively low-relief, southern part of the Colorado Plateau near the town of Winslow in north-central Arizona (35∘1′ N, 111∘1′ W) (Shoemaker and Kieffer, 1979; Shoemaker, 1987). Moenkopi is very fine-grained reddish-brown sandstone (Kring, 2017). These outcrops have weathered to produce surfaces with different shapes, sizes, aspect, and slope and contain a range of weathering features such as pits, alveoli, flaking, crumbling, fractures, colouration, and lichen colonisation (see Sect. 6).
4.1 Data collection
We used the zoom lens set at 24 mm focal length (36 mm full frame camera equivalent). The focal length of 24 mm was chosen as it provided a greater field of view in which there was little space to move around to take images in the field (e.g. very steep slope). Camera aperture was set to f∕6.3. A smaller aperture allows less light to reach the camera sensor and gives a larger depth of field (Haukebø, 2015). An image with a larger depth of field is sharper, has a larger area in focus, and is recommended for photogrammetry work (Bedford, 2017). A higher shutter speed (1∕400) was chosen to compensate for camera shake due to e.g. the wind. ISO was kept at 100 to minimise noise in the images (Mosbrucker et al., 2017). White balance was kept at daylight mode. During photo acquisition, care was taken to ensure that the image was sharp and everything in the frame was in focus. Matrix metering mode was selected to provide the best exposure and equal brightness throughout the image. Images were taken in autofocus mode to maintain optimal image quality (sharpness). These settings were chosen based on the lighting and field conditions, and field testing demonstrated high image quality at these settings.
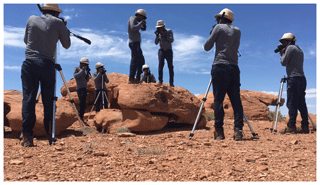
Figure 8Multi-exposure image showing the different spatial positions from which images were acquired. First, images were acquired from a distance of ∼2 m, and then close-up images were taken from a distance of < 1 m. The DEM and orthophoto of the imaged boulder are shown in Fig. 10g and h.
Several images were acquired from different vantage points: firstly, from all around the boulder surface (from a distance of ∼2 m), followed by additional close-range (from a distance of < ∼1 m) images (see Fig. 8). Images were acquired with at least 60 % lateral overlap. The theoretical minimum number of images required in SfM workflow is three (Favalli et al., 2012; Westoby et al., 2012). However, there is no maximum limit to the number of input images in the SfM workflow. The number of images required to reconstruct an accurate dense point cloud depends on the size and complexity (e.g. shape, surface texture, curvature, and slope) of the outcrop. It is always better to take more images as it will permit less sharp images to be discarded before processing.
For a detailed guideline for ideal image acquisition in the field we recommend the following: Smith et al., 2016; Bedford, 2017; Mosbrucker et al., 2017. For our data collection, a triangle-coded control target (Fig. 2) was placed on the ground parallel to the top surface of the boulder (Fig. 1). It is crucial for the control target to be flat and approximately parallel to the surface of interest as it defines the orientation of the surface of interest in the DEM. If the adjacent ground is not level, the control target can be placed on top of the target surface. We used four rulers of 30 cm and placed them around the outcrops (Fig. 1). These rulers were used as checkpoints to estimate horizontal errors in the DEMs. The images were acquired in quick succession in the field to ensure that there was a minimum change in the shadow lengths and lighting conditions. We acquired images during early morning and evening and tried to avoid shadows in the image. The images were shot in raw format. A potential limitation to this in the field is that they take up to twice as much storage space as JPEGs. For an area ∼10 m2, the placement of GCPs, rulers, and image acquisition took approximately 20 min. Images were processed as described in Sect. 2.4. DEM and orthophoto generation took 8–10 h on the “high” dense point cloud quality setting.
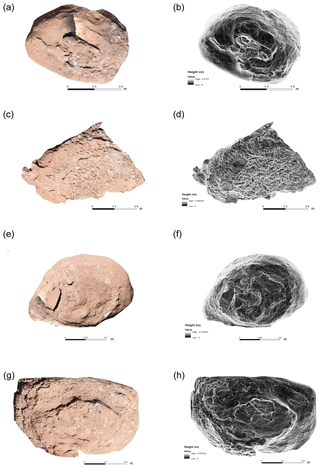
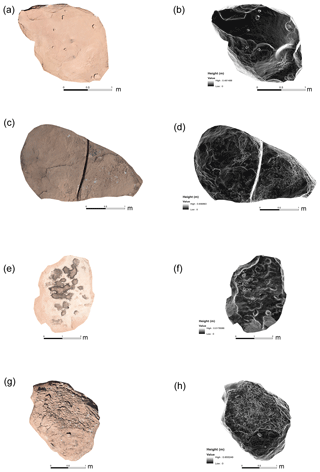
Figure 9Orthophotos and DEMs of Moenkopi outcrops. (a, b) Boulder S2-M2. (c, d) Boulder S2-M5. (e, f) Boulder S2-M4. (g, h) Boulder S2-M3.
4.2 Field results
DEMs of Moenkopi outcrops in the field
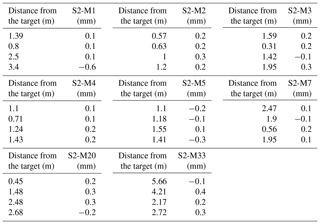
We generated eight DEMs and orthophotos of weathered Moenkopi outcrop surfaces (Figs. 9 and 10). We find that small weathering features, such as weathering pits (mm scale), are clearly resolved in our DEMs and orthophotos (Figs. 9 and 10). Details on DEM parameters have been summarised in Table 5. Horizontal errors for checkpoints were calculated by measuring the length of rulers from the orthophoto in PhotoScan and subtracting the known length of the ruler from it. The distance of the checkpoints from the control target was measured in PhotoScan. Horizontal error propagation with distance from the control target in DEMs is presented in Table 6. The resolution of DEMs ranges from 0.45 to 0.68 mm pixel−1. All the orthophotos have a resolution of 0.5 mm pixel−1. Horizontal and vertical RMSE of the control points is less than 0.5 mm except for vertical error for boulder S2-M2 (Table 5). Horizontal RMSEs estimated from checkpoints were also less than 0.5 mm (Table 5).
There are significant technical and logistical challenges that have resulted in geomorphologists not directly capturing topographic data on outcrops at the micro-scale (mm) in the field (Ehlmann et al., 2008). In order to generate high-resolution DEMs (∼ mm accuracy) of relatively small boulder and bedrock surfaces (areas < 10 m2), geographic coordinates cannot be used to register SfM dense point clouds. GPS surveying is used to collect topographic point data from surfaces, which can be used to register SfM dense point cloud to build a DEM. The surveying equipment can be expensive (e.g. dGPS, RTK-GPS, and total station). These survey instruments (except total station) have centimetre accuracy, which is inadequate for generating DEMs of sub-millimetre accuracy. The equipment can be challenging to transport in poorly accessible field terrains and can rely on satellite signals, which may not work in all locations. In addition, the equipment requires a relatively low-gradient, stable surface to set up. A relatively new approach known as “direct georeferencing” only requires the camera orientation parameters and GPS (Carbonneau and Dietrich, 2016). However, it can only provide centimetre accuracy, which is coarser than needed for small-scale weathering feature analysis.
A total station can be used to determine the coordinates of an unknown point relative to a known coordinate if a direct line of sight can be established between the two points. Coordinates obtained from a total station can be used to register SfM dense point clouds to generate high-resolution DEMs (mm accuracy). However, operating a total station in challenging field conditions has drawbacks similar to those of the dGPS survey equipment described above.
A number of previous studies have produced millimetre- to centimetre-resolution DEMs with millimetre to centimetre horizontal and vertical accuracy (Favalli et al., 2012; James and Robson, 2012; Bretar et al., 2013; Snapir et al., 2014; Haukebø, 2015; Leon et al., 2015; Micheletti et al., 2015a; Balaguer-Puig et al., 2017; Prosdocimi et al., 2017; Vinci et al., 2017; Smith and Warburton, 2018). These studies employed relatively complicated methods for georeferencing SfM dense point clouds to generate DEMs; for example, Favalli et al. (2012) and Micheletti et al. (2015a) used a laser scanner coordinate system, Snapir et al. (2014) used a laser range finder and optical level to find the relative 3-D positions of the GCPs, Bretar et al. (2013) employed a stereophotogrammetric method using a measuring tape for scaling the model, Haukebø (2015) measured the 3-D positions of each camera which are difficult to replicate in the field, James and Robson (2012) utilised the distance measured between multiple points on a turntable to scale the model of a sample of size 10 cm in the lab, Prosdocimi et al. (2017) used RTK-GPS to reference DEMs of soil plots (0.25 m2) in the field, Leon et al. (2015) used handheld GPS and several GCPs to scale the DEMs, and others (Balaguer-Puig et al., 2017; Vinci et al., 2017; Smith and Warburton, 2018) used a total station to estimate coordinates for GCPs.
The method presented by Snapir et al. (2014) is useful for making DEMs of a horizontal surface, but difficult to replicate on remote and treacherous field terrain (e.g. slope of mountain, crater, or canyon wall). This is due to the difficulty of placing several GCPs and determining their relative position with sub-millimetre accuracy in these terrains. Another problem of using many GCPs for smaller surfaces (< 5 m2) is that they may cover the area of interest and obscure the DEM of the target surface for further analysis. In this study, we have solved this problem by using a small triangle control target (area ∼75 cm2, Fig. 2) to georeference the dense point cloud used to generate DEMs with high accuracy. In our experience, we found that using three arbitrary points separated by a longer distance (a few metres) and using these points to find relative coordinates with each other can be difficult in the field due to the curvature and slope of rock surfaces (e.g. Heindel et al., 2018). In comparison, this study achieved sub-millimetre horizontal (< 0.5 mm) and vertical (< 1 mm) accuracy in a sub-millimetre-resolution DEM using a relatively simple georeferencing approach (Sect. 2.2) without any expensive and bulky survey equipment. The DEMs generated following our methodology have sufficient resolution for the measurement and quantification of millimetre- to centimetre-scale rock breakdown features.
5.1 High-resolution DEMs with low errors
Scaling errors in DEMs are important as they will affect any 2-D distance or 3-D volume measurements obtained from the DEMs (Carbonneau and Dietrich, 2016). Uncertainties in the DEMs are linked to the accuracy of the SfM model (James et al., 2017b), and knowledge of the source and magnitude of error helps in interpreting the results. The resolution and accuracy of SfM-based DEMs also relies on image quality. Low-quality images used in the SfM workflow reduces the resolution and accuracy of DEMs (Russell, 2016). It has been found that image acquisition geometry affects the output of SfM models (Carbonneau and Dietrich, 2016; Morgan et al., 2017). We acknowledge that controlling image acquisition geometry in the field will be difficult as the outcrop may not be accessible from all angles for image acquisition (e.g. a boulder on steeply sloping crater wall). The error in DEMs depends mainly on image quality and geometry and the method of georeferencing. Proper planning of image acquisition and high GCP accuracy can improve the accuracy of DEMs. Image matching is a limiting factor for point cloud density, camera calibration, error related to model scaling, and orientation in the SfM workflow and DEM accuracy (Mosbrucker et al., 2017). Image matching depends on image quality, lighting condition, surface texture, and the complexity of the subject. Image quality depends on good exposure (which depends on camera settings and lighting conditions), sharpness (i.e. the entire subject in the image in focus), noise in the image (higher ISO), and camera configuration (camera sensor and lens combination). Improvement in image matching reduces reprojection error, which ultimately propagates high accuracy in the dense point cloud and DEM. We have achieved a horizontal accuracy of < 0.5 mm for in situ generated DEMs of boulders and bedrock. To our knowledge, this accuracy has not been reported before in the literature for SfM-generated DEMs of rock outcrops.
5.1.1 DEM resolution
The resolution of the DEM depended on the resolution of the camera sensor used, the distance of image acquisition from the object, the quality of images, and the quality settings used for processing dense point clouds in PhotoScan. Since a 24 MP camera was used and images were acquired < 2 m from the boulder or bedrock this resulted in a DEM of resolution < 1 mm pixel−1. This resolution could be further increased if the “ultra-high” quality settings were used while processing dense point clouds in PhotoScan. Instead, the “high” quality setting was chosen during processing because it cut down the time required to process the DEM by 70 %–80 % and resulted in a smaller DEM file size, which can be easily handled in external analysis software (e.g. ArcGIS, Landserf).
In our experiment, we found that the “medium” dense point cloud quality setting does not dramatically deteriorate the horizontal and vertical accuracy of the DEM. The “medium” quality DEM is good enough for geomorphological studies if time and computing power are a constraint. Given optimal lighting and weather conditions, this SfM workflow can outperform laser scanning solutions for small surfaces (< 10 m2). However, the performance of SfM-based topographic data is affected by vegetation, shadows, and texture of the surface of interest (Micheletti et al., 2015b; Smith et al., 2016).
5.1.2 DEM errors
Our experiment was conducted under controlled conditions to validate sub-millimetre horizontal and vertical accuracy using our triangle control target georeferencing approach. We obtained horizontal accuracy of < 0.60 mm and vertical accuracy of < 0.45 mm in our experiment. The use of the prime lens at fixed focus will yield lower errors compared to a zoom lens for SfM photogrammetry, as suggested by Mosbrucker et al. (2017). Our experimental results suggest that the prime lens had slightly better vertical accuracy compared to the zoom lens when both lenses were used in autofocus mode. However, there is no statistically significant difference in the accuracy of DEMs generated from prime and zoom lenses used at autofocus. The slightly higher errors due to using a zoom lens in comparison with a prime lens is acceptable considering that it offers flexibility to choose a focal length (choice depends on the field of view) and its low cost. Most of the less expensive DSLR camera lenses do not come with a focusing scale. A lens set at autofocus is more suitable than those set at fixed focus for acquiring images of outcrops in challenging and steep terrains such as crater walls. A lens set at autofocus allows us to take sharper images from a very close distance (a few centimetres) as well as from farther away (a few metres) from the rock outcrop without introducing issues associated with the hyperfocal distance of the camera system. PhotoScan does an excellent job performing accurate autocalibration from the EXIF data of the images. We found that using AdobeRGB colour space and tiff image compression improves the DEM accuracy. The prior lens profile correction and the position of the control target had a negligible effect on the accuracy of the DEM. Masking of images in our experiment did not reduce the processing time for DEM generation. We find that changing the position of the control target with respect to the area of interest had an almost negligible effect on horizontal and vertical errors. For the field data, the horizontal checkpoint errors derived using rulers for Moenkopi outcrop DEMs in the field (Table 6) correspond to the results obtained in our experiment (Fig. 4a). In some cases, the horizontal error was found to be lower in the field for a certain distance from the control target (Table 6) compared to the results obtained in the experiment (Fig. 4a). This could be due to better image texture of weathered outcrops in the field compared to the reduced texture of our experiment subject (Fig. 3). This is evident in the reprojection error and projection accuracy (Tables 4 and 5). Some of the field DEMs have lower reprojection and projection error than the DEMs generated in the experiment. PhotoScan provides an option to improve the reprojection errors and thus the overall error in DEMs if errors are high due to poor image matching. This can be performed using the “gradual selection” tool in PhotoScan to filter and remove tie points with high reprojection errors after image matching during stage 2 (see Table 2) of processing the DEM (Agisoft, 2016).
5.2 Portable and affordable
For many projects, it is the budget, ease of use, and portability that require researchers to choose one technique over others. To date, relatively few studies have undertaken a cost–benefit, data acquisition rate, spatial coverage, operating condition, resolution, and accuracy analysis of the SfM with other topography data collection methods. Some researchers (e.g. Smith et al., 2016, and Wilkinson et al., 2016) have proposed that SfM photogrammetry ranks highly as it is the cheapest and has the highest resolution compared to other topographic data collection methods (e.g. total station, differential GPS (dGPS), terrestrial laser scanning (TLS), stereophotogrammetry). They also found that the speed of data acquisition and accuracy for the SfM method are comparable to TLS and stereophotogrammetry in a close-range scenario. Our work supports their findings but goes further and outlines an approach to produce sub-millimetre-resolution DEMs with sub-millimetre accuracy using ground-based, close-range SfM photogrammetry. The cost of the camera system (camera + zoom lens) used in this study is EUR 460. The triangle control target cost less than EUR 10. The educational licence for Agisoft PhotoScan was purchased for EUR 600 (a one-time investment). The total cost of field equipment and software is well within the budget of a small research project. In addition, the total weight of the camera system and control target used is less than 1 kg. Our approach can be used in any scenario for which high-resolution, accurate DEMs and orthophotos are required (e.g. scaled laboratory experiments or small-scale features in the field). In addition, we have demonstrated an SfM photogrammetry approach that is a relatively affordable, field-portable, fast, and efficient method without requiring any prior information on camera position, orientation, or internal camera parameters or the need for additional survey equipment.
5.3 Importance of microtopographic data in rock breakdown
We propose that the generation of micro-scale topographic data by the methods described here will be important for the advancement of rock breakdown studies. Specific rock breakdown processes can leave a unique morphological signature on rock surfaces (Bourke and Viles, 2007). More often, the synergies linking breakdown processes, mechanisms, and agents operate over a range of spatial and temporal scales (Viles, 2013) and can result in a palimpsest of features that represent a change in e.g. weathering conditions (Ehlmann et al., 2008). As such, the breakdown is non-linear, and processes can exploit inheritance features and overprint them over time. Micro-scale DEMs will permit us to move from a predominant specific geomorphometry approach to a general geomorphometry approach in which e.g. the relationships can be investigated. In addition, our approach will ease the cumbersome task of collecting morphometric data on individual weathering features in the field (e.g. Norwick and Dexter, 2002; Bruthans et al., 2018).
There are a number of areal surface roughness and geomorphometric parameters that can be applied to quantify rock breakdown (Leach, 2013; Lai et al., 2014; Davis et al., 2015; Du Preez, 2015; Trevisani and Rocca, 2015; Verma and Bourke, 2017). The ability to quantify surface change across an area rather than limited to specific points will aid interpretation of the causal links between controls and resultant landform development. This is particularly relevant for recent developments in monitoring microclimates (Mol et al., 2012; Coombes et al., 2013) of rock breakdown environments or in dynamic environments such as intertidal rock platforms (e.g. Cullen et al., 2018).
Our companion paper (Cullen et al., 2018) shows the potential application of our approach and provides a comparison between the traditional method of measuring erosion on rock shore platforms using a traversing micro-erosion meter (T/MEM) with structure-from-motion (SfM) photogrammetry. The results indicated that SfM photogrammetry offers several advantages over the T/MEM, allowing for the measurement of erosion at different scales on rock surfaces with low roughness while also providing a means for identifying different processes and styles of erosion. In addition, the work demonstrates that a high level of accuracy is possible in repeated measurements.
Diagnostic indices that reveal morphometric differences have been attempted at the landscape scale (e.g. Lyew-Ayee et al., 2007). The production of a high-resolution dataset for micro-scale weathering features offers an opportunity to test analysis routines such as semi-variogram, areal surface roughness, and fractal analysis to identify patterns of breakdown features at different scales (Inkpen et al., 2000; Viles, 2001; Fardin et al., 2004; Bourke et al., 2008; Leach, 2013). Areal surface fractal analysis of rock surfaces would help to elucidate the equifinality in the production of breakdown features and the issue of distinguishing fossil from current forming features (Viles, 2001; Fardin et al., 2004).
Our approach permits the comparative study of weathering features in different environments and the same environment over time. The ability to replicate our approach to assemble a time series of data (as outlined in a companion paper by Cullen et al., 2018) will facilitate the determination of weathering rates in the field at seasonal and annual scales. This will assist with issues in extrapolating data from the laboratory to the field where rates of weathering have traditionally been overestimated (Viles, 2001).
We have developed and tested a triangle-coded control target which is used to register SfM-generated dense point clouds to produce DEMs. We applied SfM photogrammetry on eight Moenkopi sandstone outcrops near Meteor Crater, Arizona. We found that the deployment of existing techniques to generate high-resolution data is not suitable for use in remote and poorly accessible field terrains (e.g. crater wall, canyon). In this study, we have demonstrated that this challenge can be overcome by SfM photogrammetry. A triangle-coded control target (GCPs) was specifically developed to (a) compute local coordinates and (b) to georeference the 3-D point cloud generated by SfM photogrammetry. This allowed for the generation of a sub-millimetre-resolution DEM with sub-millimetre accuracy. We validated sub-millimetre accuracy in DEMs with an experimental approach. Our study demonstrated that it is possible to use our method to generate DEMs of rock outcrops (< 10 m2) in the field to sub-millimetre horizontal and vertical accuracy. In optimal conditions (good lighting, weather, and vegetation free) local coordinate georeferencing workflow may outperform TLS for certain applications. Development of triangle-coded control target not only helped to generate a sub-millimetre-resolution DEM but also permitted the automation of the SfM batch process workflow, generating a DEM as the end product. We anticipate that the ease of production of a sub-millimetre-resolution DEM without the use of any bulky survey equipment has the potential to transform the existing approach to small-scale topographic data acquisition and offers a promising solution to data collection challenges in confined laboratory and difficult field conditions. The SfM workflow in this study provides an easy, quick, and relatively affordable method to generate 3-D topographic data for weathering features in hard to access terrains. The high-resolution DEMs of rocks surfaces in this study facilitate faster data collection and offer a potential solution to overcome many challenges in the field, including short- and long-term monitoring of micro-scale to mesoscale erosion in dynamic environments (Cullen et al., 2018).
All data are available upon request from the corresponding author at vermaan@tcd.ie.
The supplement related to this article is available online at: https://doi.org/10.5194/esurf-7-45-2019-supplement.
AKV developed the control target and designed the SfM experiment with input from MCB. AKV collected, processed, and analysed field and experimental data, and AKV wrote the paper with guidance, discussion, and editing from MCB.
The authors declare that they have no conflict of interest.
The authors would like to thank Niamh Cullen for her assistance in the field
and the review of an early version of this paper. The Prosser family
kindly allowed the authors to access the Bar T Bar Ranch property near Meteor
Crater in Arizona for collecting data on Moenkopi sandstone outcrops. Ankit K. Verma
was supported by the following: Trinity College Dublin Postgraduate Studentship, Faculty of
Engineering, Maths and Science, Trinity College Dublin, India (PhD)
Scholarship, the J.N. Tata Endowment Scholarship for the higher education of
Indians, and the J.N. Tata Gift Scholarship during the preparation of this
paper. The Barringer Family Fund for Meteorite Impact Research 2015,
British Society for Geomorphology Postgraduate Research Grant 2016,
International Association of Sedimentologists Postgraduate Research Grant
2016, and Trinity Trust Travel Grant 2016.
Edited by: Heather Viles
Reviewed by: Martin Schaefer and Philip Sapirstein
Aguilar, M., Aguilar, F., and Negreiros, J.: Off-the-shelf laser scanning and close-range digital photogrammetry for measuring agricultural soils microrelief, Biosyst. Eng., 103, 504–517, https://doi.org/10.1016/j.biosystemseng.2009.02.010, 2009.
Andrews, D. P., Bedford, J., and Bryan, P. G.: A COMPARISON OF LASER SCANNING AND STRUCTURE FROM MOTION AS APPLIED TO THE GREAT BARN AT HARMONDSWORTH, UK, Int. Arch. Photogramm. Remote Sens. Spatial Inf. Sci., XL-5/W2, 31–36, https://doi.org/10.5194/isprsarchives-XL-5-W2-31-2013, 2013.
Bakker, M. and Lane, S. N.: Archival photogrammetric analysis of river–floodplain systems using Structure from Motion (SfM) methods, Earth Surf. Proc. Land., 42, 1274–1286, https://doi.org/10.1002/esp.4085, 2016.
Balaguer-Puig, M., Marqués-Mateu, Á., Lerma, J. L., and Ibáñez-Asensio, S.: Estimation of small-scale soil erosion in laboratory experiments with Structure from Motion photogrammetry, Geomorphology, 295, 285–296, https://doi.org/10.1016/j.geomorph.2017.04.035, 2017.
Bedford, J.: Photogrammetric Applications for Cultural Heritage, Guidance for Good Practice, Historic England, 2017.
Bourke, M., Nicoli, J., Viles, H., and Holmlund, J.: The persistence of fluvial features on clasts: results of wind tunnel abrasion experiments, Lunar and Planetary Science Conference, 2007.
Bourke, M., Viles, H., Nicoli, J., Lyew-Ayee, P., Ghent, R., and Holmlund, J.: Innovative applications of laser scanning and rapid prototype printing to rock breakdown experiments, Earth Surf. Proc. Land., 33, 1614–1621, https://doi.org/10.1002/esp.1631, 2008.
Bourke, M. C. and Viles, H. A. (Eds.): A Photographic Atlas of Rock Breakdown Features in Geomorphic Environments, Planetary Science Institute, Tucson, p. 88, available at: https://tinyurl.com/y9l499yc (last access: 11 January 2019), 2007.
Bretar, F., Arab-Sedze, M., Champion, J., Pierrot-Deseilligny, M., Heggy, E., and Jacquemoud, S.: An advanced photogrammetric method to measure surface roughness: Application to volcanic terrains in the Piton de la Fournaise, Reunion Island, Remote Sens. Environ., 135, 1–11, https://doi.org/10.1016/j.rse.2013.03.026, 2013.
Brunier, G., Fleury, J., Anthony, E. J., Gardel, A., and Dussouillez, P.: Close-range airborne Structure-from-Motion Photogrammetry for high-resolution beach morphometric surveys: Examples from an embayed rotating beach, Geomorphology, 261, 76–88, https://doi.org/10.1016/j.geomorph.2016.02.025, 2016.
Bruthans, J., Filippi, M., Slavík, M., and Svobodová, E.: Origin of honeycombs: Testing the hydraulic and case hardening hypotheses, Geomorphology, 303, 68–83, https://doi.org/10.1016/j.geomorph.2017.11.013, 2018.
Bui, Q.-B., Morel, J.-C., Reddy, B. V., and Ghayad, W.: Durability of rammed earth walls exposed for 20 years to natural weathering, Build. Environ., 44, 912–919, https://doi.org/10.1016/j.buildenv.2008.07.001, 2009.
Carbonneau, P. E. and Dietrich, J. T.: Cost-effective non-metric photogrammetry from consumer-grade sUAS: implications for direct georeferencing of structure from motion photogrammetry, Earth Surf. Proc. Land., 42, 473–486, https://doi.org/10.1002/esp.4012, 2016.
Caroti, G., Martínez-Espejo Zaragoza, I., and Piemonte, A.: ACCURACY ASSESSMENT IN STRUCTURE FROM MOTION 3-D RECONSTRUCTION FROM UAV-BORN IMAGES: THE INFLUENCE OF THE DATA PROCESSING METHODS, Int. Arch. Photogramm. Remote Sens. Spatial Inf. Sci., XL-1/W4, 103–109, https://doi.org/10.5194/isprsarchives-XL-1-W4-103-2015, 2015.
Carr, B. B., Clarke, A. B., Arrowsmith, J. R., Vanderkluysen, L., and Dhanu, B. E.: The emplacement of the active lava flow at Sinabung Volcano, Sumatra, Indonesia, documented by structure-from-motion photogrammetry, J. Volcanol. Geoth. Res., in press, https://doi.org/10.1016/j.jvolgeores.2018.02.004, 2018.
Casella, E., Collin, A., Harris, D., Ferse, S., Bejarano, S., Parravicini, V., Hench, J. L., and Rovere, A.: Mapping coral reefs using consumer-grade drones and structure from motion photogrammetry techniques, Coral Reefs, 36, 269–275, https://doi.org/10.1007/s00338-016-1522-0, 2016.
Chan, T. O., Lichti, D. D., Belton, D., Klingseisen, B., and Helmholz, P.: Survey Accuracy Analysis of a Hand-held Mobile LiDAR Device for Cultural Heritage Documentation, Photogramm. Fernerkun., 2016, 153–165, https://doi.org/10.1127/pfg/2016/0294, 2016.
Chen, Y., Cao, P., Mao, D., Pu, C., and Fan, X.: Morphological analysis of sheared rock with water–rock interaction effect, Int. J. Rock Mech. Min. Sci., 70, 264–272, 10.1016/j.ijrmms.2014.05.002, 2014.
Clapuyt, F., Vanacker, V., and Van Oost, K.: Reproducibility of UAV-based earth topography reconstructions based on Structure-from-Motion algorithms, Geomorphology, 260, 4–15, https://doi.org/10.1016/j.geomorph.2015.05.011, 2016.
Coombes, M. A., Naylor, L. A., Viles, H. A., and Thompson, R. C. J. G.: Bioprotection and disturbance: seaweed, microclimatic stability and conditions for mechanical weathering in the intertidal zone, Geomorphology, 202, 4–14, https://doi.org/10.1016/j.geomorph.2012.09.014, 2013.
Cullen, N. D., Verma, A. K., and Bourke, M. C.: A comparison of structure from motion photogrammetry and the traversing micro-erosion meter for measuring erosion on shore platforms, Earth Surf. Dynam., 6, 1023–1039, https://doi.org/10.5194/esurf-6-1023-2018, 2018.
Davis, L. G., Bean, D. W., Nyers, A. J., and Brauner, D. R.: GLiMR: A GIS-based method for the geometric morphometric analysis of artifacts, Lithic Technology, 40, 199–217, https://doi.org/10.1179/2051618515Y.0000000007, 2015.
Dietrich, J.: Applications of structure-from-motion photogrammetry to fluvial geomorphology, PhD, Department of Geography, University of Oregon, 2015.
Dietrich, J. T.: Bathymetric Structure-from-Motion: extracting shallow stream bathymetry from multi-view stereo photogrammetry, Earth Surf. Proc. Land., 42, 355–364, https://doi.org/10.1002/esp.4060, 2016a.
Dietrich, J. T.: Riverscape mapping with helicopter-based Structure-from-Motion photogrammetry, Geomorphology, 252, 144–157, https://doi.org/10.1016/j.geomorph.2015.05.008, 2016b.
Du Preez, C.: A new arc–chord ratio (ACR) rugosity index for quantifying three-dimensional landscape structural complexity, Landscape Ecol., 30, 181–192, https://doi.org/10.1007/s10980-014-0118-8, 2015.
Ehlmann, B. L., Viles, H. A., and Bourke, M. C.: Quantitative morphologic analysis of boulder shape and surface texture to infer environmental history: A case study of rock breakdown at the Ephrata Fan, Channeled Scabland, Washington, J. Geophys. Res.-Earth, 113, F02012, https://doi.org/10.1029/2007JF000872, 2008.
Eltner, A., Kaiser, A., Castillo, C., Rock, G., Neugirg, F., and Abellán, A.: Image-based surface reconstruction in geomorphometry – merits, limits and developments, Earth Surf. Dynam., 4, 359–389, https://doi.org/10.5194/esurf-4-359-2016, 2016.
Fardin, N., Stephansson, O., and Jing, L.: The scale dependence of rock joint surface roughness, Int. J. Rock Mech. Min. Sci., 38, 659–669, https://doi.org/10.1016/S1365-1609(01)00028-4, 2001.
Fardin, N., Feng, Q., and Stephansson, O.: Application of a new in situ 3-D laser scanner to study the scale effect on the rock joint surface roughness, Int. J. Rock Mech. Min. Sci., 41, 329–335, 10.1016/S1365-1609(03)00111-4, 2004.
Favalli, M., Fornaciai, A., Isola, I., Tarquini, S., and Nannipieri, L.: Multiview 3-D reconstruction in geosciences, Comput. Geosci., 44, 168–176, https://doi.org/10.1016/j.cageo.2011.09.012, 2012.
Fonstad, M. A., Dietrich, J. T., Courville, B. C., Jensen, J. L., and Carbonneau, P. E.: Topographic structure from motion: a new development in photogrammetric measurement, Earth Surf. Proc. Land., 38, 421–430, https://doi.org/10.1002/esp.3366, 2013.
Ge, Y., Kulatilake, P. H., Tang, H., and Xiong, C.: Investigation of natural rock joint roughness, Comput. Geotech., 55, 290–305, https://doi.org/10.1016/j.compgeo.2013.09.015, 2014.
Goldstein, E. B., Oliver, A. R., Moore, L. J., and Jass, T.: Ground control point requirements for structure-from-motion derived topography in low-slope coastal environments, PeerJ PrePrints, https://doi.org/10.7287/peerj.preprints.1444v1, 2015.
Goudie, A. S. and Viles, H. A.: Weathering and the global carbon cycle: geomorphological perspectives, Earth-Sci. Rev., 113, 59–71, https://doi.org/10.1016/j.earscirev.2012.03.005, 2012.
Guidi, G., Gonizzi, S., and Micoli, L. L.: Image pre-processing for optimizing automated photogrammetry performances, ISPRS Ann. Photogramm. Remote Sens. Spatial Inf. Sci., II-5, 145–152, https://doi.org/10.5194/isprsannals-II-5-145-2014, 2014.
Harwin, S. and Lucieer, A.: Assessing the accuracy of georeferenced point clouds produced via multi-view stereopsis from unmanned aerial vehicle (UAV) imagery, Remote Sens., 4, 1573–1599, https://doi.org/10.3390/rs4061573, 2012.
Haukebø, A. R.: Modelling of Marine Icing with Close Range Photogrammetry, UiT The Arctic University of Norway, 2015.
Heindel, R. C., Chipman, J. W., Dietrich, J. T., and Virginia, R. A.: Quantifying rates of soil deflation with Structure-from-Motion photogrammetry in west Greenland, Arct. Antarct. Alp. Res., 50, SI00012, https://doi.org/10.1080/15230430.2017.1415852, 2018.
Immerzeel, W., Kraaijenbrink, P., and Andreassen, L.: Use of an Unmanned Aerial Vehicle to assess recent surface elevation change of Storbreen in Norway, The Cryosphere Discuss., https://doi.org/10.5194/tc-2016-292, 2017.
Inkpen, R., Collier, P., and Fontana, D. J. Z. F. G. S.: Close-range photogrammetric analysis of rock surfaces, Zeitschrift für Geomorphologie Supplementband, 67–81, 2000.
Jalandoni, A., Domingo, I., and Taçon, P. S. C.: Testing the value of low-cost structure-from-motion (SfM) photogrammetry for metric and visual analysis of rock art, Journal of Archaeological Science: Reports, 17, 605–616, https://doi.org/10.1016/j.jasrep.2017.12.020, 2018.
James, M. and Robson, S.: Straightforward reconstruction of 3-D surfaces and topography with a camera: Accuracy and geoscience application, J. Geophys. Res.-Earth, 117, F03017, https://doi.org/10.1029/2011JF002289, 2012.
James, M. R. and Robson, S.: Mitigating systematic error in topographic models derived from UAV and ground-based image networks, Earth Surf. Proc. Land., 39, 1413–1420, https://doi.org/10.1002/esp.3609, 2014.
James, M. R., Robson, S., d'Oleire-Oltmanns, S., and Niethammer, U.: Optimising UAV topographic surveys processed with structure-from-motion: Ground control quality, quantity and bundle adjustment, Geomorphology, 280, 51–66, https://doi.org/10.1016/j.geomorph.2016.11.021, 2017a.
James, M. R., Robson, S., and Smith, M.: 3-D uncertainty-based topographic change detection with structure-from-motion photogrammetry: precision maps for ground control and directly georeferenced surveys, Earth Surf. Proc. Land., 42, 1769–1788, https://doi.org/10.1002/esp.4125, 2017b.
Javernick, L., Brasington, J., and Caruso, B.: Modeling the topography of shallow braided rivers using Structure-from-Motion photogrammetry, Geomorphology, 213, 166–182, https://doi.org/10.1016/j.geomorph.2014.01.006, 2014.
Kim, D. H., Gratchev, I., and Balasubramaniam, A.: A photogrammetric approach for stability analysis of weathered rock slopes, Geotechnical and Geological Engineering, 33, 443–454, https://doi.org/10.1007/s10706-014-9830-z, 2015.
Kim, J.-R. and Muller, J.-P.: Multi-resolution topographic data extraction from Martian stereo imagery, Planet. Space Sci., 57, 2095–2112, https://doi.org/10.1016/j.pss.2009.09.024, 2009.
Ko, J. and Ho, Y.-S.: 3-D Point Cloud Generation Using Structure from Motion with Multiple View Images, The Korean Institute of Smart Media Fall Conference, 91–92, 2016.
Koppel, P.: Agisoft Photoscan: Point Cloud accuracy in close range configuration, Koppel Engineering, available at: http://www.koppel-engineering.de/core/docs/agisoft_photoscan.pdf (last access: 11 January 2019), 2016.
Korytkowski, P. and Olejnik-Krugly, A.: Precise capture of colors in cultural heritage digitization, Color Res. Appl., 42, 333–336, https://doi.org/10.1002/col.22092, 2017.
Kring, D. A.: Guidebook to the geology of barringer meteorite crater, arizona (aka Meteor Crater), Lunar and Planetary Institute, 2017.
Lai, P., Samson, C., and Bose, P.: Surface roughness of rock faces through the curvature of triangulated meshes, Comput. Geosci., 70, 229–237, https://doi.org/10.1016/j.cageo.2014.05.010, 2014.
Leach, R.: Characterisation of areal surface texture, Springer, 2013.
Leon, J. X., Roelfsema, C. M., Saunders, M. I., and Phinn, S. R.: Measuring coral reef terrain roughness using “Structure-from-Motion” close-range photogrammetry, Geomorphology, 242, 21–28, https://doi.org/10.1016/j.geomorph.2015.01.030, 2015.
Li, R., Hwangbo, J., Chen, Y., and Di, K.: Rigorous photogrammetric processing of HiRISE stereo imagery for Mars topographic mapping, IEEE T. Geosci. Remote, 49, 2558–2572, https://doi.org/10.1109/TGRS.2011.2107522, 2011.
Lyew-Ayee, P., Viles, H., Tucker, G. J. E. S. P., and Landforms: The use of GIS-based digital morphometric techniques in the study of cockpit karst, Earth Surf. Proc. Land., 32, 165-179, https://doi.org/10.1002/esp.1399, 2007.
Marteau, B., Vericat, D., Gibbins, C., Batalla, R. J., and Green, D. R.: Application of Structure-from-Motion photogrammetry to river restoration, Earth Surf. Proc. Land., 42, 503–515, https://doi.org/10.1002/esp.4086, 2016.
McCarroll, D.: A new instrument and techniques for the field measurement of rock surface roughness, Z. Geomorphol., 36, 69–79, 1992.
McCarroll, D. and Nesje, A.: Rock surface roughness as an indicator of degree of rock surface weathering, Earth Surf. Proc. Land., 21, 963–977, https://doi.org/10.1002/(SICI)1096-9837(199610)21:10<963::AID-ESP643>3.0.CO;2-J, 1996.
Medapati, R. S., Kreidl, O. P., MacLaughlin, M., Hudyma, N., and Harris, A.: Quantifying surface roughness of weathered rock-examples from granite and limestone, Geo-Congress 2013: Stability and Performance of Slopes and Embankments III, 120–128, 2013.
Mercer, J. J. and Westbrook, C. J.: Ultrahigh-resolution mapping of peatland microform using ground-based structure from motion with multiview stereo, J. Geophys. Res.-Biogeo., 121, 2901–2916, https://doi.org/10.1002/2016JG003478, 2016.
Micheletti, N., Chandler, J. H., and Lane, S. N.: Investigating the geomorphological potential of freely available and accessible Structure-from-Motion photogrammetry using a smartphone, Earth Surf. Proc. Land., 40, 473–486, https://doi.org/10.1002/esp.3648, 2015a.
Micheletti, N., Chandler, J. H., and Lane, S. N.: Structure from Motion (SfM) Photogrammetry, in: Geomorphological Techniques, edited by: Cook, S. J., Clarke, L. E., and Nield, J. M., British Society for Geomorphology, 2015b.
MŁynarczuk, M.: Description and classification of rock surfaces by means of laser profilometry and mathematical morphology, Int. J. Rock Mech. Min. Sci., 47, 138–149, https://doi.org/10.1016/j.ijrmms.2009.09.004, 2010.
Mol, L., Viles, H. A. J. E. S. P., and Landforms: The role of rock surface hardness and internal moisture in tafoni development in sandstone, Earth Surf. Proc. Land., 37, 301–314, https://doi.org/10.1002/esp.2252, 2012.
Morgan, J. A., Brogan, D. J., and Nelson, P. A.: Application of Structure-from-Motion photogrammetry in laboratory flumes, Geomorphology, 276, 125–143, https://doi.org/10.1016/j.geomorph.2016.10.021, 2017.
Mosbrucker, A. R., Major, J. J., Spicer, K. R., and Pitlick, J.: Camera system considerations for geomorphic applications of SfM photogrammetry, Earth Surf. Proc. Land., 42, 969–986, https://doi.org/10.1002/esp.4066, 2017.
Niethammer, U., James, M., Rothmund, S., Travelletti, J., and Joswig, M.: UAV-based remote sensing of the Super-Sauze landslide: Evaluation and results, Eng. Geol., 128, 2–11, https://doi.org/10.1016/j.enggeo.2011.03.012, 2012.
Nilosek, D., Walvoord, D. J., and Salvaggio, C.: Assessing geoaccuracy of structure from motion point clouds from long-range image collections, Opt. Eng., 53, 113112–113112, https://doi.org/10.1117/1.OE.53.11.113112, 2014.
Norwick, S. A. and Dexter, L. R.: Rates of development of tafoni in the Moenkopi and Kaibab formations in Meteor Crater and on the Colorado Plateau, northeastern Arizona, Earth Surf. Proc. Land., 27, 11–26, https://doi.org/10.1002/esp.276, 2002.
Ozyesil, O., Voroninski, V., Basri, R., and Singer, A.: A Survey on Structure from Motion, arXiv preprint arXiv:1701.08493, https://doi.org/10.1017/S096249291700006X, 2017.
Palmer, L. M., Franke, K. W., Abraham Martin, R., Sines, B. E., Rollins, K. M., and Hedengren, J. D.: Application and Accuracy of Structure from Motion Computer Vision Models with Full-Scale Geotechnical Field Tests, in: IFCEE 2015, 2432–2441, 2015.
Panagiotidis, D., Surový, P., and Kuželka, K.: Accuracy of Structure from Motion models in comparison with terrestrial laser scanner for the analysis of DBH and height influence on error behaviour, J. For. Sci., 62, 357–365, https://doi.org/10.17221/92/2015-JFS, 2016.
Pearson, E., Smith, M., Klaar, M., and Brown, L.: Can high resolution 3-D topographic surveys provide reliable grain size estimates in gravel bed rivers?, Geomorphology, 293, 143–155, https://doi.org/10.1016/j.geomorph.2017.05.015, 2017.
Piermattei, L., Carturan, L., de Blasi, F., Tarolli, P., Dalla Fontana, G., Vettore, A., and Pfeifer, N.: Suitability of ground-based SfM-MVS for monitoring glacial and periglacial processes, Earth Surf. Dynam., 4, 425–443, https://doi.org/10.5194/esurf-4-425-2016, 2016.
Prosdocimi, M., Burguet, M., Di Prima, S., Sofia, G., Terol, E., Comino, J. R., Cerdà, A., and Tarolli, P.: Rainfall simulation and Structure-from-Motion photogrammetry for the analysis of soil water erosion in Mediterranean vineyards, Sci. Total Environ., 574, 204–215, https://doi.org/10.1016/j.scitotenv.2016.09.036, 2017.
Remondino, F., Spera, M. G., Nocerino, E., Menna, F., and Nex, F.: State of the art in high density image matching, The Photogramm. Rec., 29, 144–166, https://doi.org/10.1111/phor.12063, 2014.
Rieke-Zapp, D. H. and Nearing, M. A.: Digital close range photogrammetry for measurement of soil erosion, Photogramm. Rec., 20, 69–87, https://doi.org/10.1111/j.1477-9730.2005.00305.x, 2005.
Russell, T. S.: Calculating the Uncertainty of a Structure from Motion (SfM) Model, Cadman Quarry, Monroe, Washington, University of Washington, 2016.
Sapirstein, P. and Murray, S.: Establishing Best Practices for Photogrammetric Recording During Archaeological Fieldwork, J. Field Archaeol., 42, 337–350, https://doi.org/10.1080/00934690.2017.1338513, 2017.
Sapirstein, P.: A high-precision photogrammetric recording system for small artifacts, J. Cult. Herit., 31, 33–45, https://doi.org/10.1016/j.culher.2017.10.011, 2018.
Sapirstein, P.: Accurate measurement with photogrammetry at large sites, J. Archaeol. Sci., 66, 137–145, 2016.
Schonberger, J. L. and Frahm, J.-M.: Structure-from-motion revisited, Proceedings of the IEEE Conference on Computer Vision and Pattern Recognition, 4104–4113, 2016.
Seitz, L., Haas, C., Noack, M., and Wieprecht, S.: From picture to porosity of river bed material using Structure-from-Motion with Multi-View-Stereo, Geomorphology, 306, 80–89, https://doi.org/10.1016/j.geomorph.2018.01.014, 2018.
Shoemaker, E. M.: Meteor Crater, Arizona, Geological Society of America, Centennial Field Guide, 2, 399–404, 1987.
Shoemaker, E. M. and Kieffer, S. W.: Guidebook to the geology of Meteor Crater, Arizona, 17, Center for Meteorite Studies, Arizona State University, 1979.
Smith, M. and Warburton, J.: Microtopography of bare peat: a conceptual model and objective classification from high-resolution topographic survey data, Earth Surf. Proc. Land., 43, 1557–1574, https://doi.org/10.1002/esp.4336, 2018.
Smith, M., Carrivick, J., and Quincey, D.: Structure from motion photogrammetry in physical geography, Prog. Phys. Geogr., 40, 247–275, https://doi.org/10.1177/0309133315615805, 2016.
Smith, M. W. and Vericat, D.: From experimental plots to experimental landscapes: topography, erosion and deposition in sub-humid badlands from Structure-from-Motion photogrammetry, Earth Surf. Proc. Land., 40, 1656–1671, https://doi.org/10.1002/esp.3747, 2015.
Snapir, B., Hobbs, S., and Waine, T.: Roughness measurements over an agricultural soil surface with Structure from Motion, ISPRS J. Photogramm., 96, 210–223, https://doi.org/10.1016/j.isprsjprs.2014.07.010, 2014.
Sturzenegger, M. and Stead, D.: Close-range terrestrial digital photogrammetry and terrestrial laser scanning for discontinuity characterization on rock cuts, Eng. Geol., 106, 163–182, https://doi.org/10.1016/j.enggeo.2009.03.004, 2009.
Süsstrunk, S., Buckley, R., and Swen, S.: Standard RGB color spaces, Color and Imaging Conference, 127–134, 1999.
Taconet, O. and Ciarletti, V.: Estimating soil roughness indices on a ridge-and-furrow surface using stereo photogrammetry, Soil Till. Res., 93, 64–76, https://doi.org/10.1016/j.still.2006.03.018, 2007.
Thoeni, K., Giacomini, A., Murtagh, R., and Kniest, E.: A comparison of multi-view 3-D reconstruction of a rock wall using several cameras and a laser scanner, Int. Arch. Photogramm. Remote Sens. Spatial Inf. Sci., XL-5, 573–580, https://doi.org/10.5194/isprsarchives-XL-5-573-2014, 2014.
Trevisani, S. and Rocca, M.: MAD: robust image texture analysis for applications in high resolution geomorphometry, Comput. Geosci., 81, 78–92, https://doi.org/10.1016/j.cageo.2015.04.003, 2015.
Verma, A. K. and Bourke, M. C.: An in-situ Investigation of the Effect of Impact Processes on Rock Breakdown Using sub-mm Resolution DEMs at Meteor Crater, Arizona 9th International Conference on Geomorphology, India, 6–11 November 2017.
Viles, H.: Simulating weathering of basalt on Mars and Earth by thermal cycling, Geophys. Res. Lett., 37, L18201, https://doi.org/10.1029/2010GL043522, 2010.
Viles, H., Messenzehl, K., Mayaud, J., Coombes, M., and Bourke, M.: Stress histories control rock-breakdown trajectories in arid environments, Geology, 46, 419–422, https://doi.org/10.1130/G39637.1, 2018.
Viles, H. A.: Scale issues in weathering studies, Geomorphology, 41, 63–72, https://doi.org/10.1016/S0169-555X(01)00104-0, 2001.
Viles, H. A.: Microclimate and weathering in the central Namib Desert, Namibia, Geomorphology, 67, 189–209, https://doi.org/10.1016/j.geomorph.2004.04.006, 2005.
Viles, H. A.: Synergistic Weathering Processes in: Treatise on Geomorphology, edited by: Shroder, J. F., Academic Press, San Diego, 12–26, 2013.
Vinci, A., Todisco, F., Brigante, R., Mannocchi, F., and Radicioni, F.: A smartphone camera for the structure from motion reconstruction for measuring soil surface variations and soil loss due to erosion, Hydrol. Res., 48, 673–685, https://doi.org/10.2166/nh.2017.075, 2017.
Warke, P.: Complex weathering in drylands: implications of “stress” history for rock debris breakdown and sediment release, Geomorphology, 85, 30–48, https://doi.org/10.1016/j.geomorph.2006.03.038, 2007.
Westoby, M., Brasington, J., Glasser, N., Hambrey, M., and Reynolds, J.: “Structure-from-Motion” photogrammetry: A low-cost, effective tool for geoscience applications, Geomorphology, 179, 300–314, https://doi.org/10.1016/j.geomorph.2012.08.021, 2012.
White, K., Bryant, R., and Drake, N.: Techniques for measuring rock weathering: application to a dated fan segment sequence in southern Tunisia, Earth Surf. Proc. Land., 23, 1031–1043, https://doi.org/10.1002/(SICI)1096-9837(1998110)23:11<1031::AID-ESP919>3.0.CO;2-G, 1998.
Wilkinson, M., Jones, R., Woods, C., Gilment, S., McCaffrey, K., Kokkalas, S., and Long, J.: A comparison of terrestrial laser scanning and structure-from-motion photogrammetry as methods for digital outcrop acquisition, Geosphere, 12, 1865–1880, https://doi.org/10.1130/GES01342.1, 2016.
Zhu, S., Shen, T., Zhou, L., Zhang, R., Fang, T., and Quan, L.: Accurate, Scalable and Parallel Structure from Motion, arXiv preprint arXiv:1702.08601, 2017.


