the Creative Commons Attribution 4.0 License.
the Creative Commons Attribution 4.0 License.
Storm-induced sediment supply to coastal dunes on sand flats
Filipe Galiforni-Silva
Kathelijne M. Wijnberg
Suzanne J. M. H. Hulscher
Growth of coastal dunes requires a marine supply of sediment. Processes that control the sediment transfer between the subtidal and the supratidal zone are not fully understood, especially in sand flats close to inlets. It is hypothesised that storm surge events induce sediment deposition on sand flats, providing fresh material for aeolian transport and dune growth. The objective of this study is to identify which processes cause deposition on the sand flat during storm surge conditions and discuss the relationship between the supratidal deposition and sediment supply to the dunes. We use the island of Texel (NL) as a case study, of which multiannual topographic and hydrographic datasets are available. Additionally, we use the numerical model XBeach to simulate the most frequent storm surge events for the area. Results show that supratidal shore-parallel deposition of sand occurs in both the numerical model and the topographic data. The amount of sand deposited is directly proportional to surge level and can account for more than a quarter of the volume deposited at the dunes yearly. Furthermore, storm surges are also capable of remobilising the top layer of sediment of the sand flat, making fresh sediment available for aeolian transport. Therefore, in a sand flat setting, storm surges have the potential of reworking significant amounts of sand for aeolian transport in periods after the storm and as such can also play a constructive role in coastal dune development.
- Article
(9477 KB) - Full-text XML
- BibTeX
- EndNote
Coastal dunes are important natural flood defence features. They grow at the interface between land and sea by the interaction of biological processes, physical processes and geological conditioners (Hesp, 1983, 2002; Hesp and Walker, 2013; Sherman and Bauer, 1993; Bauer and Davidson-Arnott, 2002; Delgado-Fernandez and Davidson-Arnott, 2011; van Puijenbroek et al., 2017). Key requirements for the development of coastal dunes are the availability of sediment, space for dune growth, suitable climate conditions (e.g. wind, waves, vegetation, and rain) and time for its development (Hesp, 1983, 2002; Bochev-van der Burgh et al., 2009; Bauer et al., 2009; Bochev-van der Burgh et al., 2011; Keijsers et al., 2015; van Puijenbroek et al., 2017; Galiforni-Silva et al., 2018, 2019).
The amount of available sediment controls aspects like dune type and morphology, vegetation growth, and growth rate (Eastwood et al., 2011; Hesp, 2002; Short and Hesp, 1982; Houser, 2009). The sea is the primary source of sediment for coastal dunes. Wave-driven currents, oscillatory components of the incident wave motions and effects of infra-gravity waves on currents are responsible for transporting sediment onshore, leading to a continuous supply of sediment from the subtidal (i.e. zone that stays below sea level) to the intertidal zone and, consequently, subaerial zone (i.e. also known as supratidal zone, refers to the zone above the high tide level) (Aagaard, 2014). Aagaard et al. (2004) linked the occurrence of onshore bar migration and its subsequent welding to the coast with sediment supply towards the dunes. Anthony et al. (2006) showed that, for a tide-dominated beach on the coast of France, annual dune accretion depends on bar welding phenomena related to storm processes, which could account for 48 % of the overall dune change. Anthony (2013) showed that for the southern North Sea coastal system (i.e. French and Belgian coast), the highest rate of foredune accretion is associated with areas where underwater sandbanks have migrated onshore in the past century, thus leading to an increased supply condition for the dunes.
Most studies on beach–dune systems and sediment transfer between subtidal and supratidal zones only consider locations away from inlets (Anthony et al., 2006; Anthony, 2013; Aagaard et al., 2004; Reichmüth and Anthony, 2007). Inlet-driven processes such as shoal attachment and channel migration can drive changes in the adjacent coastlines (Fitzgerald et al., 1984; Fenster and Dolan, 1996; Robin et al., 2009; Elias and Van Der Spek, 2006), which in turn can influence subtidal/subaerial sediment exchange and coastal dune behaviour (Ruessink and Jeuken, 2002; Aagaard et al., 2004; Anthony et al., 2006; Cohn et al., 2017). For barrier islands in the Dutch Wadden Sea region, beaches close to inlets commonly developed as sand flats due to long-term morphodynamics of its ebb-tidal delta systems, as illustrated by De Hors sand flat at Texel island (the Netherlands) (van Heteren et al., 2006; Elias and Van Der Spek, 2006). Those sand flats are large (scale of kilometres) and present great potential for dune growth due to their large beach width, wind velocities, and climate (Bauer et al., 2009; Houser and Ellis, 2013). A recent analysis of annual topographic data (Wijnberg et al., 2017) suggested that supratidal storm deposits may form a source for sand supply towards the dunes. However, it is unclear during which conditions supratidal deposition occurs and whether the amount deposited can be considered significant for dune growth and development.
Therefore, the objective of this study is to identify processes and storm conditions that cause deposition on the sand flat during storm surge flooding and to discuss the relationship between the supratidal deposition and sand supply to the dunes. We use a site in the Netherlands (Texel island) as a case study, for which we analysed multiannual topographic datasets together with a field survey and the application of a numerical model to investigate bed level changes at the sand flat during storm surge flooding events.
The paper outline is as follows: Sect. 2 describes the study area characteristics; Sect. 3 presents the available data, its treatment and usage and explains the numerical model, its concepts, initial conditions, and assumptions. Section 4 presents the results starting with multiannual topographic data analysis, the field survey and finally results from the numerical simulations. The paper closes with a discussion section (Sect. 5) and conclusion (Sect. 6).
On the southern side of Texel island (the Netherlands), bordering the Marsdiep Inlet, long-term ebb-tidal dynamics built a sand flat (named De Hors) where dunes have been emerging over the past 20 years, at least (Fig. 1). The flat has an approximate area of 3 km2. According to Galiforni-Silva et al. (2018), around 1.2×10⁶ m3 of sand has been deposited in the dunes between 1997 and 2015. Furthermore, the dune area at De Hors can be separated into three distinct zones: a western part, more exposed to wave action; a central zone; and an eastern part, which receives less wave action. According to Galiforni-Silva et al. (2018), the western zone accounted for 60 % of the total dune volume increase, which emerged mostly as a linear dune ridge, similar to the foredunes found along the Dutch coast away from inlets. The central dune zone accounted for about 30 % of the total dune volume increase and emerged as coppice-like dunes. The eastern zone presented the lowest dune volume increase and evolved as a linear dune ridge.
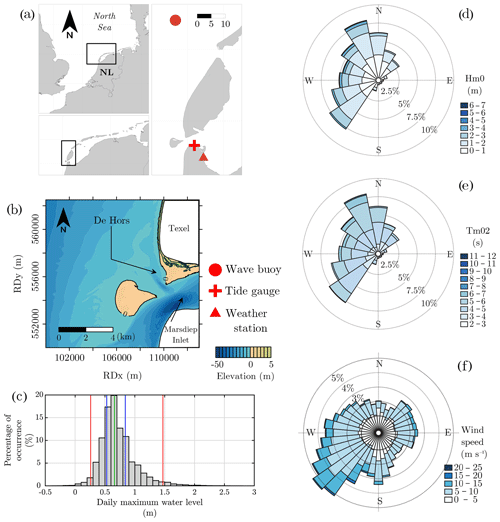
Figure 1Study area of Texel. (a) Geographic location. Red symbols represent the locations of the wave buoy (circle), weather station (triangle,) and tide gauge (cross) used in this paper. (b) Topographic setting highlighting the sand flat used as a case study. (c) Histogram of daily maximum water levels, where blue lines represent the 25th and 75th percentiles, the red lines the 2.5 and 97.5th percentiles. Overall characteristics of the area for wave and wind climate are shown by directional histograms for (d) , (e) , and (f) hourly averaged wind speed
The Marsdiep Inlet is classified as a mixed-energy, wave-dominated inlet, with a gorge width of 3 km and a channel depth up to 50 m (Elias and Van Der Spek, 2017). The inlet has an asymmetric ebb-tidal delta that is mostly conditioned by side effects of a past large-scale engineering project (i.e. construction of the Afsluitdijk) (Elias and Van Der Spek, 2006; Elias and Van Der Spek, 2017). The sand flat is exposed to wind most of the time and is flooded only during storm surge events. The main wind direction is from the southwest, whereas waves predominantly come from southwest and northwest directions (Fig. 1). The mean tidal range is 1.41 m, with a mean spring high tide level (MSHTL) of 0.66 m + NAP (i.e. Normaal Amsterdams Peil – in Dutch – the Dutch reference level, which is close to the mean sea level) (Rijkswaterstaat, 2013).
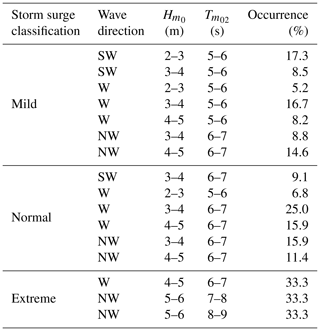
In the present paper, a storm surge is defined by its maximum water level following the classification used by the Dutch Ministry of Infrastructure and Water Management (Rijkswaterstaat). Storm surges with maximum water levels between the 75th quantile and 1.9 m + NAP are classified as mild, whereas maximum water levels between 1.9 and 2.6 m + NAP are classified as normal storms surges, and above 2.6 m + NAP they are classified as extreme storm surges. To determine the local storm climate, we used a 29-year long time series of hourly water levels collected at the Den Helder tide gauge in the channel margin together with hourly wave data from a wave buoy for the same period (Fig. 1). Daily maximum water levels were extracted from the time series and used as a proxy for storms. Results show that 73.31 % of the daily maximum water levels lie below the 75th quantile level (0.86 m + NAP), whereas 26.15 % can be considered mild storms. From the mild storms, 22.26 % lies between MSHTL and the 97.5th percentile (1.32 m + NAP), with only 3.88 % representing water levels above the 97.5th percentile. Only 0.54 % is classified as storms (0.5 %) or extreme storms (0.04 %).
Wave conditions related to storms are separately classified for each storm surge class (i.e. mild, storm, and extreme storm) in Table 1. For mild storms, waves come from three directions (SW, W, and NW), with relatively similar occurrence (25.8 %, 30.1 %, and 23.4 %). For storms and extreme storms, waves tend to come from more northerly directions.
To achieve our objectives, we follow two main approaches: numerical modelling and analysis of observational data. The analysis of multiannual topographic surveys focuses on the occurrence of deposition above the MSHTL, as well as the overall erosion/deposition patterns in the flat. This analysis is complemented by field observations collected after a storm surge event to qualitatively identify the effects of a single storm on the sand flat. The numerical modelling is used to analyse in depth which processes control the deposition on the sand flat during storm surge flooding and identify which storm conditions will lead to sand deposition.
3.1 Data and field campaign
To analyse beach–dune behaviour over the sand flat area, we used annual lidar data from 1997 up to 2018 provided by the Dutch Ministry of Infrastructure and Water Management (Rijkswaterstaat). Survey dates vary over the years, with a tendency of flights being done after the most energetic period (Fig. 2). The data are available at a horizontal resolution of 5 m up to 2013, when a finer horizontal resolution of 2 m became available. The vertical accuracy is within 0.08 m. For consistency, data from 2013 onward were interpolated in a 5 m horizontal resolution.

Figure 2Daily maximum water level time series, including indications of the periods when the topographic surveys were executed. Dashed red lines represent the exact date used in the analysis, whereas the pink-shadowed region represent the potential period during which the measurements took place (only for surveys where the exact date were not available).
From the lidar data, we calculated annual changes in elevation and volume of the dune field and the sand flat. The dune area has been defined by the 3 m contour, whereas the sand flat area has been defined as the area between 1.5 m and the MSHTL. We limit the extent of the sand flat up to 1.5 m since above such elevation there are signals of aeolian deposition and incipient dune formation, which would add an error to the hydrodynamic deposition estimates. The dunefoot level along the Dutch coast is widely assumed to be approximately 3 m + NAP (de Winter et al., 2015; Ruessink and Jeuken, 2002; Quartel et al., 2008; Keijsers et al., 2014; de Vries et al., 2012; Galiforni-Silva et al., 2019; Duarte-Campos et al., 2018; Donker et al., 2018). The value is based on past measurements in which dunefoot was defined as a visible break in slope between beach and dune and was roughly 3 m + NAP (de Vries et al., 2012). Furthermore, we use variance maps to analyse the stability of the sand flat using the entire topographic dataset. Variance maps show the elevation variance at each grid node, which highlights areas where elevation changes occurred in a larger magnitude. Furthermore, elevation difference maps have been used to define erosion and accretion trends between subsequent surveys. Difference maps are calculated by subtracting the elevation survey of the previous year from the next year, such that positive values relate to accretion, and negative values relate to erosion. Thus, areas with low growth trend and high variance values suggest that even though no accretion/erosive trend occurs, the elevation varies considerably in time. Moreover, to determine whether a location presented more accretive or erosive events in time, we built maps of occurrence of accretion and erosion events (i.e. number of times which a particular location had experienced an annual bed level change larger than ±0.16 m). Thus, areas with increased frequency of accretive/erosive events are highlighted. Therefore, the trend map will reveal the overall growth trend and spatial variations therein; the variance map will show the variability in bed level, without consideration of a temporal structure, and the occurrence map will show areas where more accretive or erosive events occurred, regardless of their magnitude and trends over time.
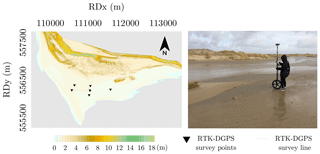
To analyse the effects of a storm surge on the surface layer of sediment at the sand flat, we executed a field survey before and after an event that flooded the sand flat of De Hors on January 2017. Elevation data were acquired at six locations and along a transect across the sand flat to check whether changes in elevation occurred and, if so, on which order of magnitude (Fig. 3). Elevation data were acquired using a real-time kinematic and differential GPS (RTK-DGPS) system.
3.2 The XBeach model
Considering that the topography is available on an annual basis (therefore, no data on the impacts of a single storm surge event are available), we choose to simulate the accretion/erosion patterns onto the sand flat that were induced by the most frequent storm surge conditions. The main goal is to identify, in an event scale, during which storm conditions deposition onto the sand flat occurs and understand the leading hydrodynamic processes underlying such a deposition.
3.2.1 Model structure
The XBeach model (Roelvink et al., 2009) is a process-based model developed to simulate hydrodynamic and morphodynamic processes on sandy coasts. It has been developed to work on a timescale of storms and for coastal stretches on the order of kilometres in length. The model solves the 2D horizontal shallow water equations, including capabilities of time-varying wave action balance, roller energy balance, advection-diffusion equation, sediment transport and bottom change (Elsayed and Oumeraci, 2017; Roelvink et al., 2009; Deltares, 2018). The model includes the hydrodynamic processes of short-wave transformation (refraction, shoaling, and breaking), long-wave transformation, wave-induced setup, and unsteady currents, as well as overwash and inundation. The morphodynamic processes include bed load and suspended sediment transport, dune face avalanching, bed update, and dune breaching (Deltares, 2018). The main difference in the XBeach model compared to other process-based models for coastal areas is the capability of including the effects of infragravity waves through solving long-wave motions created by time-dependent, cross-shore wave height gradients (Roelvink et al., 2009). For the present study, we run the model in surfbeat mode, where the short wave variations on the wave group scale, and the long waves associated with them are resolved (Deltares, 2018). The model has been extensively validated and applied in a range of coastal settings, including overwash and storm surge flooding (de Vries, 2009; Roelvink et al., 2009; McCall et al., 2010; Elsayed and Oumeraci, 2017; Vet, 2014; Nederhoff, 2014; Engelstad et al., 2017). Detailed information on model formulation and validation can be found in Roelvink et al. (2009) and Deltares (2018).
3.2.2 Scenarios
Based on the local storm climatology (Table 1), we selected 12 actual storm surge events that occurred between 1990 and 2017 to represent the most frequently occurring storm conditions in each of the three storm surge categories. Choices have been made to ensure that we simulated at least one storm surge from each wave direction represented. For the domain, we used lidar and bathymetric data available for the year 2009, the same year of the storm chosen for validation. Thus, only hydrodynamic boundary conditions are different for each scenario. Bathymetric data are available on a 20 m×20 m grid, with vertical accuracy between 0.11 and 0.4 m, whereas topographic lidar data are available on a 5 m×5 m grid, with vertical accuracy within 0.08 m. For each storm, its wave characteristics have been gathered from data available from a nearby wave buoy (Fig. 1). Simulated scenarios are shown in Table 2.
Table 2Characteristics of the simulated scenarios. Deposited volume refers to the amount of sand deposited onto the sand flat according to the simulation results.
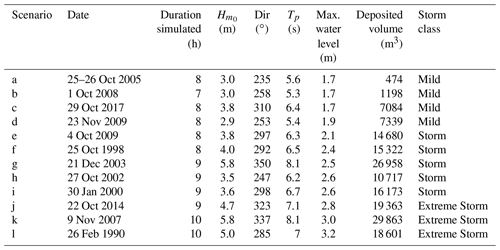
From the simulations, we relate bed level change on the flat with local hydrodynamic characteristics (i.e. Hrms, the root-mean-square wave height, and gradients u, zonal component of flow vector, and v, meridional component of flow vector), in order to identify which driving force would explain most of the bed level change. u and v gradients refer to the zonal and meridional components of the local depth-averaged flow velocity. We do this by analysing how the morphology and hydrodynamics evolve in time, at a location where deposition occurs and following the time series of bed level change and hydrodynamic processes. Furthermore, to study whether storm strength influences the amount of deposited volume onto the sand flat, we correlate final sand volumes deposited with imposed storm characteristics (i.e. maximum water level imposed at the boundary, , wave direction, and Tp). Violin plots are used to identify on which elevation the volume changes occurred. Violin plots are essentially boxplots with the addition of a rotated probability density plot on each side.
Regarding the validation of the numerical model, only one hydrodynamic dataset was available to assess model performance for the present study. The ferry that links Texel island with the mainland crosses the Marsdiep Inlet every half an hour from 06:00 up to 21:30 LT with an acoustic Doppler current profiler (ADCP) mounted, performing detailed flow measurements. The data acquired and treated by the Royal Netherlands Institute for Sea Research (NIOZ) have been made available for the year of 2009 by Duran-Matute et al. (2014). One limitation of the dataset is that the ferry does not sail at night. Furthermore, the ferry also does not sail when the water level exceeds 2 m above NAP. That would introduce gaps and limit the number of possible storms for validation based only on periods of mild storms surges. Moreover, it is important to note that this dataset only gives information related to the inner side of the system (i.e. tide-dominated), thus being not optimal for validation given our interest being on the sand flat, where wave-driven processes are expected to play a significant role. Thus, given the lack of hydrodynamic data during storm surges for the area and considering that the XBeach model has been validated in a broad range of applications, we use default settings for the present study.
4.1 Supratidal development
Figure 4 presents elevation difference maps over consecutive years. Maps show that deposition in the supratidal zone occur over at least 10 different years, usually in a shoreline-parallel shape. For some years, as between 1998–1999 (b) and 2003–2004 (e), the deposition extended from the north to the south of the flat and occurred at least 100 m landward of the mean spring high tide level (i.e. higher elevations). For other periods, such as (j), (l), and (r), the deposition occurred much closer to the MSHTL, although also oriented from north to south. For others, such as (m), the deposition occurred only in the southern tip of the flat. Erosion patterns exceeding 0.16 m occurred only over a few years and mostly at locations close to the MSHTL. When looking at the map of accretion/erosion occurrence (balance of occurrence of accretion and erosive trends between years – Fig. 5b), we can also see that a zone with more accretive than erosive years occurs in a well-formed, shore-parallel shape above MSHTL. Thus, we conclude that there is a zone of sediment deposition in the west margin of the flat above MSHTL.
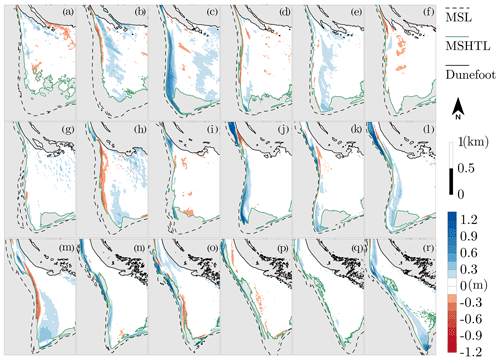
Figure 4Difference maps for the periods between 1997 and 2017 focusing on the supratidal area. Letters refer to the specific years from which the subplots were calculated, as follows: (a) 1998–1997, (b) 1999–1998, (c) 2001–1999, (d) 2003–2001, (e) 2004–2003, (f) 2005–2004, (g) 2006–2005, (h) 2007–2006, (i) 2008–2007, (j) 2009–2008, (k) 2010–2009, (l) 2011–2010, (m) 2012–2011, (n) 2013–2012, (o) 2014–2013, (p) 2015–2014, (q) 2016–2015, and (r) 2017–2016. Most plots show a 1-year difference, with exception of (c) and (d), which represent the difference between 1999–2001 and 2001–2003, respectively, due to the absence of surveys in the years 2000 and 2002.

Figure 5(a) Average annual elevation change based on lidar data from 1997 up to 2017. Dashed lines show the average position of the MSHTL. (b) Net number of years where accretion/erosion occurrences from the difference maps were greater than 0.16 m. Negative values mean that the location had more erosive years than accretive, whereas positive values mean that the location had more accretive years than erosive. (c) Variance in the elevation.
In terms of volume, the supratidal depositional zones account for values on the order of 104 m3, with average values of 2.5×10⁴ () m3 over the surveyed period, and maximum numbers reaching values 1 order of magnitude higher (Fig. 6). The deposited volume over the sand flat shows no correlation with either measured maximum water levels or median values of storm surge levels between surveys.
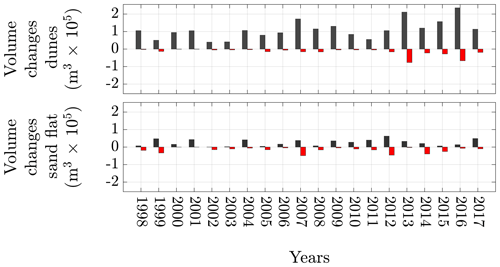
Figure 6Annual volume changes for the sand flat and dune area considering only cells where elevation change was greater than 0.16 m (approximately the maximum possible error based on the allowed error for each lidar survey. Black boxes represent accretion, whereas red boxes represent erosion).
Even though there is a deposition zone, the flat as a whole does not present any long-term average deviation between MSHTL and the dunefoot in terms of elevation. Figure 5a shows the average year to year elevation change. In the upper part, accretion trends relate to dune growth, with elevation change up to 0.5 m yr−1. Also, regions of accretion and erosion on levels below mean spring high tide level (MSHTL – dashed lines) range between values of −0.25 and 0.25 m, approximately. Average annual elevation change in the central part of the flat is minimal, with values within the measurement error. Variance maps related to the elevation between each year (Fig. 5c) also show that values are higher for subtidal zones and zones where dunes have been growing compared to the centre of the sand flat, which has variance values smaller than 0.01 for most of the zone. This suggests not only that average annual elevation changes are close to 0 but also that the area presents low temporal variability in elevation. Thus, to maintain the rate of change close to 0, erosive years must be higher in magnitude than accretive years. Moreover, the location of such a deposition zone being above MSHTL means that the deposition is caused by either water levels above mean spring high-tide level or other transport mechanisms like aeolian transport.
Regarding dune growth, on average 1.1×10⁵ () m3 of sand per year is deposited on the dunes, which represents a change in the height of the dune area of 0.28 m yr−1 on average. Overall, a total of 2.2×10⁶ m3 of sand has been deposited in the dune part between 1997 and 2017. This sediment resulted in an average increase in elevation of 2.51 m and an expansion of the dune field by 9.2×10⁵ m2. Potentially, when comparing the volume of sand deposited at the sand flat and the dunes, the yearly average volume deposited on the sand flat over the years represents 27.8 % of the yearly average volume change in the dunes.
Results from the field survey show that bedforms with an average height of 11 cm and length of 150–250 cm, approximately, developed on the west portion of the sand flat, gradually diminishing their size towards the east, where they disappeared (Fig. 7). This suggests that a decrease in flow velocity occurred from west to east. This also suggests that the top of the sand flat was reworked, with values being higher in the western part due to the bedforms (Fig. 7).
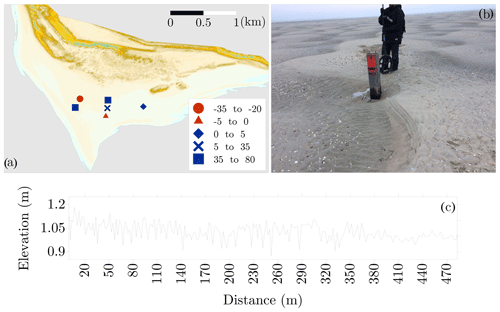
Figure 7(a) Results from the survey, showing the change in surface elevation over the storm flooding event, in centimetres; (b) picture showing and example of bed form developed after the storm at the sand flat; (c) elevation data along the transect shown in Fig. 3 showing the bed forms formed during the storm event of January 2017.
4.2 Modelled scenarios
Simulation of the storm surge events shows that deposition above the MSHTL happened in almost all tested scenarios. For most scenarios, the sediment is deposited in a clear shore-parallel, north–south deposition patch, with volumes varying from 0.7×10⁴ up to 3×10⁴ m3 of sand. The maximum deposition values occurred for storms (j) and (k), which are labelled as extreme storm surges (Fig. 8). Only two storms did not yield a significant deposition pattern at the sand flat above MSHTL (storms a and b, Table 2), with volume values of 474 and 1198 m3 deposited over 2320 and 6203 m2, respectively. These values are distributed in small patches over the plain. Values found in the simulations for the shore-parallel supratidal deposition are of the same order of magnitude as the ones derived from the lidar data.
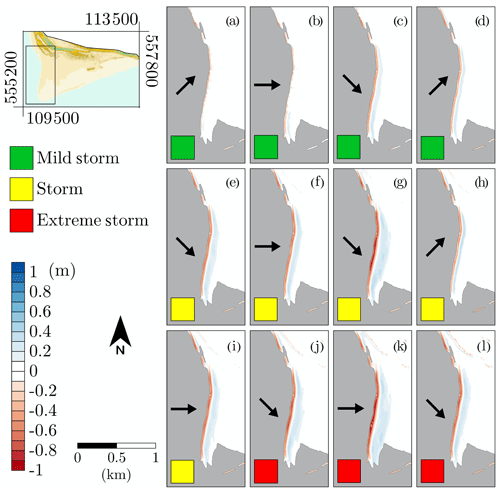
Figure 8Final elevation change after XBeach simulation for all tested scenarios. Arrows represent the main wave direction for the period, whereas the coloured box shows the storm strength.
Furthermore, simulation results suggest that the amount of sediment deposited tends to be higher for stronger storms. The amount of deposited sand over the sand flat shows a positive correlation (R>0.8) with hydrodynamic forcing conditions (: significant wave height; Tp: peak period; dir: direction; and W.L.: water level) (Fig. 9). Considering that higher water levels and wave energy are associated with stronger storms, positive values of correlation suggest that stronger storms would lead to more deposition at the sand flat. Even though correlation with main wave direction is also positive, the presence of deposition for all directions suggests that high correlation values are due to the relation between wave energy and wave direction rather than a principal mechanism towards more deposition onto the sand flat.

Figure 9Scatter plot for the initial boundary conditions used for each scenario (, Tp, dir, and maximum water level) against total volume deposited onto the sand flat.
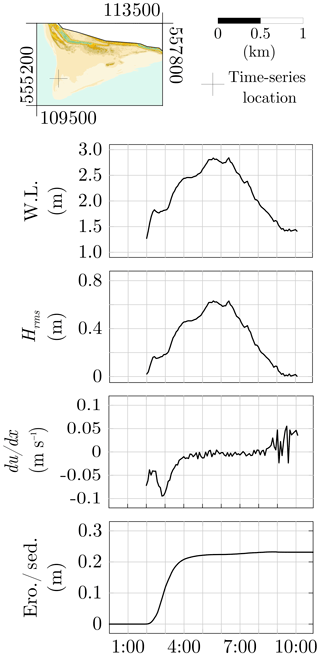
We further analyse the relation between hydrodynamic processes and morphological evolution along a cross-shore transect for scenario k by analysing the time evolution of seven parameters: local water level, wave height, cumulative bed level change, bed level change, bed level, convergence values of u in the cross-shore direction (i.e. perpendicular to the shoreline), and zonal components (u) of the flow (Fig. 10). We also extracted a time series from a point in the sand flat where deposition occurred and followed the evolution of water level, wave height, convergence values of u in the cross-shore direction (i.e. perpendicular to the shoreline) and cumulative erosion/accretion (Fig. 12).
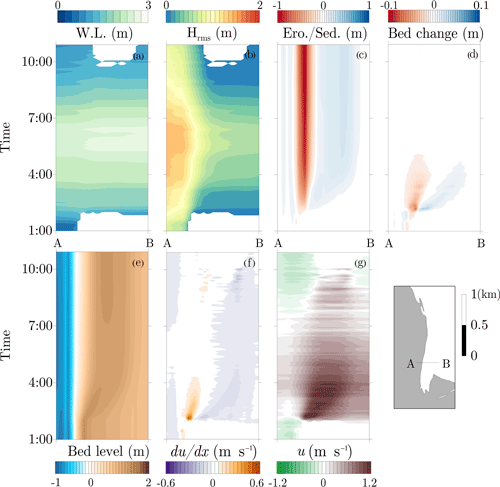
Figure 10Evolution of hydrodynamic and morphological characteristics along the transect A–B taken from scenario k. The y axes represent the time, whereas the x axes represent the distance between A and B (left to right), shown on the small reference plot. Variables shown are (a) local water level relative to NAP, (b) wave height, (c) cumulative bed level change, (d) bed level change, (e) bed level, (f) cross-shore convergence of u, and (g) zonal components (u) of the flow.
Regarding currents, Fig. 10g shows the cross-shore component of the depth-averaged currents. Before inundation of the sand flat, the system is dominated by an offshore-directed current, related to the formation of an undertow current to compensate onshore-directed, wave-driven mass fluxes. As water inundates the flat, the offshore-directed current loses strength, with a predominance of an onshore-directed current in the upper part of the beach. It is important to notice that as the undertow loses strength, water fluxes in this zone of the beach are less intense compared to water fluxes in elevations above MSHTL.
Most of the deposition occurred at the beginning of the inundation. Using scenario k as an example, we extracted information from a profile and a point in space, as highlighted in Figs. 10 and 12. Results show that deposition occurred mostly between 02:00 and 04:00 MT (model time) , which is also the period when water levels reached sufficient elevation to inundate the flat. Between 02:00 and 04:00 MT, values of wave height found in the flat are on the order of 0.1–0.5 m. After 04:00 MT, the increase in water levels reduces wave dissipation and, in turn, allows wave height on the order of 0.5–0.6 m on the flat. This suggests that the deposition is a wave-driven process, which may be associated with wave breaking. As the water starts to inundate the flat, breaking waves start to erode the beach. At the start of the event (i.e. before sand flat inundation), wave breaking induces pressure gradient differences that are higher at the shoreline, inducing the development of the undertow and a depth-averaged offshore barotropic flow. As the water level increases and the sand flat gets inundated, the pressure gradient induced by the surf bore reduces, as it starts to flow over and enter the sand flat. That leads to a reduction in the offshore flow, and the onshore-directed surf bore starts to lead the overall flow. As the breaking evolves as an onshore-directed water flux, it transports the eroded sediment in the down-wave direction. This process occurs for the period in which water depth is small enough to dissipate most of the wave energy, which is supported by the really small waves on the flat. As water depth increases, there is a reduction in wave dissipation, which in turn reduces the sediment transport capacity by reducing either the generated flux or the bottom stress.
Convergence values of the cross-shore current component (u) help to explain the mechanism of deposition further. Positive values of du∕dx occur immediately at the beginning of the inundation phase, as water level reaches values of 1.8 m (Fig. 12). Positive values, which relate to the divergence of currents, can be related to an immediate acceleration of water fluxes due to wave breaking in the cross-shore direction. Moreover, the divergence of currents will also lead to erosion of the beach. As the water starts to inundate the upper part of the beach, wave-driven water fluxes start to decelerate in the cross-shore direction, resulting in a zone of convergence, leading to deposition.
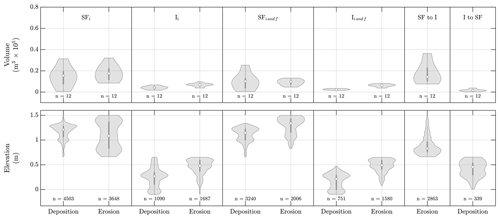
Figure 11Violin plots showing storm-induced volume changes and the elevation where such changes occurred. Dark grey boxes represent a standard boxplot (i.e. median and quartiles), whereas light grey shapes represent the normalised population distribution of the data plotted in the boxplot. “SF” and “I” refer to “Sand flat” and “Intertidal” zone, respectively. Subscripts “i” and “f” refer to the boundaries used to estimate each zone that locates the changes. Subscript “i” refers to a zone (e.g. SF or I) estimated using the initial contour to set the zone (i.e. before the storm), whereas “f” refers to the use of the final contour to estimate the zone (i.e. after the storm). Combination of both leads to a restricted zone estimated using both the initial and final contours (thus zones that did not change over the simulation), whereas using both “SF” and “I” refers to zone that changed to the other during after the simulation.
Comparing the amount of sediment eroded on the sand flat and the intertidal zone shows that most sediment is eroded from positions between the MSHTL and the 97.5th quantile (i.e. 1.32 m) of the daily maximum water level statistics, with two main elevation peaks of erosion located at the extremes of the distribution (Fig. 11, SFi and Ii). In terms of volume, deposition onto the sand flat from simulations are of the same order of magnitude as those extracted from the lidar data. Moreover, the amount eroded from the intertidal zone is 1 or 2 orders of magnitude smaller than the portion deposited on the sand flat, suggesting that most of the sediment does not move between intertidal and supratidal zones but is instead reworked within each zone (Fig. 11, SFi and Ii). Moreover, most of the volume eroded from the sand flat comes from areas that became intertidal zones by the end of the simulations, suggesting being areas close to the interface between the intertidal zone (Fig. 11, “SF to I”). It is important to note that by comparing the volume of deposition on the intertidal zone, most of the eroded from the sand flat is deposited in the sand flat itself.
Even though most of the sediment deposited is related to a reworking of the sand flat, some transfer between subtidal and supratidal still occur (Fig. 13). Using the transect A–B from scenario k as an example, results show that median values of elevation where sediment was eroded are 0.61 m, whereas sediment was deposited on a median elevation of 1.34. Moreover, 85 % of the deposition over the whole period occurred in elevations above the MSHTL, whereas 34 % of the erosion occurred in elevations above MSHTL. That suggests that sediment was transported from a regularly hydrodynamically active zone (i.e. below MSHTL) to a zone with a sparser occurrence of hydrodynamic processes (i.e. above MSHTL). Moreover, results show that accretion also occurred in areas below 0 m. This deposition occurs mainly before the inundation of the sand flat and is mainly associated with the offshore-directed current which develops before the inundation phase. Sediment is eroded from the upper beach and transported towards the sea and is then deposited in regions below mean sea level.
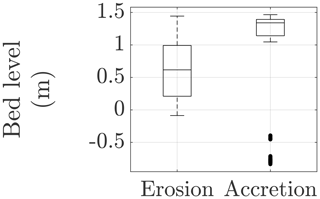
Figure 13Boxplot of the elevation where erosion or accretion occurred extracted from scenario k as example.
Using the volume deposited on the sand flat from the simulations, it is possible to estimate the amount of sediment deposited on the sand flat, in reality, using regression techniques. Using both the initial water level and wave height from the simulations as predictors, we could pair the results with measured water levels and wave height in reality. Estimates of sand being deposited on the sand flat show that, between 1997 and 2017 (i.e. dates which we have lidar data and dune volume estimates), the amount of sand predicted to be deposited on the sand flat accounts for 67 % of the total sand deposited at the dunes (Fig. 14). Curves remain similar up to the year of 2007, where divergence occurs due to a mild period in terms of storms. The unchanging rate of the volume increase in the lidar data suggests that even though storm-induced deposition may account for a significant portion of the deposited volume, it is not the only source mechanism of sand for dune growth.
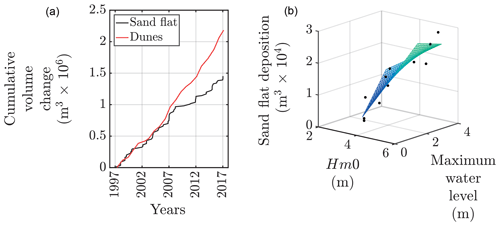
Figure 14(a) Cumulative volume changes from the dunes using lidar data (dunes) and estimated sand flat deposition using regression model as predictor (sand flat). The regression model has been built using simulation results with maximum water level at the boundary and wave height as predictors for deposition. (b) Scatter plot of the regression model used with regression surface.
Overall, both elevation survey data and modelling results suggest that (i) there is a shore-parallel deposition pattern that occurs at the sand flat in areas above the MSHTL, (ii) the deposition can be linked to storm events and (iii) the amount of sediment deposited might have a significant importance for dune growth in the area.
As mentioned by Wijnberg et al. (2017), the magnitude of the sand flat surface area is on the order of 2 km2. Considering the total amount of sand accreted at the dunes and considering the sand flat as its only source, the same amount would represent a lowering on the order of 1 m in the height of the sand flat. Considering the stability of the sand flat on a yearly scale, which can be seen through the variance and rate of change maps at the sand flat, Wijnberg et al. (2017) suggested that either the sand flat has been continuously replenished by sand or the supratidal part of the sand flat is not the primary source of sediment for the dunes. Our elevation survey data results suggest that the accretion above MSHTL can contribute with more than 27 % of the sediment supply of the dunes on a yearly basis. Furthermore, numerical modelling results support that storms may act as a depositional mechanism onto sand flats, depositing similar shore-parallel supratidal deposits of sand as seen in the elevation data. Also, estimates pairing modelling results and actual data suggest that cumulative depositions would be of the same order of magnitude as volume changes at the dunes. The potential to contribute to more than a quarter of the yearly average deposited volume in the dunes suggests that, for a sand flat setting like Texel, the sediment deposited through storm surge flooding can be seen as an important mechanism in terms of dune growth.
However, surprisingly, numerical modelling has also shown that such shore-parallel supratidal deposits are not from the subtidal zone as previously hypothesised but are rather a product of reworking of mostly supratidal-deposited sand close to the intertidal zone. Considering that the sand reworked into a depositional ridge is already from the supratidal zone (thus, potentially available for transport), the question arises whether this mechanism can be genuinely considered a new source for dune growth. To be considered as a new source, the supratidal zone of the sand flat should not act as a primary source, as hypothesised by Wijnberg et al. (2017). Although the elevation stability of most of the supratidal zone of the sand flat, together with no growth trend related to the depositional ridge, hints at such possibility, the main process that might lead to such limitation of the zone to act as a sediment source remains unclear. Galiforni-Silva et al. (2018) showed that spatial variation in groundwater depth along the sand flat induces variations in sediment supply to the dunes, which may lead to an overall limitation of the sand flat to act as a source in the long-term. Hoonhout and de Vries (2017) suggested that in a mega-nourishment setting, wind transport would lead to a sorting process of the sediments at the beach surface that, within a certain period of time, would induce an armouring effect that could reduce the potential of the sediment surface to act as a sediment source. Considering that large parts of the sand flat remain exposed most of the time, there is a possibility of armouring effects reducing the capacity of the flat to serve as a sediment source. Although possible, to what extent the armouring effect does also occur in a sand flat setting and what effect this has on the sediment transport towards the dunes remains for further research.
On coastlines away from inlets, storm surges tend to reach the dune toe, erode the sediment and transport it towards the subtidal zone via a strong undertow current (Aagaard, 2014; Guannel and Özkan Haller, 2014). For sand flats, this mechanism holds at the start of the event, before sufficient levels for inundation. After inundation, the undertow weakens, and sediment eroded from the upper beach is transported onto the sand flat instead of seaward, being deposited mainly by deceleration of a wave-driven flow, creating a shore-parallel depositional ridge on the sand flats in areas that are not reworked by the sea in a daily basis. The freshly reworked and deposited sands further inland tend to be less affected by surface moisture variations induced by tide movements and, therefore, are more prone to synchronise with energetic wind events that are capable of transferring this sand to the dunes.
Although modelling results suggest that the amount of sand deposited is directly proportional to storm strength (i.e. storm surge level plus wave energy), data analysis does not show statistical evidence that it happens in reality. This discrepancy may be explained by the following: the annual time interval of the surveys; cumulative effect of multiple storms before the total dispersion of the deposition of the previous one; the date which the measurement has been taken, since surveys done close to storms would have a higher probability of picturing the shore-parallel deposition pattern; and changes in the sand flat shape between storms, which might lead to slightly nonuniform hydrodynamic forcing in time, thus influencing the potential capacity of sand to be transferred from the subtidal to the supratidal zone.
Currently, it is hard to quantify exactly how much sand related to storm deposition or remobilisation of previously deposited sand contributes to dune growth. Lidar results show that the sediment deposited on the sand flat represents more than a quarter of the sediment necessary to maintain the dune increase at the rates that have been measured. However, being available for transport does not mean that the sediment will indeed end up at the dunes, since other hydrodynamic processes (e.g. next storm surge, erosion due to channel migration) may transport it to the subtidal area. Furthermore, the depositional ridge developed between lidar data has been already reworked by wind and potentially other storms due to the time between the measurements. Moreover, wind can also transport this sand back to the subtidal zone depending on its direction. Furthermore, limiting factors such as surface moisture and salt-crusting and lag deposits can reduce the capacity of the wind considerably to transport the sand from the sand flat towards the dunes (Langston and Neuman, 2005; Delgado-Fernandez and Davidson-Arnott, 2011; de Vries et al., 2012; Bauer et al., 2009; Houser and Ellis, 2013; Duarte-Campos et al., 2018). Thus, synchronisation of capable wind events, bed/grain characteristics and available sediment plays a key role (Houser, 2009). Nevertheless, considering the capacity of sediment deposition suggested by our results together with the dominant wind direction, it is probable that at least part of this sediment contributes to dune growth.
Considering that the depositional ridge on the sand flat is mainly composed by reworked supratidal deposits, it remains unclear which mechanisms are responsible for sediment exchange between supratidal and subtidal zones on sand flats. As a hypothetical framework of sediment exchange, we propose four phases of sediment pathways. Initially, longshore transport would transport sediments from northern coastlines of the island and deposit on the subtidal and intertidal exposed coastline of the sand flat. Local processes such as longshore gradients would shape the shoreline creating locations of accretion and erosion. On accretive portions, fresh sediment would become available on the supratidal zone through local progradation and accommodation of sediment previously located at the intertidal zone. Swash and overwash processes would be responsible for exchanging sediment between subtidal and intertidal zones. During storm surges, such fresh sediment close to MSHTL would be reworked into the supratidal ridges. Finally, aeolian transport would be responsible for eroding such a depositional ridge. Berm formation and supratidal shore-parallel depositional ridges on open coastal beaches have been already related to deposition of sediment related to swash processes (Houser and Ellis, 2013). Several authors exemplify that exchange of sediment between subtidal and supratidal zones depend on surf and swash processes during calm conditions or migration of subtidal and intertidal bars landward (Houser and Barrett, 2010; Houser and Ellis, 2013; Aagaard et al., 2004; Jackson et al., 2004). Our present research suggests that, for a sand flat setting, a supratidal shore-parallel depositional ridge can also form during a storm surge flooding, inducing the deposition of a certain amount of sand that is of the same order of magnitude as the amount of dune volume increase.
A sand flat at the tip of the island of Texel (NL) has been used as a case study to firstly identify processes and storm properties that cause deposition on the sand flat during storm-surge flooding and discuss the relationship between the supratidal deposition and sand supply to the dunes. The case was approached by an integrated analysis of lidar surveys, field survey, and numerical modelling. Results suggest that supratidal deposition of sand is directly proportional to storm surge levels and wave energy. Also, the amount of sand deposited may account for more than a quarter of the volume deposited at the dunes in a yearly basis. During storm surge flooding of the sand flat, sediment is mostly eroded from supratidal areas close to MSHTL and deposited further landward by a wave-driven, onshore-directed flow. Furthermore, simulation results suggest that most of the deposition occurs at the beginning of the sand flat inundation. Deposition is controlled by the convergence of the cross-shore component of the wave-driven flow. Furthermore, storms are also capable of remobilising the top layer of sediment of the sand flat, making fresh sediment available for aeolian transport if an armouring effect occurred, especially in the west part of the sand flat. Therefore, in a sand flat setting, storm surges have the potential of reworking considerable amounts of sand into depositional ridges that are further transported by the wind to the dunes. This suggests that storms play a significant role in supplying sand for the dunes to grow in a sand flat setting.
Data used related to the long-term Dutch monitoring programme can be found at http://opendap.deltares.nl/thredds/catalog.html (last access: 24 April 2020) (Deltares, 2020). Remaining datasets and code are available upon request from Filipe Galiforni-Silva (f.galifornisilva@utwente.nl).
Conceptualization, investigation, methodology, and writing – review and editing – were performed by FGS, KMW, and SJMHH. Resources, software, supervision and funding acquisition were managed by KMW and SJMHH. Project administration was done by KMW. Validation, visualisation, data curation, formal analysis, and writing – original draft – were performed by FGS.
The authors declare that they have no conflict of interest.
This research forms a component of the CoCoChannel project (Co-designing Coasts using natural Channel shoal dynamics – NWO). We further wish to acknowledge Rijkswaterstaat and KNMI for making their valuable bathymetric and topographic datasets freely available, as well as the water level, wave, and wind data. Furthermore, we would like to thank Dano Roelvink for his help and discussions on the application of the XBeach model.
This research has been supported by the Nederlandse Organisatie voor Wetenschappelijk Onderzoek (grant no. 85013042) and the Hoogheemraadschap Hollands Noorderkwartier.
This paper was edited by Andreas Baas and reviewed by Edward Anthony and one anonymous referee.
Aagaard, T.: Sediment supply to beaches: Cross-shore sand transport on the lower shoreface, J. Geophys. Res.-Earth, 119, 913–926, 2014. a, b
Aagaard, T., Nielsen, J., Jensen, S. G., and Friderichsen, J.: Longshore sediment transport and coastal erosion at Skallingen, Denmark, Geografisk Tidsskrift-Dan. J. Geogr., 104, 5–14, https://doi.org/10.1080/00167223.2004.10649499, 2004. a, b, c, d
Anthony, E. J.: Storms, shoreface morphodynamics, sand supply, and the accretion and erosion of coastal dune barriers in the southern North Sea, Geomorphology, 199, 8–21, https://doi.org/10.1016/j.geomorph.2012.06.007, 2013. a, b
Anthony, E. J., Vanhee, S., and Ruz, M. H.: Short-term beach-dune sand budgets on the north sea coast of France: Sand supply from shoreface to dunes, and the role of wind and fetch, Geomorphology, 81, 316–329, https://doi.org/10.1016/j.geomorph.2006.04.022, 2006. a, b, c
Bauer, B. O. and Davidson-Arnott, R. G. D.: A general framework for modeling sediment supply to coastal dunes including wind angle, beach geometry, and fetch effects, Geomorphology, 49, 89–108, https://doi.org/10.1016/S0169-555X(02)00165-4, 2002. a
Bauer, B. O., Davidson-Arnott, R. G. D., Hesp, P. A., Namikas, S. L., Ollerhead, J., and Walker, I. J.: Aeolian sediment transport on a beach: Surface moisture, wind fetch, and mean transport, Geomorphology, 105, 106–116, 2009. a, b, c
Bochev-van der Burgh, L. M. V., Wijnberg, K. M., and Hulscher, S. J. M. H.: Dune Morphology along a Nourished Coastline, J. Coast. Res., 1, 292–296, 2009. a
Bochev-van der Burgh, L. M. V., Wijnberg, K. M., and Hulscher, S. J. M. H.: Decadal-scale morphologic variability of managed coastal dunes, Coast. Eng., 58, 927–936, https://doi.org/10.1016/j.coastaleng.2011.05.013, 2011. a
Cohn, N., Ruggiero, P., de Vries, S., and García-Medina, G.: Beach Growth driven by intertidal sandbar welding, in: Proceedings of Coastal Dynamics 2017, 12–16 June 2017, Kulturværftet, Helsingør, Denmark, 2017. a
Delgado-Fernandez, I. and Davidson-Arnott, R.: Meso-scale aeolian sediment input to coastal dunes: The nature of aeolian transport events, Geomorphology, 126, 217–232, https://doi.org/10.1016/j.geomorph.2010.11.005, 2011. a, b
Deltares: XBeach Manual, available at: https://xbeach.readthedocs.io/ (last access: 24 April 2020), 2018. a, b, c, d
Deltares: OpenDAP THREDDS Data Server, available at: http://opendap.deltares.nl/thredds/catalog.html, last access: 24 April 2020. a
de Vries, J. V. T.: Dune Erosion during storm surges, PhD thesis, Delft University of Technology, Delft, 2009. a
de Vries, S., Southgate, H. N., Kanning, W., and Ranasinghe, R.: Dune behavior and aeolian transport on decadal timescales, Coast. Eng., 67, 41–53, https://doi.org/10.1016/j.coastaleng.2012.04.002, 2012. a, b, c
de Winter, R., Gongriep, F., and Ruessink, B.: Observations and modeling of alongshore variability in dune erosion at Egmond aan Zee, the Netherlands, Coast. Eng., 99, 167–175, https://doi.org/10.1016/j.coastaleng.2015.02.005, 2015. a
Donker, J., van Maarseveen, M., and Ruessink, G.: Spatio-Temporal Variations in Foredune Dynamics Determined with Mobile Laser Scanning, J. Mar. Sci. Eng., 6, 126, https://doi.org/10.3390/jmse6040126, 2018. a
Duarte-Campos, L., Wijnberg, K., and Hulscher, S.: Estimating Annual Onshore Aeolian Sand Supply from the Intertidal Beach Using an Aggregated-Scale Transport Formula, J. Mar. Sci. Eng., 6, 127, https://doi.org/10.3390/jmse6040127, 2018. a, b
Duran-Matute, M., Gerkema, T., De Boer, G. J., Nauw, J. J., and Gräwe, U.: Residual circulation and freshwater transport in the Dutch Wadden Sea: A numerical modelling study, Ocean Sci., 10, 611–632, https://doi.org/10.5194/os-10-611-2014, 2014. a
Eastwood, E., Nield, J., Baas, A., and Kocurek, G.: Modelling controls on aeolian dune-field pattern evolution, Sedimentology, 58, 1391–1406, https://doi.org/10.1111/j.1365-3091.2010.01216.x, 2011. a
Elias, E. P. L. L. and Van Der Spek, A. J. F.: Long-term morphodynamic evolution of Texel Inlet and its ebb-tidal delta (The Netherlands), Mar. Geol., 225, 5–21, https://doi.org/10.1016/j.margeo.2005.09.008, 2006. a, b, c
Elias, E. P. L. L. and Van Der Spek, A. J. F.: Dynamic preservation of Texel Inlet, the Netherlands: understanding the interaction of an ebb-tidal delta with its adjacent coast, Neth. J. Geosci., 96, 293–317, 2017. a, b
Elsayed, S. M. and Oumeraci, H.: Effect of beach slope and grain-stabilization on coastal sediment transport: An attempt to overcome the erosion overestimation by XBeach, Coast. Eng., 121, 179–196, 2017. a, b
Engelstad, A., Ruessink, B. G., Wesselman, D., Hoekstra, P., Oost, A. P., and Vegt, M. V. D.: Observations of waves and currents during barrier island inundation, J. Geophys. Res.-Oceans, 122, 3152–3169, https://doi.org/10.1002/2016JC012545, 2017. a
Fenster, M. and Dolan, R.: Assessing the impact of tidal inlets on adjacent barrier island shorelines, J. Coast. Res., 12, 294–310, 1996. a
Fitzgerald, D. M., Penland, S., and Nummedal, D.: Control Of Barrier Island Shape By Inlet Sediment Bypassing: East Frisian Islands, West Germany, Mar. Geol., 60, 355–376, https://doi.org/10.1016/0025-3227(84)90157-9, 1984. a
Galiforni-Silva, F., Wijnberg, K. M., de Groot, A. V., and Hulscher, S. J. M. H.: The influence of groundwater depth on coastal dune development at sand flats close to inlets, Ocean Dynam., 68, 885–897, https://doi.org/10.1007/s10236-018-1162-8, 2018. a, b, c, d
Galiforni-Silva, F., Wijnberg, K. M., de Groot, A. V., and Hulscher, S. J. M. H.: The effects of beach width variability on coastal dune development at decadal scales, Geomorphology, 329, 58–69, https://doi.org/10.1016/j.geomorph.2018.12.012, 2019. a, b
Guannel, G. and Özkan Haller, H. T.: Formulation of the undertow using linear wave theory, Phys. Fluids, 26, 056604, https://doi.org/10.1063/1.4872160, 2014. a
Hesp, P.: Morphodynamics of incipient foredunes in new south wales, australia, Dev. Sedimentol., 38, 325–342, https://doi.org/10.1016/S0070-4571(08)70802-1, 1983. a, b
Hesp, P.: Foredunes and blowouts: initiation, geomorphology and dynamics, Geomorphology, 48, 245–268, https://doi.org/10.1016/S0169-555X(02)00184-8, 2002. a, b, c
Hesp, P. A. and Walker, I. J.: 11.17 Coastal Dunes, in: Treatise on Geomorphology, Elsevier, 328–355, https://doi.org/10.1016/B978-0-12-374739-6.00310-9, 2013. a
Hoonhout, B. and de Vries, S.: Field measurements on spatial variations in aeolian sediment availability at the Sand Motor mega nourishment, Aeolian Res., 24, 93–104, https://doi.org/10.1016/j.aeolia.2016.12.003, 2017. a
Houser, C.: Synchronization of transport and supply in beach-dune interaction, Prog. Phys. Geogr., 33, 733–746, https://doi.org/10.1177/0309133309350120, 2009. a, b
Houser, C. and Barrett, G.: Divergent behavior of the swash zone in response to different foreshore slopes and nearshore states, Mar. Geol., 271, 106–118, 2010. a
Houser, C. and Ellis, J.: 10.10 Beach and Dune Interaction, in: Treatise on Geomorphology, Elsevier, 267–288, https://doi.org/10.1016/b978-0-12-374739-6.00283-9, 2013. a, b, c, d
Jackson, N. L., Masselink, G., and Nordstrom, K. F.: The role of bore collapse and local shear stresses on the spatial distribution of sediment load in the uprush of an intermediate-state beach, Mar. Geol., 203, 109–118, https://doi.org/10.1016/s0025-3227(03)00328-1, 2004. a
Keijsers, J. G. S., Poortinga, A., Riksen, M. J. P. M., and Maroulis, J.: Spatio-temporal variability in accretion and erosion of coastal foredunes in the Netherlands: regional climate and local topography, PloS One, 9, e91115, https://doi.org/10.1371/journal.pone.0091115, 2014. a
Keijsers, J. G. S., De Groot, A. V., and Riksen, M. J.: Vegetation and sedimentation on coastal foredunes, Geomorphology, 228, 723–734, https://doi.org/10.1016/j.geomorph.2014.10.027, 2015. a
Langston, G. and Neuman, C. M.: An experimental study on the susceptibility of crusted surfaces to wind erosion: A comparison of the strength properties of biotic and salt crusts, Geomorphology, 72, 40–53, https://doi.org/10.1016/j.geomorph.2005.05.003, 2005. a
McCall, R., de Vries, J. V. T., Plant, N., Dongeren, A. V., Roelvink, J., Thompson, D., and Reniers, A.: Two-dimensional time dependent hurricane overwash and erosion modeling at Santa Rosa Island, Coast. Eng., 57, 668–683, https://doi.org/10.1016/j.coastaleng.2010.02.006, 2010. a
Nederhoff, C.: Modeling the effects of hard structures on dune erosion and overwash, Master thesis, Delft University of Technology, Delft, 2014. a
Quartel, S., Kroon, A., and Ruessink, B.: Seasonal accretion and erosion patterns of a microtidal sandy beach, Mar. Geol., 250, 19–33, https://doi.org/10.1016/j.margeo.2007.11.003, 2008. a
Reichmüth, B. and Anthony, E. J.: Tidal influence on the intertidal bar morphology of two contrasting macrotidal beaches, Geomorphology, 90, 101–114, 2007. a
Rijkswaterstaat: Kenmerkende waarden, Tech. rep., Rijkswaterstaat, available at: http://publicaties.minienm.nl/documenten/kenmerkende-waarden-getijgebied-2011 (last access: 24 April 2020), 2013. a
Robin, N., Levoy, F., Monfort, O., and Anthony, E.: Short-term to decadal-scale onshore bar migration and shoreline changes in the vicinity of a megatidal ebb delta, J. Geophys. Res., 114, F04024, https://doi.org/10.1029/2008jf001207, 2009. a
Roelvink, D., Reniers, A., van Dongeren, A., van Thiel de Vries, J., McCall, R., and Lescinski, J.: Modelling storm impacts on beaches, dunes and barrier islands, Coast. Eng., 56, 1133–1152, https://doi.org/10.1016/j.coastaleng.2009.08.006, 2009. a, b, c, d, e
Ruessink, B. G. and Jeuken, M. C. J. L.: Dunefoot dynamics along the Dutch coast, Earth Surf. Proc. Land., 27, 1043–1056, https://doi.org/10.1002/esp.391, 2002. a, b
Sherman, D. J. and Bauer, B. O.: Dynamics of beach-dune systems, Prog. Phys. Geogr., 17, 413–447, https://doi.org/10.1177/030913339301700402, 1993. a
Short, A. D. and Hesp, P. A.: Wave, beach and dune interactions in southeastern australia, Mar. Geol., 48, 259–284, 1982. a
van Heteren, S., Oost, A. P., van der Spek, A. J. F., and Elias, E. P. L.: Island-terminus evolution related to changing ebb-tidal-delta configuration: Texel, The Netherlands, Mar. Geol., 235, 19–33, https://doi.org/10.1016/j.margeo.2006.10.002, 2006. a
van Puijenbroek, M. E., Limpens, J., de Groot, A. V., Riksen, M. J., Gleichman, M., Slim, P. A., van Dobben, H. F., and Berendse, F.: Embryo dune development drivers: Beach morphology, growing season precipitation, and storms, Earth Surf. Proc. Land., 42, 1733–1744, https://doi.org/10.1002/esp.4144, 2017. a, b
Vet, P. D.: Modelling sediment transport and morphology during overwash and breaching events, Master thesis, Delft University of Technology, Delft, 2014. a
Wijnberg, K. M., van der Spek, A. J., Silva, F. G., Elias, E., van der Wegen, M., and Slinger, J. H.: Connecting subtidal and subaerial sand transport pathways in the Texel inlet system, Coast. Dynam. Proceed., 235, 323–332, 2017. a, b, c, d


