the Creative Commons Attribution 4.0 License.
the Creative Commons Attribution 4.0 License.
 | 04 Nov 2022
Failure mode of rainfall-induced landslide of granite residual soil, southeastern Guangxi Province, China
Shanbai Wu
Ruihua Zhao
Liping Liao
Yunchuan Yang
Yao Wei
Wenzhi Wei
Granite residual soil landslides are widely distributed in the southeast of Guangxi, China. They pose threats to local communities, economic development and ecological restoration. To understand the failure mode, the landslide can provide a scientific basis for early warning and prevention. In this study, we conducted artificial flume model tests to investigate the failure mode of granite residual soil landslide. The macroscopic phenomena of landslides were observed and summarized. The response and variations of soil moisture content and pore water pressure were analyzed. And the discrepancies in landslide initiation were explored. The results had three aspects: (1) the response of volume moisture content was not synchronized with that of pore water pressure. Their variations were influenced by initial dry density, slope angle and rainfall intensity. The fluctuation of pore water pressure depended on soil mechanical behavior and its diffusion. (2) The differences in the formation process of granite residual soil landslides included the initiation time and mode. The starting time of landslide was delayed with increasing initial dry density and slope angle but shortened with increasing rainfall intensity. The failure mode could be changed from a sudden type to a progressive type due to the increase in initial dry density. (3) There are five stages in the landslide mobilization as follows: rain infiltration and crack generation, soil slide at the slope toe, occurrence of surface runoff and soil erosion, formation of steep-free surface, and soil slide at the upper slope. This research can provide valuable reference for the prevention and early warning of granite residual soil landslide in southeastern Guangxi.
- Article
(10636 KB) - Full-text XML
- BibTeX
- EndNote


Rainfall-induced landslides are the most common geohazards in the tropical and subtropical areas covered by granite residual soil, such as Brazil (Lacerda, 2007; Coutinho et al., 2019), Singapore (Rezaur et al., 2003; Rahardjo et al., 2008, 2012; Zhai et al., 2016; Zhang et al., 2019), Malaysia (Rahman et al., 2018), Korea (Kim et al., 2004; Pham et al., 2019), southern (Jiao et al., 2005; Fan et al., 2018; Luo et al., 2021; Liu et al., 2020a, b, 2021) and southeastern China (Xia et al., 2019; Yao et al., 2021; Shu et al., 2021; Zhao et al., 2021). Guangxi is located in southeastern China, where granite is concentrated in the southeast and landslides occur frequently (Liao et al., 2019). Hot and rainy climatic conditions have caused strong weathering of the surface granite, giving birth to tens of thousands of residual soil. This provides a superior environment for the formation of landslides. Therefore, southeastern Guangxi has been threatened by granite residual soil landslides for a long time. Granite residual soil is a regional special soil (Ministry of Construction of the People's Republic of China, 2002). One reason is that it has the dual mechanical properties of cohesive soil and sandy soil. The other is that it exhibits an abnormal combination of poor physical properties, such as high liquid limit and large void ratio and high-strength properties in a natural state (Chen et al., 2011). However, granite residual soil is extremely sensitive to rainfall. It is easy to disintegrate and soften and induces a wide range of landslides (Dahal et al., 2008; Liu et al., 2020a; Zhang and Tang, 2013). Although shallow landslides are the main type (Rahardjo et al., 2008; Kim et al., 2004), they still have the characteristics of high frequency (Kim et al., 2015), suddenness and mass occurrence.
The failure mode of residual soil landslide is an important basis for landslide monitoring and early warning (Rezaur et al., 2003). In this regard, many scholars have conducted in-depth studies on granite residual soil landslide and other residual soil landslide through statistical analysis, model tests and numerical simulations. They classified the type of granite residual soil (Wu, 2006b) and studied the physical mechanical properties (Zhu and Anderson, 1998; Chen et al., 2011; Zhang and Tang, 2013; Chen and Gong, 2014; Xia et al., 2019), engineering characteristic (Wu, 2006a; Xu et al., 2017) and microstructure (Li et al., 2017; Wang et al., 2018). The formation condition (Zhan et al., 2012; Zuo et al., 2015) and instability mode (Zhao and Hu, 2005; Dahal et al., 2008; Xu and Jian, 2017) of granite residual soil landslides were revealed. They found and confirmed that the failure mode of residual soil slope is different from that of homogeneous soil–rock slope. This is because it includes arc slip, plane slip and front shear slip, but plane slip is dominant (Fu et al., 2018). The failure surface is parallel to the original slope (Kim et al., 2004). They also pointed out rainfall is the most important external triggering factor due to two aspects (Coutinho et al., 2019). One is the deepening of the wetting peak induced by rainfall infiltration (Kim et al., 2004). Second, the increase in soil–water content and pore water pressure can lead to a decrease in slope stability (Gasmo et al., 2000; Rezaur et al., 2003; Rahardjo et al., 2005, 2008; Lacerda, 2007). Thus, in the process of landslide formation, the variation of physical property parameters such as moisture, matric suction or pore pressure plays an important role in the residual soil landslide (Kassim et al., 2012; Igwe and Fukuoka, 2014; Pham et al., 2019; Zhai et al., 2016). Rainfall-triggered mechanisms focus on completely weathered granite fill slope in Hong Kong SAR, China. They are static liquefaction (Chen et al., 2004) and the transition from slide to flow due to localized transient pore water pressure (Take et al., 2004). However, static liquefaction is impossible due to an unsaturated condition. Instead, local transient pore water pressure can induce the initially slip, which further triggers the high-speed slide (Take et al., 2004). Another finding is that the initial dry density (Mukhlisin et al., 2008) and slope angle (Liu et al., 2020a, b) can affect the water permeability and control the formation of landslides (Xu et al., 2018). Many scholars have carried out related studies on the relationship between dry density of other types of soil such as sandy soil, volcanic residual soil, and gravel soil, and the initiation of landslides. They found, through model tests, that the initial density can determine the stress–strain characteristics of the soil, and it corresponds to the initiation mechanism of dilation and contraction (Dai et al., 1999a, b; McKenna et al., 2011). The macroscopic phenomena corresponding to these two mechanisms are that the saturated loose slope will suddenly liquefy and flow rapidly, while the saturated dense slope will slowly creep (Iverson et al., 2000). It can be seen that there is a significant difference in the sliding motion rate of sand landslides (Iverson, 2005). Especially when the dry density is optimal, the moving speed and sliding distance of the landslide are both maximums (Wang and Sassa, 2001). This is mainly because the initial dry density affects the soil–water interaction and soil permeability (Ng and Pang, 2000; Jiang et al., 2017). For example, high-density steep slopes are much more resistant to rainwater penetration than low-density gentle slopes (Xu et al., 2018). A gentle slope can lead to better accumulation of rainwater and a faster increase in water content but a slower rate of soil collapse (Liu et al., 2020a, b). Other scholars have further confirmed the above results through numerical simulations. That is, the initial dry density has a decisive influence on the movement accumulation and evolution process of the landslide. It is mainly reflected in the significant differences in slip rate (Liang et al., 2017).
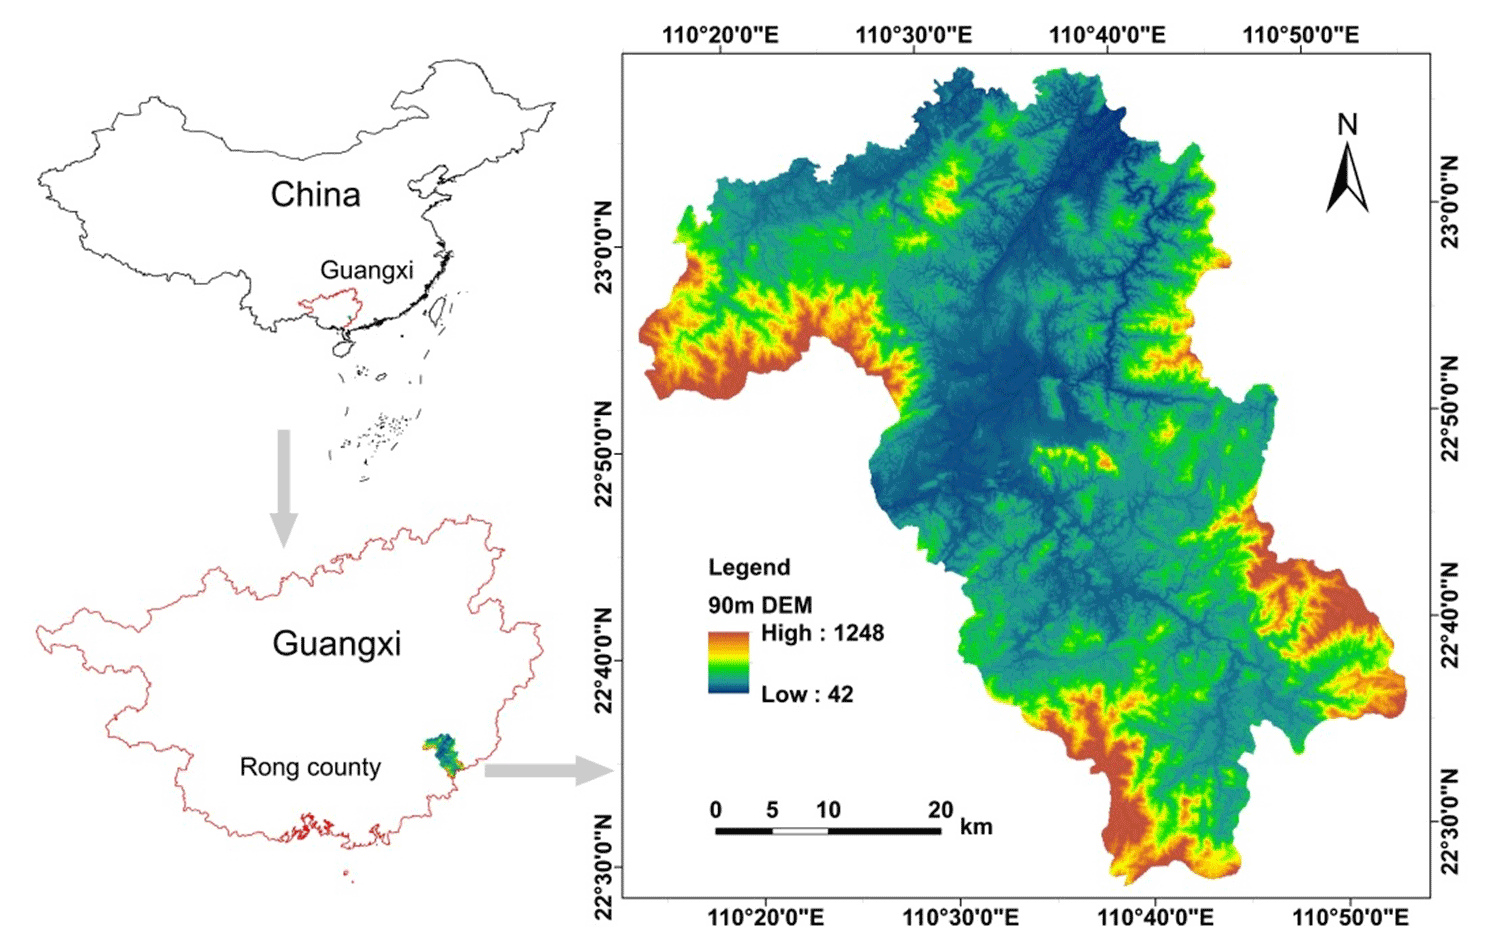
Figure 1Study area.
The above research pointed out the direction for the follow-up work. However, most of the conclusions related to failure process focus on gravel soil (Chen et al., 2017; Liao et al., 2018; Wu et al., 2019), sandy soil (Moriwaki et al., 2004; Huang et al., 2008; Huang and Yuin, 2010), fill slope (Chen et al., 2004; Take et al., 2004), clay soil (Elkamhawy et al., 2018; Miao et al., 2022) and loess slope (Tu et al., 2009; Zou et al., 2020). Moreover, the degree of development of granite weathering crust is closely related to the climate, topography and environment (Qu et al., 2000). The granite residual soil has significant heterogeneity characteristics in terms of thickness and physical and mechanical property (Rahardjo et al., 2002, 2012). These special characteristics lead to the complex initiation modes of landslides (Calcaterra and Parise, 2005; Mukhlisin and Taha, 2012; Liu et al., 2020a; Xia et al., 2019). At present, the failure mode of granite residual soil slope in the southeast of Guangxi has not been studied, which has brought challenges to the prevention and early warning of landslides. Therefore, some scientific issues need to be solved. For example, what are the similarities and differences of the failure process of granite residual soil slope? How do the physical parameters of residual soil change? In this paper, we conducted artificial flume model tests to resolve the above issues. Firstly, the macroscopic phenomena of landslide is observed and summarized. Subsequently, the variation characteristics of soil moisture content and pore water pressure are analyzed. Finally, the differences in the initiation of rainfall-induced landslide are discussed.
2.1 Field site
Rong County is a typical high-prone area of rainfall-induced landslide of granite residual soil in southeast Guangxi (Liao et al., 2019). It is located between longitude 110∘15′00′′–110∘53′00′′ E and latitude 22∘27′00′′–23∘07′00′′ N (Fig. 1). The County covers an area of 2257 km2, with an average annual rainfall of 1737.4 mm a−1. The rainy period is from April to September, and the rainfall in this period accounts for 78.6 % of the average annual rainfall. The area of magmatic rocks is 1260.09 km2, accounting for 55.83 % of the total area of the county. The lithology is mainly granite with an area of 1219.06 km2.
2.2 Method
The village of Logntou in the town of Liuwang is a highly landslide prone area in Rong County. Therefore, the test soil comes from the village of Longtou. Specific gravity of the soil is 2.71, and the minimum and maximum of dry density are 1.18 and 1.72 g cm−3. Particle data are the average of three sets of sieve tests on granite residual soil (Fig. 2). The red grid points in Fig. 2 represent the cumulative content of gravel (diameter < 2 mm) and silt and clay (diameter ≤ 0.075 mm). They are 87.52 % and 25.62 %. The angles of natural slope in the study area are 30–45∘ and mainly 40–45∘. The dry density of superficial soil is 1.20–1.40 g cm−3. The average mass moisture content is 6 %–10 % (Wen, 2015). Only two initial dry densities of 1.20 and 1.40 g cm−3 are set to highlight the discrepancies between tests (Table 1). Two slope angles of 40 and 45∘ are established. Initial mass moisture content is controlled in the range of 6 % to 10 %. Heavy rainfall is the main factor in the formation of landslides (Wei et al., 2017). Hence, rainfall intensity and duration are set based on rainfall data from multiple landslide events in the study area in 2010 (Wen, 2015). There are one to three periods of rainfall, and each period lasts for 8 h with an interval of 15 h. Rainfall intensities are 60 and 90 mm h−1 respectively. Furthermore, the groundwater level in the study area is relatively deep. The landslide initiation of granite residual soil does not depend on the fluctuation of groundwater level. Therefore, the groundwater level is not considered in the tests.

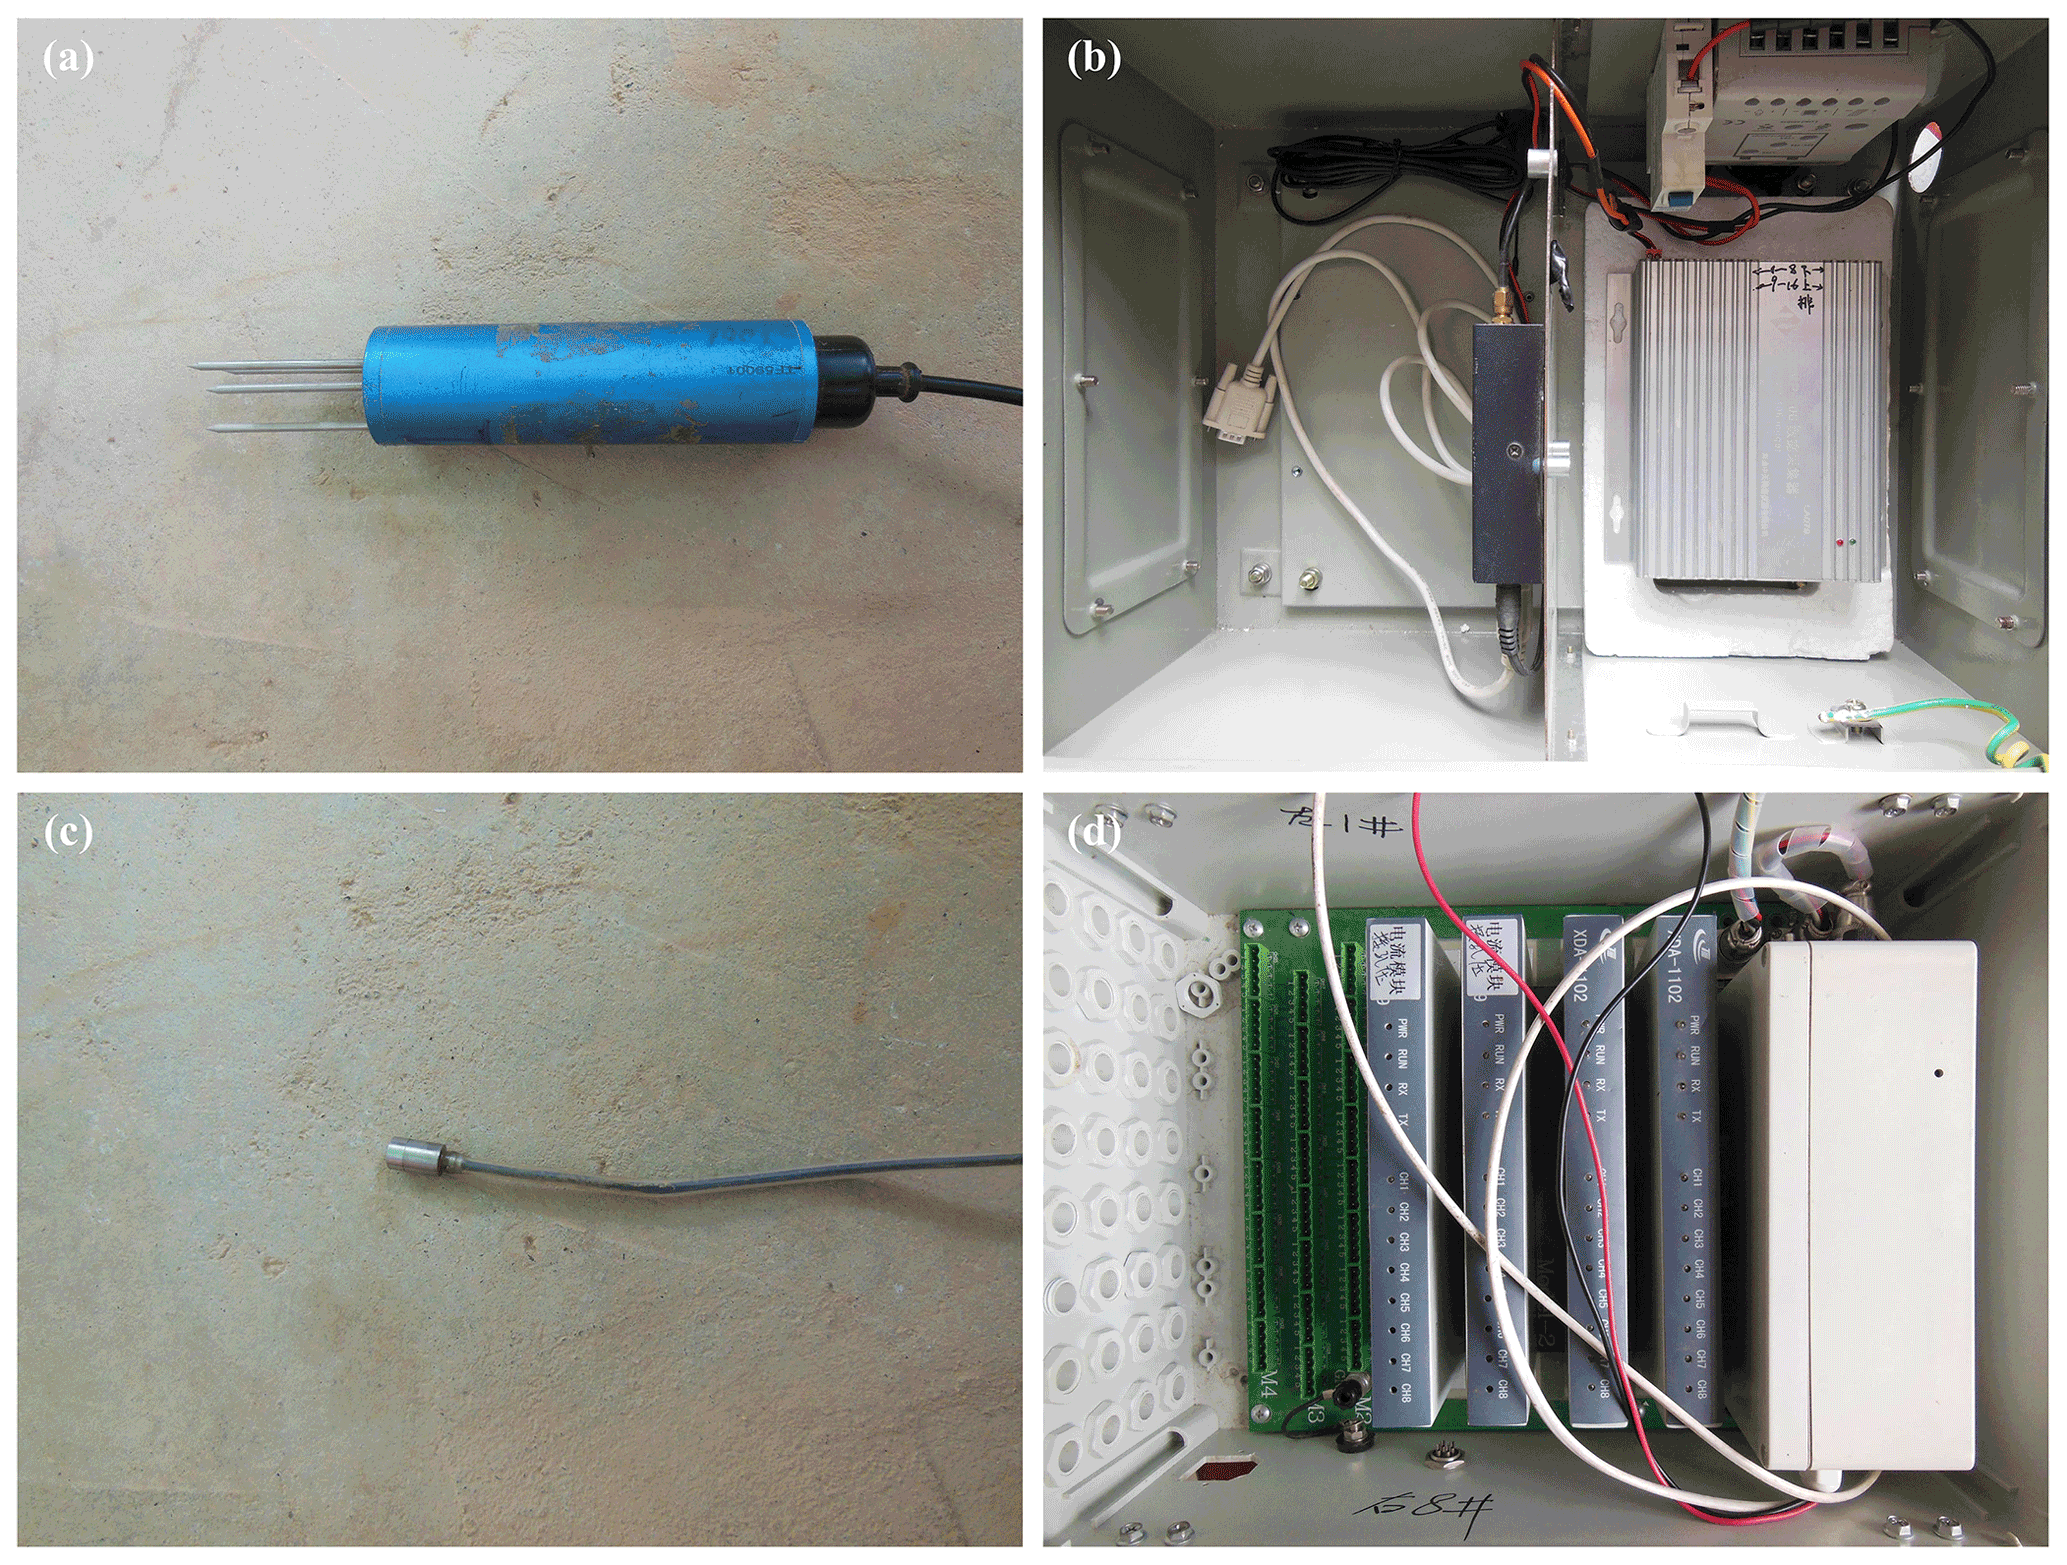
Figure 3Testing equipments. (a) Soil moisture sensor (the model is MP-406B). (b) Soil moisture collector (the model is M-16). (c) Micro gauge of pore water pressure (the model is HC-25). (d) Pore water pressure collector (the model is MCU).

Test equipments are composed of a rainfall control system, data testing system and flume model. The rainfall control system contains a central control system, suction pump, water tank, hose, brace and nozzle. The size of water output can be set in the rainfall control system. The distance from the nozzle to slope crest is 2.3 m. The effective rainfall area of the tests is 6 m2, and the rainfall is calibrated before the formal test. Data testing system consists of sensors and data collectors (Fig. 3). The minimum time unit for data collection is 1 min, and the storage space of the data collector is limited. Hence, the acquisition frequency of volume moisture content and pore water pressure is set to 1 and 3 min respectively.
The length, width and height of test slope are 1.5, 0.8 and 0.6 m respectively. The slope is divided into six layers, and the thickness of each layer is 0.1 m (Fig. 4). Firstly, a sufficient number of air-dried soils are screened. Secondly, the required water is calculated based on the current and designed moisture content. Subsequently, this water is sprayed evenly into the soil. When the water and soil are fully mixed, they are placed in a container and kept for 24 h. Finally, when moisture content of the mixture meets the requirement of designed moisture content, the slope model begins to be made. The accuracy of initial dry density must be guaranteed, so the soil of each layer is compacted with the wooden hammer. In addition, 12 monitoring points are set up inside the model. They belong to five positions. Each monitoring point consists of a soil moisture sensor and a micro gauge of pore water pressure (Fig. 4b).

Figure 4Flume model. (a) Three-dimensional schematic of the model. (b) Center section of the slope and sensor locations.
3.1 Macroscopic phenomena of tests
(1) Test 1
During the first rainfall, when the rainfall lasts for 50 min, two small ditches are found on the slope surface. At this time, the soil at the slope toe slips and triggers the soil on the trailing edge to slide. The instability area is fan-shaped and located at the left side of the slope toe. Its length is three-quarters of the total length of the slope. When the rainfall lasts for 421 min, a new ditch developing on the slope shoulder is connected with the original instability area. In the second rainfall, the ditches are continuously eroded. At the same time, many fine particles are moved to the slope toe by rain. When the rainfall lasts for 559 min, the soil of the left slope shoulder begins to slide, causing the formation of tensile crack at the slope crest. Then the soil around the crack slips and accumulates to the slope toe. During the third rainfall, the continuous soil slide leads to the occurrence of a steep-free surface. When the rainfall lasts for 1324 min, the soil of the steep surface starts to slide. The soil sliding does not stop until the slope gradient becomes gentle.
(2) Test 2
When the first rainfall lasts for 67 min, the soil on the left side of the slope toe begins to slip. The area of sliding range gradually extends. When the rainfall lasts 431 min, the instability range has been extended to the slope shoulder, and the seventh sensor is exposed. Subsequently, the soil on the right side of the slope toe slips, causing the soil slide in the middle slope. During the second rainfall, tiny cracks are found on the right side of slope. When the rainfall lasts for 524 min, the soil around the crack slips and the sliding surface is arc-shaped. Owing to continuous rainfall, the process of soil slide occurs repeatedly and the gullies forms. The slope surface is eroded by third rainfall. The ditch on the right side of slope extends and the slope eventually stabilizes.
(3) Test 3
In the first rainfall process, when the rainfall lasts for 32 min, tensile cracks appear successively on the slope toe and the soil around the cracks slips (Fig. 5a). Subsequently, a steep-free surface is formed. When the rainfall lasts for 39 min, the soil in the middle slope begins to slide (Fig. 5b). When the rainfall lasts for 215 min, the soil on the slope shoulder starts to slip due to unbalance internal forces (Fig. 5c). It causes sensor no. 3 to deviate from the embedded position. When the second rainfall lasts for 811 min, blocky soil slides suddenly on the right slope toe (Fig. 5d). When the rainfall lasts for 923 min, massive soil on the right slope shoulder begins to slides owing to the unloading effect of the slope toe (Fig. 5e). Subsequently, the slope is stable (Fig. 5f). This sliding process is accompanied by the sinking of the slope.
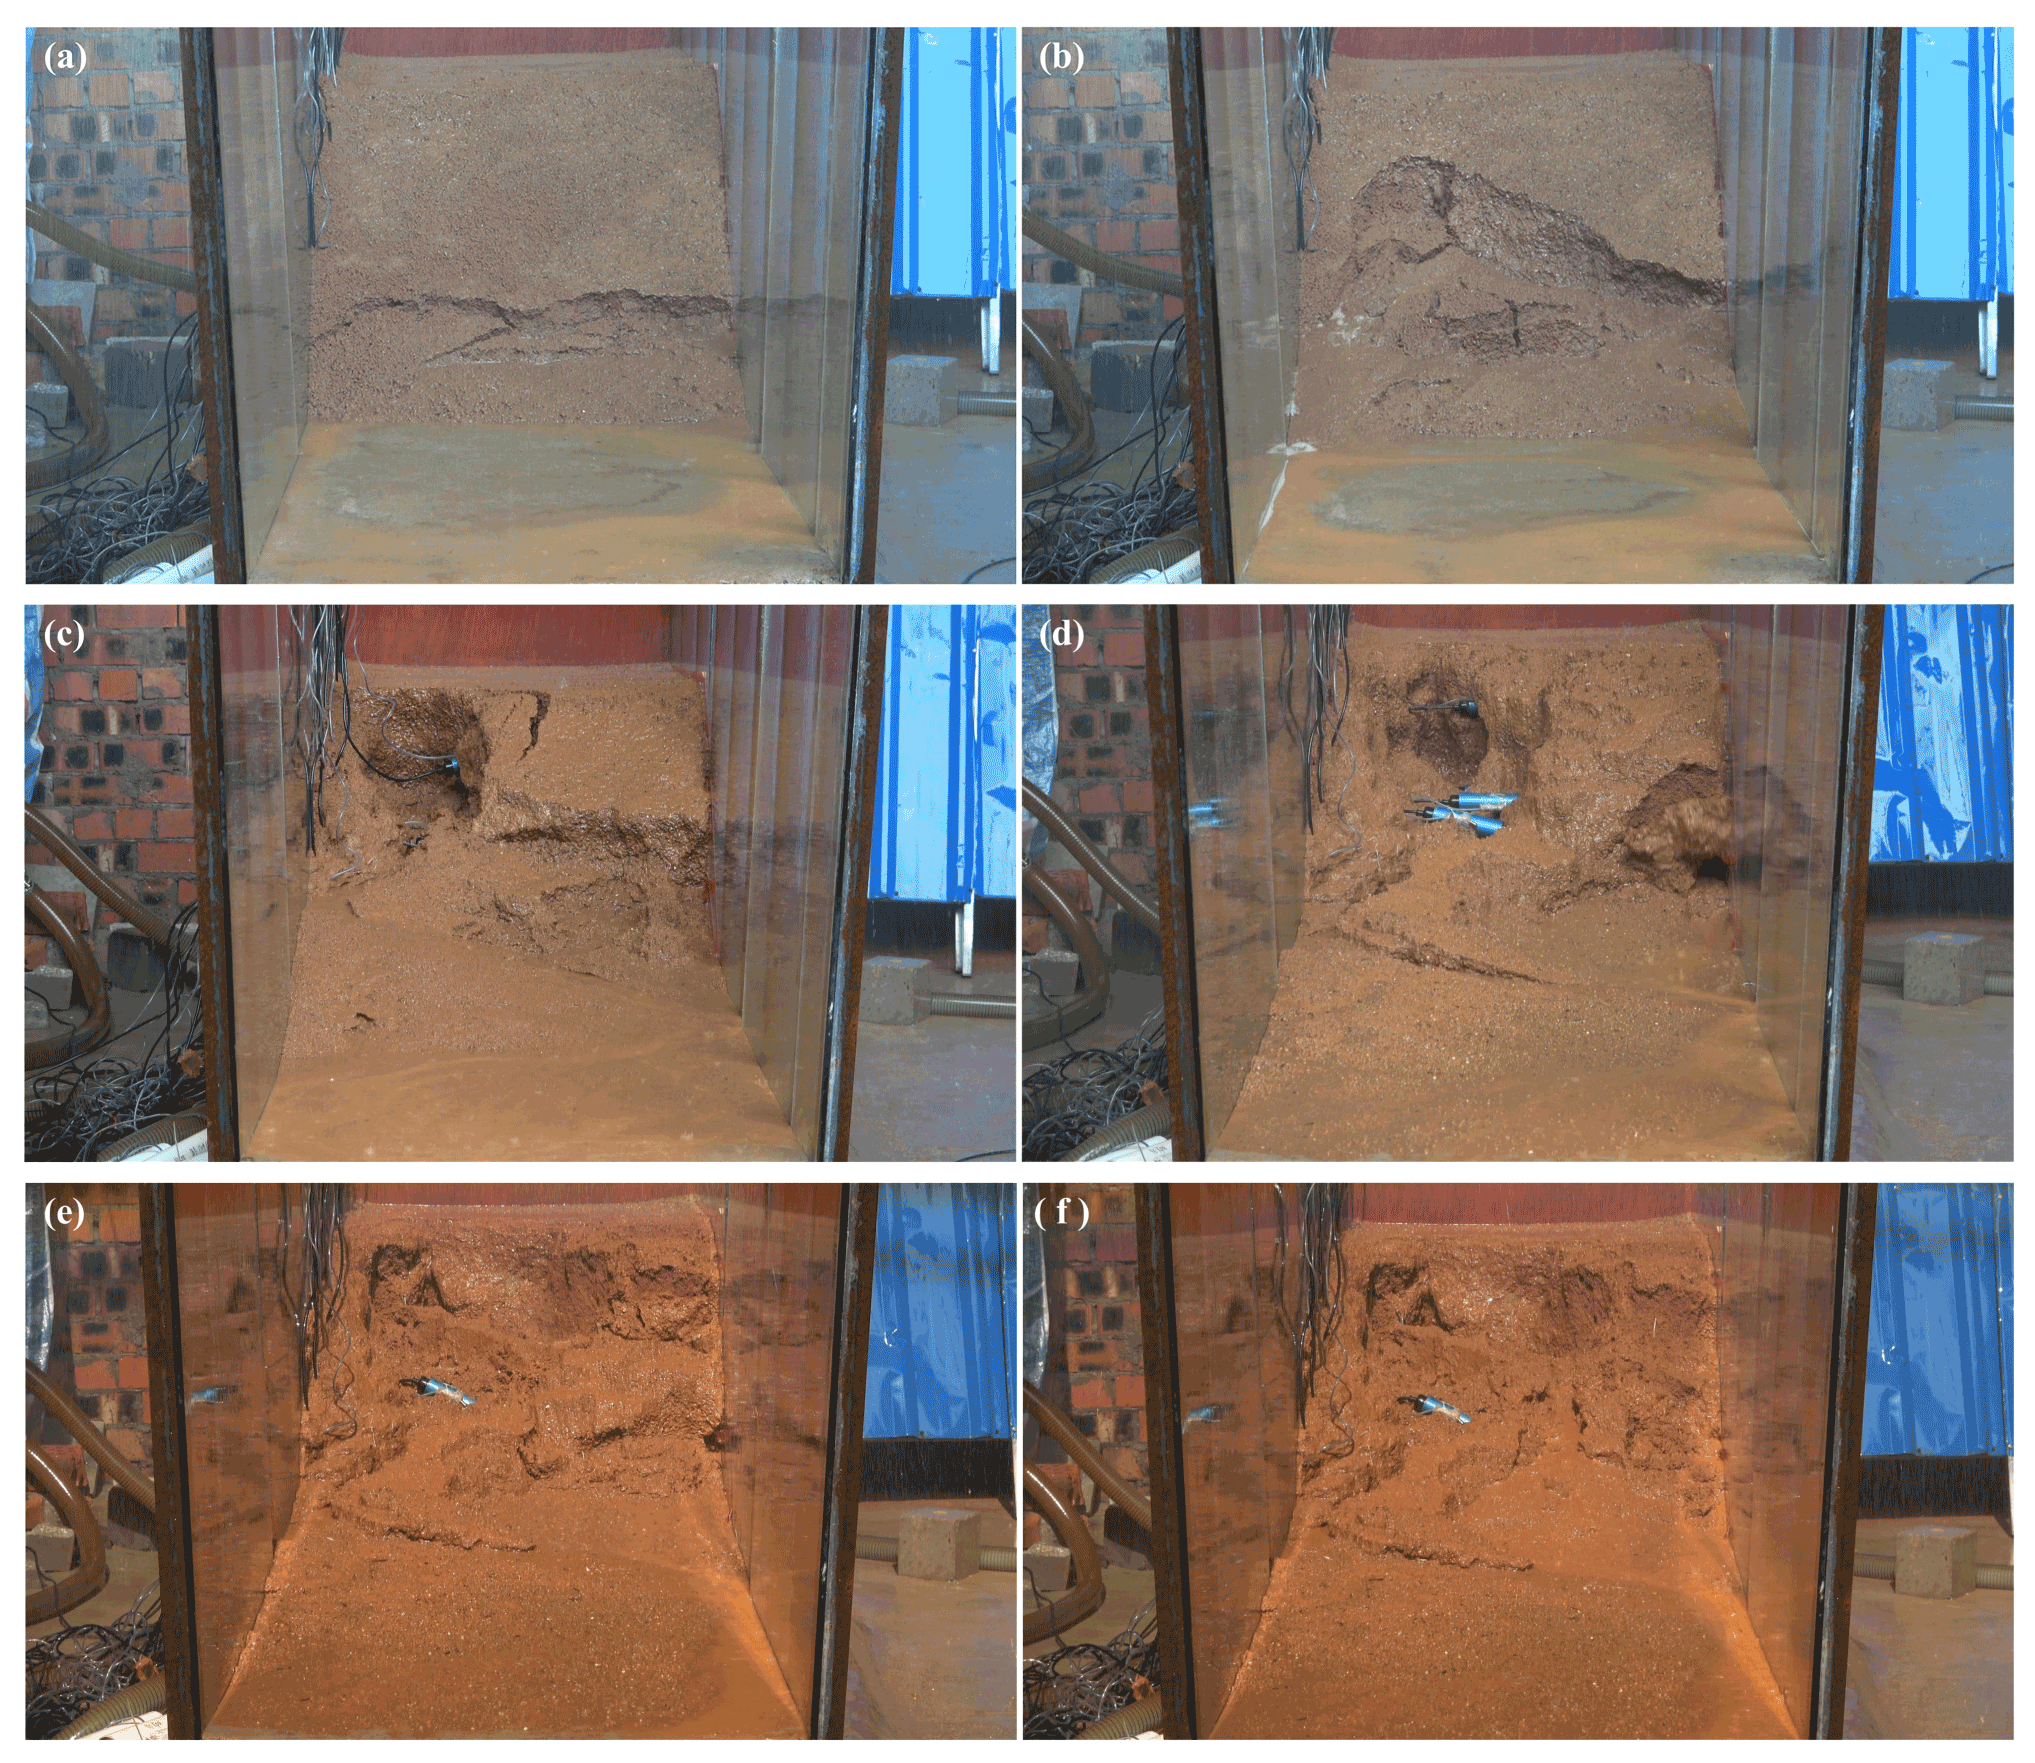
Figure 5Typical phenomena of test 3. (a) The soil at the slope toe begins to slip after tensile cracks appear. (b) The soil in the middle slope slides. (c) The soil on the slope shoulder slips owing to unbalance internal forces. (d) Blocky soil slides suddenly on the right slope toe. (e) Massive soil on the right slope shoulder slides due to the unloading effect of the slope toe. (f) The slope is stable at the end of the rainfall.
(4) Test 4
When the first rainfall lasts for 45 min, the soil on the left slope toe starts to slip. Muddy water flows from the area of sliding soil. When the rainfall lasts for 78 min, the area of instability of soil extends to the slope shoulder. However, only a small amount of soil on the right slope toe slips. During the second rainfall, the right slope is scoured away by rain, which results in a deep gully. When the rainfall lasts for 496 min, the soil on the right side of slope slips, but the slide scale is small. The slope is not completely destroyed.
(5) Test 5
When the first rain lasts for 26 min, the soil on the right foot begins to slide. The failure range extends to the middle of slope as the rainfall continues. At the same time, rainfall gravity leads to the formation of low-lying areas. When the rainfall duration is 208 min, the sunken area becomes larger and the soil at the slope toe has basically slipped. When the second rainfall lasts for 766 min, the low-lying areas are connected and a steep-free surface is formed. Subsequently, the soil at the slope toe continues to slide. In the third rainfall, a small number of soil slips. However, there is no significant change in the slope eventually.
(6) Test 6
When the rainfall lasts for 5 min, tensile cracks occur at the slope toe, resulting in the soil failure. When the rainfall lasts for 27 min, the failure range extends to the shoulder of the slope. Subsequently, massive soil on the free surface slides from time to time. When the rainfall lasts for 96 min, the soil in the middle of slope begins to slip, causing the exposure of sensor no. 7. When the rainfall lasts for 133 min, the soil on the left slope shoulder begins to slide. The slope begins to be sinking. When the rainfall lasts for 220 min, the soil on the right slope toe continues to slide. The failure area extends to the middle of the slope as the rainfall continues. At the end of the rainfall, the soil on the right slope shoulder remains stable.
3.2 Volume moisture content
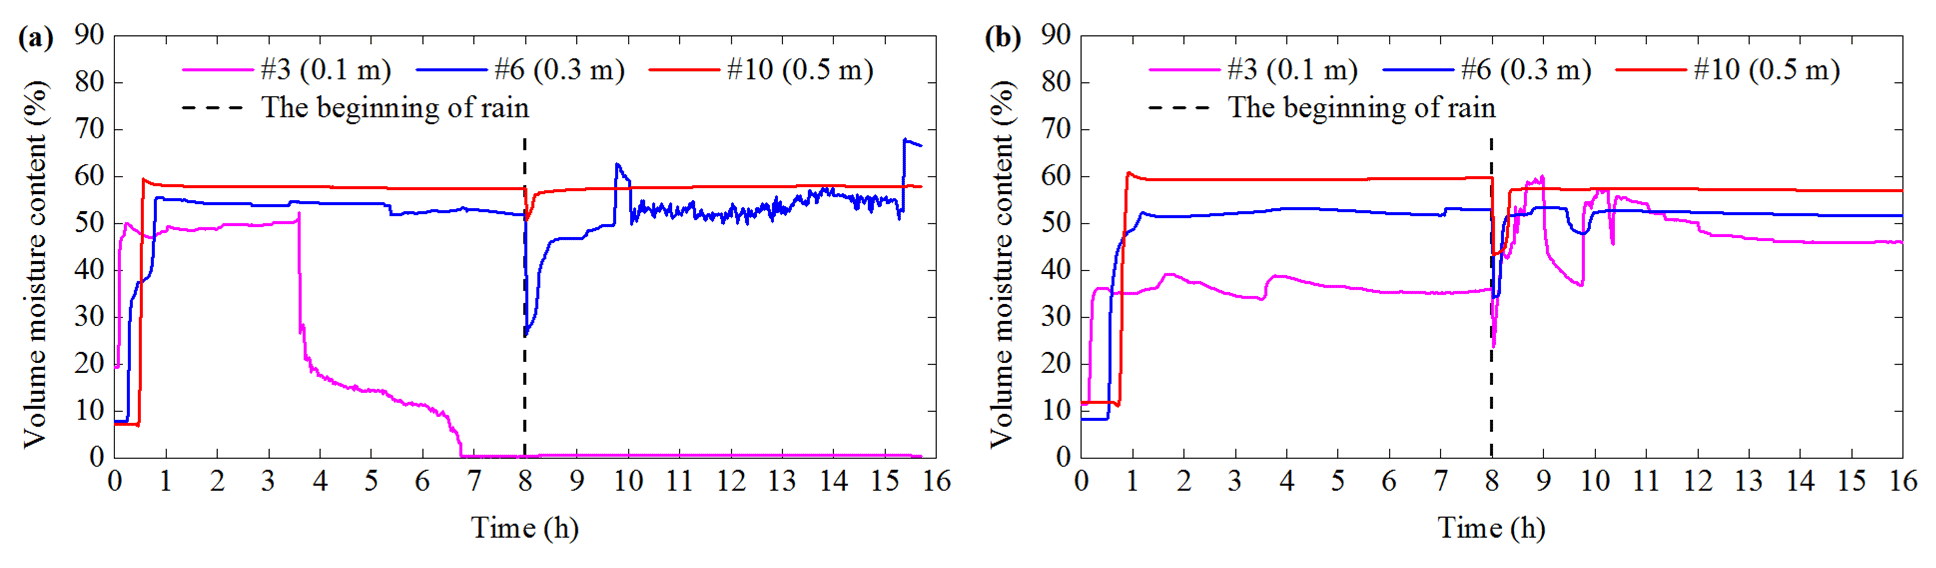
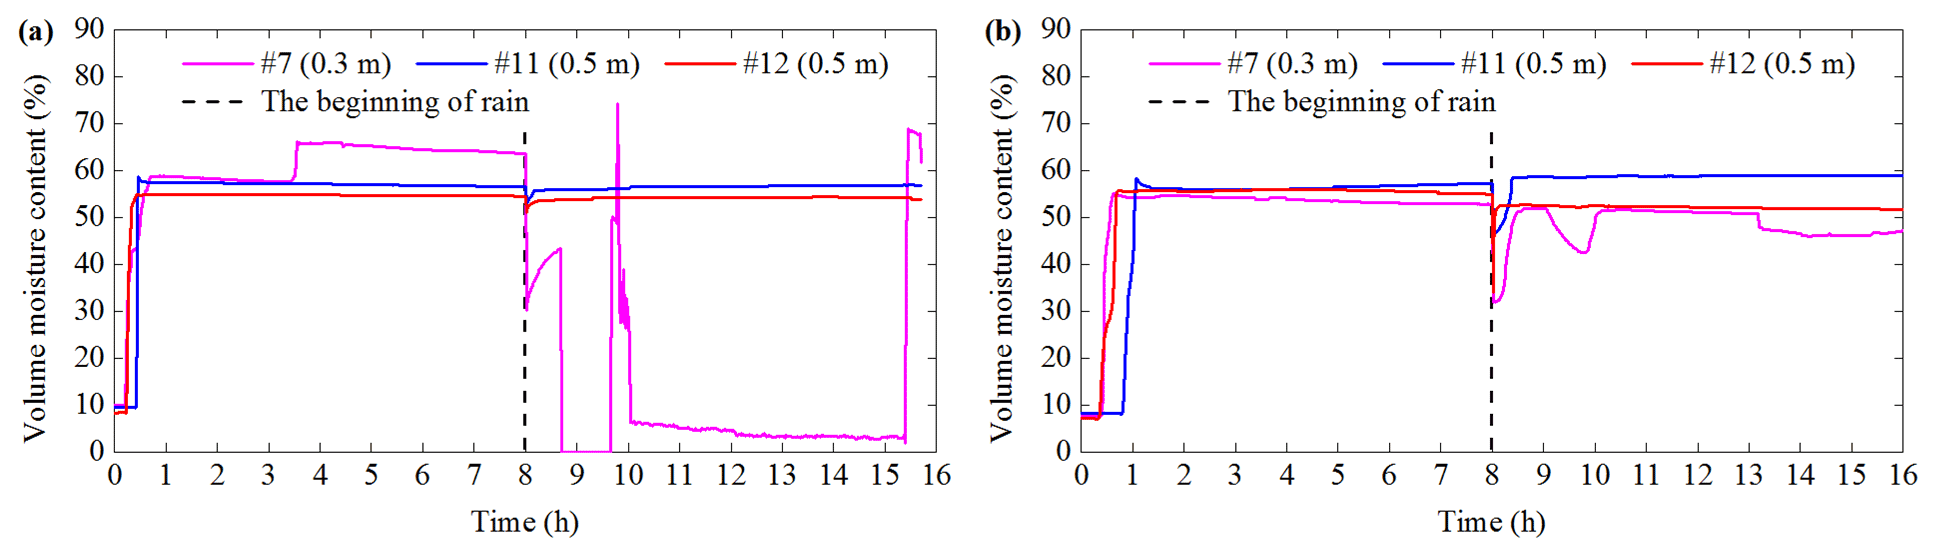
A–E inside the flume model represents the crest, shoulder, middle and foot of the slope respectively. The variation characteristics of the volume moisture content (VMC) at A, B and C are relatively similar. Therefore, the VMC of C is selected in the paper to indicate a general trend. In addition, the three positions (C, D and E) are close to the sliding surface. Thus, the data of these three positions are analyzed in this section and shown in Figs. 6–11. The general variation of VMC mainly consists of three stages: initial constant, significant increase and stability. When the monitoring depth of the same position increases from 0.1 to 0.5 m, the response time of VMC is delayed, and the stable VMC increases. It is attributed to the rainwater infiltration process and its accumulation. In addition, VMC is reduced due to water evaporation during the interval between two rainfall periods. This phenomenon is particularly obvious for soils with a depth of 0.1–0.3 m. VMC can be restored to the previous level or an even higher value in subsequent rain.
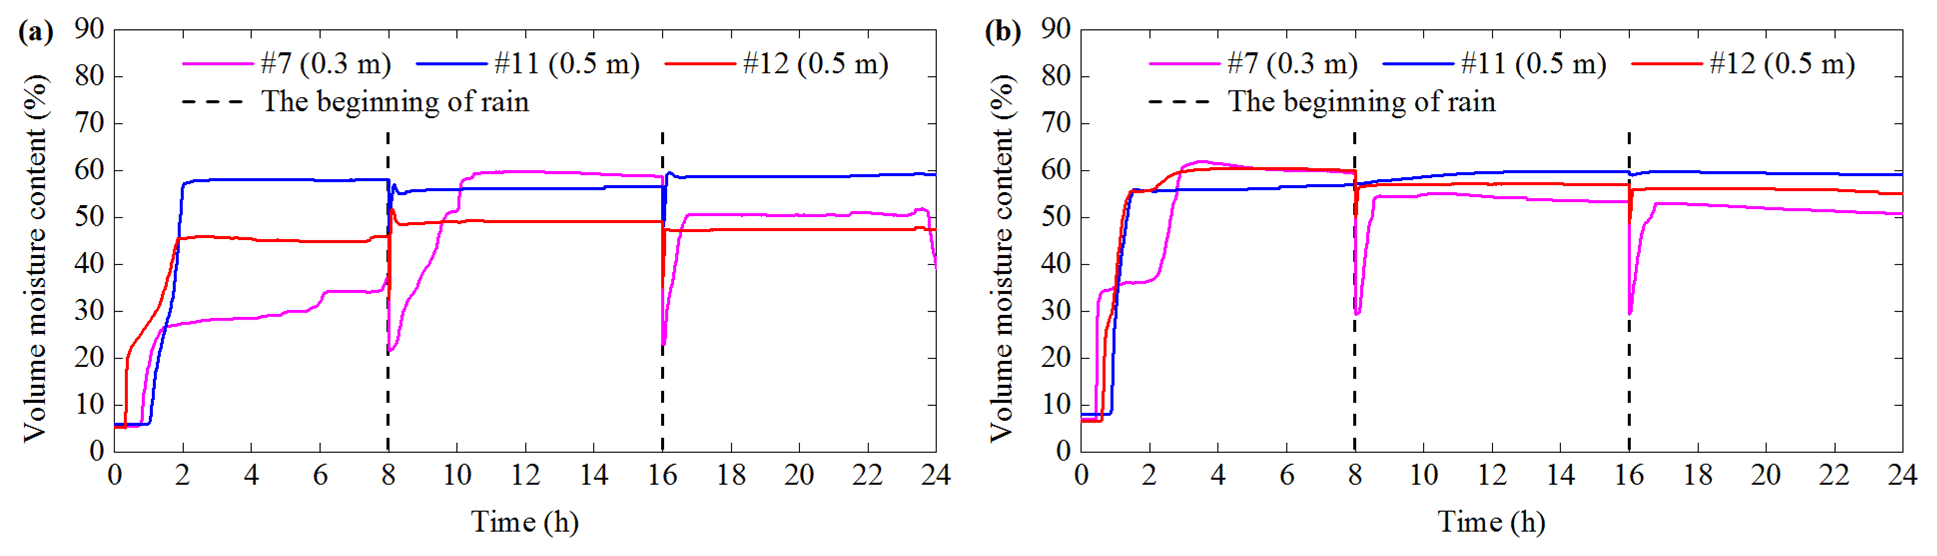
Figures 6 and 7 shows the differences of VMC between test 1 and test 2 as follows. (1) When the monitoring depth of position C is 0.1 and 0.3 m, the stable VMC of test 1 is smaller than that of test 2. The main reason is that the capacity of soil to store water can be enhanced as initial dry density (IDD) increases (Lu et al., 2018). (2) The VMC of three depths in position C of test 2 is similar. However, the VMC between three depths of test 1 has a great difference. It is especially noticeable in the first rain. (3) When the depth is 0.5 m, the VMC of the slope foot in test 1 is significantly smaller than that of the slope middle, but the VMC at these two locations is similar in test 2.

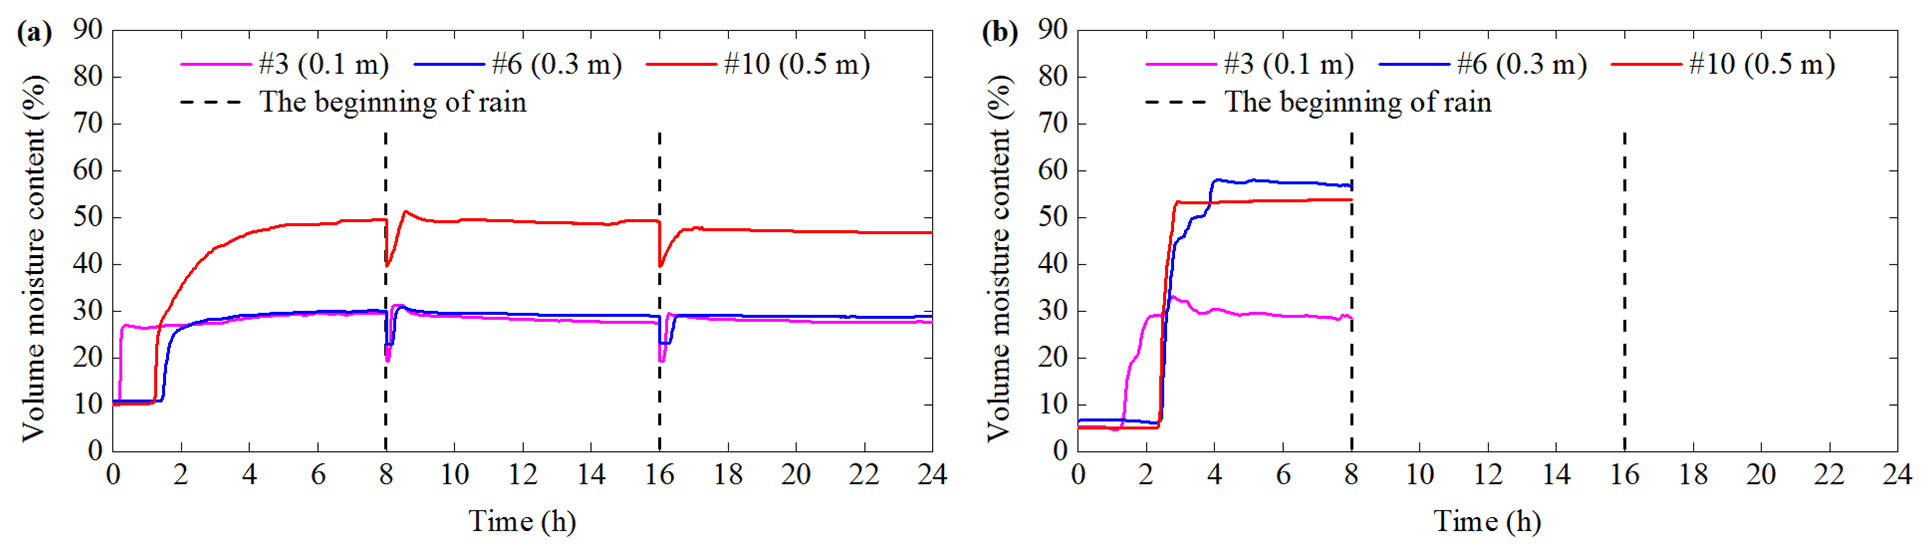
The VMC of test 3 and test 4 is shown in Figs. 8 and 9. The response time of VMC of test 3 is shorter than that of test 4 at the same location. The reason is that the increase of IDD results in the weakening of rain infiltration (Lee et al., 2005). The VMC at a depth of 0.1 m in test 3 decreases sharply and eventually becomes zero in the first rain (Fig. 8a). This is due to the soil sliding causing the third sensor to deviate from its original position. In addition, the VMC at a depth of 0.3 m in C and D of test 3 fluctuates significantly (Figs. 8a and 9a). The macroscopic phenomena in Sect. 3.1 indicate that the time of the soil failure is basically corresponding to the fluctuation time. Thus, the fluctuation is attributed to the soil failure. The maintenance of the water pipe causes a short water stop. Hence, VMC fluctuates at the beginning of the second rainfall in test 4 (Figs. 8b and 9b).
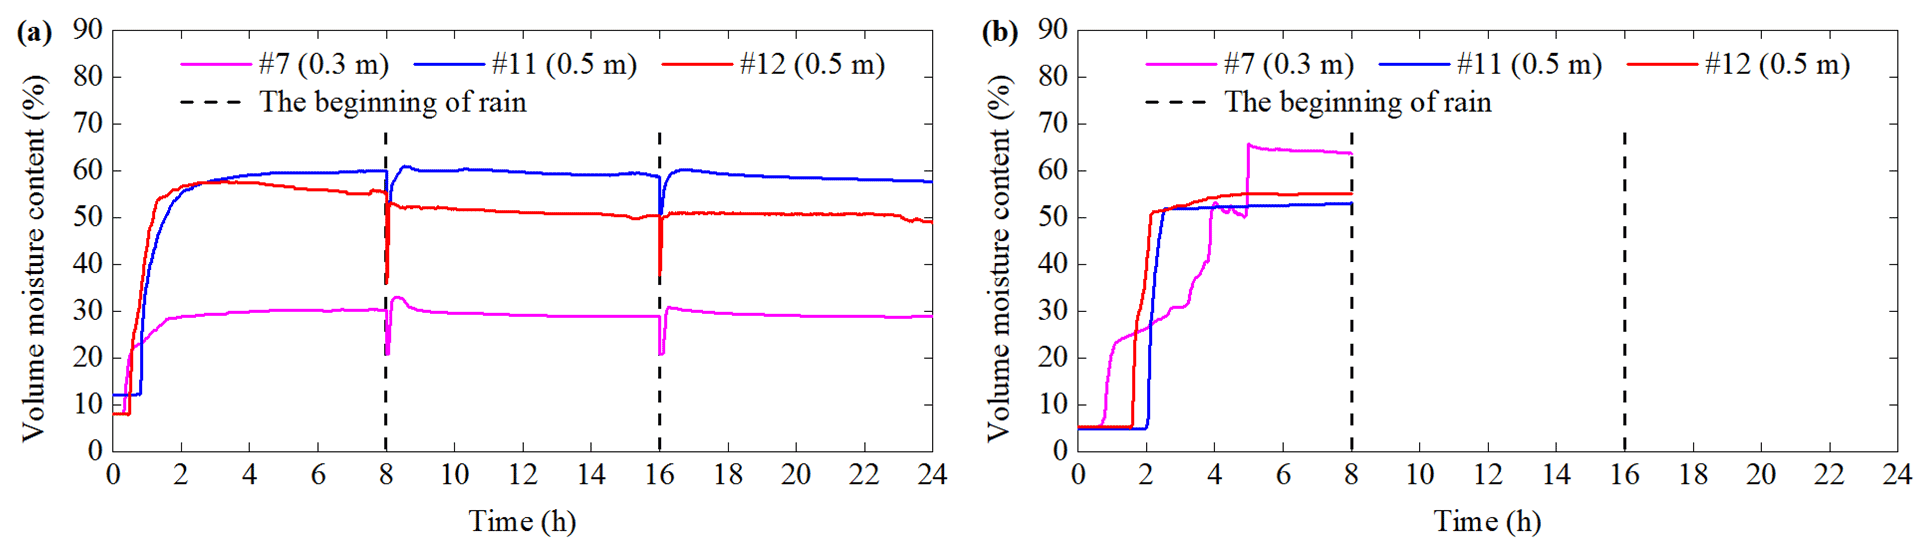
The VMC of test 5 and test 6 is shown in Figs. 10 and 11. When the rainfall intensity increases from 60 to 90 mm h−1, the stable value of VMC of test 5 is less than that of test 6. However, the VMC in test 6 has a longer response time than that in test 5. It is obvious in the slope crest, such as at position C. Worth noting in Sect. 3.1 is that the sliding time of test 6 is earlier than that in test 5. The main reasons of the above abnormal phenomena are include three aspects. One is that when the rainfall intensity is relative larger, more rainwater can penetrate the soil quickly. The shallow layer can be saturated rapidly. This process can cause silt and clay to migrate vertically and accumulate at a certain depth (Fang et al., 2012). Subsequently, the microstructure of soil is changed (Chen et al., 2018), and the infiltration path is blocked by the fine particles. Furthermore, rainwater cannot infiltrate the soil smoothly and causes the long response time of VMC at the slope crest. The other is that rainfall infiltration can cause a difference in water pressure between the slope crest and the slope foot; this effect of seepage force will cause the slope foot to slide first (Zhou et al., 2014). In test 5 and test 6, the soil failures are both found in the slope foot at the beginning of rainfall. It is consistent with the research carried out by Zhou et al. (2014). This local deformation of the slope can cause internal force unbalance and soil microstructure change. The rainfall infiltration will be affected later (Chang et al., 2021). On the other hand, the tensile crack of the slope toe can provide a preferential path of rainwater. It is the main reason for the relative early sliding time in test 6. However, sensor no. 12 cannot observe this data because it is not located under the crack.
Figure 12 shows the response time and stable VMC at five positions during the first rainfall. In Fig. 12, test 1 and test 2 are compared as are test 3 and test 4. The similar result is that when an IDD increases from 1.20 to 1.40 g cm−3, the response time of VMC at the same location is delayed. However, this similarity does not apply to position D. The reason is that the local soil sliding is found in the shallow layer in position D of test 2. It can lead to the decrease in the part of the soil thickness. Thus, the position D of test 2 affected by the rainfall is earlier than that of test 1.
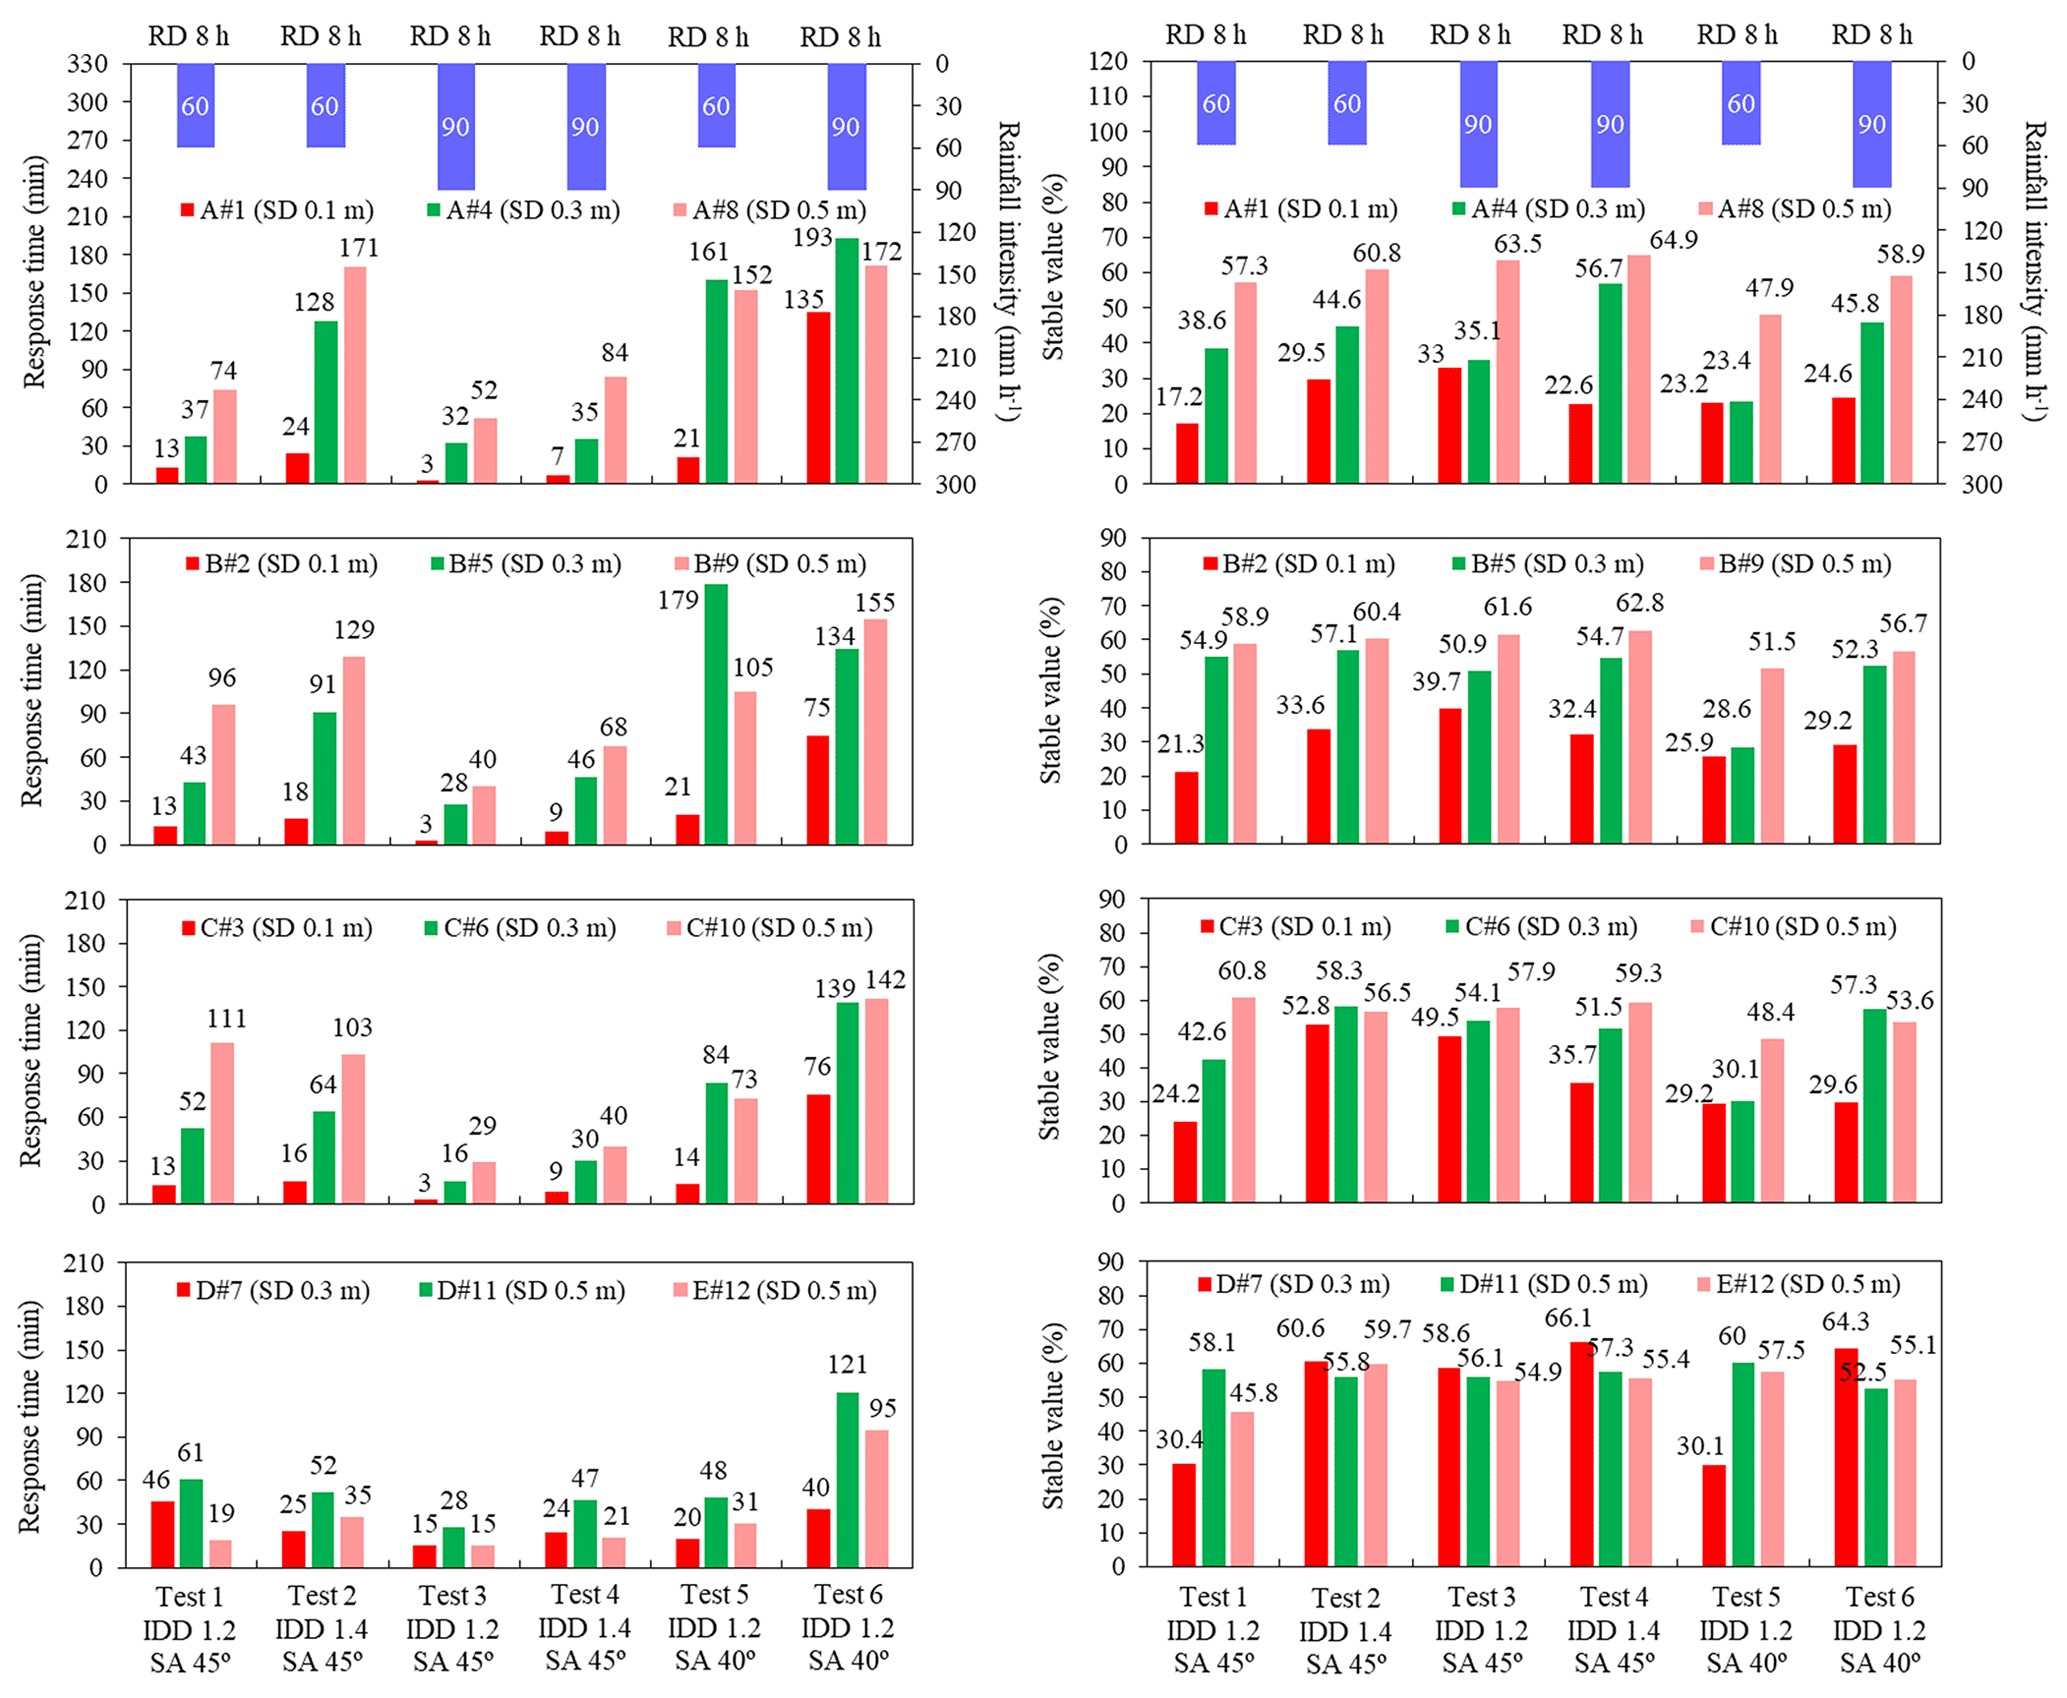
Figure 12Response time and stable value of volume moisture content in six tests during the first rainfall. In this bar chart, IDD represents initial dry density, SA represents slope angle, SD represents sensor depth, and RD represents rainfall duration.
The stable VMC with an IDD of 1.20 g cm−3 is smaller than that of 1.40 g cm−3. It is suitable for most of the depths of test 1 to test 4. The abnormal points include as follows: the depth of 0.5 m at C and D of test 1 and test 2; the depth of 0.1 m at A, B and C; and the depth of 0.3 m at C of test 3 and test 4. This is due to the difference in soil–water action during rainfall. When rainfall intensity is 60 mm h−1, all the rainwater can percolate through the soil with an IDD of 1.20 and 1.40 g cm−3. However, when rainfall intensity is 90 mm h−1 and an IDD is 1.40 g cm−3, the rainwater seepage capacity is less than 90 mm h−1. Subsequently, rainwater cannot completely penetrate the soil and surface runoff is formed. The slope is eroded by surface runoff; it can be found in the macroscopic phenomena of test 4. Therefore, even if the rainfall intensity is 90 mm h−1, the stable value of VMC is relative small. In addition, test 5 and test 6 have the same initial dry density, but the response time cannot decrease when the rainfall intensity is from 60 to 90 mm h−1. The reasons are mentioned in the previous paragraph.
3.3 Pore water pressure
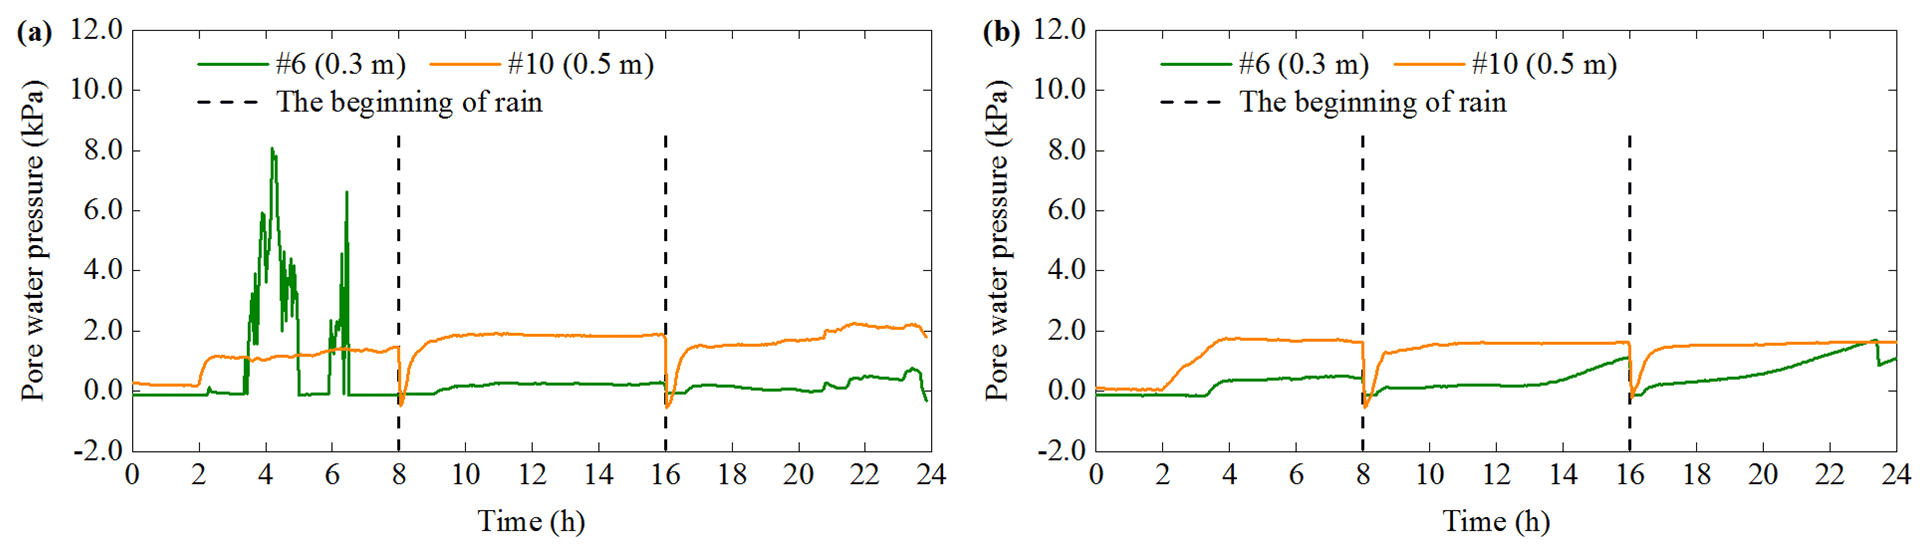
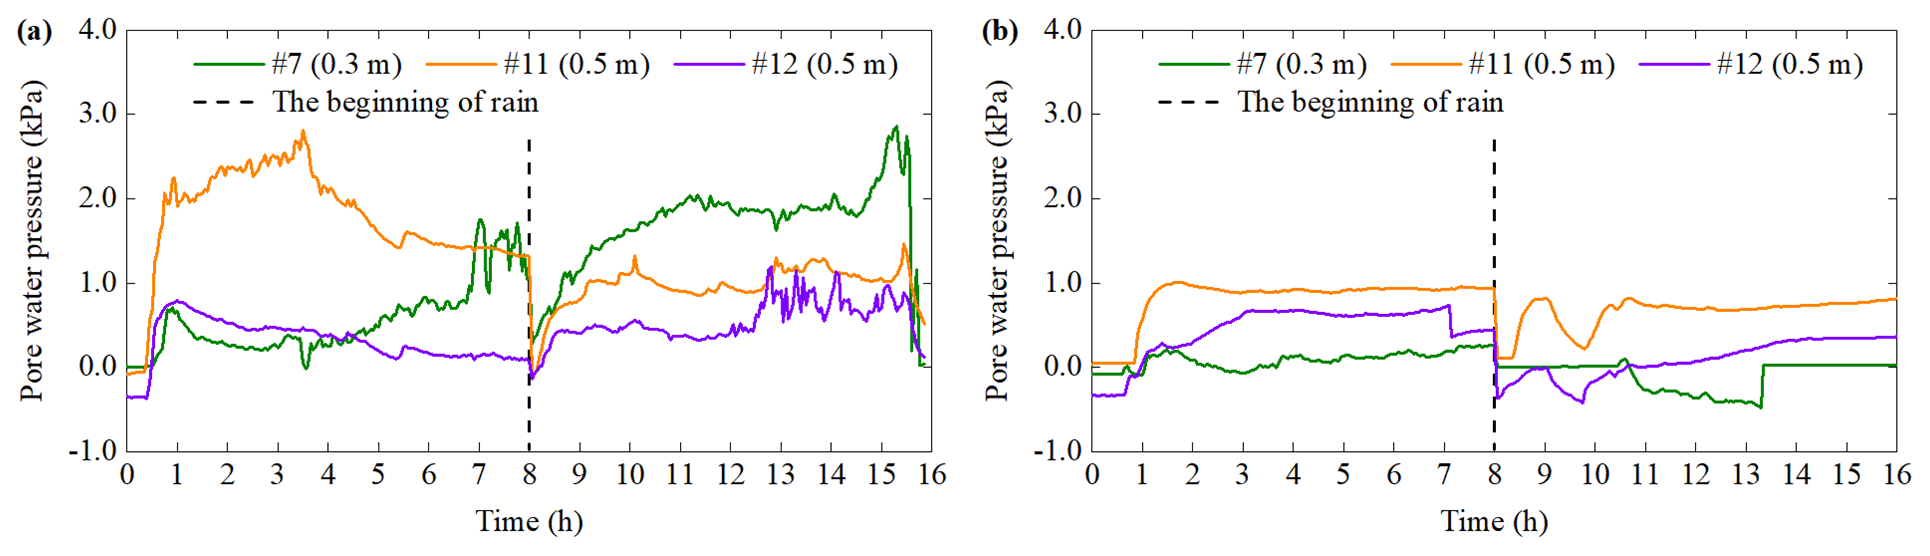
Pore water pressure (PWP) at three positions (C, D, E) is shown in Figs. 13–18. Sensor no. 3 of PWP in test 2 and test 4 breaks down, and it deviates from its original position in test 3. Thus, the PWP of sensor no. 3 are not analyzed in this section. The variation of PWP consists of three similar parts: stability, significant increase and dynamic fluctuation. Some differences between these tests can be clarified. In test 1, the PWP at a depth of 0.3 m at C fluctuates drastically during the first rain. However, the PWP of test 2 does not fluctuate, and its variation is smaller than that in test 1 (Fig. 13). In addition, the PWP with a depth of 0.3 m at D varies gently in test 1, but it increases significantly during the second and third rain in test 2. The fluctuation occurs at a depth of 0.5 m at D in test 1 (Fig. 14). The changes of PWP and VMC are not synchronized, which manifests in two aspects. One is the response time of PWP is later than that of VMC. The other is that VMC is in a stable stage when PWP fluctuates.
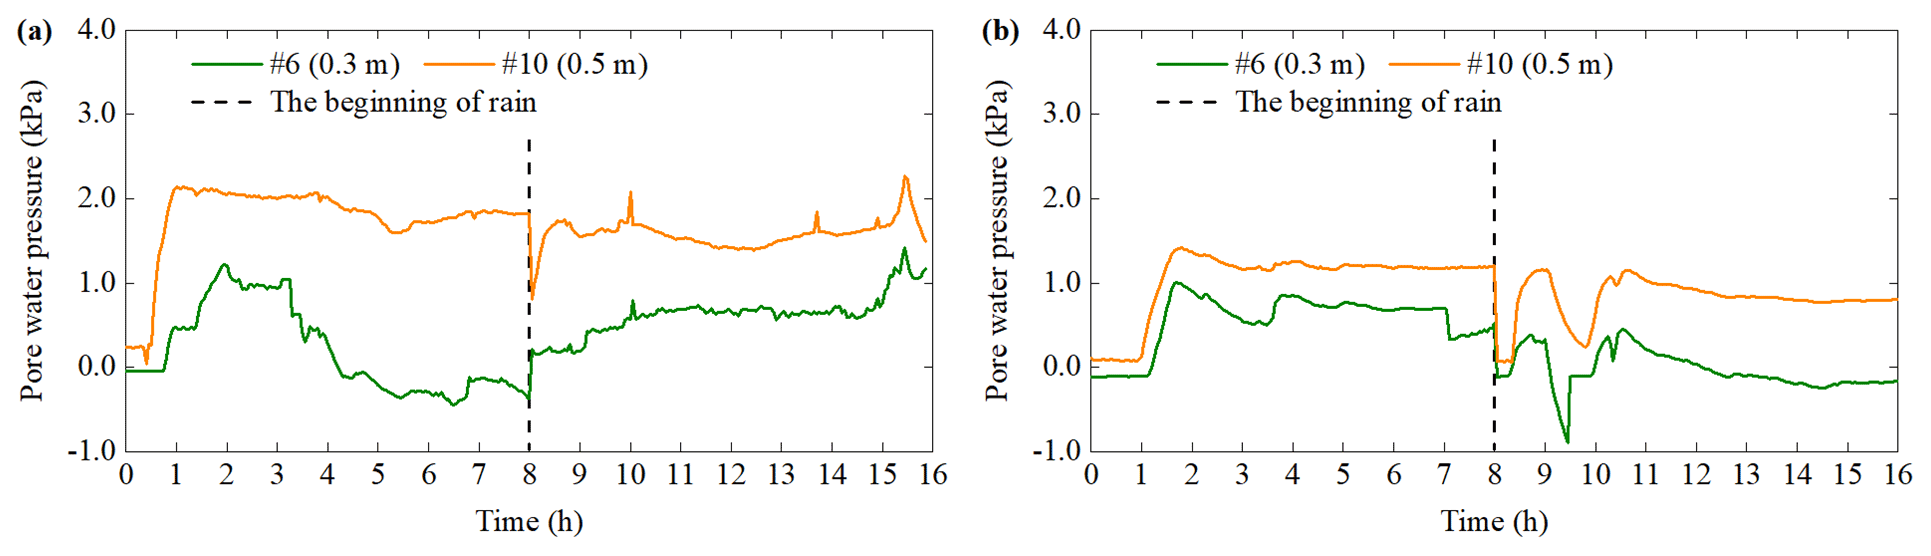
In the first rainfall, the PWP response time of test 3 is shorter than that of test 4 at the same location (Figs. 15 and 16). The difference in the response time is consistent with that in VMC. It directly reflects the soil seepage capacity when an IDD is 1.20 and 1.40 g cm−3 respectively. Besides, the frequent fluctuation of PWP mostly appears in test 3. In particular, the PWP in test 3 is decreasing after increasing at the most locations except for the depth of 0.5 m of D. This downward trend exists at position C of test 4 but is not significant at D and E.
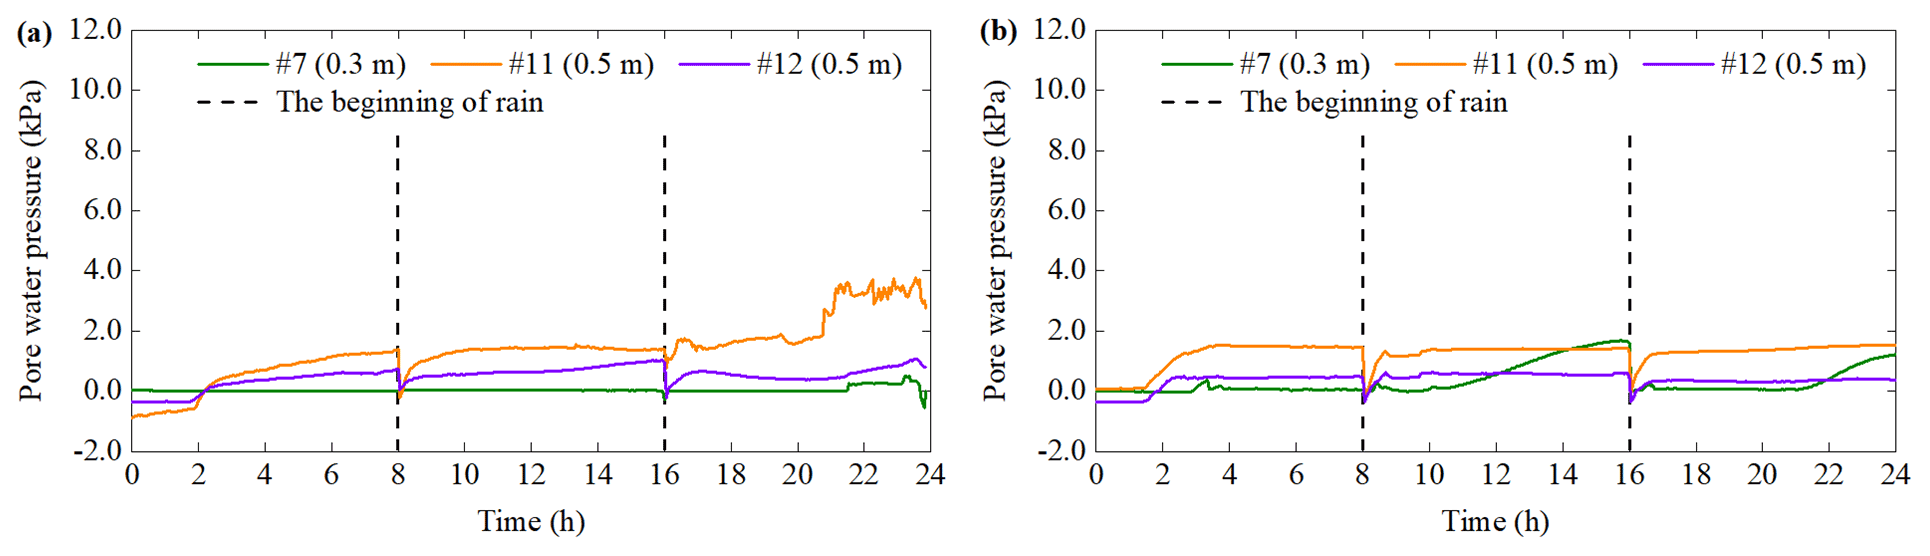
Figures 17 and 18 show the differences between test 5 and test 6 during the first rainfall. One is that the PWP curve at C in test 5 is flat. However, all the PWP in test 6 experiences the flat, increase and decrease stages. The other is that the PWP at E in test 5 has an obvious volatility characteristic. It fluctuates to the peak at the end of the first rain, whereas the PWP at E in test 6 has a downward trend after it reaches the peak. This opposite trend is related to the differences between the soil failures of these two tests. Soil sliding can cause stress to relax, which further results in an increase in soil porosity. It will induce pore water pressure to decrease. When rainwater is enough, pore water pressure can be restored.
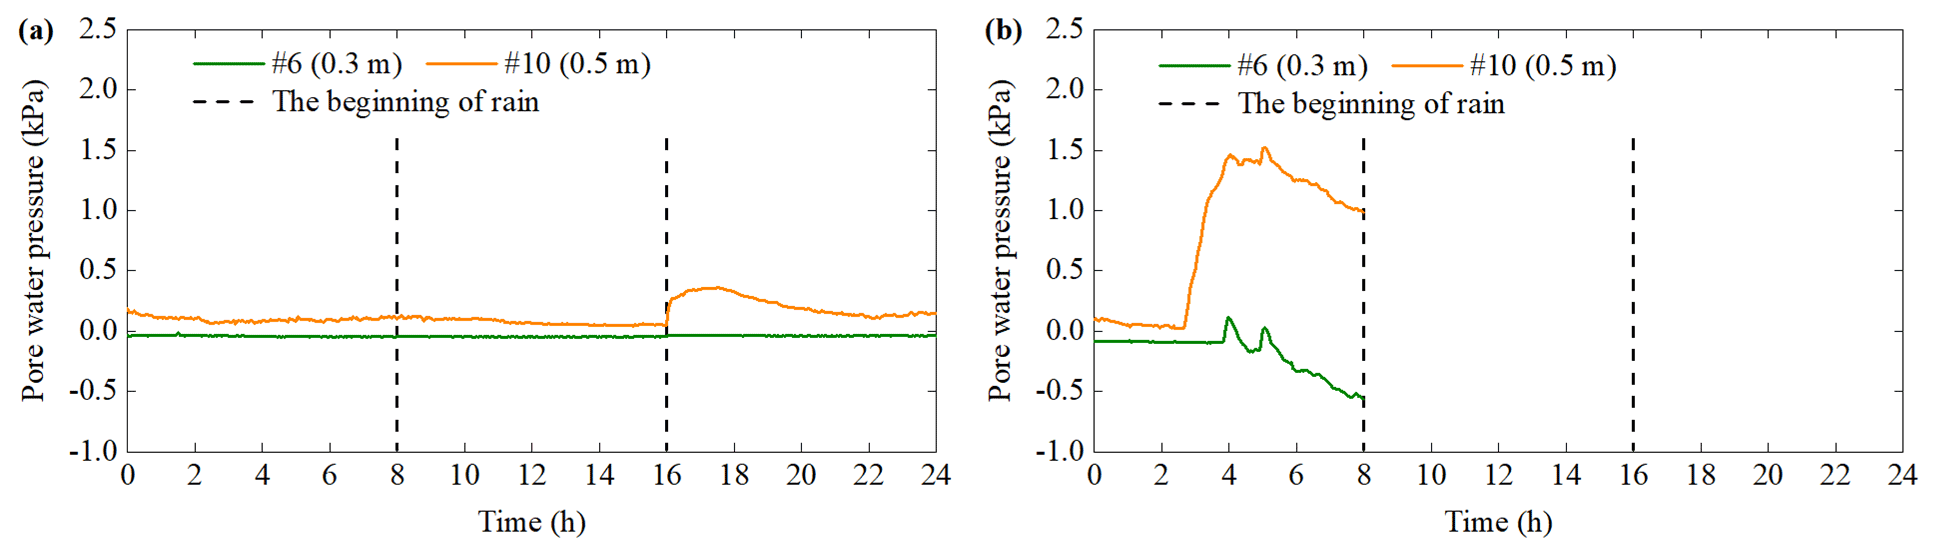

Figure 19 shows the response time and variation of PWP at five positions during the first rainfall. In Fig. 19, test 1 and test 2 are compared as are test 3 and test 4. The main commonality is that when the location and rainfall duration is same, the response time of PWP with an IDD of 1.20 g cm−3 is shorter than that of 1.40 g cm−3. Nonetheless, most of the variation in PWP has a contrary pattern. The reason is that even if the rainfall intensity is the same, the slope with different density has diverse hydrological characteristics (Lan et al., 2003). For example, slopes with high density have relatively low permeability and the change in PWP is limited. A significant difference is that although PWP change of the surface soil layer at each position is the smallest except for test 3, the PWP changes of other two depths do not increase with the increase of depth. The reasons are analyzed as follows. When the rainwater accumulates at a depth of 0.3 m, the PWP variation is relative large. At this moment, the PWP with a depth of 0.3 m can be larger than that of 0.5 m. The continuous seepage can cause soil gravity to increase. It can produce the compressive stress on the soil layer at a depth of 0.5 m. The further decrease in soil porosity can cause PWP to increase. At the same time, if the soil with a depth of 0.3 m begins to slide, PWP will be released. Therefore, in these conditions, the PWP with a depth of 0.5 m may be larger than that of 0.3 m. It suggests that changes in PWP depend on soil deformation and its diffusion. This validates the study by Iverson et al. (1997).
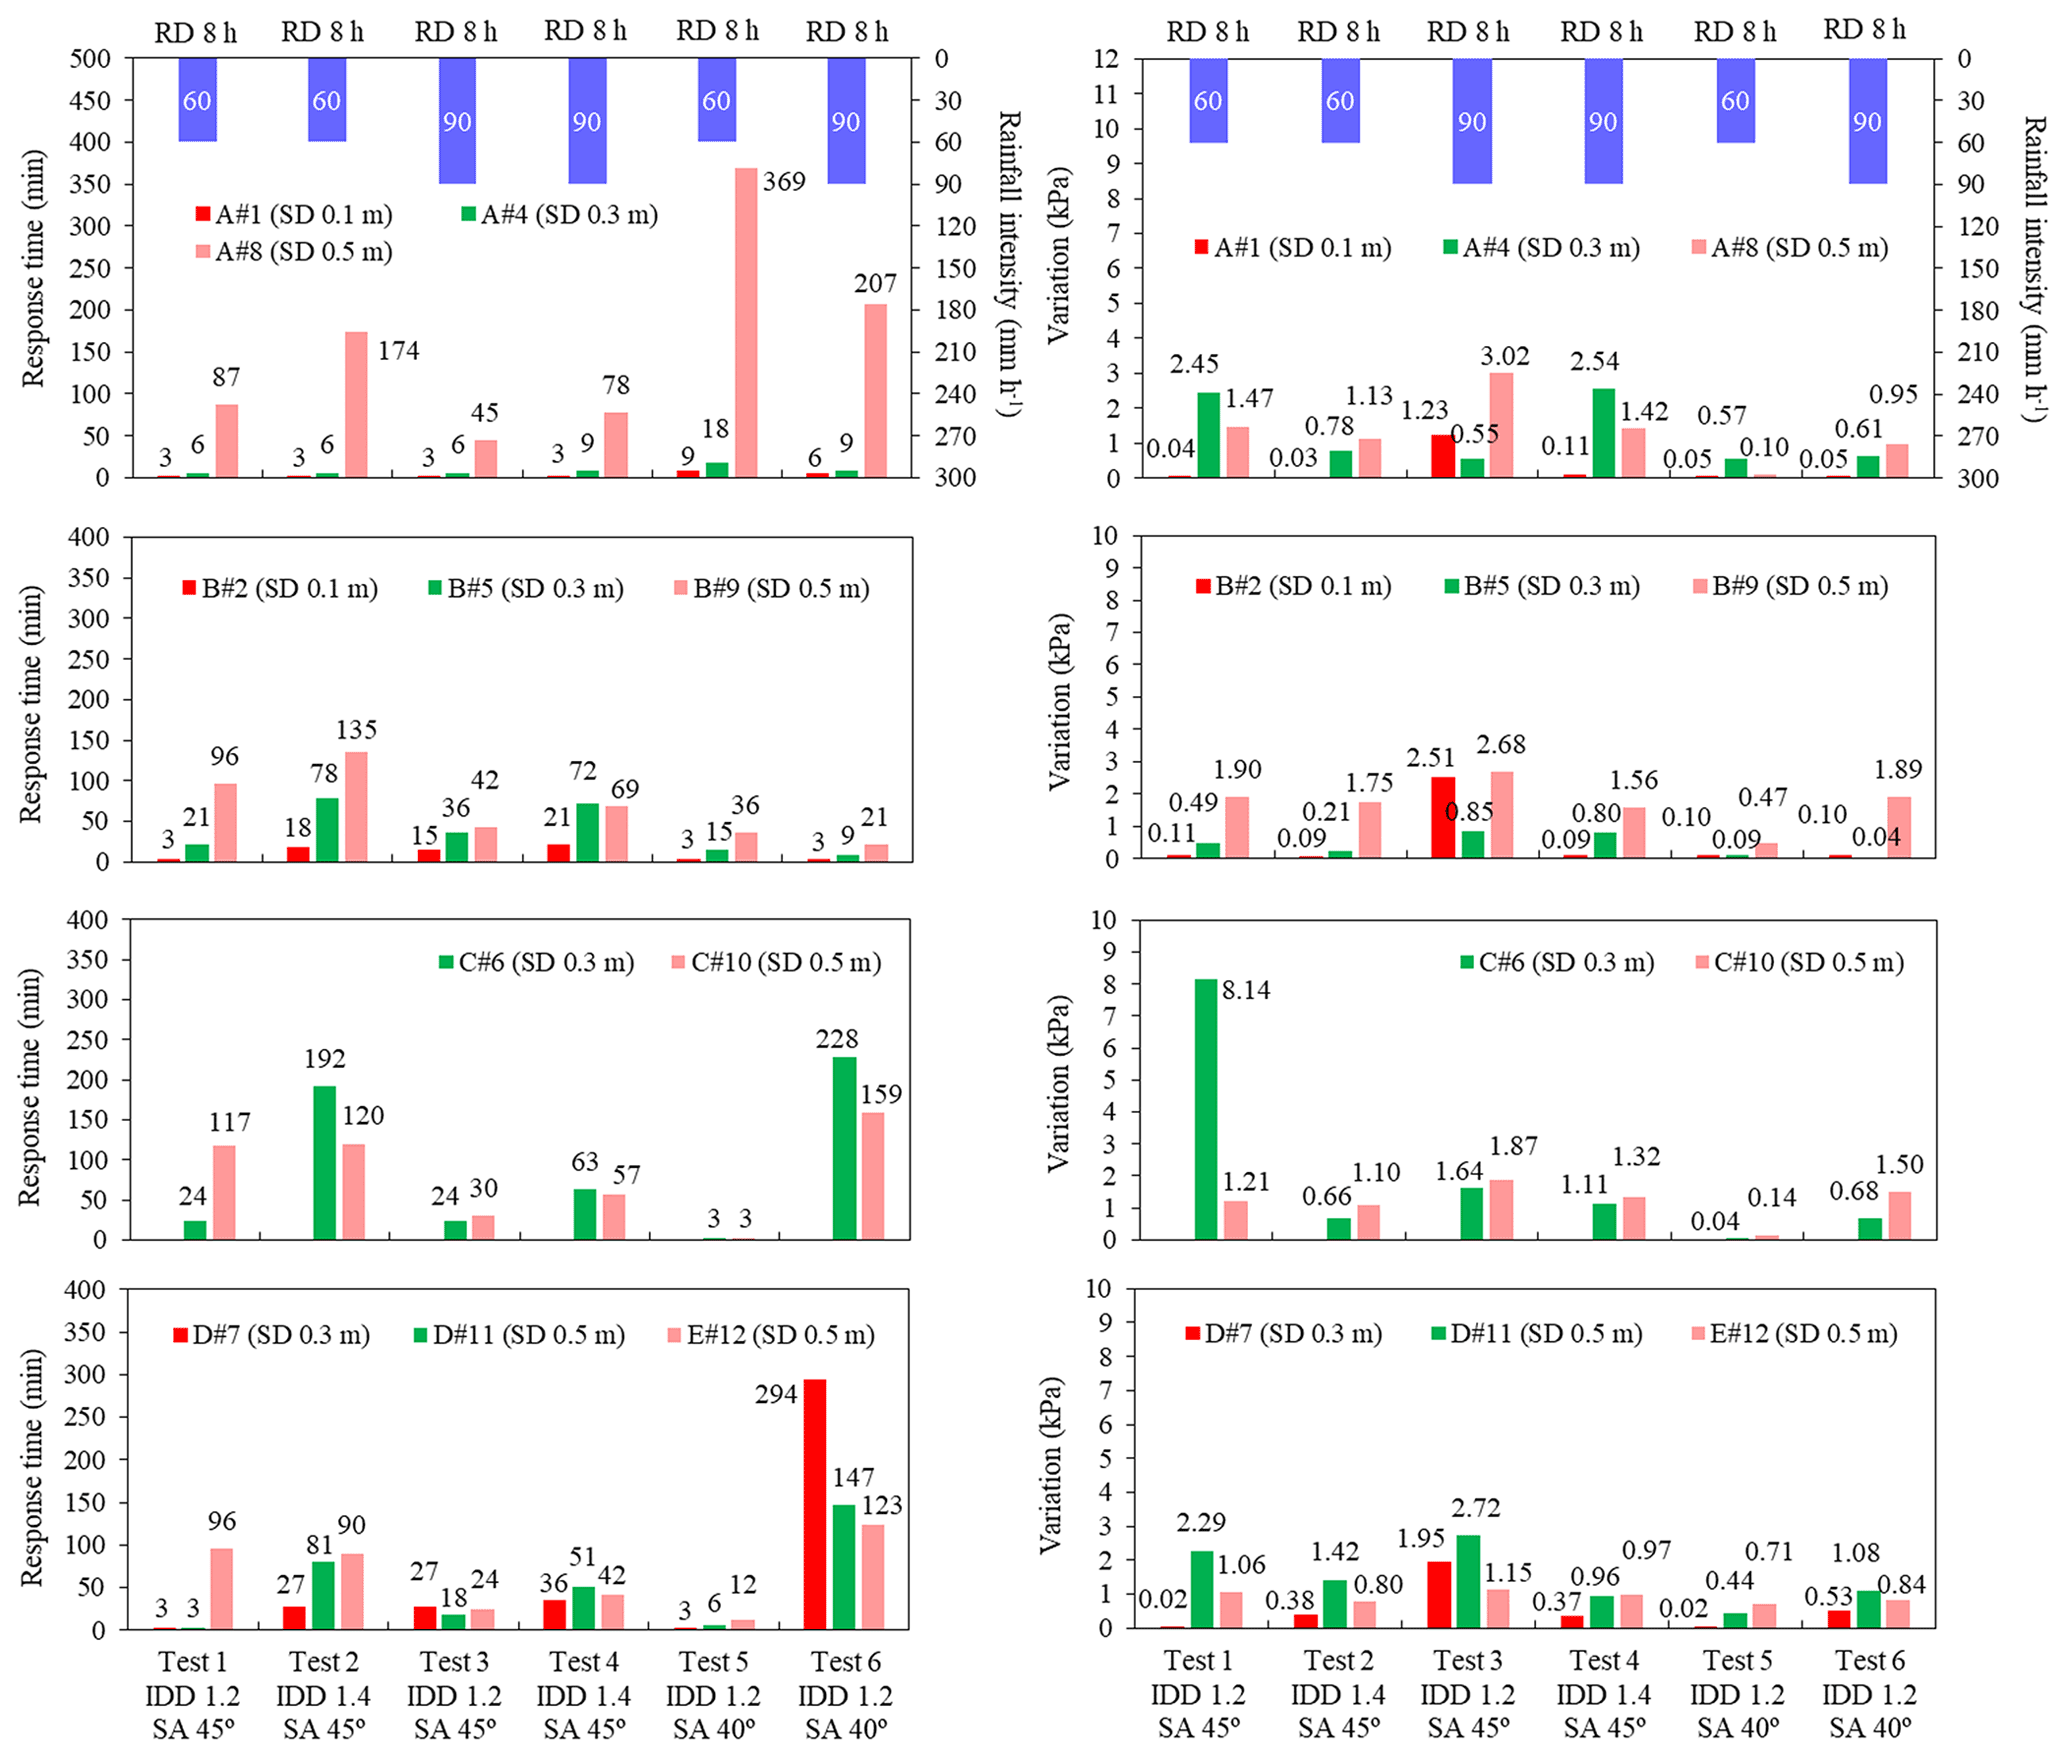
Figure 19Response time and variation of pore water pressure in six tests during the first rainfall. In this bar chart, IDD represents initial dry density, SA represents slope angle, SD represents sensor depth and RD represents rainfall duration.
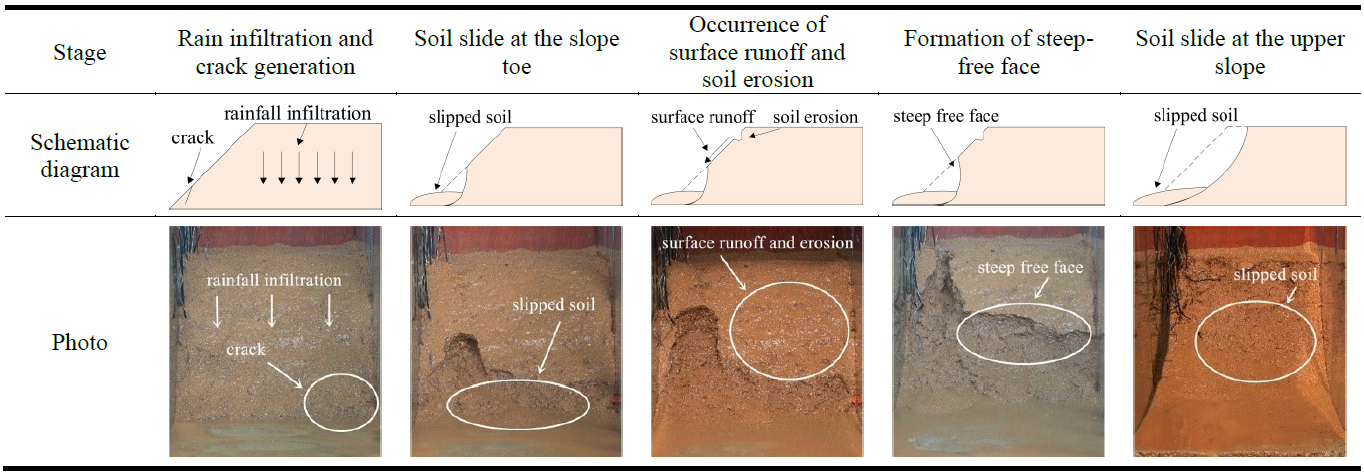
Six model tests have commonness in the patterns of slope failure based on the macroscopic phenomena. Based on these tests, the landslide formation can be classified into five stages and are shown in Table 2. They are basically consistent with the results of the field survey in southeastern Guangxi (Wei et al., 2017). Therefore, the initiation processes of granite residual soil landslides can be reproduced by flume model tests.
- i.
Rain infiltration and crack generation. At the beginning of rainfall, all rainwater can seep into the slope. There is no surface runoff on the slope. Volume moisture content begins to increase. However, matrix suction decreases, which results in the reduction of shear strength. In addition, the gravity load of the slope increases and favors the downward creep. The differential distribution of soil strength can cause cracks to generate at the slope toe, which provide a preferential path for rainwater.
- ii.
Soil slide at the slope toe. As rainfall continues, rainwater penetrates the soil through the crack. The accumulated rainwater in the crack can produce the pressure acting on the slope. It facilitates the propagation of the crack. Hence, the soil strength around the crack decreases. Meanwhile, the underground runoff converges at the toe of the slope. The VMC at the slope toe is relative large. The water pressure's difference between the top and toe of the slope increases. This difference in pressure and changes in the soil microstructure can lead to a reduction in the shear strength of the slope. Therefore, the soil at the foot of the slope softens and slides first. Subsequently, muddy water gradually flows out from the slope toe. This indicates that fine particles migrate through subsurface runoff, causing changes in the microstructure of some soils along the flow network.
- iii.
Occurrence of surface runoff and soil erosion. The water content of the shallow soil layer increases to a saturation value with the continuing rain. A saturation zone appears. This process allows fine particles to migrate vertically to a certain depth. Subsequently, the infiltration path will be blocked, and rainwater cannot permeate the soil smoothly. The surface runoff gradually forms. On the other hand, the gravel of the soil remains on the slope surface, which is conductive to seepage along the slope. Therefore, subsurface runoff can lead to the loss of the surface layer soil. Multiple low-lying areas and ditches are generated by the erosion of surface runoff and splash erosion of rainfall. The erosion destruction is most serious in the slope toe and the slope middle.
- iv.
Formation of steep-free surface. As the soil at the foot of the slope continues to slide, the geometry and stress of the slope have changed due to the removal of downward support. Even the internal force balance of the slope is destroyed. The unstable range expands to the surroundings. A steep-free surface begins to form subsequently. However, the soil on the top of the slope has not slipped.
- v.
Soil slide at the upper slope. The presence of macro-pores between the gravel can promote the rainwater penetration through the soil. This process facilitates the rainwater transmission to a deep layer. The sliding force of the slope can be further improved. Meanwhile, the unbalance internal forces gradually increase due to the repeat slide of the slope toe. Besides, the increase of PWP leads to a reduction in the effective stress and shearing strength. Finally, when the sliding force is greater than the soil resistance, the soil at the slope top begins to slide. Obvious shear deformation is formed.
One difference between the six tests is the time of landslide initiation (Table 3). Six initiation times are 50, 67, 32, 45, 26 and 5 min respectively. When the slope angle and rainfall intensity are the same, the initiation time of a landslide with a density of 1.20 g cm−3 is shorter than that of a landslide with a density of 1.40 g cm−3. The difference is 17 and 13 min. The reason is that when the IDD increases, the slope permeability decreases (Lan et al., 2003) and the infiltration process is relative slow. Therefore, the slope needs more penetration time. This corresponds to the difference of the response time of VMC in Sect. 3.2. In Sect. 3.2, when an IDD increases from 1.20 to 1.40 g cm−3, the response time of VMC and PWP is delayed. The decrease rate of the shearing strength is correspondingly slow. This is beneficial to the stability of the slope. When the slope angle and density are the same, the initiation time of a landslide with the rainfall intensity of 90 mm h−1 is 18–22 min shorter than that of a landslide with the rainfall intensity of 60 mm h−1. The reason is that when the rainfall intensity is relative larger, more rainwater can penetrate the soil quickly. This leads to a rapid increase in VMC and PWP in shallow soil layers. The shearing strength decreases. At this time, the difference of water pressure between the slope toe and the slope crest is obvious, which results in the first soil sliding at the slope toe. Meanwhile, when the IDD is 1.20 g cm−3, the rainfall intensity is 60 and 90 mm h−1; if a slope angle increases from 40 to 45∘, the starting time can be delayed by 24 and 27 min. This is because steep slopes are not conducive to infiltration of rainwater (Xu et al., 2018). Hence, the VMC and PWP respond to rainfall slowly, which is favorable to slope stability. In a word, the initiation time of landslide is closely related to density, slope angle and rainfall intensity. It is mainly controlled by the hydrological response of the slope.

The other difference in six tests is the failure mode and process of landslide. In test 1, all the surface soil slips, and the frequent sliding soil is in the shape of a block. In test 2, the sliding area slowly spreads to the surroundings, and the partial right shoulder fails to slide eventually. In test 3, the soil around the crack slides quickly and all the soil on the slope surface is destroyed. In test 4, the scouring action of rain results in the formation of a deep gully, but the slope has stabilized finally. In test 5, the low-lying areas are enlarged with the continuous rainfall, and all the soil at the slope toe slips suddenly. In test 6, the soil surrounding crack slide rapidly, and the soil failure is repetitive. The abovementioned macroscopic phenomenon contains two main characteristics. When the IDD is 1.20 g cm−3, tensile crack is an important triggering factor for soil failure and the formation process of landslide is relatively sudden and large in scale. When the IDD is 1.40 g cm−3, the soil failure of the slope foot can trigger the trailing edge slip. Therefore, the sliding process is gradual and small-scale, often accompanied by the appearance of low-lying areas and ditches. The main reason is the energy required for the destruction of large density is significantly greater than that of small density (Xu et al., 2018). Hence, the formation process of landslide is different due to the initial state of the slope.
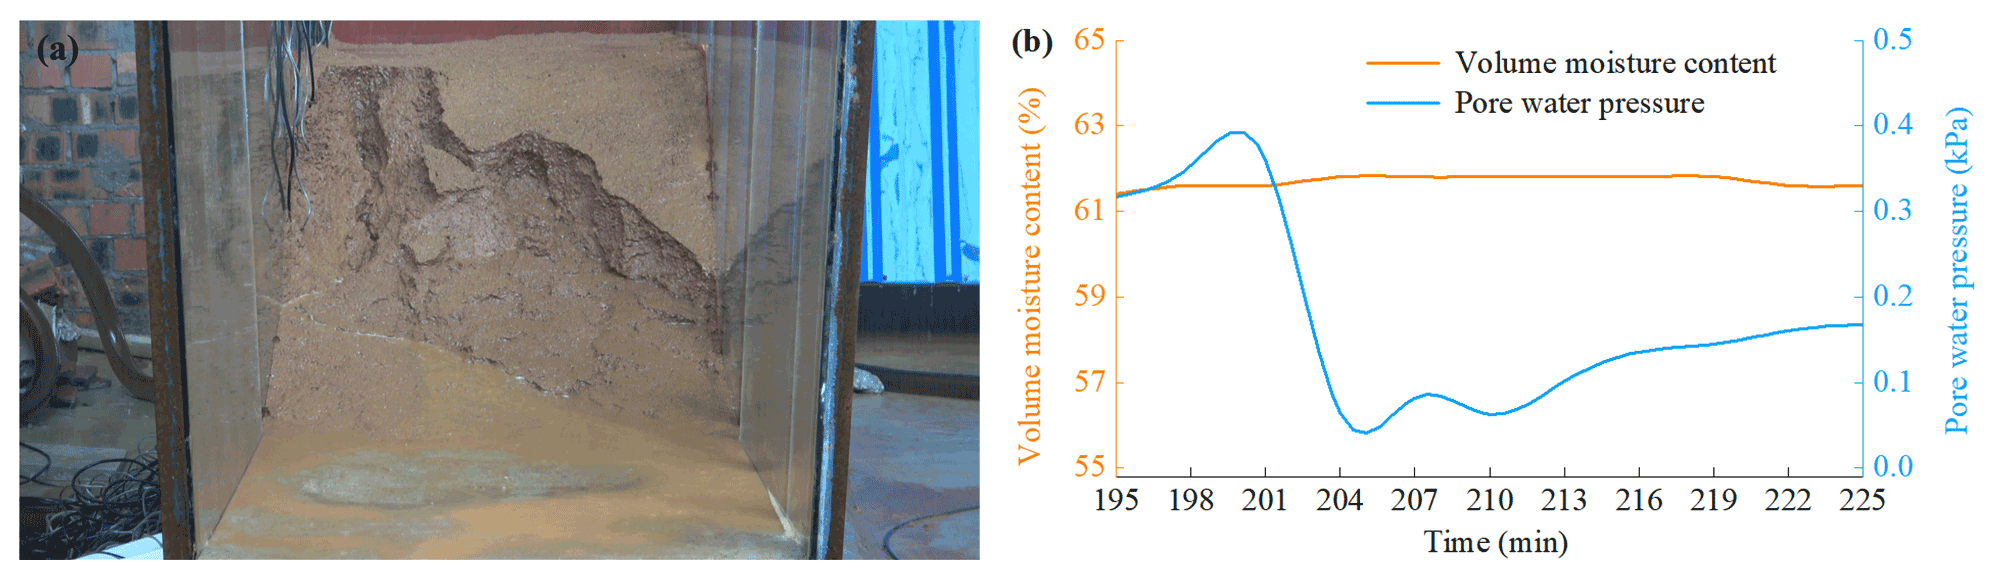
Figure 20Typical phenomenon and result with an initial dry density of 1.40 g cm−3. (a) Slope failure. (b) Results for sensor no. 7 closest to sliding surface.
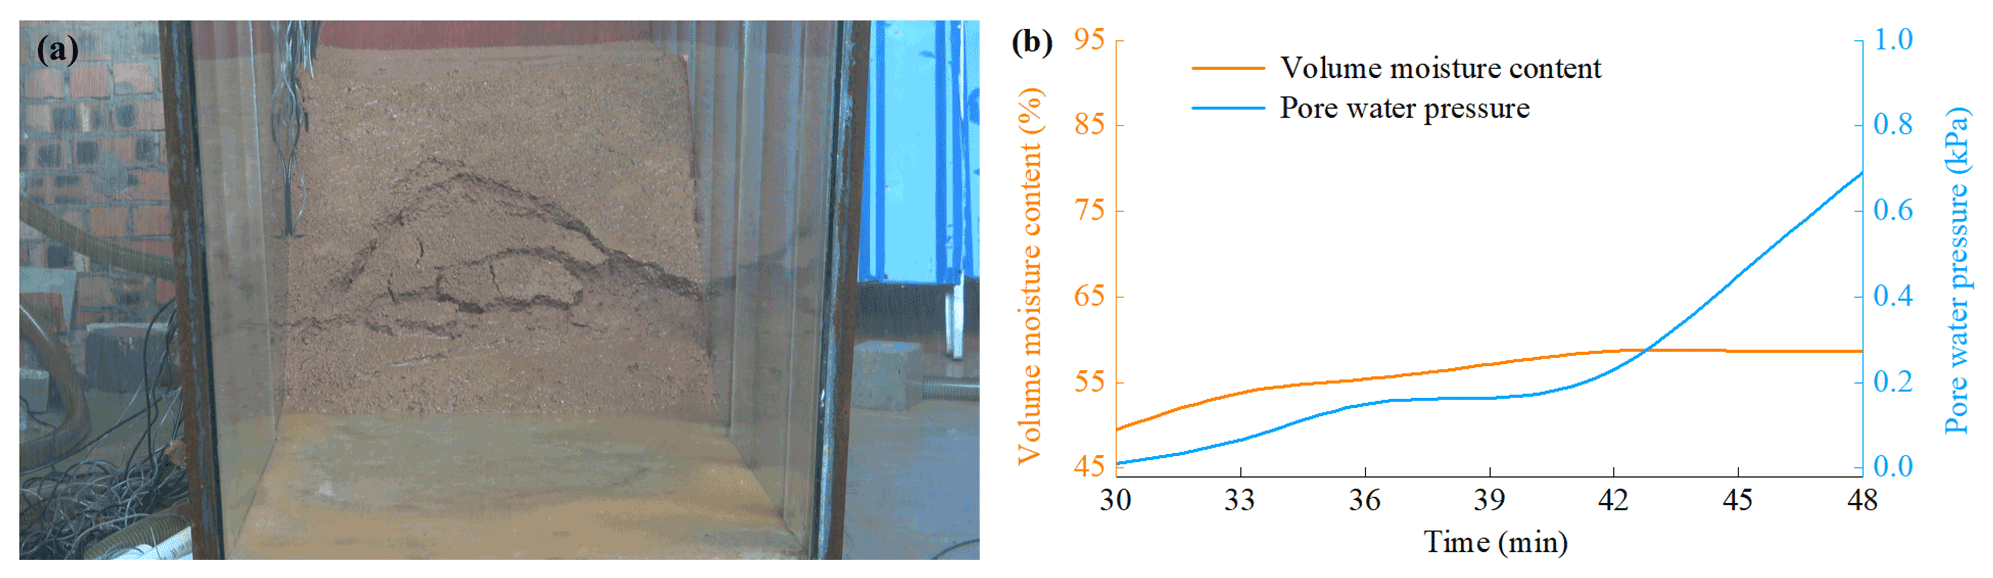
Figure 21Typical phenomenon and result with an initial dry density of 1.20 g cm−3. (a) Slope failure. (b) Results of sensor no. 7 closest to sliding surface.
Section 3.3 shows that the pore water pressure fluctuates significantly during the soil failure. However, the variation of pore water pressure at the same position and depth is not synchronized with the water content. The typical periods of test 2 and the test 3 are selected in this section to understand the relationship between them. In test 2 with an IDD of 1.40 g cm−3, when the rainfall lasts for 195–225 min, the soil in the slope middle slides. It promotes the development of cracks and causes massive soil to slide (Fig. 20a). The seventh sensor is the closest to unstable soil; thus, the data of this sensor are selected for detailed analysis. Figure 20b shows that the water content is stable at about 61.6 % during this period, and the soil is in an over-saturated state. However, pore water pressure gradually increases to a peak of 0.361 kPa when the rainfall duration is 195–201 min. Subsequently, pore water pressure decreases rapidly and maintains a certain degree of volatility. When the rainfall duration is 210 min, pore water pressure begins to increase again. In test 3 with an IDD of 1.20 g cm−3, when the rainfall lasts for 30–48 min, the shallow soil is softened and slides many times (Fig. 21a). Figure 21b shows that when the rainfall duration is 30–36 min, VMC and PWP both increases; when the rainfall lasts for 36 min, the increasing trend of them is relatively gentle; when the rainfall lasts for 42 min, although PWP increases rapidly again, VMC remains stable at 58.7 %. In a word, the differences in the variation of PWP and VMC comprise two aspects. One is that when VMC begins to increase, PWP is invariant. The response time of PWP is behind that of VMC. The other is that when VMC is constant or is in a significant rise, PWP has almost no change or only dramatic fluctuations. These may be related to mechanical behavior of granite residual soil.
The above results may be explained by the research made by Iverson (2005) and Iverson et al. (2000). He found that landslide mobilization was affected by the mechanical properties of shear bands that were related to the initial density. When dry density is low and rainfall intensity is high, the hammering effect of rain can squeeze the shallow soil. In addition, pore water pressure can increase due to the decrease in void ratio and leads to a reduction in shear strength. When the initial local shear deformation occurs, the shear zone is mainly contractive. Subsequently, excessive pore water pressure is generated. However, excess pore water pressure is difficult to dissipate completely in a short time. This condition can promote the continuous increase of pore water pressure and the connection of potential sliding surfaces. Therefore, the type of landslide failure is a sudden sliding type in the macroscopic phenomenon (Dai et al., 1999a, b; McKenna et al., 2011). When the dry density is larger, the infiltration rate of rainwater is smaller. At the same time, the response time of water content and pore water pressure is delayed. In addition, the fluctuation of pore water pressure is limited. As a result, the ability of the slope to resist seepage damage is improved effectively. When dilative shear deformation appears, it can cause the dissipation of pore water pressure and even leads to the appearance of negative pore water pressure (Chen et al., 2018). It can result in the delay of the VMC and the recovery of the shear strength. After that, long-term rainfall can restore the loss of pore pressure due to soil dilation, and shear deformation will reappear. At this time, the macroscopic phenomenon of landslide start is progressive (Dai et al., 1999a, b; McKenna et al., 2011). The landslide mobilization mode in this paper is consistent with the abovementioned.
Finally, the limitation of the model tests in this paper should be discussed. All sensors are embedded in the center section of the slope (Fig. 4). Therefore, the sensors are less affected by the left or right boundary. Monitoring data are reliable and can reflect the variation of VMC and PWP during landslide formation. Because the sensor is connected to the data collector, the connecting line is embedded in the slope. The surrounding soil is compacted to achieve the preset dry density. However, the influence is caused by the material heterogeneity of the connecting line, and the soil cannot be eliminated. The effect is reflected in the difference in rainwater infiltration. This may cause the right side of the slope to tend to slide locally (Figs. 5 and 20). Nevertheless, this trend is temporary and does not dominate the five similar stages of landslide formation. In addition, the five stages are basically consistent with the field survey in southeastern Guangxi (Wei et al., 2017). In conclusion, the model tests in this paper reproduce the failure pattern of granite residual soil slope well. In future research, a wireless transmission system will be employed to collect sensor data. This can minimize the disturbance caused by the sensor line.
The present study is executed to analyze the failure mode and process of granite residual soil landslides in Guangxi Province, China. The conclusions are summarized as follows.
-
Volume moisture content and pore water pressure exhibit a non-synchronous response to the rain. Initial dry density and rainfall intensity has a significant effect on the hydrological response. Large density can restrain the rainwater infiltration rate and limit the fluctuation of pore water pressure. In addition, high rainfall intensity is corresponds to the short response time of volume moisture content. However, this is unsuitable for the soil with a small density, as changes in the soil microstructure can alter the seepage path. The fluctuation of pore water pressure depends on soil mechanical behavior and its diffusion.
-
The differences in the formation process of granite residual soil landslides include the initiation time and mode. The starting time of landslide is closely related to initial dry density, slope angle and rainfall intensity. It is mainly controlled by the hydrological response of the slope. The initiation time of 1.20 g cm−3 is 13–17 min earlier than that of 1.40 g cm−3. The initiation time of 90 mm h−1 is 18–22 min shorter than that of 60 mm h−1. Mechanical properties of the shear zone play an important role in the failure modes of landslides, which are closely related to the initial dry density. Two failure modes can be observed. One is a sudden sliding in a large scale with a density of 1.2 g cm−3; the other is a progressive sliding in a small scale with a density of 1.40 g cm−3.
-
Landslide mobilization can be classified into five stages as follows: rain infiltration and crack generation, soil slide at the slope toe, occurrence of surface runoff and soil erosion, formation of steep–free surface, and soil slide at the upper slope. It is accompanied by the migration of fine particles and the formation of cracks and macro-pores. Cracks and macro-pores can facilitate the hydrological response in the deep layer.
Future research includes four aspects. Firstly, more tests involving multiple factors will be conducted through the orthogonal experimental design. Secondly, a triaxial instrument will be used to perform the stress path tests. Thirdly, the influence of variation of initial dry density along the vertical direction on slope failure will be analyzed. Fourthly, the quantitative relationship between volume moisture content and pore water pressure during landslide initiation will be explored.
All data in this study are available by contacting the first author: wushanbai@163.com.
SW carried out the artificial model tests, analyzed the experimental data and wrote the manuscript. RZ participated in the tests and analyzed part of the data. LL and YY guided the design and implementation of the tests, as well as revised the content of the manuscript. YW and WW participated in the implementation of the tests.
The contact author has declared that none of the authors has any competing interests.
Publisher's note: Copernicus Publications remains neutral with regard to jurisdictional claims in published maps and institutional affiliations.
This research was funded by the National Natural Science Foundation of China (grant nos. 41901132 and 42261017) and the Natural Scientific Project of Guangxi Zhuang Autonomous Region (nos. 2021GXNSFBA220025, 2019GXNSFAA185015).
This research has been supported by the National Natural Science Foundation of China (grant nos. 41901132 and 42261017) and the Natural Scientific Project of Guangxi Zhuang Autonomous Region (grant nos. 2021GXNSFBA220025 and 2019GXNSFAA185015).
This paper was edited by Xuanmei Fan and reviewed by two anonymous referees.
Calcaterra, D. and Parise, M.: Landslide types and their relationships with weathering in a Calabrian basin, southern Italy, Bull. Eng. Geol. Environ., 64, 193–207, https://doi.org/10.1007/s10064-004-0262-5, 2005.
Chang, Z., Huang, F., Huang, J., Jiang, S., Zhou, C., and Zhu, L.: Experimental study of the failure mode and mechanism of loess fill slopes induced by rainfall, Eng. Geol., 280, 1–16, https://doi.org/10.1016/j.enggeo.2020.105941, 2021.
Chen, D. and Gong, X.: Experiment and modeling of soil-water characteristic curve of unsaturated residual soil, Rock Soil Mech., 35, 1885–1891, 2014.
Chen, G., Meng, X., Qiao, L., Zhang, Y., and Wang, S.: Response of a loess landslide to rainfall: observations from a field artificial rainfall experiment in Bailong River Basin, China, Landslides, 15, 895–911, https://doi.org/10.1007/s10346-017-0924-6, 2018.
Chen, H., Lee, C. F., and Law, K. T.: Causative mechanisms of rainfall-induced fill slope failures, J. Geotech. Geoenviron. Eng., 130, 593–602, https://doi.org/10.1061/(ASCE)1090-0241(2004)130:6(593), 2004.
Chen, N., Zhu, Y., Huang, Q., Iqbal, J., Deng, M., and He, N.: Mechanisms involved in triggering debris flows within a cohesive gravel soil mass on a slope: a case in SW China, J. Mt. Sci., 14, 611–620, https://doi.org/10.1007/s11629-016-3882-x, 2017.
Chen, X., Zhou, Q., and Cai, X.: Physical properties and shear strength characteristics of high liquid limit granite residual soil, Chinese J. Geotech. Eng., 32, 901–908, 2011.
Coutinho, R. Q., Silva, M. M., dos Santos, A. N., and Lacerda, W. A.: Geotechnical characterization and failure mechanism of landslide in granite residual soil, J. Geotech. Geoenviron. Eng., 145, 1–16, https://doi.org/10.1061/(asce)gt.1943-5606.0002052, 2019.
Dahal, R. K., Hasegawa, S., Nonomura, A., Yamanaka, M., Masuda, T., and Nishino, K.: Failure characteristics of rainfall-induced shallow landslides in granitic terrains of Shikoku Island of Japan, Environ. Geol., 56, 1295–1310, https://doi.org/10.1007/s00254-008-1228-x, 2008.
Dai, F., Lee, C. F., and Wang, S.: Analysis of rainstorm-induced slide-debris flows on natural terrain of Lantau Island, Hong Kong, Eng. Geol., 51, 279–290, https://doi.org/10.1016/s0013-7952(98)00047-7, 1999a.
Dai, F., Lee, C. F., Wang, S., and Feng, Y.: Stress-strain behaviour of a loosely compacted voleanic-derived soil and its significance to rainfall-induced fill slope failures, Eng. Geol., 53, 359–370, https://doi.org/10.1016/s0013-7952(99)00016-2, 1999b.
Elkamhawy, E., Wang, H., Zhou, B., and Yang, Z.: Failure mechanism of a slope with a thin soft band triggered by intensive rainfall, Environ. Earth. Sci., 77, 340–354, https://doi.org/10.1007/s12665-018-7538-8, 2018.
Fan, X., Juang, C., Wasowski, J., Huang, R., Xu, Q., Scaringi, G., van Westen, C., and Havenith, H.: What we have learned from the 2008 Wenchuan Earthquake and its aftermath: A decade of research and challenges, Eng. Geol., 241, 25–32, https://doi.org/10.1016/j.enggeo.2018.05.004, 2018.
Fang, H., Cui, P., Pei, L., and Zhou, X.: Model testing on rainfall-induced landslide of loose soil in Wenchuan earthquake region, Nat. Hazards Earth Syst. Sci., 12, 527–533, https://doi.org/10.5194/nhess-12-527-2012, 2012.
Fu, R., Hu, X., Zhou, B., Wang, H., and Wang, J.: A quantitative characterization method of 3D morphology of sand particles, Rock Soil Mech., 39, 483–490, 2018.
Gasmo, J. M., Rahardjo, H., and Leong, E. C.: Infiltration effects on stability of a residual soil slope, Comput. Geotech., 26, 145–165, https://doi.org/10.1016/s0266-352x(99)00035-x, 2000.
Huang, C.-C. and Yuin, S.-C.: Experimental investigation of rainfall criteria for shallow slope failures, Geomorphology, 120, 326–338, https://doi.org/10.1016/j.geomorph.2010.04.006, 2010.
Huang, C.-C., Lo, C.-L., Jang, J.-S., and Hwu, L.-K.: Internal soil moisture response to rainfall-induced slope failures and debris discharge, Eng. Geol., 101, 134–145, https://doi.org/10.1016/j.enggeo.2008.04.009, 2008.
Igwe, O. and Fukuoka, H.: The effect of water-saturation on the stability of problematic slopes at the Iva Valley area, Southeast Nigeria, Arab. J. Geosci., 8, 3223–3233, https://doi.org/10.1007/s12517-014-1398-7, 2014.
Iverson, R. M.: Regulation of landslide motion by dilatancy and pore pressure feedback, J. Geophys. Res.-Earth, 110, 1–16, https://doi.org/10.1029/2004JF000268, 2005.
Iverson, R. M., Reid, M. E., and LaHusen, R. G.: Debris-flow mobilization from landslides, Annu. Rev. Earth Planet. Sci., 25, 85–138, https://doi.org/10.1146/annurev.earth.25.1.85, 1997.
Iverson, R. M., Reid, M. E., Iverson, N. R., LaHusen, R. G., and Logan, M.: Acute sensitivity of landslide rates to initial soil porosity, Science, 290, 513–516, https://doi.org/10.1126/science.290.5491.513, 2000.
Jiang, Y., Chen, W., Wang, G., Sun, G., and Zhang, F.: Influence of initial dry density and water content on the soil-water characteristic curve and suction stress of a reconstituted loess soil, Bull. Eng. Geol. Environ., 76, 1085–1095, https://doi.org/10.1007/s10064-016-0899-x, 2017.
Jiao, J., Wang, X., and Nandy, S.: Confined groundwater zone and slope instability in weathered igneous rocks in Hong Kong, Eng. Geol., 80, 71–92, https://doi.org/10.1016/j.enggeo.2005.04.002, 2005.
Kassim, A., Gofar, N., Lee, L. M., and Rahardjo, H.: Modeling of suction distributions in an unsaturated heterogeneous residual soil slope, Eng. Geol., 131–132, 70–82, https://doi.org/10.1016/j.enggeo.2012.02.005, 2012.
Kim, J., Jeong, S., Park, S., and Sharma, J.: Influence of rainfall-induced wetting on the stability of slopes in weathered soils, Eng. Geol., 75, 251–262, https://doi.org/10.1016/j.enggeo.2004.06.017, 2004.
Kim, M. S., Onda, Y., Kim, J. K., and Kim, S. W.: Effect of topography and soil parameterisation representing soil thicknesses on shallow landslide modelling, Quatern. Int., 384, 91-106, https://doi.org/10.1016/j.quaint.2015.03.057, 2015.
Lacerda, W. A.: Landslide initiation in saprolite and colluvium in southern Brazil: Field and laboratory observations, Geomorphology, 87, 104–119, https://doi.org/10.1016/j.geomorph.2006.03.037, 2007.
Lan, H., Zhou, C., Lee, C. F., Wang, S., and Wu, F.: Stability response analysis of rainfall landslide under instantaneous pore water pressure: a case study of natural rainfall landslide in Hong Kong, Sci. China Ser. E, 33, 119–136, 2003.
Lee, I.-M., Sung, S.-G., and Cho, G.-C.: Effect of stress state on the unsaturated shear strength of a weathered granite, Can. Geotech. J., 42, 624–631, https://doi.org/10.1139/t04-091, 2005.
Li, Z., Tang, L., and Sang, H.: 3-D micro-structure of the particle and water morphology of the granite residual soil, Acta Scientiarum Naturalium Universitatis Sunyatseni, 56, 15–21, 2017.
Liang, H., He, S., Lei, X., Bi, Y., Liu, W., and Ouyang, C.: Dynamic process simulation of construction solid waste (CSW) landfill landslide based on SPH considering dilatancy effects, Bull. Eng. Geol. Environ., 2, 1–15, https://doi.org/10.1007/s10064-017-1129-x, 2017.
Liao, L., Yang, Y., Yang, Z., Zhu, Y., Hu, J., and Zou, D. H. S.: Mechanical state of gravel soil in mobilization of rainfall-induced landslides in the Wenchuan seismic area, Sichuan province, China, Earth Surf. Dynam., 6, 637–649, https://doi.org/10.5194/esurf-6-637-2018, 2018.
Liao, L., Zhu, Y., Zhao, Y., Wen, H., Yang, Y., Chen, L., Ma, S., and Xu, Y.: Landslide integrated characteristics and susceptibility assessment in Rongxian county of Guangxi, China, J. Mt. Sci., 16, 657–676, https://doi.org/10.1007/s11629-017-4804-2, 2019.
Liu, W., Song, X., Luo, J., and Hu, L.: The processes and mechanisms of collapsing erosion for granite residual soil in southern China, J. Soil Sediment., 20, 992–1002, https://doi.org/10.1007/s11368-019-02467-4, 2020a.
Liu, W., Ouyang, G., Luo, X., Luo, J., Hu, L., and Fu, M.: Moisture content, pore-water pressure and wetting front in granite residual soil during collapsing erosion with varying slope angle, Geomorphology, 362, 1–10, https://doi.org/10.1016/j.geomorph.2020.107210, 2020b.
Liu, X., Zhang, X., Kong, L., Li, X., and Wang, G.: Effect of cementation on the small-strain stiffness of granite residual soil, Soils Found., 61, 520–532, https://doi.org/10.1016/j.sandf.2021.02.001, 2021.
Lu, Y., Wei, C., Cai, G., and Zhao, C.: Water-holding characteristics of weathered granite soils, Chinese J. Geotech. Eng., 40, 96–100, 2018.
Luo, X., Gao, H., He, P., and Liu, W.: Experimental investigation of dry density, initial moisture content, and temperature for granite residual soil disintegration, Arab. J. Geosci., 14, 1–9, https://doi.org/10.1007/s12517-021-07239-4, 2021.
McKenna, J. P., Santi, P. M., Amblard, X., and Negri, J.: Effects of soil-engineering properties on the failure mode of shallow landslides, Landslides, 9, 215–228, https://doi.org/10.1007/s10346-011-0295-3, 2011.
Miao, F., Wu, Y., Torok, A., Li, L., and Xue, Y.: Centrifugal model test on a riverine landslide in the Three Gorges Reservoir induced by rainfall and water level fluctuation, Geosci. Front., 13, 1–14, https://doi.org/10.1016/j.gsf.2022.101378, 2022.
Ministry of Construction of the People's Republic of China: Code for investigation of geotechnical engineering (GB50021-2001), China Architecture & Building Press, Beijing, https://github.com/Shanbai-Wu/files (last access: 1 October 2009), 2002.
Moriwaki, H., Inokuchi, T., Hattanji, T., Sassa, K., Ochiai, H., and Wang, G.: Failure processes in a full-scale landslide experiment using a rainfall simulator, Landslides, 1, 277–287, https://doi.org/10.1007/s10346-004-0034-0, 2004.
Mukhlisin, M. and Taha, M. R.: Numerical model of antecedent rainfall effect on slope stability at a hillslope of weathered granitic soil formation, J. Geol. Soc. India, 79, 525–531, https://doi.org/10.1007/s12594-012-0077-0, 2012.
Mukhlisin, M., Taha, M. R., and Kosugi, K.: Numerical analysis of effective soil porosity and soil thickness effects on slope stability at a hillslope of weathered granitic soil formation, Geosci. J., 12, 401–410, https://doi.org/10.1007/s12303-008-0039-0, 2008.
Ng, C. W. and Pang, Y. W.: Experimental investigations of the soil-water characteristics of a volcanic soil, Can. Geotech. J., 37, 1252–1264, https://doi.org/10.1139/t00-056, 2000.
Pham, K., Kim, D., Lee, I.-M., and Choi, H.: Hydraulic-mechanical properties of unsaturated granite-weathered residual soil in Korea, Vadose Zone J., 18, 1–13, https://doi.org/10.2136/vzj2018.10.0188, 2019.
Qu, Y., Ng, C. W., and Shang, Y.: Study on latitudinal effect on lateritization of eluvial soil on granite and cuase for weak lateritization of the soil in Hong Kong, J. Eng. Geol., 8, 16–20, 2000.
Rahardjo, H., Aung, K. K., Leong, E. C., and Rezaur, R. B.: Effects of pore-size distribution on engineering properties of residual soils, in: Proceedings of the Second World Engineering Congress, Geotechnical Engineering & Transportation, 22–25 July 2002, Sarawak, Malaysia, 70–76, 2002.
Rahardjo, H., Lee, T. T., Leong, E. C., and Rezaur, R. B.: Response of a residual soil slope to rainfall, Can. Geotech. J., 42, 340–351, https://doi.org/10.1139/t04-101, 2005.
Rahardjo, H., Leong, E. C., and Rezaur, R. B.: Effect of antecedent rainfall on pore-water pressure distribution characteristics in residual soil slopes under tropical rainfall, Hydrol. Process., 22, 506–523, https://doi.org/10.1002/hyp.6880, 2008.
Rahardjo, H., Satyanaga, A., Leong, E.-C., Ng, Y. S., and Pang, H. T. C.: Variability of residual soil properties, Eng. Geol., 141–142, 124–140, https://doi.org/10.1016/j.enggeo.2012.05.009, 2012.
Rahman, A. S. A., Noor, M. J. M., Jais, I. B. M., Sidek, N., and Ahmad, J.: Shear strength of granitic residual soil in saturated and unsaturated conditions, in: AIP Conference Proceedings, Advances in Civil Engineering and Science Technology, 5–6 September 2018, Penang, Malaysia, 1–9, https://doi.org/10.1063/1.5062629, 2018.
Rezaur, R. B., Rahardjo, H., Leong, E. C., and Lee, T. T.: Hydrologic behavior of residual soil slopes in Singapore, J. Hydrol. Eng., 8, 133–144, https://doi.org/10.1061/(asce)1084-0699(2003)8:3(133), 2003.
Shu, R., Kong, L., Liu, B., and Wang, J.: Stress-strain strength characteristics of undisturbed granite residual soil considering different patterns of variation of mean effective stress, Appl. Sci.-Basel, 11, 1–16, https://doi.org/10.3390/app11041874, 2021.
Take, W. A., Bolton, M. D., Wong, P. C. P., and Yeung, F. J.: Evaluation of landslide triggering mechanisms in model fill slopes, Landslides, 1, 173–184, https://doi.org/10.1007/s10346-004-0025-1, 2004.
Tu, X. B., Kwong, A. K. L., Dai, F. C., Tham, L. G., and Min, H.: Field monitoring of rainfall infiltration in a loess slope and analysis of failure mechanism of rainfall-induced landslides, Eng. Geol., 105, 134–150, https://doi.org/10.1016/j.enggeo.2008.11.011, 2009.
Wang, G. and Sassa, K.: Factors affecting rainfall-induced flowslides in laboratory flume tests, Geotechnique, 51, 587–599, https://doi.org/10.1680/geot.51.7.587.51386, 2001.
Wang, Z., Mai, T., and Qi, C.: Shear strength and microstructure of compacted granite residual soils in Rong County, Hydrogeol. Eng. Geol., 45, 101–107, 2018.
Wei, C., Wen, H., Liao, L., Yang, Y., Ma, S., Zhao, Y., and Chen, L.: Failure characteristics and prevention measures of granite residual soil slope in the southeast of Guangxi Province, China Earth Environ., 45, 576–586, 2017.
Wen, H.: A detailed survey report of geological disasters in Rongxian County, Guangxi, Guangxi Zhuang Autonomous Region Geological Environmental Monitoring Station, Guilin, Guangxi, 196 pp., https://github.com/Shanbai-Wu/files (last access: 1 December 2014), 2015.
Wu, N.: Engineering characteristics of cutting slope of granite residual soil, Mount. Res., 24, 431–436, 2006a.
Wu, N.: Study on classification of granite residual soils, Rock Soil Mech., 27, 2299–2304, 2006b.
Wu, Q., Tang, H., Ma, X., Wu, Y., Hu, X., Wang, L., Criss, R., Yuan, Y., and Xu, Y.: Identification of movement characteristics and causal factors of the Shuping landslide based on monitored displacements, Bull. Eng. Geol. Environ., 78, 2093–2106, https://doi.org/10.1007/s10064-018-1237-2, 2019.
Xia, J., Cai, C., Wei, Y., and Wu, X.: Granite residual soil properties in collapsing gullies of south China: spatial variations and effects on collapsing gully erosion, Catena, 174, 469–477, https://doi.org/10.1016/j.catena.2018.11.015, 2019.
Xu, X. and Jian, W.: Experiment study on rainfall infiltration of slope under thrust at front end, Rock Soil Mech., 38, 3547–3554, 2017.
Xu, X., Jian, W., and Wu, N.: Influence of repeated wetting cycles on shear properties of natural residual soil, China J. Highw. Transp., 30, 33–40, 2017.
Xu, X., Jian, W., Wu, N., Xu, X., and Liu, J.: Unsaturated seepage characteristics of slope under rainfall infiltration, Earth Sci., 43, 922–932, 2018.
Yao, Y., Ni, J., and Li, J.: Stress-dependent water retention of granite residual soil and its implications for ground settlement, Comput. Geotech., 129, 1–11, https://doi.org/10.1016/j.compgeo.2020.103835, 2021.
Zhai, Q., Rahardjo, H., and Satyanaga, A.: Variability in unsaturated hydraulic properties of residual soil in Singapore, Eng. Geol., 209, 21–29, https://doi.org/10.1016/j.enggeo.2016.04.034, 2016.
Zhan, L., Li, H., Chen, Y., and Fredlund, D. G.: Parametric analyses of intensity-duration curve for predicting rainfall-induced landslides in residual soil slope in Southeastern coastal areas of China, Rock Soil Mech., 33, 872–880 + 886, 2012.
Zhang, S. and Tang, H.: Experiment study of disintegration mechanism for unsaturated granite residual soil, Rock Soil Mech., 34, 1668–1674, 2013.
Zhang, W. G., Zhang, R. H., Han, L., and Goh, A. T. C.: Engineering properties of the Bukit Timah Granitic residual soil in Singapore, Underground Space, 4, 98–108, https://doi.org/10.1016/j.undsp.2018.07.001, 2019.
Zhao, X. and Hu, H.: Investigation on failure of granitic residual slope by using centrifugal model test, J. Eng. Geol., 13, 410–414, 2005.
Zhao, Y., Sun, X., Wen, T., Chen, R., and Huang, L.: Micro-structural evolution of granite residual soil under external loading based on X-ray micro-computed tomography, KSCE J. Civ. Eng., 25, 2836–2846, https://doi.org/10.1007/s12205-021-0803-5, 2021.
Zhou, J., Du, Q., Li, Y., and Zhang, J.: Centrifugal model tests on formation mechanism of landslide-type debris flows of cohesiveless soils, Chinese J. Geotech. Eng., 36, 2010–2017, 2014.
Zhu, J.-H. and Anderson, S. A.: Determination of shear strength of Hawaiian residual soil subjected to rainfall-induced landslides, Geotechnique, 48, 73–82, https://doi.org/10.1680/geot.1998.48.1.73, 1998.
Zuo, C., Xu, Y., Ding, S., and Tang, X.: Class soil landslide stability and its influencing factor interaction law, Res. Soil Water Conserv., 22, 325–330, 2015.
Zou, Z., Yan, J., Tang, H., Wang, S., Xiong, C., and Hu, X.: A shear constitutive model for describing the full process of the deformation and failure of slip zone soil, Eng. Geol., 276, 1–11, https://doi.org/10.1016/j.enggeo.2020.105766, 2020.