the Creative Commons Attribution 4.0 License.
the Creative Commons Attribution 4.0 License.
 | 09 Nov 2022
Episodic sediment supply to alluvial fans: implications for fan incision and morphometry
Anya S. Leenman
Brett C. Eaton
Sediment supply is widely believed to be a key control on alluvial fan morphology and channel dynamics. Although the sediment supply to natural fans is rather episodic, experimental studies of alluvial fans often use constant sediment supply rates, making it difficult to relate fan dynamics to the magnitude and frequency of sediment supply in the field. This paper presents a series of experiments designed to test the impact of episodic sediment supply on fan evolution and dynamics. We compare four experiments, each with the same mean sediment supply but different durations of high- and low-supply periods. The experiments show that fan morphology and channel dynamics respond systematically to the temporal elongation of sediment supply oscillations: longer supply cycles generate flatter fans with more trenched channels. These results highlight how different basin conditions might generate different fan morphologies: supply-limited basins with intermittent sediment supply might generate fans that are flatter than expected. Our results raise the question of whether a constant sediment supply in experimental models can adequately characterise the dynamics of natural fans in the field. We therefore suggest that experimental modellers should include variability when investigating fan responses to sediment supply.
- Article
(6171 KB) - Full-text XML
-
Supplement
(4214 KB) - BibTeX
- EndNote


The shapes of alluvial fans reflect the fluxes of water and sediment from their source basins. Field and experimental studies show that, for a given flow rate, fans become steeper as the sediment supply (and importantly, the sediment concentration) increases (Ashworth et al., 2004; Bryant et al., 1995; Bull, 1964; Delorme et al., 2018; Hooke, 1968b; Whipple et al., 1998). Fan-channel dynamics also change, with more frequent avulsions at higher sediment supply rates (Ashworth et al., 2004; Bryant et al., 1995). This influence of sediment concentration is reflected in the inverse relation between upstream catchment area and fan slope (e.g. Blair and McPherson, 1994b, Fig. 23). Within-basin sediment storage means that while larger basins generate higher discharges, they typically have lower sediment concentration (often fluvial flows as opposed to debris flows) and hence form lower-gradient fans (e.g. Blair and McPherson, 1994b; Crosta and Frattini, 2004; De Scally and Owens, 2004; de Haas et al., 2015; Harvey, 1984; Kostaschuk et al., 1986; Stokes and Gomes, 2020; Tomczyk, 2021).
Despite these established linkages between sediment supply and fan forms, little is known about how oscillations in the sediment supply or concentration govern fan morphology. In the field, fans experience temporal variation in their sediment supply, depending on the frequency and magnitude of erosion events in their source basins (e.g. Cabre et al., 2020; Davies and Korup, 2007; Frechette and Meyer, 2009; Kesel and Lowe, 1987; Meyer and Pierce, 2003; Pierce and Meyer, 2008; Talbot and Williams, 1979; Wells and Harvey, 1987, among others). The nature and timing of sediment delivery to a fan are moderated in turn by the size of the source basin and the connectivity of sediment transport pathways therein; disconnectivity within larger basins can mean that sediment inputs from erosional events do not make it to the basin outlet to build alluvial fans at all (Stokes and Mather, 2015; Wang et al., 2008).
The fan response to these episodic disturbances likely reflects the balance between disturbance frequency (and duration) and fan adjustment timescale. Theorists have proposed that disturbances with a periodicity less than the timescale of system adjustment will not be recorded in stratigraphy (e.g. Jerolmack and Paola, 2010); the same may be true for fan morphology. For many fans, short, frequent disturbances (such as debris flows or sediment-laden floods) aggrade the fan or its channels locally but not every event triggers a wholesale avulsion (e.g. de Haas et al., 2018a; Field, 2001; Zubrycky et al., 2021); sequences of multiple events may be required to affect whole-fan morphology, implying that these individual events are shorter than the adjustment timescale. Conversely, on fans experiencing longer (decadal) periods of heightened sediment supply, prolonged aggradation and progradation across the whole fan have been observed (De Rose et al., 1998; Leenman and Tunnicliffe, 2020; Marden et al., 2018). The balance between the magnitude, duration, and frequency of sediment inputs and the timescale of fan adjustment is therefore key for understanding how fans respond to episodic sediment inputs. It is challenging to systematically investigate this balance in the field, but the manipulability of physical experiments makes them a useful tool for this problem.
While the episodic nature of sediment supply to fans is well documented, only a few alluvial fan experiments have explicitly investigated the effects of episodic sediment supply. Schumm et al. (1987, p. 316) conducted a preliminary study of fans built from episodic flood events generated via “a burst of artificial rainfall applied by a hand-held nozzle” to the experimental source basin. Davies and Korup (2007) generated random pulses in their “background” experimental sediment supply, while investigating the impact of large pulses superimposed on this input. Apart from these two studies, most alluvial fan experiments used a constant sediment supply (e.g. Bryant et al., 1995; Clarke et al., 2010; Van Dijk et al., 2009; Hamilton et al., 2013; Reitz and Jerolmack, 2012). These constant-input studies were invaluable to our understanding of the autogenic dynamics and evolution of alluvial fans. Nevertheless, there has not been a systematic experimental study of how episodic sediment supply affects alluvial fan morphology in the long term or the stability and patterns of stream channels upon the fan.
This paper presents four alluvial fan experiments designed to address this knowledge gap. The experiments demonstrate the impacts of variable sediment supply on alluvial fan morphology, channel patterns, and change thereof. All the experiments had the same mean sediment supply rate but varying durations of high-supply and low-supply conditions. These scenarios allow us to investigate the effects of periodic oscillations around the mean sediment supply rate.
Through comparing the four experimental scenarios, this paper considers two key questions.
-
How do abrupt changes in sediment supply rate influence fan morphology, channel patterns, and dynamics?
-
How does the duration of sediment supply oscillations govern their impact?
The experiments presented here show that abrupt sediment supply oscillations can generate distinctive responses in the fan gradient, channel patterns, lateral mobility, and morphologic reworking rates. Moreover, comparisons between the experiments show that fan morphology changes systematically with oscillation duration. While the experiments indicate how fans are likely to respond to changes in sediment concentration during or between floods, they also highlight the distortions that arise from using a constant sediment supply rate to represent systems whose sediment supply is intermittent in the field.
This paper describes four experiments conducted in the alluvial fan simulator at the University of British Columbia's Biogeomorphology Experimental Laboratory. The experiments presented here are named Runs CON, OSC10, OSC20, and OSC40. Results from Run CON have been presented in detail in Leenman and Eaton (2021) and compared to another set of fan experiments in Leenman et al. (2022), wherein Run CON was referred to as Run 1. Note that in Leenman (2021), Runs CON, OSC10, OSC20, and OSC40 are referred to as Runs 1, 7, 8, and 9, but the data are the same. The experimental set-up, sediment mixture, scaling approach, and data collection system used here are the same as in those publications, but they are summarised here for completeness.
2.1 Model set-up
Our stream table experiments used a physical model of a generic gravel–cobble alluvial fan. The stream table measured m (Fig. 1). We delivered water and sediment to the fan head through a m feeder channel at one corner of the table. Water was input from a constant head tank. Sediment was input from a sediment feeder with a rotating pipe outlet; the sediment supply rate was set by the inclination of the pipe. Sediment and water were first mixed in a funnel, then dropped into the head of the feeder channel. Sediment aggraded and degraded freely in the feeder channel, as we would expect for a confined reach upstream of a natural fan in the field.
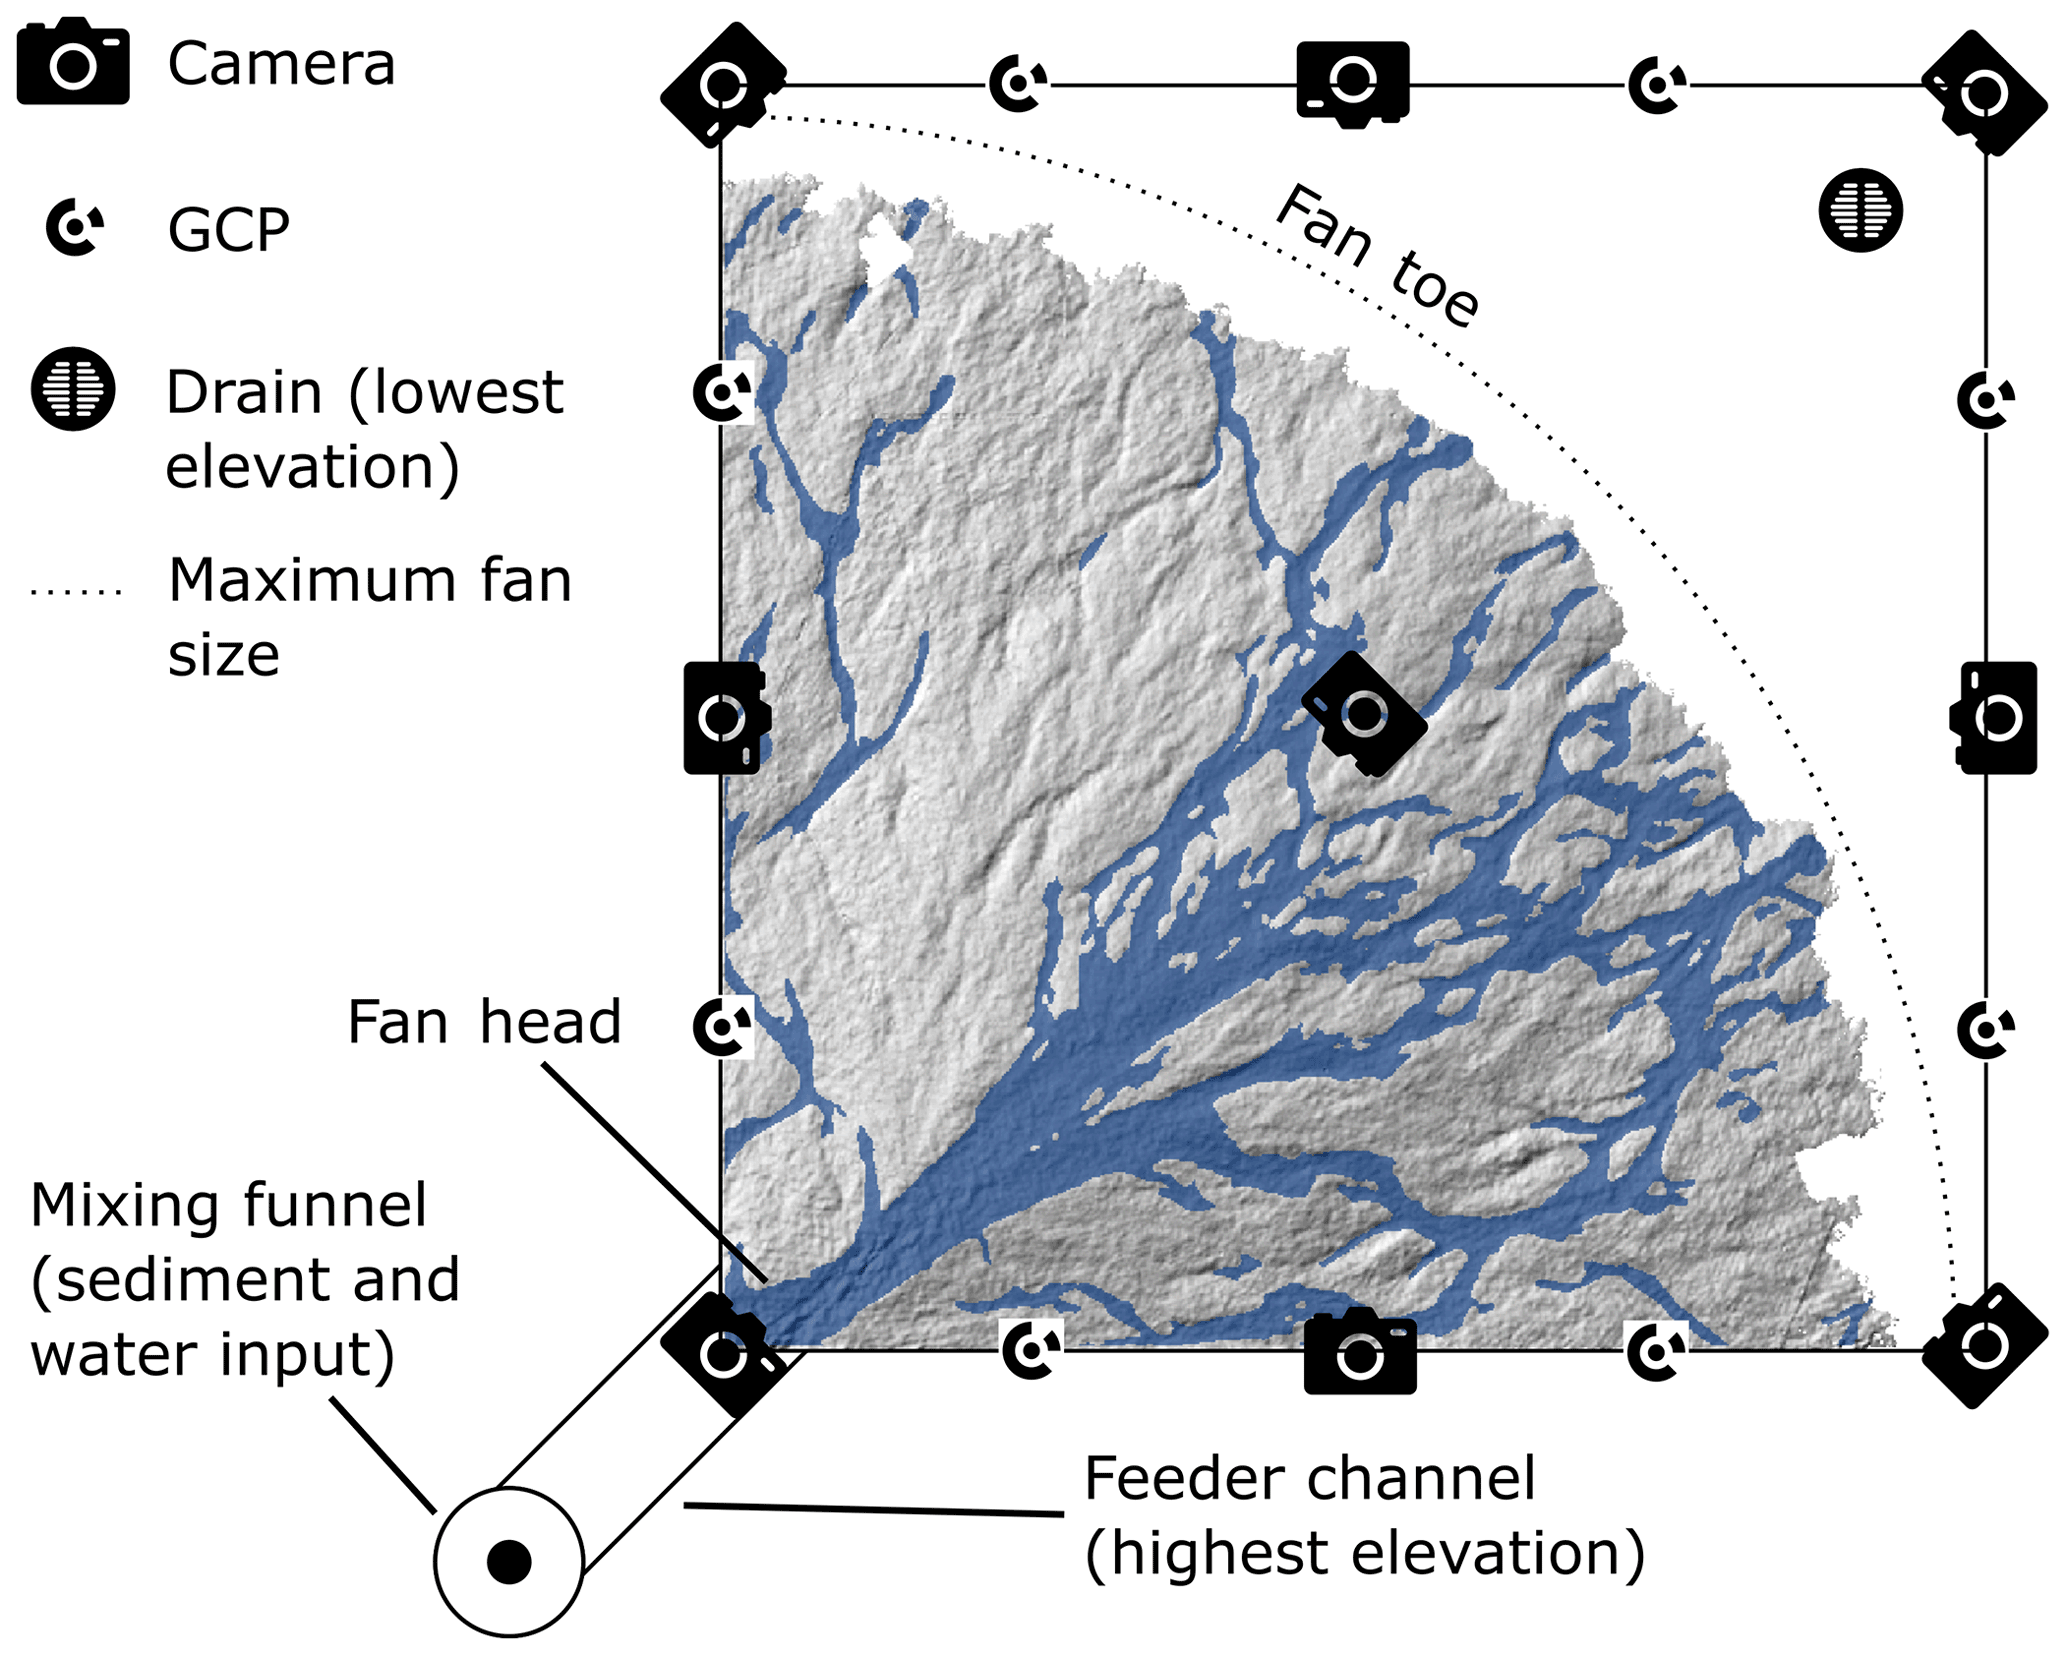
Figure 1Experimental design (not to scale). Water and sediment mix in the funnel and drop into the experiment at the head of the feeder channel, where sediment aggrades and degrades freely. The hillshaded topography and flow map example are from Run CON repeat 2 at 20 h into the experiment.
We tilted the stream table to 0.0002 m m−1 (0.02 %), the minimum slope required to trigger flow toward a drain in one corner and avoid the formation of a “lake” in the experiment. We roughened the experimental boundary with 2 mm sand grains and LEGO® sheets glued to the table and walls, respectively. The water was dyed blue to permit automatic channel extraction from overhead photographs.
We collected data with a system inspired by Structure-from-Motion photogrammetry. Leenman and Eaton (2021) and Leenman (2021) give detailed descriptions of the data collection system and its accuracy, so we present a brief summary here. The system consisted of an array of nine digital single-lens reflex cameras mounted above the stream table (locations shown in Fig. 1). The cameras captured photos synchronously at 1 min intervals. In experiments with sediment supply changes, the first photo was always ∼30 s after the change in supply rate. We georeferenced each set of nine photos to a local coordinate system using a set of eight ground control points on the table walls. We processed each photo set using Agisoft PhotoScan Professional (2018) to generate a topographic point cloud (∼280 000 points per m2) and co-registered orthomosaic (1 mm resolution) for each minute of the experiment.
2.2 Experimental approach
Our experimental alluvial fan is a “similarity-of-process” or “analogue” model (see Hooke, 1968a; Paola et al., 2009), as are most physical models of fans (e.g. Bryant et al., 1995; Clarke et al., 2010; Davies and Korup, 2007; Van Dijk et al., 2009; De Haas et al., 2016, 2018b; Hamilton et al., 2013; Hooke, 1967, 1968b; Hooke and Rohrer, 1979; Miller et al., 2019; Piliouras et al., 2017; Reitz and Jerolmack, 2012; Schumm et al., 1987). The key processes in the model (fluvial sediment entrainment, transport, and deposition) are similar to those on fans in the field. In alluvial fan experiments, it is challenging to maintain Froude scaling between the model and any field prototype due to the large scaling ratio that is necessary to build a conveniently small laboratory model. This lack of Froude scaling means that it is inappropriate to extrapolate rates and volumes measured in the experiment to field settings. Nevertheless, comparisons between the different experiments demonstrate how natural fans might respond to different frequencies and durations of sediment delivery. Such comparisons also highlight the distortions introduced through temporal averaging in the experimental inputs.
The slope of the fan itself and the dimensions of the channels upon it were self-formed. Therefore, it was not possible to control the Froude or Reynolds numbers during the experiments. To give readers an idea of the flow dynamics, we have estimated these parameters for the fan head (where flow was often confined to one channel) in Run CON (constant inputs). The estimated Froude number (Fr) was ∼1.9; this value aligns with observations of supercritical flow during floods on fans in the field (Beaumont and Oberlander, 1971; Rahn, 1967). Further down-fan, flow likely became subcritical as it spread into multiple distributaries. The particle Reynolds number (Re*) at the fan head was estimated (using the D84 as a representative grain size) to be 66. This conforms to the threshold of 15 proposed by Parker (1979) and Ashworth et al. (1994), although it is below the minimum of 70 recommended by Schlichting and Gersten (2016) and Yalin (1971). The estimated Reynolds number (Re) at the fan head was 1200, placing the flow in the transitional regime between laminar and turbulent flow (and preventing the attainment of Froude scaling). Nevertheless, Malverti et al. (2008) showed that even laminar flow can transport sediment at rates which fit the Meyer-Peter and Müller (1948) relation often used to predict bedload transport by turbulent flows. Moreover, many other experimental studies of fans also reported flows that were not fully turbulent (e.g. Davies et al., 2003; Davies and Korup, 2007; Delorme et al., 2017, 2018; Van Dijk et al., 2012; Guerit et al., 2014; Hamilton et al., 2013; Reitz et al., 2010; Reitz and Jerolmack, 2012; Whipple et al., 1998). Although those models did not achieve Froude scaling, they successfully reproduced the fan-channel dynamics that are of interest to us.
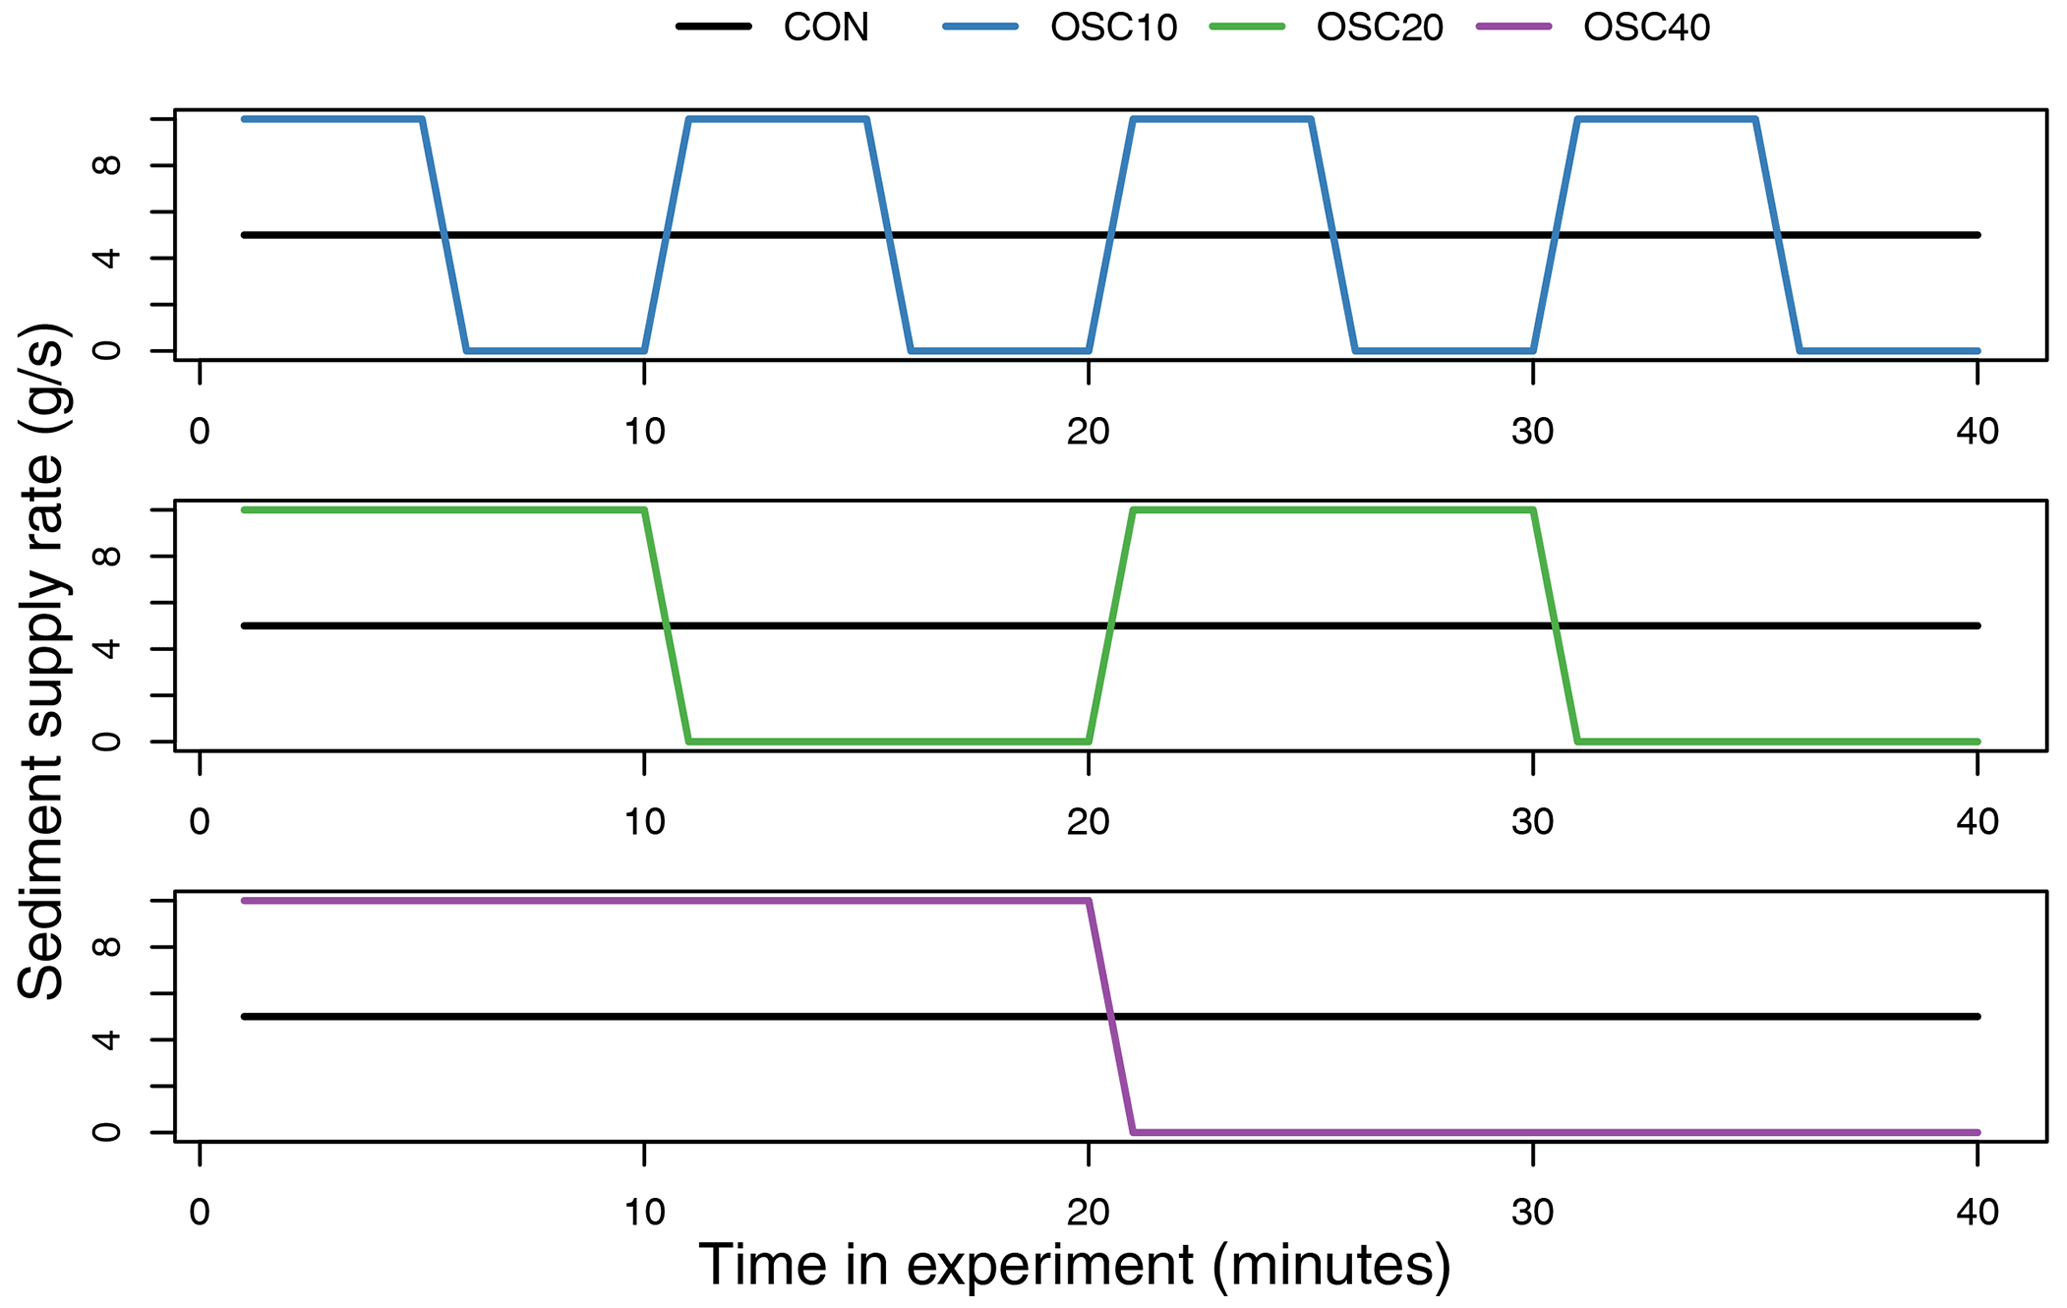
Figure 2The durations of high-supply and zero-supply periods in Runs CON and OSC10–OSC40. The constant sediment supply rate in Run CON equals the mean supply rate in all other runs.
2.3 Experimental runs
We varied the sediment supply periodicity between the four experiments. In Run CON, the sediment supply was constant at 5 g s−1. In Run OSC10, the supply rate was 10 g s−1 for 5 min, followed by 0 g s−1 for 5 min, and continued to oscillate between these two extremes every 5 min, creating a 10 min cycle of high- to zero-supply conditions. In Run OSC20, the cycle duration doubled to 20 min (10 min each for high- and zero-supply conditions). In Run OSC40, the duration doubled again to 40 min (20 min each for high- and zero-supply conditions). These oscillations are summarised in Fig. 2. Importantly, the mean sediment supply rate in Runs OSC10–OSC40 was 5 g s−1, equalling the constant supply rate in Run CON. This meant that in all experiments, the same volume of sediment and water was delivered in any 40 min period, but with a different temporal distribution in the sediment supply. The periods of the sediment supply oscillations in Runs OSC10–OSC40 were chosen to explore the effects of sediment input duration and are not intended to scale to a specific event, season, or climate oscillation in the field.
Each experiment was ∼20 h long, which was approximately the duration over which the fan prograded to the far walls of the experimental table. For Run CON, we then conducted two additional repeats (i.e. three repeats in total); the data for Run CON therefore appear more dense in Figs. 5–9 and we have increased the transparency for Run CON to account for this. Runs OSC10–OSC40 were not repeated.
Using a length scale of 1:128, we approximated the experimental grain size distribution (GSD) from a surface gravel sample collected in the channel at Three Sisters Creek fan, Canada, which is a typical gravel–cobble fan (located at 51.055108, −115.333515; see also Fig. S1 in the Supplement). The experimental mixture ranged from 0.25–8 mm (Fig. 3). This sandy GSD encouraged subsurface flow, which sometimes generated seepage channels on the lower fan during the experiments. Such processes are common on fans in the field; for instance, both down-fan channel narrowing and spring formation have been attributed to infiltration on fans (Davidson et al., 2013; Kesel and Lowe, 1987; Woods et al., 2006).
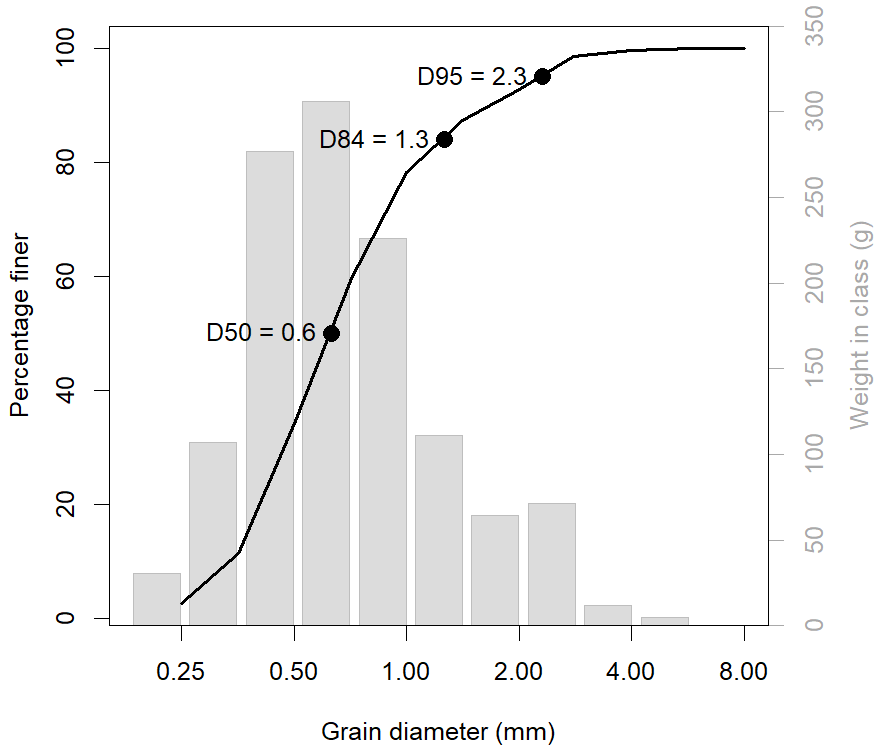
Figure 3The grain size distribution (GSD) of our experimental sediment mixture. The cumulative distribution is on the primary y axis, and the individual class weights are on the secondary y axis.
All four experiments had a constant flow of 150 mL s−1. This flow is approximately equal to the 20-year flood in the stream where grain size data were collected. While the model is generic and does not represent a specific field prototype, the above relation provides context for the size of this flow relative to the size of the sediment used in the experiments.
The sediment concentration was 3.6 % by volume in the high-supply periods. The experimental grain size mixture was truncated at 0.25 mm, omitting the finest ∼40 % of material in the field sample, so the true bedload sediment concentration could be expected to be around 6 % by volume. In mountain streams, bedload makes up between 10 % and 99 % of the total sediment load, with a mean of 44.5 % and standard deviation of 31.1 % (see Table S1 in the Supplement for values reported in the literature). Consequently, the maximum experimental truncated-bedload sediment concentration of 3.6 % is roughly equal to a total volumetric sediment concentration of 13.5 % (7.9 %–45.0 %) in the field.
The 150 mL s−1 flow rate was relatively high, as was the sediment concentration. As a result, these experiments can be thought of as analogues for a system that alternates between debris floods and clearwater floods; “clearwater” refers to flows with low sediment concentration. This paper therefore explores the effect of abrupt, large-scale variations in the sediment concentration and the timing thereof.
2.4 Data analysis
Our photogrammetry system generated a topographic point cloud and co-registered 1 mm orthomosaic for each minute of each experiment. We interpolated the point cloud (using a nearest-neighbour approach) to generate a 1 mm resolution digital elevation model (DEM). DEM accuracy was assessed in Leenman (2021); elevation values for an individual cell in a topographically inactive area varied by less than −0.7 to +0.8 mm (90 % confidence) over any 30 min period. Following Leenman and Eaton (2021) and Leenman et al. (2022), only data from 12 h and onward were used, as the fan slope and wet fraction were scale-dependent earlier in the experiment.
Fan slope was measured from 88 equally spaced down-fan profiles extracted from the DEM (see Fig. S2 for their locations). For each profile, slope was taken from a linear regression of elevation against distance down-fan (profiles were quasi-linear). For each time step, the representative fan slope was taken as the median of these 88 measurements.
Fan-head entrenchment was measured from arcuate cross-fan profiles extracted from each DEM at 0.25 m down-fan (see Fig. S2 for profile location). Fan-head entrenchment was measured as the difference between maximum and minimum elevations along the profile for each time step. We located the profile at 0.25 m because the method was not applicable farther down-fan: the convex nature of cross-fan profiles (e.g. Blair and McPherson, 1994a) meant that the minimum elevation was not always in the active channel for transects that were farther down-fan.
The orthomosaics were processed to generate binary (wet or dry) maps of the fan and channels at each time step. These flow maps quantified the proportion of the fan area covered by flow (referred to as the “wet fraction”). The flow maps were also used to count the number of channels at an arcuate cross-section 1 m down-fan (discounting seepage channels that were not connected to the fan head by surface flow; see Fig. S2 for cross-section location). We chose the 1 m cross-section as this was far enough down-fan that changes in flow pattern there represent changes on the fan as a whole. In addition to the cross-section analyses, change detection between successive flow maps revealed the area newly inundated in each minute, which was normalised by fan area to give Fn (Eq. 1), the percentage of the fan newly inundated in 1 min:
Change detection between the DEMs produced DEMs of difference (DoDs) that quantified the erosion and deposition in each minute. The DEMs were first smoothed with a 7×7 mm moving average filter (approximately the size of the largest grains). In the resulting DoDs, patches of erosion or deposition with a planform area of less than 2 cm2 were discounted; elevation change of <2 mm was also discounted.
A general understanding of the fan responses to constant or oscillating sediment supply can be gained from the time-lapse videos (these show the fan from ∼12 h onward): https://youtu.be/ML2LV28MQEM (last access: 3 November 2022) (Run CON), https://youtu.be/jXjWIkLU-7A (last access: 3 November 2022) (Run OSC10), https://youtu.be/T4JbZC9YkXQ (last access: 3 November 2022) (Run OSC20), and https://youtu.be/EcCWYGIbsqA (last access: 3 November 2022) (Run OSC40). Figure 4 also has links to these videos. Note that frames were collected at 1 min intervals for Run CON and 10 s intervals for Runs OSC10–OSC40, so the video speed differs. These videos demonstrate how the fan responded to constant sediment supply (Run CON) or sediment supply oscillations (Runs OSC10–OSC40). Flow became more diverging when the sediment supply was turned on (see also upper row, Fig. 4) and more channelised when the supply was cut off (middle row, Fig. 4). The videos show that rapid lateral migration and channel readjustment followed each change in the sediment supply.
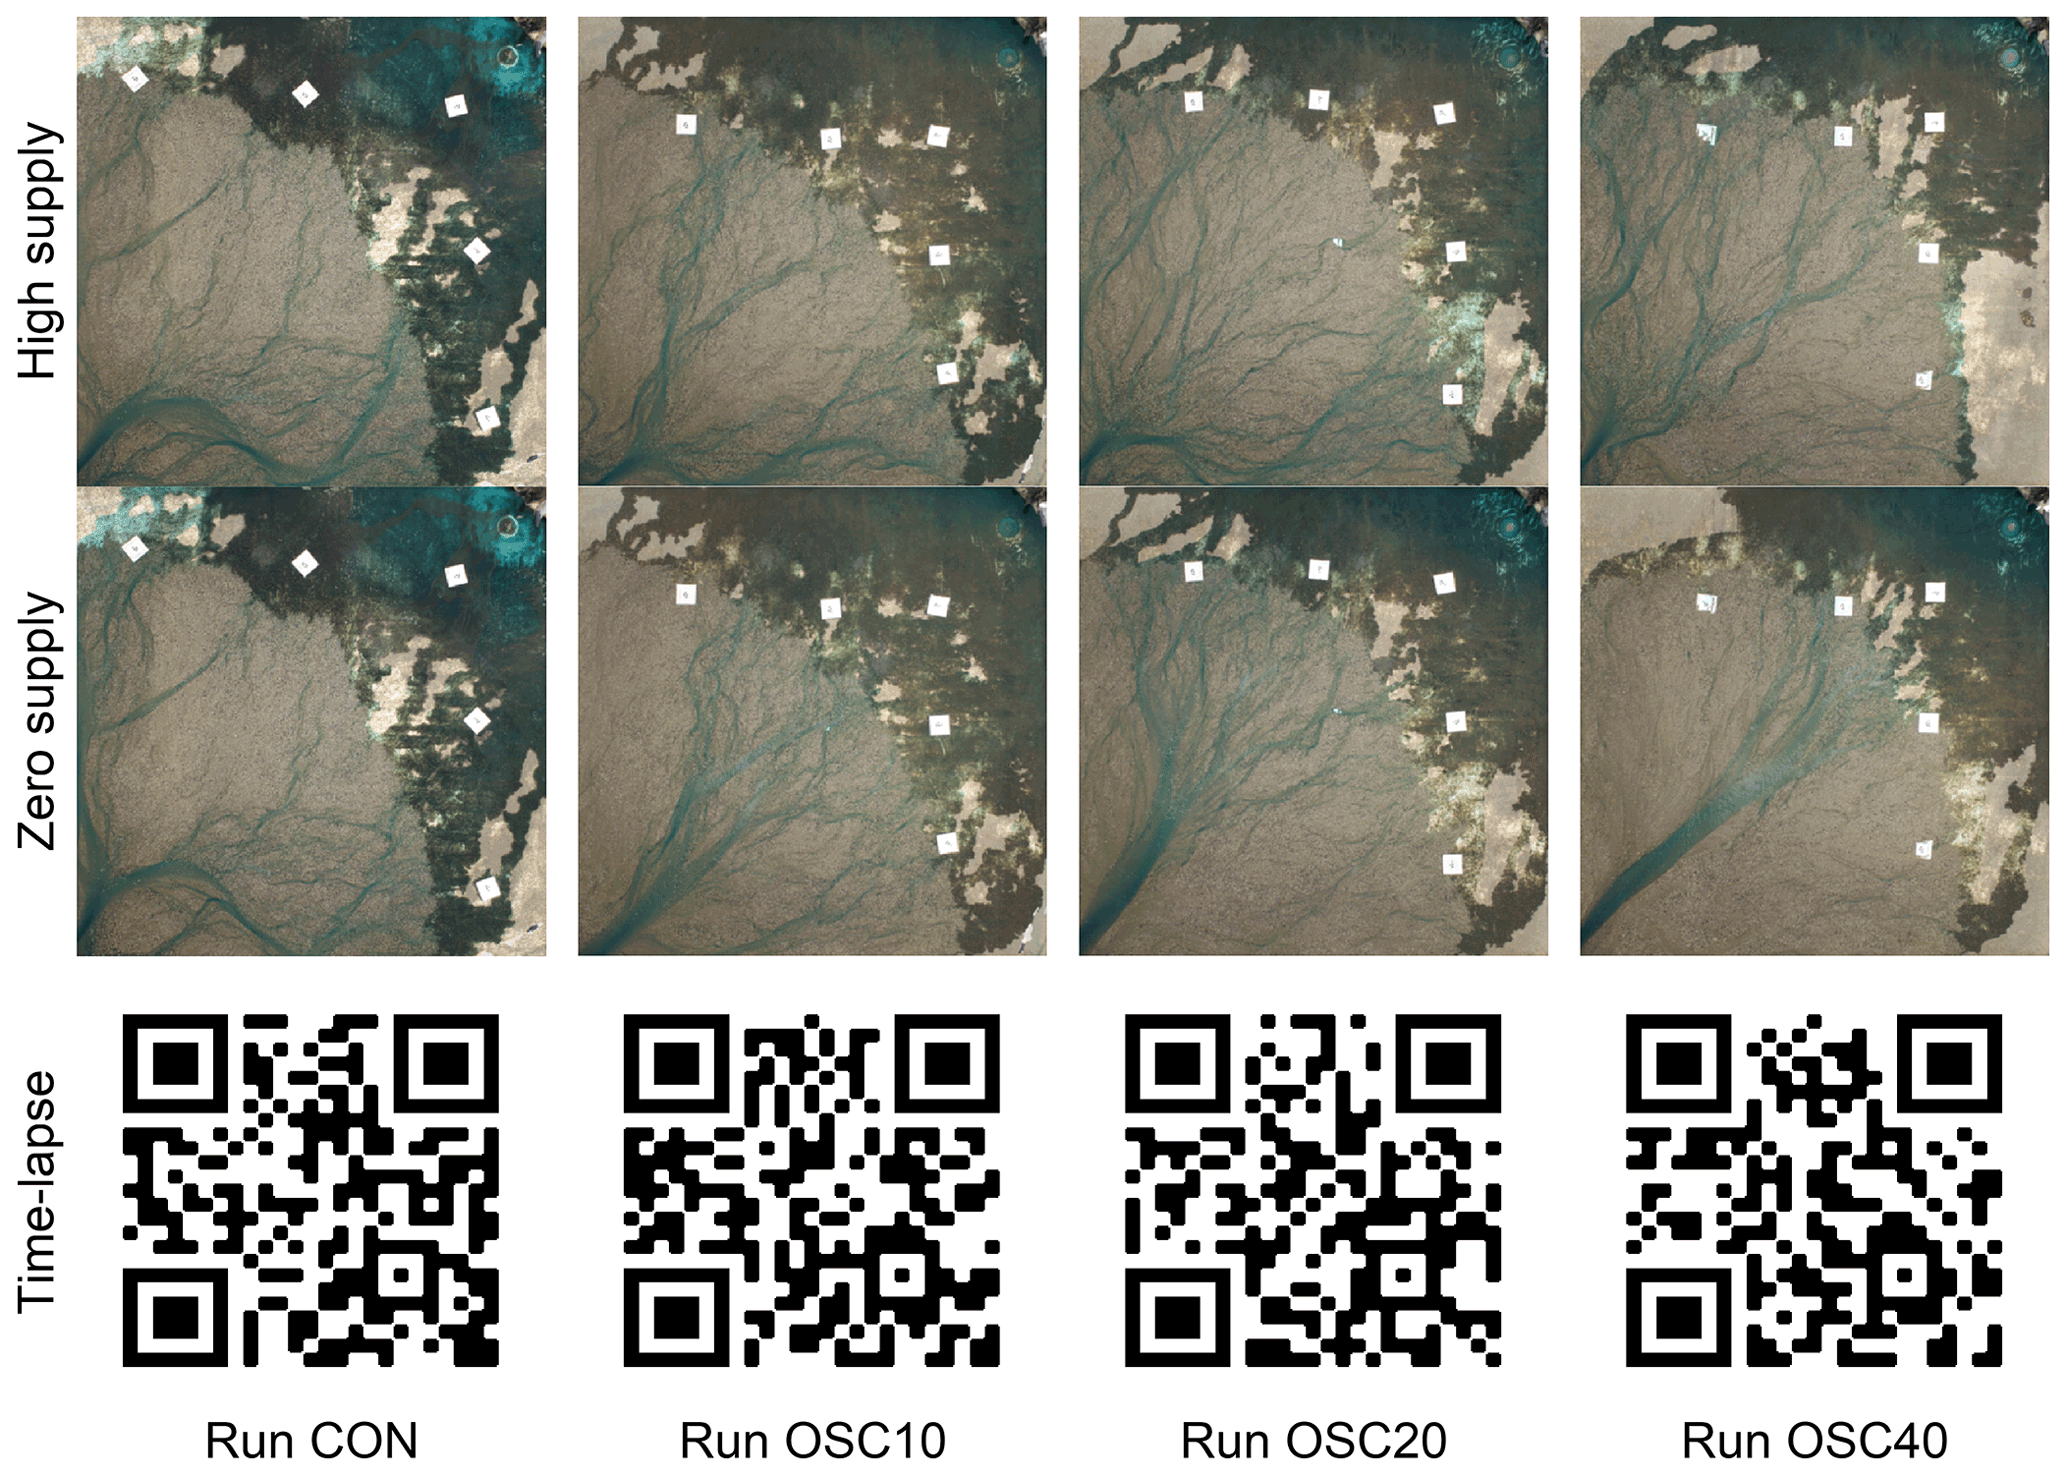
Figure 4Example fan morphology after a period of high sediment supply (upper row panels) and zero sediment supply (middle row panels). Note that Run CON had no supply oscillations but has been sampled at the same time stamps as Run OSC10 for comparison. Lower row: QR codes that link to each experimental time-lapse video. The videos are also available at https://youtu.be/ML2LV28MQEM (last access: 3 November 2022) (Run CON), https://youtu.be/jXjWIkLU-7A (last access: 3 November 2022) (Run OSC10), https://youtu.be/T4JbZC9YkXQ (last access: 3 November 2022) (Run OSC20), and https://youtu.be/EcCWYGIbsqA (last access: 3 November 2022) (Run OSC40).
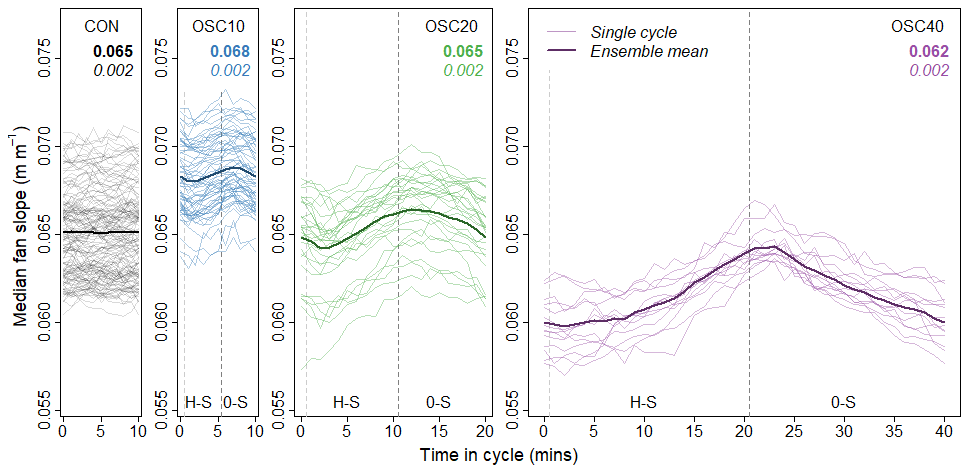
Figure 5Median fan slope (for the whole fan) versus time in the sediment supply oscillation cycle. The thin lines represent each individual supply oscillation cycle; the thick line is the ensemble mean. H-S denotes the high-supply period; 0-S denotes zero sediment supply. Coloured text indicates each experiment's time-averaged mean (in bold) and standard deviation (in italics).
3.1 Fan morphology
Down-fan gradient is one of the simplest descriptors of fan morphology. As fans are self-formed, it provides a useful metric for their self-organised adjustment to the input conditions or changes thereof. Figure 5 shows how the median down-fan slope differed across the four experiments and how it adjusted during high- and zero-supply conditions.
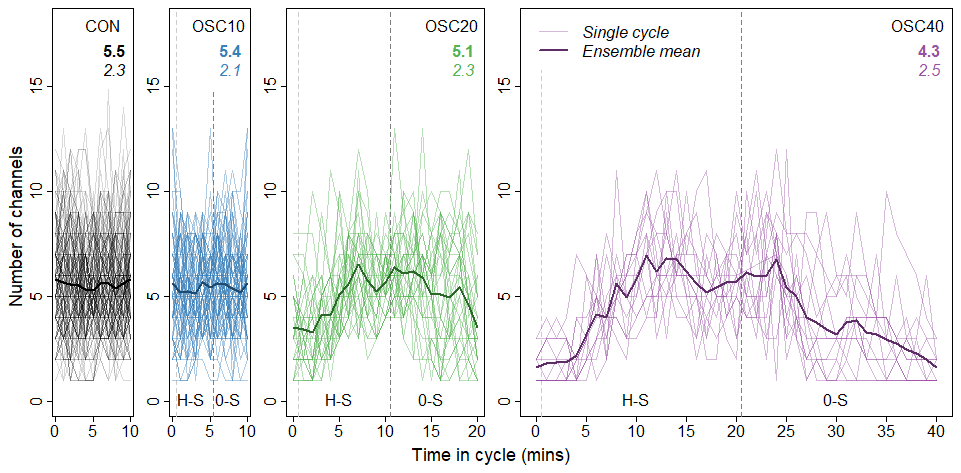
Figure 6The number of connected channels versus time in the sediment supply oscillation cycle. The number of channels was measured along a transect 1 m down-fan. The thin lines represent each individual supply oscillation cycle; the thick line is the ensemble mean. H-S denotes the high-supply period; 0-S denotes zero sediment supply. Coloured text indicates each experiment's time-averaged mean (in bold) and standard deviation (in italics).
Figure 5 shows that, compared to Run CON (constant sediment supply), the fan was steeper with short-duration sediment supply oscillations (Run OSC10); it became flatter as the duration of the oscillations increased (Runs OSC20–OSC40). The fan steepened during high-supply periods and regraded to a lower slope during zero-supply periods. This partly explains the trend in slope across the four experiments: during high-supply periods, sediment was deposited on the fan head, steepening the fan, but during zero-supply periods the channel incised this material, lowering the fan slope. There was a lag of 2–3 min between the onset of a new sediment supply rate and the geomorphic response. In the 10 min cycle in Run OSC10, the 5 min of zero-supply conditions was insufficient to completely incise the new material at the fan head, leading to a fan that was steeper than it would be with constant sediment supply (Run CON). Conversely, in the 40 min cycle in Run OSC40, the fan head was deeply incised during the 20 min of zero supply, reducing overall fan gradient. The spatial pattern of erosion and deposition, linked to these slope adjustments, is considered further in Sect. 3.4.
Figure 5 shows how median fan slope declined during zero-supply periods. However, the fan-head incision during zero-supply periods may in fact have meant that the slope along the fan channel declined even farther than indicated by Fig. 5. Table 1 suggests that the mean depth of fan-head trenching increased from Run OSC10–OSC40 (see also Figs. S5–S7). These values indicate that channel gradients (as opposed to fan gradients) at the end of the zero-supply periods were likely even lower than the median fan gradients shown in Fig. 5.
Table 1The mean, maximum, and standard deviation in the depth of fan-head trenching (in mm) at an arcuate cross-section across the fan head placed at 0.25 m down-fan. Depth estimates are accurate to within 1.5 mm (90 % confidence).

3.2 Channel patterns
Channel patterns (and channel pattern change) provide a metric for how flow on the fan self-organises to transport the available sediment supply. Here, channel pattern is characterised using two variables: the number of connected channel threads at 1 m down-fan (Fig. 6) and the portion of the fan occupied by flow (Fig. 7).
Figure 6 shows that flow became more branching in high-supply periods, with the number of channel threads increasing. Conversely, flow became more channelised in zero-supply periods, with the number of channel threads decreasing.
The number of channel threads was slow to respond to a change in sediment supply rate. Consequently, the variability in the mean number of channels is similar between Run CON (constant sediment supply) and Run OSC10 (10 min supply oscillation cycle). Moreover, there is insufficient time for flow to channelise in the 5 min zero-supply periods so that flow maintains a divergent pattern in Run OSC10 with a fairly high number of channel threads (five to six channel threads on average at 1 m down-fan). In comparison, the 20 min zero-supply duration in Run OSC40 means that fan-head trenching extends down-fan to the 1 m cross-section, bringing the mean number of channels down to around two at the end of the 40 min cycle.
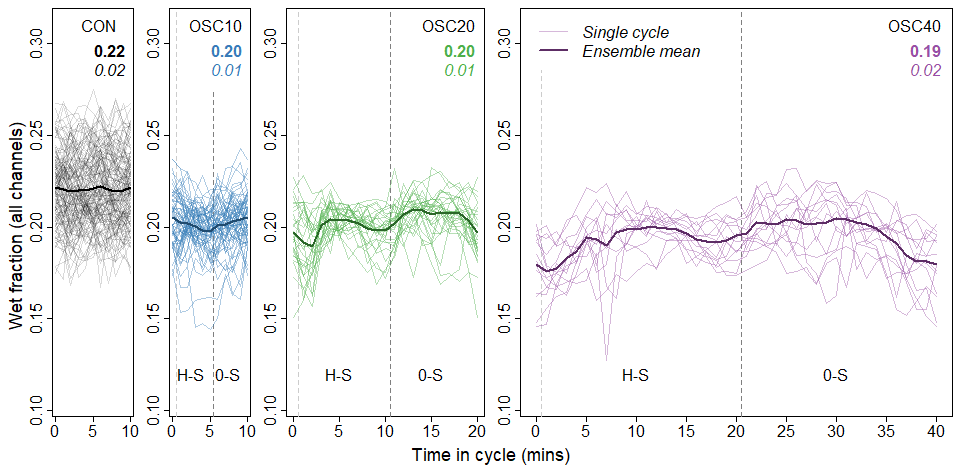
Figure 7Wet fraction (across the whole fan, measured from all channels) versus time in the sediment supply oscillation cycle. The thin lines represent each individual supply oscillation cycle; the thick line is the ensemble mean. H-S denotes the high-supply period; 0-S denotes zero sediment supply. Coloured text indicates each experiment's time-averaged mean (in bold) and standard deviation (in italics).
Comparing Figs. 5 and 6 indicates that fan gradient adjusted more readily than the channel pattern: fan gradient has a clear response to the changing sediment supply rate in Run OSC10, while the number of channels in Run OSC10 did not fluctuate more than in Run CON (with constant sediment supply). This is likely because channels were counted at 1 m down-fan, but the channel response to a change in sediment supply typically started at the fan head and propagated down-fan to the 1 m cross-section (see e.g. time-lapse video for Run OSC40). Extracting the number of channels at the 0.5 m cross-section confirms that the fan-head channel pattern responded more readily to changes in the sediment supply rate (see Fig. S3).
The second metric for channel pattern was the wet fraction: the proportion of the total fan area that was inundated with flow in a given minute. Variations in the wet fraction (Fig. 7) were more subtle than those in the number of channels and provide a nuanced measure of how the flow pattern adjusted to changes in the sediment supply rate.
Figure 7 shows that, as with the number of channel threads, there was a lag of a few minutes before the wet fraction began to adjust to a change in the sediment supply. Consequently, the rapid supply oscillations in Run OSC10 (10 min cycle) had little impact on the wet fraction; its variation through time was similar to that with constant sediment supply (Run CON). During Runs OSC20 and OSC40, the longer durations of high- and zero-supply periods show more clearly how the wet fraction adjusted to the sediment supply rate. At the start of high-supply periods, the wet fraction increased after an initial lag, as flow widened and shallowed and/or slowed. A close examination of the experimental videos reveals that this increase was not through sheet flow or the complete abandonment of channelised flow, but through flow divergence into numerous channel threads that were often poorly defined and interconnected, as with braided streams. Toward the end of the high-supply period, the wet fraction decreased, suggesting that flow ultimately organised into fewer, deeper channels (although still more channels than during zero-supply periods). Close examination of Fig. 6 supports this notion.
At the start of zero-supply periods, the wet fraction increased briefly, showing that a larger portion of the fan was inundated as flow readjusted to the reduced sediment concentration. However, the number of channel threads decreased during this period, as did the sector of the fan occupied by the flow (Figs. 6 and S4). Their decrease implies that flow was collecting into fewer channels, but that those channels were initially shallow (or slow) and wide as the total area of flow was high. Toward the end of the zero-supply period, the wet fraction decreased, suggesting that channels were becoming deeper (or faster) and narrower as the flow area decreased. These changes can also be seen in the experimental videos.
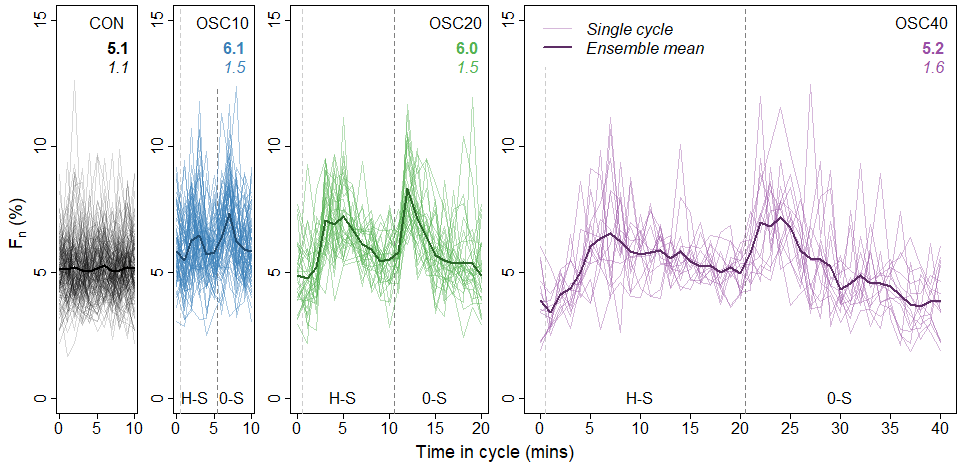
Figure 8Fn (across the whole fan) versus time in the sediment supply oscillation cycle. The thin lines represent each individual supply oscillation cycle; the thick line is the ensemble mean. H-S denotes the high-supply period; 0-S denotes zero sediment supply. Coloured text indicates each experiment's time-averaged mean (in bold) and standard deviation (in italics).
3.3 Lateral mobility
In addition to characterising channel patterns, we also monitored channel change. Here, we characterise lateral channel mobility by measuring Fn, the percentage of the fan area that is newly inundated in a given minute. High Fn values imply either avulsion, a rapid channel sweep across the fan, or a rapid change in channel pattern (e.g. divergence from single- to multi-threaded flow). Conversely, a low Fn reflects a relatively stable channel.
Figure 8 shows how lateral mobility (Fn) varied during each sediment supply oscillation cycle. After any change in the sediment supply, lateral mobility peaked, with the channel adjusting rapidly to the altered sediment concentration. The experimental videos show that, when the sediment supply was turned on, rapid divergence into a multi-threaded flow pattern caused this peak in lateral mobility. Conversely, when the sediment supply was cut, the videos show rapid fan-head trenching, cutting off the flow to the diverging channel threads and rapidly redirecting flow into a single (and often new) channel, again raising mobility rates. This peak decayed gradually during both high- and zero-supply periods. The lowest Fn values, implying the most stable channel pattern, were attained in Runs OSC20 and OSC40 at the end of the zero-supply periods. This stability reflects an incised channel, which must be filled with sediment in the next high-supply period before rapid migration can recommence. Such channel filling thus delayed the onset of peak mobility in the following high-supply period, with the high-supply mobility peak occurring later in Runs OSC20 and OSC40, as those runs had longer zero-supply periods in which the channel became more entrenched at the fan head. These results mirror a set of experiments by Vincent et al. (2022), in which longer-duration low-flow periods between debris floods increased the time required for a debris flood to cause avulsion.
3.4 Morphologic reworking
In addition to the lateral mobility computed by comparing flow maps, we calculated rates of vertical change (i.e. erosion and deposition) by performing change detection between successive DEMs. Figure 9 shows the volumes of sediment deposited or eroded in each minute of the sediment supply oscillation cycle.
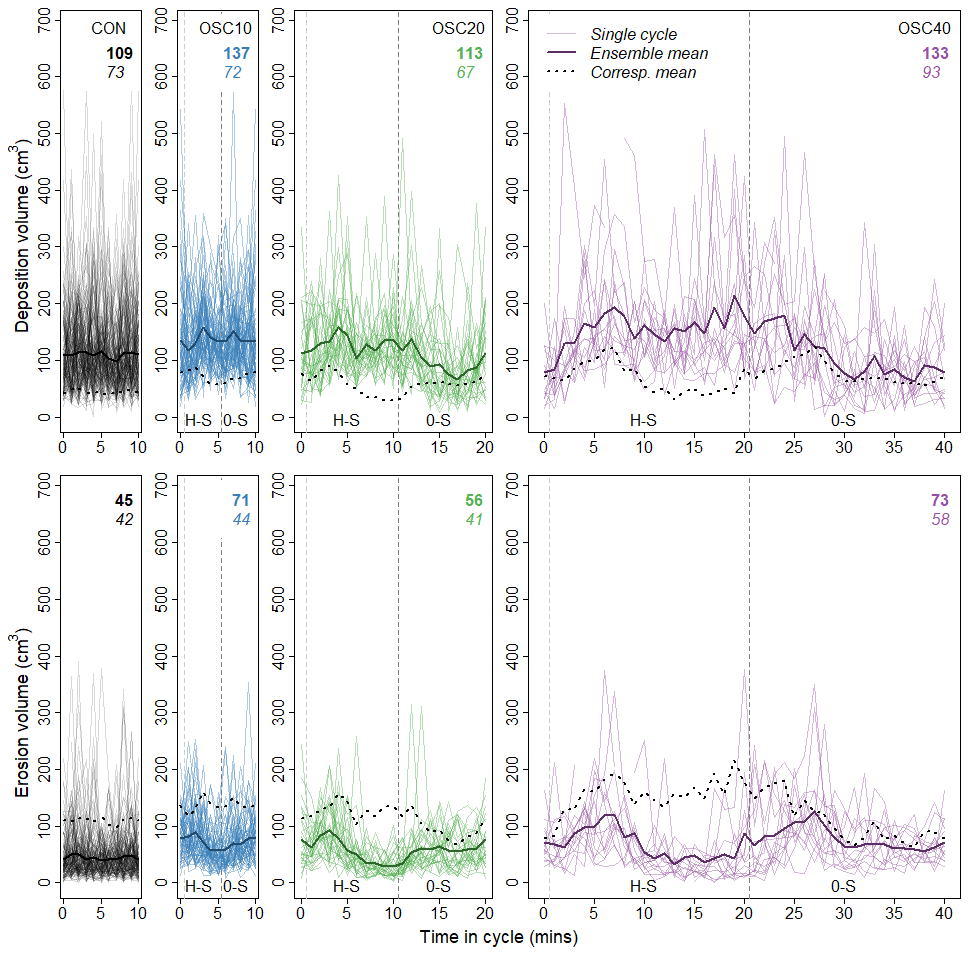
Figure 9Deposition and erosion volumes (across the whole fan) versus time in the sediment supply oscillation cycle. The thin lines represent each individual supply oscillation cycle; the thick lines are the ensemble means. The dashed black lines (“Corresp. mean”) show the mean from the corresponding upper or lower plot; for instance, the dashed black line in the top-right deposition plot shows the mean erosion volume from the plot below, allowing direct comparison of erosion and deposition. H-S denotes the high-supply period; 0-S denotes zero sediment supply. Coloured text indicates each experiment's time-averaged mean (in bold) and standard deviation (in italics). Figure S9 also overlays these data for comparison.
Figure 9 indicates that the addition of short sediment supply oscillations in Run OSC10 increased the erosion and deposition rates on the fan compared to Run CON with constant sediment supply. The temporal variation in erosion and deposition was similar in Run OSC10 and Run CON, although the timing of peaks in Run OSC10 followed the same pattern as Runs OSC20 and OSC40, described below.
In Runs OSC20–OSC40, deposition (top row) increased during high-supply periods. The increase was gradual, with peak deposition coming several minutes after the onset of high-supply conditions. This reflects the fact that deposition began in the feeder channel upstream of the fan head, which buffered the fan from the immediate effect of changes in environmental conditions in the same way that a confined upstream reach would in a natural system. When the sediment supply was turned off, deposition rates remained high for a few minutes as sediment in the feeder channel was mined. Deposition rates then decreased toward the end of the zero-supply period.
Erosion (bottom row) also increased at the start of the high-supply period, even though deposition rates were high. This reflects a period of channel adjustment in response to the sudden increase in sediment supply. After the initial peak, erosion decreased to a minimum in the second half of the high-supply period. When the zero-supply period commenced, erosion accelerated, reflecting the rapid lateral migration (Fig. 8) at this time. After the initial increase, erosion rates stabilised during the zero-supply period. This was particularly evident in Runs OSC20 and OSC40, wherein erosion and deposition rates were approximately equal toward the end of the zero-supply periods. Their similarity implies that, through fan-head trenching during the zero-supply period, the fan reached a form of equilibrium with the imposed flow rate and the supply of sediment from incision. Although erosion and deposition occurred, there were no major peaks, suggesting that there was little channel reorganisation. Instead, a condition of relative stability persisted, with the channel gradually incising the fan head and depositing sediment on the lower fan.
The average spatial patterns of erosion and deposition are revealed in Fig. 10, which demonstrates the effects of lengthening the sediment supply oscillations. During high-supply periods (top row), deposition was concentrated at the fan head and particularly in the fan-head trench (most visible in Runs OSC20 and OSC40). Downstream of this deposition was a focused erosion zone. As the duration of the sediment supply oscillation cycle increased, this deposition–erosion couplet extended farther downstream. The deposition zone became more elongate, emphasising the filling of the fan-head trench, while the erosion zone shifted farther down-fan.
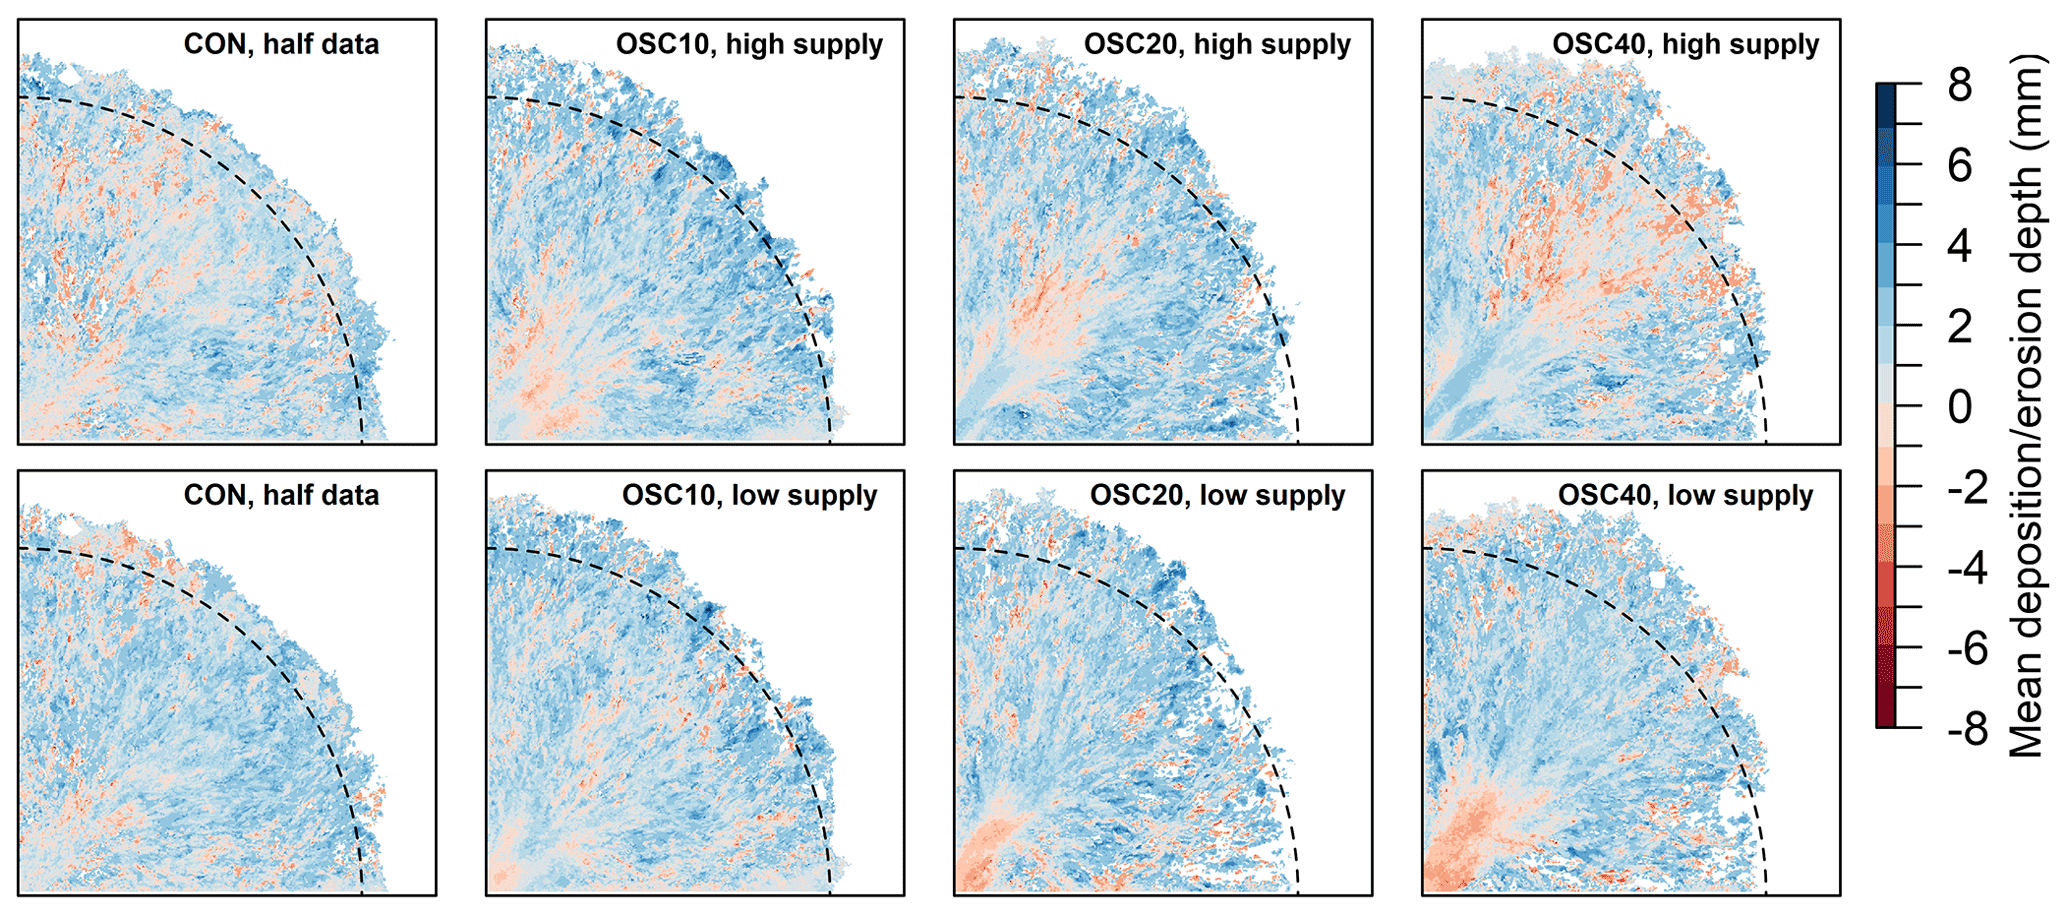
Figure 10Spatial patterns of erosion (red) and deposition (blue). All 1 min DoDs for high-supply (above) and zero-supply periods (below) were averaged to show the typical pattern. Data from Run CON are split into the same groups as Run OSC10, although the former had no sediment supply oscillations; the Run CON data show how deposition and erosion varied randomly in comparison to the spatially organised erosion and deposition in Runs OSC10–OSC40. The semicircle at 2 m down-fan shows how the central fan became more elongate as the sediment supply oscillations lengthened. To maintain the same data density (and therefore signal-to-noise ratio), the data for Run CON displayed here are only from the second repeat of this experiment, which was closest to the mean slope and area across the three repeats of Run CON.
During zero-supply periods, trenching at the fan head was again clear, with a zone of focused erosion at the fan head. The erosion zone and fan-head trench extended down-fan as the duration of the zero-supply period increased. A zone of focused deposition radiated from the downstream end of the fan-head trench and is particularly visible in Runs OSC20 and OSC40. This pattern indicates that, during the longer zero-supply periods in Runs OSC20 and OSC40, the fan-head trench incised and acted as a conduit for sediment eroded from the feeder channel. The morphology of the fan-head trench is also visible in the cross-fan topographic profiles in Figs. S5–S7.
The cumulative effect of this coupled fan-head trenching and lower-fan deposition can be viewed by comparing the fan shapes in Fig. 10. Each DoD compilation in this figure was masked to the fan planform at 18 h of experimental run time; the same total volume of water and sediment had been delivered to each fan. Nevertheless, as the durations of sediment supply oscillations increased, the fan shape became more elongate: the mid-fan (axial) radius increased from Run OSC10 to OSC40, while the side radius remained comparable across all runs. This reflects fan-head trenching and sediment transfer from the upper to lower fan during the zero-supply periods, which lengthened the central fan.
By alternating between a high sediment supply rate and no sediment supply and by varying the duration of oscillations, these experiments permit the investigation of two key phenomena on alluvial fans. The first is the fan-channel response to abrupt changes in sediment concentration. The second is the response of fan dynamics and morphology to the frequency and duration of sediment supply oscillations. Through comparing constant- and oscillating-supply experiments, this paper also considers the (im)propriety of substituting a constant sediment supply for a naturally variable one when modelling alluvial fans in the lab.
These experiments have demonstrated how fan channels respond to an abrupt increase in the sediment supply rate (and therefore the sediment concentration). The primary responses were steepening, an increased number of channels, and increased inundated area. This was accompanied by a rapid increase in lateral mobility that tailed off as the flow pattern stabilised and by a peak in erosion rate during this channel adjustment phase. Deposition was generally high during high-supply periods.
When sediment supply was abruptly cut off, the fan responded through slope reduction and channelisation. The inundated area was high at first, while flow adjusted toward a single channel, but then decreased as that channel incised. Similarly, there was a steep but short-lived peak in lateral mobility as the flow pattern adjusted. This pulse of lateral mobility was accompanied by an increase in erosion that stayed high during the zero-supply period due to fan-head incision. Meanwhile, the deposition rate gradually decreased, eventually equilibrating with the erosion rate in the runs with longer zero-supply periods.
Extending the length of the sediment supply oscillations altered fan morphology, even though the mean sediment supply rate was unchanged. Short oscillations led to sediment accumulation at the fan head, steepening the fan in comparison to the constant supply experiment and generating diverging, laterally active channels. Conversely, longer oscillations allowed the channel to incise the fan head, shifting the zone of geomorphic activity farther down-fan and giving rise to a flatter gradient and more elongated fan shape.
4.1 Sediment concentration variability on fans in the field
These similarity-of-process experiments are a simple but useful model of fan dynamics (Hooke, 1968a; Paola et al., 2009). The different scenarios explore the limits of fan behaviour: while there are few situations in which fans abruptly alternate between high-supply conditions and clearwater floods, wide temporal variations in sediment concentration do occur on fans and in steep, gravel-bed streams (e.g. Garcia et al., 2000; Habersack et al., 2001; Hayward and Sutherland, 1974; Kuhnle, 1992; Mao et al., 2014; Meyer and Wells, 1997; Reid et al., 1985; Wasson, 1974; Wells and Harvey, 1987). Our experiments show how fan channels respond to some of the widest possible variations in sediment concentration; one could expect lower-amplitude variability to generate dampened but qualitatively similar responses.
On fans in the field, wide variations in sediment concentration can occur during a single flood event or between successive events. For instance, sediment exhaustion over the course of a storm can rapidly decrease sediment concentration during a flood event (Meyer and Wells, 1997; Wasson, 1974; Wells and Harvey, 1987). Similarly, debris flow control nets are designed to trap coarse sediment but transmit water and fine sediment (Wendeler et al., 2007; Wendeler and Volkwein, 2015); therefore, their emplacement in source basins can lower the bedload sediment concentration in flows reaching fans. Lower-amplitude sediment concentration variations have also been observed during floods in gravel-bed rivers (e.g. Garcia et al., 2000; Habersack et al., 2001; Hayward and Sutherland, 1974; Kuhnle, 1992; Mao et al., 2014; Reid et al., 1985).
The experiments presented in this paper provide a controlled analogue to the scenarios described above; the experimental results indicate how fans in the field may respond to different scales of variability. For instance, the changes in channel pattern and lateral migration in Run OSC10 (see Figs. 6 and 8) were minor, suggesting that short-term fluctuations in the sediment concentration do not strongly influence channel pattern. Although Run OSC10 had the steepest slope (Fig. 5), this likely reflects the high amplitude of the sediment supply rate variations from 0 to 10 g s−1. A preliminary experiment with lower-amplitude variations but the same mean sediment supply rate and oscillation duration generated a less-steep fan (Fig. S8). Consequently, it seems that small-scale, short variations in sediment concentration during a flood will have little influence on the overall channel pattern or fan gradient.
Conversely, the experiments show that longer-duration or larger-amplitude variations in the sediment concentration do impact fan-channel adjustment during high flows and may have longer-term implications for fan morphology. For instance, depletion of the sediment supply to a fan during a storm event may mean the channel responds through rapid lateral migration and erosion, as in Runs OSC20 and OSC40 (Fig. 8). Similarly, emplacement of a debris retention structure which reduces sediment concentration during subsequent flood events might lead at first to lateral migration and eventually to fan-head trenching.
While these experiments highlight the impact of rapid changes in sediment concentration, they also underscore the importance of clearwater flow for shaping fan and channel morphology, particularly the fan-head trench. Such trenches are ubiquitous in natural fans of varying ages in varying climates (e.g. Bowman, 1978; Bluck, 1964; Davies and Korup, 2007; Dorn et al., 1987; Harvey, 1987; Mather and Hartley, 2005, among others). Previous experimental studies have suggested that an incised fan-head trench can develop in the absence of external perturbations: that is, when water and sediment are supplied at constant rates (Clarke et al., 2010; Van Dijk et al., 2012; Schumm et al., 1987; Whipple et al., 1998; Zarn and Davies, 1994). Nevertheless, the constant flow and sediment supply experiment presented here (Run CON) had a relatively high sediment supply and wide grain size distribution relative to previous experiments, so the channel planform was highly dynamic throughout the experiment (see Leenman and Eaton, 2021). This dynamism meant that a single channel never persisted for long enough to allow significant fan-head trenching.
In contrast, a distinct fan-head trench did develop in Runs OSC20–OSC40, with longer sediment supply oscillations. It is interesting to note that there was no notable fan-head trench in a related set of experiments with short-duration flow variability (published in Leenman et al., 2022) or in the experiment with short-duration sediment supply variability (Run OSC10). These results suggest that longer-term sediment concentration variations (and particularly periods of lower-than-average sediment supply) encourage the formation of an incised fan-head trench. Figure 6 suggests one explanation for this phenomenon: the number of channels decreased during periods of low sediment concentration, as flow collected into a few main channel threads. This flow contraction then concentrated the erosive activity of the channel into a narrow sector of the fan (see also Fig. S4), which likely enhanced the rate of down-cutting and trench formation. This down-cutting further concentrated flow at the fan head in a positive feedback, as lateral migration was most restricted at the end of the zero-supply periods (especially in Run OSC40). The zero-supply periods in Run OSC10 were too short for this down-cutting mechanism to be effective, so a distinct trench did not form all the way down to the 1 m transect we analysed. This result highlights how fan responses to disturbance are governed by the fan's adjustment timescale. Disturbances may not alter fan morphology if the duration of or time between disturbances is shorter than the adjustment timescale. Figure 6 therefore suggests that, at least for the formation of a fan-head trench in response to sediment supply exhaustion, our experiments' adjustment timescale must be between 5 and 10 min.
In our experiments and in some active fans in the field, the fan-head trench fills when sediment supply is high; in nature, this may occur when landslides temporarily raise the sediment supply (e.g. Davies and Korup, 2007). A fan-head trench does not necessarily require a clearwater flood event in order to develop: experiments by Vincent et al. (2022) showed that even low-flow periods with no sediment supply were capable of incising a fan-head trench given a sufficiently long period. An additional implication of the experiments in this paper, supported by the work of Davies and Korup (2007) and Vincent et al. (2022), is that the impact of floods with high sediment concentration is mediated by the depth and length of the fan-head trench, as this depression must be filled before avulsion can occur at the fan head.
In the field, depositional events on fans have formed deposits of a size comparable to that generated by the high-supply periods in these experiments. In Runs OSC10–OSC40, fan-head trenches were on average 9–14 mm deep, respectively; over all areas of topographic change (including erosion) the mean depth of topographic change in high-supply periods was 2–4 mm, respectively. The ratio of deposition depth to trench depth therefore ranged from 0.2–0.3. On fans in southwestern New Zealand, Davies and Korup (2007) observed depositional lobes ∼1–5 m thick on fans with trenches ∼10 m deep, giving similar ratios of 0.1–0.5. Following the 2010 landslide and debris flow at Mount Meager, British Columbia, debris-flow sediment completely filled a creek in an incised trench of 5–15 m depth (a ratio of 1.0), thinning downstream to around 2 m (a ratio of 0.1–0.4) (Guthrie et al., 2012). In northeastern New Zealand, post-logging deposition on fans ranged from <1 to ∼10 m in depth, in one case filling an incised fan-head trench by 12 m (Leenman and Tunnicliffe, 2020). These comparisons demonstrate how the size of depositional events relative to fan-channel dimensions are similar in the model and some field examples. Moreover, the comparisons highlight the relatively large depth of fan-head incision that can occur during prolonged periods of clearwater flow.
Parallels can be drawn between our experimental fans and natural fans formed by basins that are supply- or transport-limited. For instance, a transport-limited basin is less likely to have frequent or prolonged clearwater floods. Such a basin is most similar to Run CON or OSC10, and one might therefore expect it to generate a steeper fan with diverging, laterally active channels, all other things being equal. Conversely, a supply- or “weathering-limited” basin (Bovis and Jakob, 1999) might have more frequent or prolonged clearwater floods or floods with low sediment concentration. It is therefore more similar to Runs OSC20 or OSC40, and one might expect it to generate a fan with a lower gradient and more incised fan-head trench that is relatively stable, punctuated by periods of high lateral activity and more divergent flow when hillslope erosion generates peaks in the sediment concentration (such as that observed on the Poerua fan by Davies and Korup, 2007).
Climate change is increasing the frequency and severity of extreme weather events that lead to floods (IPCC, 2022). In transport-limited basins, such changes could increase the frequency of flood events with high sediment concentration, making fan behaviour more similar to Run CON or OSC10. Conversely, in supply-limited basins, this hydroclimatic change could increase the frequency of floods capable of reworking the fan and may have less impact on the sediment supply (depending on the nature of hillslope erosion). Such a change might make fans more similar to Runs OSC20 or OSC40.
4.2 Sediment supply oscillations and fan form
Studies of alluvial fans have sought for many decades to relate fan area and slope to source basin morphometry (e.g. Al-Farraj and Harvey, 2005; Beaumont, 1972; Bull, 1964; Crosta and Frattini, 2004; Denny, 1965; De Scally and Owens, 2004; Harvey, 1984; Hooke, 1968b; Kostaschuk et al., 1986; Lecce, 1991; Melton, 1965; Milana and Ruzycki, 1999; Oguchi and Ohmori, 1994; Saito and Oguchi, 2005; Silva et al., 1992; Stokes and Mather, 2015; Stokes and Gomes, 2020; Tomczyk, 2021). A key goal of those studies was to untangle the sources of scatter in such relationships, thereby elucidating the controls on fan slope and area. For instance, scatter has been attributed to fan setting (e.g. tributary junction vs. mountain front; Al-Farraj and Harvey, 2005), downstream valley width (Stokes and Mather, 2015), and depositional process (debris flow vs. fluvial; De Scally and Owens, 2004).
While studies of fan and catchment morphometry have contributed a great deal to our understanding of alluvial fans, linking catchment and fan variables rests upon the assumption that fans have reached (or will reach) an equilibrium with their source catchment. This is not always the case; the sediment supply to fans oscillates at periods ranging from single events (e.g. Cabre et al., 2020) to orbital cycles (e.g. Blechschmidt et al., 2009). In fact, this temporal variability gives rise to the concept of alluvial fans as environmental “indicators” that record changes in sediment supply (Harvey, 2012). Our experiments show how, over many successive cycles, such oscillations in the “upstream” conditions of an alluvial fan can alter fan morphology, even for the same average sediment supply rate. Consequently, our results reveal another potential source of scatter in relationships between basin and fan morphometry: the periodicity of sediment inputs.
The flattening and lengthening of our experimental fans with increasing oscillation duration (see Fig. 10 in particular) also suggest that, in the field, we can infer something of the sediment supply histories of fans based on their elongation. For instance, fans that have a shorter, more “stacked” morphology might form from high-frequency oscillations. Conversely, fans with more “telescoping” morphologies (like that of Run OSC40) might reflect a more intermittent sediment supply, with longer-term periods of high and then low sediment supply. In particular, longer periods of low sediment supply likely allow for sediment redistribution from the upper to lower fan, forming a fan-head trench and telescoping lower fan. Figure 10 suggests that the fan-head trench becomes more elongate (and the intersection point farther down-fan) as the duration of a low sediment supply period lengthens. One example of a set of natural fans with elongate, telescoping morphologies is the mountain front fans along the west of the Musandam Mountains (Al-Farraj and Harvey, 2005). Prolonged periods of higher monsoonal rainfall throughout the late Quaternary have driven long-term changes in the sediment supply in this region (Blechschmidt et al., 2009), which may account for these fans' telescoping morphology.
4.3 A representative sediment supply rate?
These experiments show how sediment supply fluctuations can affect fan morphology and channel patterns. However, they also highlight a problem in the common approach to physical models of alluvial fans: that of constant sediment supply as an approximation for a range of variable sediment supply rates in the field. While the temporal variations imposed in Runs OSC10–OSC40 were almost as simple as possible, they nevertheless generated fans with morphology, channel patterns, and behaviour that were different from Run CON, with constant sediment supply. Moreover, fan morphology varied systematically with the duration of high- and zero-supply periods. These findings indicate that constant sediment supply rates poorly represent fans in the field that are governed by episodic sediment supply.
It might be possible to find a “representative” sediment supply rate which generates the same fan slope as would a series of episodic sediment delivery events. For instance, median fan slope was similar in Run CON (constant sediment supply) and Run OSC20 (20 min oscillation cycle). One could infer that the 20 min cycle in Run OSC20 may represent some kind of “characteristic event periodicity” for the given sediment supply and flow rates, with the 10 min cycle being too short (and therefore producing steeper fans) and the 40 min cycle being too long. However, while Runs CON and OSC20 produced similar fan slope, geomorphic activity was much more variable in Run OSC20, with higher extreme values of lateral and topographic change. Consequently, when seeking to model natural hazards on fans, it might be appropriate to choose a higher representative sediment supply or to include oscillations about the mean. Although doing so may misrepresent fan slopes, it is more likely to capture the extreme values of erosion or lateral migration which are of interest for understanding and managing natural hazards.
Other experimental studies have explored how sediment supply alters fan gradients and channel dynamics (Ashworth et al., 2004; Bryant et al., 1995; Delorme et al., 2018; Whipple et al., 1998). However, those experiments featured constant sediment supply rates. The experiments presented here show that both fan gradient and channel dynamics vary systematically with the duration of sediment supply oscillations. These results raise the possibility of equifinality: natural fans with steeper gradients and laterally active channels may result from high sediment supply, rapid fluctuations between high and low sediment concentrations, or some combination of both. Moreover, it is possible that long-term average sediment supply and the intermittency of sediment inputs could covary in natural fans, making these two controls difficult to separate. Series of shorter and longer sediment supply periods likely occur as well, which may generate legacy effects depending on their sequencing. Further experiments varying both the mean sediment supply and the duration of supply oscillations could aid in addressing these questions.
This paper presents the results of four experiments with the same mean sediment supply rate and a constant flow. Three of the experiments alternated between a high supply rate and no sediment supply, with the duration of the oscillations varying between experiments. The experiments addressed (a) how fan channels respond to abrupt changes in sediment concentration and (b) how fan dynamics and morphology vary with the duration of sediment supply oscillations.
The experiments showed that, when sediment concentration increased abruptly, fans steepened and flow diverged into more channel threads, inundating a larger fraction of the fan. Lateral mobility and erosion rates were high at first before the channel pattern stabilised. Deposition rates remained high while sediment concentration was high. Conversely, when sediment concentration decreased abruptly, fans adjusted through slope reduction and channelisation. The inundated area, lateral mobility, and erosion rate were high at first until flow adjusted toward a single-channel state. The erosion rate remained elevated while sediment concentration was low due to fan-head trenching.
The duration of high- and zero-supply periods systematically affected fan morphology and channel dynamics. Short-term oscillations promoted fan-head deposition, steepening the fan and generating diverging, laterally active channels. Long-term oscillations promoted fan-head incision, shifting the zone of geomorphic “activity” down-fan and generating a flatter, more elongate fan.
These experiments, conducted with a constant “flood” flow, highlight how sediment concentration governs the geomorphic impact of a flood event on an alluvial fan. Debris retention structures designed to pass floodwater only, or natural sediment exhaustion during floods, prompt a reduction in sediment concentration. These experiments indicate the possible channel response in such a scenario.
The varying durations of high- and zero-supply periods in the experiments also demonstrate how different basin conditions might generate different fan morphology. Transport-limited basins, more similar to the short-oscillation experiment presented here, might be expected to have steeper slopes and more diverging flow. Supply-limited basins, more similar to the long-oscillation experiments here, might have gentler slopes and more channelised flow. The exact responses are likely to depend on the sediment concentration (and its variability) in the flow to fans, which was monitored only indirectly in this study by using sediment supply as a proxy.
Finally, the duration of sediment supply oscillations produced systematic variation in fan slope and area, even though all experiments had the same mean sediment supply rate. This raises the question of how closely experimental fans built with constant sediment supply can be said to represent fans in the field. While such experimental studies have revealed the importance of autogenic fan dynamics, our work builds on this foundation by modelling more “real-world” scenarios that are relevant for hazard management in changing hydroclimates. Future studies of alluvial fans could consider including supply variability when modelling how sediment supply affects alluvial fans.
Basic data processing steps were conducted using the code at https://github.com/a-leenman/phd_code/releases/tag/v1.0 (Leenman, 2022a). Code to conduct further analysis and produce the figures can be found at https://github.com/a-leenman/Leenman_Eaton_2022/releases/tag/v1.2 (Leenman, 2022b). Data underlying the figures, as well as back-up copies of the time-lapse videos and code, can be downloaded at https://doi.org/10.5281/zenodo.7100814 (Leenman and Eaton, 2022). The raw data from these experiments are still under analysis for subsequent publications; please email the corresponding author if you would like a copy.
Time-lapse videos of the experiments are available at https://youtu.be/ML2LV28MQEM (Leenman, 2022c) (Run CON), https://youtu.be/jXjWIkLU-7A (Leenman, 2022d) (Run OSC10), https://youtu.be/T4JbZC9YkXQ (Leenman, 2022e) (Run OSC20), and https://youtu.be/EcCWYGIbsqA (Leenman, 2022f) (Run OSC40).
The supplement related to this article is available online at: https://doi.org/10.5194/esurf-10-1097-2022-supplement.
ASL conceptualised the project, conducted the experiments, analysed the data, and wrote the paper. BCE conceptualised the project, edited the paper, and provided supervision throughout the project.
The contact author has declared that neither of the authors has any competing interests.
Publisher's note: Copernicus Publications remains neutral with regard to jurisdictional claims in published maps and institutional affiliations.
We dedicate this paper to the memory of Matthias Jakob, whose enthusiasm and insight played an influential role in our alluvial fan research. We are also grateful to Mike Church, Scott McDougall, and Sam Woor for lively discussions of fan dynamics and for helpful comments on an earlier draft. Thanks to Lucy Clarke and Anastasia Piliouras for their insightful reviews, which greatly improved our paper.
This research has been supported by the Natural Sciences and Engineering Research Council of Canada (Discovery Grant to Brett C. Eaton) and the University of British Columbia (Four-Year Fellowship to Anya S. Leenman).
This paper was edited by Fiona Clubb and reviewed by Lucy Clarke and Anastasia Piliouras.
Agisoft PhotoScan Professional: Structure-from-Motion photogrammetry software, https://www.agisoft.com/downloads/installer/ (last access: 3 November 2022), 2018. a
Al-Farraj, A. and Harvey, A. M.: Morphometry and depositional style of Late Pleistocene alluvial fans: Wadi Al-Bih, northern UAE and Oman, Geol. Soc. Lond. Spec. Publ., 251, 85–94, 2005. a, b, c
Ashworth, P. J., Best, J. L., Leddy, O., and Geehan, G. W.: The physical modelling of braided rivers and deposition of fine-grained sediment, in: Process Models and Theoretical Geomorphology, edited by: Kirkby, M. J., John Wiley & Sons Ltd, 115–139, ISBN 0471941042, ISBN 9780471941040, 1994. a
Ashworth, P. J., Best, J. L., and Jones, M.: Relationship between sediment supply and avulsion frequency in braided rivers, Geology, 32, 21–24, 2004. a, b, c
Beaumont, P.: Alluvial fans along the foothills of the Elburz Mountains, Iran, Palaeogeogr. Palaeocl., 12, 251–273, https://doi.org/10.1016/0031-0182(72)90022-3, 1972. a
Beaumont, P. and Oberlander, T.: Observations on stream discharge and competence at Mosaic Canyon, Death Valley, California, Geol. Soc. Am. Bull., 82, 1695–1698, 1971. a
Blair, T. C. and McPherson, J. G.: Alluvial fans and their natural distinction from rivers based on morphology, hydraulic processes, sedimentary processes, and facies assemblages, J. Sediment. Res., 64, 450–489, 1994a. a
Blair, T. C. and McPherson, J. G.: Alluvial fan processes and forms, in: Geomorphology of desert environments, edited by: Abrahams, A. D. and Parsons, A. J., Springer, 354–402, ISBN 978-94-015-8256-8, ISBN 978-94-015-8254-4 (eBook), https://doi.org/10.1007/978-94-015-8254-4, 1994b. a, b
Blechschmidt, I., Matter, A., Preusser, F., and Rieke-Zapp, D.: Monsoon triggered formation of Quaternary alluvial megafans in the interior of Oman, Geomorphology, 110, 128–139, https://doi.org/10.1016/j.geomorph.2009.04.002, 2009. a, b
Bluck, B. J.: Sedimentation of an alluvial fan in southern Nevada, J. Sediment. Res., 34, 395–400, 1964. a
Bovis, M. J. and Jakob, M.: The role of debris supply conditions in predicting debris flow activity, Earth Surf. Proc. Land., 24, 1039–1054, 1999. a
Bowman, D.: Determination of intersection points within a telescopic alluvial fan complex, Earth Surf. Process., 3, 265–276, 1978. a
Bryant, M., Falk, P., and Paola, C.: Experimental study of avulsion frequency and rate of deposition, Geology, 23, 365–368, https://doi.org/10.1130/0091-7613(1995)023<0365:ESOAFA>2.3.CO;2, 1995. a, b, c, d, e
Bull, W. B.: Geomorphology of segmented alluvial fans in western Fresno County, California, Tech. Rep. 352-E, US Geological Survey, https://doi.org/10.3133/pp352E, 1964. a, b
Cabre, A., Aguilar, G., Mather, A. E., Fredes, V., and Riquelme, R.: Tributary-junction alluvial fan response to an ENSO rainfall event in the El Huasco watershed, northern Chile, Prog. Phys. Geogr.: Earth Environ., 44, 679–699, 2020. a, b
Clarke, L., Quine, T. A., and Nicholas, A.: An experimental investigation of autogenic behaviour during alluvial fan evolution, Geomorphology, 115, 278–285, 2010. a, b, c
Crosta, G. B. and Frattini, P.: Controls on modern alluvial fan processes in the central Alps, northern Italy, Earth Surf. Proc. Land., 29, 267–293, 2004. a, b
Davidson, S. K., Hartley, A. J., Weissmann, G. S., Nichols, G. J., and Scuderi, L. A.: Geomorphic elements on modern distributive fluvial systems, Geomorphology, 180–181, 82–95, https://doi.org/10.1016/j.geomorph.2012.09.008, 2013. a
Davies, T. R. and Korup, O.: Persistent alluvial fanhead trenching resulting from large, infrequent sediment inputs, Earth Surf. Proc. Land., 32, 725–742, 2007. a, b, c, d, e, f, g, h, i
Davies, T. R., McSaveney, M. J., and Clarkson, P. J.: Anthropic aggradation of the Waiho River, Westland, New Zealand: microscale modelling, Earth Surf. Proc. Land/, 28, 209–218, 2003. a
de Haas, T., Kleinhans, M. G., Carbonneau, P. E., Rubensdotter, L., and Hauber, E.: Surface morphology of fans in the high-Arctic periglacial environment of Svalbard: Controls and processes, Earth-Sci. Rev., 146, 163–182, https://doi.org/10.1016/j.earscirev.2015.04.004, 2015. a
De Haas, T., Van Den Berg, W., Braat, L., and Kleinhans, M. G.: Autogenic avulsion, channelization and backfilling dynamics of debris-flow fans, Sedimentology, 63, 1596–1619, 2016. a
de Haas, T., Densmore, A. L., Stoffel, M., Suwa, H., Imaizumi, F., Ballesteros-Cánovas, J. A., and Wasklewicz, T.: Avulsions and the spatio-temporal evolution of debris-flow fans, Earth-Sci. Rev., 177, 53–75, https://doi.org/10.1016/j.earscirev.2017.11.007, 2018a. a
De Haas, T., Kruijt, A., and Densmore, A.: Effects of debris-flow magnitude–frequency distribution on avulsions and fan development, Earth Surf. Proc. Land., 43, 2779–2793, 2018b. a
Delorme, P., Voller, V., Paola, C., Devauchelle, O., Lajeunesse, É., Barrier, L., and Métivier, F.: Self-similar growth of a bimodal laboratory fan, Earth Surf. Dynam., 5, 239–252, https://doi.org/10.5194/esurf-5-239-2017, 2017. a
Delorme, P., Devauchelle, O., Barrier, L., and Métivier, F.: Growth and shape of a laboratory alluvial fan, Phys. Rev. E, 98, 012907, https://doi.org/10.1103/PhysRevE.98.012907, 2018. a, b, c
Denny, C. S.: Alluvial fans in the Death Valley region, California and Nevada, Tech. Rep. 466, US Geological Survey, Washington, DC, https://doi.org/10.3133/pp466, 1965. a
De Rose, R. C., Gomez, B., Marden, M., and Trustrum, N. A.: Gully erosion in Mangatu Forest, New Zealand, estimated from digital elevation models, Earth Surf. Proc. Land., 23, 1045–1053, https://doi.org/10.1002/(SICI)1096-9837(1998110)23:11<1045::AID-ESP920>3.0.CO;2-T, 1998. a
De Scally, F. A. and Owens, I. F.: Morphometric controls and geomorphic responses on fans in the Southern Alps, New Zealand, Earth Surf. Proc. Land., 29, 311–322, 2004. a, b, c
Dorn, R. I., DeNiro, M., and Ajie, H.: Isotopic evidence for climatic influence on alluvial-fan development in Death Valley, California, Geology, 15, 108–110, 1987. a
Field, J.: Channel avulsion on alluvial fans in southern Arizona, Geomorphology, 37, 93–104, 2001. a
Frechette, J. D. and Meyer, G. A.: Holocene fire-related alluvial-fan deposition and climate in ponderosa pine and mixed-conifer forests, Sacramento Mountains, New Mexico, USA, Holocene, 19, 639–651, 2009. a
Garcia, C., Laronne, J. B., and Sala, M.: Continuous monitoring of bedload flux in a mountain gravel-bed river, Geomorphology, 34, 23–31, 2000. a, b
Guerit, L., Métivier, F., Devauchelle, O., Lajeunesse, E., and Barrier, L.: Laboratory alluvial fans in one dimension, Phys. Rev. E, 90, 022203, https://doi.org/10.1103/PhysRevE.90.022203, 2014. a
Guthrie, R. H., Friele, P., Allstadt, K., Roberts, N., Evans, S. G., Delaney, K. B., Roche, D., Clague, J. J., and Jakob, M.: The 6 August 2010 Mount Meager rock slide-debris flow, Coast Mountains, British Columbia: characteristics, dynamics, and implications for hazard and risk assessment, Nat. Hazards Earth Syst. Sci., 12, 1277–1294, https://doi.org/10.5194/nhess-12-1277-2012, 2012. a
Habersack, H., Nachtneb El, H., and Laronne, J.: The continuous measurement of bedload discharge in a large alpine gravel bed river, J. Hydraul. Res., 39, 125–133, 2001. a, b
Hamilton, P. B., Strom, K., and Hoyal, D. C.: Autogenic incision-backfilling cycles and lobe formation during the growth of alluvial fans with supercritical distributaries, Sedimentology, 60, 1498–1525, 2013. a, b, c
Harvey, A.: Debris flows and fluvial deposits in Spanish Quaternary alluvial fans: implications for fan morphology, Sedimentology of Gravels and Conglomerates – Memoir 10, Canadian Society of Petroleum Geologists, 123–132, https://archives.datapages.com/data/cspg_sp/data/010/010001/123_cspgsp0100123.htm (last access: 3 November 2022), 1984. a, b
Harvey, A.: Alluvial fan dissection: relationships between morphology and sedimentation, Geol. Soc. Lond. Spec. Publ., 35, 87–103, 1987. a
Harvey, A. M.: The coupling status of alluvial fans and debris cones: a review and synthesis, Earth Surf. Proc. Land., 37, 64–76, 2012. a
Hayward, J. A. and Sutherland, A. J.: The Torlesse Stream vortex-tube sediment trap, J. Hydrol. (NZ), 13, 41–53, 1974. a, b
Hooke, R. L.: Processes on arid-region alluvial fans, J. Geol., 75, 438–460, 1967. a
Hooke, R. L.: Model geology: prototype and laboratory streams: discussion, Geol. Soc. Am. Bull., 79, 391–394, 1968a. a, b
Hooke, R. L.: Steady-state relationships on arid-region alluvial fans in closed basins, Am. J. Sci., 266, 609–629, 1968b. a, b, c
Hooke, R. L. and Rohrer, W. L.: Geometry of alluvial fans: Effect of discharge and sediment size, Earth Surf. Process., 4, 147–166, https://doi.org/10.1002/esp.3290040205, 1979. a
IPCC: Chapter 4: Water, in: Climate Change 2022: Impacts, Adaptation and Vulnerability: Working Group II Contribution to the Sixth Assessment Report of the Intergovernmental Panel on Climate Change, edited by: Pörtner, H.-O. and Roberts, D. C., IPCC, Geneva, https://doi.org/10.1017/9781009325844, 2022. a
Jerolmack, D. J. and Paola, C.: Shredding of environmental signals by sediment transport, Geophys. Res. Lett., 37, L19401, https://doi.org/10.1029/2010GL044638, 2010. a
Kesel, R. H. and Lowe, D. R.: Geomorphology and sedimentology of the Toro Amarillo alluvial fan in a humid tropical environment, Costa Rica, Geograf. Ann. A, 69, 85–99, 1987. a, b
Kostaschuk, R., MacDonald, G., and Putnam, P.: Depositional process and alluvial fan-drainage basin morphometric relationships near Banff, Alberta, Canada, Earth Surf. Proc. Land., 11, 471–484, 1986. a, b
Kuhnle, R. A.: Bed load transport during rising and falling stages on two small streams, Earth Surf. Proc. Land., 17, 191–197, 1992. a, b
Lecce, S. A.: Influence of lithologic erodibility on alluvial fan area, western White Mountains, California and Nevada, Earth Surf. Proc. Land., 16, 11–18, 1991. a
Leenman, A.: Environmental variability and geomorphic responses on alluvial fans: An experimental study, PhD thesis, University of British Columbia, Vancouver, Canada, https://doi.org/10.14288/1.0400597, 2021. a, b, c
Leenman, A.: Data processing code, GitHub [code], https://github.com/a-leenman/phd_code/releases/tag/v1.0 (last access: 3 November 2022), 2022a. a
Leenman, A.: Figure generation code, GitHub [code], https://github.com/a-leenman/Leenman_Eaton_2022/releases/tag/v1.2 (last access: 3 November 2022), 2022a. a
Leenman, A.: Alluvial fan experiment with widely graded sediment mixture, ft. clock (repeat 2), YouTube [video], https://youtu.be/ML2LV28MQEM (last access: 3 November 2022), 2022c. a
Leenman, A.: Alluvial fan experiment with short feed oscillations, YouTube [video], https://youtu.be/jXjWIkLU-7A (last access: 3 November 2022), 2022d. a
Leenman, A.: Alluvial fan experiment with medium-length feed oscillations, YouTube [video], https://youtu.be/T4JbZC9YkXQ (last access: 3 November 2022), 2022e. a
Leenman, A.: Alluvial fan experiment with long feed oscillations, YouTube [video], https://youtu.be/EcCWYGIbsqA (last access: 3 November 2022), 2022f. a
Leenman, A. and Eaton, B.: Mechanisms for avulsion on alluvial fans: Insights from high-frequency topographic data, Earth Surf. Proc. Land., 46, 1111–1127, https://doi.org/10.1002/esp.5059, 2021. a, b, c, d
Leenman, A. and Eaton, B.: Episodic sediment supply to alluvial fans: implications for fan incision and morphometry: experimental dataset, Zenodo [data set], https://doi.org/10.5281/zenodo.7100814, 2022. a
Leenman, A. and Tunnicliffe, J.: Tributary-junction fans as buffers in the sediment cascade: a multi-decadal study, Earth Surf. Proc. Land., 45, 265–279, https://doi.org/10.1002/esp.4717, 2020. a, b
Leenman, A. S., Eaton, B. C., and MacKenzie, L. G.: Floods on Alluvial Fans: Implications for Reworking Rates, Morphology and Fan Hazards, J. Geophys. Res.-Earth, 127, e2021JF006367, https://doi.org/10.1029/2021jf006367, 2022. a, b, c
Malverti, L., Lajeunesse, E., and Métivier, F.: Small is beautiful: Upscaling from microscale laminar to natural turbulent rivers, J. Geophys. Res.-Earth, 113, F04004, https://doi.org/10.1029/2007JF000974, 2008. a
Mao, L., Dell'Agnese, A., Huincache, C., Penna, D., Engel, M., Niedrist, G., and Comiti, F.: Bedload hysteresis in a glacier-fed mountain river, Earth Surf. Proc. Land., 39, 964–976, 2014. a, b
Marden, M., Fuller, I. C., Herzig, A., and Betts, H. D.: Badass gullies: Fluvio-mass-movement gully complexes in New Zealand's East Coast region, and potential for remediation, Geomorphology, 307, 12–23, https://doi.org/10.1016/j.geomorph.2017.11.012, 2018. a
Mather, A. E. and Hartley, A.: Flow events on a hyper-arid alluvial fan: Quebrada Tambores, Salar de Atacama, northern Chile, Geological Soc. Lond. Spec. Publ., 251, 9–24, 2005. a
Melton, M. A.: The geomorphic and paleoclimatic significance of alluvial deposits in southern Arizona, J. Geol., 73, 1–38, 1965. a
Meyer, G. A. and Pierce, J. L.: Climatic controls on fire-induced sediment pulses in Yellowstone National Park and central Idaho: a long-term perspective, Forest Ecol. Manage., 178, 89–104, 2003. a
Meyer, G. A. and Wells, S. G.: Fire-related sedimentation events on alluvial fans, Yellowstone National Park, USA, J. Sediment. Res., 67, 776–791, 1997. a, b
Meyer-Peter, E. and Müller, R.: Formulas for bed-load transport, in: IAHSR 2nd meeting, Stockholm, appendix 2, IAHR, http://resolver.tudelft.nl/uuid:4fda9b61-be28-4703-ab06-43cdc2a21bd7 (last access: 3 November 2022), 1948. a
Milana, J. P. and Ruzycki, L.: Alluvial-fan slope as a function of sediment transport efficiency, J. Sediment. Res., 69, 553–562, 1999. a
Miller, K. L., Kim, W., and McElroy, B.: Laboratory Investigation on Effects of Flood Intermittency on Fan Delta Dynamics, J. Geophys. Res.-Earth, 124, 383–399, 2019. a
Oguchi, T. and Ohmori, H.: Analysis of relationships among alluvial fan area, source basin area, basin slope, and sediment yield, Z. Geomorphol., 38, 405–420, 1994. a
Paola, C., Straub, K., Mohrig, D., and Reinhardt, L.: The “unreasonable effectiveness” of stratigraphic and geomorphic experiments, Earth-Sci. Rev., 97, 1–43, 2009. a, b
Parker, G.: Hydraulic geometry of active gravel rivers, J. Hydraul. Div., 105, 1185–1201, 1979. a
Pierce, J. and Meyer, G.: Long-term fire history from alluvial fan sediments: the role of drought and climate variability, and implications for management of Rocky Mountain forests, Int. J. Wildland Fire, 17, 84–95, 2008. a
Piliouras, A., Kim, W., and Carlson, B.: Balancing aggradation and progradation on a vegetated delta: The importance of fluctuating discharge in depositional systems, J. Geophys. Res.-Earth, 122, 1882–1900, 2017. a
Rahn, P. H.: Sheetfloods, streamfloods, and the formation of pediments, Ann. Assoc. Am. Geogr., 57, 593–604, 1967. a
Reid, I., Frostick, L. E., and Layman, J. T.: The incidence and nature of bedload transport during flood flows in coarse-grained alluvial channels, Earth Surf. Proc. Land., 10, 33–44, 1985. a, b
Reitz, M. D. and Jerolmack, D. J.: Experimental alluvial fan evolution: Channel dynamics, slope controls, and shoreline growth, J. Geophys. Res.-Earth, 117, F02021, https://doi.org/10.1029/2011JF002261, 2012. a, b, c
Reitz, M. D., Jerolmack, D. J., and Swenson, J. B.: Flooding and flow path selection on alluvial fans and deltas, Geophys. Res. Lett., 37, L06401, https://doi.org/10.1029/2009GL041985, 2010. a
Saito, K. and Oguchi, T.: Slope of alluvial fans in humid regions of Japan, Taiwan and the Philippines, Geomorphology, 70, 147–162, 2005. a
Schlichting, H. and Gersten, K.: Boundary-layer theory, Springer, ISBN 978-3-662-52917-1, ISBN 978-3-662-52919-5 (eBook), https://doi.org/10.1007/978-3-662-52919-5, 2016. a
Schumm, S. A., Mosley, M. P., and Weaver, W.: Experimental fluvial geomorphology, John Wiley and Sons Inc., New York, 1987. a, b, c
Silva, P., Harvey, A., Zazo, C., and Goy, J.: Geomorphology, depositional style and morphometric relationships of Quaternary alluvial fans in the Guadalentin Depression (Murcia, Southeast Spain), Z. Geomorphol., 36, 325–341, 1992. a
Stokes, M. and Gomes, A.: Alluvial fans on volcanic islands: A morphometric perspective (São Vicente, Cape Verde), Geomorphology, 368, 107356, https://doi.org/10.1016/j.geomorph.2020.107356, 2020. a, b
Stokes, M. and Mather, A. E.: Controls on modern tributary-junction alluvial fan occurrence and morphology: High Atlas Mountains, Morocco, Geomorphology, 248, 344–362, 2015. a, b, c
Talbot, M. and Williams, M.: Cyclic alluvial fan sedimentation on the flanks of fixed dunes, Janjari, central Niger, Catena, 6, 43–62, 1979. a
Tomczyk, A. M.: Morphometry and morphology of fan-shaped landforms in the high-Arctic settings of central Spitsbergen, Svalbard, Geomorphology, 392, 107899, https://doi.org/10.1016/j.geomorph.2021.107899, 2021. a, b
Van Dijk, M., Postma, G., and Kleinhans, M. G.: Autocyclic behaviour of fan deltas: an analogue experimental study, Sedimentology, 56, 1569–1589, 2009. a, b
Van Dijk, M., Kleinhans, M. G., Postma, G., and Kraal, E.: Contrasting morphodynamics in alluvial fans and fan deltas: effect of the downstream boundary, Sedimentology, 59, 2125–2145, 2012. a, b
Vincent, L. T., Eaton, B. C., Leenman, A. S., and Jakob, M.: Secondary Geomorphic Processes and Their Influence on Alluvial Fan Morphology, Channel Behavior and Flood Hazards, J. Geophys. Res.-Earth, 127, e2021JF006371, https://doi.org/10.1029/2021jf006371, 2022. a, b, c
Wang, H., Harvey, A. M., Xie, S., Kuang, M., and Chen, Z.: Tributary-junction fans of China's Yangtze Three-Gorges valley: morphological implications, Geomorphology, 100, 131–139, 2008. a
Wasson, R.: Intersection point deposition on alluvial fans: an Australian example, Geograf. Ann. A, 56, 83–92, 1974. a, b
Wells, S. G. and Harvey, A. M.: Sedimentologic and geomorphic variations in storm-generated alluvial fans, Howgill Fells, northwest England, Geol. Soc. Am. Bull., 98, 182–198, 1987. a, b, c
Wendeler, C. and Volkwein, A.: Laboratory tests for the optimization of mesh size for flexible debris-flow barriers, Nat. Hazards Earth Syst. Sci., 15, 2597–2604, https://doi.org/10.5194/nhess-15-2597-2015, 2015. a
Wendeler, C., Volkwein, A., Roth, A., Denk, M., and Wartmann, S.: Field measurements and numerical modelling of flexible debris flow barriers, Debris-Flow Hazards Mitig. Mech. Predict. Assess., Millpress, Rotterdam, 681–687, http://hdl.handle.net/20.500.11850/57642 (last access: 3 November 2022), 2007. a
Whipple, K. X., Parker, G., Paola, C., and Mohrig, D.: Channel dynamics, sediment transport, and the slope of alluvial fans: Experimental study, J. Geol., 106, 677–693, 1998. a, b, c, d
Woods, S. W., MacDonald, L. H., and Westbrook, C. J.: Hydrologic interactions between an alluvial fan and a slope wetland in the central Rocky Mountains, USA, Wetlands, 26, 230–243, 2006. a
Yalin, M. S.: Theory of hydraulic models, in: Macmillan civil engineering hydraulics, Macmillan, London, ISBN 0333035577, 1971. a
Zarn, B. and Davies, T. R.: The significance of processes on alluvial fans to hazard assessment, Z. Geomorphol., 38, 487–500, 1994. a
Zubrycky, S., Mitchell, A., McDougall, S., Strouth, A., Clague, J. J., and Menounos, B.: Exploring new methods to analyse spatial impact distributions on debris-flow fans using data from south-western British Columbia, Earth Surf. Proc. Land., 46, 2395–2413, https://doi.org/10.1002/esp.5184, 2021. a
sandboxexperiments with oscillating high and low sediment supply. Even though the average sediment supply never changed, longer oscillations built flatter fans, indicating how wetter climates might affect these mountain landforms.