the Creative Commons Attribution 4.0 License.
the Creative Commons Attribution 4.0 License.
 | 10 May 2022
Organic carbon burial by river meandering partially offsets bank erosion carbon fluxes in a discontinuous permafrost floodplain
Gen K. Li
Woodward W. Fischer
Joel C. Rowland
Preston C. Kemeny
A. Joshua West
Jon Schwenk
Anastasia P. Piliouras
Austin J. Chadwick
Michael P. Lamb
Arctic river systems erode permafrost in their banks and mobilize particulate organic carbon (OC). Meandering rivers can entrain particulate OC from permafrost many meters below the depth of annual thaw, potentially enabling the production of greenhouse gases. However, the amount and fate of permafrost OC that is mobilized by river erosion is uncertain. To constrain OC fluxes due to riverbank erosion and deposition, we collected riverbank and floodplain sediment samples along the Koyukuk River, which meanders through discontinuous permafrost in the Yukon River watershed, Alaska, USA, with an average migration rate of 0.52 m yr−1. We measured sediment total OC (TOC) content, radiocarbon activity, water content, bulk density, grain size, and floodplain stratigraphy. Radiocarbon activity and TOC content were higher in samples dominated by silt as compared to sand, which we used to map OC content onto floodplain stratigraphy and estimate carbon fluxes due to river meandering. Results showed that the Koyukuk River erodes and re-deposits a substantial flux of OC each year due to its depth and high migration rate, generating a combined OC flux of a similar magnitude to the floodplain net ecological productivity. However, sediment being eroded from cutbanks and deposited as point bars had similar OC stocks (mean ± 1 SD of 125.3±13.1 kg OC m−2 in cutbanks versus 114.0±15.7 kg OC m−2 in point bars) whether or not the banks contained permafrost. We also observed radiocarbon-depleted biospheric OC in both cutbanks and permafrost-free point bars. These results indicate that a substantial fraction of aged biospheric OC that is liberated from floodplains by bank erosion is subsequently re-deposited in point bars rather than being oxidized. The process of aging, erosion, and re-deposition of floodplain organic material may be intrinsic to river–floodplain dynamics, regardless of permafrost content.
- Article
(5402 KB) - Full-text XML
-
Supplement
(1505 KB) - BibTeX
- EndNote


The warming climate is changing Arctic landscapes, inducing complex feedbacks in the global carbon cycle as permafrost soils thaw (Schuur et al., 2015; Turetsky et al., 2020). Changes in air temperature and precipitation have increased the thickness of the active layer (ground overlying permafrost that experiences seasonal freeze–thaw cycles), allowing respiration of soil organic carbon (OC) previously frozen for thousands of years (Romanovsky et al., 2010; Isaksen et al., 2016; Biskaborn et al., 2019). Organic carbon is also lost from permafrost through lateral erosion by Arctic rivers – the six largest Arctic rivers contribute ∼3 Tg of river particulate OC (POC) to the Arctic Ocean annually (McClelland et al., 2016). Since a substantial portion of eroded POC is thought to be prone to oxidation (Schreiner et al., 2014), river erosion of POC could play an important role in the greenhouse gas fluxes associated with permafrost thaw (Toohey et al., 2016; Walvoord and Kurylyk, 2016).
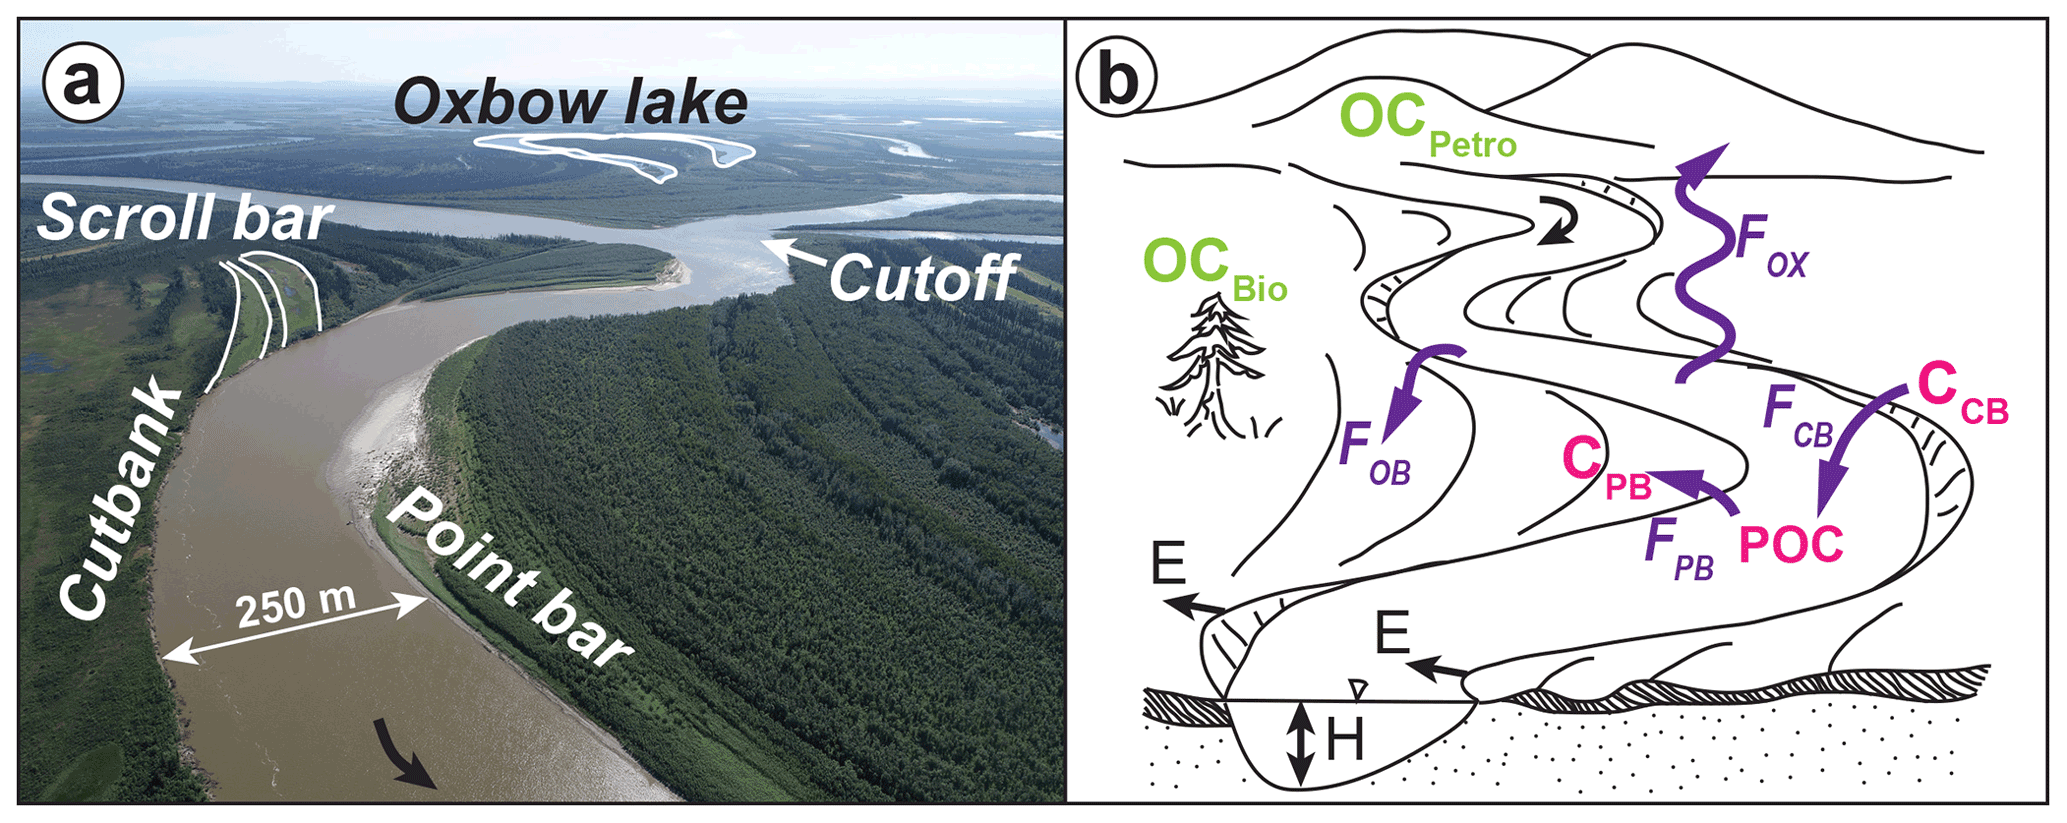
Figure 1Overview of sediment erosion and deposition patterns in meandering river floodplains and important variables influencing the regional carbon cycle. (a) Drone photograph taken looking east across the Koyukuk River floodplain, Alaska (location marked with a white star in Fig. 2). The river flows south toward the bottom of the image (indicated by black arrow), eroding the cutbank on the outside of the river bend and depositing sediment on the point bar. Channel migration generates bands of higher and lower elevation sections of floodplain called scroll bars. As the river migrates, an individual bend becomes more sinuous, eventually cutting itself off and abandoning a section of channel, which becomes an oxbow lake. (b) Schematic of a meandering river floodplain, with channel geometry variables shown in black and particulate organic carbon reservoirs and fluxes into and out of the river control volume shown in purple. The river has bankfull depth H and migrates laterally at rate E, maintaining a constant channel width. Organic carbon is stored in the river cutbanks (CCB) and point bars (CPB) and is transported in the river as particulates (POC). These reservoirs are mixtures of radiocarbon-dead (Fm=0) petrogenic organic carbon (OCPetro) and biospheric organic carbon (OCBio) that has been stored in permafrost (low Fm) or been recently fixed by the biosphere (Fm≥1). Fluxes of organic carbon into and out of the river control volume include cutbank erosion (FCB), point bar deposition (FPB), overbank deposition (FOB), and oxidation of POC and DOC (FOX).
As Arctic rivers migrate laterally across permafrost floodplains, they can mine sediment and organics from over 10 m below the active layer (Spencer et al., 2015; Kanevskiy et al., 2016). Permafrost floodplains are thus an important source of POC to rivers (Kanevskiy et al., 2016; Loiko et al., 2017; Lininger et al., 2018; Lininger and Wohl, 2019). After mobilization by a river, POC can be oxidized during transport (Striegl et al., 2012; Denfeld et al., 2013; Serikova et al., 2018) or re-buried in floodplains (Wang et al., 2019; Torres et al., 2020). Alternatively, POC can be delivered downstream to the ocean, where it may be oxidized to CO2, reduced to CH4, or buried in deltaic sedimentary deposits (Torres et al., 2020; Hilton et al., 2015). Riverbank erosion may be limited by the rate of permafrost thaw (Costard et al., 2003; Randriamazaoro et al., 2007; Dupeyrat et al., 2011), implying that erosion rates could increase with warming air and river water temperatures. Therefore, more rapid riverbank erosion resulting from warming temperatures has the potential to increase fluvial POC fluxes and oxidation, resulting in a positive feedback on the concentration of atmospheric carbon dioxide (Striegl et al., 2012; Denfeld et al., 2013; Serikova et al., 2018). The magnitude and timescale of this feedback are highly uncertain but may be important to consider for predicting and mitigating impacts from anthropogenic climate change.
Floodplain POC stocks are vulnerable to erosion by Arctic rivers (Vonk et al., 2019; Parmentier et al., 2017). For instance, Lininger et al. (2018, 2019) mapped OC contents and stocks across the Yukon Flats and found significant variability in OC contents between riverine landforms (Lininger et al., 2018) as well as underestimation of floodplain OC stocks in previous data compilations (Lininger et al., 2019). Their work built on previous studies that characterized vegetation and permafrost succession through a time series of floodplain surfaces that had been progressively abandoned by river migration (Shur and Jorgenson, 2007). Yet major questions remain about the magnitude of POC fluxes due to bank erosion and bar deposition in permafrost river systems as well as the physical processes that govern these fluxes (Lininger and Wohl, 2019).
Alluvial rivers commonly maintain an approximately constant channel width, eroding one bank while depositing sediment at a commensurate rate on the opposite bank (Fig. 1a) (Dietrich et al., 1979; Eke et al., 2014). Riverbank erosion has been shown to contribute substantially to downstream POC fluxes (Kanevskiy et al., 2016). However, it is unclear to what extent the OC released by bank erosion is compensated by OC burial in depositional bars as opposed to being transported downstream or oxidized during transport within river systems (Fig. 1b) (Wang et al., 2019; Scheingross et al., 2021).
To quantify POC storage and mobilization, we investigated the Koyukuk River in the Yukon River watershed, Alaska, USA (Fig. 2), which is an actively meandering river in discontinuous permafrost. We quantified OC stocks using measurements of OC content in field samples and extrapolated these across the floodplain using floodplain stratigraphy and correlations between grain size and OC content. We then used a one-dimensional mass-balance model to quantify net fluxes of OC into and out of the river due to bank erosion and bar deposition. To attribute OC to biospheric versus rock-derived (petrogenic) sources, we used radiocarbon measurements to infer the presence of a petrogenic OC end-member and compared the range of biospheric radiocarbon compositions in permafrost and non-permafrost sediment samples and landforms.
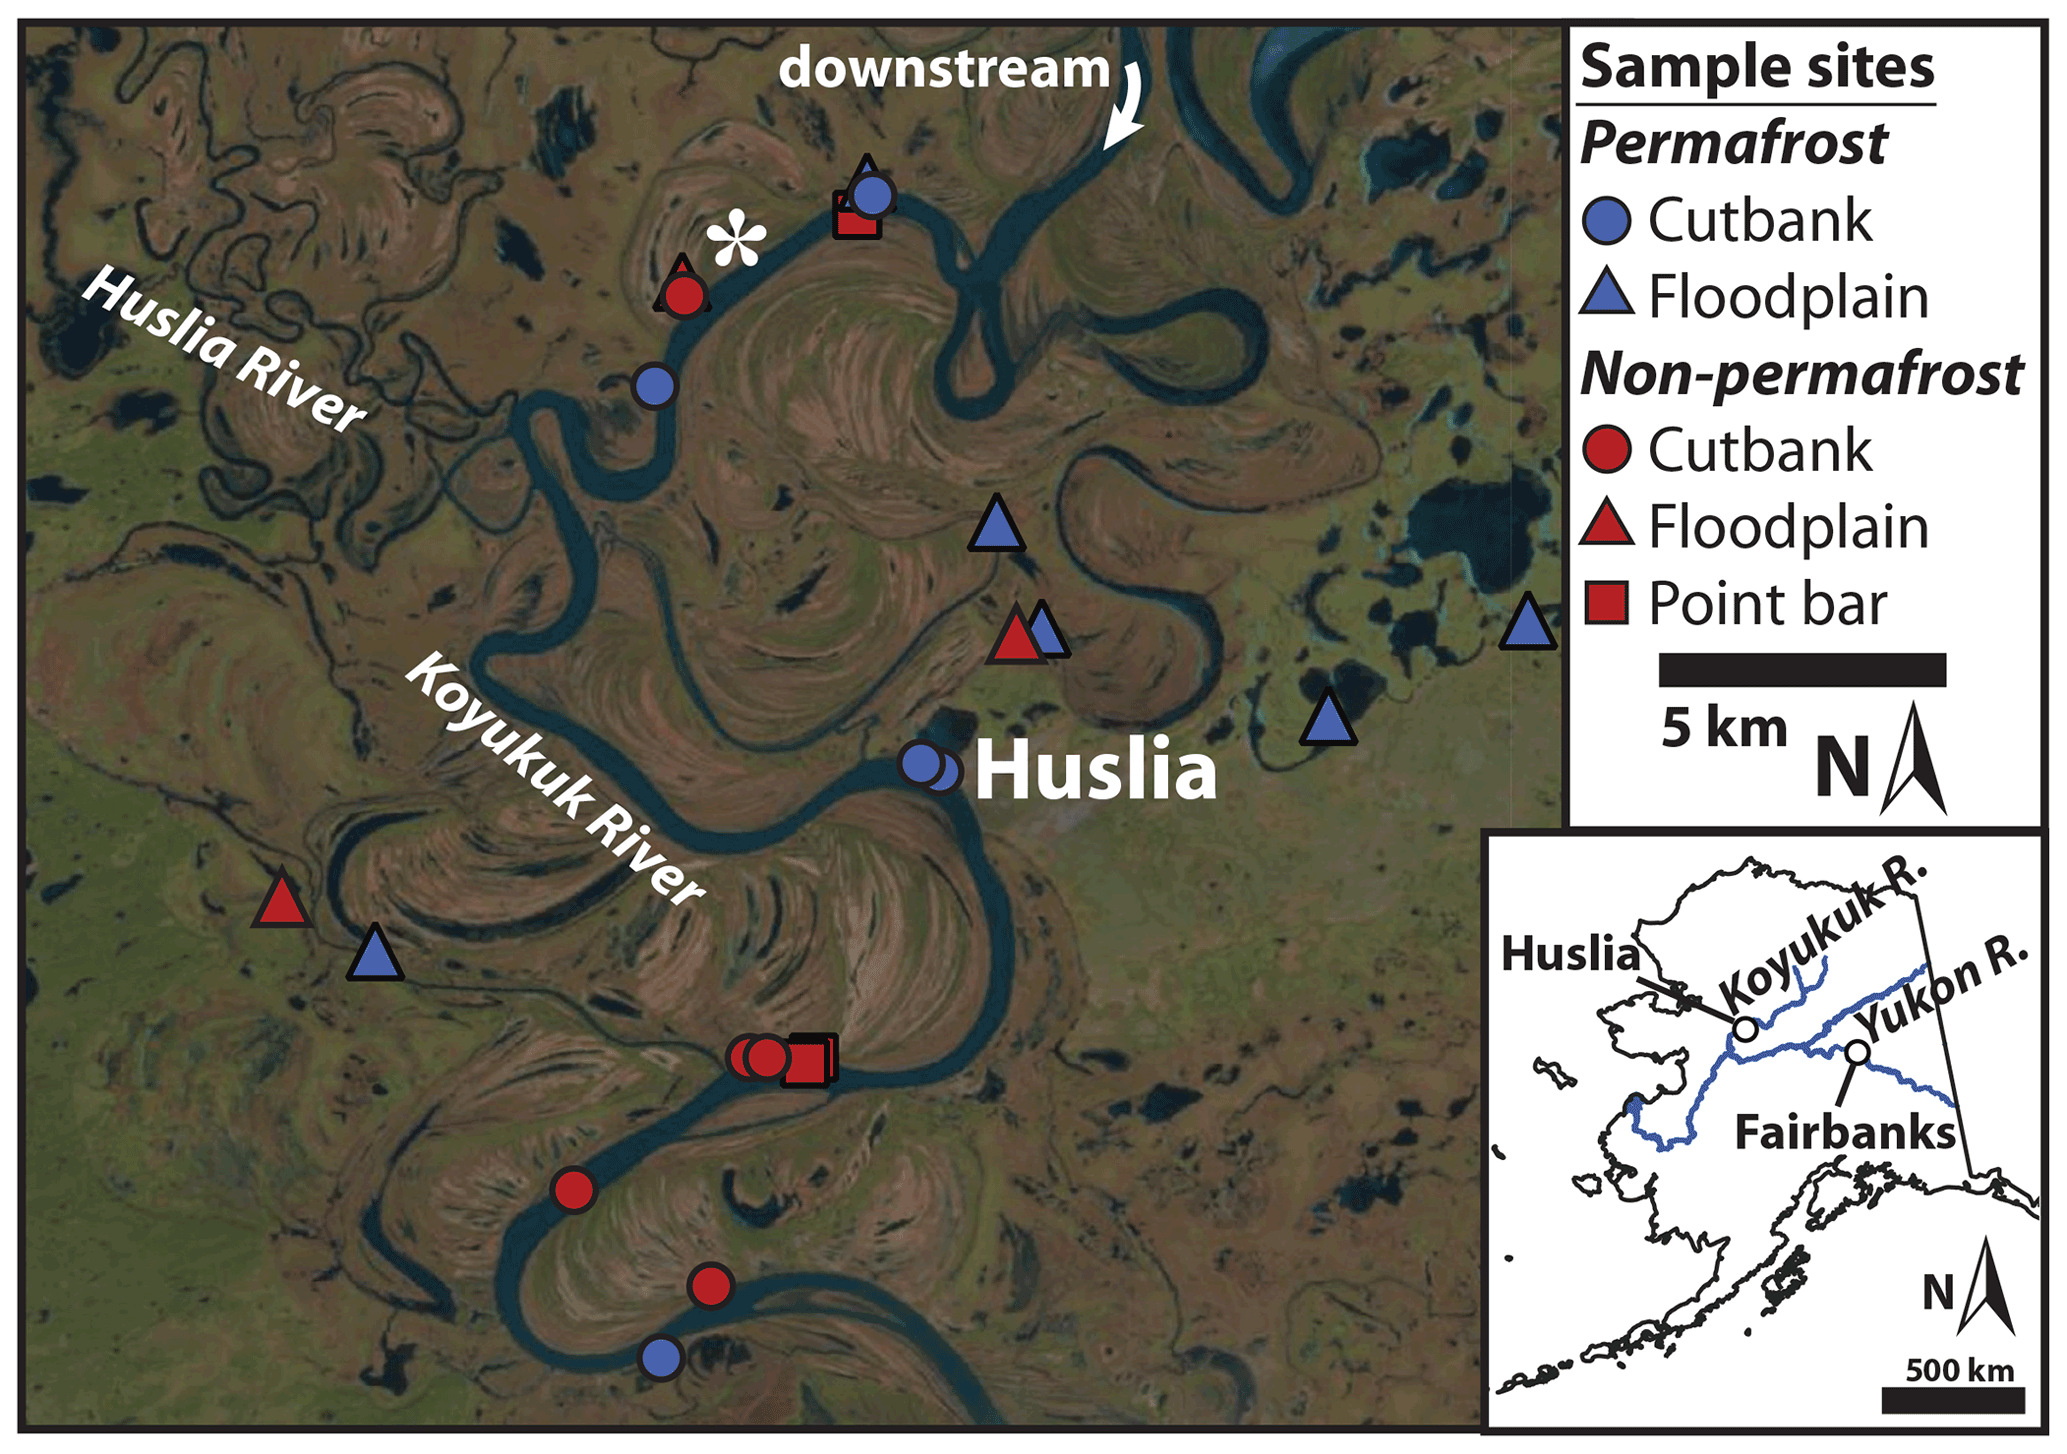
Figure 2Sample locations on the Koyukuk River floodplain. Locations are coded for sites where we sampled ice-cemented permafrost versus ice-poor ground inferred to be non-permafrost. Sample sites are located near the village of Huslia, in central Alaska, and the river flows towards the south past the town. Sampling locations are mapped on Landsat imagery, with the white star marking the location of Fig. 1a (drone photo taken looking east). The inset map was generated using the “Alaska Coast Simplified” and “Major Rivers” shapefiles from the Alaska State Geo-Spatial Data Clearinghouse.
To understand cycling of POC between rivers and floodplains, we developed an approach to ascertain OC sources and determined if OC eroded from river deposits was transported downstream or re-buried (Fig. 1b). Eroding banks can source OC from modern vegetation and organic horizons near the bank surface as well as deeper sediment that may be depleted in radiocarbon. Radiocarbon provides an effective tracer of OC aging in floodplains (Galy and Eglinton, 2011; Torres et al., 2017), but several processes can produce depleted radiocarbon signals. First, many Arctic permafrost deposits are relicts from colder climatic conditions (O'Donnell et al., 2012). These deposits have low radiocarbon activity, expressed as fraction modern (; Asample,norm indicates sample 14C activity normalized for isotope fractionation to ‰ (VPDB – Vienna Pee Dee Belemnite), while AOx,norm indicates NBS Oxalic Acid I normalized to ‰, with reported in per mill (‰)) (Reimer et al., 2004). If mobilized permafrost POC is re-buried in bars without the addition of newly fixed biospheric OC, then bar sediment should also have OC with low Fm values inherited from permafrost carbon. Second, sediment can contain a radiocarbon-dead, petrogenic OC component that contributes to low Fm values (Blair et al., 2003). We expected a petrogenic OC contribution in floodplain sediments throughout the Koyukuk River system, since the headwaters of the Koyukuk River contain outcrops of shale bedrock rich in kerogen (Dumoulin et al., 2004; Wilson et al., 2015; Slack et al., 2015). Third, river–floodplain interactions generate organic carbon with low Fm values via transient OC storage, independent of the presence of either permafrost or petrogenic OC (Torres et al., 2020). For example, floodplain deposits can remain in place over millennial timescales before being reworked by the river channel due to the stochastic nature of river lateral migration (Torres et al., 2017; Repasch et al., 2020). Therefore, radiocarbon measurements provide insight into OC sources but require de-convolving petrogenic OC from biospheric OC and assessing aging of OC by storage in permafrost versus non-permafrost floodplain deposits.
We used sediment total OC (TOC) and Fm measurements to calculate the Fm of the biospheric OC end-member as well as the contribution of petrogenic OC to our samples. This calculation allowed us to determine if low Fm values were due to a high content of radiocarbon-dead rock-derived OC or preservation and aging of OC in permafrost or in the river floodplain (Fig. 1b) (Scheingross et al., 2021). Both radiocarbon-dead OC derived from bedrock erosion (TOCpetro) and aging of biospheric OC (TOCbio) in permafrost and river floodplain deposits will yield sediment OC with low Fm values (Fig. 1b). We partitioned the TOC contents measured in each sample (TOCmeas) into a two end-member mixture of biospheric () and petrogenic OC () fractions (Fig. 4c) (Blair et al., 2003; Cui et al., 2016):
where fbio and fpetro are the fraction of organic carbon from biospheric and petrogenic sources. Changes in the ratio of biospheric to petrogenic OC, as well as aging of the biospheric pool, will change the measured fraction modern in sediment OC (Fmmeas; unitless ratio) (Galy et al., 2008). By mass balance,
The petrogenic OC end-member was assumed to be radiocarbon-dead (Fmpetro=0), and Eqs. (1) and (2) substituted into Eq. (3) yield
A nonlinear optimization of Eq. (4) for Fmmeas versus TOCmeas was used to calculate 95 % confidence intervals around Fmbio (effectively the mean radiocarbon activity of biosphere-derived carbon) and the TOCpetro content in cutbank and point bar sediment samples (Fig. 4c) (Hemingway et al., 2018; Wang et al., 2019). We reported a range of fitted Fmbio end-members to compare biospheric OC eroding from cutbanks to that being deposited in point bars because cutbanks comprise a mixture of permafrost and non-permafrost terrain with varying Fm values that are homogenized during transport in the river. This optimization also considers a range of TOCpetro content end-members for cutbanks and point bars. We do not expect that geographic location on the Koyukuk floodplain has a strong control on sediment OCpetro content. While recent work found evidence for petrogenic OC oxidation during riverine transport of sediment (Bouchez et al., 2010; Horan et al., 2019), these studies focused on river reaches spanning hundreds of kilometers, 1 order of magnitude longer than our study reach. Even over hundreds of kilometers, Horan et al. (2019) found that less than half of petrogenic OC eroded from the Mackenzie River catchment was oxidized during transport. Therefore, it is reasonable to assume that the production and oxidation of rock-derived OC is limited within our study reach and a single TOCpetro end-member is appropriate for cutbanks and another for point bars.
3.1 Field sampling methods
We collected samples from 33 locations along the Koyukuk River near the village of Huslia, Alaska, during June–July 2018 (Fig. 2 inset; Fig. S1 in the Supplement). Near Huslia, the mean annual air temperature is −3.6 ∘C (Nowacki et al., 2003; Daly et al., 2015, 2018). The Koyukuk is a meandering river in discontinuous permafrost (portions of the floodplain are underlain by ground below 0 ∘C while others are not) with well-defined scroll bars (former levees) (Mason and Mohrig, 2019) that demarcate clear spatial patterns of channel lateral migration (Fig. 2) (Shur and Jorgenson, 2007). Bands of vegetation outline scroll bars on the floodplain that were abandoned due to channel lateral migration and meander-bend cutoff (Fig. 1). Seasonal variations in temperature cause an annual freeze–thaw cycle in sediment near the ground surface across the landscape, called the active layer, while the ground below, in areas of permafrost, is perennially at sub-zero temperatures. To represent the diversity of floodplain geomorphology, permafrost occurrence, and deposit ages, we selected eight permafrost cutbanks, six non-permafrost cutbanks, six permafrost floodplain cores, four non-permafrost floodplain cores and pits, and nine non-permafrost cores and pits in transects across two point bar complexes to characterize floodplain stratigraphy and carbon geochemistry (Fig. 2; Tables S1 and S2 in the Supplement). We categorized permafrost as ice-cemented sediment observed during our summer field season, often containing ice lenses and other structures indicative of permafrost (Fig. 3a and b) (French and Shur, 2010). Permafrost cutbanks often had an undercut marking the high water level where bank sediment was directly thawed by the river and collapsed as well as abundant toppled trees indicating active bank erosion. We classified terrain without ice cement observed to the depth of coring or sampling as non-permafrost (Fig. 3a and c), although this category might also include perennial sub-zero ground that lacked pore water to form ice cement. Bank samples were collected by digging into cutbanks and point bars, and cores were taken using a hand auger in non-permafrost deposits and a Snow, Ice, and Permafrost Research Establishment (SIPRE) auger in permafrost (Fig. 2). All samples were recorded in stratigraphic columns to determine the thickness of each stratigraphic unit. Samples were stored in sterile Whirl-pak bags and frozen within 12 h of collection and then transported frozen back to a cold room (−15 ∘C) at Caltech for laboratory analyses.
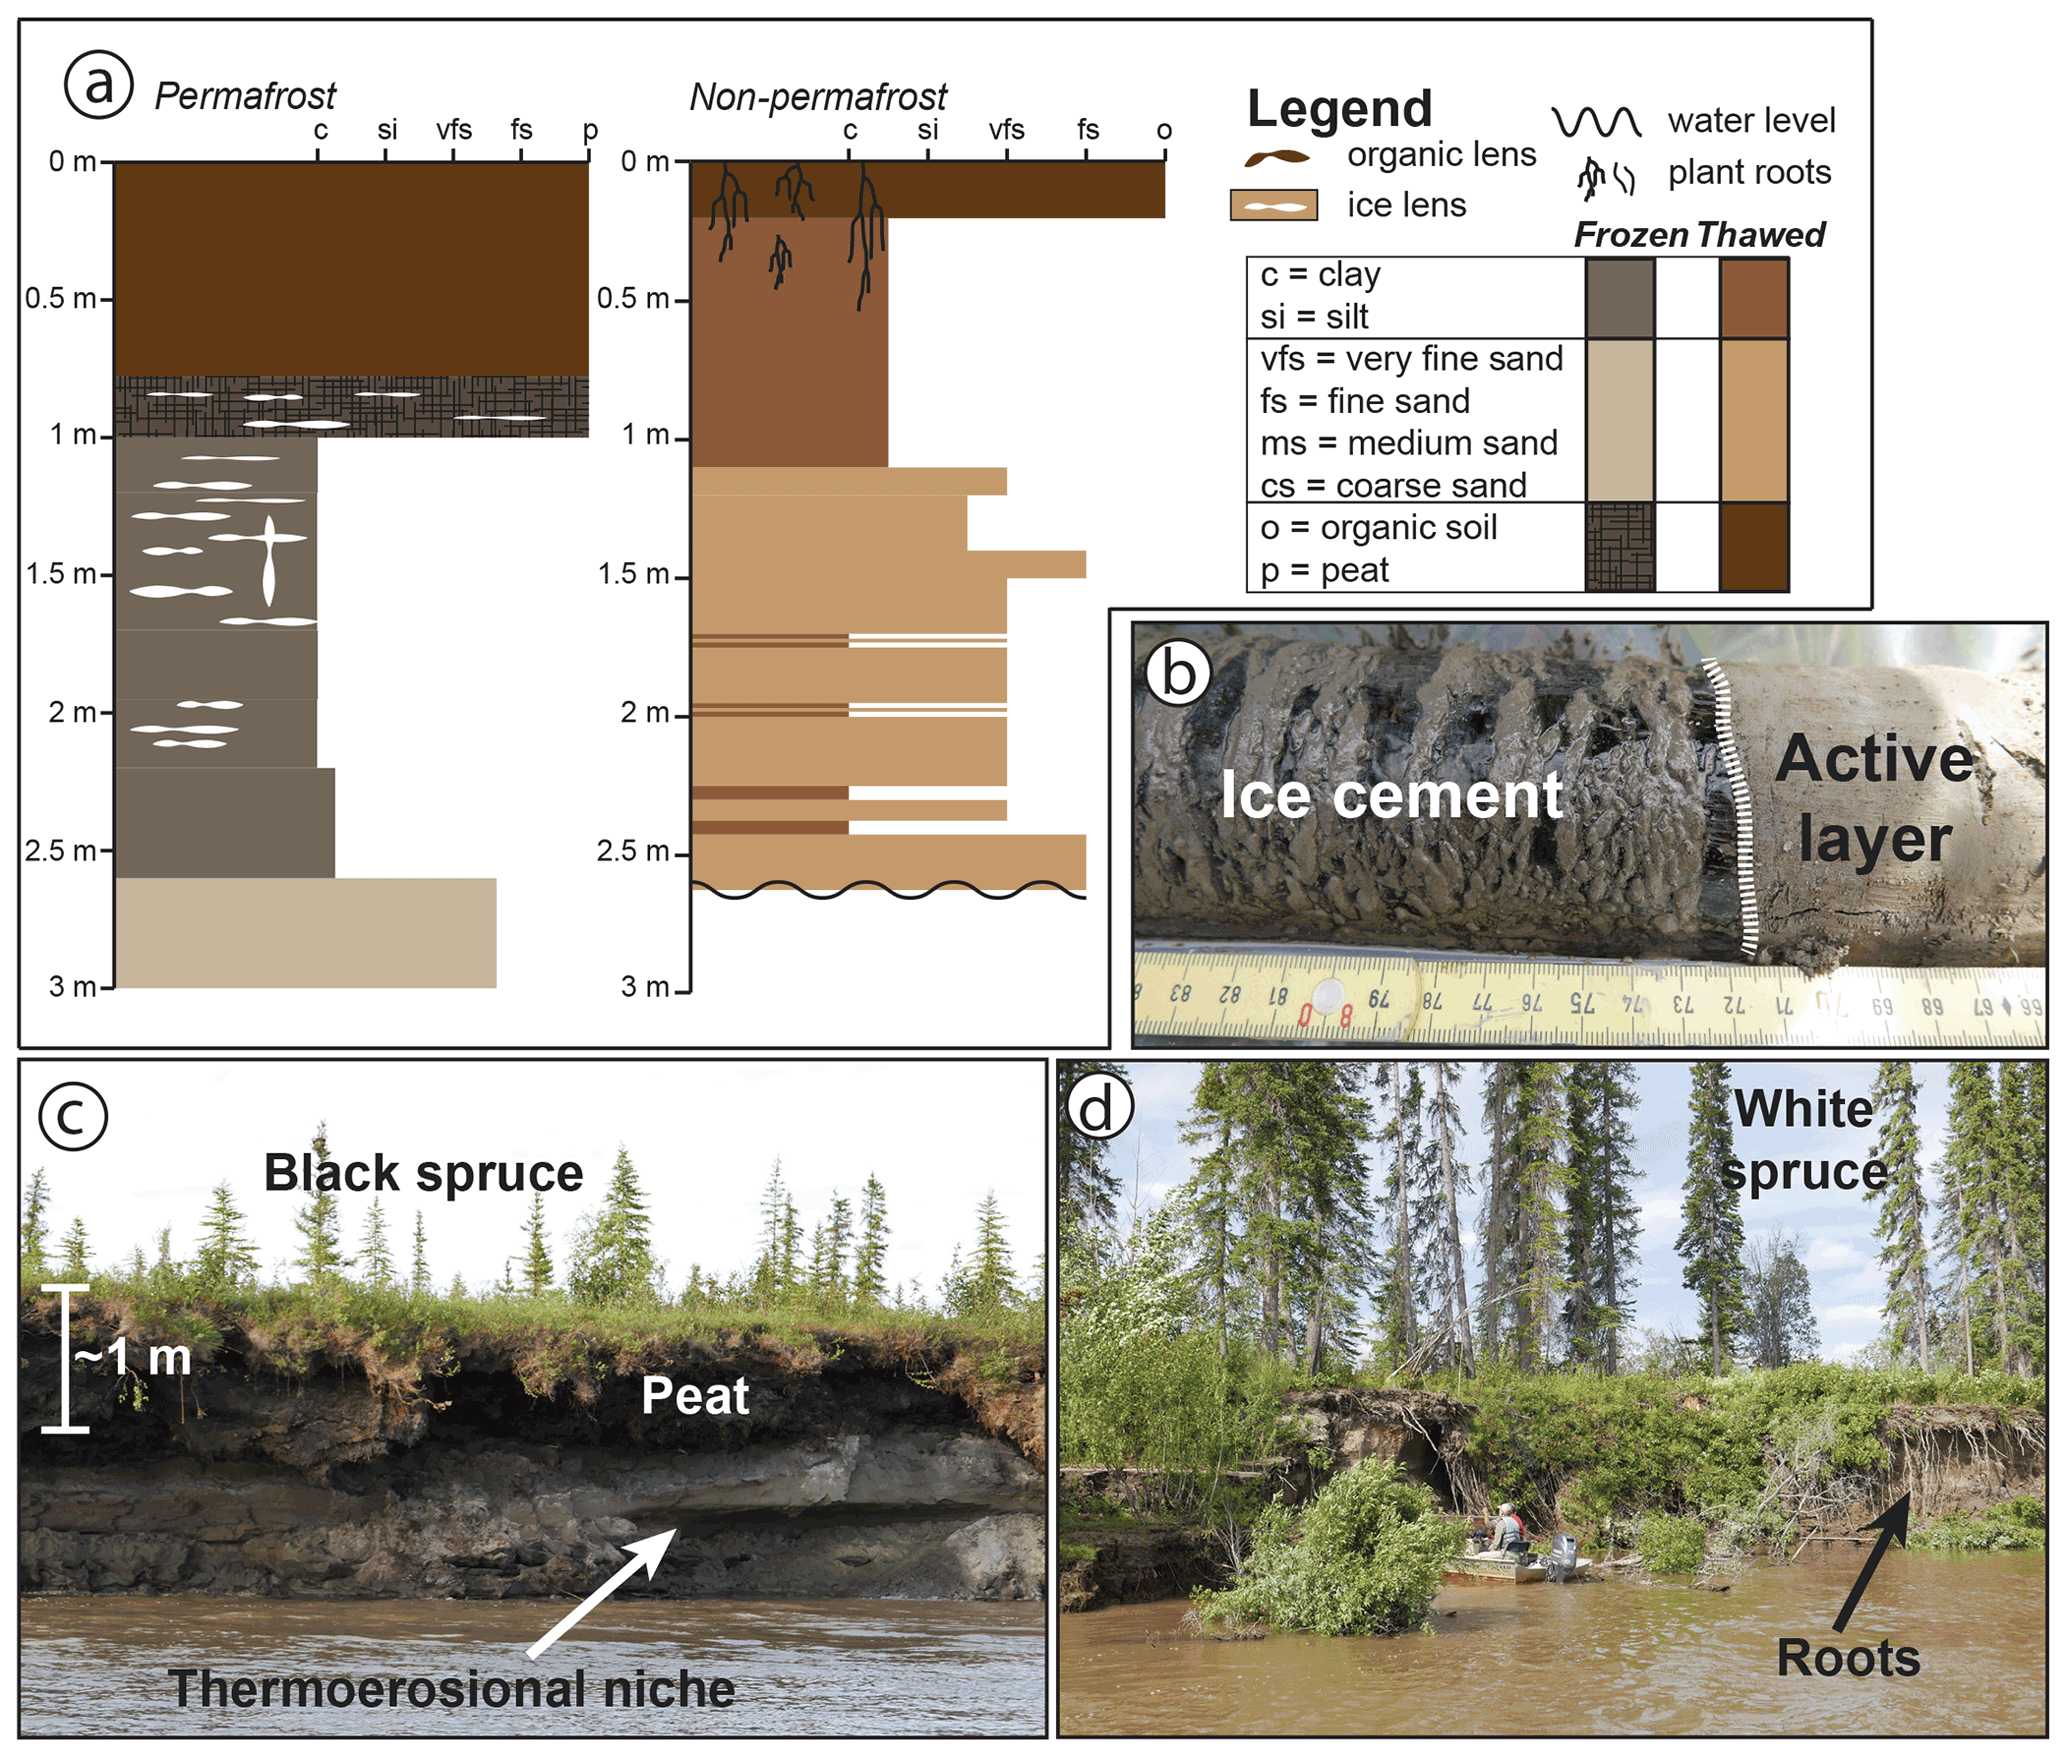
Figure 3Field observations of Koyukuk riverbanks and floodplain stratigraphy. (a) Representative stratigraphic columns from non-permafrost (Bank 2) and permafrost (Bank 6) cutbanks. (b) Field photo of boundary between permafrost ice cement and the overlying active layer in Core 4. (c) Thermoerosional niche formed in a permafrost cutbank, with silty permafrost overlain by a layer of peat and black spruce trees. (d) Eroding riverbank without permafrost, hosting a white spruce forest with roots that reach deep into the bank sediment. Complete stratigraphic sections and additional field photos are in Figs. S2 and S3.
River bathymetry was characterized using a Teledyne RioPro acoustic Doppler current profiler (ADCP). We calculated a river depth of 12.4 m as the mean of the deepest measured value (i.e., the thalweg) for eight ADCP river cross-sectional transects across a representative meander bend. Mean bank erosion rates for the portion of the Koyukuk we studied were 0.52 m yr−1 averaged over the time period of 1978–2018 (Rowland et al., 2019). Over the same time interval, channel width varied from 173±43 m in 1978 to 179±43 m in 2018 (median ± 1 SD), indicating a balance between cutbank erosion and point bar deposition over this period since net lateral erosion or deposition would change channel width (Fig. S2).
3.2 Laboratory analyses
Samples were transferred to pre-combusted aluminum foil, weighed, and oven-dried at 55–60 ∘C to calculate the mass fraction of water (). For samples taken using the SIPRE auger with known volume, bulk density (ρi) was calculated from total mass divided by volume. The samples were gently homogenized using an agate mortar and pestle and then split using cone and quarter or a riffle splitter, to avoid grain size fractionation, for further analysis.
Total organic carbon content (TOCmeas in Eq. 2), stable organic carbon isotopes, and total nitrogen (TN) content were measured on a Costech Elemental Analyzer coupled to a MAT 253 IRMS (isotope ratio mass spectrometer) at Los Alamos National Laboratory (LANL). Prior to analysis, samples were ground to a powder and approximately 3 mg of each sample was decarbonated by fumigation with HCl in silver capsules. Isotope ratios are reported relative to the VPDB (; reported in per mill (‰)), and measured blanks were below the peak detection limit. Measurements were calibrated using laboratory standards of 2,5-Bis(5-tertbutyl-2-benzo-oxazol-2-yl) thiophene (BBOT, Eurovector; TOC=72.53 %, measured as 69.59 %±2.05 %; ‰, measured as ‰; TN=6.51 %, measured as 6.82 %±0.24 %), peach leaves (1570a; TOC=44.65 %; measured as 44.33 %±0.96 %; , measured as; TN=2.83 %, measured as 3.31 %±1.27 %), and urea (Eurovector; TOC=20.00 %, measured as 17.98 %±0.37 %; TN=46.65 %, measured as 45.88 %±0.88 %) for TOC and TN and cellulose (IAEA-C3; , measured as ), sucrose (IAEA-C6; , measured as ), and oxalic acid (IAEA-C8; , measured as ) for stable OC isotopes, with uncertainties reported as 1 standard deviation (± 1 SD). Values of δ13C and TN content are not discussed in the main text but are included in figures and tables in the Supplement.
Radiocarbon content was measured on a subset of sample at the National Ocean Sciences Accelerator Mass Spectrometry (NOSAMS) facility in Woods Hole. Sample splits for radiocarbon were ground to a powder and decarbonated at Caltech in pre-combusted glassware using 1 M HCl, sonicated for 10 min, and neutralized using 1 M NaOH. Splits were centrifuged for 10 min, and the supernatant was removed using a pipette. The samples were rinsed using 20 mL Milli-Q water, centrifuged and decanted twice before being lyophilized, and sent to NOSAMS to be measured for radiocarbon activity (Fmmeas in Eq. 3). NOSAMS also reported total organic carbon content (dry wt % with 5 % measurement uncertainty) and organic carbon stable isotope measurements (referenced to VPDB; ; reported in per mill (‰)), and these produced similar results as LANL (Fig. S5 and Table S2). We used LANL OC contents in subsequent analyses because they reported smaller uncertainties and because we made measurements at LANL for all samples. NOSAMS data are used only for Fm values of the sample subset.
Sample splits for grain size analysis were placed into sterile polypropylene Falcon tubes to remove carbonate and organic materials (Gee and Or, 2002). Samples were acidified overnight with 1 M HCl and then centrifuged for 15 min at 4000 rpm and decanted; they were rinsed twice with DI (deionized) H2O, centrifuged, and decanted before being oven-dried at 55–60 ∘C; and they were then reacted with H2O2 on a hot plate at 85 ∘C to remove organics. Floating pieces of organic material were removed using a micro-spatula rinsed with DI H2O. Additional H2O2 was added until reactions ceased by visual inspection. Samples were rinsed and centrifuged three times before oven-drying. Each sample was re-hydrated using DI H2O, ∼10 mL of 10 g (NaPO3)6 (sodium hexametaphosphate) per 1 L DI H2O was added to prevent flocculation, and samples were sonicated for 3 min. The samples were split while wet using a riffle splitter to the required sediment concentration for laser diffraction, and grain size was measured on a Malvern Mastersizer 2000, with measurements calibrated against a laboratory silica carbide standard (median diameter µm throughout our measurements). Grain size data confirmed our field observations of grain size that were made using a sand card and hand lens (Table S5).
A subset of TOC and TN contents, stable OC isotopes, and grain size data was previously published in Douglas et al. (2021) (Table S2).
Permafrost cutbanks and floodplains generally displayed an organic-rich upper horizon, which extended up to 1.3 m below the ground surface in peat, underlain by silt that abruptly transitioned to sand (Fig. 3a and d; Fig. S3). The thickness of the active layer, measured by trenching or using a 1 m permafrost probe (n=53), ranged from 40 cm to greater than the length of the probe, with a median of measured values (n=38) of approximately 75 cm. Non-permafrost cutbanks had a layer of organic topsoil overlying silt with abundant roots and organic-rich lenses that became interbedded and then transitioned to sand with increasing depth (Fig. 3a). All terrain types exhibited a trend of grain size fining upward, with medium sand (based on bed-material grab samples taken from a boat with a Ponar sampler) comprising the channel-bed material. We did not observe permafrost in active point bars, which had a thin to absent layer of organic topsoil at the land surface underlain by sandy deposits exhibiting ripple and dune cross stratification from sediment transport and deposition. Sediment TOC content and Fm values varied with sediment size. Silt samples had higher average TOC content than sandy samples, and peat had higher TOC content than topsoil (Fig. 4a). Although the organic horizons overlying permafrost had a higher TOC content than the organic horizons overlying non-permafrost deposits, sediment samples below the organic horizon did not show a significant difference in TOC content based on the presence or absence of permafrost for a given grain size (Fig. 4a and b). The strong dependence of TOC content on grain size allowed us to estimate OC stocks based on measured stratigraphic sections.

Figure 4Floodplain sediment geochemistry results. (a) Total organic carbon versus median sediment grain size, with organic horizons split into ice-rich permafrost peat and non-permafrost topsoil, with 1 SD error bars. The horizontal lines indicate the mean and shaded region the standard error of the mean for the peat (n=5, blue shading), topsoil (n=2, red shading), silt (D50<0.63 mm, n=14, gray shading), and sand (D50>0.63 mm, n=7, gray shading) grain size classes. (b) Radiocarbon activity (reported as fraction modern, Fm) versus median grain size, with 1 SD error bars and shaded regions indicating the mean and standard error of the mean for peat (n=3), topsoil (n=1), silt (n=13), and sand (n=7). (c) Sediment sample fraction modern (Fmmeas) plotted against TOC content (TOCmeas) and fit using Eq. (4) to calculate end-members for biospheric radiocarbon fraction modern (Fmbio) and petrogenic organic carbon content (TOCpetro). The 95 % confidence intervals (CI) for cutbanks and point bars are shaded in blue and yellow, with the horizontal upper bound on the point bar CI representing TOCpetro=0.0 wt %. Black lines denote mixing between representative values of TOCpetro and Fmbio. The range of wood and plant debris Fm values is plotted on the right y axis, indicating the likely range of biospheric end-members.
Coarser sediment yielded lower Fm values – indicative of older organic carbon – with silt and organic horizons having higher Fm values (Fig. 4c). A petrogenic contribution can explain measured differences in sediment Fm and would be expected to be enriched in the coarser-size fraction (Galy et al., 2007). To calculate the range of TOCpetro and Fmbio end-members for cutbank and point bar sediment OC, we fitted a nonlinear regression (nlinfit.m in Matlab 2017) between Fmmeas and TOCmeas using Eq. (4) and used the Jacobian to calculate 95 % confidence intervals (Fig. 4c). Fitting Fmmeas to TOCmeas gave a range of biospheric radiocarbon (Fmbio) and petrogenic OC content (TOCpetro) end-members. Some cutbank samples had δ13C greater than −20 ‰, raising concerns about incomplete decarbonation (see Table S2). However, fitting Fmmeas to TOCmeas for cutbank and floodplain samples together but excluding samples with δ13C greater than −20 ‰ (n=13) generated a fit with similar end-members and confidence intervals. Therefore, due to the small number of radiocarbon activity, we did not exclude the high δ13C samples from our analysis.
The 95 % confidence intervals for Fmbio of the cutbanks and point bars overlapped with Fm values from centimeter-scale wood fragments collected from bank samples and cores ( to 0.9843±0.0027, equivalent to radiocarbon ages of 11 750±55 to 125±20 yr BP). Since wood and plant debris is devoid of petrogenic OC, its Fm directly reflects storage and aging in these deposits. Therefore, we inferred that non-permafrost point bars also likely contained some aged biospheric OC.
5.1 Carbon mass balance for a meandering river
To evaluate particulate OC fluxes into and out of the Koyukuk River, we used a mass-balance model applicable to single-threaded, meandering rivers (Fig. 1b), neglecting fluxes due to dissolved OC and wood and plant debris. Our model includes vertical variations in floodplain structure and their corresponding OC stocks, following similar floodplain–river exchange models (Lauer and Parker, 2008). While other models exist that incorporate more complex boundary conditions and sediment tracking (Lauer and Parker, 2008; Malmon et al., 2003; Lauer and Willenbring, 2010), we sought the simplest possible framework that could utilize our field data to constrain carbon fluxes. We considered POC fluxes into the river due to cutbank erosion (FCB; kg yr−1) and out of the river due to POC being deposited in point bars (FPB; kg yr−1) or overbank deposits (FOB; kg yr−1) or oxidized during transport and released to the atmosphere as CO2 (FOX; kg yr−1; Fig. 1b) (Striegl et al., 2012; Denfeld et al., 2013; Serikova et al., 2018). This net budget is represented by
In the subsequent sections, we estimate the organic carbon stocks to find FCB and FPB in Eq. (5) and then discuss the relative magnitudes of FOB and FOX.
5.2 Floodplain organic carbon stocks
To quantify the fluxes of carbon in and out of the river due to bank erosion and bar deposition, we first needed to estimate the carbon stocks in the floodplain. Our approach was to first take advantage of particle-size correlations with TOC content (Fig. 4a and b), as discussed in detail below, to estimate carbon contents for stratigraphic units where we only had grain size information. This process increased our sample size from 9 to 30 complete stratigraphic sections. Next, we used our mapping of floodplain stratigraphy and grain size to estimate carbon stocks integrated over a characteristic depth of the floodplain. We produced this analysis using two different characteristic depths for comparison. A depth of 1 m was used for comparison to previous studies that often only sampled in the top meter of the floodplain (Hugelius et al., 2014). The second depth we used was the depth of the Koyukuk River (12.4 m) because ultimately this is the thickness of floodplain material that is being eroded and deposited by the river. In Sect. 5.3, these depth-integrated carbon concentrations are used to estimate carbon fluxes due to bank erosion and bar deposition.
Measured stratigraphic sections were divided into four units (Fig. S4): sand (D50>63 µm), mud (D50<63 µm), topsoil (organic horizons overlying non-permafrost sediment), and peat (organic horizons overlying permafrost). These stratigraphic units correlated with distinct magnitudes of mean TOC content (ci) and mass fraction of water (). We found the average TOC value from each unit and assigned these average values to the corresponding units for beds where we measured grain size but did not measure TOC. We quantified the uncertainty in ci and using Gaussian error propagation of 1 standard deviation (Tables S2–S4).
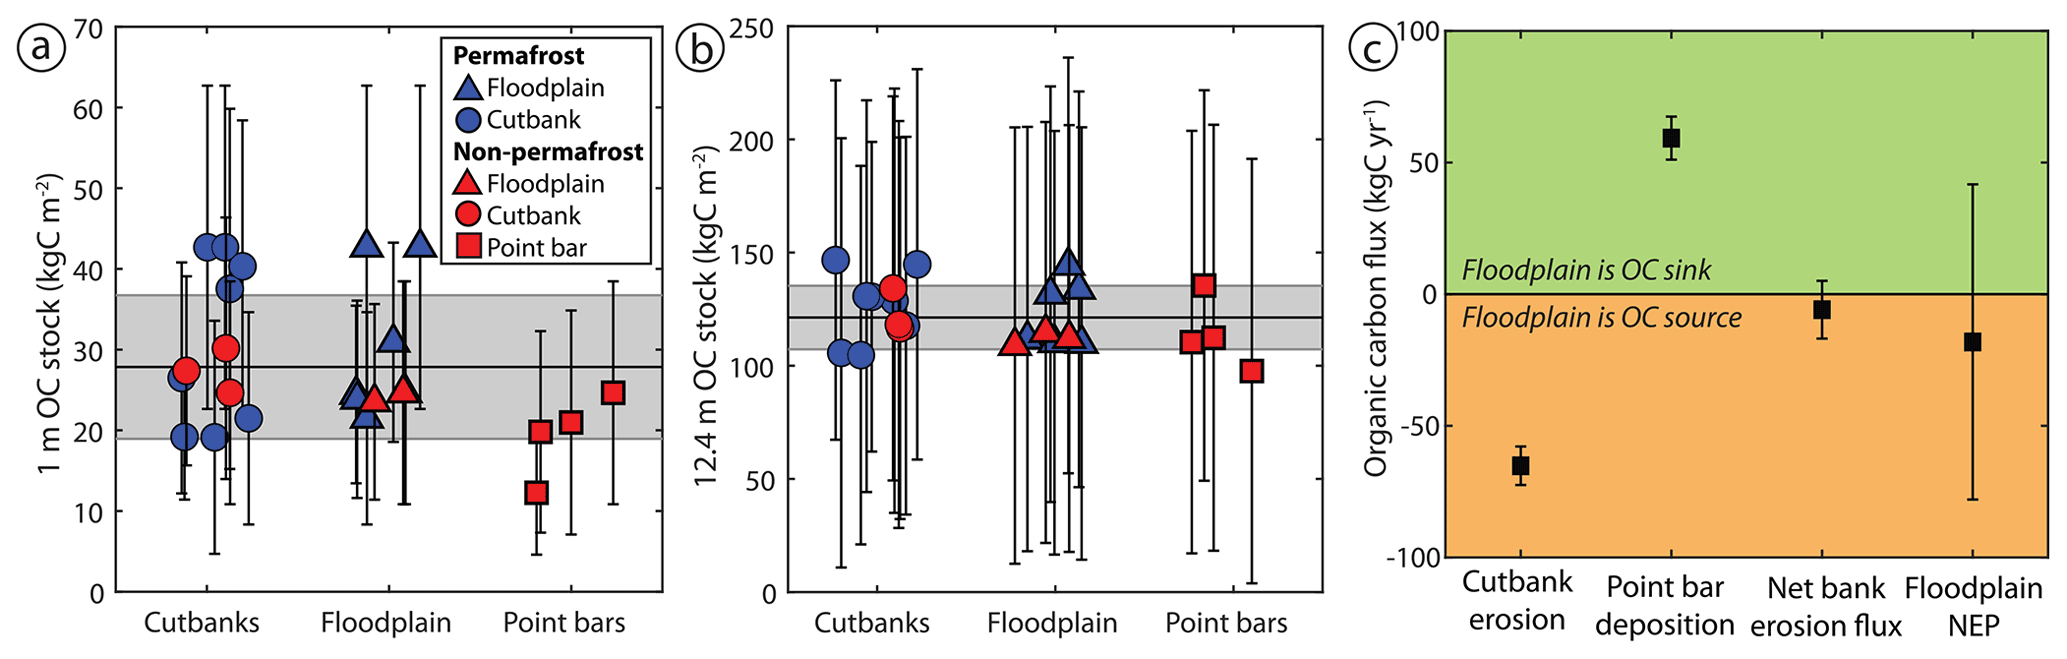
Figure 5Carbon cycling due to river meandering. (a) Total organic carbon (OC) in each stratigraphic column integrated to 1 m below surface, with unmeasured portions of the section assumed to be sand; horizontal lines indicate the mean and shaded regions 1 SD for the complete dataset. (b) Total organic carbon in each stratigraphic column integrated to mean channel depth (12.4 m) using the same assumptions and uncertainty. (c) The net OC flux due to channel migration is comparable to floodplain net ecological productivity (NEP), and both are zero within uncertainty. The net flux of OC into the river due to erosion of cutbanks and out of the river due to sediment deposition in point bars in the Koyukuk River is calculated as the mean OC stock for each landform (with ±1 SD OC stock uncertainty for that landform) multiplied by an average channel migration rate for a 1 m downstream section of riverbank. The cutbank and point bar fluxes are differenced to calculate the net bank erosion flux. Floodplain NEP is calculated for a 10 km wide, 1 m downstream distance section of floodplain using previously reported regional NEP and uncertainties (Potter et al., 2013).
To estimate carbon stocks, total OC measurements and estimated values for each unit (Fig. 4a; Figs. S6 and S7) were integrated both over 1 m depth below the surface (Fig. 5a) and over a depth equivalent to the bankfull river depth (12.4 m; Fig. 5b). We calculated the depth-integrated OC stock using
We accounted for n beds of the four stratigraphic units in each measured stratigraphic section, where ρi is the mean unit bulk density (kg wet sediment per m3), Hi is the unit thickness (m), ci is the mass fraction of OC in the unit (kg OC per kg dry sediment of each unit), and is the mass fraction of water in the unit (kg H2O per kg wet sediment of each unit). , with Mdry,i being the mass fraction of dry sediment in the unit (kg dry sediment per kg wet sediment of each unit). Bulk densities measured from cores for mineral (mean ± SD of 989±323 kg m−3, n=7) and organic (905±49 kg m−3, n=2) horizons were the same within uncertainty (Table S2). Therefore, we used a constant mean bulk density () across all stratigraphic units (Table S3).
Measurement and sampling were only possible on the exposed section of the riverbank, above the water level. Exposed sections represented 7 %–47 % of total bank height (as measured from channel thalweg to bank top). We assumed all sediment below the base of our stratigraphic sections consisted of sand, which was supported by our measurements of grab samples of the active channel and cores of the floodplain beyond 2 m depth (Fig. S3) and was consistent with downward-coarsening trends widely observed in meandering rivers and their deposits (Tables S3–S4) (Miall, 2013).
Estimated permafrost cutbank and floodplain OC stocks integrated to 1 m depth were 31.1±9.8 kg OC m−2 (mean ± 1 SD of OC stocks; n=14), while non-permafrost cutbanks, floodplains, and point bars contained 23.3±4.8 kg OC m−2 (n=10) (Fig. 5a). The Mann–Whitney U test found that OC stocks in permafrost and non-permafrost deposits had similar organic content distributions (p=0.1669). Grouping results by terrain type, permafrost and non-permafrost cutbanks had 30.2±9.2 kg OC m−2 (n=11), permafrost and non-permafrost floodplains had 28.8±8.3 kg OC m−2 (n=9), and non-permafrost point bars had 19.4±5.2 kg OC m−2 (n=4). The Mann–Whitney U test could not reject the null hypothesis of cutbank and floodplain OC stocks being drawn from the same distribution at 5 % confidence (p=0.7891), but the test found weak evidence for point bars having distinctly lower OC stocks (p=0.0503 for floodplains versus point bars, p=0.0601 for point bars versus cutbanks). Therefore, floodplains and cutbanks generally had higher OC stocks in their upper 1 m of sediment than point bars, but we did not observe a significant difference in 1 m OC stocks between permafrost and non-permafrost deposits (Fig. 5a).
Estimated permafrost cutbank and floodplain OC stocks integrated over the channel depth were 125.1±14.9 kg OC m−2 (mean ± 1 SD of OC stocks; n=14), while non-permafrost cutbanks, floodplains, and point bars contained 116.1±11.4 kg OC m−2 (n=10) (Fig. 5b). The Mann–Whitney U test could not reject the null hypothesis that OC stocks in permafrost and non-permafrost deposits had the same organic content distributions (p=0.3641). Grouping results by terrain type, permafrost and non-permafrost cutbanks had 125.3±13.1 kg OC m−2 (n=11), permafrost and non-permafrost floodplains had 121.0±13.5 kg OC m−2 (n=9), and non-permafrost point bars had 114.0±15.7 kg OC m−2 (n=4). Again, the Mann–Whitney U test could not reject the null hypothesis of all landform OC stocks being drawn from the same distribution at 5 % confidence (p=0.3619 for floodplains versus cutbanks, p=0.8252 for floodplains versus point bars, p=0.2799 for point bars versus cutbanks). Therefore, the distribution of OC stocks integrated to channel depth for cutbanks was indistinguishable from the distribution of measured stocks of newly deposited point bars (Fig. 5b).
5.3 Carbon fluxes from river meandering
We used the OC stocks calculated to channel depth to quantify POC fluxes due to lateral channel migration (FCB and FPB in Eq. 5). We averaged the lateral migration rate over 83 km river length comprising eight meander bends (Fig. 2) to capture the characteristic sediment transport distances between depositional events (Pizzuto et al., 2014), variation in local erosion rate due to channel curvature (Sylvester et al., 2019; Howard and Knutson, 1984), and the formation of cutoffs and oxbow lakes. We calculated the mean bank erosion rate by averaging the area of floodplain eroded (1.60 km2) and accreted (1.85 km2) from previously published erosion masks generated using Landsat imagery (Rowland et al., 2019). Dividing this area by the length of the channel reach centerline (82.823 km) and the measurement interval for the erosion masks (2018–1978) resulted in a mean lateral migration rate of 0.52 m yr−1.
We approximated the flux into the river due to cutbank erosion as , where L is a unit river reach length (1 m), E is the bank erosion rate (0.52 m yr−1), and CCB is the cutbank carbon stock (kg OC m−2). The point bar carbon flux was similarly calculated using , where CPB is the carbon stock of the point bar (kg OC m−2). Using OC stocks integrated to channel depth, we estimated fluxes of POC due to bank erosion as kg OC yr−1 and due to point bar deposition as kg OC yr−1 (Fig. 5c). This result means that OC fluxes due to bank erosion and bar deposition were equal within uncertainty.
We used radiocarbon measurements to evaluate if (1) the OC being eroded from cutbanks was oxidized during transport (FOX), (2) the eroded OC was re-deposited in bars via lateral accretion (FPB) or overbank deposits (FOB), or (3) new biospheric OC was being added to point bars and floodplains by vegetation growth after sediment deposition. Similar to TOC and TN contents, Fm displayed a trend of higher values for finer grain sizes – a pattern consistent with prior findings that reflects the greater proportional petrogenic OC contribution in coarser material (Hilton et al., 2015; Galy et al., 2007). Coarser sediment tended to have lower TOC content, potentially indicating that low Fm values are in part due to a greater fraction of petrogenic OC (fpetro). When we fit a range of mixing models to assess sediment biospheric radiocarbon activity, we found that sediment from cutbanks and point bars had similar ranges of potential biospheric OC end-members (Fig. 4c). This observation matched the range of aged wood and plant debris found at sediment sampling locations.
Our mass-balance calculation and the presence of aged Fmbio in newly deposited point bars both support the hypothesis that a significant fraction of OC eroded from cutbanks is re-deposited in the floodplain and not oxidized during transport. In addition to point bar deposition, OC could be lost from the river via overbank deposition (FOB). In this case, one would expect the carbon stocks to increase on floodplain surfaces of increasing age due to the deposition of silt units near the surface. Our measurements did indicate a slight increase in 1 m OC stocks between recently deposited point bars and floodplain inferred to be older based on their distance to the river (Fig. 5a), but they did not show a significant increase in OC stock when integrated to channel depth (Fig. 5b). One possible explanation could be that FOB is substantial but that this carbon has been remineralized and lost to the atmosphere. To constrain the frequency of overbank flooding along the Koyukuk River near Huslia, we examined the Landsat image record and did not find instances of overbank flooding. Ice jams, where floating ice piles up and causes high water during spring break up along Arctic rivers, occurred only four times near Huslia from 1967–2019, and in these cases, overbank flooding did not occur (White and Eames, 1999). Therefore, historical records suggest that sediment fluxes due to overbank sediment deposition are relatively minor compared to fluxes due to channel migration. Our stratigraphic observations showing a similar thickness of capping silt units in floodplain stratigraphy (with a mean of 1.29 m for cutbank, 0.92 m for floodplain, and 1.55 m for point bar samples; Table S4), and the low mass fraction of siliciclastic sediment in organic horizons (based on high mass fraction TOC; Fig. 4a) also indicated that overbank deposition of sediment on the distal floodplain is relatively small.
Rather than additional OC from overbank flows, floodplains do appear to accumulate additional OC from biomass production. We observed an increase in organic horizon thickness, from a mean of 0.06 m in point bars to 0.45 m in cutbanks and 0.44 m in floodplain deposits, primarily driven by increasing thickness of peat horizons (Table S4). The increase in organic horizon thickness can explain the cutbank and floodplain OC stocks summed to 1 m depth being slightly higher than the point bar 1 m OC stocks. Since OC stocks summed to channel depth were statistically similar between landforms, we expected that there was some oxidation of modern, labile OC during fluvial transport that was replaced after sediment was deposited in a point bar by biomass production. In spite of biospheric OC input to floodplain sediment through the growth of peat (on permafrost) and an organic-rich topsoil (on non-permafrost), observations of sediment containing old radiocarbon in both cutbanks and point bars indicate that point bar OC has been eroded from upstream and subsequently re-deposited, generating a reservoir of OC that has been aged by sediment storage along the Koyukuk River.
Our mass-balance model indicated that channel migration generated substantial fluxes of OC into the river (>50 kg OC yr−1 from cutbank erosion). If we assumed that all OC in point bars was deposited with river sediment, the calculated OC fluxes due to bank erosion and bar deposition balanced each other within uncertainty (Fig. 5c). However, our radiocarbon analyses indicated that a portion of the biospheric OC in point bars was fixed after deposition by local vegetation. This was reflected in slightly higher 1 m OC stocks in cutbanks and floodplain deposits versus point bars. If we instead assumed that around half of OC in eroding cutbanks was oxidized during river transport, we calculated the river must transport downstream or oxidize >30 kg OC yr−1 per meter of river reach. For comparison, measurements of floodplain net ecological productivity (NEP) – the rate of OC fixation minus respiration – indicated that an equivalent 10 km wide, 1 m long river reach would emit 12.1±39.9 kg OC yr−1 (mean ± 1 SD) (Potter et al., 2013). Therefore, the large depth (>10 m) and migration rates (0.52 m yr−1) of the Koyukuk River allow fluxes due to bank erosion and deposition to exceed floodplain NEP, despite the far smaller land area of erosion and deposition along the riverbanks compared to the expansive floodplain. In addition, our results indicate that ∼75 % of OC liberated by bank erosion comes from below the top meter. Therefore, large downstream OC fluxes from river migration can be attributed to rapid exposure and mobilization of a deep OC reservoir not readily accessible by top–down thaw.
The channel migration rates we measured reflect the river area eroded versus deposited from 1978–2018, and these migration rates are influenced by the cutoff of a narrow river reach that decreases channel length but slightly increases average width (Fig. S2). Autogenic processes such as river response to cutoffs and re-visiting areas of the floodplain more or less frequently may cause transient changes in downstream OC fluxes along the Koyukuk. However, sparse observations indicate very high excess dissolved CO2 and methane in Koyukuk River water, supporting that there is significant OC oxidation during transport (FOX) (Striegl et al., 2012). Overall, significant work remains to understand the partitioning of OC loss between the dissolved and particulate loads as well as between petrogenic versus biospheric POC, particularly since DOC concentration and lability varies seasonally in the headwaters of the Koyukuk River (O'Donnell et al., 2010).
Our results indicated less variability in OC stocks across the Koyukuk River floodplain than previous work by Lininger et al. (2019), who found significant variations in OC stocks between geomorphic units in the Yukon Flats. Lininger et al. (2019) report OC stocks to a depth of 1 m along the Yukon River and its tributaries and extrapolated the deepest measured mineral OC contents to 1 m based on similar OC content in a few samples taken at depth along cutbanks. Similar to their results, we found that newly deposited point bars without a thick organic horizon had slightly lower OC stocks for the upper 1 m of sediment. Our results also agree with Lininger et al. (2019) that the coarser sediment fraction contributes significant OC and that floodplain sediments can store OC for thousands of years between riverine transport events. However, we found little variation with geomorphic unit for OC stocks calculated to the channel depth (12.4 m). Though we included organic horizons extending below 1 m, the majority of our OC budget used to calculate fluxes due to channel migration was comprised of the more massive sandy deposits with low OC content. These differences point to the importance of river depth relative to the depth of significant floodplain biospheric OC production and the grain size of the floodplain material at depth. We hypothesize that cutbank and point bar OC stocks will be similar for rivers with coarser sediment and channels much deeper than the active layer and rooting depth of vegetation. In contrast, OC stocks in floodplains of fine-grained, shallow rivers might have a higher fraction of their OC oxidized after erosion from cutbanks and replaced after deposition in point bars.
The presence of aged biospheric OC in newly deposited, non-permafrost point bars along the Koyukuk River illustrated that floodplains are important reservoirs of aged OC in sediments both with and without permafrost. Rivers tend to rework younger floodplain deposits faster than older floodplain deposits, and this can yield a heavy-tailed distribution of deposit ages and carbon storage over thousands of years (Torres et al., 2017). Our results supported the idea that a fraction of particulate OC has experienced transient mobilization and deposition and thus becomes naturally aged during transport through the river–floodplain system. Therefore, particulate OC with old radiocarbon signatures might be attributed to OC storage in floodplains and may not be a diagnostic indicator of permafrost thaw. One might expect better preservation of carbon stocks in permafrost deposits. However, our field observations of bank sediment rapidly changing color from gray to orange when exposed to air imply that thawed floodplain sediments may be anoxic, which would reduce rates of organic matter respiration in non-permafrost deposits. When coupled with cold mean annual temperatures, anoxic non-permafrost terrain might be similarly effective as permafrost in preserving and aging biospheric OC stocks (Davidson et al., 2006). Thus, transient storage of particles in floodplains, potentially for thousands of years (Repasch et al., 2020; Torres et al., 2020), may delay or diffuse downstream signals of perturbations to the watershed's carbon cycle before reaching long-term monitoring stations at river mouths or sediment depocenters (McClelland et al., 2016; Holmes et al., 2012).
Climate change is expected to cause a decrease or disappearance of permafrost, which might alter rates of POC oxidation (FOX), overbank deposition (FOB), and ultimately downstream riverine POC fluxes. Permafrost thaw is also hypothesized to increase river lateral migration rates (Costard et al., 2003), although such changes have yet to be systematically documented. For the Koyukuk River, higher channel migration rates should, with all else equal, increase the magnitude of OC fluxes due to erosion and deposition and thereby decrease the residence time and age of OC within the floodplain, but possibly with no net change in OC fluxes from the floodplain to the river. However, if, for example, climate change increases the relative importance of overbank deposition of OC-rich mud (higher FOB) relative to sand bar accretion, then this change would cause a permanent increase in floodplain OC stocks, with associated decreases in OC river fluxes during the transient period of floodplain grain size fining. In contrast, an increase in channel lateral migration relative to overbank flooding would cause floodplains to become sandier and floodplain OC stocks to decline. Furthermore, climate change is altering flood discharge and frequency (Koch et al., 2013; Vonk et al., 2019; Walvoord and Kurylyk, 2016) as well as sediment supply, often associated with thaw slumps (Kokelj et al., 2013; Lantz and Kokelj, 2008; Malone et al., 2013; Shakil et al., 2020). Increases in flood magnitude could cause channel widening (Ashmore and Church, 2001; Walvoord and Kurylyk, 2016), which would increase cutbank OC fluxes relative to point bar fluxes (FCB>FPB), creating a transient increase in riverine OC flux. We expect that changes in floodplain hydrology and sedimentation due to climate change will alter downstream particulate OC fluxes and floodplain OC storage along deep, meandering Arctic rivers similar to the Koyukuk. In the process, sediment deposition in river bars should preserve radiocarbon-depleted OC and dampen positive feedbacks due to POC being released from permafrost by riverbank erosion as the climate warms.
To evaluate the role of riverbank erosion and bar deposition in liberating organic carbon (OC) from permafrost floodplains, we conducted a field campaign along the Koyukuk River in central Alaska, taking samples of riverbank and floodplain sedimentary deposits. Finer bank sediment had a systematically higher TOC content and Fm values than coarser sands. We combined measurements on individual samples with measured floodplain stratigraphic columns to calculate OC stocks for cutbanks, point bars, and floodplains summed to both 1 m below the surface and extrapolated to the 12.4 m river channel depth. We found that cutbanks had slightly higher OC stocks than point bars at shallow depths. However, OC stocks integrated to river channel depth did not significantly vary between river cutbanks, floodplain, and point bars or with the presence or absence of permafrost. As the Koyukuk River migrates, it is able to rapidly erode this deep OC reservoir, generating substantial OC fluxes from bank erosion and bar deposition. Net OC fluxes due to river migration are of the same order of magnitude as floodplain net ecological productivity, despite the river occupying a small fraction of the land surface. Our results indicate that floodplain processes generated an aged biospheric radiocarbon signature in newly deposited point bars, and variations in sediment Fm with grain size may be due to mixing with a petrogenic end-member. We conclude that a portion of biospheric OC that was eroded from cutbanks was preserved through transport and deposition. The presence of radiocarbon-depleted sediment in non-permafrost deposits indicates that aged POC in Arctic rivers is not a unique indicator for the presence of permafrost. Our results highlight that Arctic floodplains are significant reservoirs of OC, and their stratigraphic architecture and morphology influence POC fluxes and radiocarbon ages transmitted downstream. Therefore, sediment deposition in river bars should dampen positive feedbacks due to POC being released from permafrost by riverbank erosion as the climate warms.
All datasets are included in the paper and Supplement.
The supplement related to this article is available online at: https://doi.org/10.5194/esurf-10-421-2022-supplement.
MPL, JCR, WWF, AJW, GKL, and MMD conceptualized the study. MPL, AJW, JCR and GKL determined the methodology. MMD, GKL, JCR, PCK, AJW, JS, APP, AJC, and MPL collected field data. MMD, GKL, PCK, and AJW assisted with geochemistry. MPL supervised the work. MMD conducted data analysis and wrote the original draft, and all authors contributed to the review and editing of the paper.
One author is a member of the editorial board of Earth Surface Dynamics. The peer-review process was guided by an independent editor, and the authors also have no other competing interests to declare.
Publisher's note: Copernicus Publications remains neutral with regard to jurisdictional claims in published maps and institutional affiliations.
We thank the Koyukuk-hotana Athabascans of Huslia, First Chief Norman Burgett, and the Huslia Tribal Council for land access and US Fish and Wildlife Service (USFWS) – Koyukuk National Wildlife refuge for research permitting and logistical assistance. Shawn Huffman, Alvin Attla, and Virgil Umphenour provided field support and local expertise. We also thank Alex Sessions and Fenfang Wu for use of equipment and assistance with preparing samples for TOC analysis and Matthew Kirby for use of the Malvern Mastersizer and assistance with grain size analysis.
We acknowledge financial support from the Department of Energy Office of Science, Biological and Environmental Research, Earth and Environmental Systems Sciences Division, Subsurface Biogeochemical Research Program Early Career Award to Joel C. Rowland; Caltech Terrestrial Hazards Observation and Reporting Center, Foster and Coco Stanback, the Linde Family, and the Resnick Sustainability Institute to Michael P. Lamb and Woodward W. Fischer; the Caltech Center for Environmental Microbial Interactions to Woodward W. Fischer; National Science Foundation Awards 2127442 and 2031532; the National Defence Science and Engineering Graduate Fellowship for Madison M. Douglas and Preston C. Kemeny; and the Fannie and John Hertz Foundation Cohen/Jacobs and Stein Family Fellowship for Preston C. Kemeny.
This paper was edited by Robert Hilton and reviewed by Jordon Hemingway and one anonymous referee.
Ashmore, P. and Church, M.: The Impact of Climate Change on Rivers and River Processes in Canada, Geological Survey of Canada, 65 pp., ISBN 0-660-16252-1, 2001.
Biskaborn, B. K., Smith, S. L., Noetzli, J., Matthes, H., Vieira, G., Streletskiy, D. A., Schoeneich, P., Romanovsky, V. E., Lewkowicz, A. G., Abramov, A., Allard, M., Boike, J., Cable, W. L., Christiansen, H. H., Delaloye, R., Diekmann, B., Drozdov, D., Etzelmüller, B., Grosse, G., Guglielmin, M., Ingeman-Nielsen, T., Isaksen, K., Ishikawa, M., Johansson, M., Johannsson, H., Joo, A., Kaverin, D., Kholodov, A., Konstantinov, P., Kröger, T., Lambiel, C., Lanckman, J.-P., Luo, D., Malkova, G., Meiklejohn, I., Moskalenko, N., Oliva, M., Phillips, M., Ramos, M., Sannel, A. B. K., Sergeev, D., Seybold, C., Skryabin, P., Vasiliev, A., Wu, Q., Yoshikawa, K., Zheleznyak, M., and Lantuit, H.: Permafrost is warming at a global scale, Nat. Commun., 10, 1–11, https://doi.org/10.1038/s41467-018-08240-4, 2019.
Blair, N. E., Leithold, E. L., Ford, S. T., Peeler, K. A., Holmes, J. C., and Perkey, D. W.: The persistence of memory: the fate of ancient sedimentary organic carbon in a modern sedimentary system, Geochim. Cosmochim. Ac., 67, 63–73, https://doi.org/10.1016/S0016-7037(02)01043-8, 2003.
Bouchez, J., Beyssac, O., Galy, V., Gaillardet, J., France-Lanord, C., Maurice, L., and Moreira-Turcq, P.: Oxidation of petrogenic organic carbon in the Amazon floodplain as a source of atmospheric CO2, Geology, 38, 255–258, https://doi.org/10.1130/G30608.1, 2010.
Costard, F., Dupeyrat, L., Gautier, E., and Carey-Gailhardis, E.: Fluvial thermal erosion investigations along a rapidly eroding river bank: application to the Lena River (central Siberia), Earth Surf. Proc. Land., 28, 1349–1359, https://doi.org/10.1002/esp.592, 2003.
Cui, X., Bianchi, T. S., Jaeger, J. M., and Smith, R. W.: Biospheric and petrogenic organic carbon flux along southeast Alaska, Earth Planet. Sc. Lett., 452, 238–246, https://doi.org/10.1016/j.epsl.2016.08.002, 2016.
Daly, C., Smith, J. I., and Olson, K. V.: Mapping Atmospheric Moisture Climatologies across the Conterminous United States, PLoS ONE, 10, e0141140, https://doi.org/10.1371/journal.pone.0141140, 2015.
Daly, C., Smith, J., and Halbleib, M.: 1981–2010 High-Resolution Temperature and Precipitation Maps for Alaska, PRISM Climate Group, Corvallis, OR [data set], https://prism.oregonstate.edu/projects/public/alaska/grids (last access: 5 May 2022), 2018.
Davidson, E. A., Janssens, I. A., and Luo, Y.: On the variability of respiration in terrestrial ecosystems: moving beyond Q10, Glob. Change Biol., 12, 154–164, https://doi.org/10.1111/j.1365-2486.2005.01065.x, 2006.
Denfeld, B. A., Frey, K. E., Sobczak, W. V., Mann, P. J., and Holmes, R. M.: Summer CO2 evasion from streams and rivers in the Kolyma River basin, north-east Siberia, Polar Res., 32, 19704, https://doi.org/10.3402/polar.v32i0.19704, 2013.
Dietrich, W. E., Smith, J. D., and Dunne, T.: Flow and Sediment Transport in a Sand Bedded Meander, J. Geol., 87, 305–315, https://doi.org/10.1086/628419, 1979.
Douglas, M. M., Lingappa, U. F., Lamb, M. P., Rowland, J. C., West, A. J., Li, G., Kemeny, P. C., Chadwick, A. J., Piliouras, A., Schwenk, J., and Fischer, W. W.: Impact of river channel lateral migration on microbial communities across a discontinuous permafrost floodplain, Appl. Environ. Microbiol., 87, AEM.01339-21, https://doi.org/10.1128/AEM.01339-21, 2021.
Dumoulin, J. A., Harris, A. G., Blome, C. D., and Young, L. E.: Depositional Settings, Correlation, and Age of Carboniferous Rocks in the Western Brooks Range, Alaska, Econ. Geol., 99, 1355–1384, https://doi.org/10.2113/gsecongeo.99.7.1355, 2004.
Dupeyrat, L., Costard, F., Randriamazaoro, R., Gailhardis, E., Gautier, E., and Fedorov, A.: Effects of ice content on the thermal erosion of permafrost: implications for coastal and fluvial erosion, Permafrost Periglac., 22, 179–187, https://doi.org/10.1002/ppp.722, 2011.
Eke, E., Parker, G., and Shimizu, Y.: Numerical modeling of erosional and depositional bank processes in migrating river bends with self-formed width: Morphodynamics of bar push and bank pull, J. Geophys. Res.-Earth, 119, 1455–1483, https://doi.org/10.1002/2013JF003020, 2014.
French, H. and Shur, Y.: The principles of cryostratigraphy, Earth-Sci. Rev., 101, 190–206, https://doi.org/10.1016/j.earscirev.2010.04.002, 2010.
Galy, V. and Eglinton, T.: Protracted storage of biospheric carbon in the Ganges–Brahmaputra basin, Nat. Geosci., 4, 843–847, https://doi.org/10.1038/ngeo1293, 2011.
Galy, V., France-Lanord, C., Beyssac, O., Faure, P., Kudrass, H., and Palhol, F.: Efficient organic carbon burial in the Bengal fan sustained by the Himalayan erosional system, Nature, 450, 407–410, https://doi.org/10.1038/nature06273, 2007.
Galy, V., Beyssac, O., France-Lanord, C., and Eglinton, T.: Recycling of Graphite During Himalayan Erosion: A Geological Stabilization of Carbon in the Crust, Science, 322, 943–945, https://doi.org/10.1126/science.1161408, 2008.
Gee, G. W. and Or, D.: Particle-Size Analysis, in: Methods of Soil Analysis Part 4: Physical Methods, edited by: Dane, J. H. and Topp, G. C., Soil Science Society of America, Inc., Madison, WI, ISBN 9780891188933, 2002.
Hemingway, J. D., Hilton, R. G., Hovius, N., Eglinton, T. I., Haghipour, N., Wacker, L., Chen, M.-C., and Galy, V. V.: Microbial oxidation of lithospheric organic carbon in rapidly eroding tropical mountain soils, Science, 360, 209–212, https://doi.org/10.1126/science.aao6463, 2018.
Hilton, R. G., Galy, V., Gaillardet, J., Dellinger, M., Bryant, C., O'Regan, M., Gröcke, D. R., Coxall, H., Bouchez, J., and Calmels, D.: Erosion of organic carbon in the Arctic as a geological carbon dioxide sink, Nature, 524, 84–87, https://doi.org/10.1038/nature14653, 2015.
Holmes, R. M., McClelland, J. W., Peterson, B. J., Tank, S. E., Bulygina, E., Eglinton, T. I., Gordeev, V. V., Gurtovaya, T. Y., Raymond, P. A., Repeta, D. J., Staples, R., Striegl, R. G., Zhulidov, A. V., and Zimov, S. A.: Seasonal and Annual Fluxes of Nutrients and Organic Matter from Large Rivers to the Arctic Ocean and Surrounding Seas, Estuar. Coast., 35, 369–382, https://doi.org/10.1007/s12237-011-9386-6, 2012.
Horan, K., Hilton, R. G., Dellinger, M., Tipper, E., Galy, V., Calmels, D., Selby, D., Gaillardet, J., Ottley, C. J., and Parsons, D. R.: Carbon dioxide emissions by rock organic carbon oxidation and the net geochemical carbon budget of the Mackenzie River Basin, Am. J. Sci., 319, 473–499, https://doi.org/10.2475/06.2019.02, 2019.
Howard, A. D. and Knutson, T. R.: Sufficient conditions for river meandering: A simulation approach, Water Resour. Res., 20, 1659–1667, https://doi.org/10.1029/WR020i011p01659, 1984.
Hugelius, G., Strauss, J., Zubrzycki, S., Harden, J. W., Schuur, E. A. G., Ping, C.-L., Schirrmeister, L., Grosse, G., Michaelson, G. J., Koven, C. D., O'Donnell, J. A., Elberling, B., Mishra, U., Camill, P., Yu, Z., Palmtag, J., and Kuhry, P.: Estimated stocks of circumpolar permafrost carbon with quantified uncertainty ranges and identified data gaps, Biogeosciences, 11, 6573–6593, https://doi.org/10.5194/bg-11-6573-2014, 2014.
Isaksen, K., Romanovsky, V., Smith, S. L., and Drozdov, D. S.: Thermal state of permafrost across the circumpolar permafrost regions – results from the latest assessment report, the SWIPA update, in: XI International Conference on Permafrost, book of abstracts, edited by: Günther, F. and Morgenstern, A., Bibliothek Wissenschaftspark Albert Einstein, Potsdam, DE, 444–445, https://doi.org/10.2312/GFZ.LIS.2016.001, 2016.
Kanevskiy, M., Shur, Y., Strauss, J., Jorgenson, T., Fortier, D., Stephani, E., and Vasiliev, A.: Patterns and rates of riverbank erosion involving ice-rich permafrost (yedoma) in northern Alaska, Geomorphology, 253, 370–384, https://doi.org/10.1016/j.geomorph.2015.10.023, 2016.
Koch, J., Ewing, S., Striegl, R., and McKnight, D.: Rapid runoff via shallow throughflow and deeper preferential flow in a boreal catchment underlain by frozen silt (Alaska, USA), Hydrogeol. J., 21, 93–106, https://doi.org/10.1007/s10040-012-0934-3, 2013.
Kokelj, S. V., Lacelle, D., Lantz, T. C., Tunnicliffe, J., Malone, L., Clark, I. D., and Chin, K. S.: Thawing of massive ground ice in mega slumps drives increases in stream sediment and solute flux across a range of watershed scales, J. Geophys. Res.-Earth, 118, 681–692, https://doi.org/10.1002/jgrf.20063, 2013.
Lantz, T. C. and Kokelj, S. V.: Increasing rates of retrogressive thaw slump activity in the Mackenzie Delta region, NWT, Canada, Geophys. Res. Lett., 35, L06502, https://doi.org/10.1029/2007GL032433, 2008.
Lauer, J. W. and Parker, G.: Modeling framework for sediment deposition, storage, and evacuation in the floodplain of a meandering river: Theory, Water Resour. Res., 44, W08404, https://doi.org/10.1029/2006WR005528, 2008.
Lauer, J. W. and Willenbring, J.: Steady state reach-scale theory for radioactive tracer concentration in a simple channel/floodplain system, J. Geophys. Res.-Earth, 115, F04018, https://doi.org/10.1029/2009JF001480, 2010.
Lininger, K. B. and Wohl, E.: Floodplain dynamics in North American permafrost regions under a warming climate and implications for organic carbon stocks: A review and synthesis, Earth-Sci. Rev., 193, 24–44, https://doi.org/10.1016/j.earscirev.2019.02.024, 2019.
Lininger, K. B., Wohl, E., and Rose, J. R.: Geomorphic controls on floodplain soil organic carbon in the Yukon Flats, interior Alaska, from reach to river basin scales, Water Resour. Res., 54, 1934–1951, https://doi.org/10.1002/2017WR022042, 2018.
Lininger, K. B., Wohl, E., Rose, J. R., and Leisz, S. J.: Significant Floodplain Soil Organic Carbon Storage Along a Large High-Latitude River and its Tributaries, Geophys. Res. Lett., 46, 2121–2129, https://doi.org/10.1029/2018GL080996, 2019.
Loiko, S. V., Pokrovsky, O. S., Raudina, T. V., Lim, A., Kolesnichenko, L. G., Shirokova, L. S., Vorobyev, S. N., and Kirpotin, S. N.: Abrupt permafrost collapse enhances organic carbon, CO2, nutrient and metal release into surface waters, Chem. Geol., 471, 153–165, https://doi.org/10.1016/j.chemgeo.2017.10.002, 2017.
Malmon, D. V., Dunne, T., and Reneau, S. L.: Stochastic Theory of Particle Trajectories through Alluvial Valley Floors, J. Geol., 111, 525–542, https://doi.org/10.1086/376764, 2003.
Malone, L., Lacelle, D., Kokelj, S., and Clark, I. D.: Impacts of hillslope thaw slumps on the geochemistry of permafrost catchments (Stony Creek watershed, NWT, Canada), Chem. Geol., 356, 38–49, https://doi.org/10.1016/j.chemgeo.2013.07.010, 2013.
Mason, J. and Mohrig, D.: Scroll bars are inner bank levees along meandering river bends, Earth Surf. Proc. Land., 44, 2649–2659, https://doi.org/10.1002/esp.4690, 2019.
McClelland, J. W., Holmes, R. M., Peterson, B. J., Raymond, P. A., Striegl, R. G., Zhulidov, A. V., Zimov, S. A., Zimov, N., Tank, S. E., Spencer, R. G. M., Staples, R., Gurtovaya, T. Y., and Griffin, C. G.: Particulate organic carbon and nitrogen export from major Arctic rivers, Global Biogeochem. Cy., 30, 629–643, https://doi.org/10.1002/2015GB005351, 2016.
Miall, A. D.: Principles of Sedimentary Basin Analysis, Springer Science & Business Media, 633 pp., ISBN 978-038797119, 2013.
Nowacki, G. J., Spencer, P., Fleming, M., Brock, T., and Jorgenson, T.: Unified Ecoregions of Alaska: 2001, Geological Survey, USA, https://doi.org/10.3133/ofr2002297, 2003.
O'Donnell, J. A., Aiken, G. R., Kane, E. S., and Jones, J. B.: Source water controls on the character and origin of dissolved organic matter in streams of the Yukon River basin, Alaska, J. Geophys. Res.-Biogeo., 115, G03025, https://doi.org/10.1029/2009JG001153, 2010.
O'Donnell, J. A., Jorgenson, M. T., Harden, J. W., McGuire, A. D., Kanevskiy, M. Z., and Wickland, K. P.: The effects of permafrost thaw on soil hydrologic, thermal, and carbon dynamics in an Alaskan peatland, Ecosystems, 15, 213–229, https://doi.org/10.1007/s10021-011-9504-0, 2012.
Parmentier, F.-J. W., Christensen, T. R., Rysgaard, S., Bendtsen, J., Glud, R. N., Else, B., van Huissteden, J., Sachs, T., Vonk, J. E., and Sejr, M. K.: A synthesis of the arctic terrestrial and marine carbon cycles under pressure from a dwindling cryosphere, Ambio, 46, 53–69, https://doi.org/10.1007/s13280-016-0872-8, 2017.
Pizzuto, J., Schenk, E. R., Hupp, C. R., Gellis, A., Noe, G., Williamson, E., Karwan, D. L., O'Neal, M., Marquard, J., Aalto, R., and Newbold, D.: Characteristic length scales and time-averaged transport velocities of suspended sediment in the mid-Atlantic Region, USA, Water Resour. Res., 50, 790–805, https://doi.org/10.1002/2013WR014485, 2014.
Potter, C., Klooster, S., and Genovese, V.: Alaska ecosystem carbon fluxes estimated from MODIS satellite data inputs from 2000 to 2010, Carbon Balance and Management, 8, 12, https://doi.org/10.1186/1750-0680-8-12, 2013.
Randriamazaoro, R., Dupeyrat, L., Costard, F., and Gailhardis, E. C.: Fluvial thermal erosion: heat balance integral method, Earth Surf. Proc. Land., 32, 1828–1840, https://doi.org/10.1002/esp.1489, 2007.
Reimer, P. J., Brown, T. A., and Reimer, R. W.: Discussion: Reporting and Calibration of Post-Bomb 14C Data, Radiocarbon, 46, 1299–1304, https://doi.org/10.1017/S0033822200033154, 2004.
Repasch, M., Wittmann, H., Scheingross, J. S., Sachse, D., Szupiany, R., Orfeo, O., Fuchs, M., and Hovius, N.: Sediment Transit Time and Floodplain Storage Dynamics in Alluvial Rivers Revealed by Meteoric 10Be, J. Geophys. Res.-Earth, 125, e2019JF005419, https://doi.org/10.1029/2019JF005419, 2020.
Romanovsky, V. E., Smith, S. L., and Christiansen, H. H.: Permafrost thermal state in the polar Northern Hemisphere during the international polar year 2007–2009: a synthesis, Permafrost Periglac., 21, 106–116, https://doi.org/10.1002/ppp.689, 2010.
Rowland, J., Stauffer, S., and Schwenk, J.: Pan-arctic river bank erosion and accretion, and planform metrics measured over intervals ranging from 1973 to 2016, ESS-DIVE [data set], https://doi.org/10.15485/1571527, 2019.
Scheingross, J. S., Repasch, M. N., Hovius, N., Sachse, D., Lupker, M., Fuchs, M., Halevy, I., Gröcke, D. R., Golombek, N. Y., Haghipour, N., Eglinton, T. I., Orfeo, O., and Schleicher, A. M.: The fate of fluvially-deposited organic carbon during transient floodplain storage, Earth Planet. Sc. Lett., 561, 116822, https://doi.org/10.1016/j.epsl.2021.116822, 2021.
Schreiner, K. M., Bianchi, T. S., and Rosenheim, B. E.: Evidence for permafrost thaw and transport from an Alaskan North Slope watershed, Geophys. Res. Lett., 41, 3117–3126, https://doi.org/10.1002/2014GL059514, 2014.
Schuur, E. A. G., McGuire, A. D., Schädel, C., Grosse, G., Harden, J. W., Hayes, D. J., Hugelius, G., Koven, C. D., Kuhry, P., Lawrence, D. M., Natali, S. M., Olefeldt, D., Romanovsky, V. E., Schaefer, K., Turetsky, M. R., Treat, C. C., and Vonk, J. E.: Climate change and the permafrost carbon feedback, Nature, 520, 171–179, https://doi.org/10.1038/nature14338, 2015.
Serikova, S., Pokrovsky, O. S., Ala-Aho, P., Kazantsev, V., Kirpotin, S. N., Kopysov, S. G., Krickov, I. V., Laudon, H., Manasypov, R. M., Shirokova, L. S., Soulsby, C., Tetzlaff, D., and Karlsson, J.: High riverine CO2 emissions at the permafrost boundary of Western Siberia, Nat. Geosci., 11, 825–829, https://doi.org/10.1038/s41561-018-0218-1, 2018.
Shakil, S., Tank, S. E., Kokelj, S. V., Vonk, J. E., and Zolkos, S.: Particulate dominance of organic carbon mobilization from thaw slumps on the Peel Plateau, NT: Quantification and implications for stream systems and permafrost carbon release, Environ. Res. Lett., 15, 114019, https://doi.org/10.1088/1748-9326/abac36, 2020.
Shur, Y. L. and Jorgenson, M. T.: Patterns of permafrost formation and degradation in relation to climate and ecosystems, Permafrost Periglac., 18, 7–19, https://doi.org/10.1002/ppp.582, 2007.
Slack, J. F., Selby, D., and Dumoulin, J. A.: Hydrothermal, Biogenic, and Seawater Components in Metalliferous Black Shales of the Brooks Range, Alaska: Synsedimentary Metal Enrichment in a Carbonate Ramp Setting, Econ. Geol., 110, 653–675, https://doi.org/10.2113/econgeo.110.3.653, 2015.
Spencer, R. G., Mann, P. J., Dittmar, T., Eglinton, T. I., McIntyre, C., Holmes, R. M., Zimov, N., and Stubbins, A.: Detecting the signature of permafrost thaw in Arctic rivers, Geophys. Res. Lett., 42, 2830–2835, https://doi.org/10.1002/2015GL063498, 2015.
Striegl, R. G., Dornblaser, M. M., McDonald, C. P., Rover, J. R., and Stets, E. G.: Carbon dioxide and methane emissions from the Yukon River system, Global Biogeochem. Cy., 26, GB0E05, https://doi.org/10.1029/2012GB004306, 2012.
Sylvester, Z., Durkin, P., and Covault, J. A.: High curvatures drive river meandering, Geology, 47, 263–266, https://doi.org/10.1130/G45608.1, 2019.
Toohey, R. C., Herman-Mercer, N. M., Schuster, P. F., Mutter, E. A., and Koch, J. C.: Multidecadal increases in the Yukon River Basin of chemical fluxes as indicators of changing flowpaths, groundwater, and permafrost, Geophys. Res. Lett., 43, 12120–12130, https://doi.org/10.1002/2016GL070817, 2016.
Torres, M. A., Limaye, A. B., Ganti, V., Lamb, M. P., West, A. J., and Fischer, W. W.: Model predictions of long-lived storage of organic carbon in river deposits, Earth Surf. Dynam., 5, 711–730, https://doi.org/10.5194/esurf-5-711-2017, 2017.
Torres, M. A., Kemeny, P. C., Lamb, M. P., Cole, T. L., and Fischer, W. W.: Long-Term Storage and Age-Biased Export of Fluvial Organic Carbon: Field Evidence From West Iceland, Geochem. Geophy. Geosy., 21, e2019GC008632, https://doi.org/10.1029/2019GC008632, 2020.
Turetsky, M. R., Abbott, B. W., Jones, M. C., Anthony, K. W., Olefeldt, D., Schuur, E. A., Grosse, G., Kuhry, P., Hugelius, G., and Koven, C.: Carbon release through abrupt permafrost thaw, Nat. Geosci., 13, 138–143, https://doi.org/10.1038/s41561-019-0526-0, 2020.
Vonk, J. E., Tank, S. E., and Walvoord, M. A.: Integrating hydrology and biogeochemistry across frozen landscapes, Nat. Commun., 10, 1–4, https://doi.org/10.1038/s41467-019-13361-5, 2019.
Walvoord, M. A. and Kurylyk, B. L.: Hydrologic Impacts of Thawing Permafrost – A Review, Vadose Zone J., 15, 6, https://doi.org/10.2136/vzj2016.01.0010, 2016.
Wang, J., Hilton, R. G., Jin, Z., Zhang, F., Densmore, A. L., Gröcke, D. R., Xu, X., Li, G., and West, A. J.: The isotopic composition and fluxes of particulate organic carbon exported from the eastern margin of the Tibetan Plateau, Geochim. Cosmochim. Ac., 252, 1–15, https://doi.org/10.1016/j.gca.2019.02.031, 2019.
White, K. D. and Eames, H. J.: CRREL Ice Jam Database, Cold Regions Research and Engineering Lab, Hanover, NH, https://icejam.sec.usace.army.mil (last access: 5 May 2022), 1999.
Wilson, F. H., Hults, C. P., Mull, C. G., and Karl, S. M.: Geologic map of Alaska, Geologic map of Alaska, U.S. Geological Survey, Reston, VA, https://doi.org/10.3133/sim3340, 2015.