the Creative Commons Attribution 4.0 License.
the Creative Commons Attribution 4.0 License.
 | 02 Jun 2022
Investigation of stochastic-threshold incision models across a climatic and morphological gradient
Vincent Godard
Dimitri Lague
Guillaume Duclaux
Jules Fleury
Lucilla Benedetti
Olivier Bellier
Long-term landscape evolution is controlled by tectonic and climatic forcing acting through surface processes. Rivers are the main drivers of continental denudation because they set the base level of most hillslopes. The mechanisms of fluvial incision are thus a key focus in geomorphological research and require accurate representation and models. River incision is often modeled with a stream power model (SPM) based on the along-stream evolution of drainage area and channel elevation gradient but can also incorporate more complex processes such as threshold effects and statistical discharge distributions, which are fundamental features of river dynamics. Despite their importance in quantitative geomorphology, such model formulations have been confronted with field data only in a limited number of cases. Here we investigate the behavior of stochastic-threshold incision models across the southeastern margin of the French Massif Central, which is characterized by significant relief and the regular occurrence of high-discharge events.
Our study is based on a new dataset combining measurements of discharge variability from gauging stations, denudation rates from 34 basins from 10Be cosmogenic radionuclide (CRN) concentration measurements in river sediments, morphometric analysis of river long profiles, and field observations. This new dataset is used for a systematic investigation of various formulations of the SPM and to discuss the importance of incision thresholds. Denudation rates across the SE margin of the Massif Central are in the 20–120 mm kyr−1 (equivalent to mm/ka in the figures) range, and they positively correlate with slope and precipitation. However, the relationship with the steepness index is complex and supports the importance of taking into account spatial variations in parameters (D50, discharge variability k, runoff) controlling the SPM. Overall, the range of denudation rate across the margin can mainly be explained using a simple version of the SPM accounting for spatially heterogeneous runoff. More complex formulations including stochastic discharge and incision thresholds yield poorer performances unless the spatial variations in bedload characteristics controlling incision thresholds are taken into account. Our results highlight the importance of the hypotheses used for such a threshold in SPM application to field studies and notably the impact of actual constraints on bedload size.
- Article
(6192 KB) - Full-text XML
-
Supplement
(12137 KB) - BibTeX
- EndNote


Investigating landscape evolution and its responses to tectonic or climatic perturbations requires accurate models of surface processes such as hillslope erosion and fluvial incision (Dietrich et al., 2003). Rivers are key agents for the transmission of external forcing through landscapes and, by setting the base level of most hillslopes, the main drivers of continental denudation. For these reasons the mechanisms of fluvial incision have been a key focus of geomorphological research over the last 3 decades (e.g., Howard et al., 1994; Whipple et al., 2000).
A powerful framework has been derived for the analysis of fluvial processes along bedrock rivers by postulating that incision rate scales with either shear stress or unit stream power per riverbed area (e.g., Howard, 1994; Whipple and Tucker, 1999; Sklar and Dietrich, 2006; Turowski et al., 2007; Lague, 2014). The main appeal of this stream power model (SPM) is that the incision rate can be expressed using a limited number of reasonable assumptions as a simple function of drainage area and channel elevation gradient, which are variables easily extracted from digital topographic data. Such a simplification is the foundation for the widely used analysis of channel steepness, which is now a standard approach in the investigation of tectonically active landscapes, allowing for deciphering relative rock uplift distributions (Wobus et al., 2006; Kirby and Whipple, 2012; Whittaker, 2012). It has also been used to model fluvial incision at continental scales (e.g., Roberts and White, 2010). However, the tremendous success of these applications of the stream power model should not hide the fact that some of its key aspects remain highly debated in terms of both the parameters it incorporates and the physical processes it is supposed to represent (e.g., Lague, 2014; Gasparini and Brandon, 2011; Harel et al., 2016). For example, the way rock resistance to erosion can be accounted for is still poorly understood (e.g., Sklar and Dietrich, 2001), as is its applicability to fluvial systems wherein sediment transport and deposition represent an important modulation of incision (e.g., Whipple and Tucker, 2002).
The existence of a threshold in discharge that needs to be overcome for incision or sediment transport to occur has long been recognized in fluvial geomorphology. Taking into account such a threshold in relation to a statistical description of discharge is a long-standing issue for the modeling of long-term fluvial incision and for our understanding of the contribution of extreme events to landscape evolution (e.g., Tucker and Bras, 2000; Snyder et al., 2003; Lague et al., 2005; Molnar et al., 2006; Deal et al., 2018). The theoretical implications of incorporating incision thresholds and discharge distributions into stream-power-based incision models have been explored systematically and highlight the emergence of complex and nonlinear behavior between channel properties and incision rates.
Recently, several studies have built upon this theoretical framework and explored its applications to real landscapes, mainly by bringing together erosion rates derived from cosmogenic radionuclides (CRNs), river profile morphological analysis, and constraints on climatic or hydrological variability. They notably highlighted the importance of taking into account incision thresholds and discharge variability to understand the nonlinear relationship between erosion rates and channel steepness. DiBiase and Whipple (2011) provided the first of such investigations in the San Gabriel Mountains in California and demonstrated the suitability of river incision models combining an incision threshold and a power-law distribution of extreme discharge events to account for observations of river profile steepness and erosion rates. More generally, they explored the behavior of this relationship across a wide range of climatic configurations to highlight limits in the response of channel incision to an increase in runoff. Based on a denudation dataset spanning very contrasting climates along the central Chilean Andes, Carretier et al. (2013) demonstrated the role of extreme discharge events in driving most of the erosion for arid settings. Scherler et al. (2017) developed an analysis at the scale of the whole Himalayan arc and eastern Tibet in order to explore the underlying reasons for long-wavelength variations in the relationship between channel steepness and erosion rates. They notably explored the influence of a spatially variable incision threshold and assessed the importance of climatic controls such as characteristics of monsoon precipitation. More recently, Campforts et al. (2020) highlighted the importance of taking into account lithological and climatic spatial differences when using this type of model to analyze the variance in CRN-derived denudation rate datasets.
These studies were critical tests of our ability to reconcile topographic and geochronological observations using a physically based framework for river incision. However, many of these earlier investigations relied on pre-existing CRN datasets that were acquired with sometimes independent sampling strategies. It implies datasets combining catchment areas varying over 2 orders of magnitude and with notably large basins (>100 km2), which cover surfaces displaying important variations in bedrock geology and climate. Additionally, due to the spatial extent of the studied regions and the lack of appropriate gauging station data, some of these studies also relied in part on remote sensing observations for the characterization of hydrological variability instead of direct measurements. Lastly, in some cases it was not possible to constrain first-order parameters with field observations, such as bedload size, which is the most important factor controlling the incision threshold.
The main objective of our study is to investigate stochastic-threshold incision models in a context in which robust, short-wavelength constraints can be obtained for all the parameters involved. In particular, we want to explore the importance of spatial variations of environmental parameters such as incision threshold and discharge variability in order to better understand their control on long-term landscape evolution. In contrast with most previous studies which have addressed such questions, we design a dedicated sampling strategy focusing on the southeastern margin of the Massif Central (France), a region with well-defined short-wavelength climatic and hydrological gradients and limited recent tectonic activity. For that purpose, we acquired a new consistent CRN dataset for catchment-wide denudation to compare measured landscape evolution rates with predictions of various river incision models. We analyzed river profile and basin morphometric parameters to evaluate their relationships with denudation rates, compiled hydrological data from gauging stations in order to characterize discharge variability, and combined new and existing bedload size data to constrain the incision threshold.
Based on the premise that river networks are the main drivers of landscape evolution, the relationship between channel steepness and erosion rates has been intensively scrutinized, in particular to assess the implications of its degree of nonlinearity. At first order, our new dataset displays a complex structure between these two observations, which cannot be adequately fitted by a simple scaling relationship, and highlights the need for a careful consideration of spatial variations in the lithological, climatic, and hydrological parameters. We develop this argument by first recalling the theoretical background behind stochastic incision models and outlining the main characteristics of our study area, with an emphasis on the specific characteristics which make it a particularly appropriate setting for our investigation of such models. Then, we describe the methods used and the dedicated sampling strategy we designed, as well as the results obtained. On the basis of these results, we explore the consistency of model predictions with the observed denudation rates. Lastly, we discuss the regional distribution of these denudation rates, their co-variations with various environmental factors, the adequacy of various modeling approaches, and the implications for stochastic incision models.
The theoretical background for the incorporation of discharge probability distributions into river incision models has been extensively described in previous studies (Tucker and Bras, 2000; Snyder et al., 2003; Lague et al., 2005; DiBiase and Whipple, 2011; Scherler et al., 2017; Campforts et al., 2020), and its main features will be presented briefly here. Instantaneous detachment-limited fluvial incision I can be expressed as a function of shear stress acting on the riverbed τ,
where τc is a threshold shear stress beyond which incision occurs, ke is an erodibility coefficient depending on the properties of the bedrock, and a is an exponent dependent on the nature of incision processes. Shear stress τ can be expressed as a function of discharge Q, slope S, and channel width W as
with kt, α, and β as parameters depending on the formulation used to express flow resistance: for example, and when using Manning's frictional relationship or for a Darcy–Weisbach relation (Howard, 1994).
The critical shear stress can be expressed as
where D50 is median bedload grain size, is the critical Shields stress, and ρs and ρw are the density of sediment and water, respectively. The variation of channel width W downstream and with instantaneous discharge Q can be computed according to
with ωs an empirical parameter and Wb the bankfull width, scaling with the mean annual discharge as
where kw and ωb are another couple of empirical parameters, which can be determined from field measurements or remote sensing imagery (Kirby and Ouimet, 2011; DiBiase and Whipple, 2011; Fisher et al., 2012). Mean annual discharge can be calculated from mean runoff and drainage area A as , with c an exponent that we will consider equal to 1 in the following.
Equations (1) to (5) can then be combined into an expression for instantaneous incision I,
This equation can be simplified by defining an area exponent , a slope exponent n=aβ, an erodibility term , , and a threshold term ,
This relationship highlights the importance of the parameter γ in controlling the sensitivity of incision to discharge and its variability (Lague et al., 2005). Introducing the steepness index (Kirby and Whipple, 2012), Eq. (7) can also be written as
Assuming that the threshold term Ψ is negligible and that discharge Q is constant and equal to mean discharge , Eq. (7) simplifies to the classical stream power form, which is widely used in quantitative geomorphology studies:
Long-term incision E can be calculated by weighting instantaneous incision (Eqs. 7 or 8) with discharge probability pdf(Q) and integrating over Q,
where Qc is the critical discharge needed to overcome the incision threshold and Qm is the maximum discharge. Qc is obtained by setting I=0 in Eq. (7):
In incision models taking into account discharge variability, the probability distribution of discharges is often modeled using an inverse gamma law,
where is normalized discharge, k is the variability parameter, and Γ is the gamma function (Lague et al., 2005). Low values of k correspond to a situation in which the discharge variability is high. The inverse gamma distribution combines exponential and power-law parts describing low- and high-discharge regimes, respectively, and accounting for the low probabilities of events at both ends of the spectrum. In this study we will use Eq. (10) to model erosion rates using field constraints on its parameters and compare its predictions with cosmogenic-nuclide-derived denudation rates.
Our region of interest is located along the southeastern margin of the French Massif Central, directly west of the Rhône river valley (Fig. 1a).
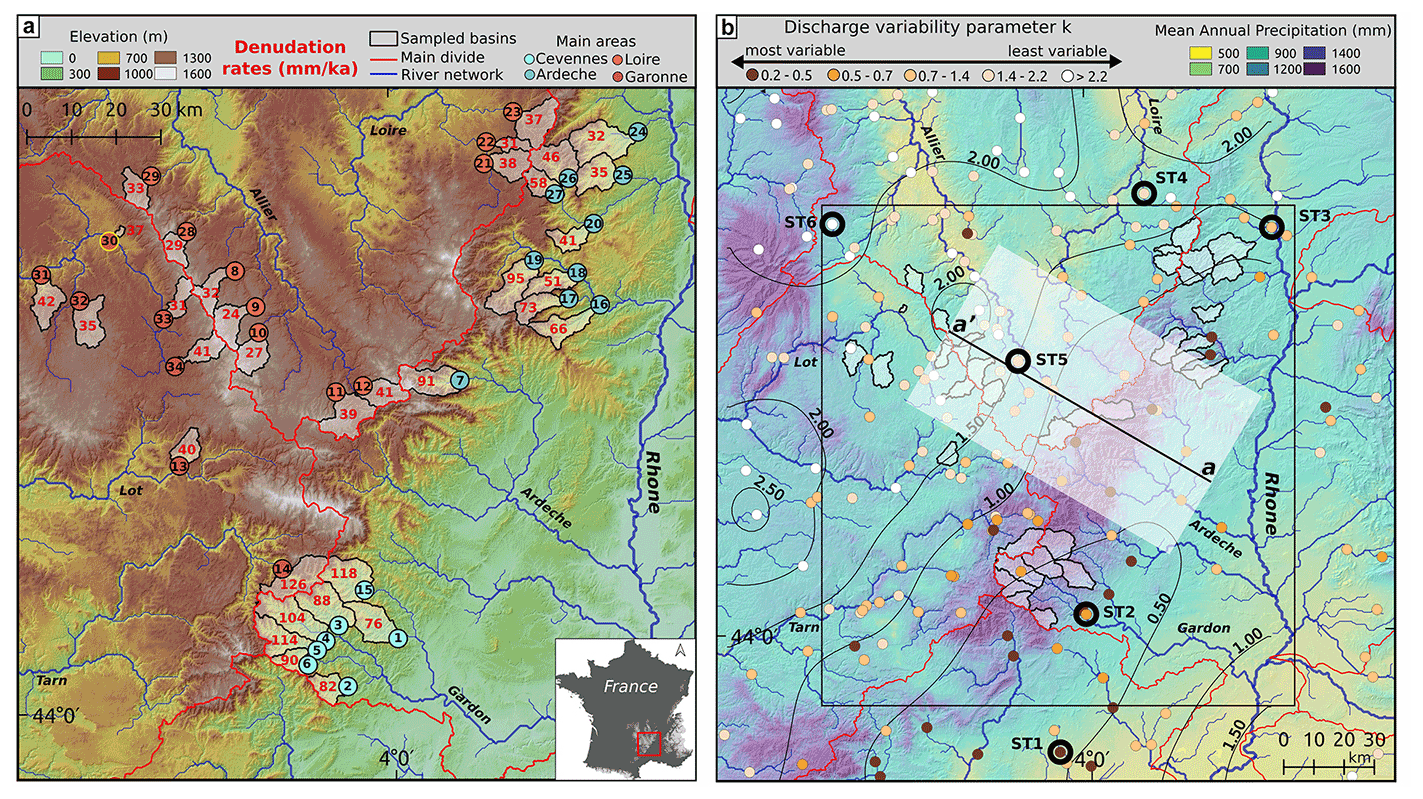
Figure 1(a) Topographic map of the southeastern margin of the Massif Central (France), with the location of the sampled basins and their denudation rate (red numbers). Black numbers identify the different samples. The red lines are the main regional drainage divides between the majors catchments: Loire (Lo), Rhône (Rh), and Garonne (Gr). For basins in the Rhône catchment, we distinguish two areas corresponding to the Cévennes (Rh-C) and Ardèche (Rh-A) mountains (Table S3). (b) Distribution of precipitation over the studied area. The black rectangle indicates the extent of (a). Colored circles are the gauging stations where the discharge variability coefficient k was estimated, with dark contours indicating selected stations with discharge distributions presented in Fig. 3. Dark contours correspond to a thin plate spline surface fitted to the variability data. aa' indicates the position and lateral extent of the swath profile presented in Fig. 2.
The margin presents an asymmetrical topography with deeply incised valleys draining into the Rhône on its eastern flank (Fig. S4), while farther west, the interior of the Massif Central is characterized by lower relief and plateau areas (Fig. 2).
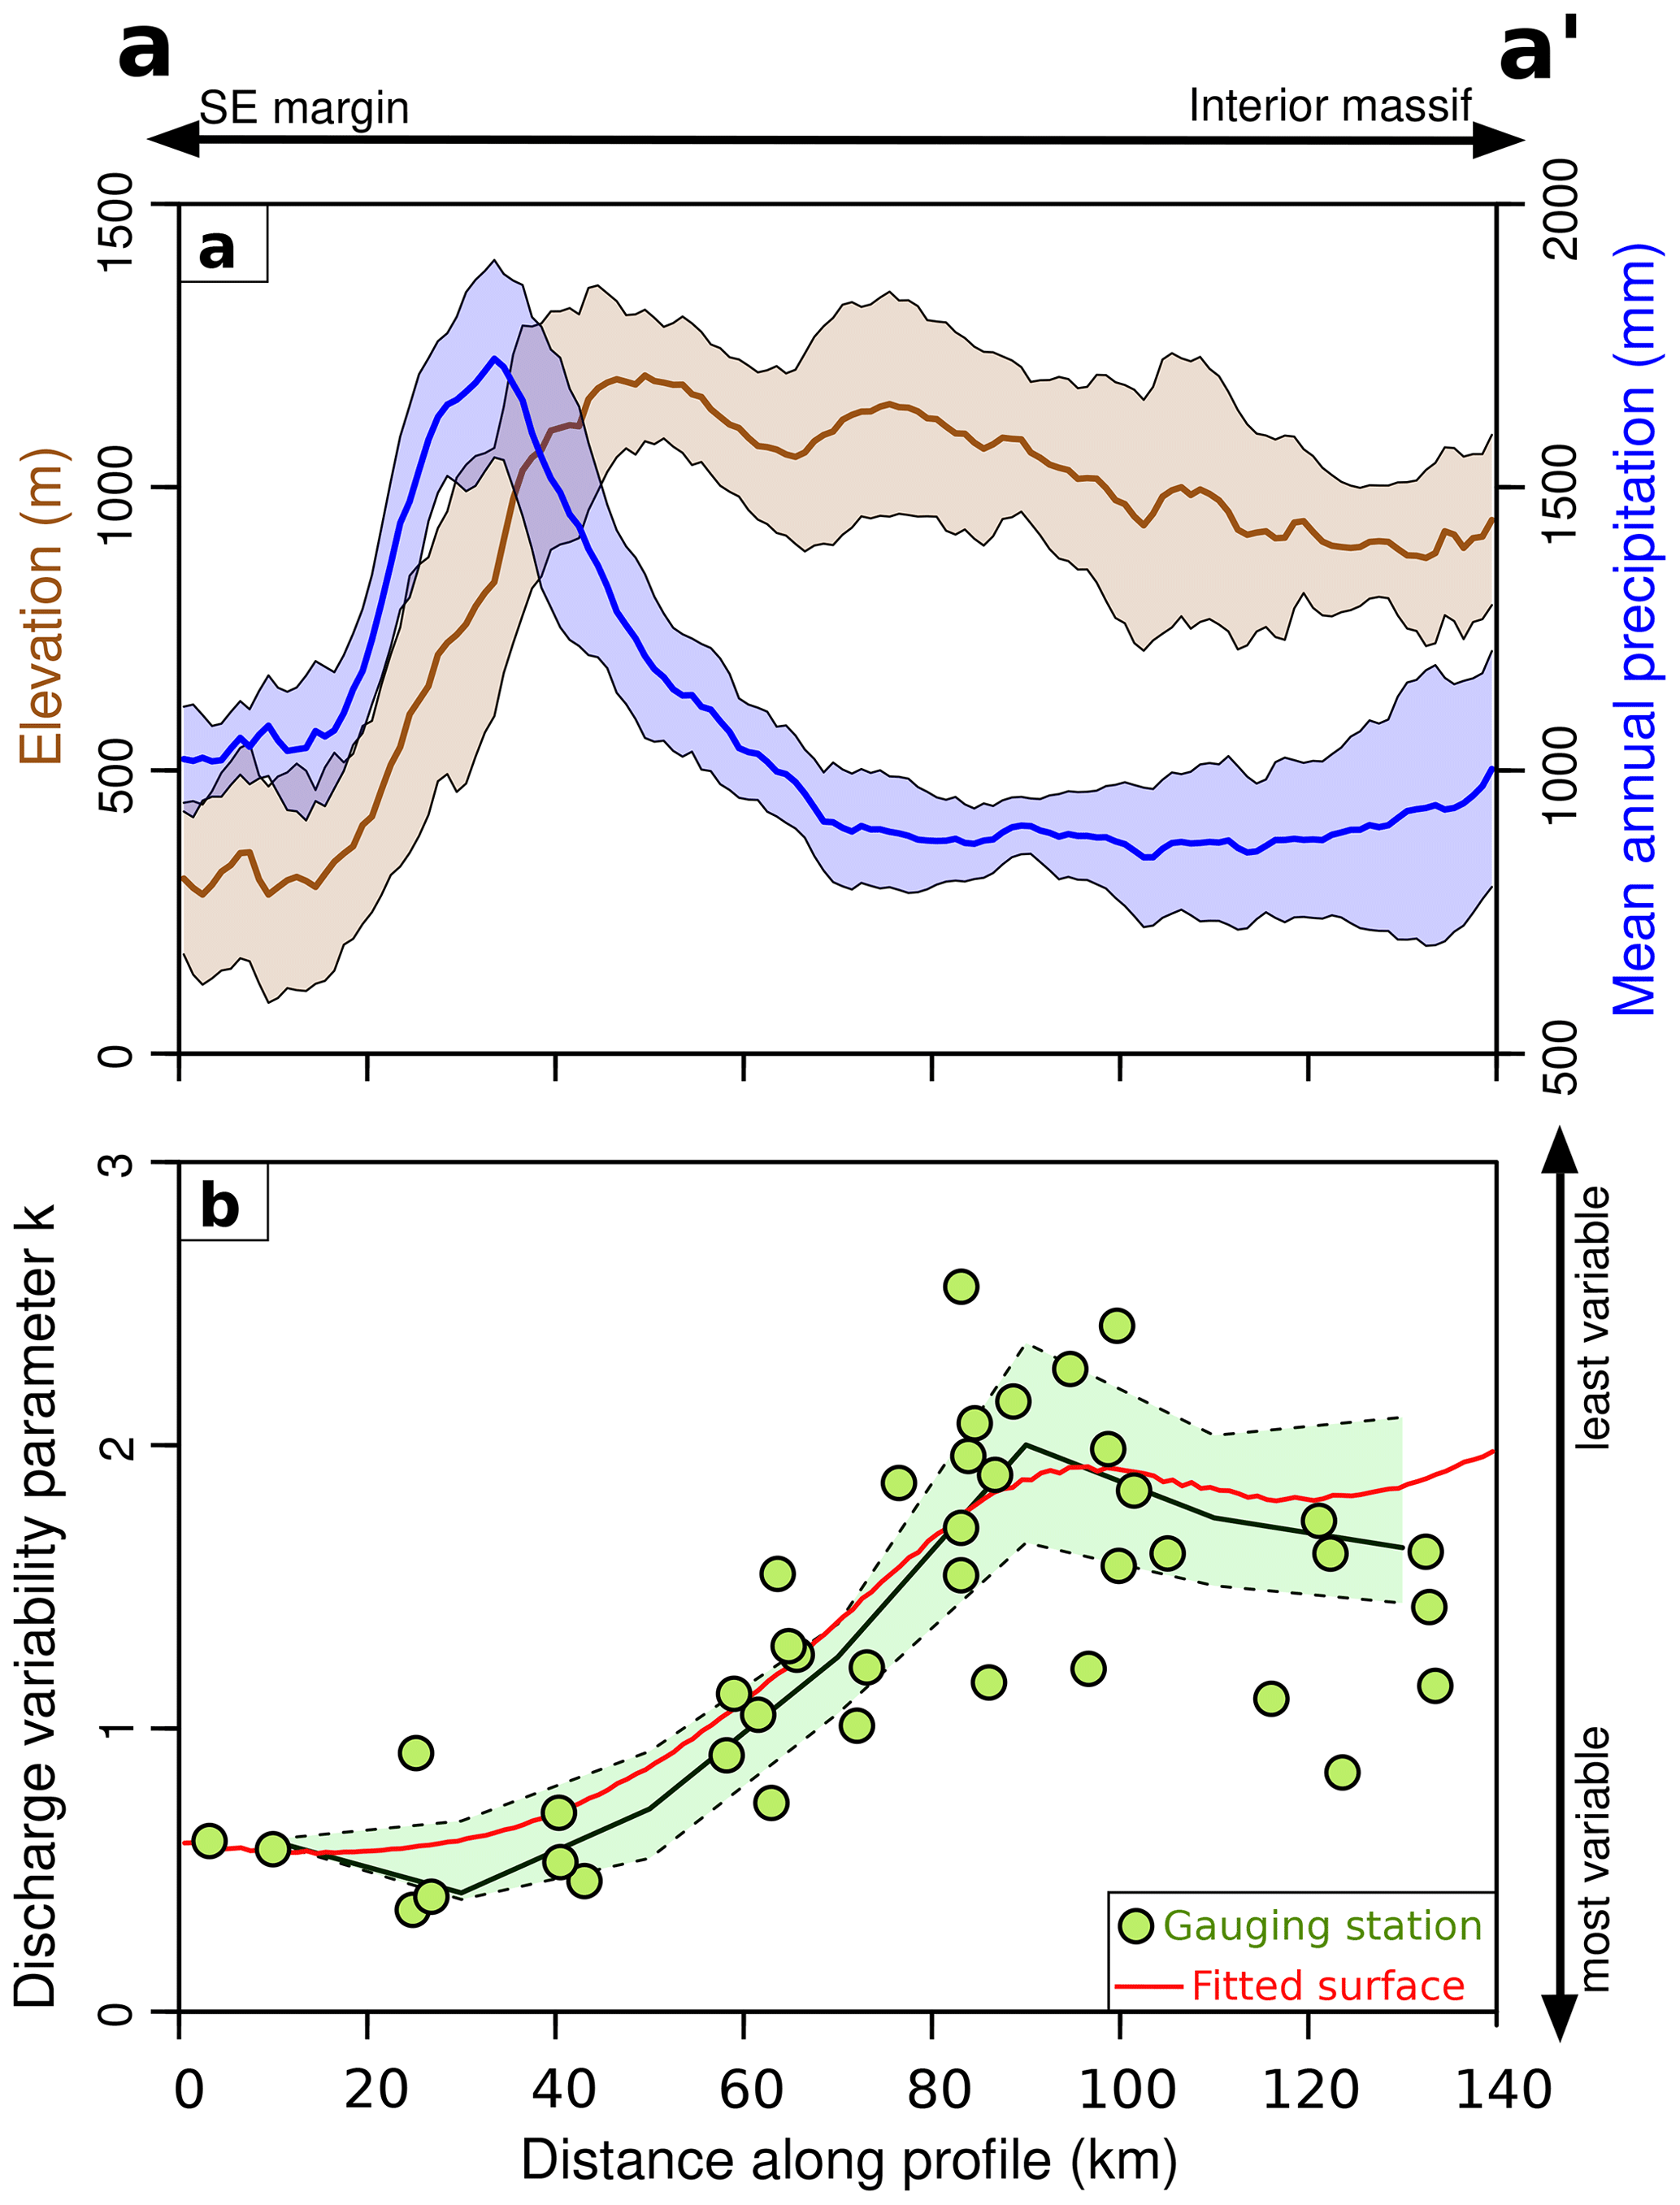
Figure 2(a) Swath profile for elevation and mean annual precipitation (MAP) across the southeastern margin of the Massif Central (width 60 km). The location of the profile is indicated in Fig. 1b. Solid lines and envelopes are the medians and interquartile ranges, respectively. (b) Values of the discharge variability parameter at gauging stations (green circles). The black solid line is the median along the same swath profile as the panel above. The envelope denotes the interquartile range. The red line corresponds to the interpolated thin plate spline surface (Fig. 1b).
The limit between these two domains corresponds to the divide between the Rhône and Loire or Garonne catchments, and on the Rhône side of the divide we specifically investigate the Cévennes and Ardèche mountains with maximum elevation of ∼1600 and 1750 m, respectively.
Orographic precipitation associated with moisture from the Mediterranean is focused on the topographic margin, with mean annual precipitation (MAP) ∼1500 mm, and then a slight decrease toward MAP∼1000 mm inside the Massif Central (Figs. 1a and 2). This orographic precipitation regime is also associated with very intense rainfall events, known as Cévenol events, triggering flash floods along the rivers draining the southeastern margin, usually in the fall. For example, during the 8–9 September 2002 event ∼500 mm precipitation was recorded in 9 h at one rain gauge inside the Gardon catchment (Le Lay and Saulnier, 2007).
The Massif Central is part of the Hercynian orogenic system, which developed during the late Paleozoic. Due to their connection to the Rhône valley the eastern drainage systems were probably affected by the Messinian salinity crisis (Mocochain et al., 2009; Tassy et al., 2013). The Cenozoic uplift history of the Massif Central and its mechanisms are still poorly documented, but it is suspected that most of the observed relief, with respect to the Rhône valley, is associated with distinct late Miocene to Pliocene uplift events (Olivetti et al., 2016; Malcles et al., 2020). The present tectonic activity of the Massif Central is limited, with a recent uplift rate < 100 mm kyr−1. A few historical and instrumental earthquakes with magnitude < 5 have been reported along the southeastern margin (Mazzotti et al., 2020; Ritz et al., 2020). Bedrock lithology is dominated by crystalline Hercynian basement (granites, gneisses, and micashists), Mesozoic–Cenozoic sedimentary series, and late Cenozoic volcanic rocks (Fig. S1 in the Supplement). In the following we focus on the quartz-bearing lithologies when collecting samples for 10Be analysis.
In summary, the SE Massif Central presents a clear topographic margin with contrasting domains on both sides of the drainage divide, associated with strong climatic and hydrological gradients. In our study we take advantage of this particular configuration, as well as low tectonic activity and strong climatic variability, to explore stochastic-threshold incision models.
We present the various datasets which were acquired or used for our study. For the sake of clarity, for each type of data we successively present the methodology and corresponding results.
4.1 Discharge variability
4.1.1 Methods
We extracted daily discharge data for 326 gauging stations from the Banque HYDRO (http://hydro.eaufrance.fr, last access: 31 May 2022) database over the SE margin of the Massif Central and surrounding areas, with records spanning at least 20 years. The time series were first processed to identify anomalies such as missing values, zero values, or sequences of days with identical data. For each station starting and ending dates were manually defined in order to extract the longest continuous series of valid data. The discharge data were normalized by the mean discharge and empirical cumulative distributions when calculated. Our focus here is on the high-discharge part of the distribution and the contribution of events associated with incision, and we fitted a power law to that part of the distribution of the form . The value of exponent α is an indicator of the importance of high-discharge events in the flow regime (Molnar et al., 2006) and is directly related to the variability parameter of the inverse gamma distribution (Eq. 12) by .
The power law was fitted using the approach of Clauset et al. (2007) to determine both the exponent α and the minimal normalized discharge value corresponding to the lower bound of the power-law behavior. The identification of the lower limit xmin of the power-law behavior was done by selecting the value yielding a probability distribution of the empirical normalized discharge data above xmin as close as possible to the best-fit power-law model. In addition to a long-wavelength pattern associated with the global regional climatic setting, we expect to observe short-wavelength variations due to diversity in catchment size, bedrock geology, and vegetation as well as uncertainty resulting from the limited length of the records, differences in monitoring practices by operators, and biases in the measurement of extreme events. We are interested in the first-order regional variation of climatic parameters; in order to obtain a long-wavelength approximation of the spatial distribution of k over our study area we fitted a thin plate spline surface to the station measurements of k.
4.1.2 Results
The calculated variability parameter k (Eq. 12) ranges from 0.1 to 3.7, with lower values similar to contexts characterized by pronounced discharge variability and a significant occurrence of extreme events (Lague et al., 2005; Molnar et al., 2006; DiBiase and Whipple, 2011). We observe a clear gradient in the spatial distribution of this variability parameter (Figs. 1b, 2, and 3).
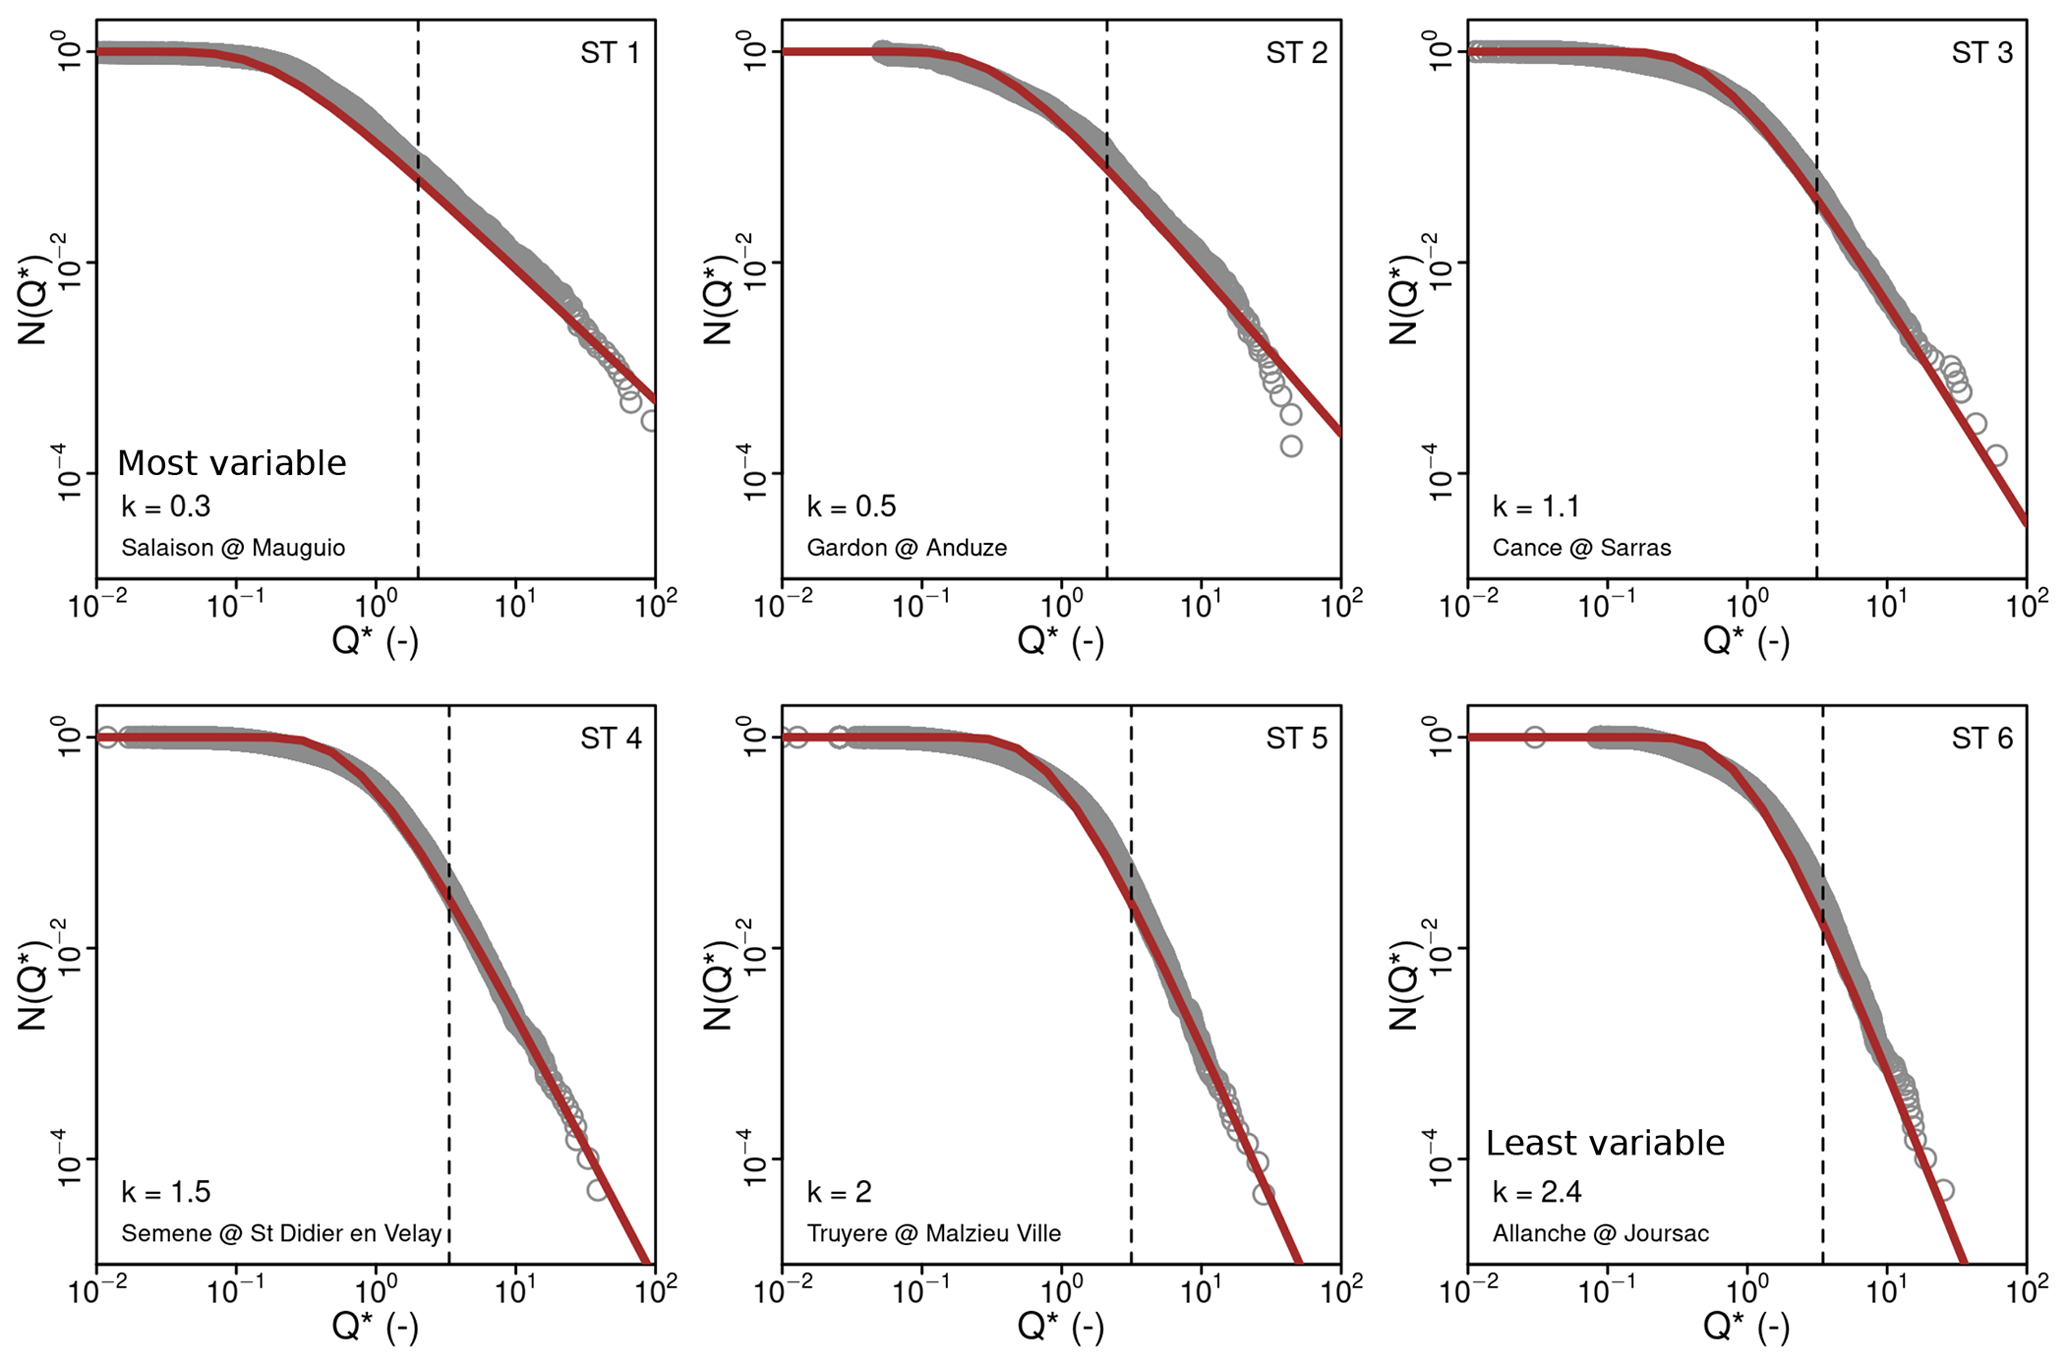
Figure 3Normalized daily discharge exceedance frequency for selected gauging stations (dark grey circles, see Fig. 1b for location). Dark red lines are fitted inverse gamma distributions (Eq. 12). The corresponding value of the discharge variability parameter k is indicated in each panel. The vertical dashed lines indicate for each station the lower bound of the normalized discharge values used to fit the power law (Clauset et al., 2007).
Low k values are dominant along the topographic margin of the SE Massif Central in the Cévennes and Ardèche areas, but also farther south and north along the Rhône valley. It corresponds to the areas affected by intense precipitation events of Cévenol and Mediterranean type. Conversely, when moving inside the massif, the measured k increases, with values in the 2 to 3.7 range indicative of a less variable hydrological regime. Furthermore, the thin plate spline surface correctly reproduces the global spatial variability gradient across the margin (Fig. 2), and we use it to compute basin-averaged k and incorporate it into the stochastic incision models.
Paleofloods and historical floods have been documented in our study area, in particular along the Ardèche river (Sheffer et al., 2003; Naulet et al., 2005) and the Gardon river (Dezileau et al., 2014), allowing the assumption of a high-discharge-variability regime since at least the middle Holocene. The absolute values of precipitation and discharge variability have probably changed through time and been modulated by the succession of glacial cycles, but, as the present-day relief is associated with late Miocene to Pliocene uplift events (Olivetti et al., 2016, 2020; Malcles et al., 2020), it can be assumed that the orographic pattern and associated relative climatic contrasts across the margin are persistent throughout the Quaternary.
While a number of previous geomorphological studies have investigated the impact of variations in parameters quantifying discharge variability over large areas such as the Himalayas (Scherler et al., 2017) and the continental US (Molnar et al., 2006), our study is the first to tackle this issue over a such a well-defined short-wavelength (<100 km) gradient.
4.2 Runoff
4.2.1 Methods
We only have discharge gauging station data at a limited number of locations, which are not coincident with our sampling sites. We calibrated a relationship between basin-averaged precipitation and runoff at these instrumented locations in order to be able to compute runoff at the sites where we obtained 10Be denudation rates. We extracted catchment boundaries for Banque HYDRO stations in our study area and computed the catchment-averaged mean annual precipitation (MAP) using a 250 m resolution raster (Joly et al., 2010), as well as the runoff from discharge data for these stations. We restricted our analysis to drainage areas ranging from 10 to 400 km2.
4.2.2 Results
We observe a positive correlation between basin-averaged MAP and runoff measured at gauging stations (Fig. 4).
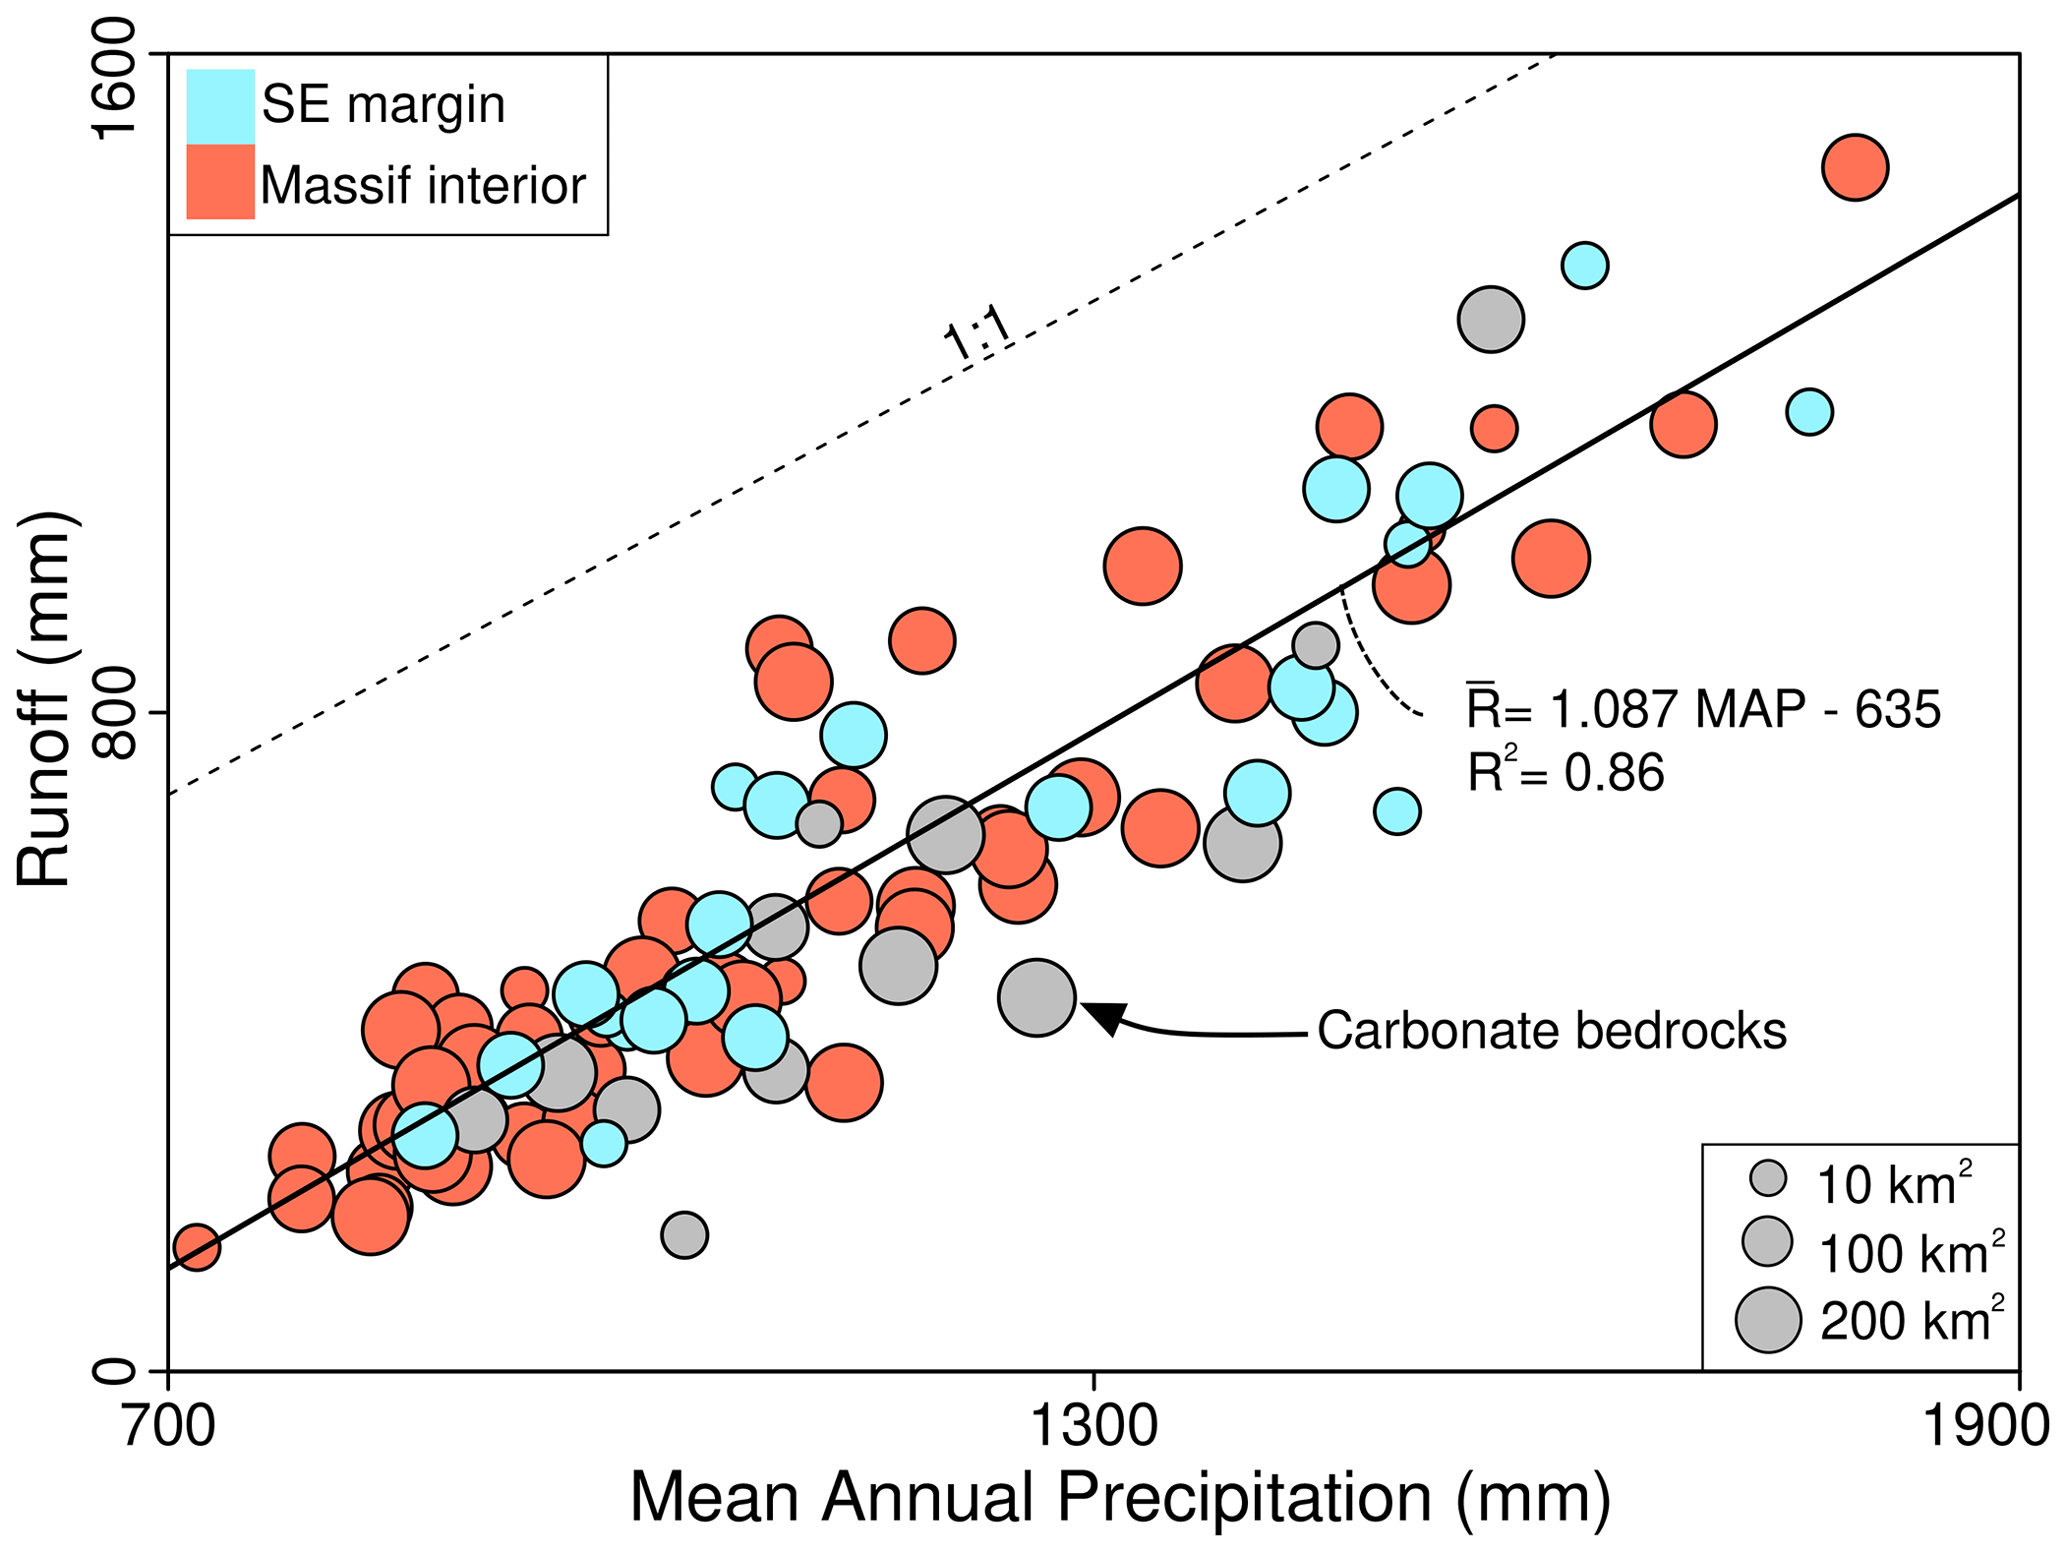
Figure 4Comparison between runoff and mean annual precipitation for 83 selected gauging stations and their corresponding watersheds. Blue and orange symbols correspond to watersheds located on the southeastern margin and inside the Massif Central, respectively. Grey circles indicate basins draining carbonate bedrock. The size of the circles depends on the area of the watersheds. The black dashed line corresponds to , and the black solid line is a linear fit excluding carbonate bedrock watersheds.
There is no clear distinction in behavior between the interior of the massif and its southeastern margin, and catchments draining over carbonate lithologies do no display a different trend than the rest of the dataset. We use the fitted linear relationship between MAP and in order to compute an estimate for runoff for the catchments where we obtained 10Be denudation rates (Table S3).
4.3 Channel width
4.3.1 Methods
We calibrated the scaling relationship between discharge and channel width (Eq. 5) with measurements at various locations in our region of interest. We use IGN orthophotos (BD ORTHO IGN – 50 cm resolution) in low-vegetation areas or field measurements with a laser range finder. We combined our data with measurements from the Carhyce database (Gob et al., 2014) (http://194.57.254.11/IED/, last access: 1 May 2021). Discharge values at the measurement site were calculated from the runoff–precipitation calibration relationship (Fig. 4). We restricted our analysis to drainage areas <400 km2 and discharge > 0.1 m3 s−1.
4.3.2 Results
We observe a positive correlation between channel width and discharge (Fig. 5a), and, for a given discharge, channel widths are larger along the margin (Cévennes and Ardèche) than west of the divide (red symbols).
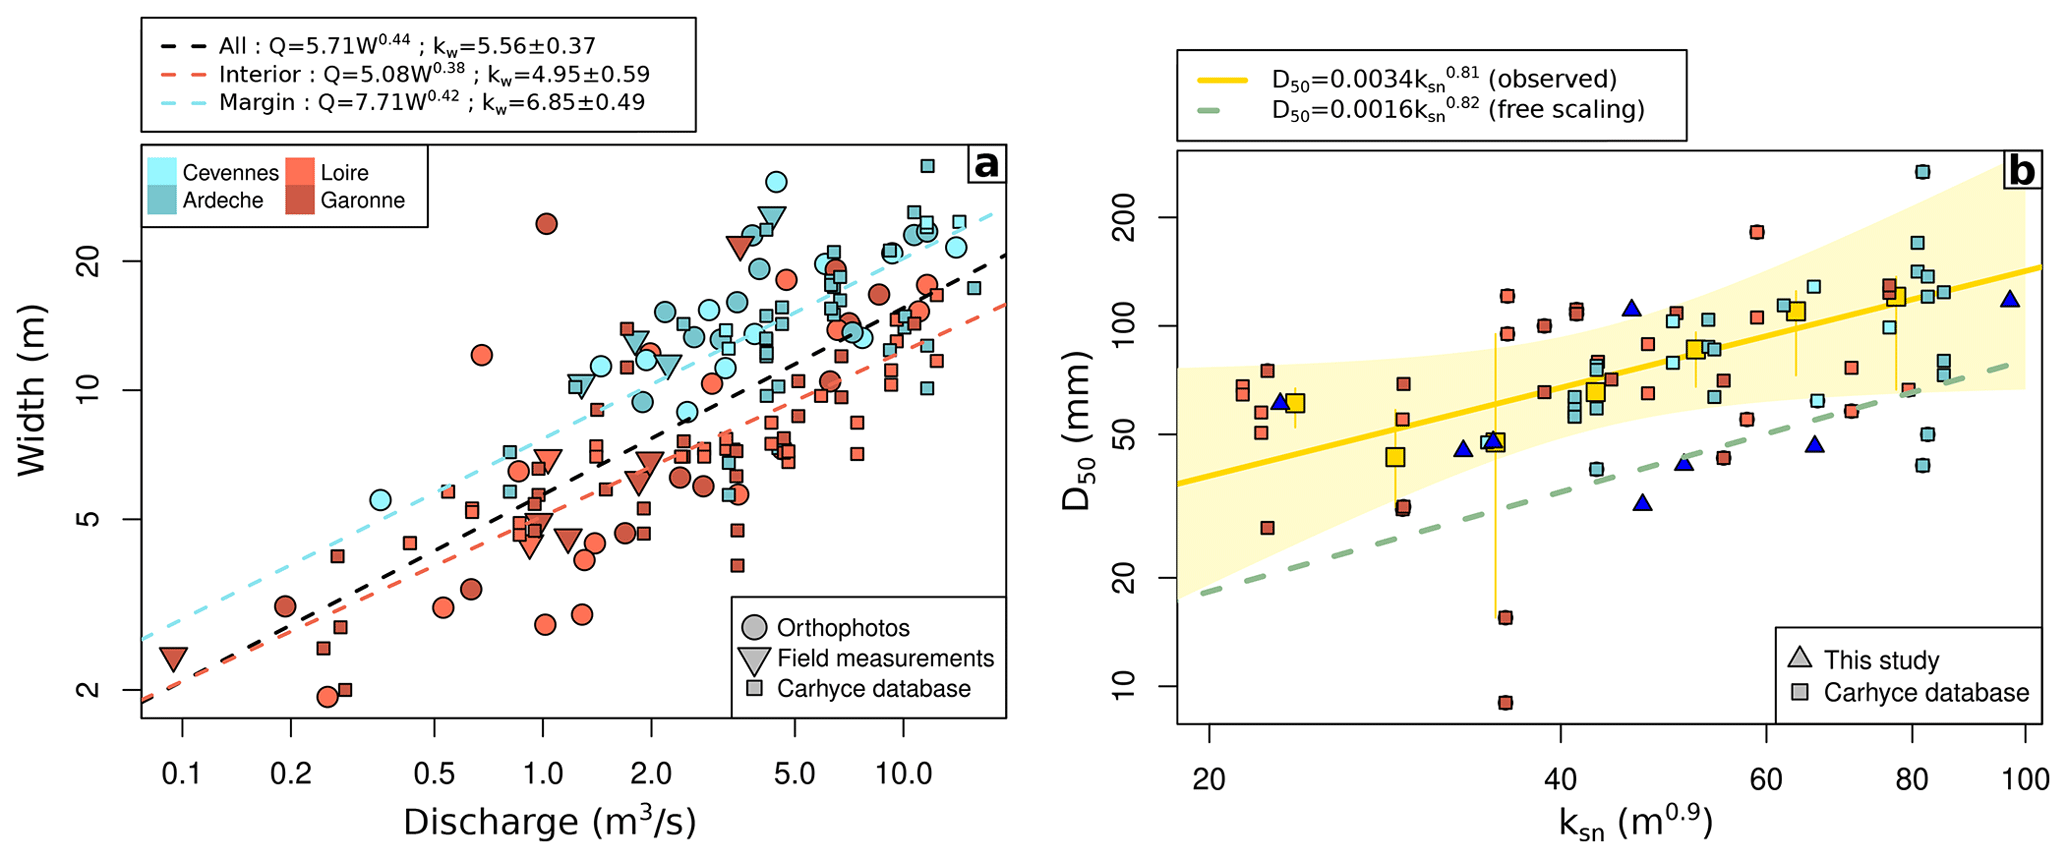
Figure 5(a) Bankfull river width against discharge calculated using the calibration in Fig. 4. Circles, triangles, and squares correspond to orthophotos measurements, field measurements, and data from the Carhyce database (Gob et al., 2014), respectively. The dashed black line is a power-law fit of the whole dataset, whereas blue and red dashed lines correspond to fits to the Ardèche–Cévennes (high relief, east of the divide) and Loire–Garonne (lower relief, west of the divide) subregions, respectively. Symbols are colored according to the four different subregions. (b) Median bedload size D50 as a function of steepness index ksn. Triangles and squares correspond to our field measurements and the Carhyce database, respectively. Yellow squares are binned values (median and interquartile range), and the yellow line is the corresponding power-law fit (Eq. 13), with its 99 % confidence envelope. The dashed green line corresponds to the estimate of the parameters in Eq. (13) from the model presented in Fig. 7f.
We fit power laws to the whole dataset and to subsets corresponding to both sides of the divide in order to calibrate the relationship described by Eq. (5). When considering the whole dataset we obtain a value for the exponent ωb=0.44, which is within the range of reported previous observations (Campforts et al., 2020) and close to the ωb=0.55 we impose in order to keep Eq. (8) dimensionally consistent when using . In this case we obtain a value of m−0.65 s0.55. If we distinguish the regions east and west of the divide, the values of kw are 4.95±0.59 and 6.85±0.49, respectively. We consider this difference in kw to be significant over our area of interest, and we use distinct values for the corresponding regions in the following.
4.4 River long profile
4.4.1 Methods
We extracted the catchment contour and upstream river network for each site where 10Be concentrations were measured in order to compute basin-scale topographic metrics such as normalized channel steepness ksn (Kirby and Whipple, 2012). We use a 25 m resolution digital elevation model (BD ALTI IGN) and a source area of 2.2 km2 for channel initiation. The optimal concavity of the stream network for each basin was defined using the integral approach of Perron and Royden (2012). Normalized steepness indexes were then computed along the river profiles that were filtered to remove short-wavelength noise and artifacts using a reference concavity value set at 0.45 (Fig. S3).
4.4.2 Results
The channel concavity ranges from 0.13 to 0.87 (Table S3) with a mean value of 0.52±0.19, which is close to the usual reference concavity value used in channel profile analysis. The normalized steepness index ksn ranges from 22 to 97 m0.9. The highest values are observed in the Ardèche, Cévennes, and Garonne areas with averages of 63±13, 47±11, and 44±12 m0.9, respectively, while the Loire watershed presents slightly lower values at 30±7 m0.9.
4.5 Bedload characteristics
4.5.1 Methods
We use bedload median size D50 to estimate the critical shear stress τc using Eq. (3). We performed bedload counts at some sites in the Cévennes and Ardèche areas and combined these results with D50 measurements from the Carhyce database (Gob et al., 2014) (http://194.57.254.11/IED/, last access: 1 May 2021). In addition to the determination of a single τc value derived from the average D50 over our study area (DiBiase and Whipple, 2011), we also consider the possibility of spatial variations in τc. Such variability can be parameterized using Eq. (3) and a power-law relationship between ksn for the upstream basin and the median bedload grain size D50 (Attal et al., 2015; Scherler et al., 2017), such as
4.5.2 Results
Median bedload size ranges from 10 to 200 mm over our study area. The average D50 is 80 mm (Fig. 5b), corresponding to τc=40 Pa, which is similar to the value used by DiBiase and Whipple (2011) in the San Gabriel Mountains. Coarse bedload was dominant in the river we surveyed along the margin, whereas we observed occurrences of gravel- or sand-dominated reaches for the low-relief parts of the landscape west of the divide. Fitting Eq. (13) to the dataset supports the existence of a power-law relationship between D50 and ksn, with exponent ∼0.8. We do not observe a difference in scaling between the two sides of the divide. For the low-ksn regions, corresponding mostly to areas west of the divide, measured D50 values are dominantly in the 30–60 mm range, whereas they are mostly >50 mm for the eastern catchments draining toward the Rhône.
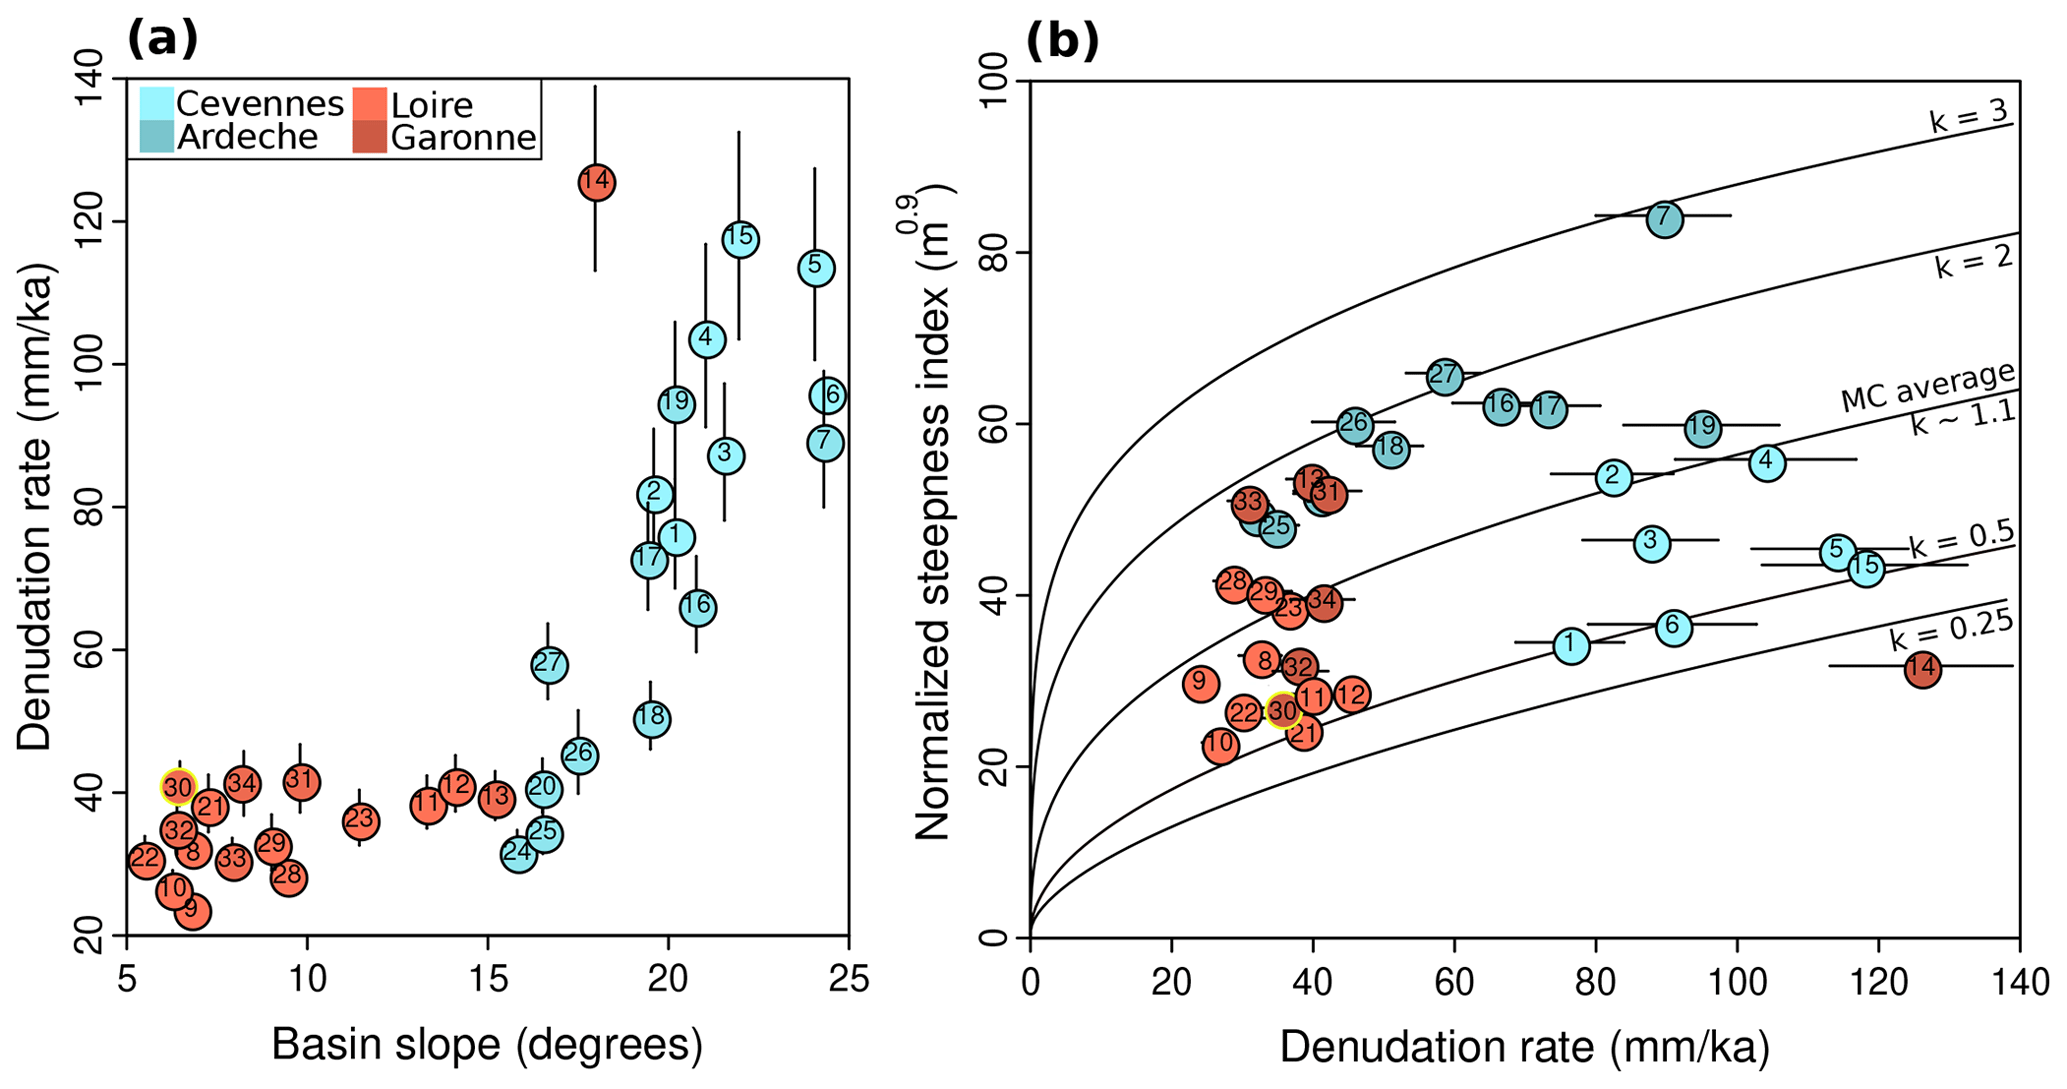
Figure 6(a) Comparison between erosion rate and basin slope. Symbols are colored according to the location of the measurements (Cévennes, Ardèche, Loire, and Garonne). Basin CDX-30 is a very small catchment when compared to the rest of our dataset and is colored in yellow. (b) Comparison between normalized channel steepness index and denudation rates. Black lines correspond to the theoretical relationship between denudation rate and steepness index computed from Eqs. (8) and (10) for various values of the discharge variability parameter k. We set the critical shear stress τc=40 Pa and the erodibility coefficient m2.5 s2 kg−1.5. We use a regionally averaged value for runoff of mm a−1.
4.6 Cosmogenic nuclides
4.6.1 Methods
We measured 10Be concentrations in quartz from river sands of basins draining the SE margin of the Massif Central, as well as the upper Loire and Garonne catchments. Sampled basins were primarily selected according to their size (21 to 95 km2 with the exception of basin CDX-30) and the observation of regular concave river long profiles, without major knickpoints (Fig. S3). We also restricted our sampling to basins draining uniform lithologies, focusing on the Paleozoic basement units, constituted of granites and gneisses, as well as schists in the Cévennes area (Fig. S1). Quartz was extracted and purified from the samples by standard physical and chemical procedures. A mass of ∼20 g of quartz was digested with hydrofluoric acid (HF) along with a 9Be carrier solution, and Be was extracted with ions exchange columns. ratios were finally measured at the French accelerator mass spectrometer (AMS) national facility, located at CEREGE in Aix-en-Provence. Steady-state denudation rates were computed using the online calculator described in Balco et al. (2008). A detailed description of the analytical procedure, calculation, and results is provided in the supplementary materials.
4.6.2 Results
Measured 10Be concentrations in the 34 sampled catchments range from 51 to 345×103 at g−1 (Table S1 in the Supplement). The corresponding calculated denudation rates range from 24 to 126 mm kyr−1 (Fig. 1a), which correspond to integration times of 25 and 5 kyr, respectively. We observe clear regional differences in denudation rates between the main sampling areas. The upper Loire and Garonne catchments, in the interior of the Massif Central, display the lowest denudation rates with averages of 33±4 and 37±4.5 mm kyr−1, respectively. Significantly faster denudation is observed along the margin of the massif, in the Ardèche mountains (58±7 mm kyr−1), and especially in the Cévennes area (95±11 mm kyr−1). We note that basin CDX-14, with the highest denudation rate of the dataset, is located next to the main divide between the Garonne and Rhône watersheds, very close to the Cévennes area, and drains over schist bedrock. This range of denudation rates is consistent with previous observations in the Massif Central (Schaller et al., 2001, 2002; Molliex et al., 2016; Olivetti et al., 2016).
Denudation rates are positively correlated with basin-average slope and relief (Figs. 6a and S2), but the dataset as a whole does not display any clear relationship with steepness index (Fig. 6b).
With the exception of CDX-CRN-30, all the sampled basins have areas between 20 and 100 km2, and we do not observe any dependence of denudation rates on catchment area over this range (Fig. S2 and Table S3), suggesting that there is no first-order scale-dependent bias in terms of the processes contributing to denudation in our dataset (Niemi et al., 2005; Yanites et al., 2009).
5.1 Modeling approach
We model denudation rates for each basin where we have 10Be data using various formulations of the stream power model. First, if we do not take into account discharge variability, denudation rate E can be derived from Eq. (9) as
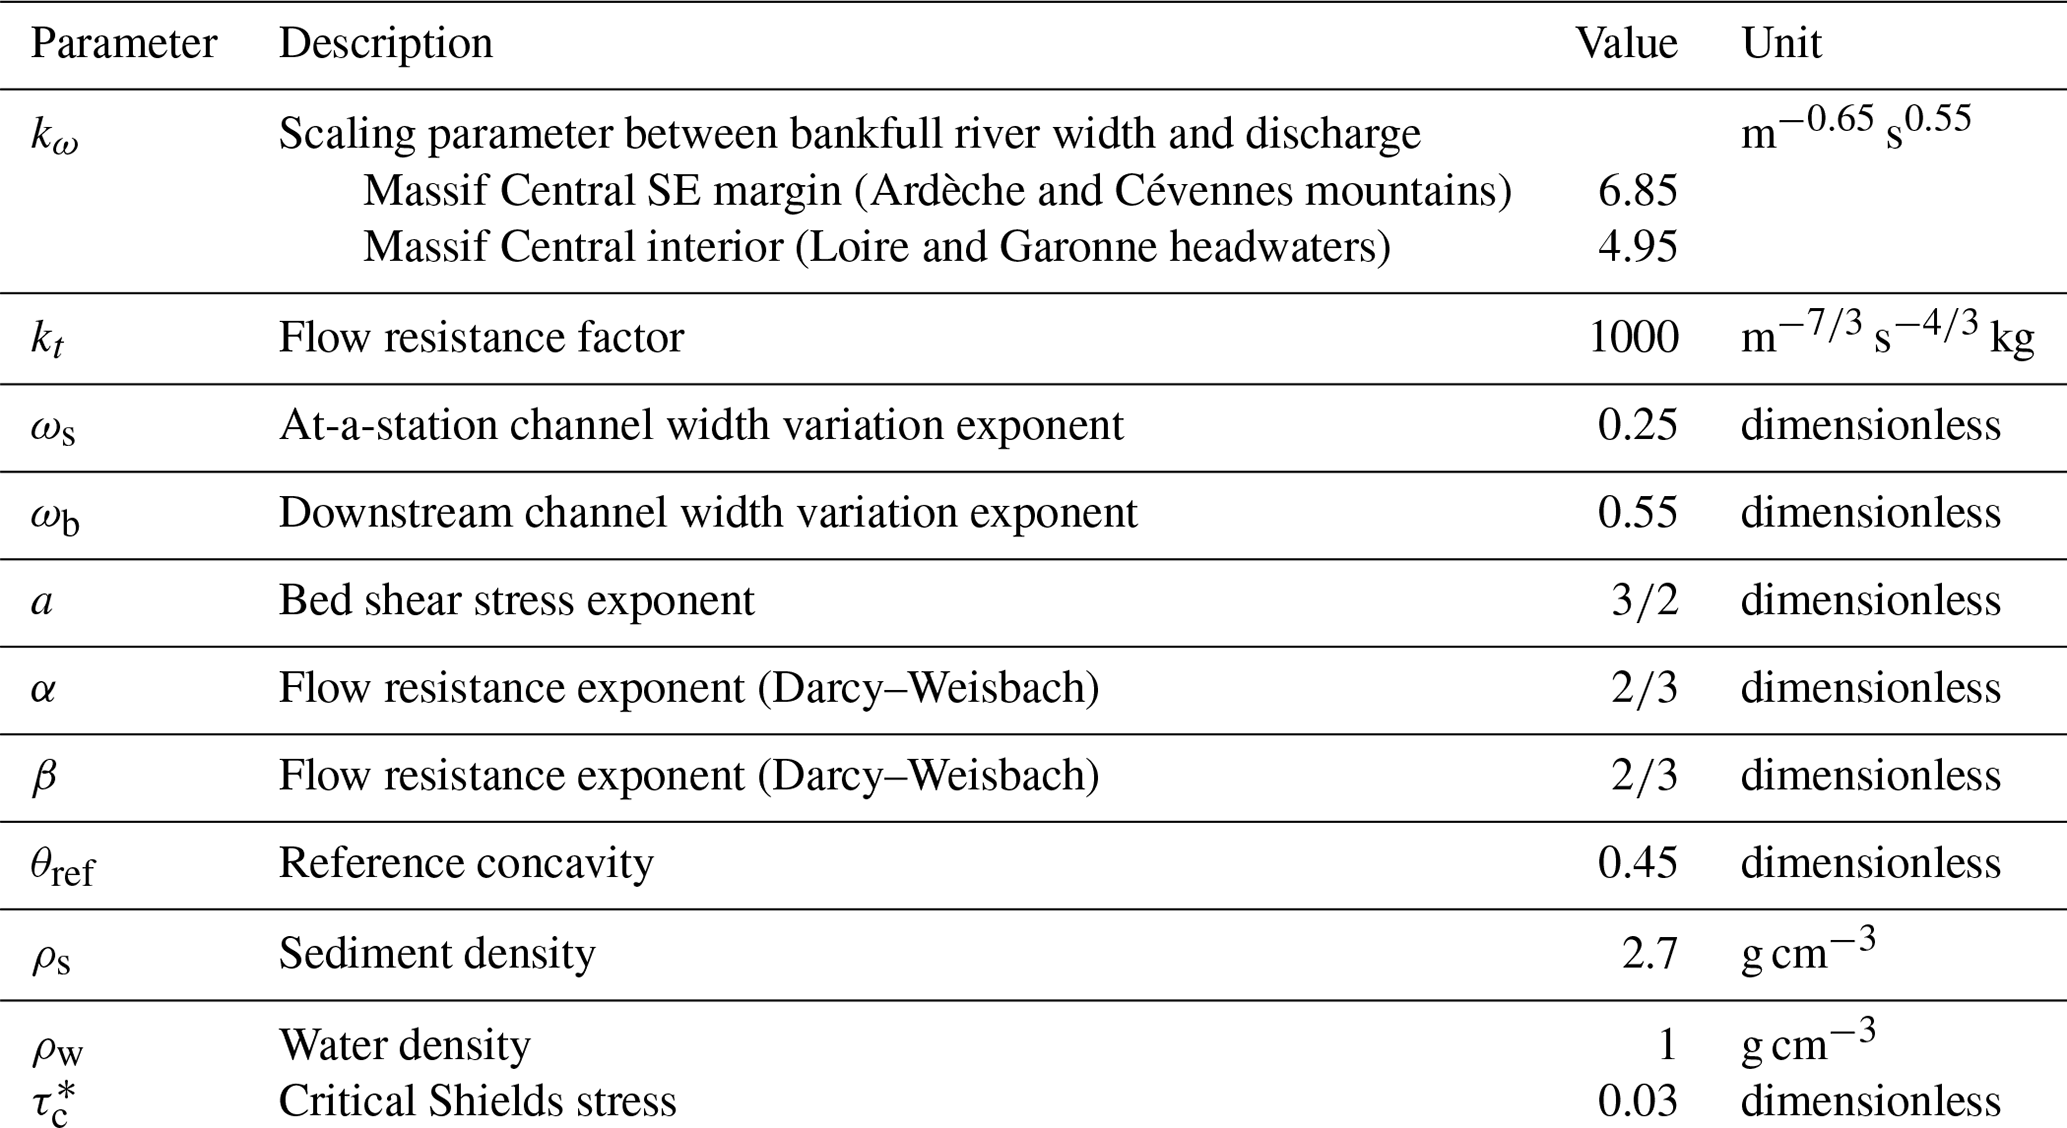
In this case we can either neglect the spatial variations of runoff, consider to be constant, and set it to a regional average value for all the considered basins (area-based stream power model: A-SPM) or take into account these spatial variations (runoff-based stream power model: R-SPM). In both cases, all the parameters are set to values from the literature or calculated for the areas we investigate (Table 1).
The only unconstrained parameter is the erodibility coefficient ke. We account for differences in erodibility between the Cévennes schists and the granitic or gneissic basement encountered for all other areas by introducing a modulation factor fs for basins draining over the former. Thus, the A-SPM and R-SPM cases have two free parameters ke and fs.
We also consider stochastic-threshold stream power models (ST-SPMs), incorporating the probability distribution of stream discharge as formulated in Eq. (10). First, we set the critical shear stress τc (Eq. 1) using the average observed median grain size over our study area using Eq. (3) (Fig. 5b). Second, similarly to Campforts et al. (2020) and Scherler et al. (2017), we consider τc to be a free parameter in addition to ke and fs.
The last model formulation we consider is the case in which the critical shear stress τc is not uniform over the study area, as in the previous case, but spatially variable (SVT-SPM) and defined using Eqs. (3) and (13), as explored by Scherler et al. (2017). Contrary to some previous studies (Scherler et al., 2017; Campforts et al., 2020) we have actual field constraints on D50 and its relationship with ksn, and we first set the parameters k50 and q of Eq. (13) according to these constraints (Fig. 5b). In a second run the models consider k50 and q to be free parameters, similar to the approach of Scherler et al. (2017).
Following Campforts et al. (2020) we use various metrics to evaluate the quality of the fit between the n modeled (M) and observed (O with uncertainty σ) denudation rates, such as the coefficient of determination R2 for a linear fit between O and M or the χ2 value,
and we maximize Nash–Sutcliffe (NS) model efficiency for our determination of optimal parameters,
5.2 Results
We observe that R-SPM allows for a slightly better prediction of denudation rates than A-SPM (Fig. 7a and b), with notable differences between the two models for lower denudation rates (<50 mm kyr−1).
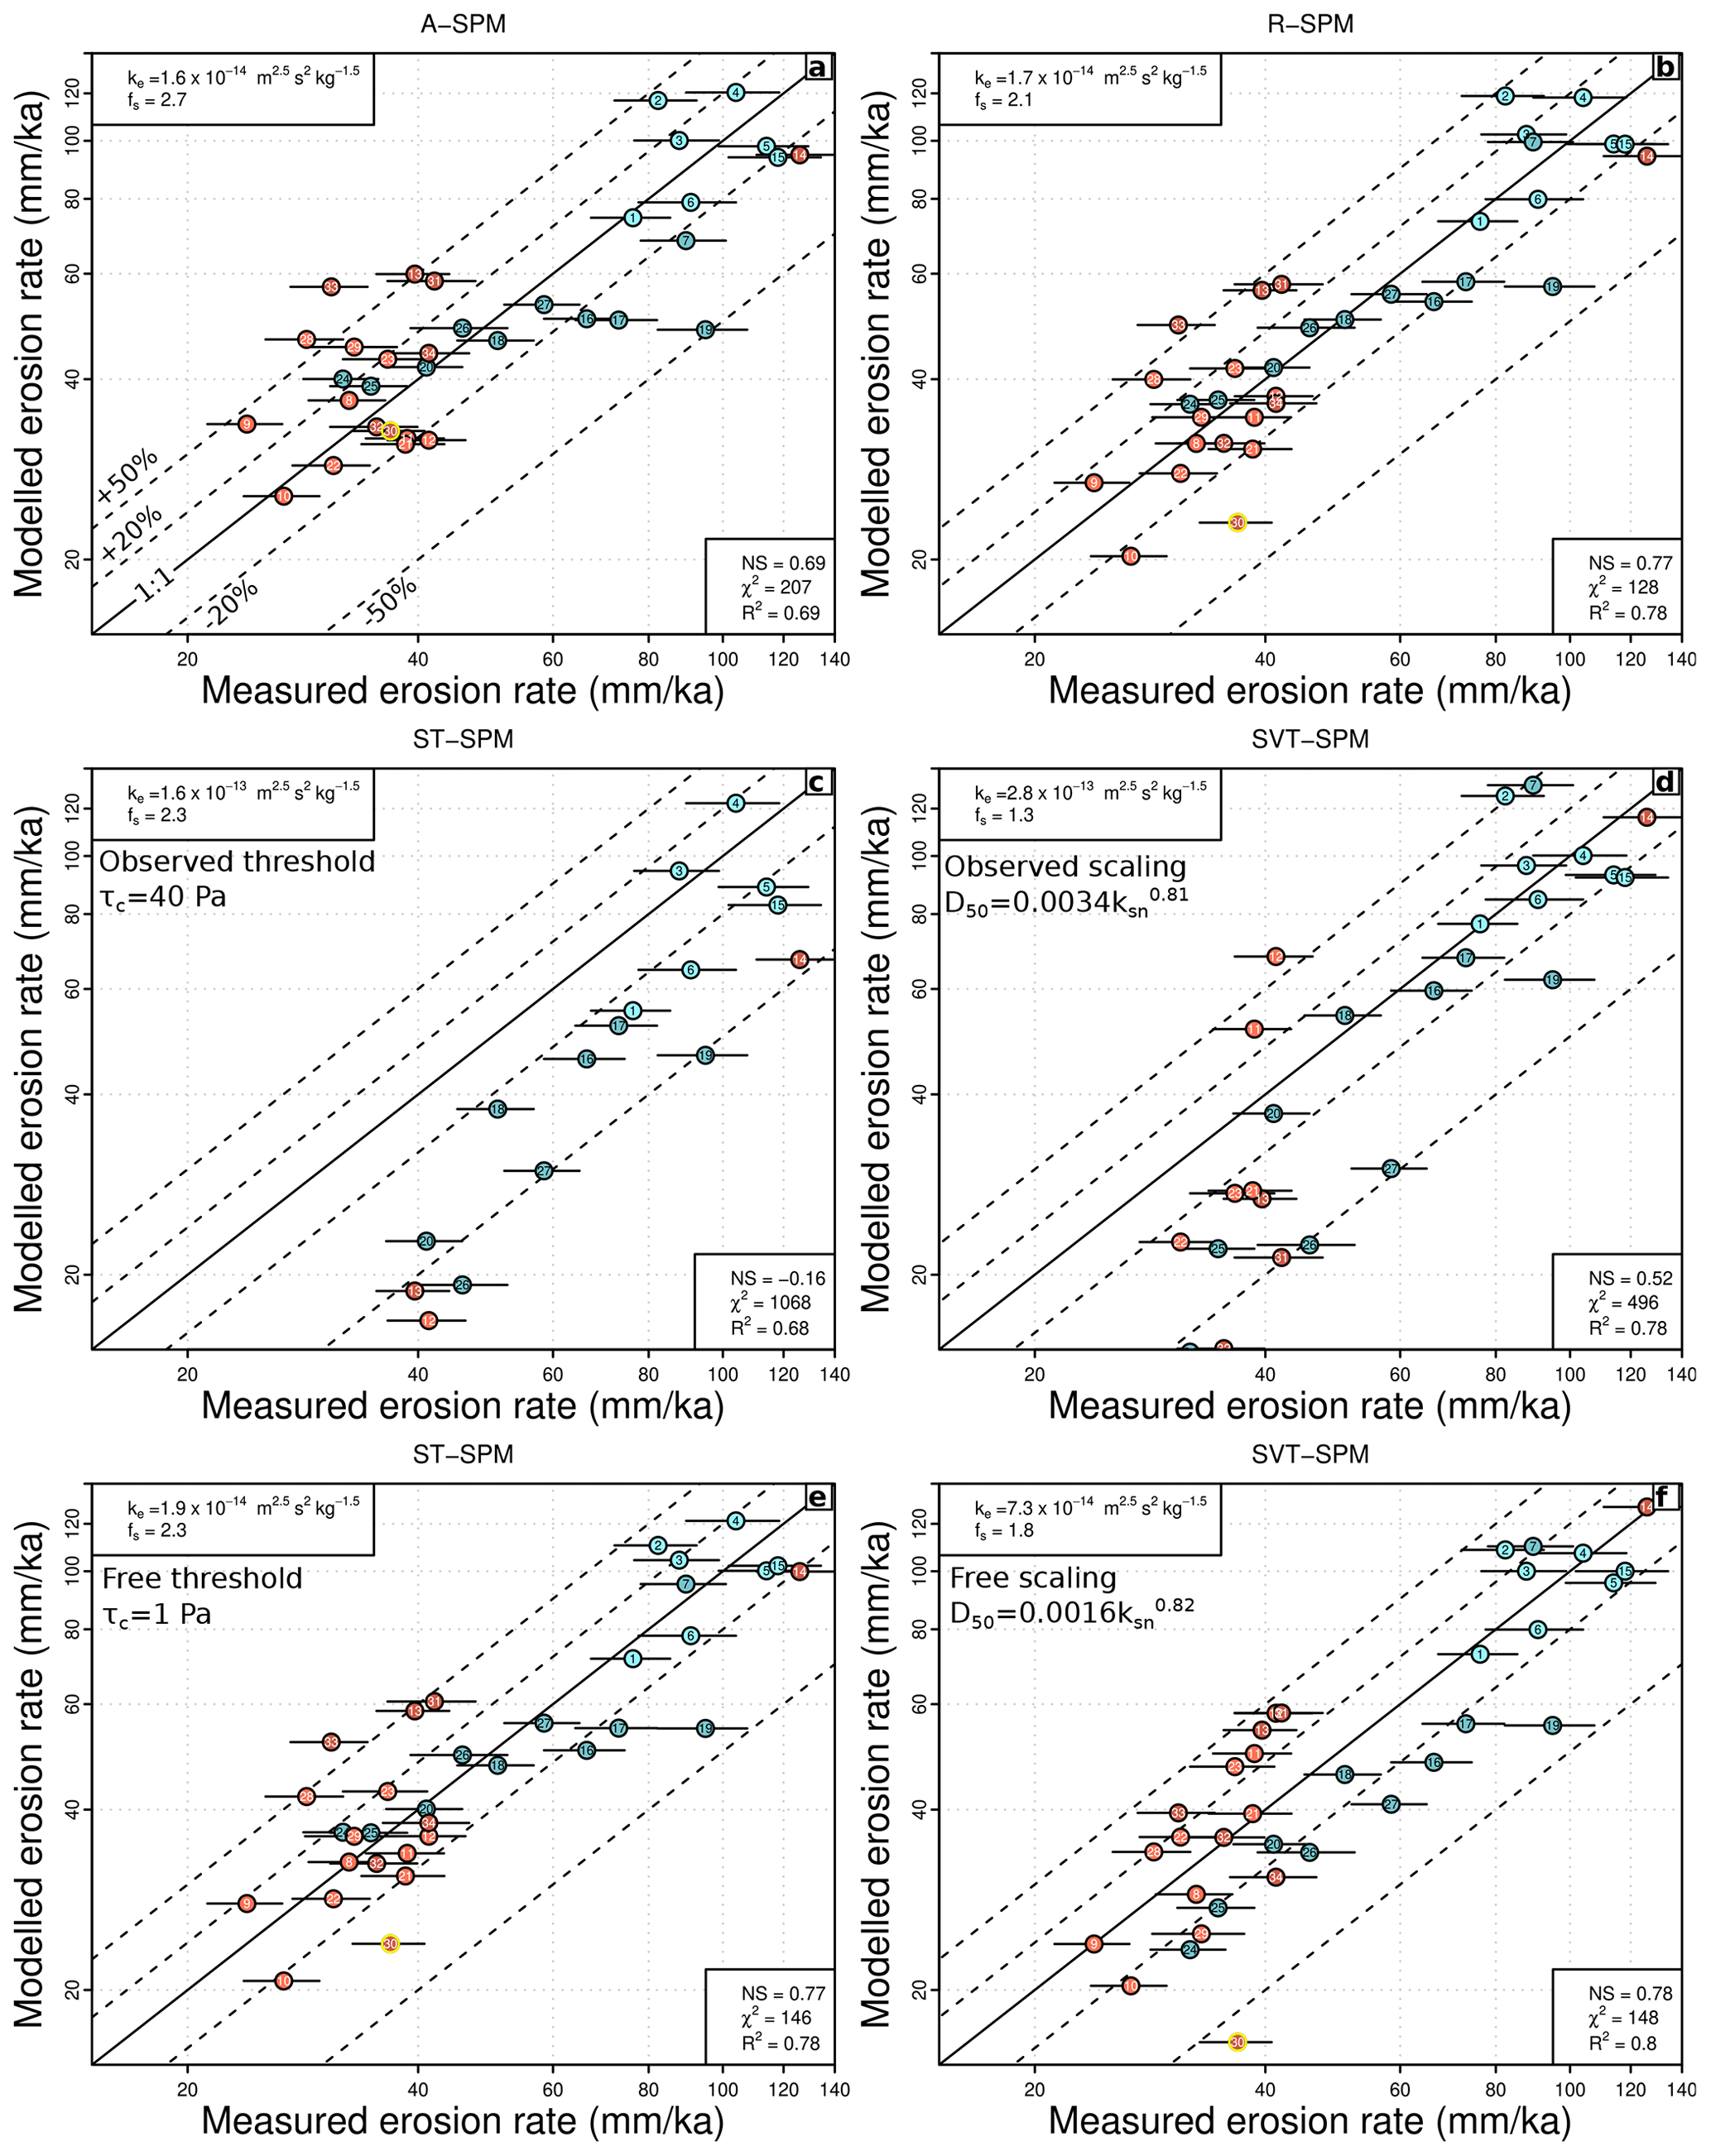
Figure 7Comparison between measured and modeled denudation rates for various formulations of the stream power model. Black lines correspond to a perfect match between observed and modeled denudation rates, and dashed lines indicate ±20 % and ±50 % deviations. Basin 30, with a much smaller area than the rest of the dataset, is outlined in yellow. (a) Area-based stream power model (A-SPM). The erodibility coefficient ke and modulation factor for Cévennes schists fs are free parameters. (b) Runoff-based stream power model (R-SPM). (c) Stochastic stream power model with an imposed spatially constant threshold τc (ST-SPM) defined using the mean regional average D50 value (Eq. 3 and Fig. 5b). (d) Stochastic stream power model, with a spatially variable threshold (SVT-SPM), scaled with ksn values (Eqs. 13 and 3). The scaling parameters are set according to the observed relationship between D50 and ksn values in Fig. 5b. (e) Stochastic stream power model (same as c), but with τc as a free parameter (in addition to ke and fs). (f) Stochastic stream power model, with a spatially variable threshold (SVT-SPM, same as d) but with the scaling parameters k50 and q from Eq. (13) being free (in addition to ke and fs).
In both cases the erodibility coefficient ke for the Cévennes schist bedrock is higher than for the crystalline basement lithologies of the other areas, which is consistent with estimates of relative differences in erodibility for these types of rocks (Campforts et al., 2020). Using an ST-SPM, with a unique threshold value calculated according to observed regionally averaged D50 (Fig. 7c), induces a drastic degradation of the fit. While the model is able to reasonably predict the denudation rates for some of the high-relief catchments along the margin (Cévennes and Ardèche areas), it largely underpredicts them for the other areas inside the massif. The introduction of a variable threshold set by Eq. (13) (SVT-SPM) yields a better fit than the constant threshold case (Fig. 7d), notably by improving the prediction for some of lowest denudation catchments west of the divide. However, the quality of the fit is still inferior to the R-SPM case. When considering a free regionally constant threshold the optimization converges toward an almost negligible value, corresponding to a situation which is essentially similar to R-SPM (Fig. 7f). At last, if we consider the two parameters of the scaling described by Eq. (13) to be free parameters, the optimization yields a fit to the data which is equivalent to R-SPM. Noticeably, the retrieved scaling exponent q between D50 and ksn of ∼0.8 is almost identical to the observed value (Fig. 5b), while the k50 factor implies ∼2 times lower predicted D50 values, but which are still within the lower range of observations.
After the presentation of the data and main results of our study, we now discuss our denudation rate dataset in the context of the SE margin of the Massif Central, the relative efficiency of the various SPM formulations which can be used to explain the distribution of these denudation rates, and the comparison of our observations with similar studies in other regions. We note that the timescale of our study is relatively short and set by the integration times of denudation rates ranging from 5 to 25 kyr (Table S1).
6.1 Distribution of denudation rates
Here we discuss the spatial distribution of denudation rates across the SE margin of the Massif Central and their relationship with morphological parameters. As we described earlier, the range of denudation rates from our sampled catchments is consistent with previous observations in the Massif Central. Olivetti et al. (2016) report denudation rates ranging from 34 to 79 mm kyr−1 on 27 watersheds located directly north of our studied catchments in the Ardèche mountains, with similar lithologies and areas. As many of the catchments from Olivetti et al. (2016) contain knickpoints, the relationships between denudation rates and morphology is not directly comparable with the one observed with our dataset, for which we specifically selected basins according to the regularity of river long profiles. A larger-scale analysis of denudation in the Gulf of Lion drainage system was performed by Molliex et al. (2016), with four sampled watersheds along the southeastern margin of Massif Central, corresponding to the Eyrieux, Ardèche, Cèze, and Gard rivers near the Cévennes mountains, with average denudation rates of 79.6±15, 67.4±11.5, 78.0±16.2, and 70.0±11.9 mm kyr−1, respectively. These basins are 1 order of magnitude larger than the ones we sampled and drain over heterogeneous lithologies with a significant contribution of the sedimentary cover in the low-relief area between the Massif Central margin and the Rhône river, which might explain the slightly lower denudation rates when compared to our samples from the Cévennes area. Denudation rates of 33±7 and 68±16 mm kyr−1 were obtained by Schaller et al. (2001) on the other side of the divide for the Allier and Loire catchments, respectively. Both catchments are larger (>250 km2) than the ones we sampled and include Cenozoic volcanics, but the denudation rate reported for the Allier headwaters from Schaller et al. (2001) is consistent with our observations from smaller catchments 11 and 12, while we have no equivalent in our dataset for the Loire headwater catchment where they report higher denudation rates. The current geography of the southeastern margin of the Massif Central and the observed contrasts in denudation rates suggest that there is some degree of westward migration of the divide as well as local river capture events, especially in the Cévennes and southern Ardèche areas. However, no large-scale disequilibrium such as knickpoints or relict surfaces associated with such captures was identified in the headwaters of our sampled basins. We also note that the measured concavities in our basins (Table S3) show a dispersion with relatively low values for some of the Loire and Garonne catchments (<0.4) and higher values for some of the Cévennes and Ardèche catchments (up to 0.8 locally), although the averaged value is around 0.5, which is consistent with global compilations (Harel et al., 2016) and theoretical predictions of the stream power model with m=0.5 and n=1 when assuming a steady state over the study area (Lague, 2014). This observed dispersion in concavity may be due to the strong precipitation gradient over our study area (Fig. 2), but the correlation between denudation rates and concavity in some basins (Fig. S2) could also be interpreted as reflecting a transient response and retreat of the topographic margin. This deviation from a strict steady-state situation could explain some of the scatter in our dataset with respect to the predictions of the various modeling formulations we test.
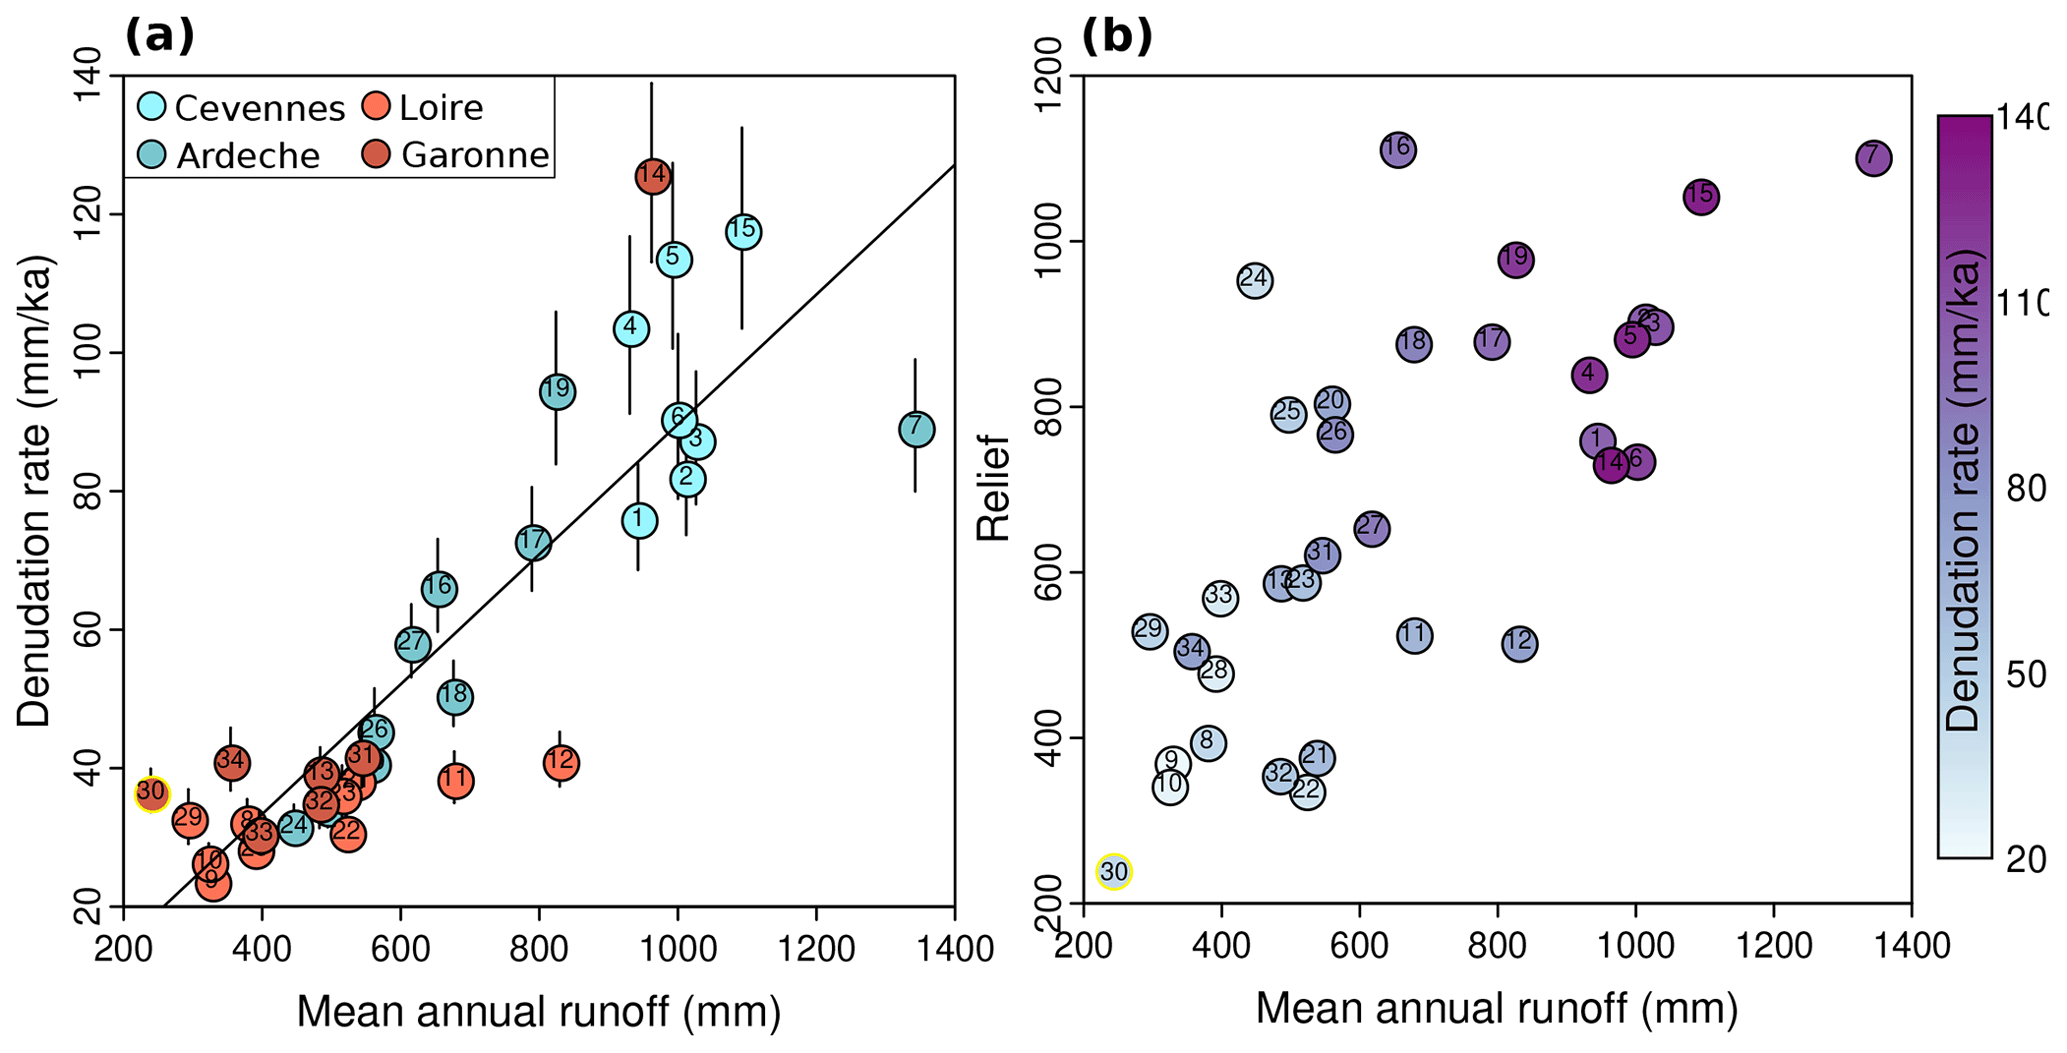
Figure 8(a) Denudation rates against basin mean annual runoff calculated using the calibration of Fig. 4. Symbols are colored according to the four different subregions, and the black solid line is a linear fit to the data. (b) Basin relief against mean annual runoff. Symbols are colored according to the denudation rates of the basins.
Denudation rates are positively correlated with basin-average slope (Fig. 6a), with a progressive linear increase in low-relief basins of the interior of the massif with slope ranging from 5 to 15∘ and then a much more rapid increase beyond 20∘ for the Cévennes and Ardèche basins along the margin. Such a relationship between denudation rates and slope is consistent with nonlinear models of hillslope evolution, whereby denudation rates increase very rapidly when hillslope angles become close to their stability threshold (Ouimet et al., 2009; DiBiase and Whipple, 2011; Carretier et al., 2013). Denudation rates are increasing nonlinearly with relief and also display a strong spatial difference between the margin and the interior of the massif (Fig. S2), with low denudation in the low-relief headwaters of the Loire and Garonne watersheds and significant scatter with higher rates for the Cévennes and Ardèche basins. We note that denudation rates are also positively correlated with runoff (Fig. 8a). A similar correlation has been observed in other non-tectonically active contexts, such as Kaua'i island (Ferrier et al., 2013b, a), across a wide range of precipitation. As suggested by Ferrier et al. (2013b), lithological homogeneity and the absence of rock uplift gradient might be important factors in allowing the expression of such a relationship between denudation rates and precipitation. These two conditions are present in our study area; however, we note the existence of a pronounced orographic effect across the margin such that the correlation between runoff and denudation also partly reflects the underlying spatial distribution of precipitation with higher rainfall focused on the steep and high-relief areas (Figs. 1b, 8b and 2).
We do not observe a simple relationship between normalized channel steepness index and catchment denudation rates (Fig. 6b). Samples from the interior of the Massif Central display a large range of ksn up to ∼60 m0.9, while denudation rates remain low. In the Ardèche mountains a positive correlation exists between ksn and denudation rates, with a much shallower trend than for the Loire and Garonne catchments. Samples from the Cévennes area cluster outside the general trend, with high denudation rates for comparatively low ksn, which could in part be related to a lithological control on erodibility and the dominance of schist bedrock as opposed to the granitic and gneissic basement of the other sampled basins. Equations (8) and (10) predict a nonlinear relationship between denudation rate and steepness index ksn with a strong influence of the discharge variability parameter k (DiBiase and Whipple, 2011). Due to the absence of a clear unique trend in our dataset, no single theoretical relationship can explain the distribution of denudation rates and ksn when using regionally averaged values for model parameters (Fig. 6b). Notably, taking into consideration the variation of runoff and discharge variability for individual samples (Fig. S5) does not allow identifying significant trends in the data (Adams et al., 2020), as their co-variation with denudation rates mostly reflects their underlying spatial distribution and differences between the margin and the interior of the massif. Even if data for the Cévennes basins appear to be consistent with model predictions for low discharge variability k values, in other areas the k values which would yield the better correspondence between data and the model do not agree with observations. For example, basins from the Ardèche mountains and the Loire headwaters display low and high k values, respectively, whereas the theoretical relationship between denudation rate and ksn in Figs. 6b and S5 would imply the opposite. For some areas from the interior of the massif, we also note high variability in k and runoff for samples presenting similar denudation rates and ksn values (Fig. S5b). Such a discrepancy highlights the limitations of using regionally averaged values for model parameters, such as erodibility or runoff, and notably the necessity of taking into account the strong climatic spatial gradients observed over our study area (Fig. 1b).

Figure 9Comparison between our results and other published datasets for normalized channel steepness index (θref=0.45) and basin-wide denudation rate calculated from 10Be concentrations. Incision rates calculated from terraces in different climatic and tectonic contexts are also plotted (green triangles). The black solid line is a power-law fit to the aggregated basin-wide denudation rate dataset. Original data for the Ecuadorian Andes are from Vanacker et al. (2015) as reported in Campforts et al. (2020). Original data for the San Gabriel Mountains are from DiBiase et al. (2010) as reported in DiBiase and Whipple (2011). Original data for the Himalayas and eastern Tibet are from Scherler et al. (2014), Wobus et al. (2005), Godard et al. (2010, 2012, 2014), Finnegan et al. (2008), Ouimet et al. (2009), and Harkins et al. (2007), as compiled by Scherler et al. (2017). Additional denudation data from Cyr et al. (2010) are also plotted, as are incision rate data from Lavé and Avouac (2000, 2001), Kirby and Whipple (2001), and Yanites et al. (2010).
Although our dataset does not display a single clear trend between ksn and denudation it is consistent with the global trend delineated by other similar studies using catchment-wide denudation rates (Fig. 9). Our dataset lies at the lower end of the global distribution and overlaps with data from other areas such as the Ecuadorian Andes (Vanacker et al., 2015) and eastern Tibet (Ouimet et al., 2009). We note that the dispersion of our data around the trend, in terms of both denudation rate and ksn, is similar to that observed in other regional studies. As already noted in the compilation of Lague (2014), incision rates present much higher values for a given steepness index range when compared with catchment-wide denudation rates. Such a systematic contrast can arise for various reasons, such as differences between integration timescales of the various types of measurements or a transient landscape response associated with a partial decoupling between channels and hillslopes (e.g., Willenbring et al., 2013; Clubb et al., 2020).
6.2 Performance and limitations of modeling formulations
We now discuss the relative behavior of various model formulations of increasing complexity and their ability to explain the variation in denudation rates observed in our dataset. Similarly to results by Campforts et al. (2020), we observe an improvement of the predictive power between the A-SPM and R-SPM types of models (Fig. 7a and b), highlighting the importance of the spatial distribution of precipitation in modulating the efficiency of fluvial incision processes, at least in this type of context (e.g., Finlayson et al., 2002; Moon et al., 2011; Ferrier et al., 2013a; Adams et al., 2020). Several observations in tectonically active settings (e.g., Godard et al., 2014; Scherler et al., 2014) have advocated for a primary control of rock uplift gradients in dictating the distribution of denudation rates, which is to be expected in a steady-state landscape. Nevertheless, recent results by Adams et al. (2020) also highlight the modulating influence of mean annual precipitation on erodibility and fluvial relief in similar high-uplift settings. Our results support a similar modulation by precipitation in slower-evolution landscapes such as the margin of the Massif Central.
In our case, using an ST-SPM setting, the critical shear stress according to observations to τc=40 Pa induces a clear failure of the model to reproduce the observed denudation rates (Fig. 7c), and when this parameter is set free the optimization converges toward a very low and actually negligible value (Fig. 7e), which makes this model equivalent to the R-SPM case. This result highlights a clear limitation of the ST-SPM approach when compared with much simpler formulations of the stream power model in the type of relatively low-denudation context we investigate here. It is noteworthy that, in the case of the τc fixed at 40 Pa, the mismatch appears to be largest for the low-relief catchments of the Loire and Garonne headwaters, while this parameterization still allows predicting denudation rates within ±20 % of the observed uncertainty range for a large proportion of the Cévennes and Ardèche catchments. Field measurements of bedload size show a positive correlation between D50 and steepness index (Fig. 5b), which would be consistent with smaller incision thresholds in low-relief areas, in contrast with the coarser bedload of the higher-relief Cévennes and Ardèche mountains. Accounting for threshold effects was a critical element in the explanation of the nonlinearity between denudation rates and ksn observed by DiBiase and Whipple (2011), whereas in our case, it appears that a large part of the scatter and deviation from linearity is controlled by the spatial variations in runoff, discharge variability, and erodibility. We note that approximately linear relationship (n≈1) have been reported in other contexts with <100 mm kyr−1 denudation rates (e.g., Ferrier et al., 2013a; Godard et al., 2019), which might play down the importance of threshold effects in explaining the variability of denudation in such settings. The next increment in model complexity is to account for possible spatial variations in bedload properties. DiBiase et al. (2018) demonstrated a direct impact of contrasts in the size distribution of sediment delivered by hillslopes to channels on landscape relief at two locations in southern California. Attal et al. (2015) documented a power-law relationship between flow competence and D50 along the Feather River in California, supporting the idea that the intensity of surface processes fluxes, including weathering and erosion, is a primary control on bedload size, and Shobe et al. (2018) explored the theoretical implications of incision thresholds varying with erosion rates. Field measurements in the area we investigate are consistent with such dependency (Fig. 5b), and following Scherler et al. (2017) we have tested the impact of introducing a variable incision threshold dependent on ksn (Eqs. 13 and 3). Such a parameterization yields a significantly better fit than the constant threshold case (Fig. 7d), in particular for some of the low-denudation catchments of the dataset, and allows taking into account differences in bedload size across the divide. However, this model formulation still largely underpredicts erosion rates for many of the low-denudation interior catchments and as a consequence yields a fit to the observations which is still inferior to R-SPM predictions. We note that the stochastic-threshold stream power model is built on the assumption that river incision is detachment-limited and a function of bed shear stress τ. We made many observations of exposed bedrock submitted to active incision processes at our sampling sites, in particular in the high-relief areas east of the divide (Figs. S2 and S4). However, we can consider the possibility that, for some of the low-denudation and low-relief catchments located west of the divide, a departure from strictly detachment-limited conditions could temporarily occur over the integration timescale of CRN measurements, in particular in relation to post-glacial changes in sediment fluxes. This change in behavior could be an explanation for the failure of the ST-SPM or SVT-SPM to predict observed denudation rates for these catchments unless a very low or negligible incision threshold is considered.
As we have shown earlier, considering k50 and q (Eq. 13) to be free parameters allows obtaining an adjustment comparable to the R-SPM case. The corresponding D50 values are lower than present-day observations by a factor of 2, but the ∼0.8 exponent of the D50−ksn scaling is strikingly similar to observations. It is important to stress that our denudation rates integrate over several tens of thousands of years, a time frame over which important changes in bedload might have occurred, depending on the nature and efficiency of the weathering processes responsible for producing sediment on hillslope (Marshall et al., 2015). Another factor which might contribute to the underprediction of the D50 is that all the data used here come from surface bedload counts. Therefore, they reflect the surface grain size, which might not be representative of the total volumetric D50. Lastly, in order to avoid introducing too many free parameters in the model optimization we have used the same scaling parameters for Eq. (13) over all of our study area. Nevertheless, it could also be noted that the major lithological difference between the Cévennes schists and the granitic–gneissic bedrock of the other regions could have some influence on the spatial variations in bedload size. Indeed, the highly foliated and anisotropic schists produce sediments with a very specific shape factor when compared to the rounded pebbles observed in Ardèche, but such a difference is not resolvable from the available bedload data (Fig. 5b).
As highlighted by Campforts et al. (2020) in the northern Andes, our results confirm the importance of documenting and taking into account spatial variations of environmental parameters. In our case, we observe that gradients in discharge variability and incision threshold, which are key parameters of the stochastic incision family of models, play an important role in explaining the distribution of denudation rates. A key finding of our study is the overall very good performance of R-SPM when compared with more complex formulations of the stream power model.
6.3 Importance and definition of threshold effects
Here we discuss the relative importance of incision threshold effects in a broader context by comparing our results with earlier similar studies. In order to carry out this comparison of the different settings in which ST-SPMs have been investigated with similar methodologies as the one we use in our study, we first compute the ratio of erosion rates E to incision threshold Ψ (Fig. 10a).
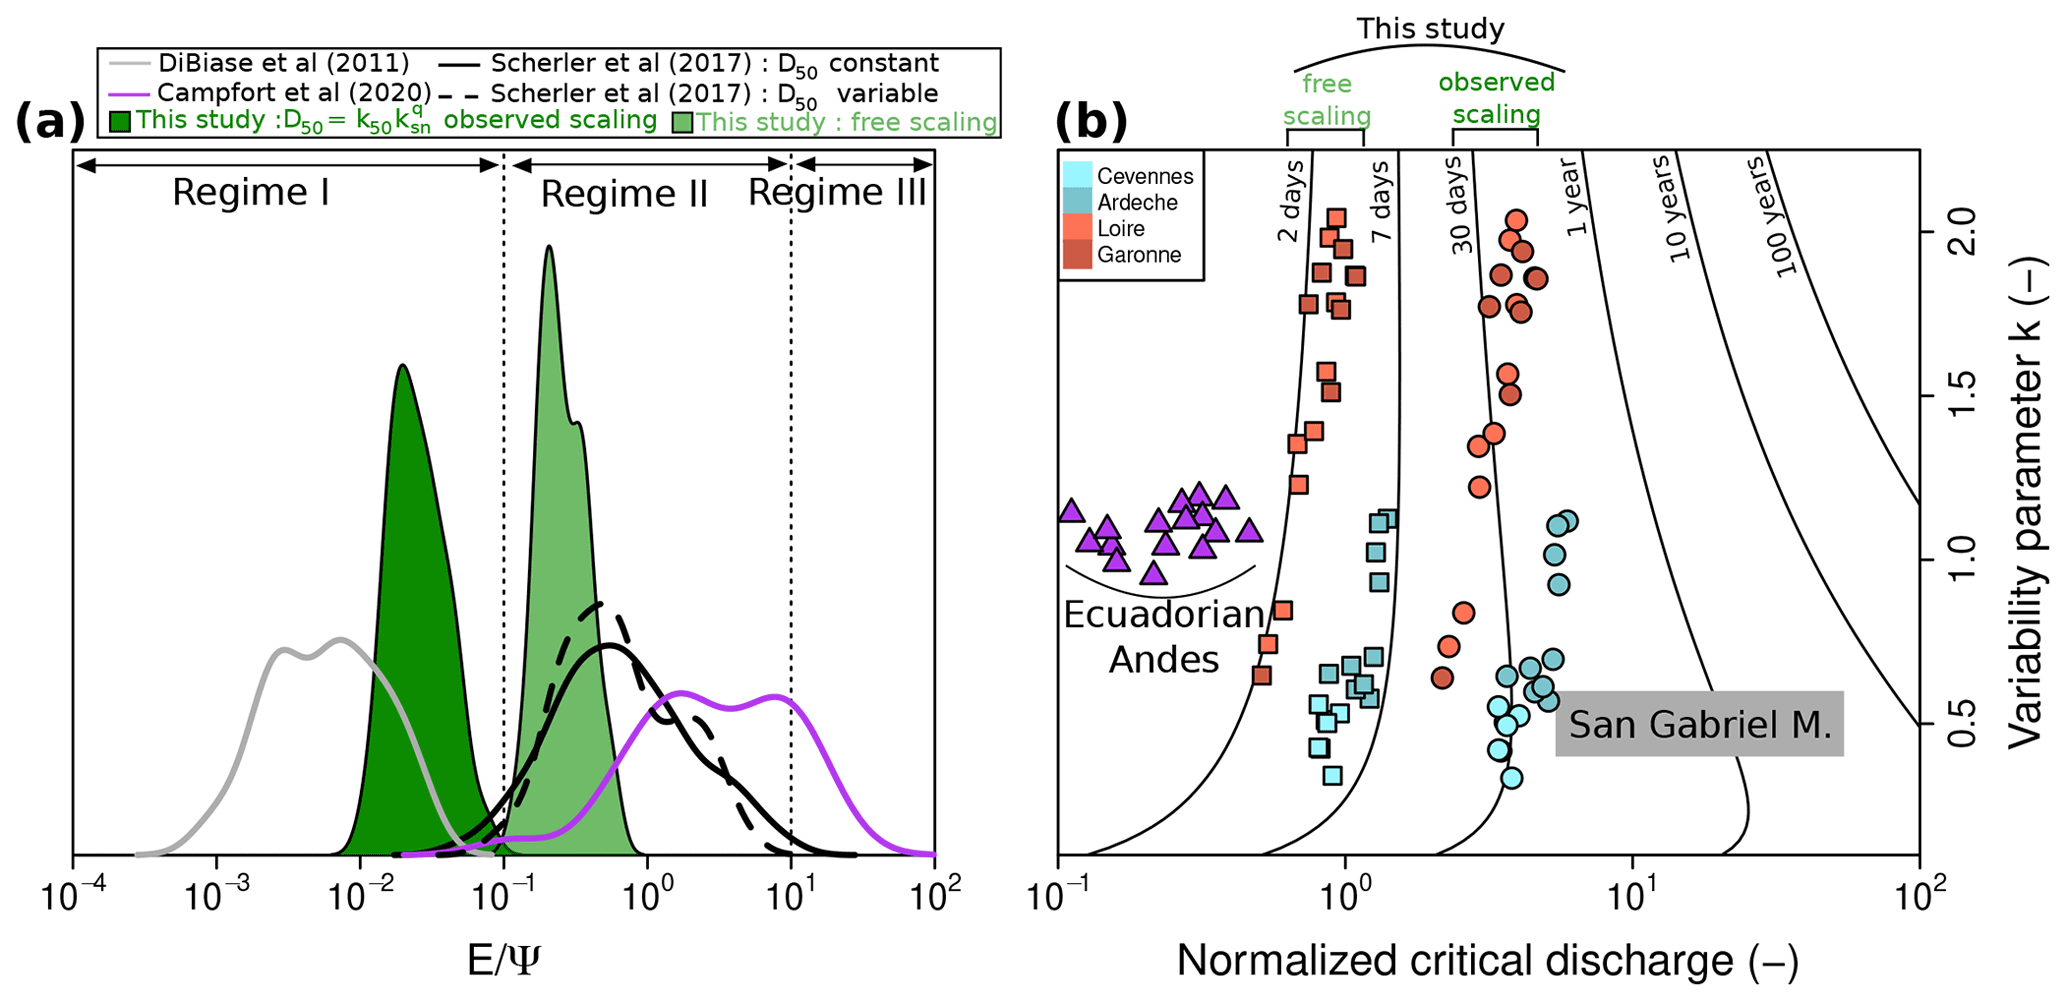
Figure 10(a) Long-term measured erosion rate E normalized by incision threshold Ψ (Eq. 7), allowing for distinguishing the various regime domains discussed in Lague et al. (2005) and DiBiase and Whipple (2011). The parameters used in the calculation (ke, τc) were obtained from each of the corresponding studies (DiBiase and Whipple, 2011; Scherler et al., 2017; Campforts et al., 2020). For the Ecuadorian Andes data, we use parameters listed in Campforts et al. (2020, Table 4) for their variable runoff, variability, and erodibility ST-SPM model (model 8). For the Himalayas and eastern Tibet data, we use the parameters listed in Scherler et al. (2017, Table 5) for their “Himalaya and eastern Tibet TRMM models”, with either constant D50 and constant (solid black line) or variable D50 and constant (dashed black line). Dark and light green curves correspond to our sampled basins with observed (Fig. 7d) and free (Fig. 7f) D50 scaling (Eq. 13), respectively. (b) Plot of the discharge variability parameter k against normalized critical discharge calculated from Eq. (11). Black lines correspond to the return time of normalized critical discharge calculated from Eq. (17) (Lague et al., 2005; Lague, 2014). Purple triangles and grey rectangles correspond to DiBiase and Whipple (2011) and Campforts et al. (2020) results, respectively, with the same model parameters as in the previous panel. Circles and squares correspond to our results with observed and free D50 scalings, respectively. The results from Scherler et al. (2017) were not plotted here, as they use a different definition of the discharge probability distribution.
As discussed in Lague et al. (2005) and DiBiase and Whipple (2011) the ratio allows distinguishing three domains defining the importance of threshold effects from domain I with low (where the ST-SPM formulation is relevant and threshold effects are important) to domain III with high (where a simple formulation such as A-SPM or R-SPM adequately describes the incision processes). Domain II is a transitional regime between these two situations. In the case of our study, we distinguish between the two scalings we have used for D50 calculation (Fig. 7d and f). We note that varies over 4 orders of magnitude between these different studies. Only our results when using the D50 scaling set from field observations and the data from DiBiase and Whipple (2011) in the San Gabriel Mountains are clearly in threshold-dominated regime I (Fig. 10a). It appears that all cases in which the incision threshold is a free parameter for model optimization, with either a constant or variable τc, fall into the transitional regime II. The two cases we consider for our Massif Central dataset illustrate the very strong influence of the hypothesis made for bedload size in influencing threshold effects and the associated regime, as there is a factor of 2 in D50 for values between the two scalings but a corresponding order of magnitude difference in the ratios.
Following Lague (2014) we also consider the implications of the relative influence of incision thresholds on the recurrence time tr for incision events (Fig. 10b) as a function of the critical normalized discharge (Eq. 11) and the discharge variability parameter k (Eq. 12),
where Γ is the incomplete gamma function. We observe that studies in which the threshold is considered to be a free parameter set by model optimization imply very low tr of less than 1 week, which, in the case of our study area in the Massif Central, is not consistent with observations of a limited number of incision events per year. Using the D50 scaling calibrated with field data yields tr values of a few months for most basins, which is more realistic given the hydrologic regime of our study area.
While measurements of bedload size are relatively straightforward to acquire in the field, definition of the appropriate D50 value to use in ST-SPMs is complicated by the usual high level of dispersion in observations as illustrated by data for the Massif Central (Fig. 5b) and the San Gabriel Mountains (DiBiase and Whipple, 2011, Fig. 6), as well as the high level of variability in space and time of bedload characteristics. Reliable estimates are thus difficult to obtain for τc, even though the a=1.5 exponent in Eq. (1) implies that limited changes in D50 can have important implications for the magnitude of threshold effects. Some earlier studies have avoided this limitation by considering τc, or the parameters involved in its calculation, to be free with values defined by the model optimization over their dataset. In the case of a spatially variable τc, our results illustrate a situation in which using such an optimization approach improves the quality of the fit to the erosion rate data (Fig. 7f vs. Fig.7d) but imply a low threshold and unrealistically short return times of incision events with respect to observed present-day conditions. A key feature of our study is that we attempted to constrain every parameter involved in the models and their spatial variations, in particular for the definition of incision thresholds. The importance of such thresholds appears to be strongly contrasting across the geomorphic and climatic gradient of the SE Massif Central.
Our study contributes to the ongoing debate concerning the impact of the distribution of discharge events on river incision and landscape evolution. We provide a case in addition to the handful of studies which have attempted to confront stochastic-threshold incision models with actual observations by focusing on the singular setting of the SE margin of the Massif Central and its pronounced gradient in discharge variability; we try to provide as many field-based controls as possible on all the environmental factors involved in the models, in particular their spatial variations.
Denudation rates are contrasted across our study area and display clear co-variations with precipitation and relief. In contrast, the relationship between denudation and steepness index does not delineate a single trend, suggesting complex interference between the spatial pattern of lithology and climate. A simple version of the stream power model, accounting for the distribution of precipitation, performs better at reproducing observed denudation rates when compared to the more elaborate stochastic-threshold SPM. The performances of such ST-SPMs are critically impacted by the definition and parameterization of the incision threshold. These results raise questions about the reliability of the assumptions usually made regarding bedload properties in such models and the signification of their estimate from field observations in terms of both underlying spatial variations and time integration of drastic changes in surface processes over the Late Pleistocene.
A key endeavor of quantitative geomorphology research is to provide a physically based explanation for the variability of erosion, denudation, or incision rates observed at the Earth's surface, accounting for landscape topographic attributes and environmental forcing of climatic or tectonic origins. The complexity of processes driving river incision has been extensively documented and explored with functional relationships attempting to capture specific mechanisms. The relative success of simpler representations in explaining landscape denudation in our study more generally suggests that the upscaling of such complex mechanistic models toward larger spatial scales requires further investigation.
Geoscientific datasets such as denudation rates, morphometric data, and hydrological data are available in the Supplement.
The supplement related to this article is available online at: https://doi.org/10.5194/esurf-10-473-2022-supplement.
Georges Aumaitre (Aix-Marseille Univ., Aix-en-Provence, France), Karim Keddadouche (Aix-Marseille Univ., Aix-en-Provence, France), and Zaidi Fawzi (Aix-Marseille Univ., Aix-en-Provence, France).
CD and VG designed the study. CD, VG, GD, LB, and JF carried out fieldwork. CD processed the 10Be samples. AT performed AMS measurements. CD and VG carried out the topographic and hydrological analysis, as well as denudation rate modeling. CD, VG, and DL discussed the modeling results. CD and VG wrote the article with input from other co-authors.
The contact author has declared that neither they nor their co-authors have any competing interests.
Publisher's note: Copernicus Publications remains neutral with regard to jurisdictional claims in published maps and institutional affiliations.
Clément Desormeaux's PhD is supported by a fellowship from the French Ministry for Higher Education. The 10Be measurements were performed at the ASTER AMS national facility (CEREGE, Aix-en-Provence), which is supported by the INSU/CNRS, the ANR through the Projets thématiques d'excellence program for the Equipements d'excellence ASTER-CEREGE action, and IRD. The authors thank the associated editor, Fiona Clubb, and the anonymous referee for their positive and constructive comments that have enhanced our paper.
This research has been supported by the Agence Nationale de la Recherche (Topo-Extreme (grant no. ANR-18-CE01-0017)).
This paper was edited by Fiona Clubb and reviewed by one anonymous referee.
Adams, B. A., Whipple, K. X., Forte, A. M., Heimsath, A. M., and Hodges, K. V.: Climate controls on erosion in tectonically active landscapes, Sci. Adv., 6, 758, https://doi.org/10.1126/sciadv.aaz3166, 2020. a, b, c
Attal, M., Mudd, S. M., Hurst, M. D., Weinman, B., Yoo, K., and Naylor, M.: Impact of change in erosion rate and landscape steepness on hillslope and fluvial sediments grain size in the Feather River basin (Sierra Nevada, California), Earth Surf. Dynam., 3, 201–222, https://doi.org/10.5194/esurf-3-201-2015, 2015. a, b
Balco, G., Stone, J. O., Lifton, N. A., and Dunai, T. J.: A complete and easily accessible means of calculating surface exposure ages or erosion rates from 10Be and 26Al measurements, Quatern. Geochronol., 3, 174–195, ISBN 1871-1014, https://doi.org/10.1016/j.quageo.2007.12.001, 2008. a
Campforts, B., Vanacker, V., Herman, F., Vanmaercke, M., Schwanghart, W., Tenorio, G. E., Willems, P., and Govers, G.: Parameterization of river incision models requires accounting for environmental heterogeneity: insights from the tropical Andes, Earth Surf. Dynam., 8, 447–470, https://doi.org/10.5194/esurf-8-447-2020, 2020. a, b, c, d, e, f, g, h, i, j, k, l, m
Carretier, S., Regard, V., Vassallo, R., Aguilar, G., Martinod, J., Riquelme, R., Pepin, E., Charrier, R., Herail, G., Farias, M., Guyot, J.-L., Vargas, G., and Lagane, C.: Slope and climate variability control of erosion in the Andes of central Chile, Geology, 41, 195–198, https://doi.org/10.1130/G33735.1, 2013. a, b
Clauset, A., Shalizi, C. R., and Newman, M. E. J.: Power-law distributions in empirical data, SIAM Review, 51, 43, https://doi.org/10.1109/ICPC.2008.18, 2007. a, b
Clubb, F. J., Mudd, S. M., Hurst, M. D., and Grieve, S. W.: Differences in channel and hillslope geometry record a migrating uplift wave at the Mendocino triple junction, California, USA, Geology, 48, 184–188, https://doi.org/10.1130/G46939.1, 2020. a
Cyr, A. J., Granger, D. E., Olivetti, V., and Molin, P.: Quantifying rock uplift rates using channel steepness and cosmogenic nuclide-determined erosion rates: Examples from northern and southern Italy, Lithosphere, 2, 188–198, https://doi.org/10.1130/L96.1, 2010. a
Deal, E., Botter, G., and Braun, J.: Understanding the role of rainfall and hydrology in determining fluvial erosion efficiency, J. Geophys. Res.-Earth, 123, 744–778, https://doi.org/10.1002/2017JF004393, 2018. a
Dezileau, L., Terrier, B., Berger, J. F., Blanchemanche, P., Latapie, A., Freydier, R., Bremond, L., Paquier, A., Lang, M., and Delgado, J. L.: A multidating approach applied to historical slackwater flood deposits of the Gardon River, SE France, Geomorphology, 214, 56–68, https://doi.org/10.1016/j.geomorph.2014.03.017, 2014. a
DiBiase, R. A. and Whipple, K. X.: The influence of erosion thresholds and runoff variability on the relationships among topography, climate, and erosion rate, J. Geophys. Res., 116, F04036, https://doi.org/10.1029/2011JF002095 2011. a, b, c, d, e, f, g, h, i, j, k, l, m, n, o, p
DiBiase, R. A., Whipple, K. X., Heimsath, A. M., and Ouimet, W. B.: Landscape form and millennial erosion rates in the San Gabriel Mountains, CA, Earth Planet. Sc. Lett., 289, 134–144, https://doi.org/10.1016/j.epsl.2009.10.036, 2010. a
DiBiase, R. A., Rossi, M. W., and Neely, A. B.: Fracture density and grain size controls on the relief structure of bedrock landscapes, Geology, 46, 1–14, https://doi.org/10.1130/G40006.1, 2018. a
Dietrich, W. E., Bellugi, D. G., Sklar, L. S., Stock, J. D., Heimsath, A. M., and Roering, J. J.: Geomorphic transport laws for predicting landscape form and dynamics, in: Prediction in Geomorphology, vol. 135, Geophysical Monograph Series, edited by: Wilcock, P. R. and Iverson, R. M., American Geophysical Union, Washington, DC, 103–132, https://doi.org/10.1029/GM135, 2003. a
Ferrier, K. L., Huppert, K. L., and Perron, J. T.: Climatic control of bedrock river incision, Nature, 496, 206–209, https://doi.org/10.1038/nature11982, 2013a. a, b, c
Ferrier, K. L., Taylor Perron, J., Mukhopadhyay, S., Rosener, M., Stock, J. D., Huppert, K. L., and Slosberg, M.: Covariation of climate and long-term erosion rates across a steep rainfall gradient on the Hawaiian island of Kaua'i, Bull. Geol. Soc. Am., 125, 1146–1163, https://doi.org/10.1130/B30726.1, 2013b. a, b
Finlayson, D. P., Montgomery, D. R., and Hallet, B.: Spatial coincidence of rapid inferred erosion with young metamorphic massifs in the Himalayas, Geology, 30, 219–222, https://doi.org/10.1130/0091-7613(2002)030<0219:SCORIE>2.0.CO;2, 2002. a
Finnegan, N. J., Hallet, B., Montgomery, D. R., Zeitler, P. K., Stone, J. O., Anders, A. M., and Yuping, L.: Coupling of rock uplift and river incision in the Namche Barwa-Gyala Peri massif, Tibet, Geol. Soc. Am. Bull., 120, 142–155, https://doi.org/10.1130/B26224.1, 2008. a
Fisher, G. B., Amos, C. B., Bookhagen, B., Burbank, D. W., and Godard, V.: Channel widths, landslides, faults, and beyond: The new world order of high-spatial resolution Google Earth imagery in the study of earth surface processes, Geological Society of America Special Papers 492, Geological Society of America, Incorporated, 1–22, https://doi.org/10.1130/2012.2492(01), 2012. a
Gasparini, N. M. and Brandon, M. T.: A generalized power law approximation for fluvial incision of bedrock channels, J. Geophys. Res., 116, F02020, https://doi.org/10.1029/2009JF001655, 2011. a
Gob, F., Bilodeau, C., Thommeret, N., Belliard, J., Albert, M.-B., Tamisier, V., Baudoin, J.-M., and Kreutzenberger, K.: A tool for the characterisation of the hydromorphology of rivers in line with the application of the European Water Framework Directive in France (CARHYCE), Géomorphologie, 20, 57–72, https://doi.org/10.4000/geomorphologie.10497, 2014. a, b, c
Godard, V., Lavé, J., Carcaillet, J., Cattin, R., Bourlès, D., and Zhu, J.: Spatial distribution of denudation in Eastern Tibet and regressive erosion of plateau margins, Tectonophysics, 491, 253–274, https://doi.org/10.1016/j.tecto.2009.10.026, 2010. a
Godard, V., Burbank, D. W., Bourlès, D. L., Bookhagen, B., Braucher, R., and Fisher, G. B.: Impact of glacial erosion on 10Be concentrations in fluvial sediments of the Marsyandi catchment, central Nepal, J. Geophys. Res., 117, F03013, https://doi.org/10.1029/2011JF002230, 2012. a
Godard, V., Bourles, D. L., Spinabella, F., Burbank, D. W., Bookhagen, B., Fisher, G. B., Moulin, A., and Leanni, L.: Dominance of tectonics over climate in Himalayan denudation, Geology, 42, 243–246, https://doi.org/10.1130/G35342.1, 2014. a, b
Godard, V., Dosseto, A., Fleury, J., Bellier, O., Siame, L., and ASTER, T.: Transient landscape dynamics across the Southeastern Australian Escarpment, Earth Planet. Sc. Lett., 506, 397–406, https://doi.org/10.1016/j.epsl.2018.11.017, 2019. a
Harel, M.-A., Mudd, S., and Attal, M.: Global analysis of the stream power law parameters based on worldwide 10Be denudation rates, Geomorphology, 268, 184–196, https://doi.org/10.1016/j.geomorph.2016.05.035, 2016. a, b
Harkins, N., Kirby, E., Heimsath, A., Robinson, R., and Reiser, U.: Transient fluvial incision in the headwaters of the Yellow River, northeastern Tibet, China, J. Geophys. Res., 112, F03S04, https://doi.org/10.1029/2006JF000570, 2007. a
Howard, A. D.: A detachment-limited model of drainage basin evolution, Water Resour. Res., 30, 2261–2285, https://doi.org/10.1029/94WR00757, 1994. a, b
Howard, A. D., Dietrich, W. E., and Seidl, M. A.: Modeling fluvial erosion on regional to continental scales, J. Geophys. Res., 99, 13971–13986, https://doi.org/10.1029/94JB00744, 1994. a
Joly, D., Brossard, T., Cardot, H., Cavailhes, J., Hilal, M., and Wavresky, P.: Types of climates on continental France, a spatial construction, Cybergeo, 501, https://doi.org/10.4000/cybergeo.23155, 2010. a
Kirby, E. and Ouimet, W.: Tectonic geomorphology along the eastern margin of Tibet: insights into the pattern and processes of active deformation adjacent to the Sichuan Basin, Geol. Soc. Lond. Spec. Publ., 353, 165–188, https://doi.org/10.1144/SP353.9, 2011. a
Kirby, E. and Whipple, K.: Quantifying differential rock-uplift rates via stream profile analysis, Geology, 29, 415–418, https://doi.org/10.1130/0091-7613(2001)029<0415:QDRURV>2.0.CO;2, 2001. a
Kirby, E. and Whipple, K. X.: Expression of active tectonics in erosional landscapes, J. Struct. Geol., 44, 54–75, https://doi.org/10.1016/j.jsg.2012.07.009, 2012. a, b, c
Lague, D.: The stream power river incision model: Evidence, theory and beyond, Earth Surf. Proc. Land., 39, 38–61, https://doi.org/10.1002/esp.3462, 2014. a, b, c, d, e, f
Lague, D., Hovius, N., and Davy, P.: Discharge, discharge variability, and the bedrock channel profile, J. Geophys. Res., 110, F04006, https://doi.org/10.1029/2004JF000259, 2005. a, b, c, d, e, f, g, h
Lavé, J. and Avouac, J. P.: Active folding of fluvial terraces across the Siwaliks Hills, Himalayas of central Nepal, J. Geophys. Res., 105, 5735–5770, https://doi.org/10.1029/1999JB900292, 2000. a
Lavé, J. and Avouac, J. P.: Fluvial incision and tectonic uplift across the Himalayas of central Nepal, J. Geophys. Res., 106, 26561–26591, https://doi.org/10.1029/2001JB000359, 2001. a
Le Lay, M. and Saulnier, G. M.: Exploring the signature of climate and landscape spatial variabilities in flash flood events: Case of the 8–9 September 2002 Cévennes-Vivarais catastrophic event, Geophys. Res. Lett., 34, L13401, https://doi.org/10.1029/2007GL029746, 2007. a
Malcles, O., Vernant, P., Chéry, J., Camps, P., Cazes, G., Ritz, J.-F., and Fink, D.: Determining the Plio-Quaternary uplift of the southern French Massif Central; a new insight for intraplate orogen dynamics, Solid Earth, 11, 241–258, https://doi.org/10.5194/se-11-241-2020, 2020. a, b
Marshall, J. A., Roering, J. J., Bartlein, P. J., Gavin, D. G., Granger, D. E., Rempel, A. W., Praskievicz, S. J., and Hales, T. C.: Frost for the trees: Did climate increase erosion in unglaciated landscapes during the late Pleistocene?, Sci. Adv., 1, e1500715, https://doi.org/10.1126/sciadv.1500715, 2015. a
Mazzotti, S., Jomard, H., and Masson, F.: Processes and deformation rates generating seismicity in metropolitan France and conterminous Western Europe, BSGF – Earth Sci. Bull., 191, 19, https://doi.org/10.1051/bsgf/2020019, 2020. a
Mocochain, L., Audra, P., Clauzon, G., Bellier, O., Bigot, J.-Y., Parize, O., and Monteil, P.: The effect of river dynamics induced by the Messinian Salinity Crisis on karst landscape and caves: Example of the Lower Ardèche river (mid Rhône valley), Geomorphology, 106, 46–61, https://doi.org/10.1016/j.geomorph.2008.09.021, 2009. a
Molliex, S., Rabineau, M., Leroux, E., Bourlès, D., Authemayou, C., Aslanian, D., Chauvet, F., Civet, F., and Jouët, G.: Multi-approach quantification of denudation rates in the Gulf of Lion source-to-sink system (SE France), Earth Planet. Sc. Lett., 444, 101–115, https://doi.org/10.1016/j.epsl.2016.03.043, 2016. a, b
Molnar, P., Anderson, R. S., Kier, G., and Rose, J.: Relationships among probability distributions of stream discharges in floods, climate, bed load transport, and river incision, J. Geophysi. Res.-Earth, 111, F02001, https://doi.org/10.1029/2005JF000310, 2006. a, b, c, d
Moon, S., Page Chamberlain, C., Blisniuk, K., Levine, N., Rood, D. H., and Hilley, G. E.: Climatic control of denudation in the deglaciated landscape of the Washington Cascades, Nat. Geosci., 4, 469–473, https://doi.org/10.1038/ngeo1159 2011. a
Naulet, R., Lang, M., Ouarda, T. B., Coeur, D., Bobée, B., Recking, A., and Moussay, D.: Flood frequency analysis on the Ardèche river using French documentary sources from the last two centuries, J. Hydrol., 313, 58–78, https://doi.org/10.1016/j.jhydrol.2005.02.011, 2005. a
Niemi, N. A., Oskin, M., Burbank, D. W., Heimsath, A. M., and Gabet, E. J.: Effects of bedrock landslides on cosmogenically determined erosion rates, Earth Planet. Sc. Lett., 237, 480–498, https://doi.org/10.1016/j.epsl.2005.07.009, 2005. a
Olivetti, V., Godard, V., Bellier, O., Team, A., and ASTER, T.: Cenozoic rejuvenation events of Massif Central topography (France): Insights from cosmogenic denudation rates and river profiles, Earth Planet. Sc. Lett., 444, 179–191, https://doi.org/10.1016/j.epsl.2016.03.049, 2016. a, b, c, d, e
Olivetti, V., Balestrieri, M. L., Godard, V., Bellier, O., Gautheron, C., Valla, P. G., Zattin, M., Faccenna, C., Pinna-Jamme, R., and Manchuel, K.: Cretaceous and late Cenozoic uplift of a Variscan Massif: The case of the French Massif Central studied through low-temperature thermochronometry, Lithosphere, 12, 133–149, https://doi.org/10.1130/L1142.1, 2020. a
Ouimet, W. B., Whipple, K. X., and Granger, D. E.: Beyond threshold hillslopes: Channel adjustment to base-level fall in tectonically active mountain ranges, Geology, 37, 579–582, https://doi.org/10.1130/G30013A.1, 2009. a, b, c
Perron, J. T. and Royden, L.: An integral approach to bedrock river profile analysis, Earth Surf. Proc. Land., 38, 570–576, https://doi.org/10.1002/esp.3302, 2012. a
Ritz, J.-F., Baize, S., Ferry, M., Larroque, C., Audin, L., Delouis, B., and Mathot, E.: Surface rupture and shallow fault reactivation during the 2019 Mw 4.9 Le Teil earthquake, France, Commun. Earth Environ., 1, 10, https://doi.org/10.1038/s43247-020-0012-z, 2020. a
Roberts, G. G. and White, N.: Estimating uplift rate histories from river profiles using African examples, J. Geophys. Res., 115, B02406, https://doi.org/10.1029/2009JB006692, 2010. a
Schaller, M., von Blanckenburg, F., Hovius, N., and Kubik, P.: Large-scale erosion rates from in situ-produced cosmogenic nuclides in European river sediments, Earth Planet. Sc. Lett., 188, 441–458, https://doi.org/10.1016/S0012-821X(01)00320-X, 2001. a, b, c
Schaller, M., von Blanckenburg, F., Veldkamp, A., Tebbens, L., Hovius, N., and Kubik, P.: A 30 000 yr record of erosion rates from cosmogenic 10Be in Middle European river terraces, Earth Planet. Sc. Lett., 204, 307–320, https://doi.org/10.1016/S0012-821X(02)00951-2, 2002. a
Scherler, D., Bookhagen, B., and Strecker, M. R.: Tectonic control on 10Be derived erosion rates in the Garhwal Himalaya, India, J. Geophys. Res.-Earth, 119, 1–23, https://doi.org/10.1002/2013JF002955, 2014. a, b
Scherler, D., DiBiase, R. A., Fisher, G. B., and Avouac, J.-P.: Testing monsoonal controls on bedrock river incision in the Himalaya and Eastern Tibet with a stochastic-threshold stream power model, J. Geophys. Res.-Earth, 122, 1389–1429, https://doi.org/10.1002/2016JF004011, 2017. a, b, c, d, e, f, g, h, i, j, k, l, m
Sheffer, N. A., Enzel, Y., Benito, G., Grodek, T., Poart, N., Lang, M., Naulet, R., and Cœur, D.: Paleofloods and historical floods of the Ardèche River, France, Water Resour. Res., 39, 1–13, https://doi.org/10.1029/2003WR002468, 2003. a
Shobe, C. M., Tucker, G. E., and Rossi, M. W.: Variable-Threshold Behavior in Rivers Arising From Hillslope-Derived Blocks, J. Geophys. Res.-Earth, 123, 1931–1957, https://doi.org/10.1029/2017JF004575, 2018. a
Sklar, L. and Dietrich, W. E.: Sediment and rock strength controls on river incision into bedrock, Geology, 29, 1087–1090, https://doi.org/10.1130/0091-7613(2001)029<1087:SARSCO>2.0.CO;2, 2001. a
Sklar, L. S. and Dietrich, W. E.: The role of sediment in controlling steady-state bedrock channel slope: Implications of the saltation-abrasion incision model, Geomorphology, 82, 58–83, https://doi.org/10.1016/j.geomorph.2005.08.019, 2006. a
Snyder, N. P., Whipple, K. X., Tucker, G. E., and Merritts, D. J.: Importance of a stochastic distribution of floods and erosion thresholds in the bedrock river incision problem, J. Geophys. Res., 108, 2117, https://doi.org/10.1029/2001JB001655, 2003. a, b
Tassy, A., Mocochain, L., Bellier, O., Braucher, R., Gattacceca, J., and Bourlès, D.: Coupling cosmogenic dating and magnetostratigraphy to constrain the chronological evolution of peri-Mediterranean karsts during the Messinian and the Pliocene: Example of Ardèche Valley, Southern France, Geomorphology, 189, 81–92, https://doi.org/10.1016/j.geomorph.2013.01.019, 2013. a
Tucker, G. E. and Bras, R. L.: A stochastic approach to modeling the role of rainfall variability in drainage basin evolution, Water Resour. Res., 36, 1953–1964, https://doi.org/10.1029/2000WR900065, 2000. a, b
Turowski, J. M., Lague, D., and Hovius, N.: Cover effect in bedrock abrasion: A new derivation and its implications for the modeling of bedrock channel morphology, J. Geophys. Res.-Earth., 112, 1–16, https://doi.org/10.1029/2006JF000697, 2007. a
Vanacker, V., von Blanckenburg, F., Govers, G., Campforts, B., Molina, A., and Kubik, P.: Transient river response, captured by the channel steepness and its concavity, Geomorphology, 228, 234–243, https://doi.org/10.1016/j.geomorph.2014.09.013, 2015. a, b
Whipple, K. X. and Tucker, G. E.: Dynamics of the stream-power river incision model: Implications for height limits of mountain ranges, landscape response timescales, and research needs, J. Geophys. Res., 104, 17661–17674, https://doi.org/10.1029/1999JB900120, 1999. a
Whipple, K. X. and Tucker, G. E.: Implications of sediment-flux-dependent river incision models for landscape evolution, J. Geophys. Res., 107, 2039, https://doi.org/10.1029/2000JB000044, 2002. a
Whipple, K. X., Hancock, G. S., and Anderson, R. S.: River incision into bedrock: Mechanics and relative efficacy of plucking, abrasion, and cavitation, Bull. Geol. Soc. Am., 112, 490–503, https://doi.org/10.1130/0016-7606(2000)112<490:RIIBMA>2.0.CO;2, 2000. a
Whittaker, A. C.: How do landscapes record tectonics and climate?, Lithosphere, 4, 160–164, https://doi.org/10.1130/RF.L003.1, 2012. a
Willenbring, J. K., Gasparini, N. M., Crosby, B. T., and Brocard, G.: What does a mean mean? The temporal evolution of detrital cosmogenic denudation rates in a transient landscape, Geology, 41, 1215–1218, https://doi.org/10.1130/G34746.1, 2013. a
Wobus, C., Heimsath, A., Whipple, K., and Hodges, K.: Active out-of-sequence thrust faulting in the central Nepalese Himalaya, Nature, 434, 1008–1011, https://doi.org/10.1038/nature03499, 2005. a
Wobus, C., Whipple, K. X., Kirby, E., Snyder, N. P., Johnson, J., Spyropolou, K., Crosby, B., and Sheehan, D.: Tectonics from topography: Procedures, promise, and pitfalls, Geol. Soc. Ame. Spec. Pap., 398, 55–74, https://doi.org/10.1130/SPE398, 2006. a
Yanites, B. J., Tucker, G. E., and Anderson, R. S.: Numerical and analytical models of cosmogenic radionuclide dynamics in landslide-dominated drainage basins, J. Geophys. Res., 114, F01007, https://doi.org/10.1029/2008JF001088, 2009. a
Yanites, B. J., Tucker, G. E., Mueller, K. J., Chen, Y.-G., Wilcox, T., Huang, S.-Y., and Shi, K.-W.: Incision and channel morphology across active structures along the Peikang River, central Taiwan: Implications for the importance of channel width, Geol. Soc. Am. Bull., 122, 1192–1208, https://doi.org/10.1130/B30035.1, 2010. a