the Creative Commons Attribution 4.0 License.
the Creative Commons Attribution 4.0 License.
 | 19 Sep 2022
Toward a general calibration of the Swiss plate geophone system for fractional bedload transport
Gilles Antoniazza
Lorenz Ammann
Dieter Rickenmann
James W. Kirchner
Substantial uncertainties in bedload transport predictions in steep streams have encouraged intensive efforts towards the development of surrogate monitoring technologies. One such system, the Swiss plate geophone (SPG), has been deployed and calibrated in numerous steep channels, mainly in the Alps. Calibration relationships linking the signal recorded by the SPG system to the intensity and characteristics of transported bedload can vary substantially between different monitoring stations, likely due to site-specific factors such as flow velocity and bed roughness. Furthermore, recent flume experiments on the SPG system have shown that site-specific calibration relationships can be biased by elastic waves resulting from impacts occurring outside the plate boundaries. Motivated by these findings, we present a hybrid calibration procedure derived from flume experiments and an extensive dataset of 308 direct field measurements at four different SPG monitoring stations. Our main goal is to investigate the feasibility of a general, site-independent calibration procedure for inferring fractional bedload transport from the SPG signal. First, we use flume experiments to show that sediment size classes can be distinguished more accurately using a combination of vibrational frequency and amplitude information than by using amplitude information alone. Second, we apply this amplitude–frequency method to field measurements to derive general calibration coefficients for 10 different grain-size fractions. The amplitude–frequency method results in more homogeneous signal responses across all sites and significantly improves the accuracy of fractional sediment flux and grain-size estimates. We attribute the remaining site-to-site discrepancies to large differences in flow velocity and discuss further factors that may influence the accuracy of these bedload estimates.
- Article
(4476 KB) - Full-text XML
-
Supplement
(2430 KB) - BibTeX
- EndNote


Flood events across Europe in the summer of 2021 have illustrated the threat of bedload-transport-related hazards to human life and infrastructure, especially in small and steep mountainous catchments (Badoux et al., 2014; Blöschl et al., 2020). Understanding sediment transport processes is also essential for efforts to return rivers to their nearly natural state by restoring their continuity and re-establishing balanced sediment budgets (e.g., Brouwer and Sheremet, 2017; Pauli et al., 2018; Logar et al., 2019; Rachelly et al., 2021). However, monitoring and predicting bedload transport still represent a considerable challenge because of large spatiotemporal variability (e.g., Mühlhofer, 1933; Einstein, 1937; Reid et al., 1985; Rickenmann, 2017; Ancey, 2020). This is especially true for steep streams because they are poorly described by traditional bedload transport equations, which have mainly been developed for lower-gradient channels (e.g., Schneider et al., 2016). Predicting sediment transport in steep channels is challenging, notably due to the presence of macro-roughness elements affecting the flow energy (e.g., Manga and Kirchner, 2000; Yager et al., 2007, 2012; Bathurst, 2007; Nitsche et al., 2011; Rickenmann and Recking, 2011; Prancevic and Lamb, 2015). It is further complicated by a sediment supply that varies in both space and time due in part to cycles of building and breaking of an armoring layer at the riverbed (e.g., Church et al., 1998; Dhont and Ancey, 2018; Rickenmann, 2020; Piantini et al., 2021).
Bedload transport equations established for lower-gradient streams typically result in errors spanning multiple orders of magnitude when applied to steep streams, motivating the development of new indirect monitoring techniques for steep mountain channels (e.g., Gray et al., 2010; Rickenmann, 2017). Indirect monitoring techniques provide complete coverage of selected river transects at high temporal resolution, reduce personal risk related to in-stream sampling, and enable consistent data collection at widely varying flow conditions, including during flooding events (e.g., Gray et al., 2010; Rickenmann, 2017; Geay et al., 2020; Bakker et al., 2020; Choi et al., 2020; Le Guern et al., 2021). The drawback of these monitoring technologies with regards to absolute bedload transport estimates lies in their need for intensive calibration through direct bedload sampling with retention basins (Rickenmann and McArdell, 2008), slot samplers (e.g., Habersack et al., 2017; Halfi et al., 2020), or mobile bag samplers (e.g., Bunte et al., 2004; Dell'Agnese et al., 2014; Hilldale et al., 2015; Mao et al., 2016; Kreisler et al., 2017; Nicollier et al., 2021).
Among indirect monitoring techniques, the Swiss plate geophone (SPG) system has been deployed and tested in more than 20 steep gravel-bed streams and rivers, mostly in the European Alps (Rickenmann, 2017). Typically, linear or power-law calibration relationships have been developed between measured signal properties and bedload transport characteristics (Rickenmann et al., 2014; Wyss et al., 2016a; Kreisler et al., 2017; Kuhnle et al., 2017). Such calibration equations permit absolute quantification of bedload fluxes (e.g., Dell'Agnese et al., 2014; Rickenmann et al., 2014; Hilldale et al., 2015; Halfi et al., 2020; Nicollier et al., 2021) as well as their variability in time and space (i.e., across a river section; e.g., Habersack et al., 2017; Rickenmann, 2020; Antoniazza et al., 2022), estimates of bedload grain-size distribution (e.g., Mao et al., 2016; Barrière et al., 2015; Rickenmann et al., 2018), and the detection of the start and end of bedload transport (e.g., Turowski et al., 2011; Rickenmann, 2020). However, these equations require a calibration procedure against independent bedload transport measurements at each individual field site because until now we have lacked generally applicable signal-to-bedload calibration equations that are valid across field settings. Although similarities between calibration relationships at various field sites are encouraging, it is not well understood why the linear calibration coefficients for total mass flux can vary by about a factor of 20 among individual samples from different sites or by about a factor of 6 among the mean values from different sites (Rickenmann et al., 2014; Rickenmann and Fritschi, 2017). Given the substantial field effort required for calibration campaigns, a generally applicable calibration equation would represent a significant advance.
Numerous studies have reported successful calibration of impact plate systems in laboratory flumes (e.g., Bogen and Møen, 2003; Krein et al., 2008; Tsakiris et al., 2014; Mao et al., 2016; Wyss et al., 2016b, c; Kuhnle et al., 2017; Chen et al., 2022), although transferring these flume-based calibrations to the field remains challenging. Nonetheless, flume experiments are valuable because they allow systematically exploring relationships between the recorded signal, the transport rates of different sediment size fractions, and the hydraulic conditions. For example, the experiments of Wyss et al. (2016b) showed that higher flow velocities induce a weaker SPG signal response per unit of transported sediment. More recent flume experiments have highlighted another important site-dependent factor influencing the SPG signal response, namely the grain-size distribution (GSD) of the transported bedload (Nicollier et al., 2021), with coarser grain mixtures shown to yield a stronger signal response per unit bedload weight.
Subsequent impact tests and flume experiments showed that this grain-size dependence arises because the impact plates are insufficiently isolated from their surroundings (Antoniazza et al., 2020; Nicollier et al., 2022). The elastic wave generated by an impact on or near a plate was found to propagate over several plate lengths, contaminating the signals recorded by neighboring sensors within a multiple-plate array. Nicollier et al. (2022) introduced the notion of “apparent packets” (in opposition to “real” packets) to define the portions of the recorded signal that were generated by such extraneous particle impacts.
The main goal of this contribution is to examine the feasibility of a general, site-independent signal conversion procedure for fractional bedload flux estimates. We follow a comprehensive hybrid signal conversion approach that encompasses a set of full-scale flume experiments conducted at an outdoor facility, as well as 308 field calibration measurements performed with direct sampling methods at four different bedload monitoring stations in Switzerland between 2009 and 2020. We present the amplitude–frequency (AF) method, aiming to reduce the bias introduced by apparent packets in the relationship between the signal characteristics and the particle size. Finally, we compare the performance of this novel AF method against the amplitude histogram (AH) method developed by Wyss et al. (2016a) for both fractional and total bedload flux estimates.
2.1 The SPG system
The Swiss plate geophone (SPG) consists of a geophone sensor fixed under a steel plate of standard dimensions 492 mm × 358 mm × 15 mm (Fig. 1a; Rickenmann, 2017). The geophone (GS-20DX by Geospace Technologies; https://www.geospace.com/, last access: 10 January 2022) uses a magnet moving inside an inertial coil (floating on springs) as an inductive element. The voltage induced by the moving magnet is directly proportional to its vertical velocity resulting from particle impacts on the plate. The SPG system can detect bedload particles with a minimum diameter of 10 mm (Rickenmann et al., 2014; Rickenmann, 2020; Wyss et al., 2016a). Typically, an SPG array includes several plates mounted side by side, acoustically isolated by elastomer elements and covering the river cross-section. The array is either embedded in a concrete sill or fixed at the downstream face of a check dam. A detailed description of the SPG system can be found in Rickenmann et al. (2014). For all the calibration measurements and flume experiments analyzed in this study ranging in duration from a few seconds to 1 h, the raw 10 kHz geophone signal was recorded (Fig. 1b).
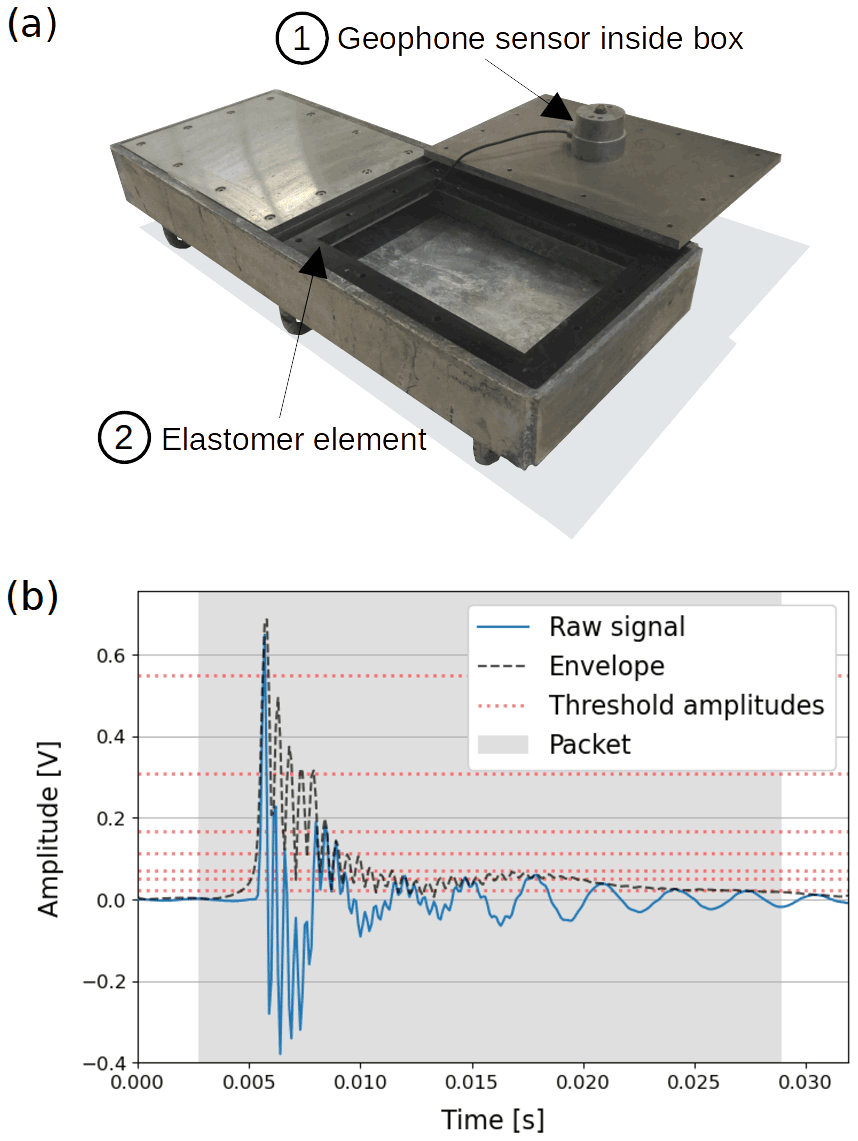
Figure 1(a) Swiss plate geophone (SPG) system before installation. Each plate is equipped with a uniaxial geophone sensor fixed in a watertight aluminum box (1) attached to the underside of the plate. The plates are acoustically isolated from each other by elastomer elements (2). (b) Example of a packet (grey area) detected by the SPG system. A packet begins 20 time steps (i.e., 2 ms) before the signal envelope crosses the lowest amplitude threshold of 0.0216 V and ends 20 time steps after the last crossing of the lowest amplitude threshold (see Sect. 2.4).
2.2 Field calibration measurements
To test the AF and AH methods, this study uses 308 field measurements from four Swiss bedload monitoring stations equipped with the SPG system (Fig. 2; Table 1). Field calibration samples were collected at the Albula, Navisence, and Avançon de Nant stations, and extensive calibration efforts have been undertaken at the fourth field station in the Erlenbach since 2009 (Rickenmann et al., 2012). The Erlenbach offers an interesting comparison with the other sites due to different channel morphology and flow characteristics upstream of the SPG plates. Field calibrations at the four sites consisted of the following steps: (i) direct bedload sampling downstream of an impact plate using either crane-mounted net samplers adapted from Bunte traps (Bunte et al., 2004; Dell'Agnese et al., 2014; Nicollier et al., 2019; Fig. 2a, b), automated basket samplers (Rickenmann et al., 2012; Fig. 2d), or manual basket samplers (Fig. 2c; Antoniazza et al., 2022); (ii) synchronous recording of the raw geophone signal; (iii) sieving and weighing of bedload samples using 10 sieve classes (see Sect. 2.4); and (iv) comparing the fractional bedload mass of each sample to the geophone signal to derive the corresponding calibration coefficients. A more detailed description of the sampling procedure is reported in Sect. S1 in the Supplement, including the mesh sizes used for bedload sampling. For the analysis, only particles larger than 9.5 mm were considered as they are close to the SPG detection threshold. Streamflow information was derived from various stage sensors (Table 1). Flow velocity Vw was introduced by Wyss et al. (2016c) as a possible governing parameter affecting the number of particles detected by the SPG system. Unfortunately, due to the lack of continuous streamflow measurements at the Albula and Navisence sites, we were not able to account for the effect of the flow velocity in the signal conversion procedure described in the present study.
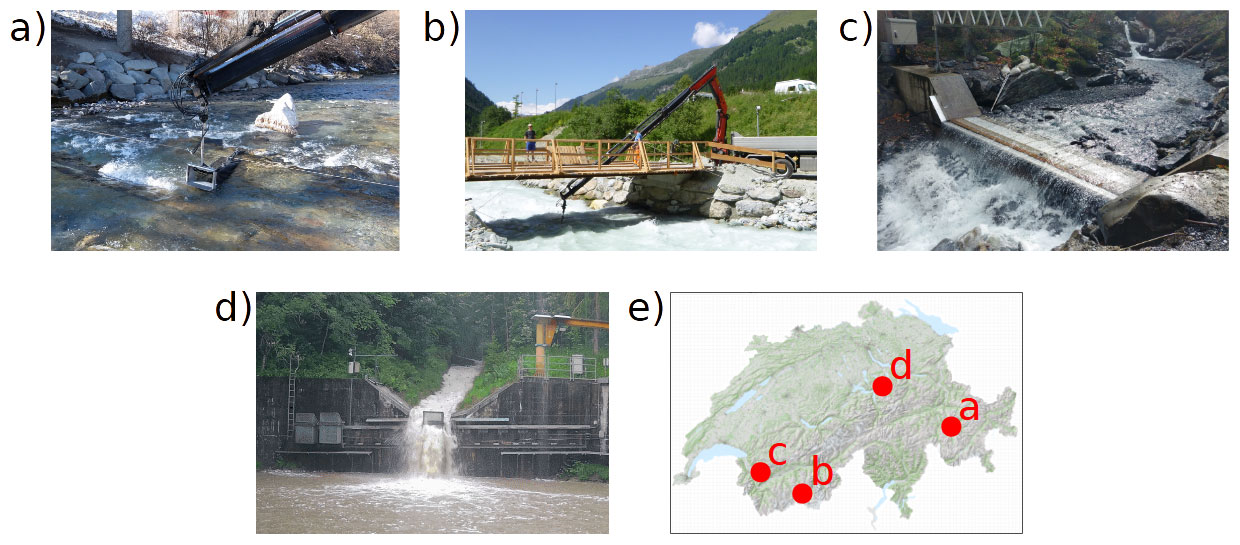
Figure 2The four Swiss bedload monitoring stations where field calibration measurements were performed: (a) Albula, (b) Navisence, (c) Avançon de Nant, and (d) Erlenbach. Their location is indicated on the map of Switzerland in panel (e) (base map © Swisstopo, used by permission). The crane-mounted net sampler is shown in (a) and (b), and an example of mobile sediment basket sampling is presented in (d).
Table 1Channel and flow characteristics based on in situ measurements during the calibration campaigns at the four field sites. The year of the field calibration campaigns, the sampling technique, and the number of collected samples are also indicated.
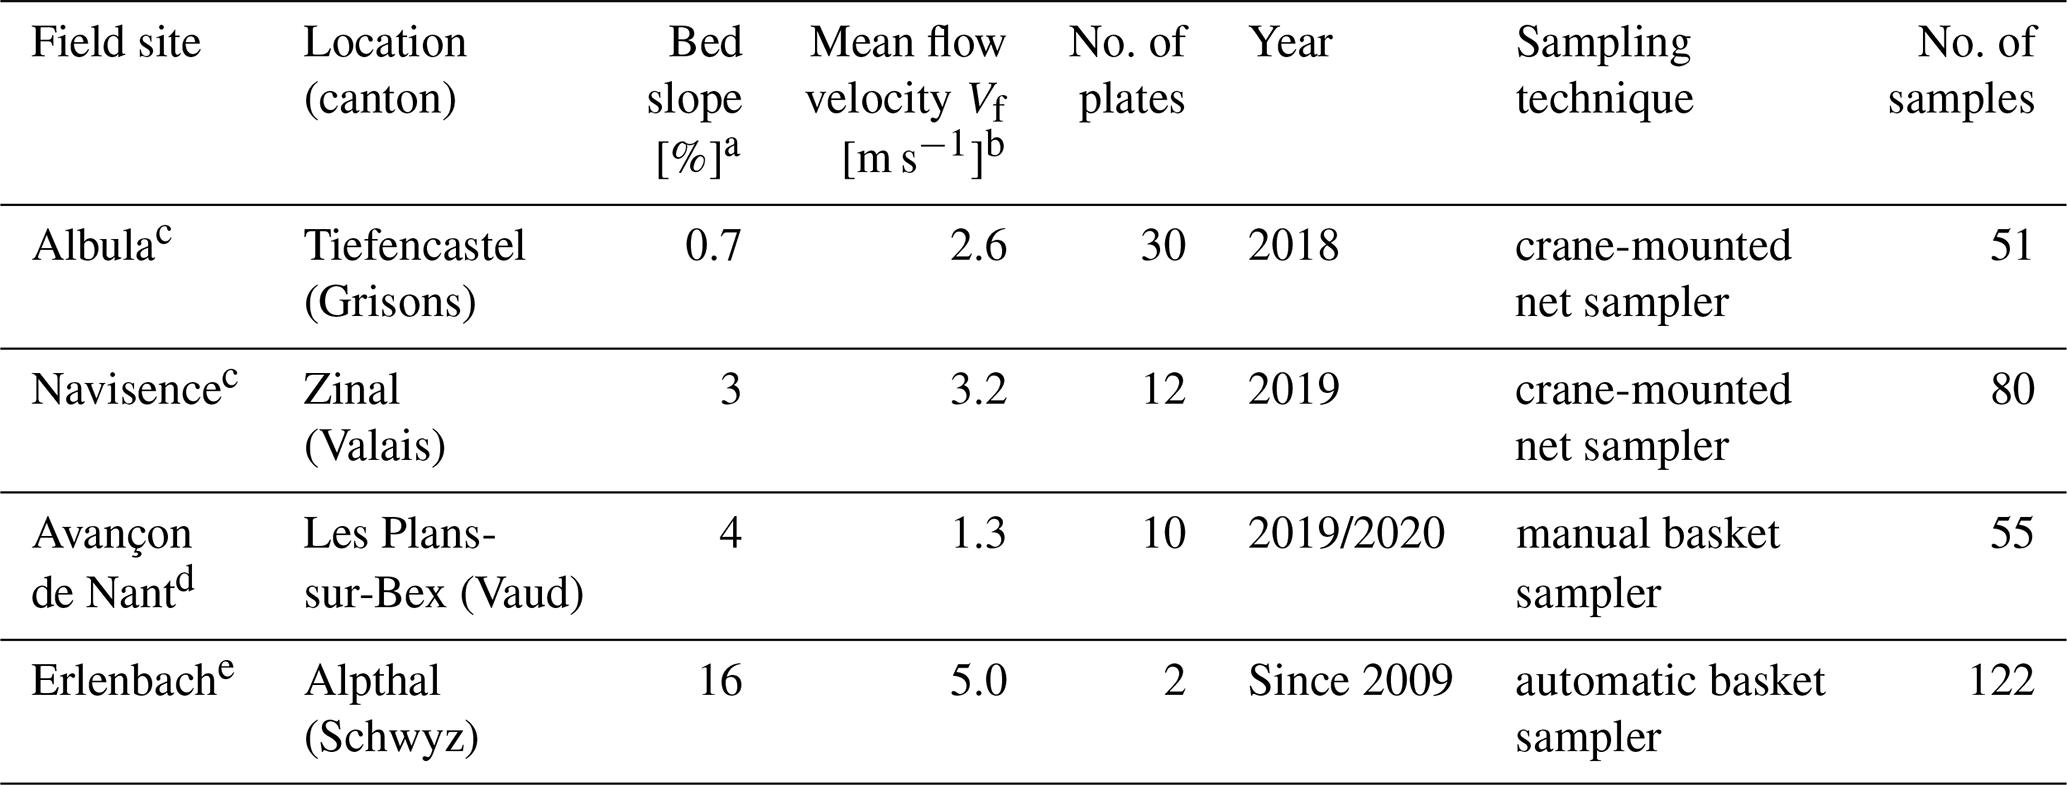
a Gradient measured upstream of the SPG plates. At the Erlenbach, this gradient is the slope of the 35 m long artificial channel upstream of the SPG system. b Depth-averaged mean flow velocities measured during the calibration measurements using an magnetic-inductive flowmeter OTT MF Pro (Albula and Navisence), a radar-based stage sensor Vegapuls WL 61 (Avançon de Nant), and a 2-D laser sensor TiM551 by SICK AG © (Erlenbach). c More information on the sites is available in Nicollier et al. (2021). d More information on the site is available in Antoniazza et al. (2022). e More information on the site is available in, e.g., Rickenmann et al. (2012, 2018) and Wyss et al. (2016c).
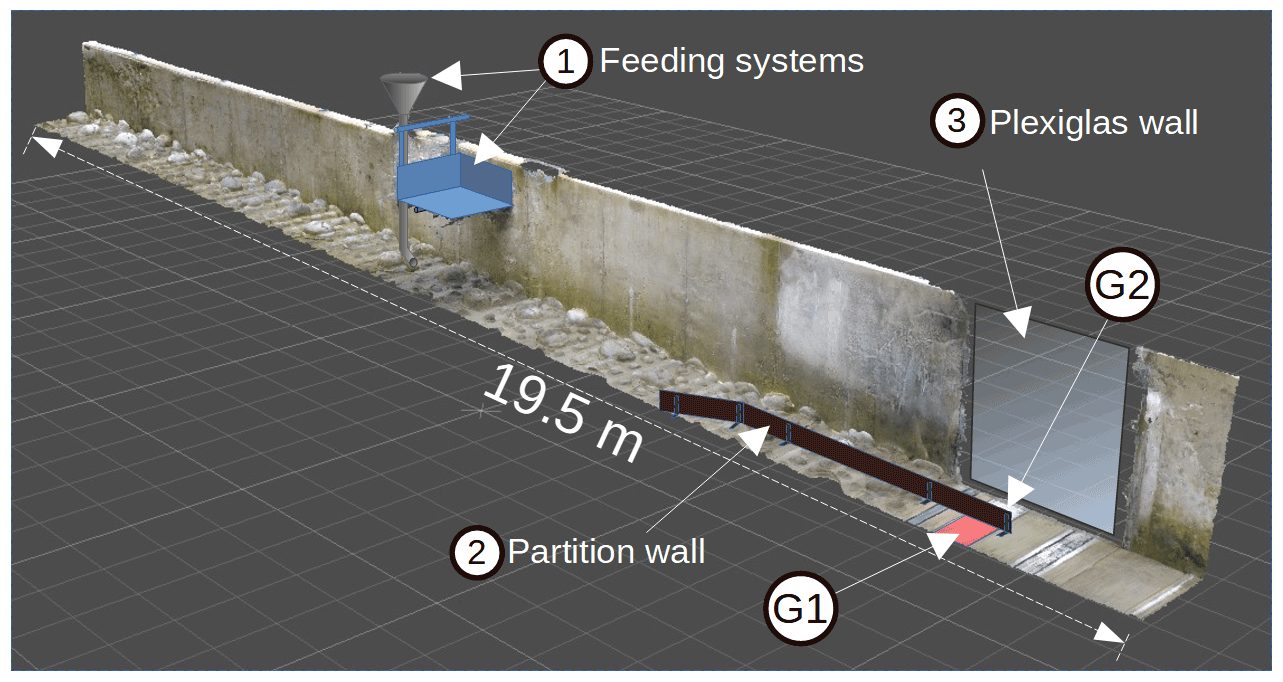
Figure 3Oblique view of the Obernach flume test reach with a total length of 24 m and width of 1 m. The bed surface is paved with particles with diameters equaling the characteristic D67 and D84 sizes of the natural beds of the reconstructed sites. Grains were fed into the channel 8 m upstream from the SPG system location (G1 and G2) using either a vertical feed pipe or a tiltable basket (1). The sensor plate G1 (in red) was shielded from direct particle impacts by the 4 m long partition wall (2). The partition wall and the impact plates were decoupled from each other by a 2 mm vertical gap to prevent disturbances of the recorded signal. Plexiglas walls (3) on each side of the flume facilitated video recordings of the experiments.
Table 2Flume and hydraulic characteristics for the reconstruction of the Albula and Avançon de Nant field sites.

a On the basis of line-by-number pebble counts at the natural site and a photo-sieving-based granulometric analysis with BASEGRAIN software (Detert and Weitbrecht, 2013). b Flow velocities measured with the OTT MF Pro magnetic-inductive flowmeter.
2.3 Flume experiments
The first part of the signal conversion procedure described in this study is based on flume experiments conducted at the outdoor flume facility of the Oskar von Miller Institute of TU Munich in Obernach, Germany. There, we reconstructed the bed slope and bed roughness of the Albula, Navisence, and Avançon de Nant field sites one after another in a flume test reach with dimensions of 24 m × 1 m equipped with two impact plates at the downstream end of a paved section (Fig. 3). For each site reconstruction, we tested bedload material collected during field calibration measurements, and we adjusted the flow velocity, flow depth, and bed roughness (D67 and D84) to match the respective field observations. A detailed description of the original flume setup and the performed experiments can be found in Nicollier et al. (2020). In the present study, we primarily use a set of experiments conducted in 2018 with the flume configured to match conditions at the Albula field site (Table 2). These experiments were single-grain-size experiments and consisted of feeding the flume with a fixed number of grains for each of the 10 particle size classes described in Sect. 2.4 below. Two different feeding systems were used, namely a vertical pipe and a tiltable basket (for particles larger than 31.4 mm). While these particles were transported over the SPG system, the full raw geophone signal was recorded. The experiment duration ranged from 15 s for the smallest particles to around 1 min for the largest particles. Up to 33 repetitions were conducted until a representative range of amplitude and frequency values for each grain-size class was obtained (Nicollier et al., 2021). The same procedure was repeated for two different flow velocities (Vf=1.6 and 2.4 m s−1). The obtained information was then used to derive empirical relationships between the mean particle size Dm,j for a given grain-size class j and properties of the SPG signal, as described in Sect. 2.5.2 below.
To illustrate the AF and AH methods and their respective performance, we use a second set of flume experiments, which mimics the Avançon de Nant field site. The main difference to other experimental setups is the presence of a 4 m wooden partition wall along the center of the flume (Fig. 3) that shields one geophone plate from impacting particles (Nicollier et al., 2022). This special setup facilitates the characterization of the signal propagated from an impacted plate to the neighboring non-impacted plate. With this modified setup, single-grain-size experiments were run (n=51; Table 2) using grains from each of the 10 particle size classes and bedload material sampled at the Avançon de Nant field site. The flow velocity was set to 3 m s−1 to facilitate particle transport through the narrower flume section and is therefore not representative of the Avançon de Nant site, where typical flow velocities were roughly 1.3 m s−1.
2.4 The amplitude histogram method
Wyss et al. (2016a) introduced the packet-based amplitude histogram (AH) method to derive grain-size information from geophone signals. A packet is defined as a brief interval, typically lasting 5 to 30 ms, reflecting a single particle impact on a plate (Fig. 1b); it begins and ends 20 time steps before and after the signal envelope crosses a threshold amplitude of 0.0216 V. The signal envelope is computed in Python with the Hilbert transform (Jones et al., 2002), yielding the magnitude of the analytic signal, i.e., the total energy. Each packet's maximum amplitude is then used to assign it to a predefined amplitude class j delimited by amplitude histogram thresholds thah,j (Table 3), yielding a packet-based amplitude histogram (e.g., Fig. 4 in Wyss et al., 2016a). Each amplitude class j is related to a corresponding grain-size class through the following relationship between the mean amplitude Am,j [V] and the mean particle size Dm,j [mm]:
The coefficients in Eq. (1) were determined using 31 basket samples collected at the Erlenbach for which the maximum geophone amplitude was analyzed as a function of the b axis of the largest particle found in the sample (Wyss et al., 2016a). The grain-size classes are delimited by the size of the meshes Dsieve,j used to sieve the bedload samples from field calibration measurements. For a given bedload sample, it is assumed that the number of packets between two amplitude histogram thresholds thah,j is a good proxy for the fractional bedload mass between the respective sieve sizes (Wyss et al., 2016a). In the present study, we have extended the 7 size classes used by Wyss et al. (2016a) to 10 classes in order to also assess the performance of the AH and AF methods for larger particles.
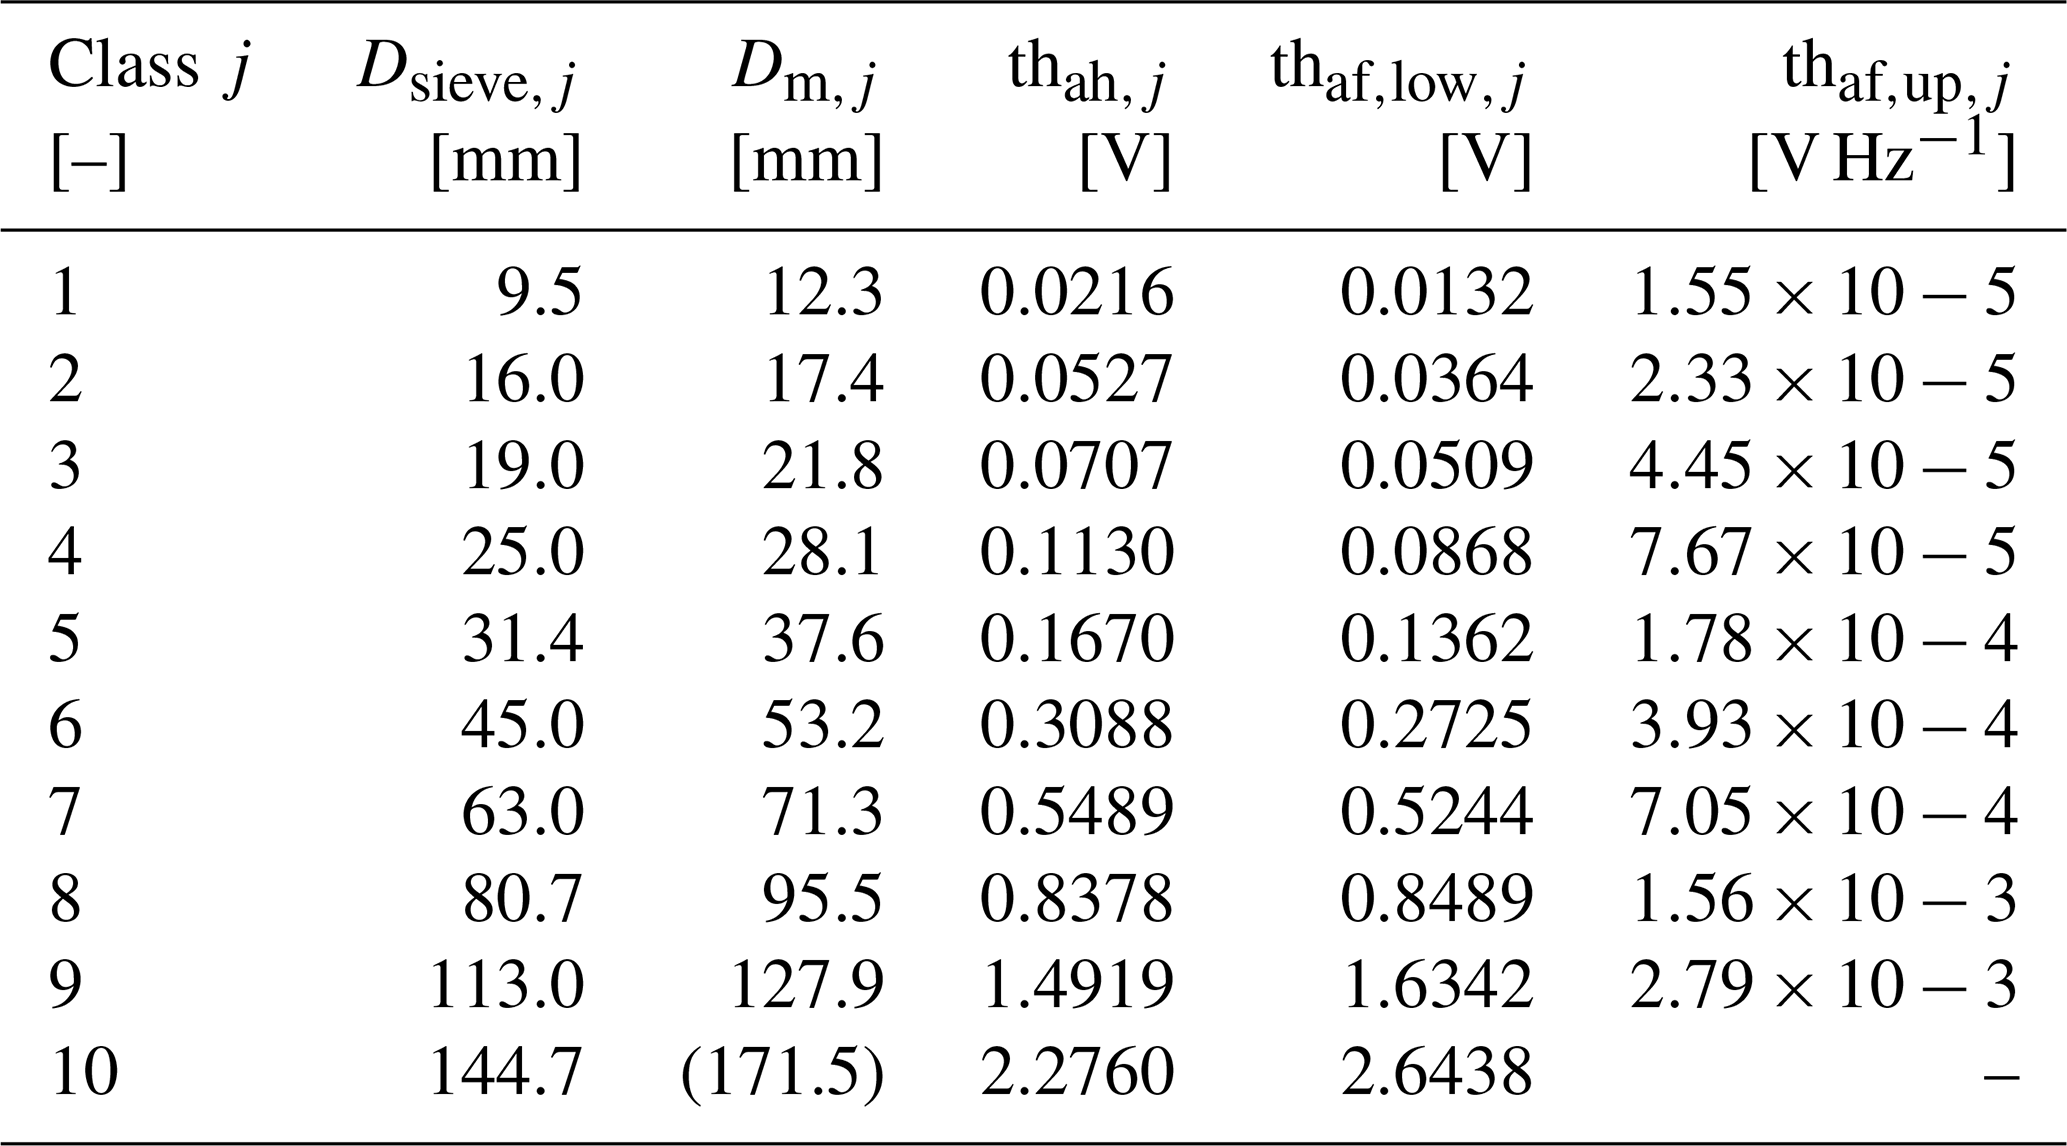
Table 3Characteristics of the size classes j according to Wyss et al. (2016a) with the sieve mesh sizes Dsieve,j, the mean particle diameter Dm,j, and the amplitude histogram thresholds thah,j derived from Eq. (1). Additionally, the lower and upper amplitude–frequency thresholds and respectively derived from Eqs. (4) and (5) are provided (see Sect. 2.5.2). The value of Dm,j for the largest class (10) in brackets is an estimate because this size class is open-ended, and as such the mean varied somewhat from site to site.
2.5 The amplitude–frequency method
In a recent study, Nicollier et al. (2022) showed that the SPG system is sensitive to extraneous particle impacts despite the isolating effect of the elastomer. Extraneous signals at individual geophone plates can arise from impacts occurring on neighboring plates or from impacts on the concrete sill surrounding the SPG array. While attenuated to some extent, the elastic waves generated by such impacts can reach multiple geophone sensors with enough energy to be recorded as apparent packets. Thus, packet histograms (i.e., counts of the number of packets per class j) are subject to a certain bias, especially in the lower size classes. The degree of bias was found to depend mainly on two factors. First, coarser grain sizes of transported bedload were shown to generate more apparent packets. Second, more apparent packets were recorded for a given bedload mass at transects containing more SPG plates. Nicollier et al. (2022) showed that packet characteristics such as the start time, amplitude, and frequency help in identifying apparent packets and filtering them out from the final packet histograms. This filtering method was subsequently applied to all four field calibration datasets (Albula, Navisence, Avançon de Nant, and Erlenbach) and helped to reduce the differences between the site-specific mean calibration relationships for the total bedload flux by about 30 % (Nicollier et al., 2022). Based on these observations, the present study proposes an amplitude–frequency (AF) method as an adaptation of the amplitude histogram (AH) method presented by Wyss et al. (2016a). By introducing two-dimensional (amplitude and centroid frequency) size class thresholds, the new method aims to reduce the effect of apparent packets and improve the accuracy of fractional bedload flux estimates. Note that the procedure does not allow for the differentiation of multiple particles impacting one plate simultaneously, but the high recording frequency (10 kHz) of the SPG system minimizes its probability of occurrence.
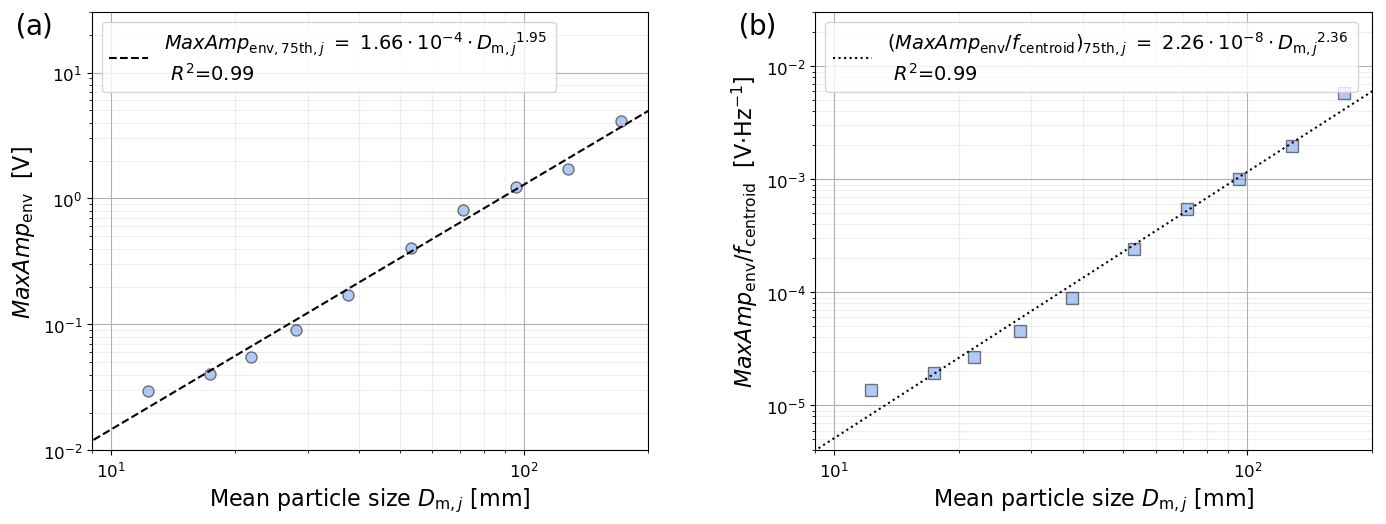
Figure 4Power-law least-squares regression relationships between the mean particle diameter Dm,j and the 75th percentile of the packets' amplitude (a) and amplitude–frequency (b) values obtained from the single-grain-size experiments after filtering out apparent packets using the filtering criterion in Eq. (3).
2.5.1 Centroid frequency
According to the Hertz contact theory, the frequency at which a geophone plate vibrates is controlled by the size of the colliding particle (Johnson, 1985; Thorne, 1986; Bogen and Møen, 2003; Barrière et al., 2015; Rickenmann, 2017). In the present study, the frequency spectrum of a packet is characterized by the spectral centroid fcentroid. It represents the center of mass of the spectrum and is computed as
where AFFT,n [V ⋅ s] is the Fourier amplitude (computed with the fast Fourier transform – FFT) corresponding to the frequency fn [Hz]. Following Wyss et al. (2016b), before applying the FFT, each packet is preprocessed in two steps. First, a cosine taper is applied at the edges of a max. 8 ms time window around the peak amplitude of each packet. Second, the signal contained in this time window is zero-padded on either side to reach an optimal number of sample points nFFT. The taper is used to smooth the transition between the packet and the concatenated zeros and to suppress spectral leakage, which results in a more accurate amplitude spectrum. The value of nFFT was set to 27 in order to adequately resolve the amplitude spectrum of the raw signal contained in the max. 8 ms time window. This time window focuses on the first-arrival waveform to obtain a more accurate evaluation of the high-frequency content of the packet (Nicollier et al., 2022). The single-sided Fourier transform of the processed packet is then computed in order to extract AFFT and derive fcentroid (Eq. 2). A decrease in fcentroid with increasing particle size was observed for different bedload surrogate monitoring techniques (Belleudy et al., 2010; Uher and Benes, 2012; Barrière et al., 2015). Furthermore, fcentroid has the advantage of showing weaker dependency on the flow velocity and transport mode than the maximum registered packet amplitude (Wyss et al. 2016b; Chen et al., 2022). As shown by Nicollier et al. (2022), fcentroid also contains information about the impact location of a packet-triggering particle. Because high frequencies are more rapidly attenuated than low frequencies along the travel path of a seismic wave (apparent), packets triggered by impacts on a given plate typically have higher fcentroid values than packets triggered by impacts occurring beyond that plate's boundaries.
2.5.2 Flume-based amplitude–frequency thresholds
The particle mass associated with an individual signal packet is strongly dependent on the size of the impacting particle. Inferring sediment transport rates from SPG signals thus requires assigning each packet to a corresponding sediment size class using threshold values of packet characteristics (Table 3). Wyss et al. (2016a) derived size class thresholds (or AH thresholds) of packet peak amplitude from field measurements (Eq. 1). In the present study, we take advantage of the single-grain-size experiments conducted at the flume facility (without the partition wall) (Nicollier et al., 2021) to derive size class thresholds combining packet amplitude and frequency (or AF thresholds). Each packet is assigned to a given class j delimited by a lower threshold based on the maximum amplitude of the packet's envelope MaxAmpenv [V] and an upper threshold based on the ratio [V Hz−1]. Compared to the raw signal, the envelope has the advantage of returning the magnitude of the analytical signal and thus better outlines the waveform by omitting the harmonic structure of the signal (Fig. 2b). Similar combinations of amplitude and frequency have been used to infer particle sizes and improve the detectability of bedload particles in previous studies involving impact plates (Tsakiris et al., 2014; Barrière et al., 2015; Wyss et al., 2016b; Koshiba and Sumi, 2018) and pipe hydrophones (Choi et al., 2020).
The lower and upper amplitude–frequency thresholds are obtained as follows. First, all packets recorded during the single-grain-size experiments are filtered with respect to the following criterion adapted from Nicollier et al. (2022):
with ac=1980 Hz and V−1. The values of the linear coefficient ac and the exponent bc were obtained through an optimization process discussed below (Sect. 4.1) and were found to best separate apparent packets from real packets. Packets identified as apparent packets using this criterion are ignored in the further analysis in order to obtain more accurate threshold values. Note that in the present study, the criterion in Eq. (3) has not been applied to the data when implementing the AH method developed by Wyss et al. (2016a).
The next step consists of fitting a power-law least-squares regression line through the 75th percentile amplitude and amplitude–frequency values of the packets detected for a given grain-size class j fed into the flume that met the filtering criterion (Fig. 4), resulting in the following two equations:
Finally, the lower threshold values are obtained by replacing Dm,j in Eq. (4) with the lower sieve sizes Dsieve,j, while the upper threshold values are obtained by replacing Dm,j in Eq. (5) with the upper sieve sizes (Table 3 and triangles in Fig. 5). Fitting functions such as Eqs. (4) and (5) allows for the computation of thresholds for any classification of particle (sieve) sizes.
When considering all the packets detected for a given grain-size class, it was found that apparent packets can greatly outnumber real packets. This is particularly pronounced for the largest grain sizes because the energy released by their impact, especially outside the plate boundaries, is more likely to be detectable by the geophone sensors. Due to signal attenuation, however, these numerous apparent packets have relatively small amplitudes, which substantially dilutes the average signal response associated with the largest grain sizes (Fig. 5). However, filtering out apparent packets reveals a rather clear relationship, which would otherwise be obscured, between the mean particle size Dm,j and both the amplitude MaxAmpenv and the ratio (Fig. 5). Overall, the filtering with criterion (Eq. 3) at the Obernach flume site eliminated about 61 % of all the packets.

Figure 5Range of signal responses obtained for each individual grain-size class fed into the flume before (red boxes) and after (blue boxes) filtering out apparent packets using the filtering criterion in Eq. (3), with (a) the maximum amplitude of the envelope MaxAmpenv and (b) the ratio as functions of the mean particle diameter Dm,j. In (a), the lower threshold values are obtained by replacing Dm,j with the lower sieve sizes (Dsieve,j) in the equation of the dashed power-law regression line (Eq. 4). In (b), the upper threshold values are obtained by replacing Dm,j with the upper sieve sizes () in the equation of the dotted power-law regression line (Eq. 5).
2.5.3 Application to field calibration measurements
The lower and upper thresholds and obtained from the filtered flume experiments can be transferred to the field datasets if the SPG apparatus and the geophone data recording and preprocessing routines are identical in both cases. The following steps allow us to derive the final general calibration coefficients (Fig. 6). First, for each field measurement i, the thresholds and are used for counting the number of packets per class from the recorded geophone signal. Second, a sample- and class-specific calibration coefficient (units: kg−1) is obtained by dividing the number of recorded packets PACKi,j by the sampled fractional mass as follows:
Finally, the general calibration coefficient is computed for each class j using
where is the site-specific median calibration coefficient computed over all samples i, and Nstations is the number of stations. Even though the number of calibration measurements differs from site to site, each coefficient in Eq. (7) is equally weighted in order to give the same importance to site-specific factors possibly affecting the signal response at each site.

Figure 6Workflow leading from the single-grain-size flume experiments with particles from 10 size classes j (top right) to the final array of general calibration coefficients . Central elements are the lower and upper threshold values and , the number of recorded packets PACKi,j per sample i and class j, the sampled fractional mass , the sample- and class-specific calibration coefficient , and finally the site-specific median calibration coefficient . To enable a comparison with the AH method developed by Wyss et al. (2016a), the “field calibration” part of the workflow was also carried out with the AH thresholds thah,j (see Table 3).
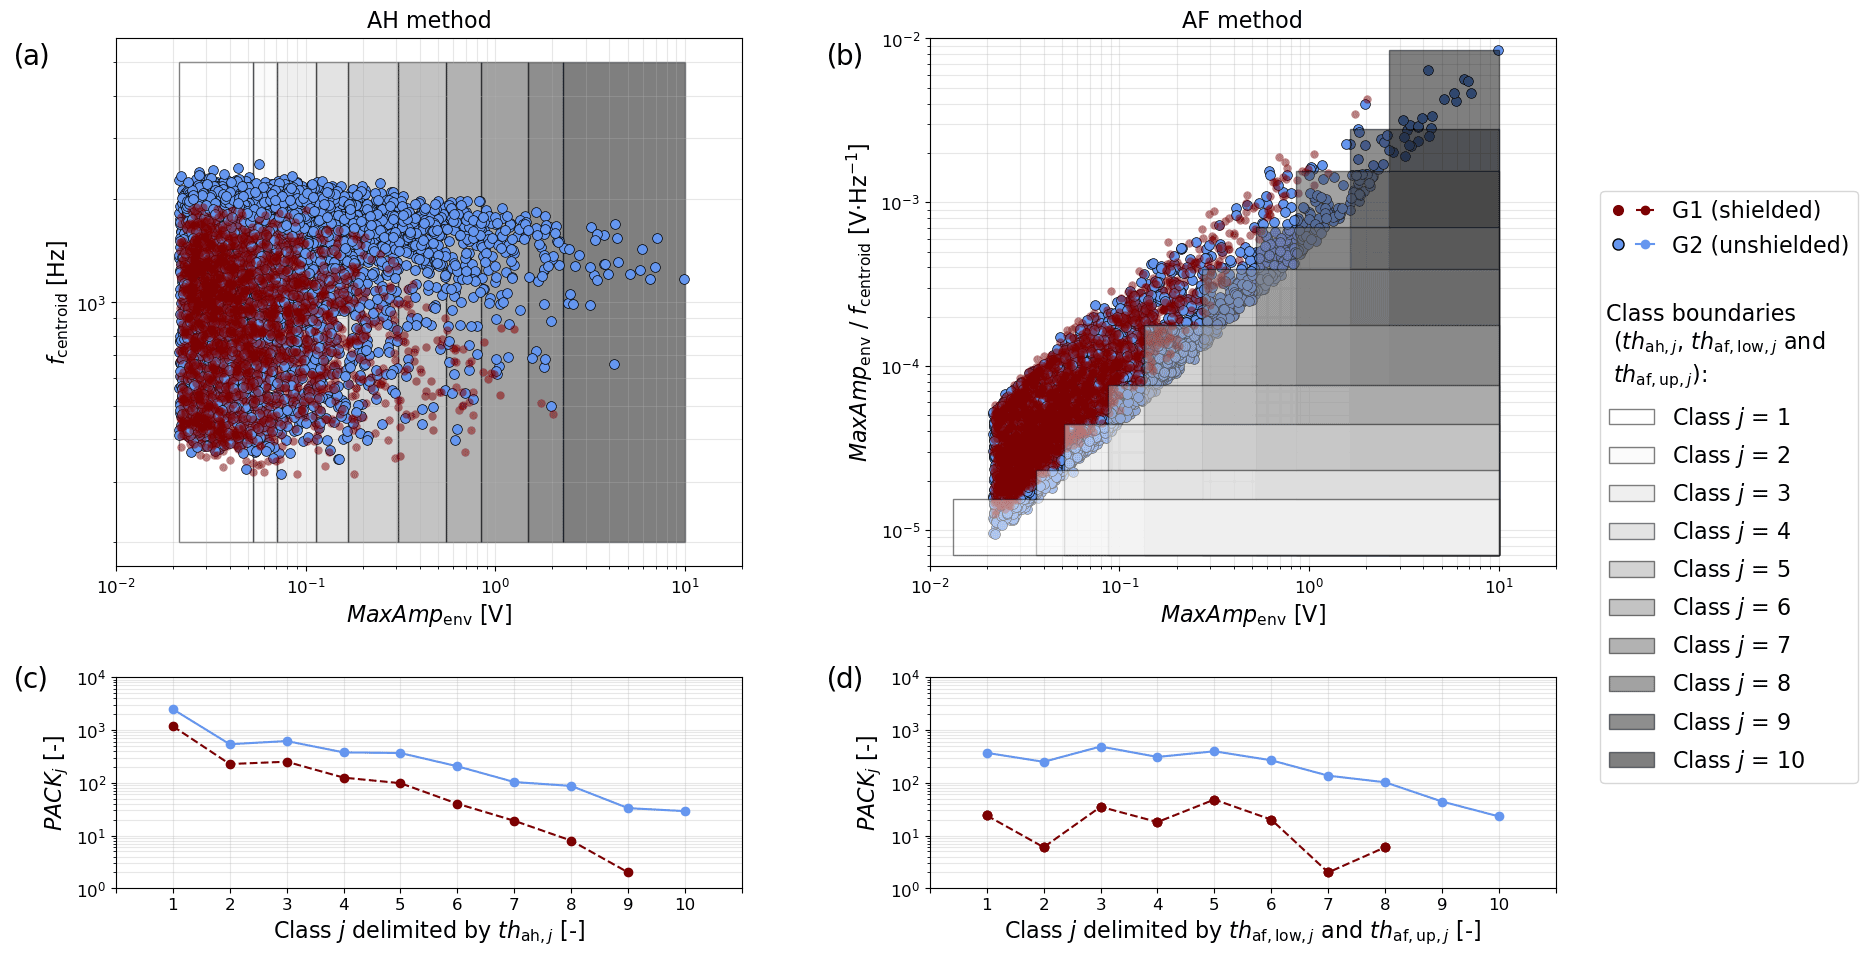
Figure 7Characteristics of the packets recorded during single-grain-size experiments conducted with the Avançon de Nant flume setup using the partition wall, with the maximum amplitude of the envelope MaxAmpenv and the centroid frequency fcentroid. The red and blue dots correspond to packets recorded by the shielded plate G1 and the unshielded plate G2, respectively. The grey rectangles are the class boundaries delimited by the thresholds obtained for the AH method (a) and the AF method (b). The number of packets PACKj located within the class boundaries delimited by the AH thresholds and the AF thresholds are indicated in (c) and (d), respectively. In (a), fcentroid is shown as a function of MaxAmpenv for information purposes only.
At this point, the single array of calibration coefficients is applied as follows to each field calibration measurement i in order to obtain fractional bedload mass estimates :
Rickenmann and Fritschi (2017) showed that bedload mass estimates derived from SPG measurements are more accurate at higher transport rates. The estimated fractional bedload mass can be converted to a unit fractional transport rate [kg m−1 s−1] using
where wp is the standard width of an impact plate (0.5 m), np is the number of plates (which may include the whole transect or a section of particular interest), and Δti is the sampling duration in seconds. Finally, the estimated unit total bedload flux can be computed as follows:
Note that the exact same procedure was followed using the AH thresholds thah,j derived from Wyss et al. (2016a) (Eq. 1; Table 3) to compare the performance between the AH method and the new AF method.
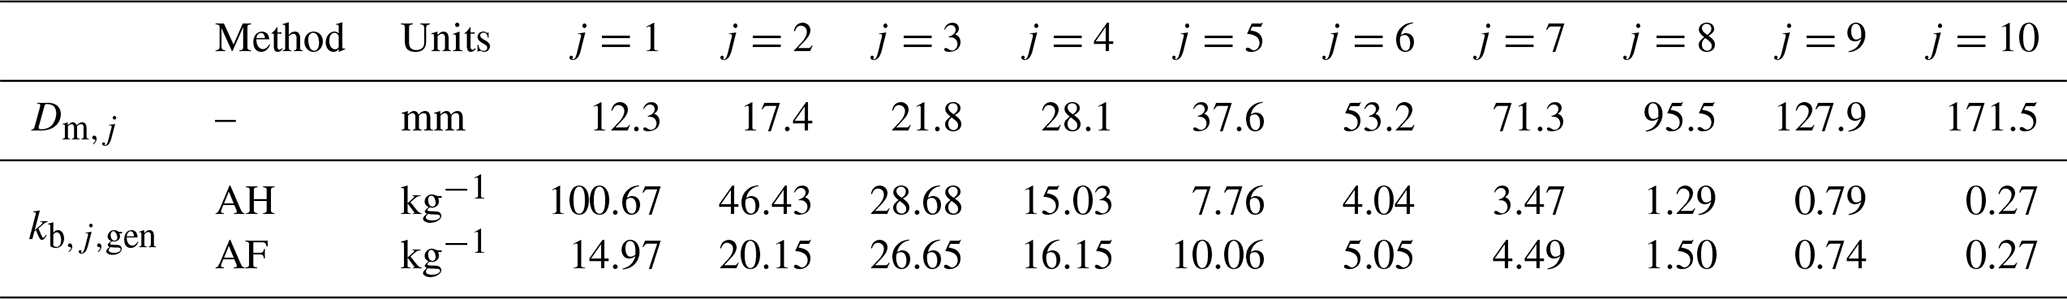
Table 4General calibration coefficients obtained for each grain-size class j with the AH method and the AF method using Eq. (7). Dm,j indicates the mean particle diameter of each grain-size class j.
3.1 Flume experiments
The flume experiments performed in the modified Avançon de Nant setup with the partition wall help to illustrate the performance of the two calibration methods. Figure 7a and b show the amplitude and frequency characteristics of all packets detected by the SPG system during these experiments. Packets detected by the shielded sensor G1 all originate from impacts that occurred either on the concrete bed or on plate G2 (Fig. 3; Nicollier et al., 2022). Packets detected by the unshielded sensor G2 are considered apparent if they are located in the area of the amplitude–frequency graph (Fig. 7a) where G1 and G2 packets overlap. Such packets are presumed to have been triggered by impacts on the concrete bed. This overlapping area arises from the fact that a seismic wave generated by an impact on the concrete bed follows a similar path towards both sensors, resulting in the recording of two apparent packets with comparable characteristics. The remaining packets, detected by G2 and located in the non-overlapping area of the amplitude–frequency graph, are considered real. The difference in fcentroid between real and apparent packets (Fig. 7a) reflects the faster attenuation of higher frequencies during wave propagation. Size class boundaries derived by the AH method of Wyss et al. (2016a) encompass all of the packets, both apparent and real (Fig. 7a). This is because the boundaries are defined solely by AH thresholds (thah,j). By contrast, in the AF method proposed here, the two-dimensional class boundaries given by and cover only a fraction of all detected packets (Fig. 7b). Applying the step-like AF thresholds leads to a strong reduction of the number of packets PACKj within each size class j for plate G1 (shielded), particularly for the smaller classes. Meanwhile, the AF thresholds had little effect on the number of detected packets for G2 (unshielded), except for a strong decrease for classes j=1 and 2 and a slight increase for classes j=6 to 10 (Fig. 7c and d). The AH thresholds encompass in total 1945 packets for the shielded geophone G1 and 4823 packets for the unshielded geophone plate G2. In comparison, the AF thresholds encompass in total 159 packets for the shielded geophone G1 and 2202 packets for the unshielded geophone plate G2 (counting the packets in the overlapping class boundaries only once). Considering apparent packets to be noise and real packets to be signal, applying the new AF method results in an increased signal-to-noise ratio, as shown by the larger vertical separation between the blue (signal) and red (noise) lines in Fig. 7d compared to 7c.
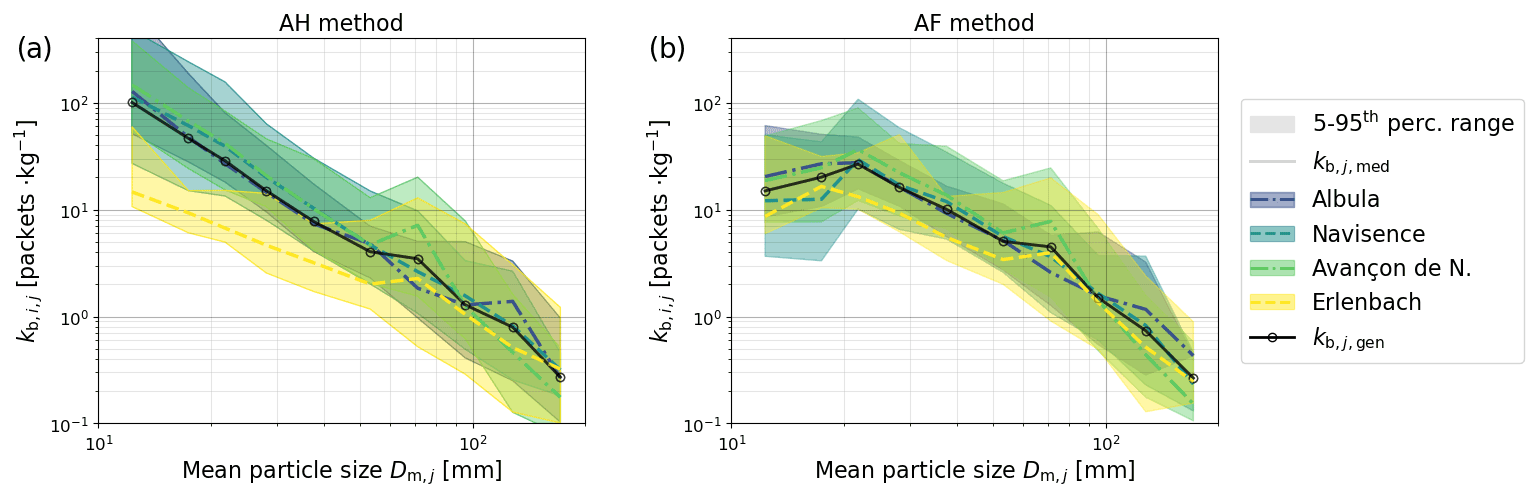
Figure 8The calibration coefficients obtained with the AH method (a) and the AF method (b) for each field site. The colored areas indicate the range between the 5th and 95th percentile values, the full lines indicate the site-specific median coefficients , and the black dashed lines indicate the final general calibration coefficients as a function of the mean particle diameter Dm,j of each grain-size class j.
3.2 Field calibration coefficients
As discussed in the previous section, the number of packets PACKi,jdetected for a given class j varies together with the thresholds thah,j, , and . Because the measured fractional bedload mass remains constant, the calibration coefficients will depend on the number of packets detected and thus on the thresholds that are used to classify them. We can make the following observations regarding the calibration coefficients obtained using the AF method compared to the AH method (Fig. 8). First, the coefficients of the smaller size classes are substantially lower, meaning that fewer packets per unit mass are detected. Second, for the larger size classes, slightly more packets are detected per unit mass. Third, the overall scatter of the coefficients across all sites is smaller, in particular for the six smallest classes j. This is reflected in the decrease in the mean coefficient of variation (CV) across all classes j and all sites from CV = 1.17 (in the AH method) to CV = 0.93 (in the AF method). Fourth, the scatter of the site-specific coefficients is usually smaller. This is supported by the change in the mean CV across all classes from 0.89 to 0.54 for Albula, from 0.83 to 0.75 for Avançon de Nant, and from 1.31 to 1.00 for the Erlenbach between the AH and AF methods. The mean CV for the Navisence site, however, remains unchanged at 0.85. The general coefficients obtained from the site-specific median coefficients using Eq. (7) are listed in Table 4.
Table 5Performance of the AH method and the AF method regarding fractional flux estimates for each class j with the following parameters: the linear coefficient a, the exponent b and the correlation coefficient r of the power-law regression lines visible in Fig. 9, the coefficient of determination R2, the root mean square error RMSE, and the percentage of all detected samples for which the estimated value differs from the measured value by less than a factor of 2 and 5 pfactor_2 and pfactor_5, respectively. These values were first computed for each site separately and then averaged over all four sites. The number of measured Nsamples,meas and the number of estimated samples Nsamples,est showing a positive unit fractional rate were summed over all four sites.
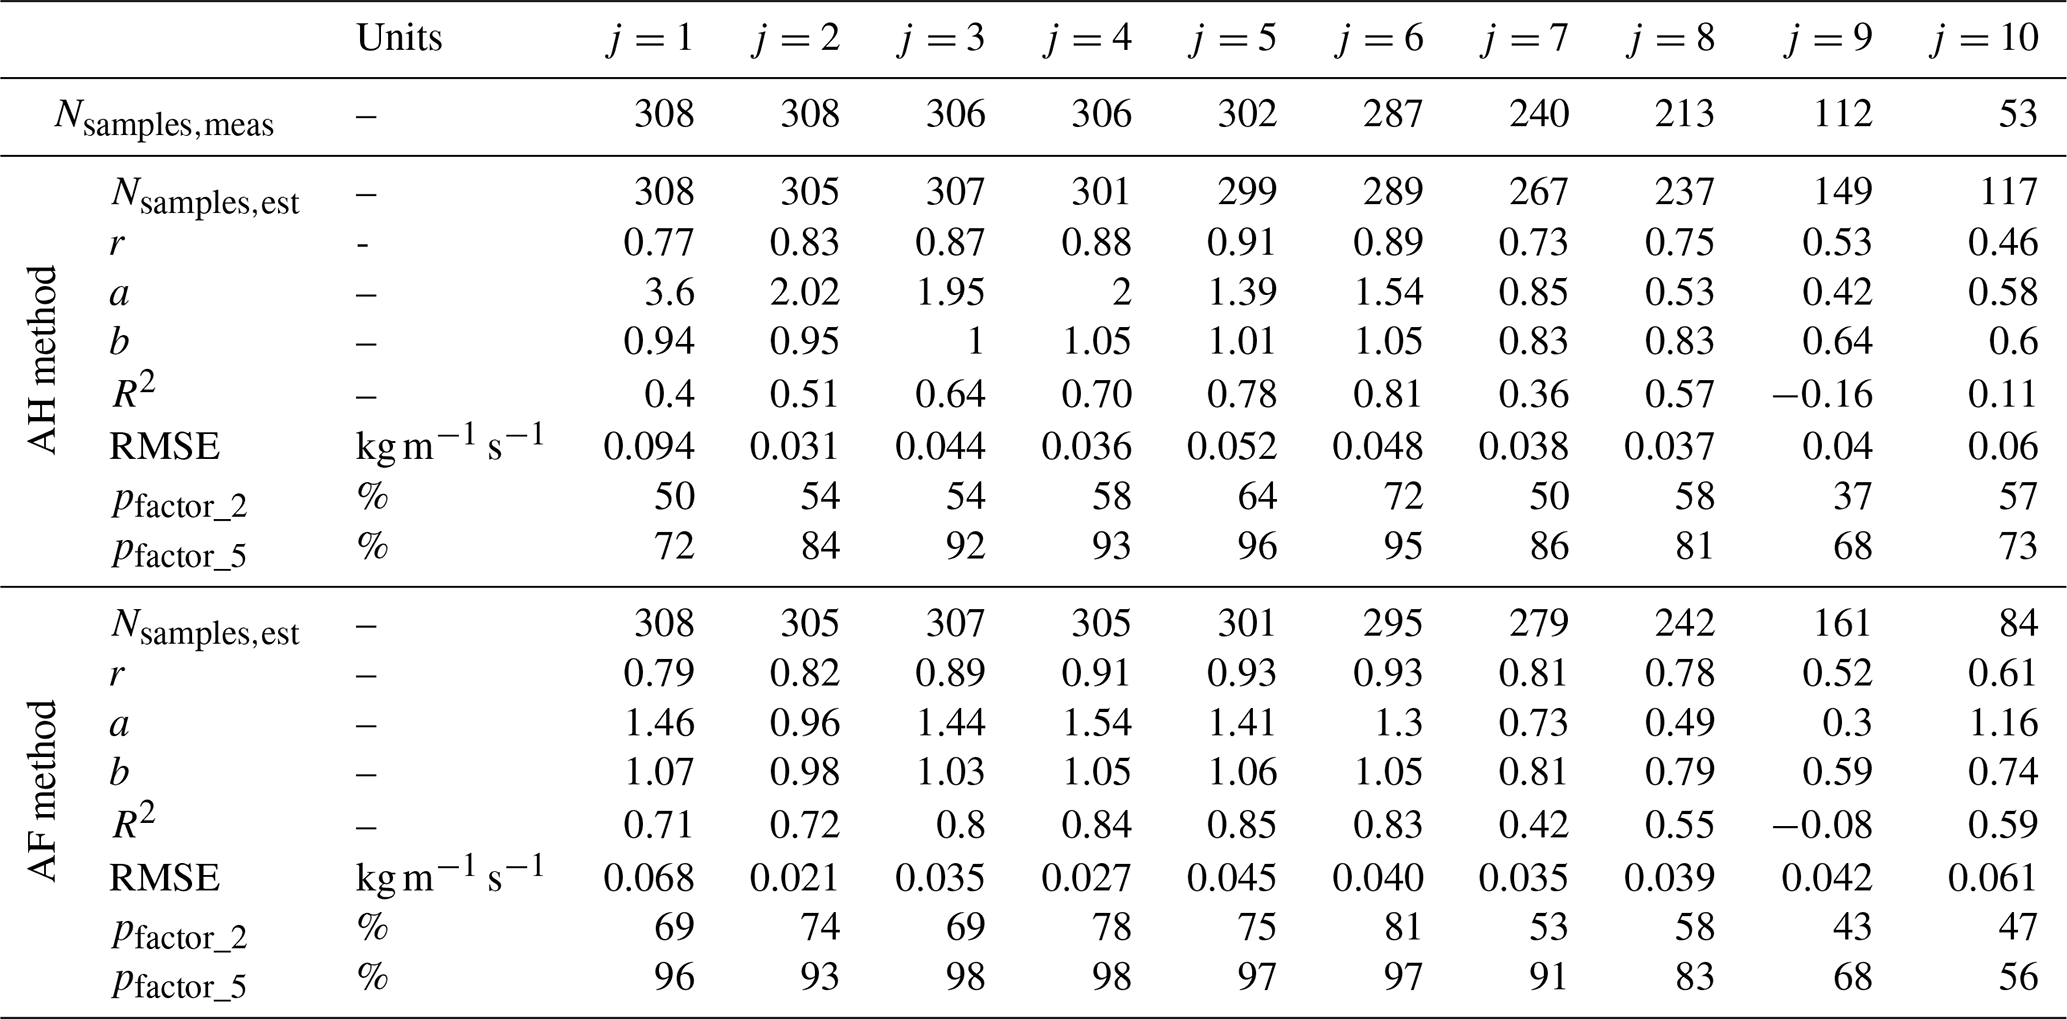
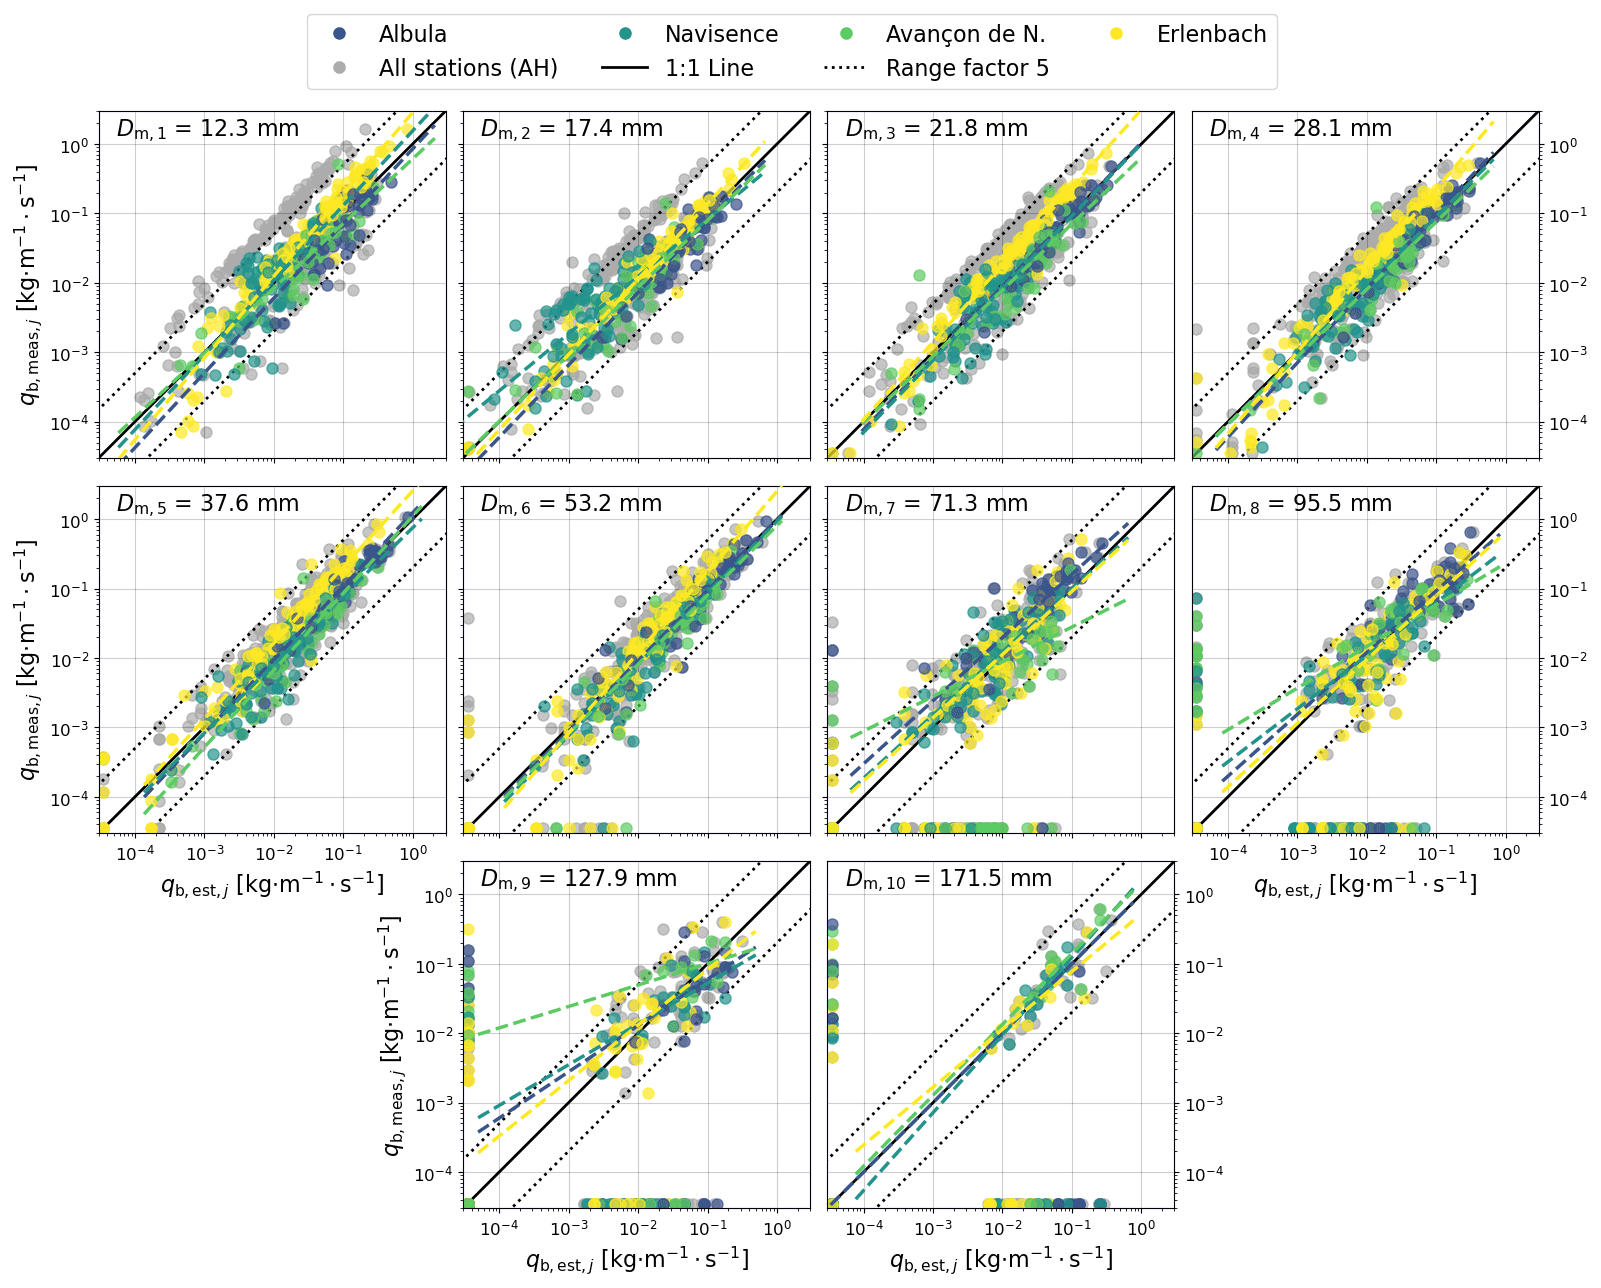
Figure 9Unit fractional transport rate estimates obtained with the AF method for each size class j and each station. The light grey dots in the background indicate the estimates obtained with the AH method and are represented in more detail in the Supplement (Fig. S1). Each panel is annotated with the mean particle size Dm,j of the represented class. The solid black lines correspond to the reference 1:1 line, while the dotted lines delimit factors of 5 above and below it (from 0.2 to 5). The dashed colored lines are power-law regression lines; the mean coefficients over all four sites are listed in Table 5. The dots along the axes indicate samples for which either the measured or estimated unit fractional flux equals 0. These samples are not considered for the computation of the trend lines.
3.3 Bedload flux estimates
We can now apply the general calibration coefficients in Eq. (8) to compute fractional bedload mass estimates and subsequently estimates of the fractional flux per unit width (Eq. 9) for every sample collected at the four field sites (Fig. 9). The results obtained with the AH method can be found in Sect. S3 in the Supplement, and Table 5 provides further information on the performance of the two methods.
When applied to the field calibration data, the AF method generally yields more accurate flux estimates than the AH method does, particularly for the five smallest grain-size classes. This improvement is most notably reflected by the coefficient of determination R2 values, describing the accuracy of the estimates relative to the 1:1 line (Table 5). R2 increased from 0.4 to 0.71 for class j=1 and from 0.51 to 0.72 for class j=2, but by contrast, R2 decreased slightly from 0.57 to 0.55 for class j=8. The root mean square error (RMSE), which quantifies the expected error of the estimates, leads to similar observations (Table 5). The RMSE decreased from 0.094 to 0.068 kg m−1 s−1 for class j=1 and from 0.031 to 0.021 kg m−1 s−1 for class j=2, but increased slightly from 0.037 to 0.039 for class j=8. A further interesting result is the increase for the first eight classes of the percentage pfactor_5 of all detected samples, whose estimated bedload fluxes differ by less than a factor of 5 from the measured values (Fig. 9; Table 5).
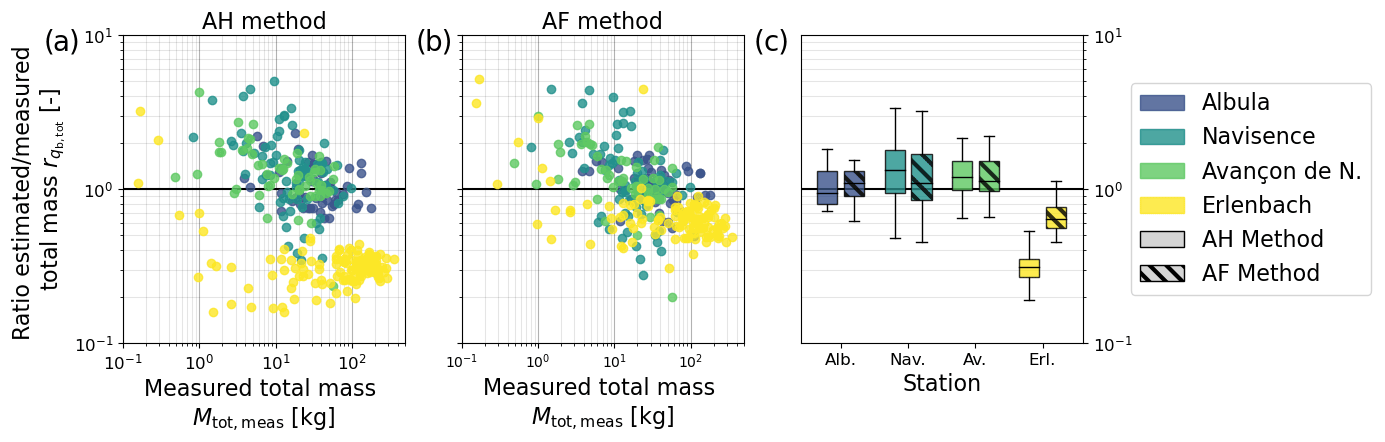
Figure 10Ratio between the estimated and measured unit total mass flux as a function of the total sampled mass Mtot,meas for each collected sample i and each station with the AH method (a) and the AF method (b). The box plots on the right (c) indicate the range of values obtained for each station. The boxes in solid colors show the results obtained with the AH method, and the hatched boxes show the results obtained with the AF method.
Aside from these comparative observations, it is also worth mentioning the following more general findings that are valid for both methods. (i) For most size fractions, the relative scatter of the estimates (on the log–log plots) decreases with increasing transport rates. (ii) At low transport rates, mass fluxes are generally overestimated, while at high transport rates they are generally underestimated. This is shown by the dashed colored power-law regression lines shown in Fig. 9, described by the corresponding linear coefficient a and exponent b in Table 5. (iii) As indicated by the yellow dots and regression lines in Fig. 9, mass fluxes for the Erlenbach closely follow the 1:1 line but tend to be slightly underestimated. (iv) The numbers of measured (Nsamples,meas) and estimated (Nsamples,est) samples both decrease with increasing particle size. While more than 300 samples were measured and estimated for each of the five smallest grain-size classes, these numbers gradually decrease to around 100 for the largest class j=10. Furthermore, samples for which either the measured or estimated flux equals 0 are indicated as dots along the axes in Fig. 9. If the measured flux is zero but the estimated flux is positive, the sample can be regarded as a false positive (Fawcett, 2006). The difference between Nsamples,meas and Nsamples,est in Table 5 indicates that the occurrence of such false positive samples increases with increasing particle size. Further performance metrics derived from the confusion matrix can be found in the Supplement (Table S2).
As indicated by Eq. (10), the unit total flux estimates are computed as the sum of the unit fractional flux estimates over all 10 classes. Figure 10 shows the ratio between the estimated total flux and the measured total flux for all 308 calibration samples as a function of the sampled total mass Mtot,meas. Here, the estimates for the Albula, Navisence, and Avançon de Nant sites are slightly more accurate with the AF method than with the AH method, whereas the estimates for the Erlenbach improve substantially, with the median value increasing from 0.31 to 0.64. Note that the observations (i) to (iii) made earlier regarding the fractional flux estimates are also valid here. Figure 10 also provides an interesting overview of the sampled masses at all four stations, reflecting the capacities of the different devices (automated and manual basket samplers as well as a crane-mounted net sampler) used to collect the calibration samples.
3.4 Grain-size estimates
We can combine the SPG bedload flux estimates for all grain-size fractions and thus derive grain-size distributions, which can then be compared to the measured size distributions of each calibration sample. Figure 11 compares the performance of the AH and the AF methods in estimating the characteristic grain sizes D30, D50, D67, and D84 (where Dx is the grain diameter for which x percent of the sampled bedload mass is finer). The accuracy of the estimates is indicated by the ratio between the estimated and measured characteristic grain size Dx. Compared to the AH method, the AF method mainly improves the estimates of the four characteristic grain sizes for the Navisence and Erlenbach sites but has little effect at the other two sites. The largest improvement is achieved for the Erlenbach site, with the median changing from 1.37 to 1.02, the median changing from 1.48 to 1.01, the median changing from 1.46 to 1.05, and the median changing from 1.39 to 1.10. In contrast, applying the AF method to the Avançon de Nant dataset slightly reduced the accuracy of the characteristic grain-size estimates, with the median changing from 0.83 to 0.88, the median changing from 0.81 to 0.79, the median changing from 0.80 to 0.82, and the median changing from 0.85 to 0.83. The overall accuracy of the estimates decreases with increasing characteristic size Dx for both methods, and for every characteristic size Dx, the Dx tends to be overestimated for finer grain mixtures and underestimated for coarser grain mixtures.
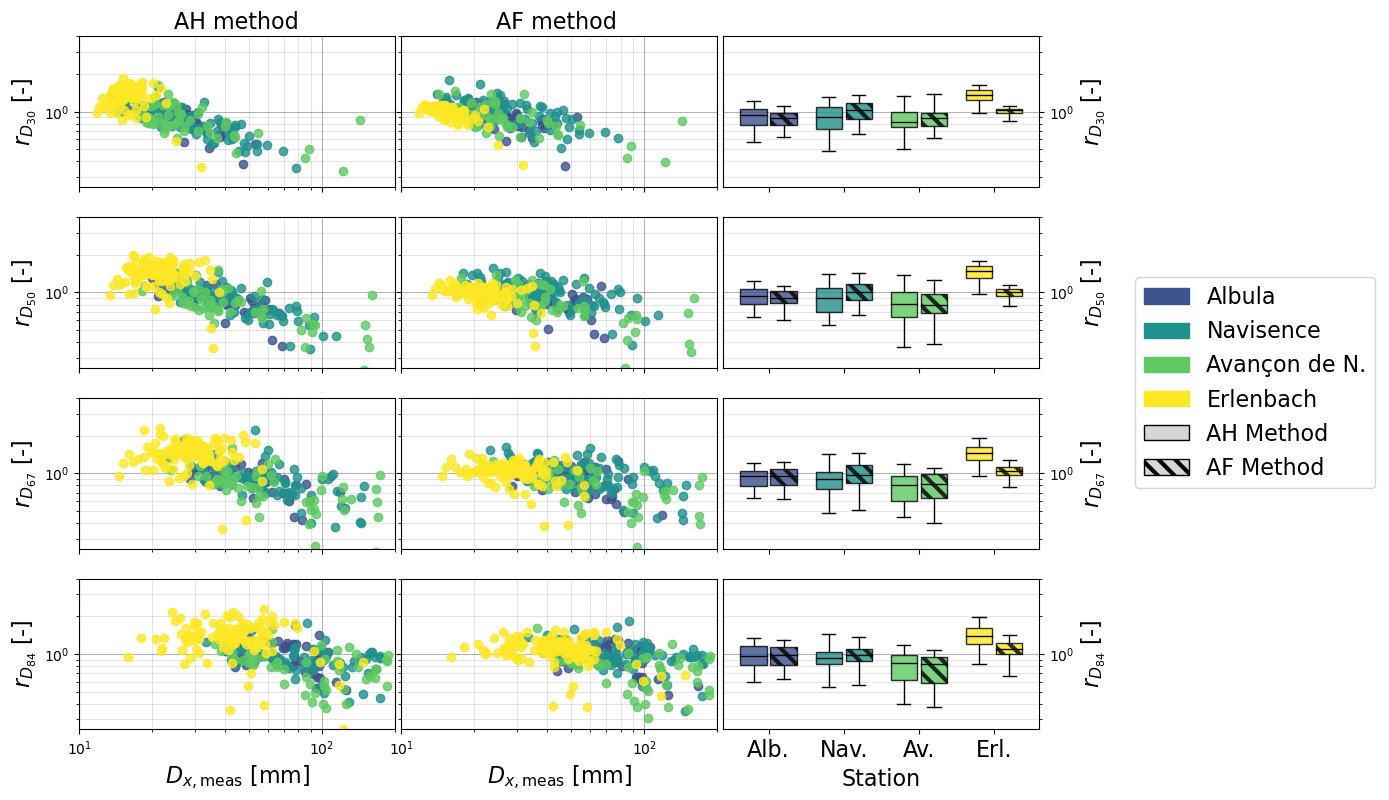
Figure 11Ratio between the estimated and measured characteristic grain sizes D30, D50, D67, and D84 as a function of the measured grain diameter Dx,meas for each collected sample i and each station using the AH method (column 1) and the AF method (column 2). Dx is the grain diameter for which x percent of the sampled bedload is finer. The box plots in column 3 indicate the range of values obtained for each station. The boxes in solid colors show the results obtained with the AH method, and the hatched boxes show the results obtained with the AF method.
4.1 The hybrid calibration procedure
Recent studies have pointed out the difficulty of transferring flume-based calibrations of impact plate systems to field applications (e.g., Mao et al., 2016; Wyss et al., 2016c; Kuhnle et al., 2017). In the hybrid calibration approach presented here, we took advantage of flume experiments to obtain amplitude and amplitude–frequency thresholds for each particle size class, which were subsequently applied to field calibration datasets to derive the general calibration coefficients .
The entire hybrid calibration procedure was run iteratively until the optimal linear coefficient and exponent of the criterion (Eq. 3) used to filter out apparent packets were found (Fig. 6). As an objective function, we used an equally weighted combination of parameters describing the accuracy of bedload flux and grain-size estimates, i.e., r, R2, pfactor_2, pfactor_5, and RMSE as shown in Table 5 and as shown in Fig. 11. The accuracy is derived from the confusion matrix (Fawcett, 2006) as shown in Table S2 in the Supplement. We looked for two types of optimal calibrations. The first type is a general calibration, for which we have presented the results in Sect. 3. This calibration combines all four stations in order to investigate the feasibility of a general signal conversion procedure applicable to multiple sites equipped with the SPG system. The second type is a site-specific calibration aiming to improve the accuracy of bedload transport rate estimates at a single monitoring station, to be used for a more detailed analysis of bedload-related processes at a given site (details of these site-specific calibrations are available in Sects. S4 and S5 in the Supplement).
The biases introduced by apparent packets can be removed by site-specific calibration of the coefficients , so the AF and AH methods perform about equally well when calibrated separately to each individual site (see Sects. S4 and S5 in the Supplement). This result supports the use of the AF method, considering the large proportion of packets left out by the AF thresholds (up to 91 % in the smallest class j=1; see Table S4 in the Supplement). However, the abundance of apparent packets varies considerably from site to site owing to differences in the channel geometry, the bedload grain-size distribution, and the construction details of the individual SPG installations. Because the AF method filters out a substantial fraction of these apparent packets, it yields substantially better general calibrations than the AH method does (see Table 5).
We also tested the performance of an adapted version of the AH method introduced by Rickenmann et al. (2018). This method was originally developed for the Erlenbach site and aimed to correct for the relationship between the signal response and the transport rate. In the present study, we applied this method to each field site. The only notable improvement introduced by the adapted AH method is the increased number of detected samples at the Erlenbach station, leading to more accurate estimates of the various characteristic grain sizes Dx at this site (Tables S8 and S9 in the Supplement); the results for the other sites were not substantially improved.
4.2 Two-dimensional size class thresholds
To understand the performance of the new AF method it is worth taking a closer look at the role of the size class thresholds. As shown in Fig. 7, replacing the upper amplitude thresholds with amplitude–frequency values results in the following two important changes. First, a dimension is added, which facilitates focusing on the narrow range of signal responses characteristic for real packets and filtering out many of the apparent packets. Second, the areas of the amplitude–frequency domain covered by two adjacent classes can now overlap. Packets located in overlapping areas are assigned once to each class and therefore counted twice. This explains why both the number of detected packets PACKj (Fig. 7c and d) and subsequently the kb,j values (Fig. 8) are slightly higher when the AF method (instead of the AH method) is applied to the larger size classes. Counting such packets twice is not unreasonable, given that the ranges of signal responses recorded during single-grain-size flume experiments for two contiguous grain-size classes significantly overlap, even after apparent packets are filtered out (Fig. 5). Overlapping class boundaries therefore result in a less strict classification of the few packets that are on the edges of the grain-size classes. In Fig. 7b, out of 2256 packets recorded by G2 (blue), 144 packets have been counted twice. But interestingly, this is not true of any of the 153 packets recorded by G1 (red) within the class boundaries. A further result supports the use of the two-dimensional size class thresholds. When applying the AF method, the kb,j coefficients obtained for the different sites (Fig. 8b) reach a maximum value at the third-smallest size class. A similar yet stronger decrease towards the two smallest classes was described by Wyss et al. (2016b) and was related to the reduced detectability of the smallest particle sizes.
Through the reduced area covered by the new amplitude–frequency thresholds in Fig. 7b, a certain percentage of all the packets recorded during the field calibration experiments is neglected for general calibration: 55 % at the Albula site, 63 % at Navisence, 58 % at Avançon de Nant, and only 9 % at Erlenbach. This suggests that the plates embedded at Erlenbach pick up less noise from their surroundings. A similar trend was observed by Nicollier et al. (2022) when comparing the maximum amplitude registered by two adjacent plates for a given impact at the same location. This difference in noise detection levels is possibly accentuated by the number of impacted plates during bedload transport events. The SPG array embedded in the artificial U-shaped channel of the Erlenbach has the particularity that only 2 of its 12 plates are usually impacted by bedload particles during floods (and only sediment crossing these two plates is caught by the automatic basket sampler). At the other sites, in contrast, every 10 to 30 embedded plates are submerged by the flow and can thus potentially be impacted.
4.3 Sampling uncertainties
Even though the AF method improved the overall accuracy of flux estimates for most classes (Table 5), some trends addressed in Sect. 3 suggest that factors other than the noise level also control the accuracy of the estimates. The dataset presented in this study includes 308 calibration measurements and is to our knowledge the largest dataset gathered for any impact plate system. Still, it appears that the number of collected samples is not sufficient to accurately assess the performance of the two methods for the three largest particle size classes (Fig. 9; Table 5). This mainly relates to a higher proportion of large particles compared to finer ones in typical sediment mixtures (Rickenmann et al., 2014; Mao et al., 2016). Earlier investigations have shown that a larger number of detected bedload particles reduces the scatter of total mass estimates by averaging over stochastic factors such as the impact location on a given impact plate, the particle transport mode (sliding, rolling, saltating, etc.; Chen et al., 2022), and the impact velocity (Rickenmann and McArdell, 2008; Turowski et al., 2013). A further uncertainty arises because these larger particles are transported at higher bed shear stresses (Einstein, 1950; Wilcock and Crowe, 2003), which also mobilize more total material and thus pose a serious challenge regarding the sampling efficiency of the calibration bedload samplers. Bunte and Abt (2005) and Bunte et al. (2019) have demonstrated that reducing the sampling duration with a bedload trap from 60 to 2 min decreases both the sampled unit total bedload flux qb,tot and the sampled maximum particle size Dmax by about half. In the present study, total bedload fluxes up to 4 kg m−1 s−1 were measured with the net sampler, meaning that the measurement duration had to be minimized to avoid overloading the sampler. At the Albula stream, for instance, only four samples contained particles of the largest class, and all four were sampled over a duration ranging from 1 to 2 min. As a comparison, the longest sampling duration was reached at the Navisence site and lasted 25 min. All this suggests that an optimal calibration of the SPG system requires balancing the sampling duration and the number of collected particles. Note that uncertainties in the direct measurements do affect the accuracy of fractional sediment flux and grain-size estimates. Flume experiments could potentially be used to assess the sampling efficiency of the various calibration sampling methods, along with the detection efficiency of the SPG system.
4.4 Transport rate
Two further trends are evident in the unit fractional flux estimates obtained for the seven smallest classes, for which most samples were detected ( >96 %; Table 5). First, the relative scatter (on the log–log plots) of the fractional flux estimates around the power-law regression lines in Fig. 9 is smaller at higher transport rates. Second, both total and fractional fluxes are generally overestimated at low transport rates and underestimated at high transport rates (Figs. 9 and 10). These findings agree with results from previous calibration campaigns with the SPG system (Rickenmann and Fritschi, 2017; Rickenmann et al., 2018), but a comprehensive explanation for these trends is still missing. The following hypotheses can be raised to explain the relationship between the mass flux estimates and the transport rate qb. (i) The SPG system may suffer from signal saturation when the transport rate is too high, as has been document in the Japanese pipe microphone system (Mizuyama et al., 2011; Choi, 2020). In our SPG data, we have observed long packets containing multiple large peaks corresponding to several impacts occurring so quickly after one another that they were not detected as separate packets. One can expect that the probability of occurrence of such packets increases together with the transport rate, the transport of large particles (which typically generate packets of longer durations), and the occurrence of sliding and rolling particles (Chen et al., 2022). The long packets obscure the multiple shorter packets that would otherwise be individually counted, leading to underestimated mass fluxes for a given kb,j value. The development of a procedure to identify such packets and attribute the peaks contained therein to individual impacts could represent an interesting aim for future research. (ii) Field observations of bedload sheets being transported over plates at high transport rates were made at the Vallon de Nant site. In the presence of bedload sheets, one can expect that the detection rate of transported particles is hampered by multiple particle layers (Rickenmann et al., 1997; Turowski and Rickenmann, 2009), kinetic sieving (e.g., Frey and Church, 2011), or percolation processes (e.g., Recking et al., 2009). As such, it would be reasonable to expect a stronger signal response at lower transport rates (Fig. 10).
We are not able to give a clear explanation for the overestimates of the characteristic grain size Dx for finer grain mixtures and underestimates for coarser grain mixtures (as shown in Fig. 11). A similar trend was also observed by Rickenmann et al. (2018) for calibration measurements originating from the Erlenbach. We expect that the decrease in the detection rate along with increasing transport intensity, as mentioned above, may partly explain this phenomenon.
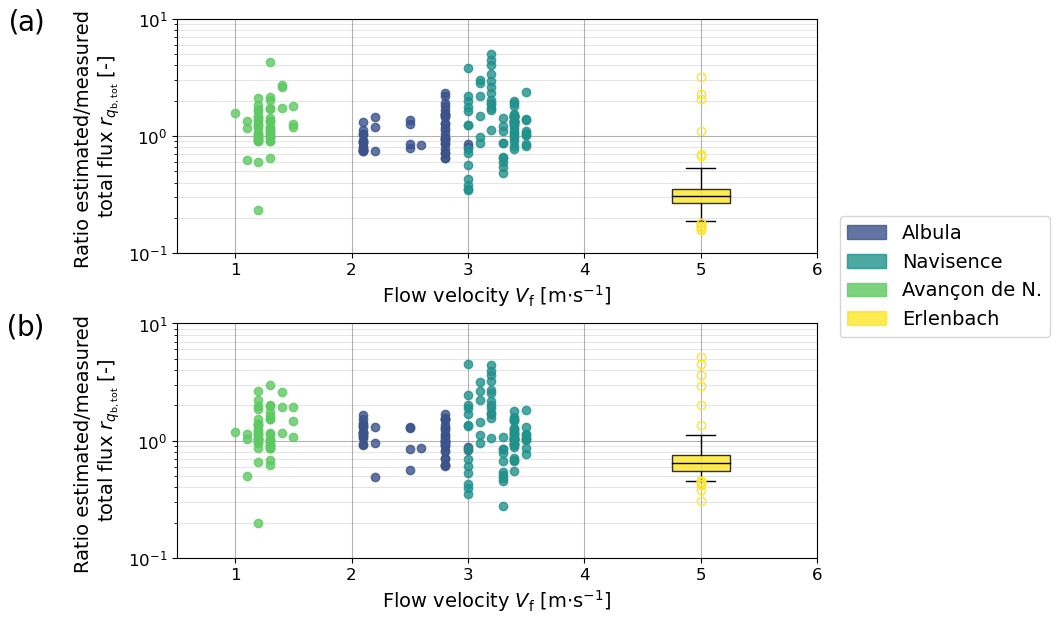
Figure 12Ratio between the estimated and measured unit total mass flux as a function of the mean flow velocity Vf for each collected sample and each station with the AH method (a) and the AF method (b). The indicated flow velocity corresponds to in situ measurements performed during (or close in time to) the corresponding calibration measurement. Due to the stable flow velocity of 5 m s−1 measured at the Erlenbach site, the range of values is represented as a box plot. The yellow circles correspond to outliers.
4.5 Effect of the flow velocity
A recurrent feature in the results presented above is an offset between the estimates obtained for the Erlenbach and those obtained for the three other stations. A similar offset was observed earlier for linear calibration relations of total bedload mass between the Erlenbach and other field sites with more natural approach flow conditions (Rickenmann et al., 2014). Although applying the new amplitude–frequency method has reduced the offset in the present study significantly, it remains visible for both fractional and total bedload flux estimates (Figs. 9, 10, and 12). At the Erlenbach site, the last 35 m upstream of the SPG system consists of an artificial bed with a steep channel slope of 16 %, made of large flat embedded boulders (Roth et al., 2016). This explains the supercritical flow regime with a Froude number around 5.1 (Wyss et al., 2016c) and a flow velocity Vf around 5 m s−1 at the check dam with the geophone sensors (Table S1). Bedload particle velocity Vp was introduced by Wyss et al. (2016b, c) as a possible governing parameter affecting the number of particles detected by the SPG system, with fast-moving particles being less likely to collide against the Swiss plate geophone than slower moving ones, which are more frequently in contact with the bed. For the present study, we used Vf as a proxy for Vp, even though bedload particles generally travel more slowly than the fluid surrounding them (Ancey et al., 2008; Chatanantavet et al., 2013; Auel et al., 2017). Past flume experiments (Wyss et al., 2016b; Kuhnle et al., 2017) have shown that the calibration coefficient kb,j can vary with the flow velocity Vf such that a 3-fold increase in Vf can lead to a 2-fold decrease in kb,j. The better detectability of particles that one could expect from the higher impact energy (Wyss et al., 2016b) seems to be insufficient to compensate for the strong reduction of the number of impacts on a plate as flow velocity increases. This possibly arises from the fact that larger flow velocities (without increased turbulence) may also lead to flatter saltation trajectories, thus decreasing the vertical component of the impact force. Furthermore, bed morphology, bed roughness, and flow velocity play important roles in determining particle transport mode, i.e., sliding, rolling, or saltating (e.g., Bagnold, 1973; Lajeunesse et al., 2010). Although high flow velocities generally favor the saltating mode (Ancey et al., 2002; Chen et al., 2022), the shallow flow depths measured at the Erlenbach (in average 0.1 m; Wyss et al., 2016b) may limit the hop height of larger particles (Amir et al., 2017). Considering all these aspects, we hypothesize that the generally underestimated transport rates observed for the Erlenbach site mainly arise from the exceptionally high flow velocity, shallow water depths, and related transport mode (Fig. 12). Continuous streamflow measurements are lacking at the Albula and Navisence sites, hampering a more detailed analysis of the relationship between flow velocities and detection rates. Another improvable aspect is the low variability between the site-specific calibration relationships of the three natural sites before the implementation the AF method (Fig. 8a). It would have been interesting to test the method on a larger number (and variety) of sites. Unfortunately, these four chosen sites are currently the only ones at which a full geophone signal has been recorded during calibration measurements.
4.6 K-fold cross-validation
In a last stage, we tested the robustness of the AH and AF methods by splitting the dataset into calibration and validation subsets. Because the number of calibration measurements is relatively small and varies between stations, we applied a 4-fold cross-validation technique (e.g., Khosravi et al., 2020). The field calibration measurements were distributed over four folds, each containing an equal number of calibration measurements from each site (Fig. S4 in the Supplement). One after another, the folds were used as validation datasets, while the remaining three folds were used for calibration. General calibration coefficients were obtained from the calibration dataset and subsequently applied to the validation data to derive flux estimates. Even though each fold contains a total of only 48 samples (12 per site), the results obtained with the 4-fold cross-validation procedure support our conclusion that including frequency information in the packet classification procedure improves the mean accuracy of the estimates over all sites, in particular for the smaller five to six size classes j (Table S10 in the Supplement). Nicollier et al. (2022) found that the true size of particles generating apparent packets is mostly underestimated due to the attenuation of the vibrations as they propagate (see Fig. 7). It is therefore reasonable that the AF method mainly improves the flux estimates for these smaller classes.
The Swiss plate geophone (SPG) is a bedload surrogate monitoring system that has been installed in several gravel-bed streams and was calibrated using direct sampling techniques. While most site-specific calibration relationships for total mass flux are robust across multiple orders of magnitude, the mean calibration coefficients can still vary by about a factor of 6 between different sites. In this study, we derived a general procedure to convert SPG signals into fractional bedload fluxes using an extensive dataset comprising flume experiments as well as 308 field calibration measurements from four field sites. The proposed hybrid approach is based on previous findings (Antoniazza et al., 2020; Nicollier et al., 2022) that the SPG system is biased by elastic waves that propagate through the apparatus and generate noise in the form of spurious “apparent” packets. We introduced the amplitude–frequency (AF) method as an alternative to the amplitude histogram (AH) method developed by Wyss et al. (2016a). Packets recorded during single-grain-size flume experiments were first filtered to exclude apparent packets and then used to derive grain-size class thresholds for packet classification. We found that filtering out apparent packets results in more consistent relationships between particle diameter and amplitude–frequency characteristics of the SPG signal. Furthermore, we showed that including frequency information in size class thresholds helps in excluding apparent packets and thus improves the signal-to-noise ratio. In a second stage, we applied these flume-based thresholds to field calibration measurements and derived general calibration coefficients applicable at all four sites for 10 different grain-size fractions. The AH method, by contrast, requires site-specific calibration because it cannot account for the site-to-site differences in the abundance of apparent packets. Averaged over the 10 grain-size fractions, the bedload mass of 69 % and 96 % of the samples was estimated within an offset of a factor of 2 and 5, respectively, relative to the measured sample mass. The remaining discrepancies between the site-specific results are mainly attributed to large differences in flow (and probably particle) velocity. Finally, the sampled mass, transport rate, and sampling efficiency were identified as further factors possibly influencing the accuracy of mass flux and grain-size estimates.
The presented results are highly encouraging regarding future applications of surrogate monitoring methods to investigate bedload transport processes. The findings also underline the valuable contribution of flume experiments to our understanding of the relationship between bedload transport and the recorded SPG signal. But above all, this study highlights the requirements for obtaining calibrations that are transferable across sites: accurate and numerous direct sampling measurements with long sampling durations and large sampled masses, sensors insulated from surrounding noise sources, and highly resolved temporal information about the streamflow to identify and account for variations in the transport conditions.
| ac | Linear coefficient of the criterion |
| AFFT | Fourier amplitude |
| Am,j | Mean amplitude registered for particle size class j |
| bc | Linear coefficient of the criterion |
| Δti | Sampling duration |
| Dm,j | Mean particle diameter for particle size class j |
| Dsieve,j | Lower sieve size retaining particle class j |
| Dx | Characteristic grain size |
| fcentroid | Centroid frequency |
| i | Sample index |
| j | Particle size class index |
| Sample- and class-specific calibration coefficient | |
| Median calibration coefficient for particle size class j and a given station | |
| General calibration coefficient for particle size class j | |
| Estimated fractional mass per sample and per class | |
| Sampled fractional mass per sample and per class | |
| MaxAmpenv | Maximum registered amplitude within a packet |
| Nsamples,est | Number of detected samples |
| Nstations | Number of stations |
| PACKi,j | Number of recorded packets per sample and per class |
| pfactor_x | Percentage of all detected samples for which the estimated and the measured values differ from each other by less than a factor of x |
| Estimated unit fractional transport rate per sample and per class | |
| Measured unit fractional transport rate per sample and per class | |
| Estimated unit total bedload flux per sample | |
| Measured unit total bedload flux per sample | |
| R2 | Coefficient of determination |
| r | Correlation coefficient |
| rx | Ratio between estimated and measured values x |
| thah,j | Amplitude histogram thresholds |
| Lower amplitude–frequency thresholds | |
| Upper amplitude–frequency thresholds | |
| Vf | Mean flow velocity |
| wp | Standard width of an impact plate |
The dataset presented in this paper is available online on the EnviDat repository at https://www.envidat.ch/#/metadata/sediment-transport-observations-in-swiss-mountain-streams (Nicollier et al., 2022).
The supplement related to this article is available online at: https://doi.org/10.5194/esurf-10-929-2022-supplement.
TN designed and carried out the field and flume experiments, developed the presented workflow, and prepared the paper with contributions from all co-authors. GA designed and carried out the field experiments at the Vallon de Nant site. LA helped develop the methodology and contributed to the formal analysis. DR contributed to the conceptualization and the supervision of the presented work, contributed to the design of the methodology, and provided support during the field and flume experiments. JWK contributed to the development of the methodology and significantly contributed to the preparation of the initial draft.
The contact author has declared that none of the authors has any competing interests.
Publisher's note: Copernicus Publications remains neutral with regard to jurisdictional claims in published maps and institutional affiliations.
This study was supported by Swiss National Science Foundation (SNSF) grant 200021L_172606 and by Deutsche Forschungsgemeinschaft (DFG) grant RU 1546/7-1. The authors are grateful to Arnd Hartlieb, the students of the TU Munich, and the technical staff of the Oskar von Miller Institute for helping to set up and perform the flume experiments. They also warmly thank Norina Andres, Mehdi Mattou, Nicolas Steeb, Florian Schläfli, Konrad Eppel, and Jonas von Wartburg for their efforts and motivation during the field calibration campaigns. Special thanks go to Stefan Boss for his support with the measurement systems at all sites and to Andreas Schmucki, who never gave up repairing the net sampler. Alexandre Badoux is further thanked for his valuable suggestions regarding an earlier version of the paper.
This research has been supported by the Schweizerischer Nationalfonds zur Förderung der Wissenschaftlichen Forschung (grant no. 200021L_172606) and the Deutsche Forschungsgemeinschaft (grant no. RU 1546/7-1).
This paper was edited by Claire Masteller and reviewed by Dan Cadol and two anonymous referees.
Amir, M., Nikora, V., and Witz, M.:A novel experimental technique and its application to study the effects of particle density and flow submergence on bed particle saltation, J. Hydraul. Res., 55, 101–113, https://doi.org/10.1080/00221686.2016.1233583, 2017.
Ancey, C.: Bedload transport: a walk between randomness and determinism. Part 2. Challenges and prospects, J. Hydraul. Res., 58, 18–33, https://doi.org/10.1080/00221686.2019.1702595, 2020.
Ancey, C., Bigillon, F., Frey, P., Lanier, J., and Ducret, R.: Saltating motion of a bead in a rapid water stream, Phys. Rev. E, 66, 036306, https://doi.org/10.1103/PhysRevE.66.036306, 2002.
Ancey, C., Davison, A. C., Böhm, T., Jodeau, M., and Frey, P.: Entrainment and motion of coarse particles in a shallow water stream down a steep slope, J. Fluid Mech., 595, 83–114, https://doi.org/10.1017/S0022112007008774, 2008.
Antoniazza, G., Nicollier, T., Wyss, C. R., Boss, S., and Rickenmann, D.: Bedload transport monitoring in alpine rivers: Variability in Swiss plate geophone response, Sensors, 20, 4089, https://doi.org/10.3390/s20154089, 2020.
Antoniazza, G., Nicollier, T., Boss, S., Mettra, F., Badoux, A., Schaefli, B., Rickenmann, D., and Lane, S.: Hydrological drivers of bedload transport in an Alpine watershed, Water Resour. Res., 58, e2021WR030663. https://doi.org/10.1029/2021WR030663, 2022.
Auel, C., Albayrak, I., Sumi, T., and Boes, R. M.: Sediment transport in high-speed flows over a fixed bed: 1. Particle dynamics, Earth Surf. Proc. Land., 42, 1365–1383, https://doi.org/10.1002/esp.4128, 2017.
Badoux, A., Andres, N., and Turowski, J. M.: Damage costs due to bedload transport processes in Switzerland, Nat. Hazards Earth Syst. Sci., 14, 279–294, https://doi.org/10.5194/nhess-14-279-2014, 2014.
Bagnold, R. A.: The nature of saltation and of bed-load transport in water, Proc. Royal Soc. A, 332, 473–504, https://doi.org/10.1098/rspa.1973.0038, 1973.
Bakker, M., Gimbert, F., Geay, T., Misset, C., Zanker, S., and Recking, A.: Field application and validation of a seismic bedload transport model, J. Geophys. Res., 125, e2019JF005416, https://doi.org/10.1029/2019JF005416, 2020.
Barrière, J., Krein, A., Oth, A., and Schenkluhn, R.: An advanced signal processing technique for deriving grain size information of bedload transport from impact plate vibration measurements, Earth Surf. Proc. Land., 40, 913–924, https://doi.org/10.1002/esp.3693, 2015.
Bathurst, J. C.: Effect of coarse surface layer on bed-load transport, J. Hydraul. Eng., 133, 1192–1205, https://doi.org/10.1061/(ASCE)0733-9429(2007)133:11(1192), 2007.
Belleudy, P., Valette, A., and Graff, B.: Passive hydrophone monitoring of bedload in river beds: First trials of signal spectral analyses, U.S. Geol. Surv. Sci. Invest. Rep., 2010–5091, 67–84, 2010.
Blöschl, G., Kiss, A., Viglione, A., Barriendos, M., Böhm, O., Brázdil, R., Coeur, D., Demarée, G., Llasat, M. C., Macdonald, N., Retsö, D., Roald, L., Schmocker-Fackel, P., Amorim, I., Bělínová, M., Benito, G., Bertolin, C., Camuffo, D., Cornel, D., Doktor, R., Elleder, L., Enzi, S., Garcia, J. C., Glaser, R., Hall, J., Haslinger, K., Hofstätter, M., Komma, J., Limanówka, D., Lun, D., Panin, A., Parajka, J., Petrić, H., Rodrigo, F. S., Rohr, C., Schönbein, J., Schulte, L., Silva, L. P., Toonen, W. H. J., Valent, P., Waser J., and Wetter, O.: Current European flood-rich period exceptional compared with past 500 years, Nature, 583, 560–566, https://doi.org/10.1038/s41586-020-2478-3, 2020.
Bogen, J. and Møen, K.: Bed load measurements with a new passive acoustic sensor, in Erosion and Sediment Transport Measurement in Rivers: Trends and Explanation, IAHS Publications, 283, 181–182, 2003.
Brouwer, R. and Sheremet, O. I.: The economic value of river restoration, Water Resour. Eco., 17, 1–8, https://doi.org/10.1016/j.wre.2017.02.005, 2017.
Bunte, K., Abt, S. R., Potyondy, J. P., and Ryan, S. E.: Measurement of coarse gravel and cobble transport using a portable bedload trap, J. Hydraul. Eng., 130, 879–893, https://doi.org/10.1061/(ASCE)0733-9429(2004)130:9(879), 2004.
Bunte, K. and Abt, S. R.: Effect of sampling time on measured gravel bed load transport rates in a coarse-bedded stream, Water Resour. Res., 41, W11405, https://doi.org/10.1029/2004WR003880, 2005.
Bunte, K., Abt, S. R., Cenderelli, D. A., Ettema, R., and Swingle, K. W.: Bedload traps and Helley-Smith Sampler Collect Different Rates and Particle Sizes of Gravel Bedload, Proceedings of the SEDHYD 2019 Conference, Federal Interagency Sedimentation and Hydrologic, Modeling Conference, 24–28 June 2019, Reno, NV, 2019.
Chatanantavet, P., Whipple, K. X., Adams, M. A., and Lamb, M. P.: Experimental study on coarse grain saltation dynamics in bedrock channels, J. Geophys. Res., 118, 1161–1176, https://doi.org/10.1002/jgrf.20053, 2013.
Chen, Z., He, S., Nicollier, T., Ammann, L., Badoux, A., and Rickenmann, D.: Signal response of the Swiss plate geophone monitoring system impacted by bedload particles with different transport modes, Earth Surf. Dynam., 10, 279–300, https://doi.org/10.5194/esurf-10-279-2022, 2022.
Choi, J. H., Jun, K. W., and Jang, C. D.: Bed-Load Collision Sound Filtering through Separation of Pipe Hydrophone Frequency Bands, Water, 12, 1875, https://doi.org/10.3390/w12071875, 2020.
Church, M., Hassan, M. A., and Wolcott, J. F.: Stabilizing self-organized structures in gravel-bed stream channels: Field and experimental observations, Water Resour. Res., 34, 3169–3179, https://doi.org/10.1029/98WR00484, 1998.
Dell'Agnese, A., Mao, L., and Comiti, F.: Calibration of an acoustic pipe sensor through bedload traps in a glacierized basin, CATENA, 121, 222–231, https://doi.org/10.1016/j.catena.2014.05.021, 2014.
Detert, M. and Weitbrecht, V.: User guide to gravelometric image analysis by BASEGRAIN, Adv. Sci. Res., edited by: Fukuoka, S., Nakagawa, H., Sumi, T., Zhang, H., Taylor and Francis Group, London, ISBN 978-1-138-00062-9, 1789–1795, 2013.
Dhont, B. and Ancey, C.: Are bedload transport pulses in gravel bed rivers created by bar migration or sediment waves?, Geophys. Res. Lett., 45, 5501– 5508, https://doi.org/10.1029/2018GL077792, 2018.
Einstein, H. A.: The Bedload Transport as Probability Problem, Mitteilung der Versuchsanstalt für Wasserbau an der Eidgenössischen Technischen Hochschule, edited by: Rascher & Co., Zürich, Eidgenössische Technische Hochschule, Zürich, Switzerland, 1937.
Einstein, H. A.: The Bedload Transport as Probability Problem, Technical bulletin, 1026, United States Department of Agriculture, Soil Conservation Service, Washington, DC, 1950.
Fawcett, T.: An introduction to ROC analysis, Pattern Recognit. Lett., 27, 861–874, https://doi.org/10.1016/j.patrec.2005.10.010, 2006.
Frey, P. and Church, M.: Bedload: a granular phenomenon, Earth Surf. Proc. Land., 36, 58–69, https://doi.org/10.1002/esp.2103, 2011.
Geay, T., Zanker, S., Misset, C., and Recking, A.: Passive Acoustic Measurement of Bedload Transport: Toward a Global Calibration Curve?, J. Geophys. Res., 125, e2019JF005242, https://doi.org/10.1029/2019JF005242, 2020.
Gray, J. R., Laronne, J. B., and Marr, J. D. G. (Eds): Bedload-surrogate Monitoring Technologies, U.S. Geol. Surv. Sci. Invest. Rep., 2010–5091, US Geological Survey, Reston, VA, http://pubs.usgs. gov/sir/2010/5091/ (last access: 10 January 2022), 2010.
Habersack, H., Kreisler, A., Rindler, R., Aigner, J., Seitz, H., Liedermann, M., and Laronne, J. B.: Integrated automatic and continuous bedload monitoring in gravel bed rivers, Geomorphology, 291, 80–93, https://doi.org/10.1016/j.geomorph.2016.10.020, 2017.
Halfi, E., Paz, D., Stark, K., Yogev, U., Reid, I., Dorman, M., and Laronne, J. B.: Novel mass-aggregation-based calibration of an acoustic method of monitoring bedload flux by infrequent desert flash floods, Earth Surf. Proc. Land., 45, 3510–3524, https://doi.org/10.1002/esp.4988, 2020.
Hilldale, R. C., Carpenter, W. O., Goodwiller, B., Chambers, J. P., and Randle, T. J.: Installation of impact plates to continuously measure bed load: Elwha River, Washington, USA, J. Hydraul. Eng., 141, 06014023, https://doi.org/10.1061/(ASCE)HY.1943-7900.0000975, 2015.
Johnson, K.: Contact Mechanics, Cambridge University Press, Cambridge, https://doi.org/10.1017/CBO9781139171731, 1985.
Jones, E., Oliphant, T., and Peterson, P.: SciPy: Open source scientific tools for Python (cited 29 December 2021), http://www.scipy.org (last access: 10 January 2022), 2002.
Khosravi, K., Cooper, J. R., Daggupati, P., Thai Pham, B., and Bui, D. T.: Bedload transport rateprediction: Application of novel hybrid data mining techniques, J. Hydrol., 585, 124774, https://doi.org/10.1016/j.jhydrol.2020.124774, 2020.
Koshiba, T. and Sumi, T.: Application of the wavelet transform to sediment grain sizes analysis with an impact plate for bedload monitoring in sediment bypass tunnels, E3S Web Conf., 40, 04022, https://doi.org/10.1051/e3sconf/20184004022, 2018.
Krein, A., Klinck, H., Eiden, M., Symader, W., Bierl, R., Hoffmann, L., and Pfister, L.: Investigating the transport dynamics and the properties of bedload material with a hydro-acoustic measuring system, Earth Surf. Proc. Land., 33, 152–163, https://doi.org/10.1002/esp.1576, 2008.
Kreisler, A., Moser, M., Aigner, J., Rindler, R., Tritthard, M., and Habersack, H.: Analysis and classification of bedload transport events with variable process characteristics, Geomorphology, 291, 57–68, https://doi.org/10.1016/j.geomorph.2016.06.033, 2017.
Kuhnle, R., Wren, D., Hilldale, R. C., Goodwiller, B., and Carpenter, W.: Laboratory Calibration of Impact Plates for Measuring Gravel Bed Load Size and Mass, J. Hydraul. Eng., 143, 06017023, https://doi.org/10.1061/(ASCE)HY.1943-7900.0001391, 2017.
Lajeunesse, E., Malverti, L., and Charru, F.: Bed load transport in turbulent flow at the grain scale: Experiments and modeling, J. Geophys. Res., 115, F04001, https://doi.org/10.1029/2009JF001628, 2010.
Le Guern, J., Rodrigues, S., Geay, T., Zanker, S., Hauet, A., Tassi, P., Claude, N., Jugé, P., Duperray, A., and Vervynck, L.: Relevance of acoustic methods to quantify bedload transport and bedform dynamics in a large sandy-gravel-bed river, Earth Surf. Dynam., 9, 423–444, https://doi.org/10.5194/esurf-9-423-2021, 2021.
Logar, I., Brouwer, R., and Paillex, A.: Do the societal benefits of river restoration outweigh their costs? A cost-benefit analysis, J. Environ. Manage., 232, 1075–1085, https://doi.org/10.1016/j.jenvman.2018.11.098, 2019.
Manga, M. and Kirchner, J. W.: Stress partitioning in streams by large woody debris, Water Resour. Res., 36, 2373–2379, https://doi.org/10.1029/2000WR900153, 2000.
Mao, L., Carrillo, R., Escauriaza, C., and Iroume, A.: Flume and field-based calibration of surrogate sensors for monitoring bedload transport, Geomorphology, 253, 10–21, https://doi.org/10.1016/j.geomorph.2015.10.002, 2016.
Mizuyama, T., Hirasawa, R., Kosugi, K., Tsutsumi, D., and Nonaka, M.: Sediment monitoring with a hydrophone in mountain torrents, Int. J. Erosion Control Eng., 4, 43–47, https://doi.org/10.13101/ijece.4.43, 2011.
Mühlhofer, L.: Untersuchungen über die Schwebstoff und Geschiebeführung des Inn nächst Kirchbichl (Tirol), Die Wasserwirtschaft, 1, 23 pp., 1933.
Nicollier, T., Rickenmann, D., and Hartlieb, A.: Field calibration of the Swiss plate geophone system at the Albula stream and comparison with controlled flume experiments, 8 pp., Paper presented at the SEDHYD 2019 Conference, Reno, NV, 24–28 June 2019, 2019.
Nicollier, T., Rickenmann, D., Boss, S., Travaglini, E., and Hartlieb, A.: Calibration of the Swiss plate geophone system at the Zinal field site with direct bedload samples and results from controlled flume experiments, in River Flow 2020, Proceedings of the 10th Conference on Fluvial Hydraulics, 901–909, https://doi.org/10.1201/b22619, 2020.
Nicollier, T., Rickenmann, D., and Hartlieb, A.: Field and flume measurements with the impact plate: Effect of bedload grain-size distribution on signal response, Earth Surf. Proc. Land., 40, 1504–1520, https://doi.org/10.1002/esp.5117, 2021.
Nicollier, T., Antoniazza, G., Rickenmann, D., Hartlieb, A., and Kirchner, J. W.: Improving the calibration of impact plate bedload monitoring systems by filtering out acoustic signals from extraneous particle impacts, Earth Space Sci., 9, e2021EA001962, https://doi.org/10.1029/2021EA001962, 2022.
Nicollier, T., Antoniazza, G., and Rickenmann, D.: Field and 115 Flume Calibration Datasets, Envidat [data set], https://www.envidat.ch/#/metadata/sediment-transport-observations-in-swiss-mountain-streams, last access: 10 January 2022.
Nitsche, M., Rickenmann, D., Turowski, J. M., Badoux, A., and Kirchner, J. W.: Evaluation of bedload transport predictions using flow resistance equations to account for macro-roughness in steep mountain streams, Water Resour. Res., 47, W08513, https://doi.org/10.1029/2011WR010645, 2011.
Pauli, M., Hunzinger, L., and Hitz, O.: More bed load in rivers. Achieving a sediment balance close to the natural state, J. Appl. Water Eng. Res., 6, 274–282, https://doi.org/10.1080/23249676.2018.1497554, 2018.
Piantini, M., Gimbert, F., Bellot, H., and Recking, A.: Triggering and propagation of exogenous sediment pulses in mountain channels: insights from flume experiments with seismic monitoring, Earth Surf. Dynam., 9, 1423–1439, https://doi.org/10.5194/esurf-9-1423-2021, 2021.
Prancevic, J. P. and Lamb, M. P.: Unraveling bed slope from relative roughness in initial sediment motion, J. Geophys. Res., 120, 474–489, https://doi.org/10.1002/2014JF003323, 2015.
Rachelly, C., Friedl, F., Boes, R. M., and Weitbrecht, V.: Morphological response of channelized, sinuous gravel-bed rivers to sediment replenishment, Water Resour. Res., 57, e2020WR029178, https://doi.org/10.1029/2020WR029178, 2021.
Recking, A., Frey, P., Paquier, A., and Belleudy, P.: An experimental investigation of mechanisms involved in bed load sheet production and migration, J. Geophys. Res., 114, F03010, https://doi.org/10.1029/2008JF000990, 2009.
Reid, I., Frostick, L. E., and Layman, J. T.: The incidence and nature of bedload transport during flood flows in coarse-grained alluvial channels, Earth Surf. Proc. Land., 10, 33–44, https://doi.org/10.1002/esp.3290100107, 1985.
Rickenmann, D.: Bed-load transport measurements with geophones and other passive acoustic methods, J. Hydraul. Eng., 143, 03117004-1-14, https://doi.org/10.1061/(ASCE)HY.1943-7900.0001300, 2017.
Rickenmann, D.: Effect of sediment supply on cyclic fluctuations of the disequilibrium ratio and threshold transport discharge, inferred from bedload transport measurements over 27 years at the Swiss Erlenbach stream, Water Resour. Res., 56, e2020WR027741, https://doi.org/10.1029/2020WR027741, 2020.
Rickenmann, D. and Fritschi, B.: Bedload transport measurements with impact plate geophones in two Austrian mountain streams (Fischbach and Ruetz): system calibration, grain size estimation, and environmental signal pick-up, Earth Surf. Dynam., 5, 669–687, https://doi.org/10.5194/esurf-5-669-2017, 2017.
Rickenmann, D. and McArdell, B. W.: Calibration measurements with piezoelectric bedload impact sensors in the Pitzbach mountain stream, Geodin. Acta, 21, 35–52, https://doi.org/10.3166/ga.21.35-52, 2008.
Rickenmann, D. and Recking, A.: Evaluation of flow resistance in gravel-bed rivers through a large field data set, Water Resour. Res., 47, W07538, https://doi.org/10.1029/2010WR009793, 2011.
Rickenmann, D., Hofer, B., and Fritschi, B.: Geschiebemessung mittels Hydrophon, Österreichische Wasser- und Abfallwirtschaft, 49, 219–228, 1997.
Rickenmann, D., Turowski, J. M., Fritschi, B., Klaiber, A., and Ludwig, A.: Bedload transport measurements at the Erlenbach stream with geophones and automated basket samplers, Earth Surf. Proc. Land., 37, 1000–1011, https://doi.org/10.1002/esp.3225, 2012.
Rickenmann, D., Turowski, J. M., Fritschi, B., Wyss, C., Laronne, J. B., Barzilai, R., Reid, I., Kriesler, A., Aigner, J., Sietz, H., and Habersack, H.: Bedload transport measurements with impact plate geophones: comparison of sensor calibration in different gravel-bed streams, Earth Surf. Proc. Land., 39, 928–942, https://doi.org/10.1002/esp.3499, 2014.
Rickenmann, D., Steeb, N., and Badoux, A.: Improving bedload transport determination by grain-size fraction using the Swiss plate geophone recordings at the Erlenbach stream, in: River Flow 2018, Proceedings of the 9th Int. Conference on Fluvial Hydraulics, 8 pp., https://doi.org/10.1051/e3sconf/20184002009, 2018.
Roth, D. L., Brodsky, E. E., Finnegan, N. J., Rickenmann, D., Turowski, J. M., and Badoux, A.: Bed load sediment transport inferred from seismic signals near a river, J. Geophys. Res., 121, 725–747, https://doi.org/10.1002/2015JF003782, 2016.
Schneider, J. M., Rickenmann, D., Turowski, J. M., Schmid, B., and Kirchner, J. W.: Bed load transport in a very steep mountain stream (Riedbach, Switzerland): Measurement and prediction, Water Resour. Res., 52, 9522–9541, https://doi.org/10.1002/2016WR019308, 2016.
Thorne, P. D.: Laboratory and marine measurements on the acoustic detection of sediment transport, J. Acoust. Soc. Am., 80, 899–910, https://doi.org/10.1121/1.393913, 1986.
Tsakiris, A. G., Papanicolaou, A. N., and Lauth, T.: Signature of bedload particle transport mode in the acoustic signal of a geophone, J. Hydraul. Res., 52, 185–204, https://doi.org/10.1080/00221686.2013.876454, 2014.
Turowski, J. M. and Rickenmann, D.: Tools and cover effect in the Pitzbach, Austria, Earth Surf. Proc. Land., 34, 26–37, https://doi.org/10.1002/esp.1686, 2009.
Turowski, J. M., Badoux, A., and Rickenmann, D.: Start and end of bedload transport in gravel-bed streams, Geophys. Res. Lett., 38, L04401, https://doi.org/10.1029/2010GL046558, 2011.
Turowski, J. M., Bockli, M., Rickenmann, D., and Beer, A. R.: Field measurements of the energy delivered to the channel bed by moving bed load and links to bedrock erosion, J. Geophys. Res., 118, 2438–2450, https://doi.org/10.1002/2013JF002765, 2013.
Uher, M. and Benes, P.: Measurement of particle size distribution by acoustic emission method, paper presented at XX IMEKO World Congress, Busan, South Korea, 9–12 September 2012, ISBN 9788995000052, 2012.
Wilcock, P. R. and Crowe, J. C.: A surface-based transport model for sand and gravel, J. Hydraul. Eng., 129, 120–128, https://doi.org/10.1061/(ASCE)0733-9429(2003)129:2(120), 2003.
Wyss, C. R., Rickenmann, D., Fritschi, B., Turowski, J., Weitbrecht, V., and Boes, R.: Measuring bed load transport rates by grain-size fraction using the Swiss plate geophone signal at the Erlenbach, J. Hydraul. Eng., 142, https://doi.org/10.1061/(ASCE)HY.1943-7900.0001090,04016003, 2016a.
Wyss, C. R., Rickenmann, D., Fritschi, B., Turowski, J., Weitbrecht, V., and Boes, R.: Laboratory flume experiments with the Swiss plate geophone bed load monitoring system: 1. Impulse counts and particle size identification, Water Resour. Res., 52, 7744–7759, https://doi.org/10.1002/2015WR018555, 2016b.
Wyss, C. R., Rickenmann, D., Fritschi, B., Turowski, J., Weitbrecht, V., Travaglini E., Bardou, E., and Boes, R. M.: Laboratory flume experiments with the Swiss plate geophone bed load monitoring system: 2. Application to field sites with direct bed load samples, Water Resour. Res., 52, 7760–7778, https://doi.org/10.1002/2016WR019283, 2016c.
Yager, E. M., Kirchner, J. W., and Dietrich, W. E.: Calculating bed load transport in steep boulder bed channels, Water Resour. Res., 43, W07418, https://doi.org/10.1029/2006WR005432, 2007.
Yager, E. M., Dietrich, W. E., Kirchner, J. W., and McArdell, B. W.: Prediction of sediment transport in step-pool channels, Water Resour. Res., 48, W01541, https://doi.org/10.1029/2011WR010829, 2012.