the Creative Commons Attribution 4.0 License.
the Creative Commons Attribution 4.0 License.
 | 01 Feb 2022
Permafrost in monitored unstable rock slopes in Norway – new insights from temperature and surface velocity measurements, geophysical surveying, and ground temperature modelling
Justyna Czekirda
Florence Magnin
Pierre-Allain Duvillard
Ludovic Ravanel
Emanuelle Malet
Andreas Aspaas
Lene Kristensen
Ingrid Skrede
Gudrun D. Majala
Benjamin Jacobs
Johannes Leinauer
Christian Hauck
Christin Hilbich
Martina Böhme
Reginald Hermanns
Harald Ø. Eriksen
Tom Rune Lauknes
Michael Krautblatter
Sebastian Westermann
The warming and subsequent degradation of mountain permafrost within alpine areas represent an important process influencing the stability of steep slopes and rock faces. The unstable and monitored slopes of Mannen (Møre and Romsdal county, southern Norway) and Gámanjunni-3 (Troms and Finnmark county, northern Norway) were classified as high-risk sites by the Norwegian Geological Survey (NGU). Failure initiation has been suggested to be linked to permafrost degradation, but the detailed permafrost distribution at the sites is unknown. Rock wall (RW) temperature loggers at both sites have measured the thermal regime since 2015, showing mean rock surface temperatures between 2.5 and −1.6 ∘C depending on site and topographic aspect. Between 2016 and 2019 we conducted 2D and 3D electrical resistivity tomography (ERT) surveys on the plateau and directly within the rock wall back scarp of the unstable slopes at both sites. In combination with geophysical laboratory analysis of rock wall samples from both sites, the ERT soundings indicate widespread permafrost areas, especially at Gámanjunni-3. Finally, we conducted 2D thermal modelling to evaluate the potential thermal regime, along with an analysis of available displacement rate measurements based on Global Navigation Satellite System (GNSS) and ground- and satellite-based interferometric synthetic aperture radar (InSAR) methods. Surface air and ground temperatures have increased significantly since ca. 1900 by 1 and 1.5 ∘C, and the highest temperatures have been measured and modelled since 2000 at both study sites. We observed a seasonality of displacement, with increasing velocities during late winter and early spring and the highest velocities in June, probably related to water pressure variations during snowmelt. The displacement rates of Gámanjunni-3 rockslide co-vary with subsurface resistivity and modelled ground temperature. Increased displacement rates seem to be associated with sub-zero ground temperatures and higher ground resistivity. This might be related to the presence of ground ice in fractures and pores close to the melting point, facilitating increased deformation. The study demonstrates and discusses the possible influence of permafrost, at least locally, on the dynamics of large rock slope instabilities.
Please read the corrigendum first before continuing.
-
Notice on corrigendum
The requested paper has a corresponding corrigendum published. Please read the corrigendum first before downloading the article.
-
Article
(38455 KB)
-
The requested paper has a corresponding corrigendum published. Please read the corrigendum first before downloading the article.
- Article
(38455 KB) - Full-text XML
- Corrigendum
- BibTeX
- EndNote


Permafrost or permanently frozen ground is a globally widespread phenomenon and covers ca. 15 % of the Northern Hemisphere land surface (Obu et al., 2019). Permafrost is purely thermally defined, with ground temperatures below 0 ∘C over at least 2 consecutive years (Williams and Smith, 1989). In southern Norway, permafrost is widespread above ca. 1500 m a.s.l. and in northern Norway above ca. 800 m a.s.l. (e.g. Gisnås et al., 2016a). In steep rock walls, permafrost is located several hundred metres lower then these values (Magnin et al., 2019), and many rock faces in Norway are within or close to the mountain permafrost limit. Furthermore, steep rock walls efficiently cool the ground and its surroundings because of low or lacking snow cover (Myhra et al., 2017), and they maintain strong thermal gradients in transition areas compared to more snow-covered regions, forming environments of more intense frost weathering (Myhra et al., 2019). While permafrost degradation in the lowlands of the Arctic is mainly associated with ground ice melt (Hjort et al., 2018) and/or release of greenhouse gases (Schuur et al., 2015; Davidson and Janssens, 2006; McGuire et al., 2010), slope instability is the major concern in mountain areas (Haeberli et al., 2010; Gruber and Haeberli, 2007). An increase in rockfall and rockslide activity has been documented following atmospheric warming (Gruber and Haeberli, 2007; Ravanel et al., 2010; Fischer et al., 2012; Frauenfelder et al., 2018; Ravanel et al., 2017). Furthermore, the increase in sub-zero rock temperatures reduces shear strength in steep slopes by affecting the strength of intact rock, ice and rock–ice interfaces (Krautblatter et al., 2013; Mamot et al., 2018). The specific sensitivity of metamorphic rocks similar to those investigated in this study for temperature-dependent weakening of the rock–ice interfaces has recently been demonstrated (Mamot et al., 2021) and is complemented by rock fatigue in zones with transitional rock freezing (Jia et al., 2015; Mamot et al., 2018). Recently, large rockslide detachments in Karrat Fjord, western Greenland, were associated with permafrost degradation (Svennevig et al., 2020).
Large rockslides are the most destructive processes in terms of single-event landslide disasters (Evans and DeGraff, 2002) and caused massive destruction and loss of life in historic times, hitting waterbodies and causing displacement waves or filling valley bottoms (Hermanns et al., 2013b, 2014; Svennevig et al., 2020). The Norwegian Geological Survey has systematically mapped relevant areas over most of the Norwegian high-relief land area for such potentially destructive unstable slopes and classified them according to their risk (Hermanns et al., 2013a; Majala et al., 2016). Seven unstable rock slopes have been identified as high-risk objects based on their risk to cause loss of life and are therefore permanently monitored. At least two of them are situated within the permafrost realm or close to the lower limit of mountain permafrost in Norway: Gámanjunni-3 in Kåfjord–Troms, northern Norway (69.5∘ N, 20.6∘ E), and Mannen in Romsdalen, southern Norway, (62.5∘ N, 7.8∘ E). Both sites were deglaciated prior to the Younger Dryas (ca. 12 ka) and showed initial displacement long after deglaciation, with calculated ages from ca. 7–8 ka at Mannen and ca. 6.6–4.3 ka at Gámanjunni-3 (overview in Hilger et al., 2021). Paleo-slip-rate variation during the Holocene and slip initialisation have been discussed in relation to Holocene permafrost dynamics at these sites (Böhme et al., 2019; Hilger et al., 2021), and it is demonstrated that present movement rates are much higher than the estimated average rates during the Holocene. While Vick et al. (2020) mostly relate these instabilities to structurally controlled rock slope deformation, we hypothesise that these higher rates might be influenced in addition by a change in the ground thermal regime and thus permafrost dynamics since the onset of atmospheric warming after the Little Ice Age (LIA).
This study evaluates the permafrost conditions and recent thermal development in these two unstable slopes of Norway. We present updated movement and rock wall temperature data, electrical resistivity tomography (ERT) combined with seismic refraction tomography (SRT), and numerical modelling of recent thermal behaviour of the unstable rock slopes.
The study focusses on two main sites monitored by the Norwegian Water and Energy Directorate (NVE) since 2009 (Mannen) and 2016 (Gámanjunni-3) (Fig. 1) (Blikra et al., 2016). Both sites are located at steep, glacially over-deepened valley sides and were presumably ice-free during the Younger Dryas (e.g. Hughes et al., 2016), facilitating thick permafrost aggradation during the late Pleistocene and early Holocene (Myhra, 2016; Hilger et al., 2021).
2.1 Gámanjunni-3 (Troms and Finnmark county)
Gámanjunni-3 is located in northern Norway on the west-facing slope of the glacially eroded Manndalen valley. The instability consists of a garnet-bearing quartz–mica schist from the Caledonian orogeny (Henderson and Saintot, 2011). Gámanjunni-3 is interpreted as one instability of 26 Mm3 of rock (Figs. 1 and 2a). Two joint surfaces delimit a wedge in the form of a large block which has already descended by 150 m. The two sliding planes, oriented ∘ and ∘, are dipping steeper than the slope, cutting the regional foliation, which is oriented ∘ (Böhme et al., 2019). The movement vector of the wedge dips 45∘ with a rate of 5 cm a−1, while the toe moves shallower at 4 cm a−1. The rockslide is moving as one wedge-shaped block that is heavily fractured in the lower part, with a large boulder talus at the base and a lobate boulder accumulation along the southern flank. This boulder accumulation forms a rock-glacier-like landform (Figs. 1b and 2a) (Eriksen, 2018) and is discussed in more detail later.

Figure 1(a) Key map for location of the study sites. The rectangles indicate the locations of the study in southern (SN) and northern Norway (NN). The yellow circles show the climate stations used for the analysis of the rock wall surface temperature time series. (1) Tromsø (100 m a.s.l.), (2) Skibotn (10 m a.s.l.), (3) Nordnes (600 m a.s.l.), (4) Åndalsnes (16 m a.s.l.), (5) Fokkstua (950 m a.s.l.), (6) Dombås (650 m a.s.l.), (7) Dovre (450 m a.s.l.). (b) Overview map of the Gámanjunni-3 unstable area. The point symbols show measurement devices or selected points for time series extraction used in this study. The yellow stippled line denotes the outline of the rock-glacier-like landform. (c) Overview map of the Mannen unstable area. The red stippled line denotes Veslemannen as part of the Mannen instability. The failure scenarios are taken from Kristensen et al. (2021). The point symbols show measurement devices or selected points for time series extraction used in this paper. Permafrost probabilities are based on the Cryowall map of permafrost in steep slopes by Magnin et al. (2019). The dashed black line marks the crest outlining the plateaus. The orange stars indicate the location of the rock wall loggers. Base maps from © Statens Kartverk. GST: mean ground surface temperature. BTS: bottom temperature of snow (see main text).
The mean annual air temperature (MAAT) was −3.2 ∘C during 2016–2020 on the top plateau at 1200 m a.s.l. The MAAT during the 1961–1990 normal period was −4.3 ∘C (Lussana et al., 2018; Saloranta, 2012) and thus considerably cooler than in the recent years. During the 4 years of meteorological data, mean annual precipitation was 655 mm. The ground is usually snow-covered from November until June, with an approximate thickness of 1 m. The site lies in the discontinuous mountain permafrost region of northern Norway, and permafrost has been modelled or even measured within the slip face of the unstable rock slope (Magnin et al., 2019; Farbrot et al., 2013; Gisnås et al., 2016a; Obu et al., 2019).
2.2 Mannen (Møre and Romsdal county)
The Mannen rockslide is situated in the Romsdalen valley on a north-facing slope between 900 m and ca. 1300 m a.s.l. (Fig. 1). The glacially over-steepened Romsdalen valley cuts through mountains comprised by gneisses that formed during the Caledonian orogeny (Saintot et al., 2012). The instability consists of an intensely folded high-grade metamorphic unit with alternating sillimanite and kyanite layers, amphibolites, and pegmatites (Saintot et al., 2012). There is an exposed slip surface or back scarp building up a 20 m high rock wall and ending in a mostly snow-filled deep rock fracture (Fig. 2b). The valley floor of Romsdalen is covered by 15 large postglacial rock slope failures. Below Mannen, six to nine rockslide deposits are mapped, three of which occurred in the first millennia after the deglaciation, and three to six slides are inferred to have been climatically triggered during a climatic phase with increased precipitation following the Holocene Thermal Maximum (Hilger et al., 2018). A smaller rockslide, Veslemannen, on the western flank of Mannen occurred in September 2019 (Fig. 2b) after episodic acceleration over several years, leading to numerous evacuations of the local population living below Mannen (Kristensen et al., 2021). Mannen was previously proposed as a translational failure (Henderson and Saintot, 2007) and wedge failure (Dahle et al., 2010). Two scenarios define the Mannen instability (Dahle et al., 2008), with the largest having no detected movement. Scenario B is approximately 10 Mm3 of rock with displacements of 5 mm a−1 to north dipping 20∘. Scenario C has displacements of 2.5 cm a−1 dipping 60∘, which is steeper than the topographic surface, and possibly sinking into a graben structure.

Figure 2(A) Image (left, © NGU) and structural–geological model (right) of Gámanjunni-3 (Böhme et al., 2016, 2019). The yellow stippled line outlines the rock glacier, and the red circles show the back scarp and the moving block. The white lines indicate the different parts of the rockslide (scarps, lateral border, slide front) mapped by Eriksen et al. (2017); similar mapping is also shown in Fig. 1b by NGU. The geological model forms the basis for the stratigraphy used for thermal modelling (Figs. 7 and A1, 2). (B) Overview image of the Mannen instability (© I. Skrede/NVE) and close-up image of the back scarp. The red line shows the moving part of the slope according to scenario C. The red circle shows the back scarp and the deep fracture below, which in this picture is still snow-covered. The stippled yellow line indicates the recently failed Veslemannen (Kristensen et al., 2021).
Since the installation in 2010, the meteorological station on top of the Mannen plateau has measured an average annual precipitation of 1250 mm and mean air temperature of −0.5 ∘C. During the last normal period of 1961–1990, the MAAT was −1.3 ∘C at the Mannen plateau. Atmospheric warming is therefore evident at this site during the last decades. The plateau is usually covered by a 2 to 3.5 m thick snow cover during the period November–June. The site lies at the lower limit of mountain permafrost, where permafrost can be expected in shaded patches or deeper fractures (Magnin et al., 2019; Gisnås et al., 2014, 2016a; Westermann et al., 2013). Recent modelling for the small rockslide Veslemannen indicated at least deep seasonal frost and a thermal influence on the dynamics of the rockslide (Kristensen et al., 2021).
This study uses various data series from different measurements related to climate, rockslide movement, thermal regime and subsurface conditions. All locations of the devices and profiles used in this study are given in Fig. 1.
3.1 Movement of the rock slopes
For Gámanjunni-3, the real-time monitoring was initiated in 2015 and includes Global Navigation Satellite System (GNSS) antennas, crack meters, extensometer, a laser to measure distances to a reflector plate, a meteorological station, a ground-based interferometric synthetic aperture radar system (GB InSAR, sensitive to displacement towards the valley floor along the radar line of sight – LOS) and web cameras. In addition, three satellite corner reflectors were installed in 2012, and their displacement measured along satellite LOS (ascending: down and towards east, descending: down and towards west) is currently being operationally monitored using Sentinel-1 satellite-based InSAR. A time series InSAR methodology based on the GSAR software (Larsen et al., 2005; Lauknes et al., 2010; Eriksen et al., 2017) was used to estimate displacement rates. From snow-free scenes with a revisit period of 11 d acquired from ascending and descending satellite geometry, two stacks of interferograms were produced using GSAR. Mean yearly velocities from both TerraSAR-X stacks (2009–2014) were combined to a 2D InSAR displacement vector surface (12×12 m ground resolution) with enhanced sensitivity to displacement in the east–west up–down plane. For details on processing, verification and limitations, see Eriksen et al. (2017).
For Mannen, the real-time monitoring was initiated late in 2009. The continuous monitoring includes GNSS antennas, distance measurements with two lasers, extensometers, two deep borehole instrumentations, a meteorological station, web cameras and two GB InSAR systems. For this study, we use some selected GNSS monitoring stations, the laser monitoring, the GB InSAR and the satellite corner reflectors to evaluate changes in movements of the unstable slopes. The location of the systems used in this study are given in Fig. 1b.
The distance laser sensor used at both sites is a Dimetix DLS-B 15, which measures with an accuracy of 1.5±1 mm in good weather conditions. The laser device registers 10 measurements per second, which are averaged every 10 min. The distance measured is in LOS, which may deviate from the true displacement vector direction, and daily averages are shown and used. The Trimble NetR9 GNSS Reference Receiver with a Trimble Zephyr 2 antenna measures position continuously and processes an average position every 12 h. The standard deviation calculated for a period between 1 August 2016 and 1 September 2020 is ±0.86 and ±0.69 mm in the north and east direction, respectively, and ±1.89 mm vertically. However, one of the permanent points located outside the unstable section of the slope showed movement because of water intrusion under the foundation; hence, the time series with reliable data is short.
The ground-based radar from LiSALab is a GB InSAR system (© Ellegi Srl) (Bardi et al., 2016; Crosta et al., 2017) placed on a concrete foundation in the respective valleys. The data were processed in the LiSALab software using an atmospheric correction region that covers a selected and assumed stable part of the slope. The reported data are derived primarily from 24 h averages and 3 d average measurements, which have been used to create interferograms, in which the selected time-averaging period depends on the particular displacement rate in LOS at the site. The data are georeferenced to a 10×10 m digital elevation model (DEM). At Gámanjunni-3, time series for 8 points on the rockslide part and 10 points on the rock glacier are extracted and further analysed (Fig. 1b).
All measurements included uncertainties and white noise in the data. To reduce these effects, we calculated daily averages of movement rates and filtered the data with a moving average filter, with variable window sizes. This procedure allowed for identifications of long-term displacement trends and possible seasonal variations of movement.
3.2 Measured and reconstructed rock wall temperatures
During 2015, five temperature data loggers (Geoprecision, M-Log5W-ROCK) were installed in the back scarps of Gámanjunni-3 (three loggers) and Mannen (two loggers), recording rock surface temperatures (RSTs) with a 2 h interval and with an accuracy of ±0.05 ∘C (Magnin et al., 2019) (Fig. 1b). The installation procedure followed the approach described by Gruber et al. (2004). To avoid rapidly fluctuating surface temperatures, sensors were placed at a depth of ca. 10 cm below the surface. We also tried to place the loggers above ledges to minimise snow influence (Magnin et al., 2019).
Automatic data loggers (Hobo and iButton) were placed on the Gámanjunni-3 rockslide and rock glacier in 2013 and 2014, measuring ground surface temperatures (GSTs), i.e. temperature below the snow cover, and temperatures in air-filled voids between crushed blocks below the surface (Eriksen, 2018). The GST loggers are distributed in three clusters over the rockslide, with data points on the moving block, the rock glacier and the toe area of the rockslide; they are maintained by NVE today (Fig. 1). At the Mannen site, data loggers were placed on the plateau to measure GST (Fig. 1) between fall 2015 and 2018. Below the plateau in the upper part of Veslemannen, which failed in 2019, four TinyTag (Gemini) temperature loggers were placed in fractures during two winter seasons in 2014–2015 and 2015–2016. The aim of these measurements was to record the temperature at the interface between the ground surface and snow cover (bottom temperature of snow – BTS) when the snow cover was established. These data provide valuable additional thermal information on the rockslide and are used to compare numerical temperature modelling and geophysical investigations for permafrost mapping.
Both sites are equipped with automatic weather stations, measuring surface air temperature (SAT), precipitation (P) and snow depth. To reconstruct temperature development since the end of the LIA at the study sites in terms of both SAT and RST, two strategies are followed: first, we used gridded climate data (daily SAT and P) available for all of Norway at a ground resolution of 1 km since 1957. The dataset, in the following called “seNorge”, is established by interpolation between meteorological stations (Lussana et al., 2018) and is operationally updated daily. Secondly, for the period before 1957 until the start of the meteorological observation period, which is during the end of the 19th century in Norway, data from the weather stations on site and the rock wall loggers were combined with long-term series from nearby stations using simple or multiple linear regressions. For Gámanjunni-3, a good correlation with the Tromsø weather station was obtained (Fig. 1a), where the data series started in 1867. For the Mannen site, we used both the stations in Dombås and Fokstua in central southern Norway (Fig. 1a), where SAT measurements reach back to 1864 and 1923, respectively. We considered R2 scores of above 0.7 sufficient to use these datasets to derive upper boundary conditions for the numerical modelling.
3.3 Laboratory analysis of rock properties
In order to relate the resistivity results of the geophysical surveys to the freezing transition of specific rock types and approximate frozen rock temperatures, six representative rock samples from the study sites were tested in the freezing laboratory at the Technical University of Munich. The two samples from Gámanjunni-3 are fine-grained greenish gneiss with indicated schistosity (density (ρ) 3.1 g cm3, porosity ca. 0.7 %). Some layers contain a significant high proportion of feldspar. The one sample from Nordnesfjellet (10 km NW of Gámanjunni-3) is a dark grey fine gneiss to quartz-rich mica schist (ρ=2.8 g cm3, porosity ca. 0.6 %). Minor slightly weathered but closed clefts in different orientations and the anisotropy due to foliated minerals account for certain deviations in the measured laboratory arrays. These correspond to variations in the field where small-scale changes in meta-sediment rock types appear. From Mannen, the three greenish to dark grey gneiss samples are medium-grained with dark and light bands of biotite, quartz and feldspar. The sample Mannen03 is coarser with a higher proportion of feldspar minerals that are centimetres large and therefore pronounced white bands.
The method of the resistivity calibration follows Krautblatter et al. (2010). The samples had a cuboid shape of ca. cm and a mass of 20 to 45 kg. All blocks were submerged in undisturbed tap water (473 µS cm−1 conductivity) in atmospheric pressure for at least 72 h to approach close to natural fluid saturation and chemical equilibrium with the pore-surrounding rock material. Each sample was equipped with three lines (L=21 cm) of four M6 stainless-steel screws in a Wenner-type array to calculate resistivity assuming an undisturbed half-space measurement geometry as the half-space with the median depth of investigation controlled by electrode spacing is significantly smaller than the sample dimensions. To overcome the challenge of loss of electrical contact upon freezing, the electrodes were fitted tightly ca. 10 mm deep into the rock. Contact grease was applied to the electrodes in order to further improve galvanic contact. Two Greisinger GMH 3750 thermometers were put in each specimen (5 and 20 mm depths) to record both the near-rock surface temperature and the temperature at the mean depth of investigation (Barker, 1989) every 30 s. We used an ABEM Terrameter LS, operating in monitoring mode, to obtain resistivity measurements every 15 min while the rock specimens were going through a freeze–thaw cycle between 10 and −5 ∘C in a 1 m3 cooling box equipped with a specially designed Fryka TK1041-LK-s ventilated cooling system controlled by a temperature probe close to the sample. The cooling rate was controlled manually to not exceed a temperature gradient of more than 1 K between the temperatures at the rock surface and at the mean depth of investigation. We used a low minimum current of 0.1 mA and high maximum voltage of 600 V to allow measurements even at high resistances supported by the high internal resistance of the ABEM Terrameter. Variance between repeated measurements (stacks) in the critical temperature interval of −2 to 2 ∘C was well below 1 %.
3.4 Field ERT and refraction seismic tomography
We used non-invasive geophysical surveys along profile lines in order to map permafrost at the individual sites and provide information on possible ice-rich or ice-poor zones in the ground. We used electrical resistivity tomography (ERT) at all sites and in addition refraction seismic tomography at Gámanjunni-3.
The electrical resistivity distribution of the subsurface is evaluated by injecting a current and measuring the resulting electrical potential differences along the profile. The investigation depth depends mainly on the distances between the current electrodes employed along the profile and the profile length, with larger distance giving greater penetration depth. The obtained apparent resistivity measurements have to be inverted using suitable inversion algorithms yielding the specific electrical resistivity distribution along the 2D profiles. High electrical resistivity is normally associated with either frozen conditions and ground ice occurrences or dry blocky layers. Low electrical resistivity points to (high) liquid water contents and unfrozen conditions (Hauck, 2002). At Gámanjunni-3, ERT is combined with seismic tomography. Seismic shots along the profiles produce P-waves, the velocity distribution and resulting travel times of which are used and applied in a subsequent data inversion. The combination of ERT and SRT is used to quantify to what extent the subsurface pores are filled with ground ice, water or air (Hauck et al., 2004; Mollaret et al., 2020) by applying the four-phase model (4PM) (Hauck et al., 2011). The 4PM is based on both ERT and SRT surveys. The combination of both methods is able to distinguish between ice (high resistivity and medium P-wave velocities), water (low resistivity and P-wave velocities) and air (high resistivity, low P-wave velocities). For modelling details, we further refer to Hauck et al. (2011) and Mewes et al. (2017).
Table 1Electrical resistivity tomograms included in this study. Provider refers to the institution involved in the ERT survey. For G-NVE2 co-located ERT and seismic profiles were re-analysed by Hauck and Hilbich (2018).
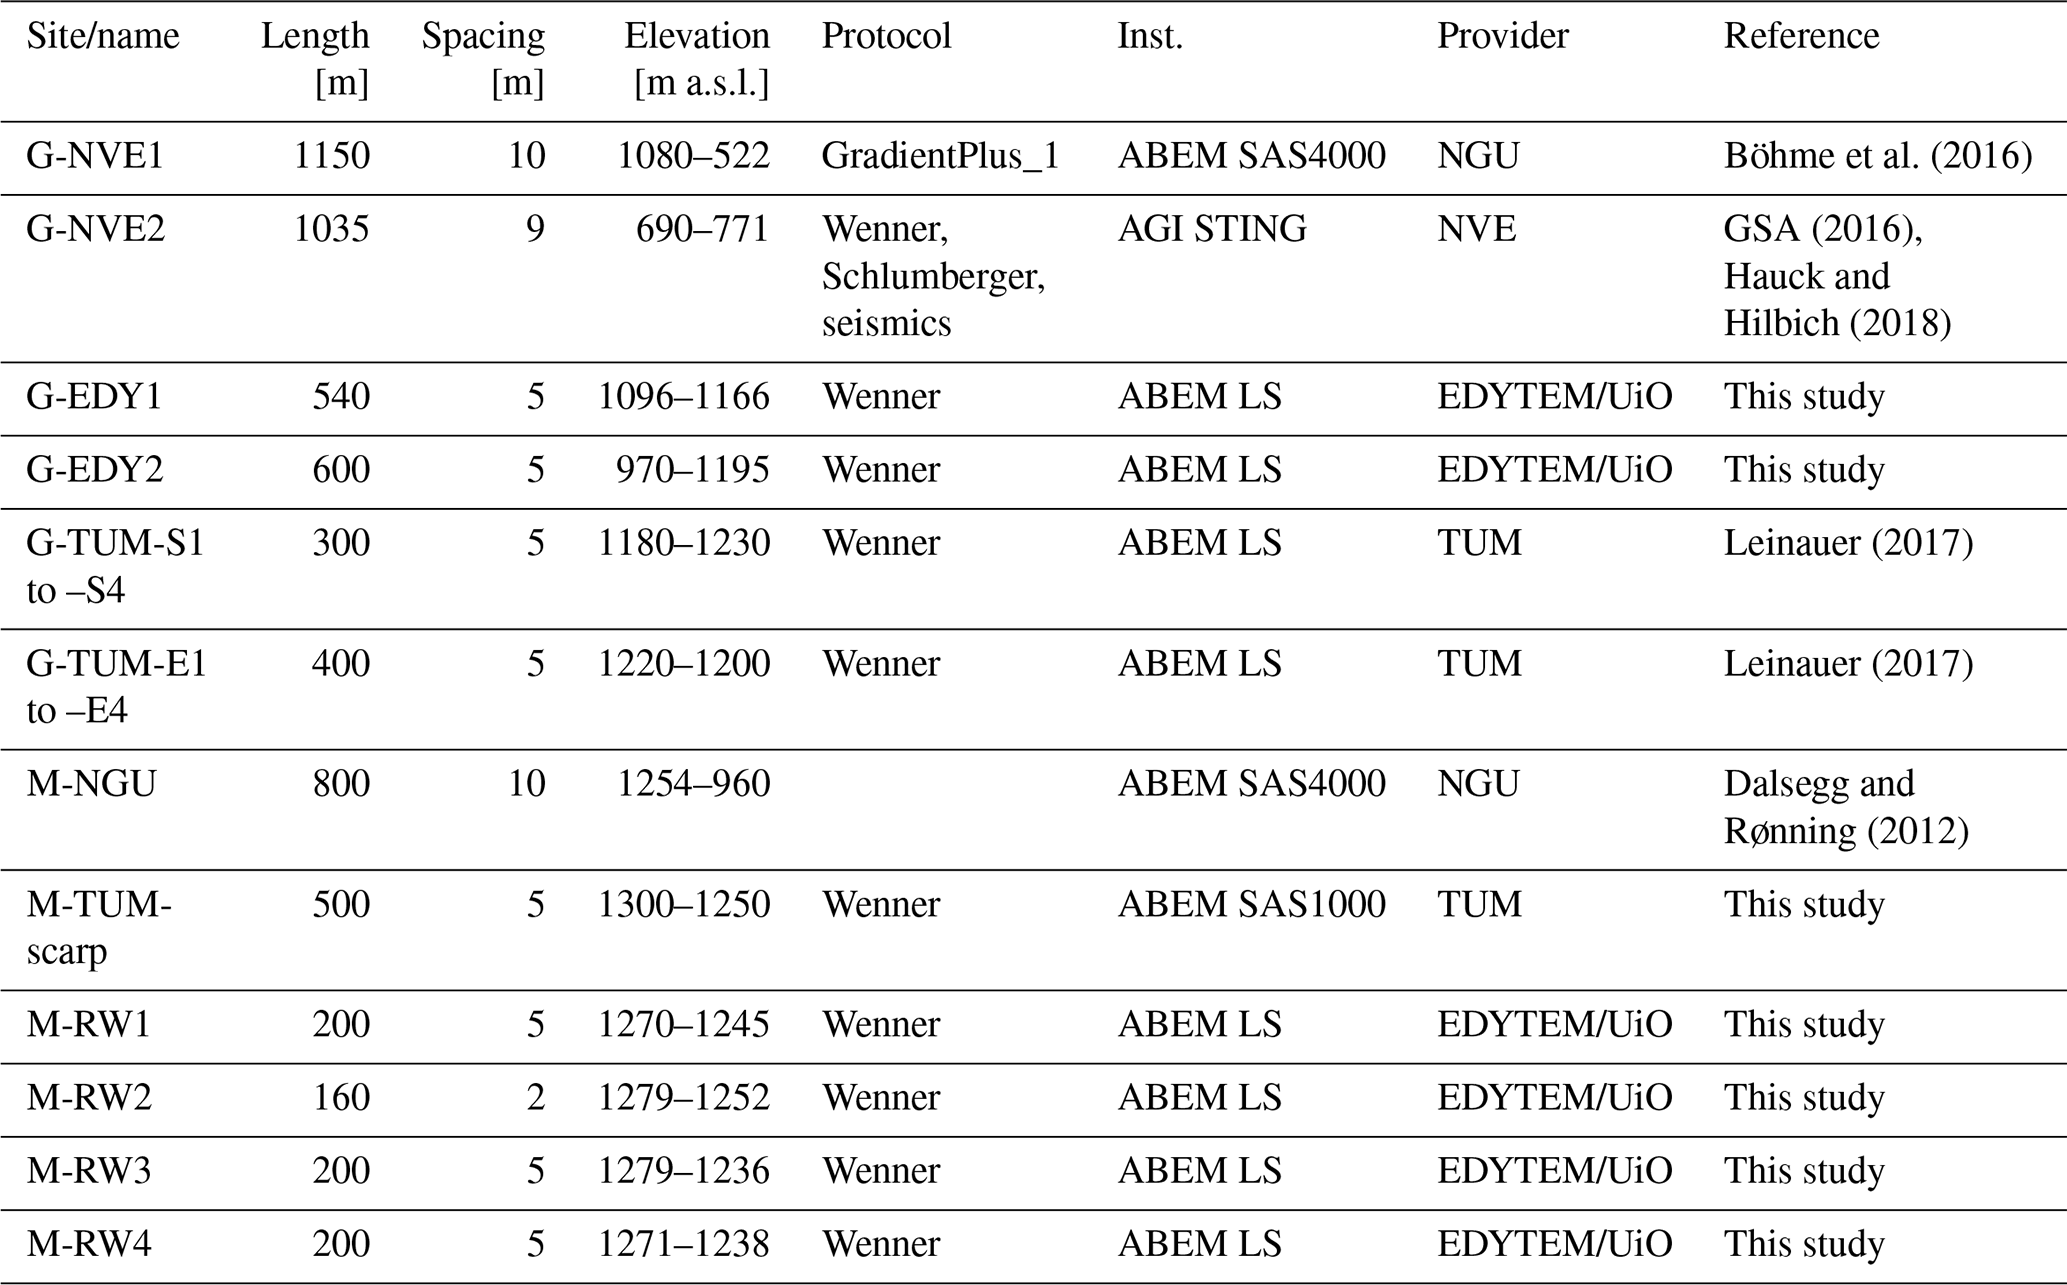
The ERT profiles at Gámanjunni-3 and Mannen were either located on the plateaus, along the valley slopes or in the rock walls. In the rock walls we used steel screws drilled into the bedrock as electrodes, while outside the rock walls, normally steel rods were used. All measurements were carried out during late summer. At the Gámanjunni-3 site, four major datasets were obtained between 2012 and 2019, while at the Mannen site, two major datasets were collected in 2012 and 2018, respectively. Locations and details of the profiles are given in Fig. 1b and Table 1.
ERT data acquisition was conducted with ABEM Terrameters (SAS1000 or LS) using Wenner or Wenner–Schlumberger protocols, with the Wenner protocol providing the best signal-to-noise ratio in difficult rock wall terrains (Dahlin and Zhou, 2004). All ERT profiles were inverted using common inversion parameters within the software Res2Dinv (Loke and Barker, 1995). The colour coding followed the values obtained through the temperature-dependent resistivity analysis performed in the freezing lab of TUM (see Sect. 4.1), and three to five inversion iterations showed sufficient convergence without overfitting. For profiles G-NVE1 and G-NVE2 at Gámanjunni-3 (Fig. 1b) the 4PM was applied.
3.5 Bottom temperature of snow (BTS) survey
BTS measurement is a simple and rapid method to estimate the possibility of permafrost conditions in the field. The principle is that during the late snow season, under a snow cover of at least 80 cm or more, the temperature under the snow cover is decoupled from the temperature in the atmosphere and is hence governed by heat flow from the ground (Haeberli, 1973). BTS values below −3 ∘C indicate a high probability of permafrost, while BTS above −2 ∘C indicates no permafrost. This method has been widely used and validated in mountain areas, especially since the 1980s, and has also been used in Norwegian mountains for local permafrost mapping (e.g. Isaksen et al., 2002; Brenning et al., 2005; Lewkowicz et al., 2012). At both Gámanjunni-3 and Mannen BTS surveys were carried out on 9 and 1 March 2017, respectively (Fig. 1b). The survey was done using a long stick with a thermistor mounted at the bottom. At each site the stick is penetrated through the snow, and the BTS temperature is registered using a standard multi-meter. At least two measurements are carried out at each site to address small-scale variability.
3.6 Ground temperature modelling
The transient heat flow model CryoGrid 2D (Myhra et al., 2017) solves the two-dimensional heat diffusion equation. The thermal properties (e.g. volumetric heat capacity and thermal conductivity) depend on temperature and material type. We used the MATLAB-based finite-element method MILAMIN package (Dabrowski et al., 2008). CryoGrid 2D models conductive processes, and thus non-conductive heat flow processes such as convective water or airflow are neglected. The model domain is constructed as a 2D slice through a slope up to a chosen depth. An unstructured triangular mesh is generated for various subsurface thermal regions, i.e. regions with a distinct combination of water (liquid and ice), mineral, organic and air volumetric contents. The maximum allowed triangle area, which is a measure of the spatial resolution, typically increases with depth and is assigned to every thermal region. We used bedrock thermal conductivity of 2.5 Wm−1 K−1 for both Mannen and Gámanjunni-3 slopes. Along the right and left boundaries we prescribe zero-flux boundary conditions. The lower boundary (at a depth of 6000 m) is defined by a geothermal heat flux of 50 m Wm−2 (Slagstad et al., 2009).
The upper boundary conditions are GST time series for the surface nodes. To calculate GST at each node, we first used SAT extracted from seNorge for elevations between the valley bottom and top plateau at both sites, where SAT is linearly interpolated between the surface nodes, following a lapse rate of 6.4 ∘C km−1 for Mannen and 4.8 ∘C km−1 for Gámanjunni-3 (Magnin et al., 2019). We subsequently estimate GST using N factors between 0 and 1 that link SAT and GST, hence accounting for the surface offset (Riseborough et al., 2008). The Nf factor describes the winter surface offset due to snow coverage; values close to 1 indicate little to no snow coverage, while values closer to 0 indicate a thick snow cover. Nt factors relate surface offsets during summer, which depend on factors such as vegetation cover, direct solar radiation and shading, albedo, and soil moisture. We applied empirical results derived from snow studies in Norway, relating Nf factors to annual mean snow height (Gisnas et al., 2013, 2016a). In our modelling we assume Nf=1 for steep rock walls (slope >60∘) that are frequently snow-free, whereas values of 0.25–0.5 can be used on the mountain plateaus (slope <30∘), where snow cover is thicker depending on precipitation and wind redistribution (Gisnås et al., 2016a). For the plateau, Nf was set to 0.5 on Gámanjunni-3 and 0.3 at Mannen due to higher snow cover at the latter site. The intermediate values of Nf are used at slope gradients between 30 and 60∘.
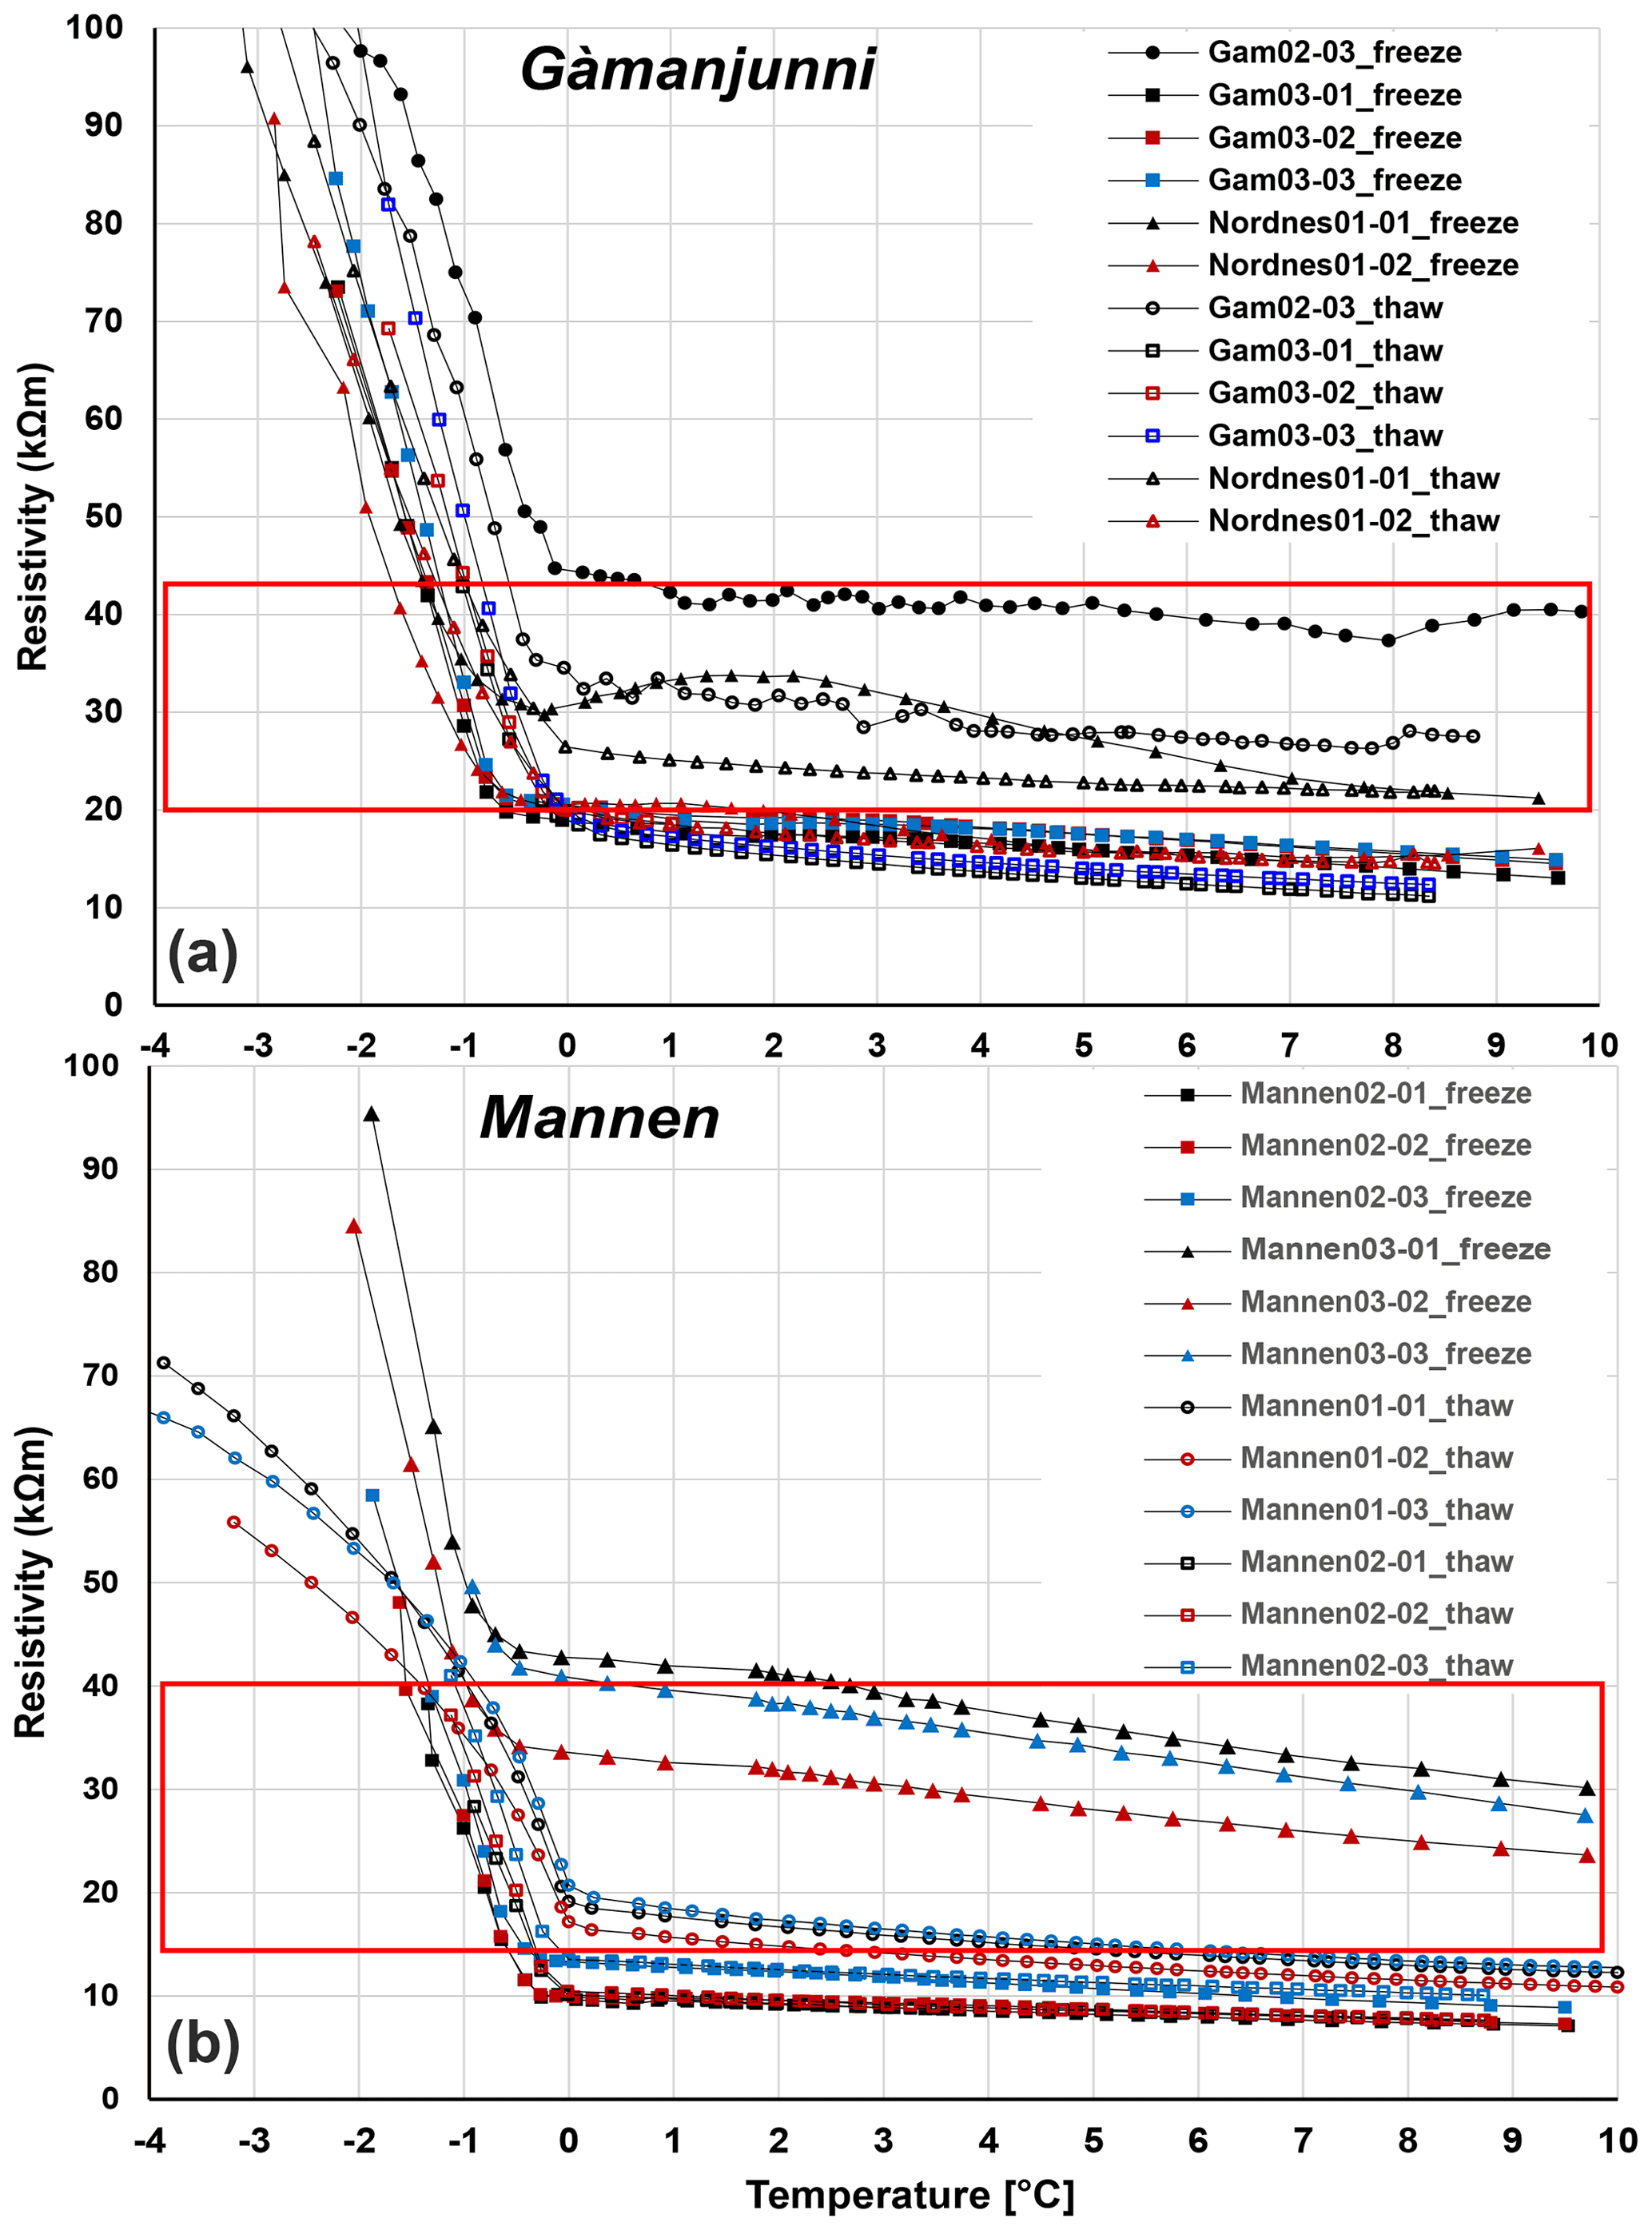
Figure 3Temperature–resistivity plots of all successful test series for rock samples from (a) Gámanjunni-3 and Nordnes as well as (b) the Mannen plateau. The red rectangles denote the transition zone between frozen and unfrozen conditions defined based on these laboratory tests. These calibrations are used for plotting in Figs. 8, 9, 10, 12, B1 and B2.
The 2D geometry of the model domains has been extracted from a gridded 1 m digital elevation model (https://www.hoydedata.no, last access: 1 November 2020) along an approximately west–east (Gámanjunni-3) or south-west to north-east transect (Mannen) (Fig. A1). There are normally larger temperature gradients close to the surface than in deeper layers. Hence, we constructed nodes with a distance of 0.05 m at the upper boundary. The subsurface thermal regions are constructed according to the geological profile for Gámanjunni-3 (Fig. 2) and our mapping of surficial sediments along the profile using orthophotos for Mannen (Fig. A1). We then applied a stratigraphy, i.e. volumetric contents of the ground constituents, for the various surficial sediment classes at both the surface and depth as presented in Westermann et al. (2013) (Fig. A1).
For both sites, the model was initialised at deglaciation. When we assume warm-based conditions at the bottom of the ice sheet (0 ∘C), we used the methods to reconstruct deglaciation curves and climate data described by Hilger et al. (2021). We ran the model yearly until 1 September 1873, then at weekly time steps, and in the period 1 January 2000–31 December 2018 at daily time steps.
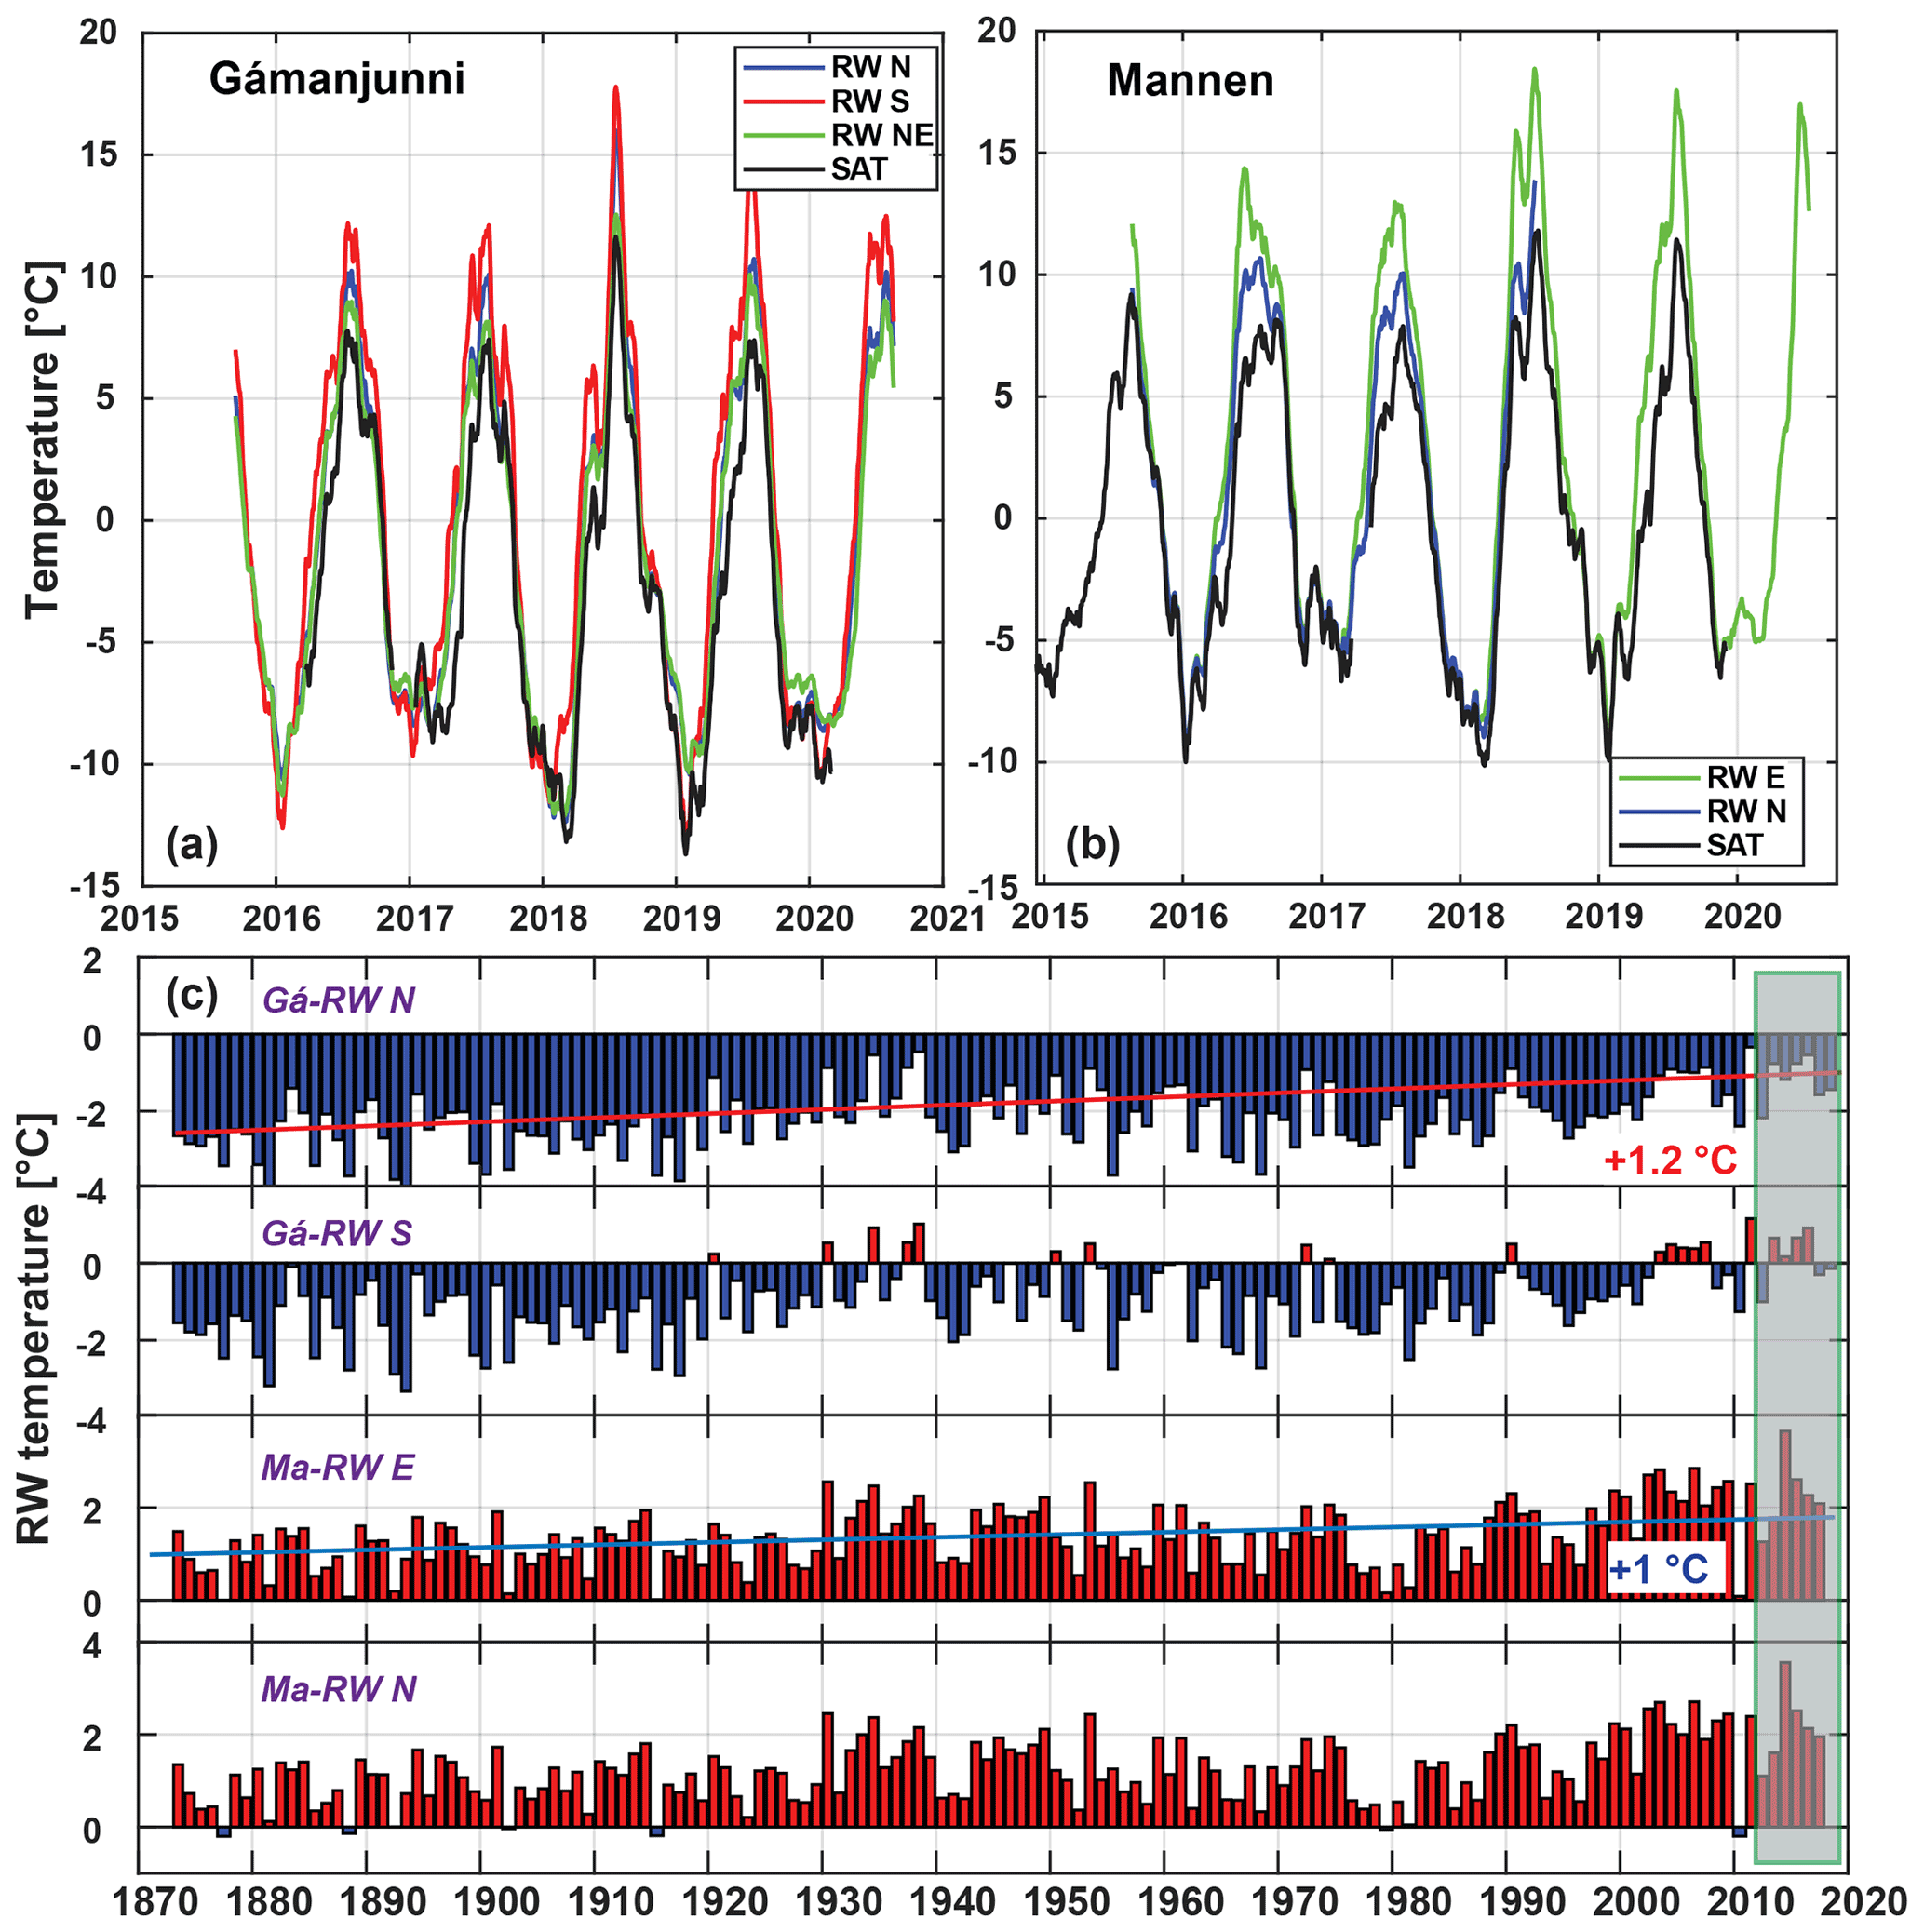
Figure 4Measured and reconstructed rock wall (RW) surface temperatures and SAT on the plateaus at (a) Gámanjunni-3 and (b) Mannen in different topographic aspects (N: north, for example). The temperature records show the differences in topographic aspect, with higher differences during spring and summer for the different aspects. (c) Reconstructed long-term annual average RW temperature for selected RW loggers at Gámanjunni (Gá) and Mannen (Ma) since 1870. The series show inter-annual variability and increasing mean temperatures of 1 ∘C or above for the 150-year period. The rockslide and RW temperature monitoring period since 2011 is indicated by the shaded area and denotes some of the highest temperatures during the 150-year period.
4.1 Laboratory analysis
The laboratory analysis relates rock temperatures to measured electrical resistivity. The rock samples from Gámanjunni-3 showed a similar pattern, with a sharp resistivity increase between 20 and 40 kΩm at the equilibrium freezing temperature of ca. −0.5 ∘C (Fig. 3a). For areas with electrical resistivity above this range we expect negative temperatures, and below we expect unfrozen conditions. The rock samples from Mannen revealed a sharp increase in resistivity below the equilibrium freezing temperature of ca. −0.3 ∘C, depending on bedrock type and freeze or thaw setting (Fig. 3b). The sharp increase in resistivity was between 15 kΩm and close to 50 kΩm, a range we defined as the transition zone between freezing and thawing conditions.
4.2 Gámanjunni-3
Temperature monitoring and reconstruction
The three rock wall loggers at the unstable slope are all located at ca. 1200 m a.s.l. and oriented towards south (RW-S), north (RW-N) and north-west (RW-NW) (Fig. 1). The RW-S site showed average rock surface temperatures of 0.05 ∘C between 2015 and 2019, while the two other loggers had clearly sub-zero temperatures of −1.6 and −1.3 ∘C for RW-N and RW-NW, respectively (Fig. 4a). During the same period mean SAT on the plateau was −3.1 ∘C, showing that rock wall temperature was at least 1.5 ∘C higher than air temperature. For the south-oriented rock wall, temperatures close to 3 ∘C higher than SAT on the plateau were recorded. The measured RW temperatures represent a period of high temperatures in comparison to the reconstructed RW temperatures since 1870, as shown in Fig. 4c. At Gámanjunni-3, the north-exposed logger showed sub-zero mean annual RW temperatures during the whole reconstruction period, while for RW-S positive annual averages were mostly estimated since 2000, along with some years during the 1930s. The reconstructed long-term series clearly demonstrate the warming since the LIA, which increased by between 1 and 1.2 ∘C for Gámanjunni-3 and Mannen, respectively.
The GST loggers placed in the rockslide area (Fig. 1b) showed mostly average annual temperatures below 0 ∘C, with some exceptions. Average annual temperatures on the toe of the rockslide at ca. 750 m a.s.l. revealed values between −1 and −1.5 ∘C, which normally indicate high permafrost probability. On the rock glacier, annual GST values are higher and between −1 and 0 ∘C. Close to the moving block at ca. 1050 m a.s.l. a mean annual GST of −2 ∘C is measured (Eriksen, 2018).
The few BTS measurements available (Fig. 1b) all showed values below −3∘C. These observations altogether place the site in the discontinuous mountain permafrost zone (Magnin et al., 2019; Farbrot et al., 2013; Gisnås et al., 2016a).
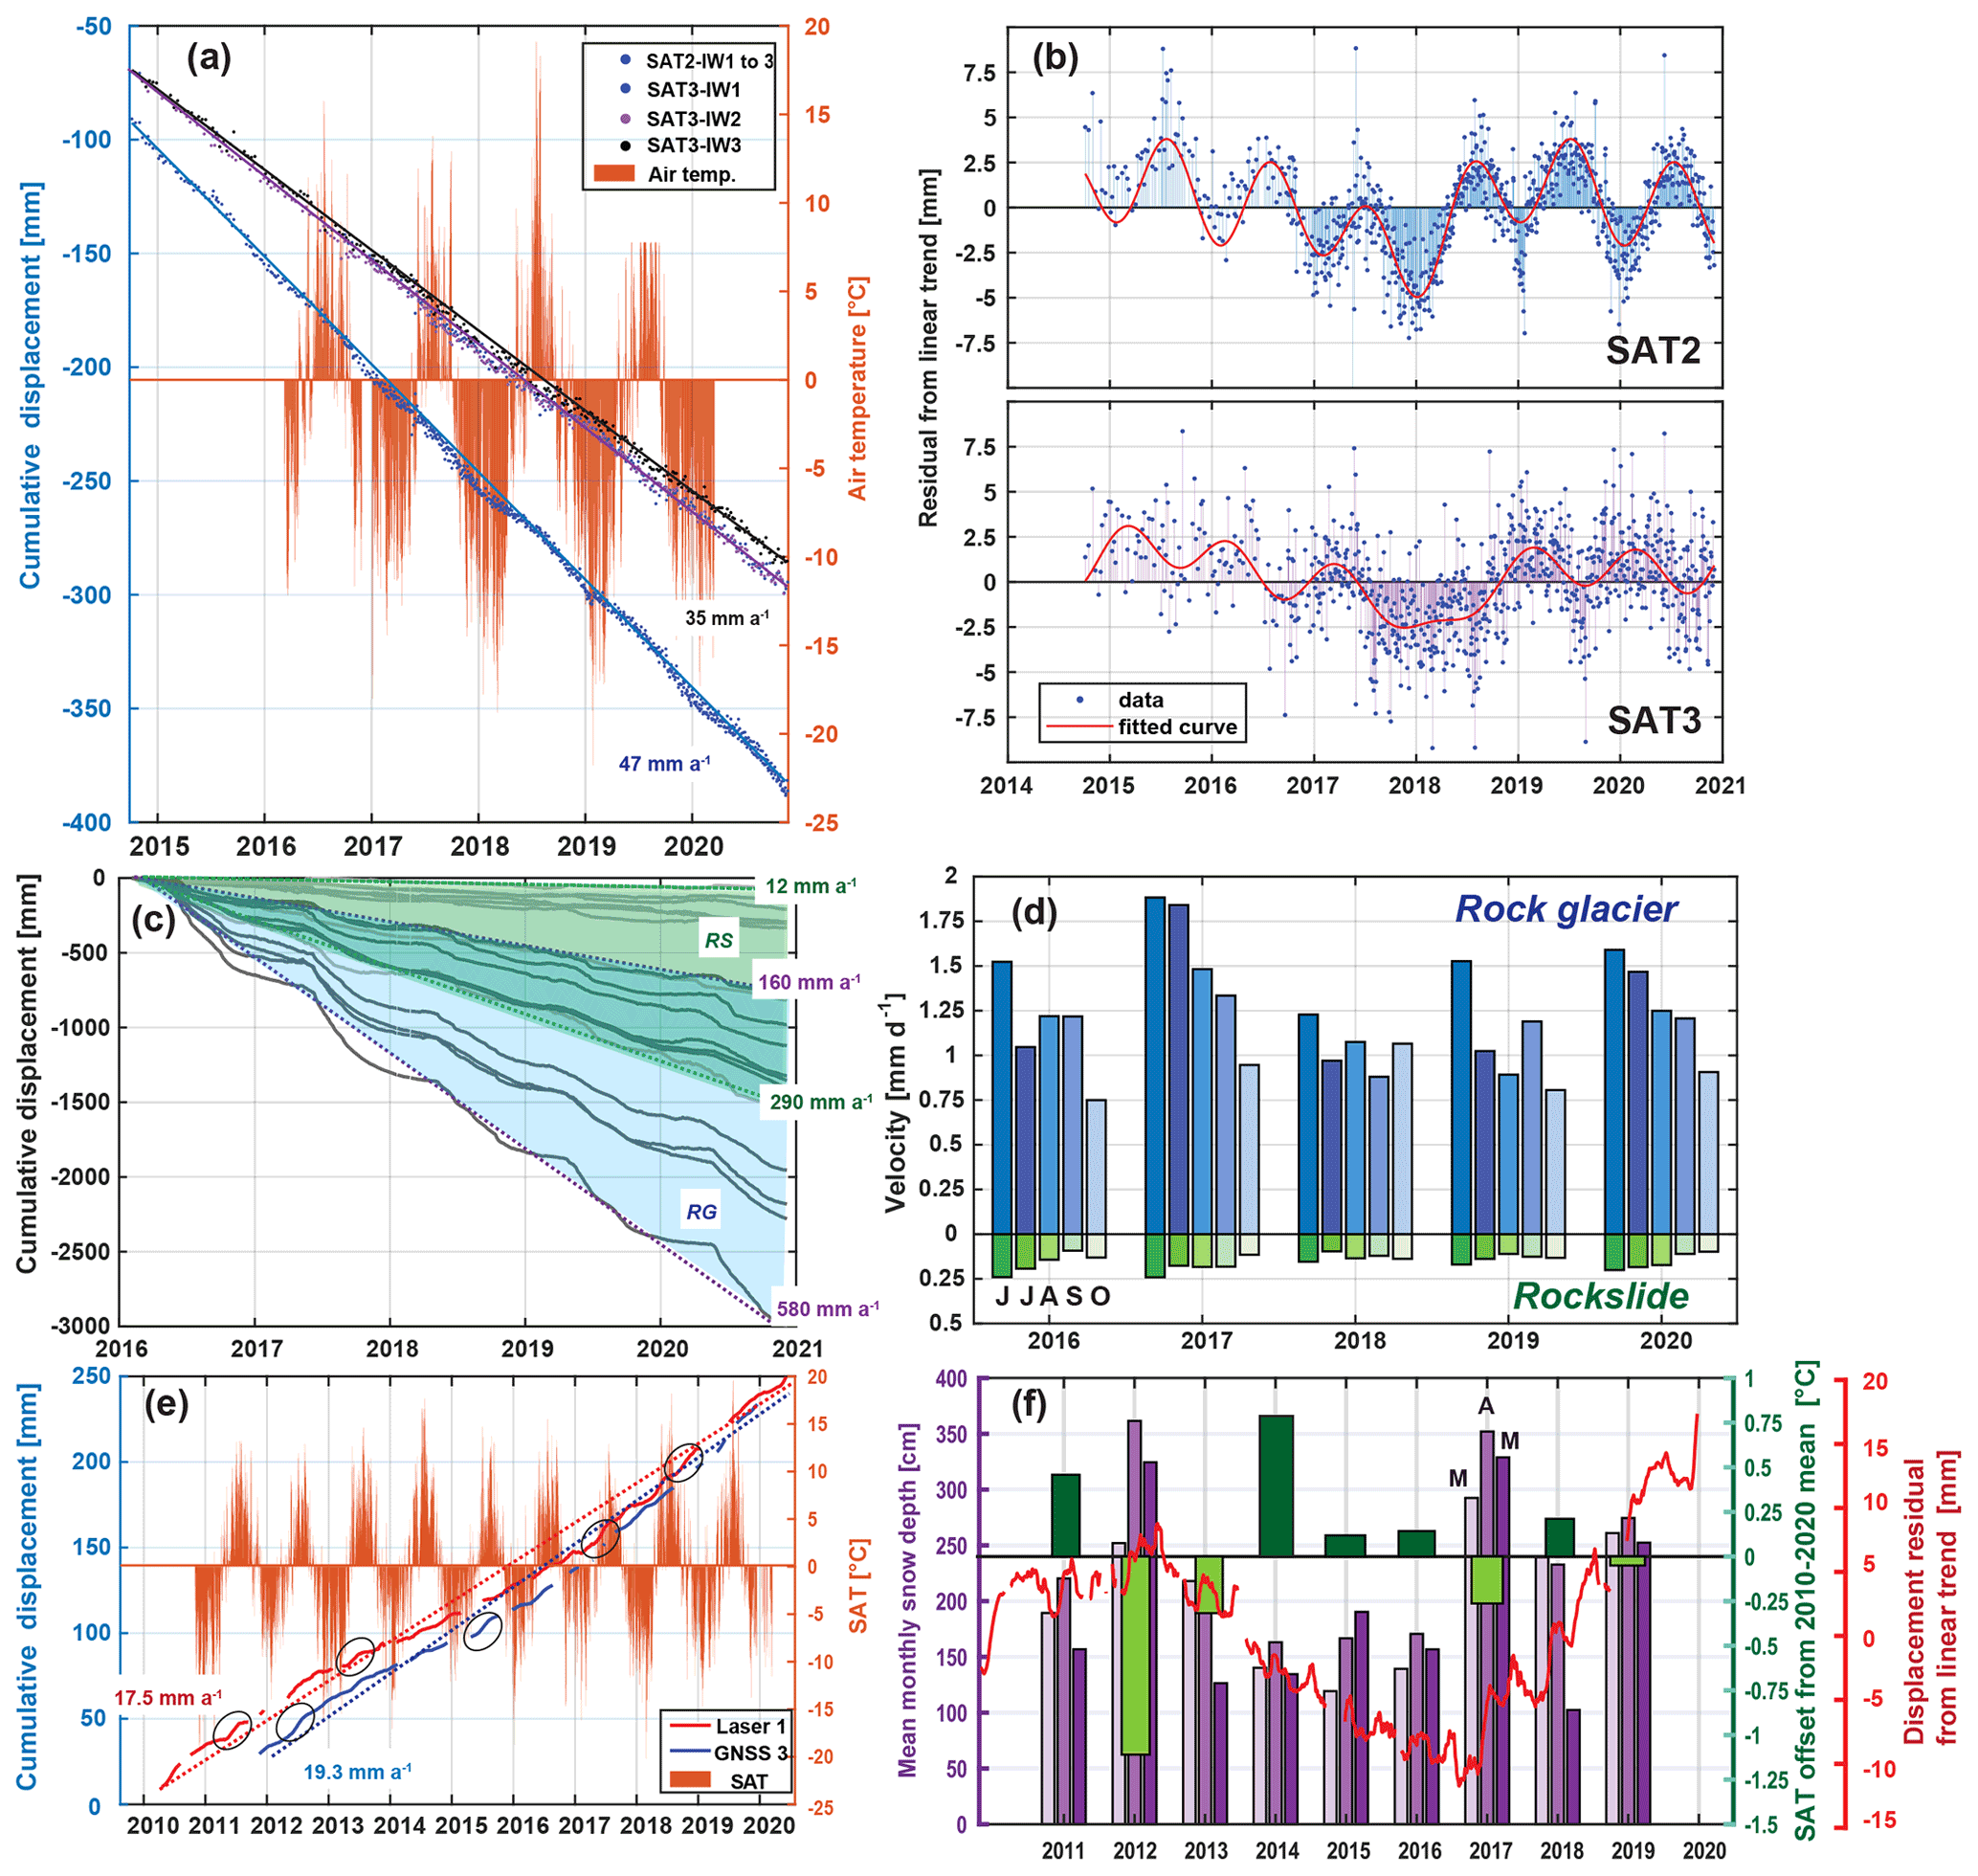
Figure 5Displacement measurements at Gámanjunni-3 (a–d) and Mannen (e, f). (a) Cumulative displacement rates from the three satellite corner reflectors on Gámanjunni-3, showing average annual displacement rates between 35 and 47 mm a−1 along satellite radar LOS. (b) Residuals from the linear trend for SAT2 (upper) and SAT3 (lower). We fitted a third-order sinusoidal curve (red line) to the residual points. The fit indicates annual variation and a trend towards negative residuals until 2018. (c) Cumulative displacement along GB radar LOS derived at a total of 18 points dispersed over the rockslide (RS) and rock glacier (RG) area (Fig. 1) based on GB InSAR. The green shaded envelope shows the RS points, and the light blue envelope indicates the RG points. Velocities between 10 and close to 600 mm a−1 are encountered. (d) Average daily displacement averaged over a month along GB radar LOS for one GB InSAR point at the rock glacier (blue bars) and a point at the rockslide area (green bars). For each year the months between June and October are shown. The graph shows the highest velocities early in the melting season and the highest absolute velocities in 2017. (e) Mannen: cumulative displacement rates for GNSS3 and Laser1, plotted with SAT since 2010. There are obvious acceleration phases (some indicated by ellipses) during early summer (May–June). (f) Residuals from the linear trend for Mannen Laser1 (red line) against MAAT deviation between 2010 and 2020 (green bars) as well as snow depth (purple bares) for the months March through May. There is a clear decrease in displacement rates between 2013 and 2017, which seems to be related to higher air temperatures and lower snow coverage.
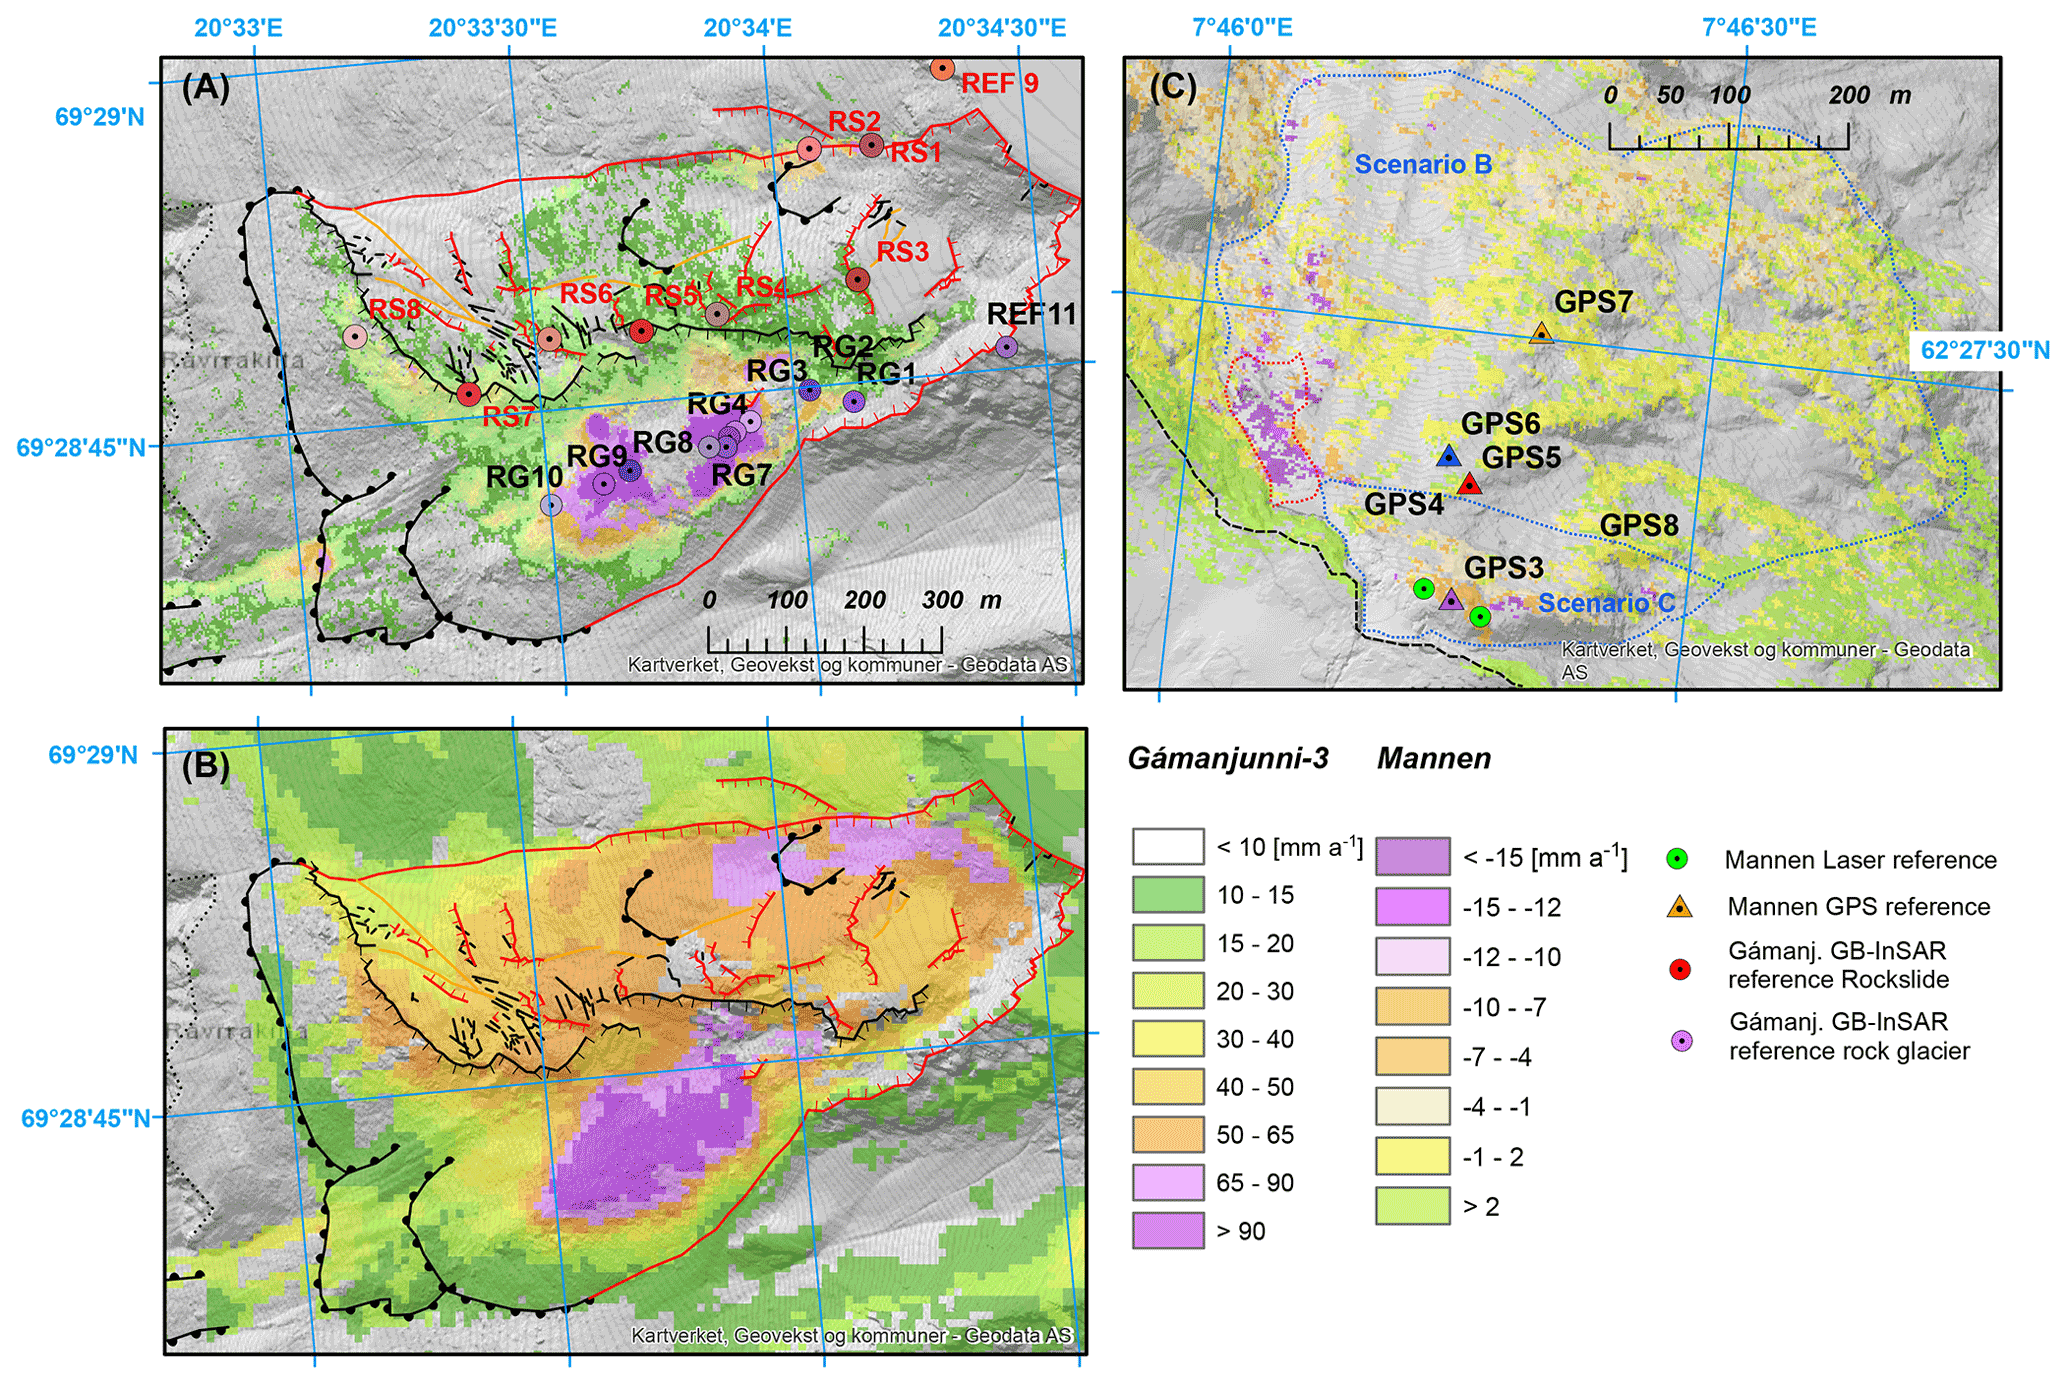
Figure 6Spatial distribution of displacement rates for Gámanjunni-3 (a, b) and Mannen (c). (a) The GB InSAR map is an average for the summer 2020. The circles indicate the position of time series sampling shown in Fig. 5 on the rockslide (red) and the rock glacier (violet). The colour depth indicates relative differences in velocity. (b) Satellite 2D InSAR-derived averaged summer displacement rates collected between 2009 and 2014 using TerraSAR-X (Eriksen et al., 2017). Both show clearly higher velocities in the rock glacier area. (c) GB InSAR displacement rates along GB radar LOS of the Mannen instability from summer 2020, showing relatively low displacement rates outside the upper scar area. The recently failed rockslide Veslemannen (Kristensen et al., 2021) is delineated by the dotted red line. The dashed black line indicates the upper scarp area. The failure scenarios are based on Dahle et al. (2008). Note the different velocity scales for Gámanjunni-3 and Mannen. All base maps from © Statens Kartverk.
Surface displacement
For Gámanjunni-3, continuous laser and GNSS measurements are available from 2018; however, the data are too short for assessing long-term variations. The three satellite corner reflectors on site provided a continuous data series since 2015 based on Copernicus Sentinel-1 data. They show a homogenous movement of between 35 and 47 mm a−1 along satellite radar LOS (Fig. 5a). The residuals from the linear trend clearly show seasonal variations with higher velocities during early spring and summer, with the largest negative residuals during winter 2017–2018 (Fig. 5b). Time series derived from GB InSAR at all 18 points revealed velocity variations between 160 and 580 mm a−1 along GB radar LOS for the 10 points on the rock glacier and between 12 and 290 mm a−1 for the 8 points in the rockslide area (Fig. 5c, d). The data showed a clear seasonality, which is attributed to the insecurity of the data gathered when the ground is snow-covered. Monthly velocities during the snow-free months revealed in most cases (1) higher displacement rates early in the melting season than later and (2) the highest summer velocities during 2017 for both the rockslide and the rock glacier part of the instability (Fig. 5d). According to the RW and SAT observations, 2017 was a particularly warm year, and RW-S shows above-zero mean annual RW temperatures (Fig. 5c). The distribution of velocity over the rockslide area shows relatively similar velocities over most of the body including the sliding block of 40–80 mm a−1, decreasing rapidly towards the slide front at 600 m a.s.l. (Eriksen et al., 2017) (Fig. 6a, b). The highest velocities are obtained on the rock-glacier-like landform forming the southern part of the instability, with surface velocities of >100 mm a−1 (Fig. 6b). GB InSAR revealed similar displacement patterns as the TerraSAR-X data (Fig. 6a).
Numerical modelling
The temperature field revealed by the 2D temperature modelling clearly showed permafrost conditions in the slopes of Gámanjunni-3 down to 600–700 m a.s.l. at the end of the 19th century, which includes most of the moving unstable part of the slope (Fig. 7a). Since the end of the LIA, permafrost has warmed and degraded at its lower boundaries (Fig. 7b), and today probably only around half of the moving part of Gámanjunni-3 is influenced by permafrost, while the lower parts are modelled to be permafrost-free today (Fig. 7c). On the plateau, maximum snow cover is around 1 m thick, while the steep rock walls are snow-free. Snow cover and water content are sensible parameters for the modelling, modulating the permafrost temperature and geometry, as shown in the sensitivity tests provided in the Appendix (Fig. A2). A maximum permafrost thickness of ca. 300 m is modelled, which is in agreement with similar settings in which we measure deep permafrost temperatures, such as in Tarfala in northern Sweden or Juvvasshøe in southern Norway (Isaksen et al., 2001). The lower permafrost boundary is modelled to be relatively stable during the 150-year period, demonstrating that relative thick permafrost can be expected in places.
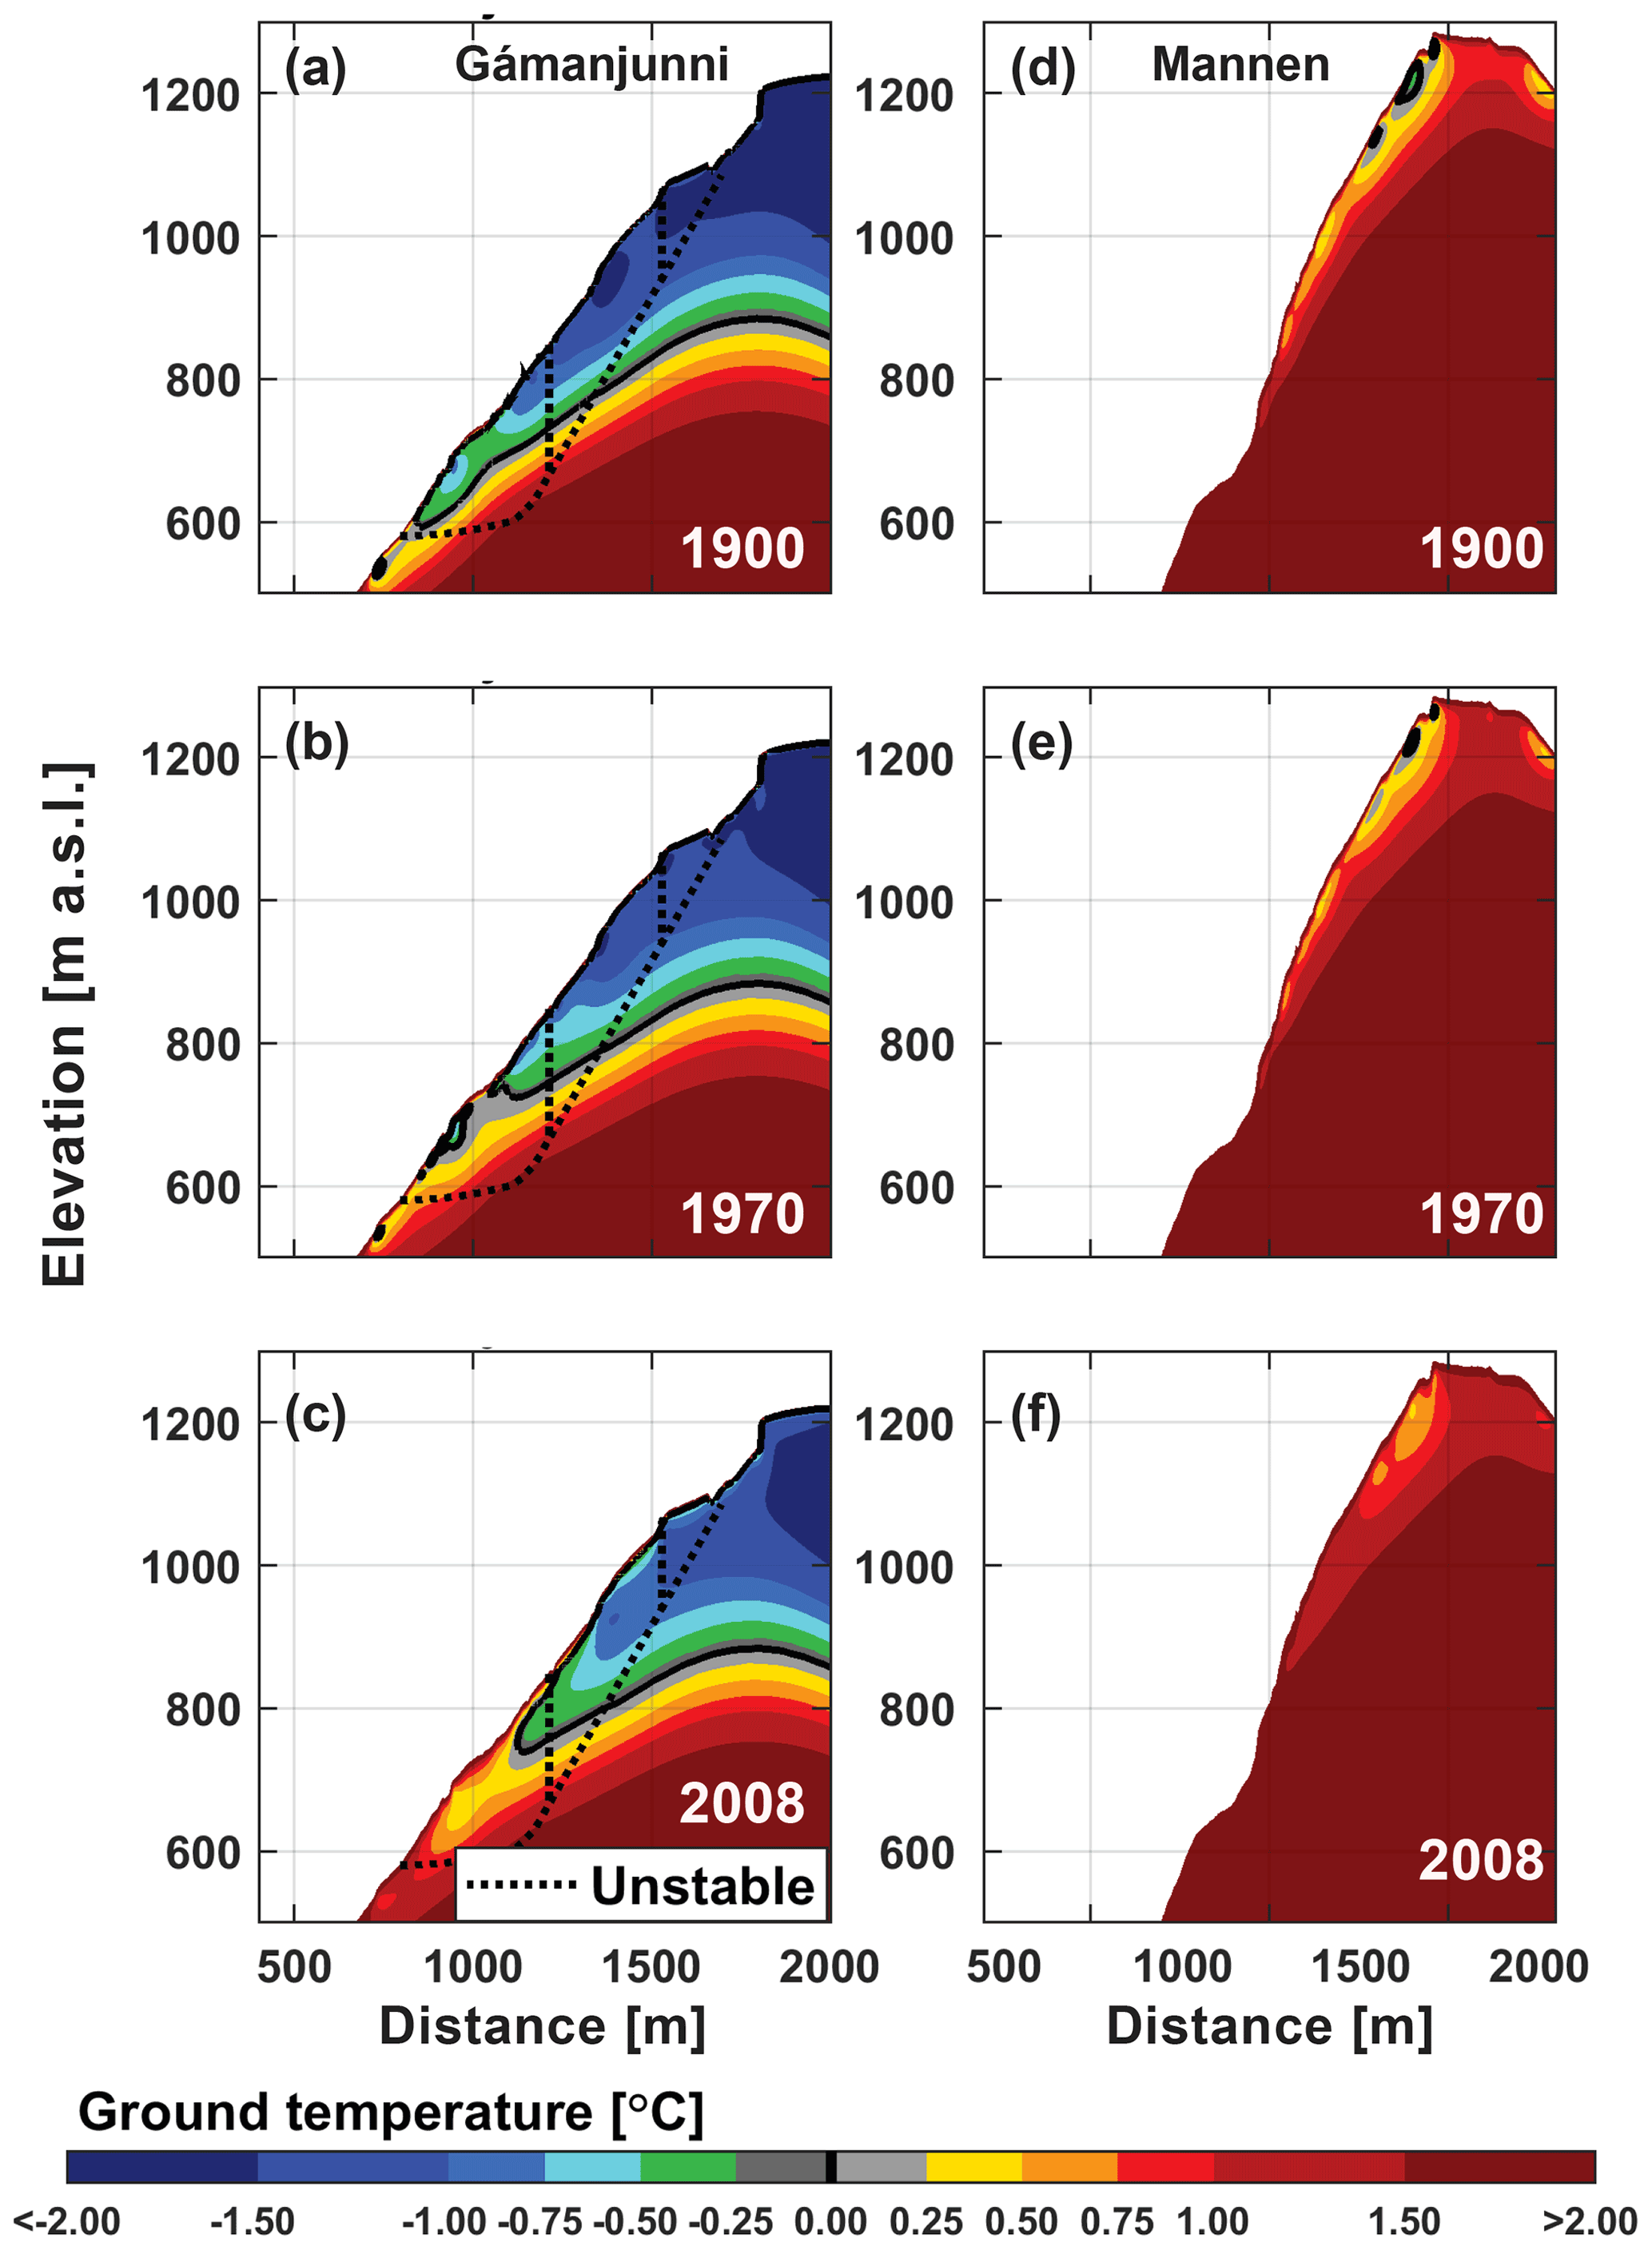
Figure 7Modelled mean annual ground temperature for Gámanjunni-3 (a–c) and Mannen (d–f) for three different years (1900, 1970 and 2018). The stippled line denotes the instability at Gámanjunni-3 based on Böhme et al. (2016). The black solid lines in the plots show the 0 ∘C isotherm. For parameterisation and sensitivity plots, see Figs. A1 and A2.
Geophysical surveys
The two long profiles down the slope from the moving block at ca. 1050 m a.s.l. (G-NVE1, Fig. 8a) and along the slope at ca. 750 m a.s.l., crossing a rock-glacier-like feature (G-NVE2, Fig. 8b), show consistent patterns (see also Fig. B1b). General resistivity values of the unfrozen and intact bedrock at depth seem to be around 1–10 kΩm. Surface resistivity values in the downslope profile show a maximum of 700–900 m a.s.l. (40–100 kΩm) and further decrease to below 2 kΩm towards lower elevation (Fig. 8a). This altitudinal transition roughly coincides with the numerical temperature modelling (see Fig. 7c). The profile G-NVE2 is oriented from south to north (Fig. 8b). Both profiles show maximum resistive surface layers of up to 50 m in thickness. In combination with the GST values by Eriksen (2018) and NVE this resistive near-surface layer could indicate permafrost patches. The overall resistivity values within the rock glacier are lower (10–20 kΩm), and the more resistive surface layer is somewhat shallower (ca. 25 m) compared to the rockslide part in the centre of the profile.
The 3D profiles (G-TUM-S1-S4 and G-TUM-E1-E4) on the plateau clearly demonstrate the cooling influence of the NW-oriented rock wall, which becomes less pronounced with distance from the rock wall (Figs. 9a–c, B1b). In addition, low-resistivity areas (<20 kΩm) are visible, probably indicating thawed conditions associated with water-filled fractures and cracks in prolongation of the exposed sliding surfaces (Fig. 9a, b). These discontinuities oriented parallel and perpendicular to the profiles may account for differences in overlapping tomograms. The east-oriented profiles (TUM-E) are clearly influenced by the SW-oriented rock wall, with generally lower resistivity compared to TUM-S close to the NW-oriented rock wall (>60 kΩm) areas, which are highly influenced by the rock walls (Figs. 10, B1c).
The G-EDY1 ERT profile crosses the south-exposed rock wall and shows lower resistivity values close to the rock wall surface (<20 kΩm), decreasing towards the north side of Gámanjunni-3 (Fig. 10a). The transition between the rock wall and the moving block below is covered by blocky scree material and shows high resistivity (>100 kΩm) (Fig. 10a). The G-EDY2 ERT profile transverses the NW-oriented rock wall, with higher resistivity at the surface, clearly indicating the temperature differences between the two rock faces (Fig. 10b). Also here, high-resistivity patches are found under the moving block and the cooled rock wall, while lower resistivity values are found under the snow-covered plateau (<15 kΩm) (Fig. 10b). The moving block is an area of high resistivity, with either possible permafrost influence or the presence of air-filled fractures. These higher values are also visible at a cross-profile over the structure (G-TUM block) (Fig. 10c).
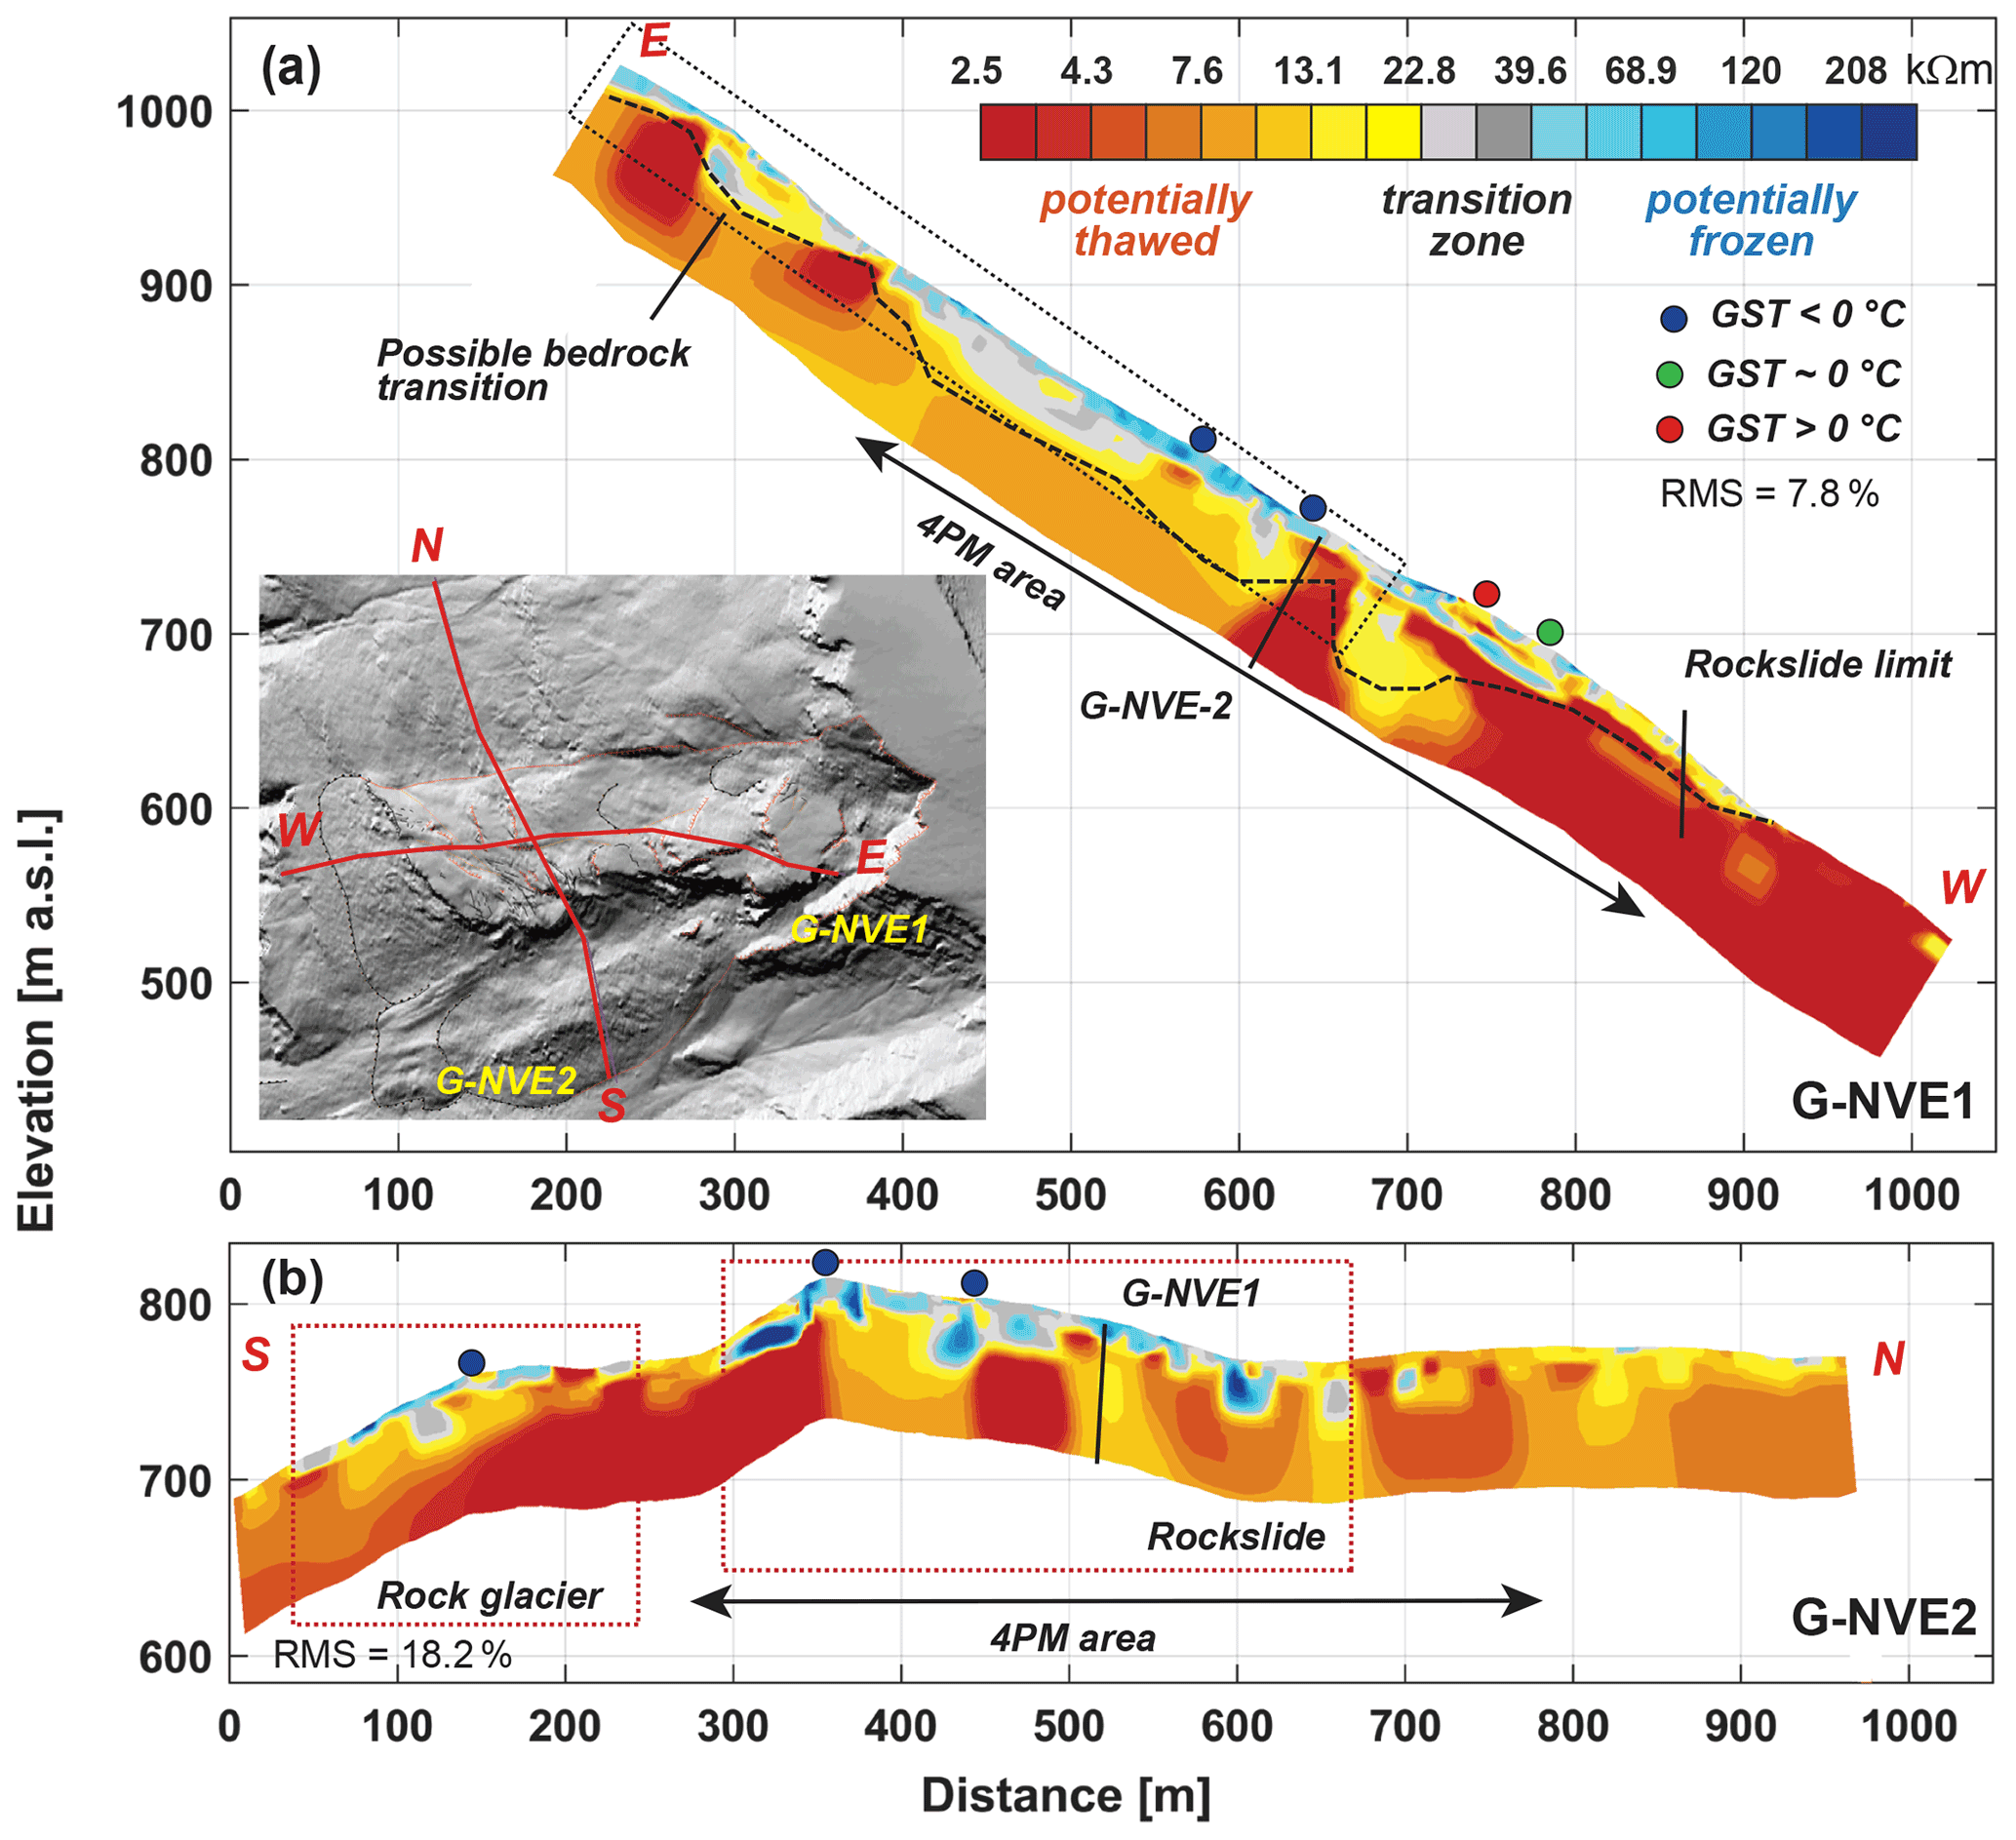
Figure 8The long ERT profiles for Gámanjunni-3. The colour scale follows the laboratory analysis shown in Fig. 3 and is a logarithmic scale. (a) G-NVE1, showing high-resistivity layers down to ca. 700 m a.s.l. (box). The dashed line indicates the possible transition to solid bedrock. (b) G-NVE2, the cross-profile over the rock glacier and the lower rockslide area, indicated by the red boxes. The circles in both profiles indicate the location and mean annual GST in the vicinity of the profiles based on Eriksen (2018) and subsequent measurements (Gudrun D. Majala, NVE, unpublished data, 2020). They show sub-zero temperatures in areas with high-resistivity surface layers and higher values below 700 m a.s.l. The part of the profile used for the four-phase model (4PM) is indicated in both profiles (Fig. 11).
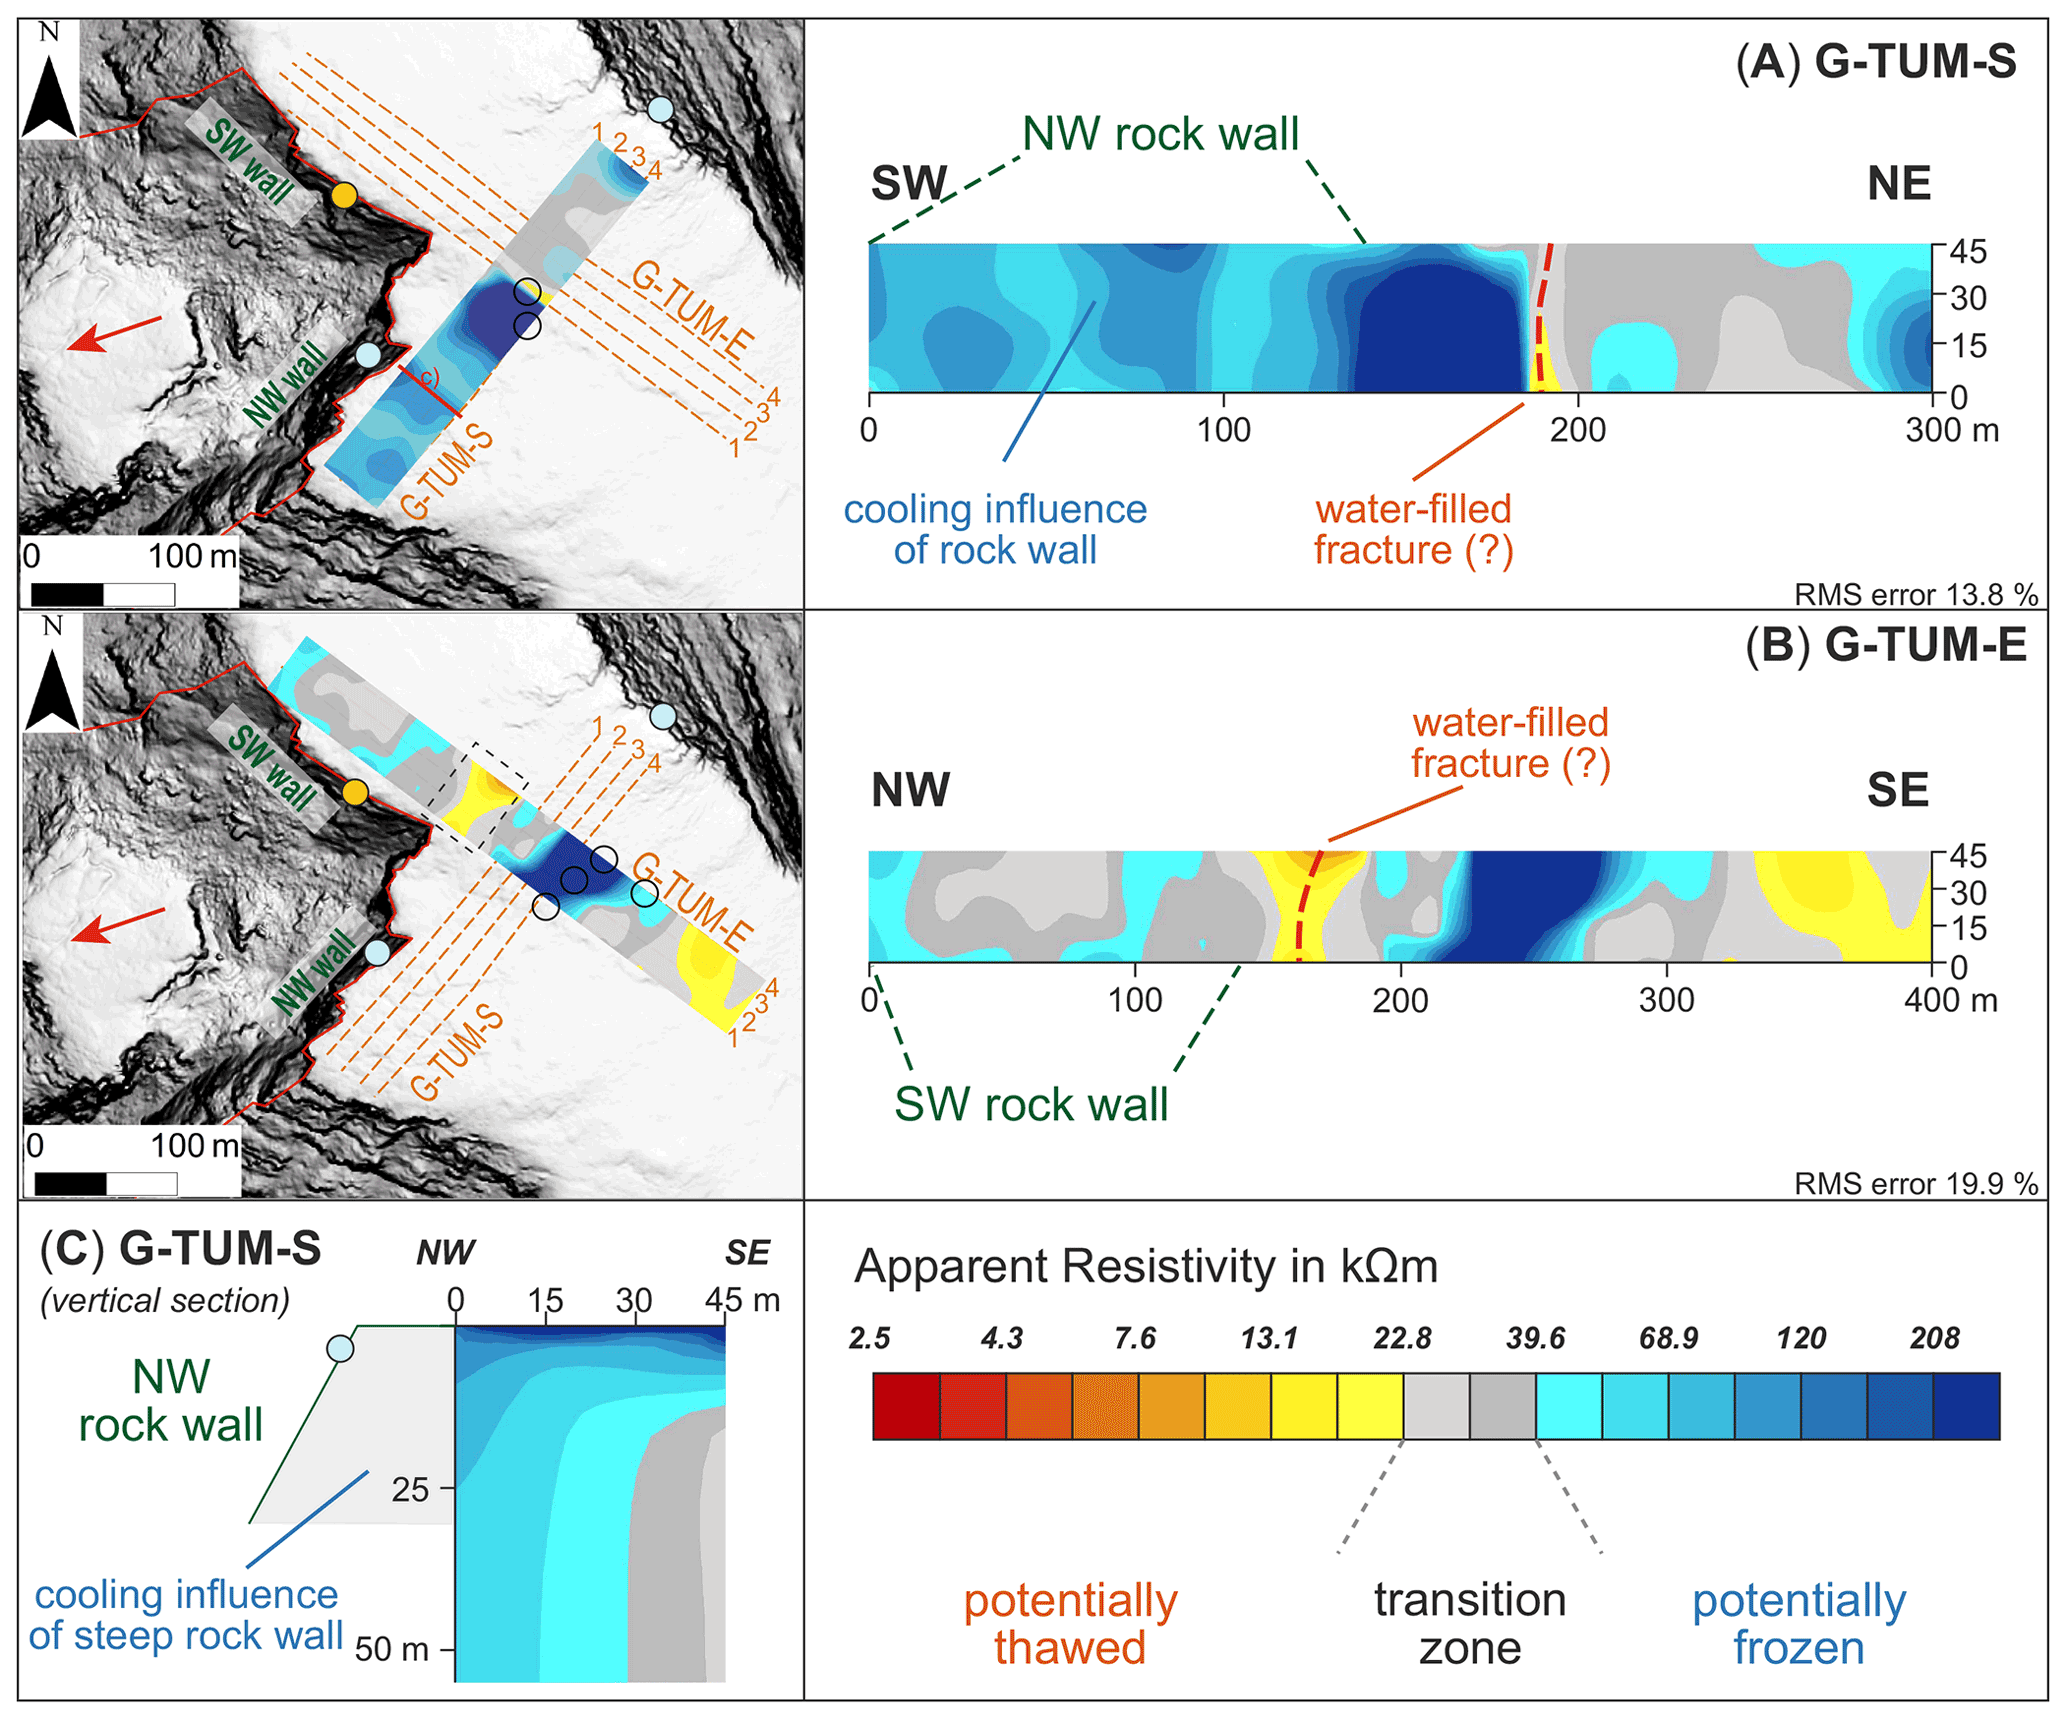
Figure 9Quasi-3D surveys on the Gámanjunni-3 plateau above the instability. The illustration shows a section interpolated for a depth of 10 m for (a) the south-oriented profiles (G-TUM-S) and (b) the east-oriented profiles (G-TUM-E). There is high variability in resistivity, and unfrozen parts indicated are interpreted as water-filled fractures. See main text for more details. (c) Interpolated vertical profile close to the NW-oriented rock wall, showing the thermal influence of the steep and probably snow-free area. The location of the cut is shown with a red solid line in (a). The black circles denote BTS measurements, all showing a temperature below −3 ∘C and probable permafrost. These measurements are all situated in high-resistivity areas. The filled circles show average annual temperatures for the rock wall loggers (Fig. 4a), with light blue equal to or below −1 ∘C and orange above 0 ∘C. Base maps © Statens Kartverk.
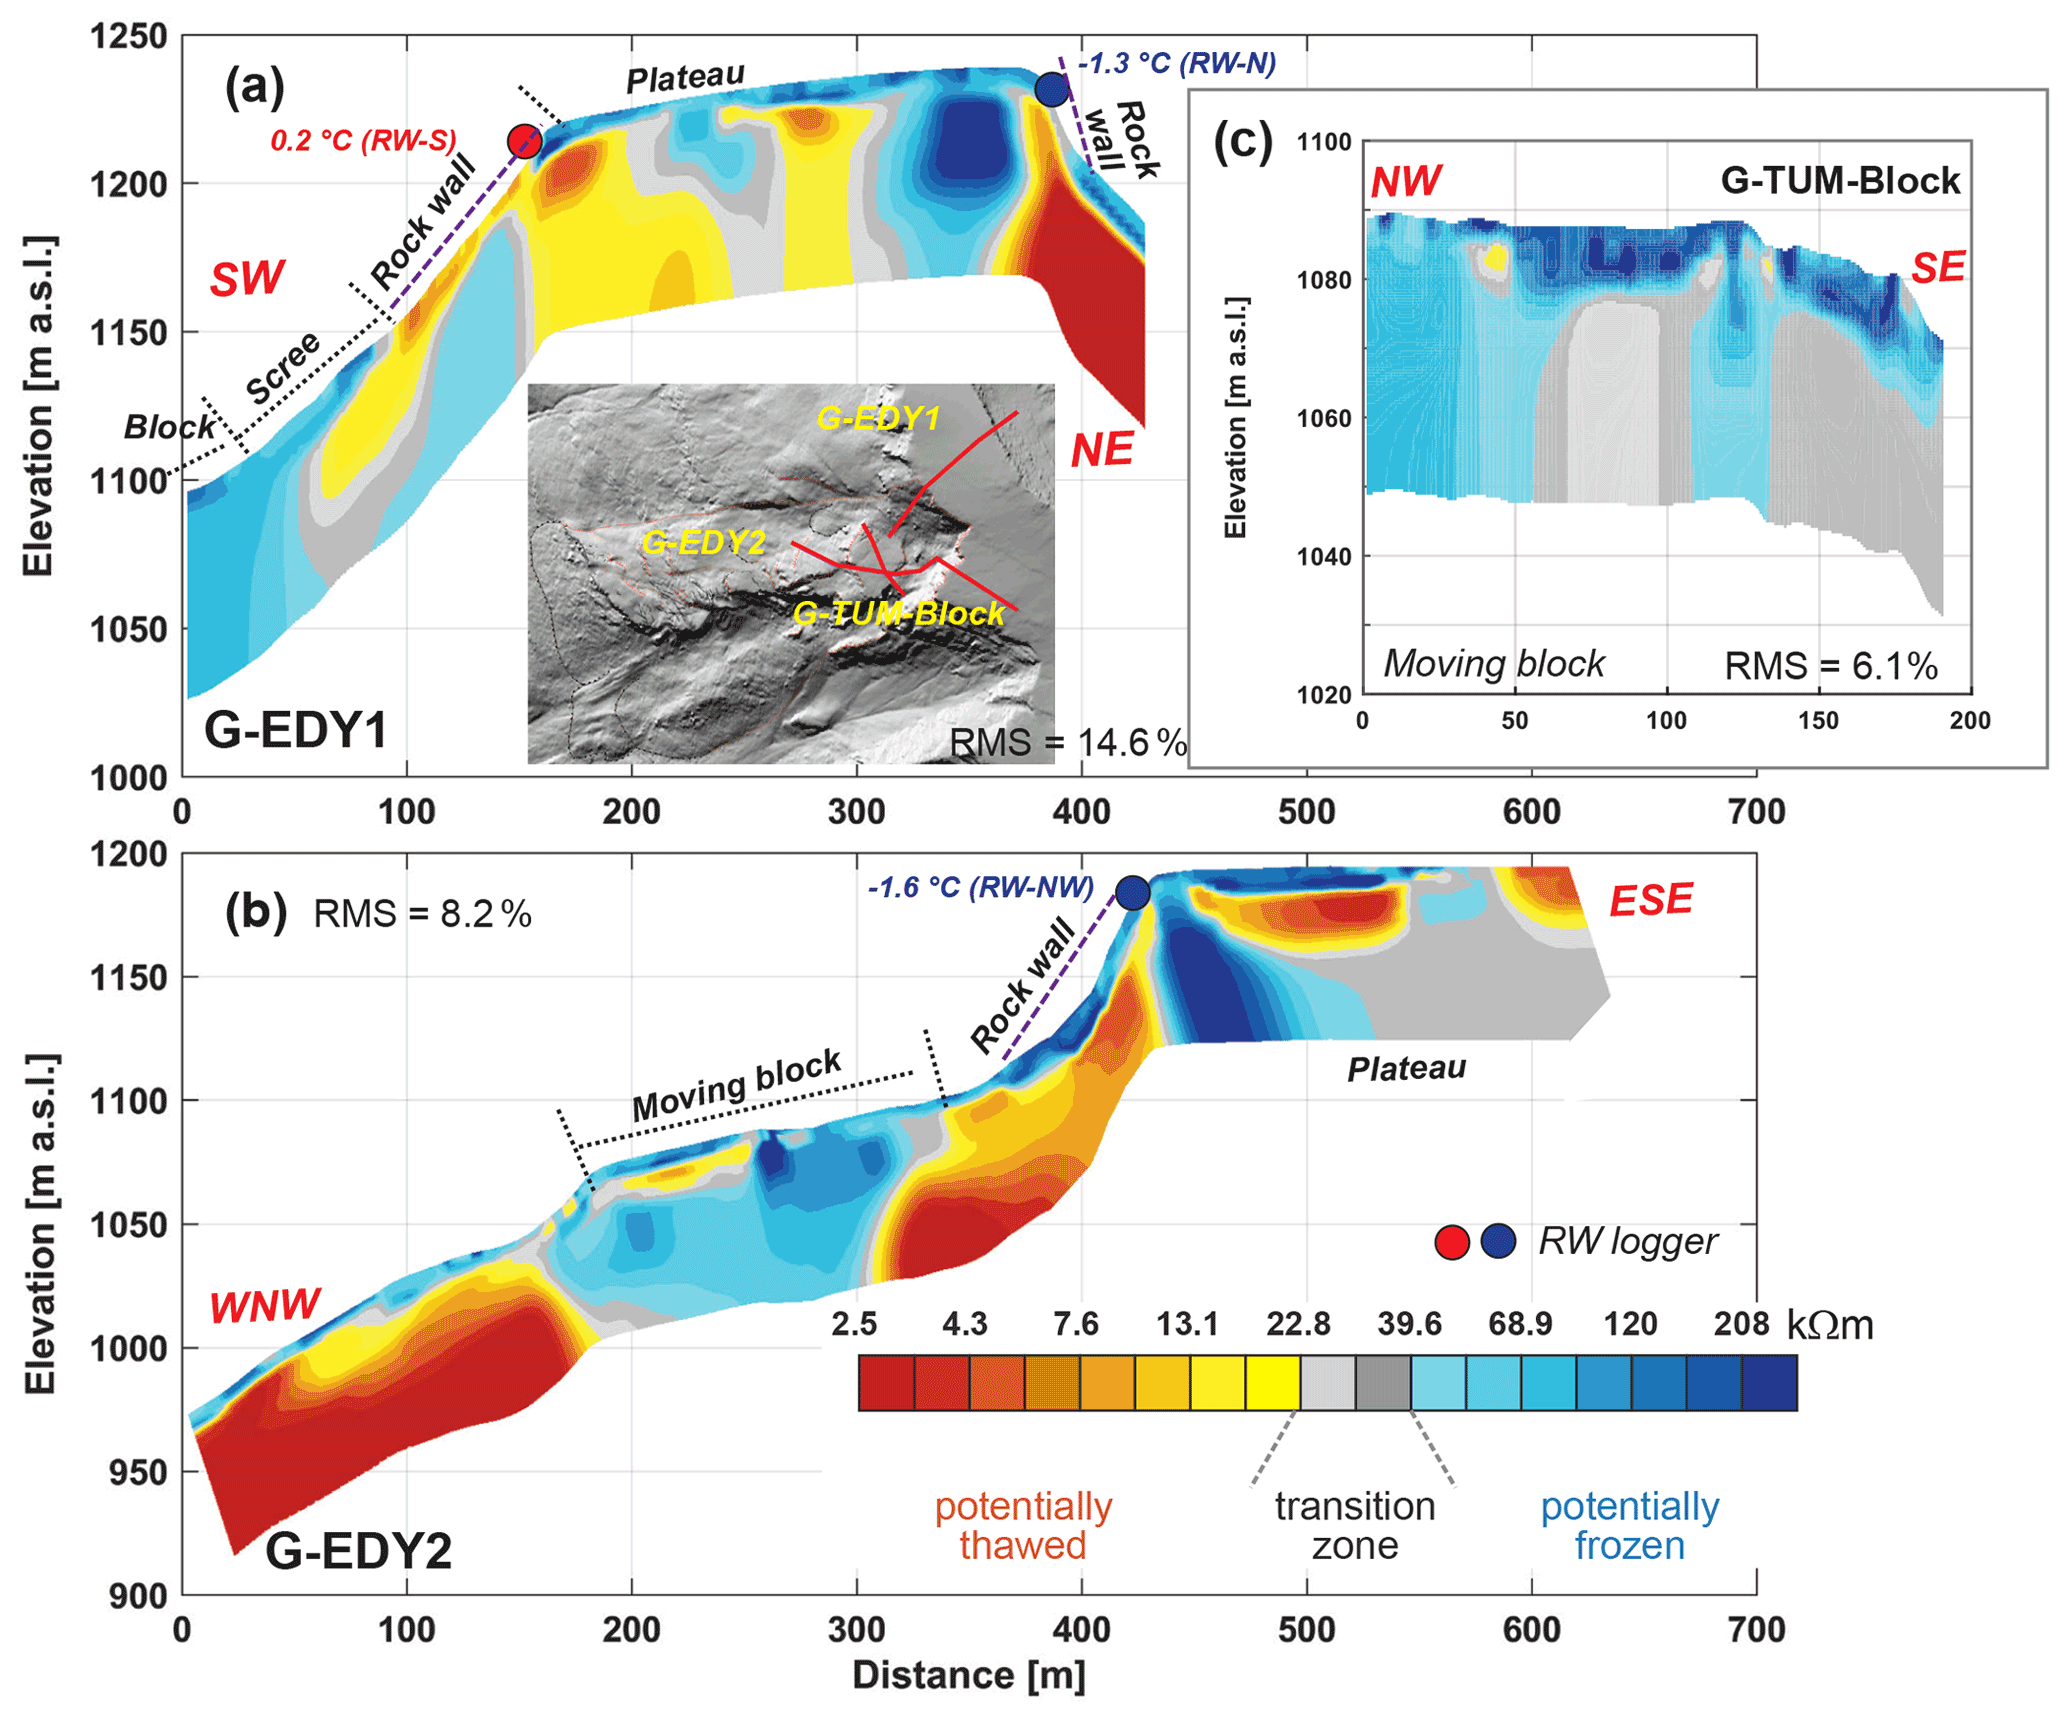
Figure 10ERT surveys over the back scarp at Gámanjunni-3: (a) G-EDY1, which is oriented over the exposed part of the slip surface. While the rock wall shows low resistivity, there is a clear transition towards the scree and the moving block with considerably higher resistivity. (b) G-EDY2, which is placed over the north-western exposed part of the rock wall. There are significantly higher resistivities in both the rock wall and plateau, illustrating that this side is more influenced by the cooler rock wall. For both profiles, the locations of the rock wall loggers are indicated as circles. (c) G-TUM block oriented NW to SE over the moving block below the slip face. The resistivity is relatively high in relation to the plateau and below the block.
The combination of ERT and refraction seismic tomography within the 4PM revealed clear patterns in relation to possible permafrost and ice saturation (Fig. 11, Hauck and Hilbich, 2018). At the G-NVE2 ERT profile, considerable ice content values of up to 50 %–80 % saturation suggest permafrost conditions. We also see heterogeneities in vertical and horizontal directions along the profile line (Fig. 11b). The overall water contents are mostly low, except a possible fracture zone at depth (horizontal distance 180–230 m) (Fig. 11a), showing greater ERT heterogeneities and low seismic velocities (Fig. C1b). Such a pattern is normally associated with high subsurface air contents. This kind of low P-wave velocity (i.e. high air contents) at greater depths is not common and more prominently discussed in reports concerning the original seismic and ERT results of the area (GeoExpert, 2016). Unfrozen surface layers with no ice along G-NVE2 for the uppermost 5–10 m are further suggested by the analysis, while the northern part of the profile shows a higher ice saturation within the upper 30 m (Fig. 11b). Finally, overall dry conditions are suggested by modelled high air contents near the surface. The overall ice content is probably low even if the model indicates high ice saturation. This is related to the low-porosity bedrock (porosity ca. 0.7 %, Leinauer, 2017) in accordance with resistivity values of only ∼10 kΩm, which are more atypical for high ice contents (Fig. C1b). We prescribed a laterally homogeneous porosity model in the 4PM, which probably led to an overestimation of ice saturations due to low-porosity bedrock in the right-hand side of the profile.
Along the slope of the instability (G-NVE1) the results also suggest permafrost conditions. This is especially evident for the upper part of the profile (Fig. 11a). We also could identify an unfrozen surface layer, even if this feature is less visible due to geometry reasons, and a fracture zone characterised by high air contents (150–280 m horizontal distance, Fig. 11a). We also note that the values for the geophysical profiles at the crossing points of the two profiles are quite correspondent. There, the transition between predominantly high ice saturations and high water saturations (which could be interpreted as a transition zone between frozen and unfrozen conditions) is at around a depth of 40–50 m in both cases. However, here we also prescribed a gradient model for porosity which was homogenous along the profile, so such transitions in the data could also be due to change in material properties. However, we are relatively confident of the reliability of our analysis, as the 4PM resulted in similar values at the cross-over area of both profiles.
The results indicate permafrost conditions in both profiles with at least 30–50 m thickness. In addition, strong heterogeneities, especially regarding de-compaction and fracture zones, have been found, indicating significant air contents at larger depths, which is seldom found in thermally stable mountain permafrost bodies.
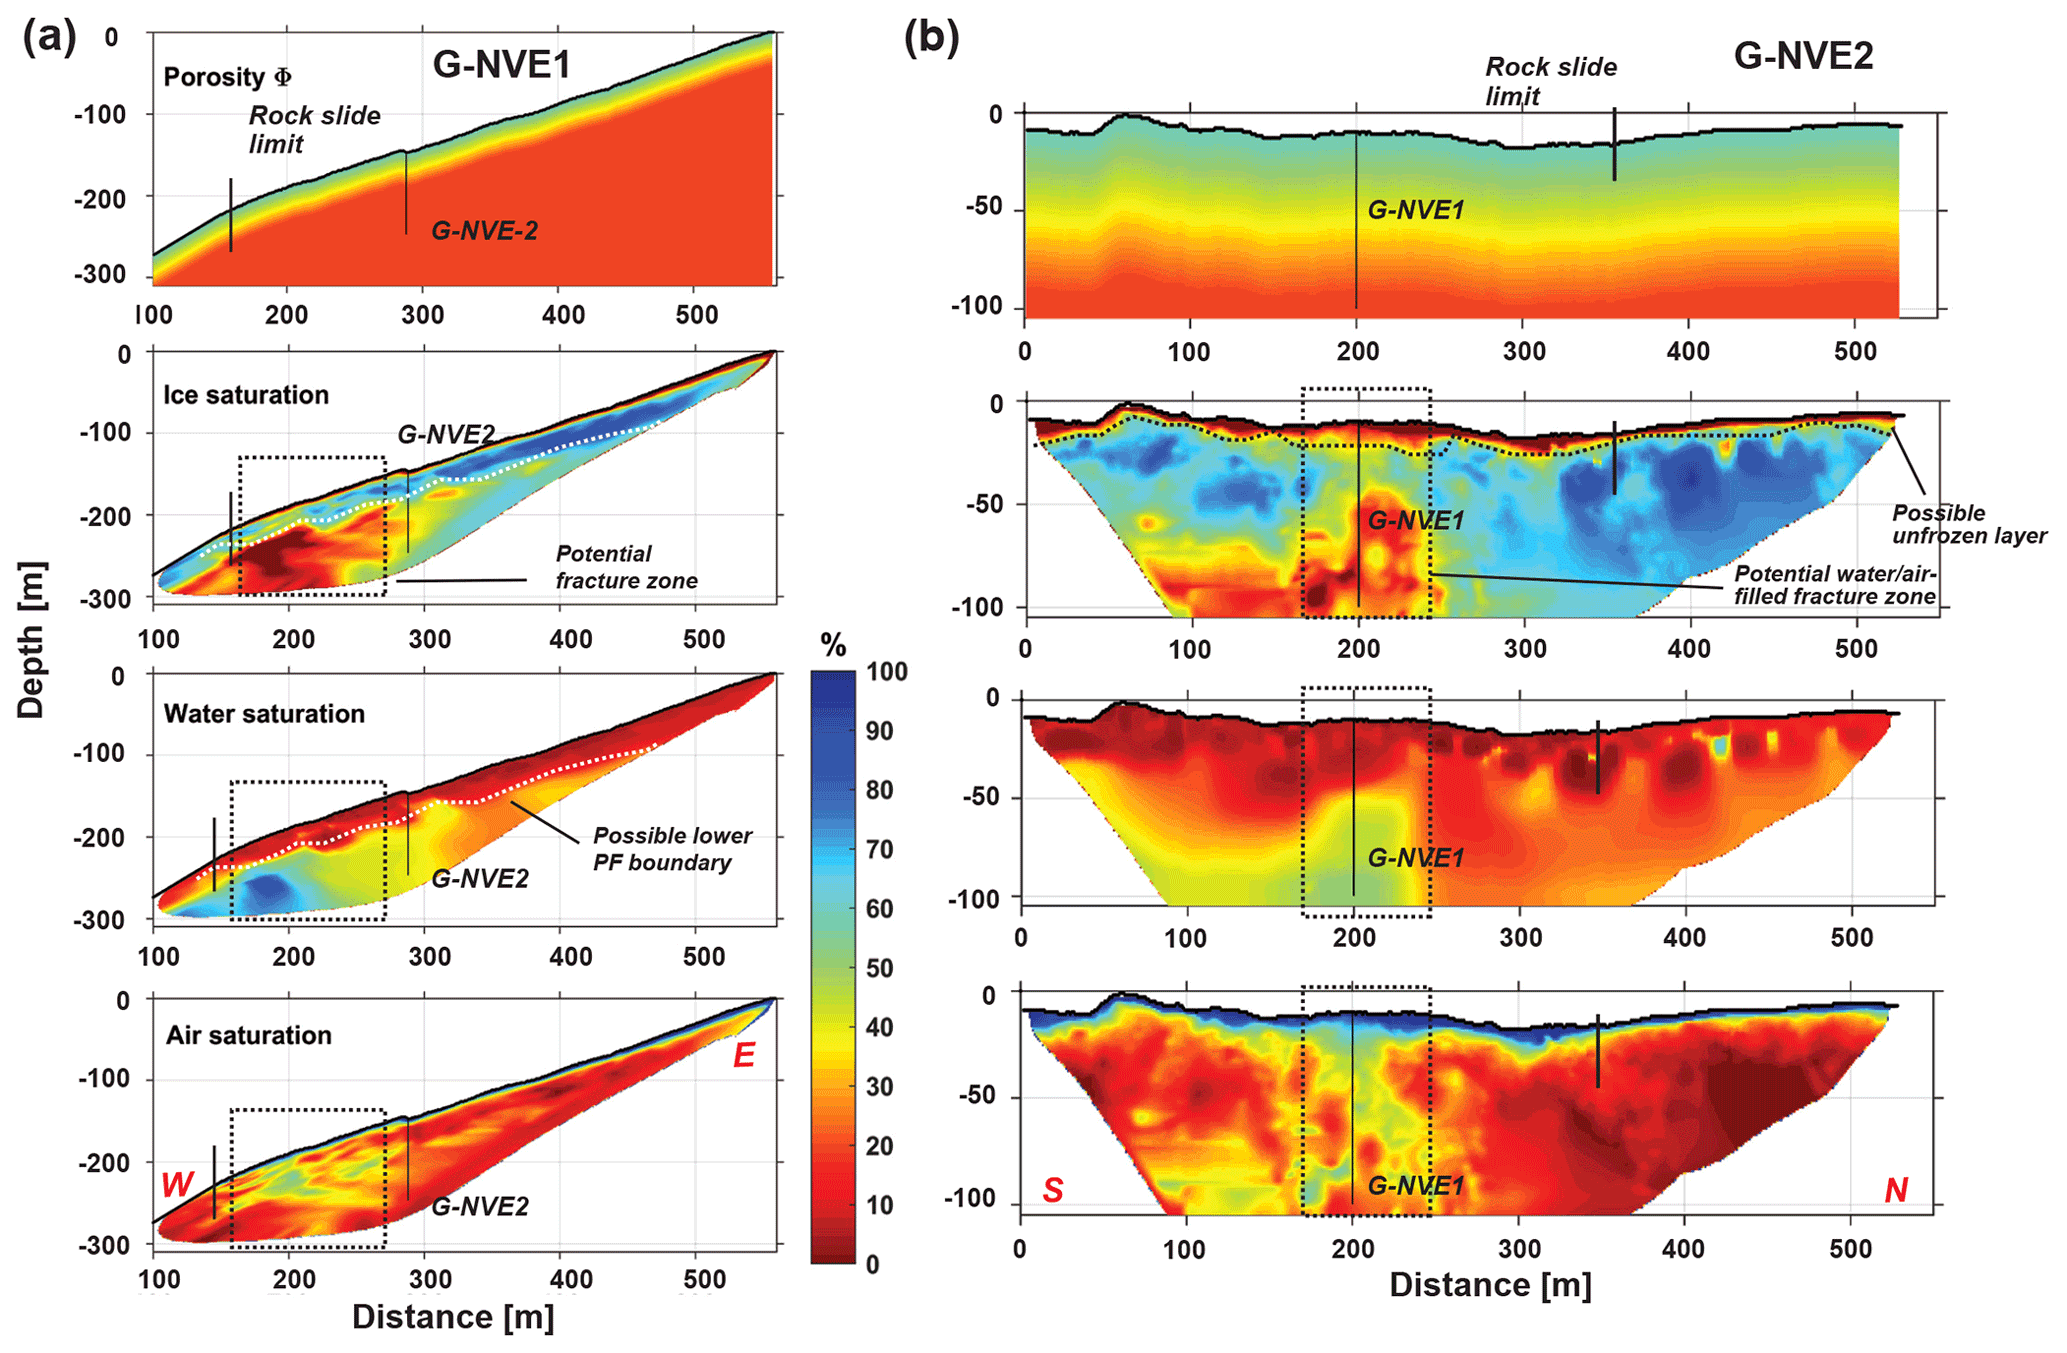
Figure 11Saturation of pore space determined using the four-phase model (4PM) based on Hauck and Hilbich (2018) for (a) the long profile along the slope G-NVE1 and (b) the transversal profile G-NVE2. The total saturation values for ice, water and air are given in relation to the porosity prescribed in the uppermost plots for the respective profiles. The model clearly indicates high ice saturation in parts of both profiles, thus suggesting the presence of permafrost. The potential fracture zone discussed in the main text is indicated by the black boxes. The possible unfrozen layer is indicated in (b), while the possible lower permafrost boundary is indicated in (a) for G-NVE1. Note that the tomograms are subsets of G-NVE1 and G-NVE2 and thus shorter than the profiles shown in Fig. 8.
4.3 Mannen
Temperature monitoring and reconstruction
The two rock wall loggers are oriented towards north (RW-N) and east (RW-E) (Fig. 1c). Both loggers showed positive annual average temperatures during 2015 and 2019 of 1.2 and 2.6 ∘C, respectively (Fig. 4b). During the same period, the mean air temperature on the plateau was 0 ∘C, showing that rock wall temperature was at least 1 ∘C higher than air temperature. The reconstructed RW temperature series since 1970 revealed above-zero temperatures in the rock wall, with an increasing trend (Fig. 4c). The north-exposed rock wall certainly featured sub-zero temperatures in some cold years, such as in 2011.
GST loggers distributed along the rock scarp (Fig. 1b) showed mean GST between 0.9 and 1.6 ∘C, showing the warming influence of the thick snow cover. The TinyTag loggers in Veslemannen (Fig. 1c) recorded BTS in fractures between −1.3 and −1.8 ∘C in late April–early May 2015. In late April 2016 the BTS recorded was between 0 and −2.3 ∘C. The mean temperatures recorded by these loggers are not representative, as they all lack complete annual data, but have to be around 0 ∘C on annual average. These data are described in more detail in Kristensen et al. (2021). Most of the BTS measurements were conducted close to the edge of the back scarp. While the BTS values were mostly below −2 ∘C behind the north-exposed scarp, BTS values above −2 ∘C dominate behind the east-oriented edge (Fig. 1c). The data confirm that permafrost patches likely occur along the plateau edge (Magnin et al., 2019).
Surface displacement
For the GNSS and laser station velocities, values between 14 and 20 mm a−1 have been recorded since the start of the monitoring in 2010 (Fig. 5e). The data indicate higher displacement rates during the start (2010) and the last years of measurements, with a slowdown between ca. 2013 and 2016 and a subsequent increase (Fig. 5f). Between 2010 and 2013 southern Norway had cold winters (MAAT of −1 ∘C on Mannen at 1200 m a.s.l.) (Fig. 5g), while after 2013 air temperatures increased by 1 ∘C on average (MAAT = −0.1 ∘C between 2013 and 2020). The slowdown of displacement rates between 2013 and 2016 seems to be associated with a lower snow cover during the winters of these years (Fig. 5f). In terms of seasonal variations the cumulative movement plots indicate a stepwise pattern, with higher velocities during spring–summer and lower velocities during fall–winter (Fig. 5f). This is different to what was observed at Veslemannen, where velocity accelerations started during the snowmelt period but were much higher and more variable in the fall period and after heavy precipitation events (Kristensen et al., 2021).
The distribution of velocities over the moving slope body was derived from GB InSAR and shows the highest velocities in the upper part just below the back scarp and the plateau of >20 mm a−1 (Fig. 6c). This high-velocity area defines scenario C for Mannen (Fig. 1c).
Simulated ground temperatures
The temperature field revealed by the 2D temperature modelling indicates possible permafrost conditions in the steep part of the slope during the onset of modelling at the end of the LIA, with permafrost thicknesses between 50 and 100 m depending on model initialisation procedure (Fig. 7d) and snow cover parameters (Fig. A2b). During the 150 years of the model run, steady warming reduced and degraded the modelled permafrost. However, isolated patches might still be possible in the steepest part with less snow, depending on model parameterisation in terms of snow coverage and water content in the model domain (Fig. A2b). Today, deep seasonal frost is modelled in the steep parts, which is coincident with the rock wall measurements in the back scarp (Figs. 7f, 4b). The plateau is heavily snow-covered, and frost penetration is only possible laterally from the snow-free steep slopes.
Geophysical surveys
The ERT profiles at Mannen show generally higher resistivity than at Gámanjunni-3, probably related to different background resistivity of the bedrock and less surficial sediment cover. The 1 km profile (M-NGU; Dalsegg and Rønning, 2012) covers both the plateau and the steep unstable slope, and it showed comparatively low resistivity (10–40 kΩm) at depth (probably indicating the resistivity of the unfrozen intact bedrock), and higher resistivity at and below the scarp close to the surface down to ca. 1150 m a.s.l. (50–>100 kΩm) (Fig. 12a). These high-resistivity areas reveal crushed air-filled and well-drained bedrock and may contain permafrost patches (Dalsegg and Rønning, 2012). The ERT profile along the crest (M-TUM1-scarp) shows decreasing resistivity from NW to SE (Fig. 12b). High resistivity (>100 kΩm, possibly indicating frozen conditions at depth) is observed close to the rock wall, while low resistivity (<30 kΩm) dominates in the south-east, where the profile departs from the crest, and in the upper ca. 20 m of the profile. The highest values (>300 kΩm) are observed around a deep crack delimiting one of the moving blocks at Mannen, which defines a fractured zone with high porosity and unsaturated conditions (Fig. 12b).
The rock wall profiles (M-EDY1-4) mainly show resistivities below 40 kΩm, also at depth, on the plateau and higher resistivity (>50 kΩm) over the back wall and over the fracture between the back scarp and the moving block (Fig. 12c–f). Again, the highest values are measured below the back scarp over large fractures, which contain much air and are possibly partly snow-filled and possibly ice-filled. An exception is the M-EDY2 profile (Fig. 12d), with high resistivity also obtained on the plateau. This profile has 2 m spacing, giving a higher resolution close to the surface, and therefore the coarse and high-porosity block cover on the plateau might result in higher resistivity values.
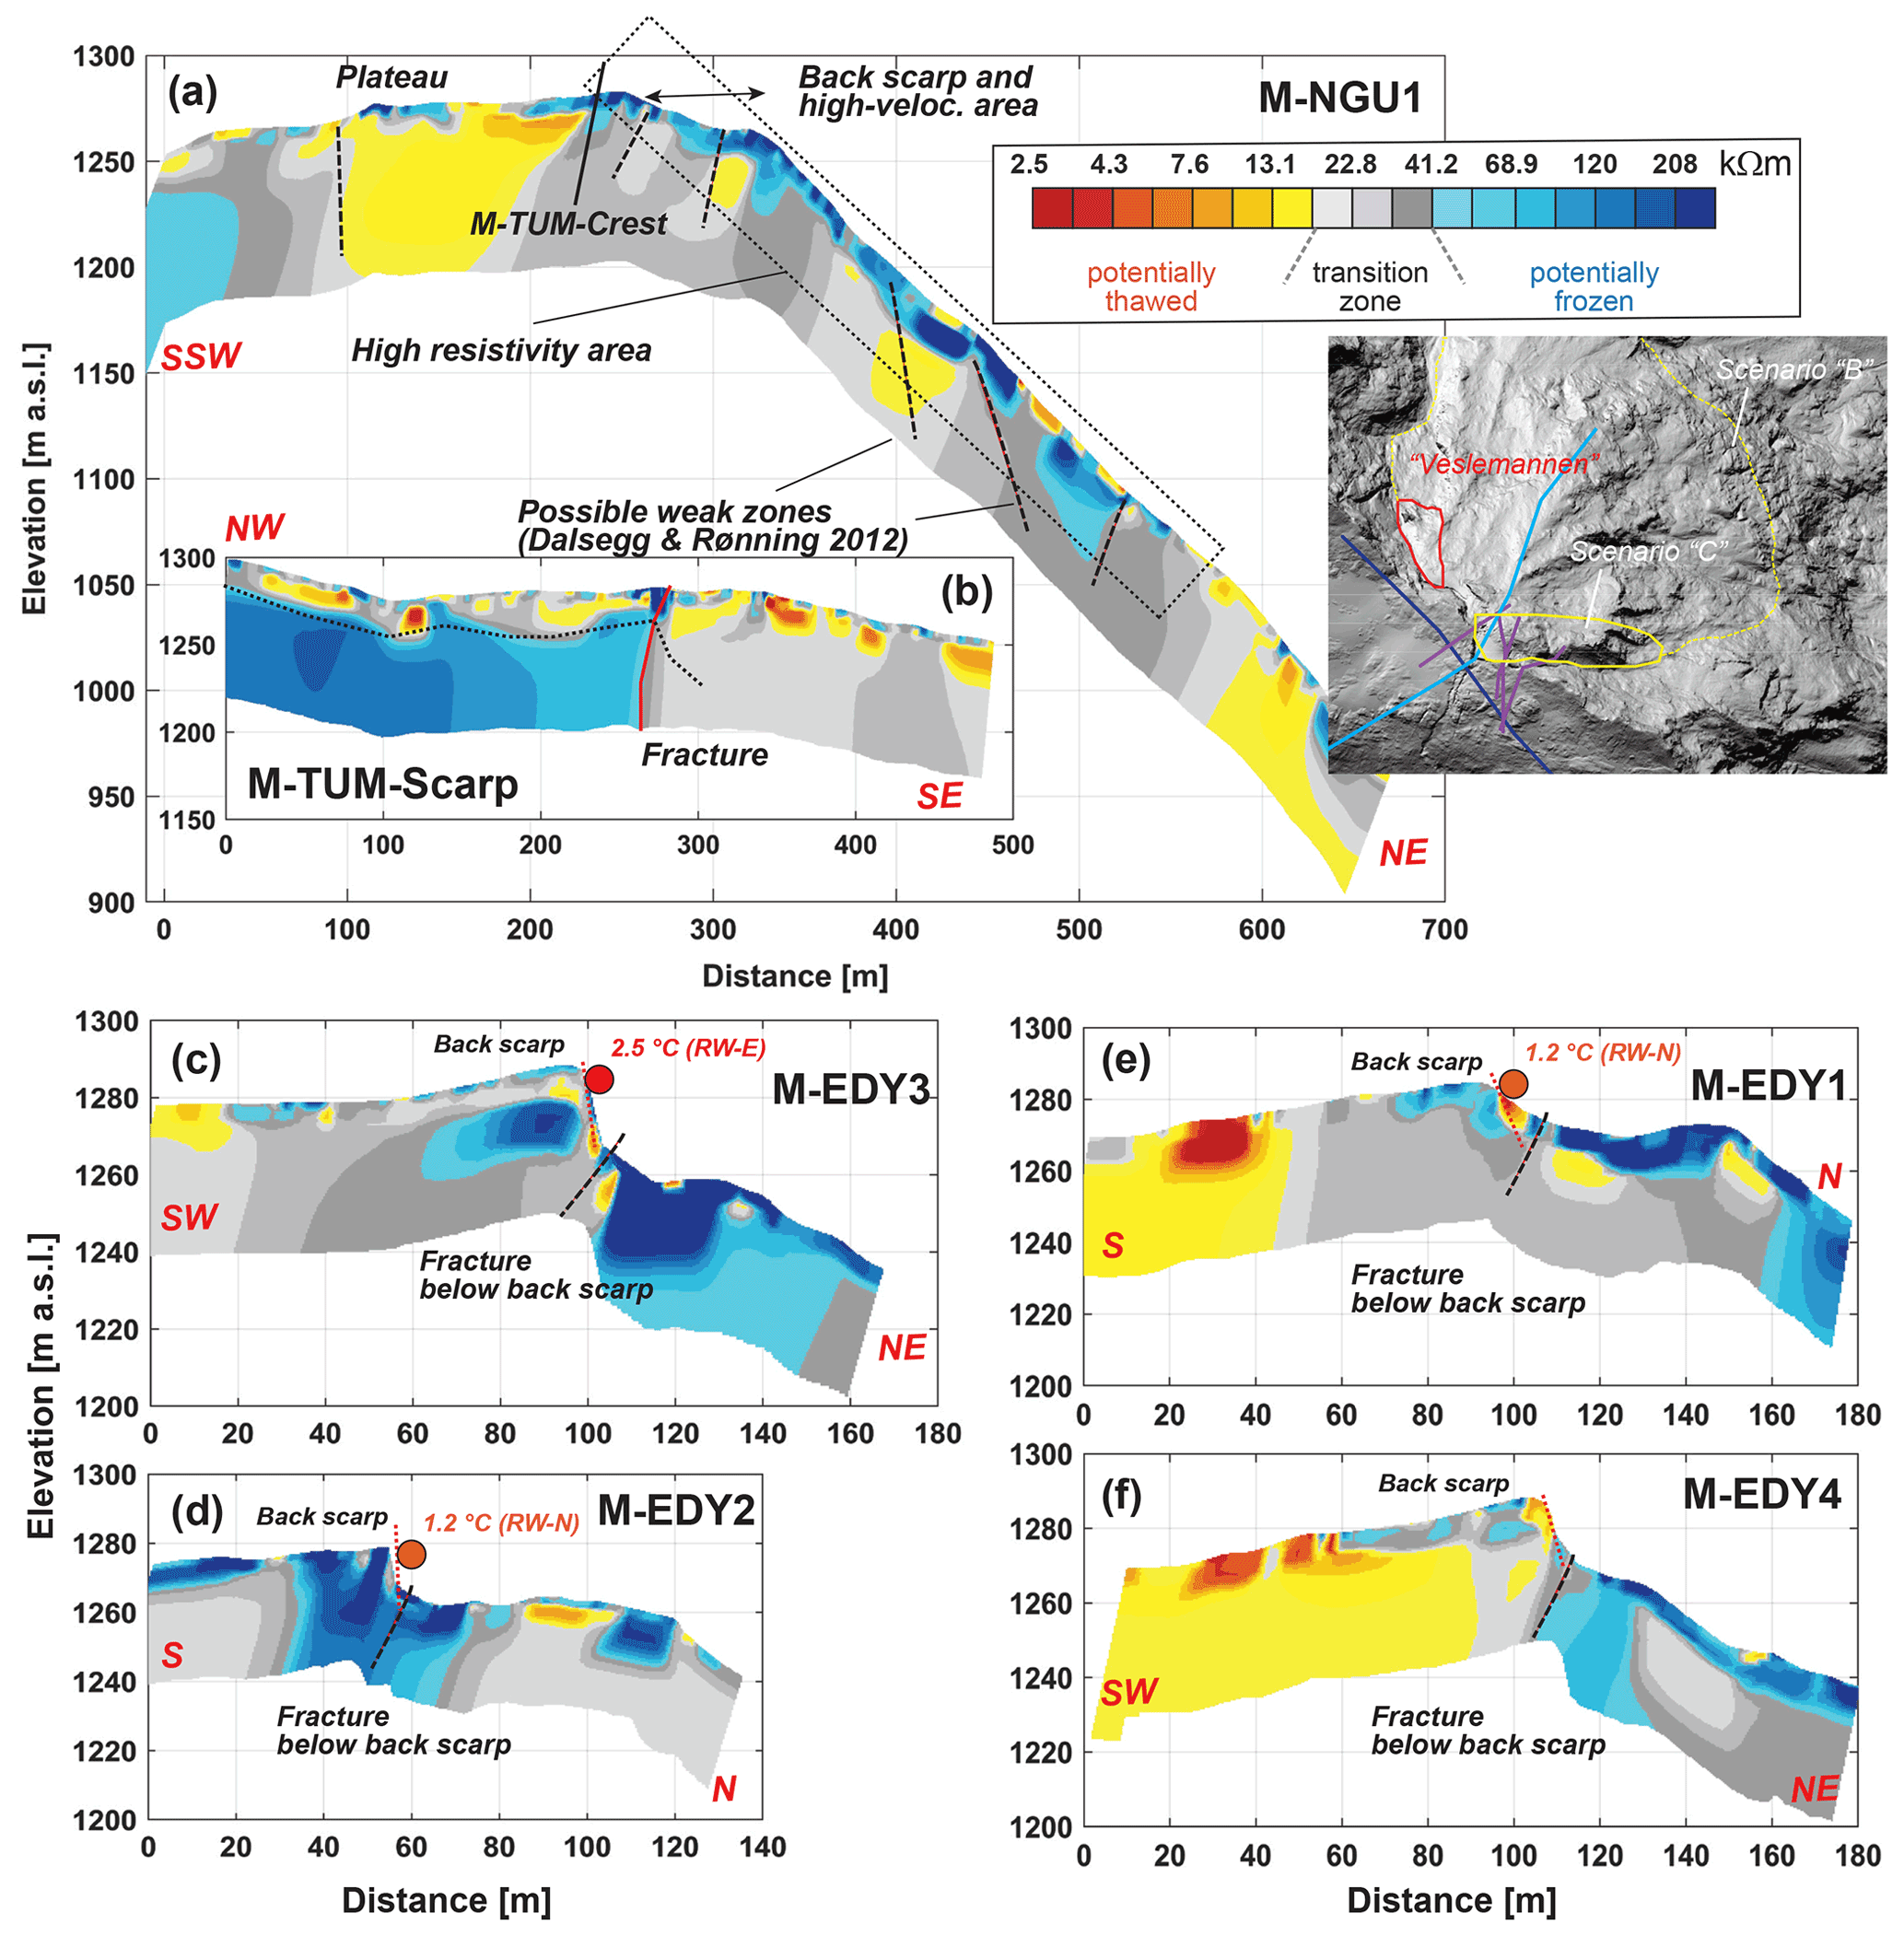
Figure 12ERT surveys over the Mannen instability; for location see Fig. 1 and for survey parameters see Table 1. (a) Along-slope profile (M-NGU) based on Dalsegg and Rønning (2012). The possible weakness zones described in Dalsegg and Rønning (2012) are indicated by dashed lines. The near-surface high-resistivity area is indicated by a box; it may reveal crushed air-filled and well-drained bedrock and may contain permafrost patches (Dalsegg and Rønning, 2012). (b) M-TUM-scarp profile along the rim on the plateau of Mannen above the exposed slip surface. A strong transition of resistivity is indicated by a red line and interpreted as a deep fracture that may be water-filled. Panels (c) to (f) show the ERT profiles (M-EDY1-4) over the rock wall from the plateau into the instability at various locations (Fig. 1). The circles show the mean annual rock wall temperatures in the two loggers on site. The exposed back fracture below the slip surface is indicated by dashed lines, while the back scarp is indicated by a red dotted line.
5.1 Hypothesis and uncertainties
Both Gámanjunni-3 and Mannen are considered to be high-risk unstable slopes (Hermanns et al., 2013a; Majala et al., 2016) and are continuously monitored. The movement was initiated several millennia after deglaciation, and thus climatic changes have been discussed as a factor influencing the dynamics of the instability (Hilger et al., 2021). Surface exposure dating shows that the current displacements of the slopes are larger than the Holocene average (Böhme et al., 2019; Hilger et al., 2021), indicating atmospheric warming as a likely influencing factor. For both sites, we therefore hypothesise that permafrost warming and/or degradation might be a substantial explanation for the temporal displacement pattern.
Our study combines a variety of methods, ranging from point observations (e.g. rock wall temperature measurements) via local surveys (e.g. geophysical measurements) to larger-scale modelling along an entire slope setting (e.g. geothermal modelling). Each method has uncertainties and includes different pre-conditions representing many pieces of a puzzle to form a consistent picture. For example, the heat flow modelling represents the lower extent of possible permafrost at Gámanjunni-3, as indicated in the ERT surveys, but does not represent local thawed areas and variations indicated by the ERT.
The methods used are independently of each other and may be contradictory in places, but they result in an overall explainable pattern. The temperature modelling does not account for fractures and other structures in a rockslide area (e.g. where water can penetrate); CryoGrid 2D is a two-dimensional model purely based on heat conduction, which results in a smoothed and simplified version of reality (Myhra et al., 2017, 2019). The ERT profiles were measured in rough terrain with often poor coupling, and both the resistivity values and data noise are very sensitive to cracks and fractures, strong topographic variations, and local water penetration. This leads to high variability of resistivity and may produce inversion artefacts, such as in the transition between plateau and rock wall at Gámanjunni (Fig. 10), which is also represented by the partly high root mean square errors (RMSEs) of the inverted tomograms, which vary between 6 % and 20 %. Therefore, comparing ERT and a more large-scale temperature model is not meaningful on a local site level. Our ERT and 4PM results for Gámanjunni-3 clearly show potentially frozen areas within the rockslide area, disappearing downslope. The potentially frozen areas are at a depth of ca. 30–50 m, which is close to the results of the temperature modelling at these places. However, locally thawed areas in the rockslides and possible taliks as indicated in the ERT are certainly realistic but cannot be covered by the simplified heat flow model.
5.2 Permafrost conditions and recent ground thermal development
At Mannen, we do not measure subsurface RW or GST temperatures below 0 ∘C on an annual average at present, except for shaded locations in fractures (Kristensen et al., 2021). Over the last 140 years, MAAT has increased, and since the cooling in the 1970s the temperature rise was around 1.5 ∘C (Fig. 4c). Rock wall temperatures oriented towards north must have had sub-zero surface temperatures during several periods of the last 150 years, indicating permafrost development in the past in shaded topographic settings (Fig. 4c). This confirms the modelling by Magnin et al. (2019) and the results from Kristensen et al. (2021) for Veslemannen, which indicate sporadic permafrost zones at Mannen in certain locations such as fractures, snow-free patches and in shaded locations. It is also well documented that cracks and fractures in rock walls locally significantly decrease ground temperatures (Magnin et al., 2015a; Hasler et al., 2011). This is also supported by the ERT surveys showing the highest resistivity values close to the rock wall and large fractures (high porosity), which may be partly filled by ice (Fig. 12). However, there are no observations of ice in the fractures as in the Jettan rockslide in northern Norway, where permafrost is observed and probably influences seasonal kinematic variations (Blikra and Christiansen, 2014). The thermal modelling indicates that permafrost patches could develop at and below the upper scarp and that the unstable area is modelled as being cooler than the plateau (Fig. 7), a pattern also visible in the long ERT profile (Fig. 12). The mountain plateau of Mannen can hardly develop permafrost because of a very thick and long-lasting snow cover.
For Gámanjunni-3, MAAT has risen over the last 140 years, and the rise was around 1.8 ∘C since 1880. Estimated rock wall temperatures in all orientations were mostly negative between 1880 and 2020. Since ca. 2000, however, the south-oriented rock wall has shown mean annual temperatures close to or above 0 ∘C (Fig. 4c). Permafrost warming and possible degradation might have accelerated since ca. 2000, which could influence the geotechnical properties of the site. The ERT measurements suggest permafrost at Gámanjunni-3, but resistivity differences between topographic aspect and laterally over the plateau indicate changes in ice content and ground temperature including the potential occurrence of taliks (Krautblatter et al., 2010; Gruber and Haeberli, 2007, 2009). Those can form during general atmospheric warming, extreme warm years or along water-filled fractures (Luethi et al., 2017). These processes result in high resistivity variations (Hilbich et al., 2008; Krautblatter and Hauck, 2007; Mollaret et al., 2019). This interplay, together with air and water advection in fractures, produces a complicated thermal pattern, which is not reproduced by our heat flow modelling. The pattern is further highly modulated by snow cover, which in Scandinavian high-mountain settings is highly variable due to wind redistribution (Gisnås et al., 2014, 2016b). This redistribution of snow is the major source for high spatial variability of surface temperatures (Haberkorn et al., 2015), which can vary by several degrees Celsius (∘C) (Gisnås et al., 2014; Marmy et al., 2016; Magnin et al., 2015a, b, 2017; Hasler et al., 2011; Haberkorn et al., 2017). However, ice-free north-oriented rock walls show a cooling influence on the surrounding subsurface.
In summary, for both sites, we can expect at least local permafrost conditions, which are clearly more widespread at Gámanjunni-3 than at Mannen, and warming with an accelerated pace during the last 2 decades, following similar observations all over Europe (Etzelmüller et al., 2020).
5.3 Is there a coupling between the slope instability and permafrost dynamics?
Spatial pattern of movement
The spatial distribution of surface displacement is slightly different at the two sites. At Mannen, relatively high displacement rates of ca. 20 mm a−1 are measured in the upper part of the unstable slope, while low velocities of <5 mm a−1 dominate the other parts (Fig. 6c). At Gámanjunni-3 displacement rates of >50 mm a−1 are registered over most of the mapped rockslide area, with some higher values in the upper part. Maximum velocity values of >150 mm a−1 are observed in the rock glacier in the southern part of the area (Fig. 6a, b).
Displacement rates, ground temperatures and ERT results were related along the ERT lines G-NVE1-2 and M-NGU (Fig. 13). At these sites GT is clearly associated with measured resistivity, confirming the lab analysis and our interpretation of possible permafrost at these sites (Fig. 13a, b). For Gámanjunni-3 we observe a positive relationship between electrical resistivity and displacement rates (more displacement when higher resistivity) and associated lower displacement with higher ground temperatures along the longitudinal profile over the rockslide mass (Fig. 13c, d).
At Mannen similar observations were made but are not that clear (Fig. 13f). This seems contradictory as permafrost is seen as a stabilising factor for slopes (Gruber and Haeberli, 2007; Krautblatter et al., 2013). An explanation for this behaviour can be found in e.g. Davies et al. (2001), who found factor-of-safety (FS) values below 1 for ice-filled fractures close to the melting point and FS values at 1 or above when the ice has melted or is very cold. The stability of both ice in fractures and rock–ice interfaces strongly declines with increasing temperatures below 0 ∘C (Mamot et al., 2018). Both at Gámanjunni-3 and Mannen possible ice occurrences are close to the melting point and thus deformable.
It is important to note here that factors other than the presence or absence of permafrost may govern the observed spatial differences in displacement rates. Changes in the geo-mechanical behaviour may, for example, cause similar variations of displacement rates as large unstable slopes are typically controlled by pre-existing weak structures and their reactivation by gravitational processes.
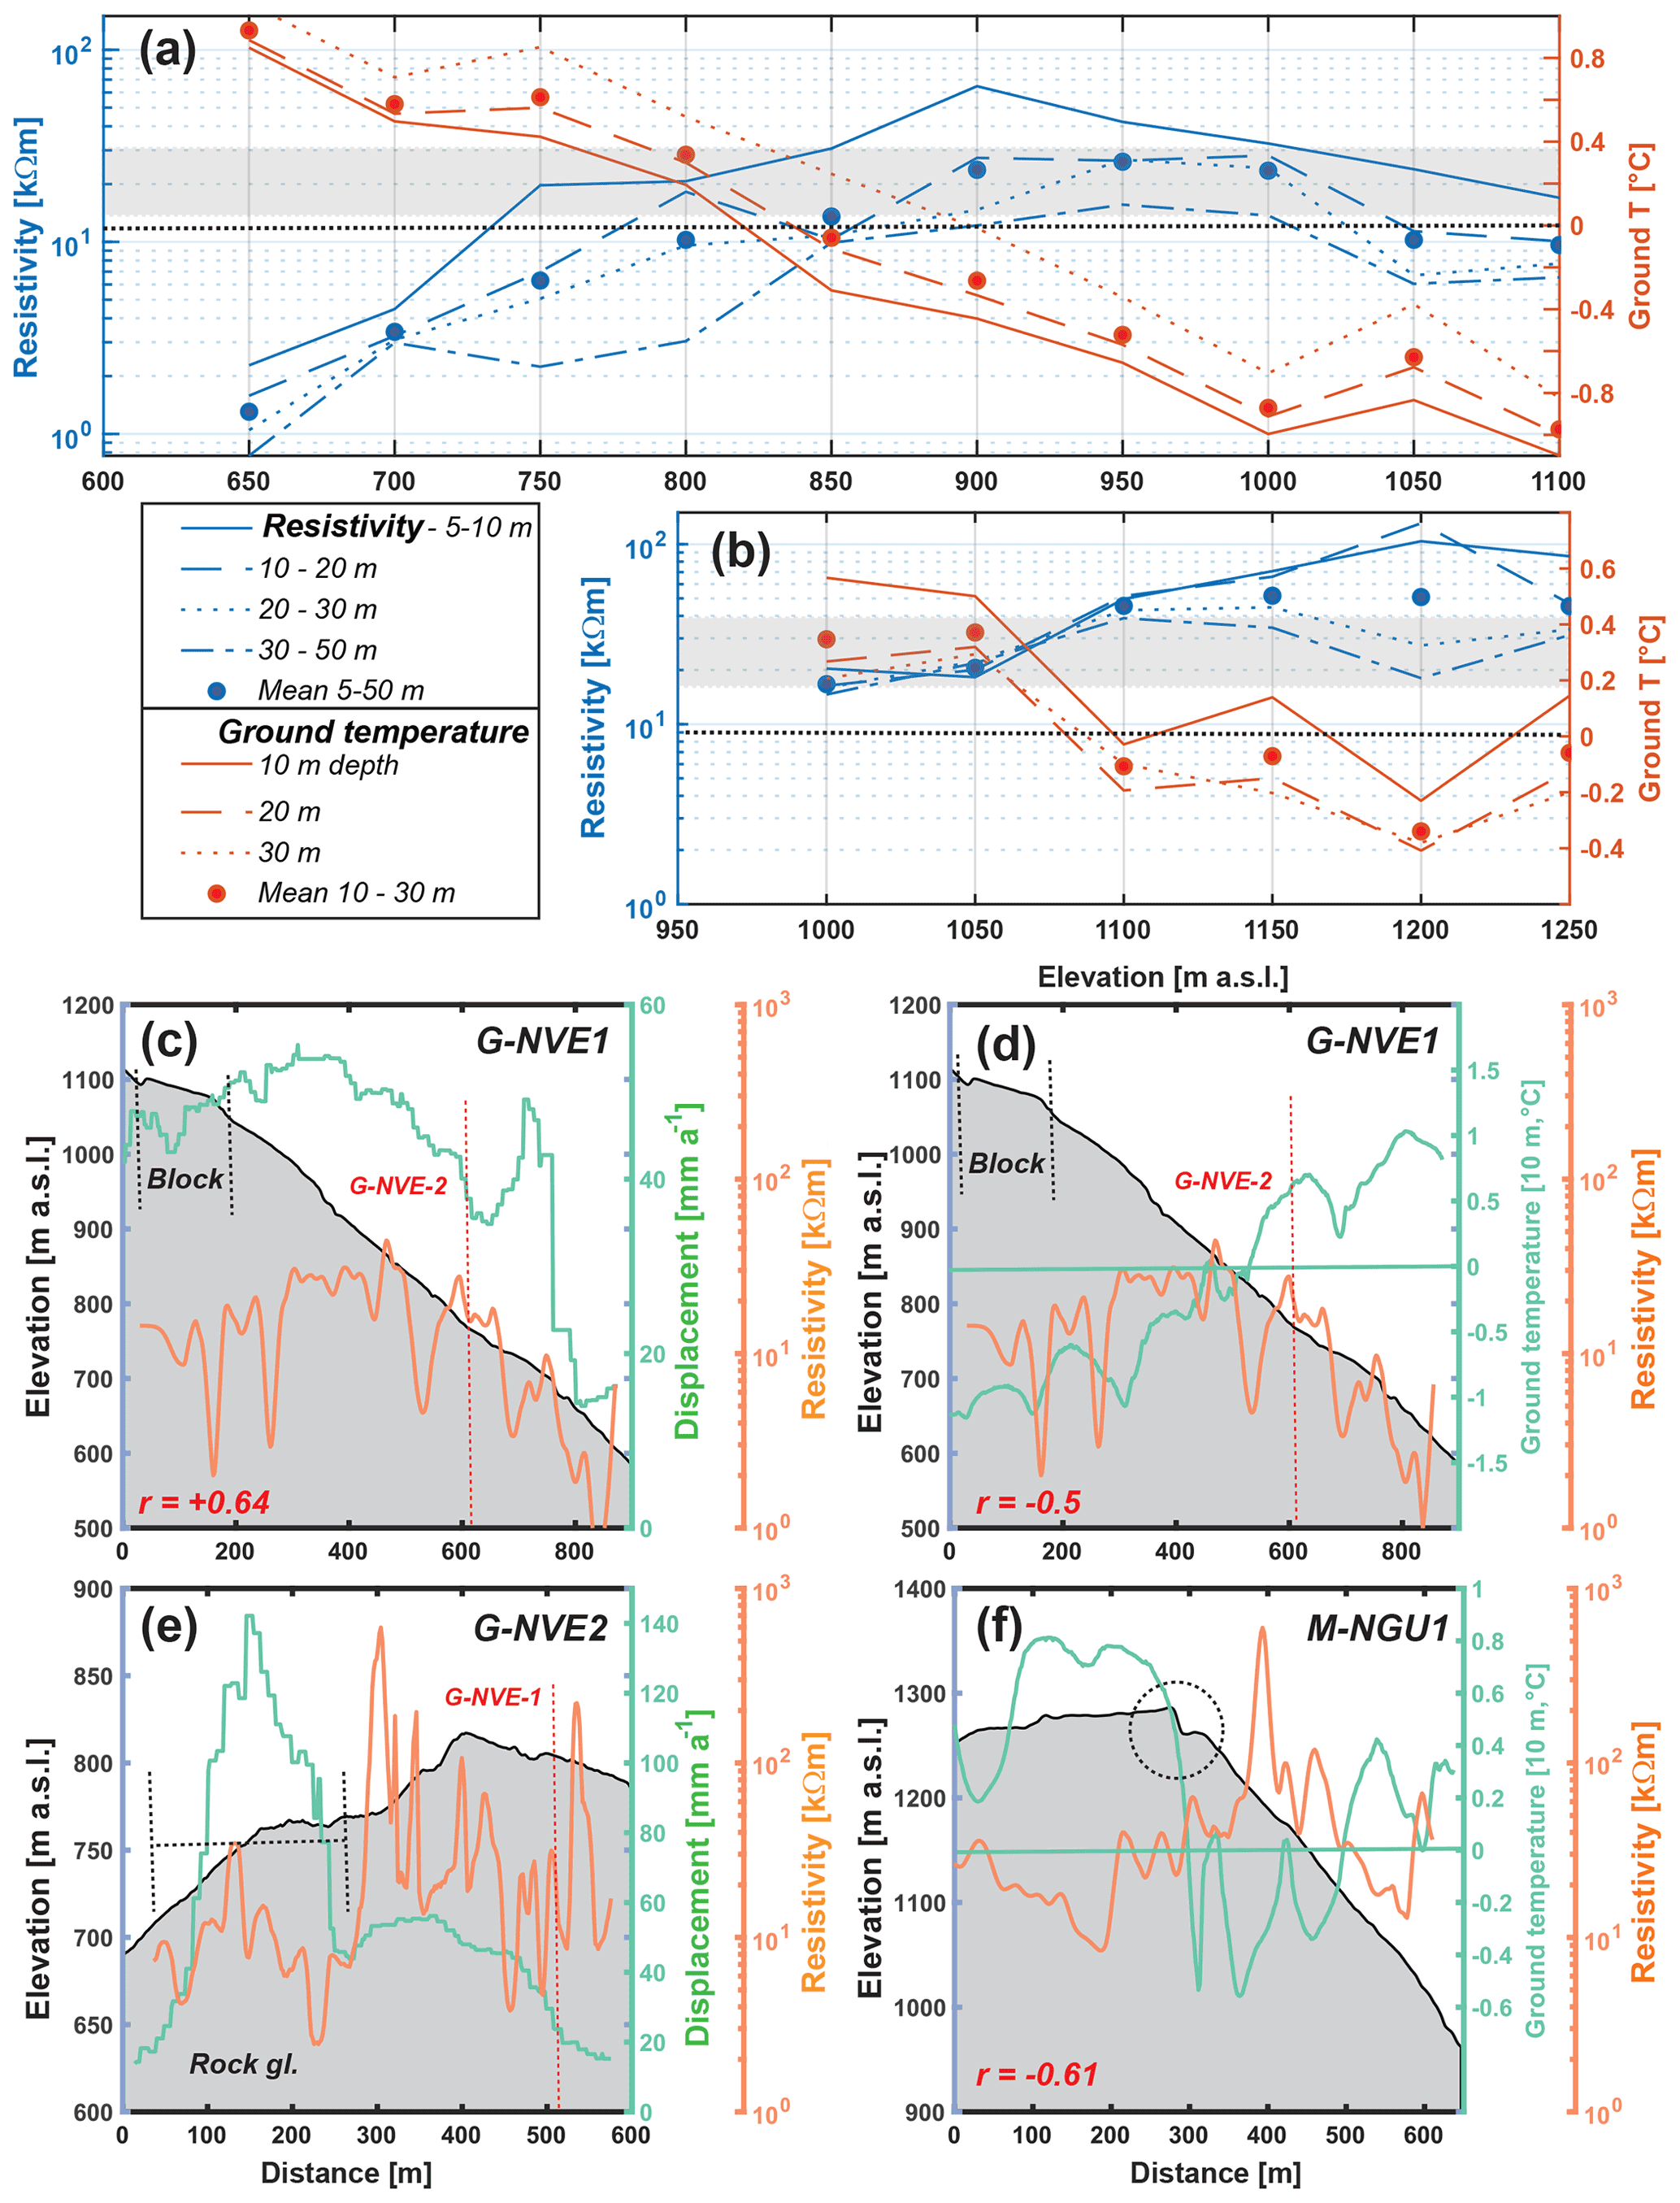
Figure 13Relationship between resistivity, modelled ground temperature (GT) and rockslide displacement rates along selected profiles for Gámanjunni-3 and Mannen, binned in 50 m intervals. At Mannen, poorer InSAR coverage restricted the analysis of the velocity–ERT relationship. The black dotted line indicates the modelled 0 ∘C line, while the grey area indicates the electrical resistivity transition resolved from laboratory analysis (Fig. 3). (a) Relationship between modelled ground temperature in three depths and extracted electrical resistivity for four different depth areas for G-NVE1. The solid circles display averages over all depths. The graph confirms the transition area for permafrost around 800 m a.s.l. (b) The same as (a), but for Mannen (M-NGU). Here there is also a higher resistivity with lower temperatures, but the relationship is less clear. According to the modelling permafrost can be expected above 1100 m a.s.l. (c) Relationship between elevation, displacement rates and electrical resistivity for G-NVE1. ERT and displacement rates co-vary, with a significant correlation of r=0.64. The red line shows the crossing point for G-NVE2. (d) G-NVE1. Relationship between elevation, modelled GT and electrical resistivity. We observe a negative relation between GT and resistivity (). The red line shows the crossing point for G-NVE2. (e) Cross-profile G-NVE2 over the rock glacier (dotted line) and rockslide area at ca. 700 m a.s.l. Resistivity is lower and displacement rates are much higher on the rock glacier than on the rockslide part, indicating different modes of movement (see main text). The red line shows the crossing point for G-NVE1 (f) M-NGU. Relationship between surface altitude, modelled GT and resistivity. We observe a negative relationship between GT and resistivity (), with lower GT and higher resistivity values along the upper part of the steep slope. The location of the back scarp of the unstable area is indicated with a circle.
This also applies when analysing the cross-profile (G-NVE2) at Gámanjunni-3, which covered both the rock glacier and the rockslide. Here, the geophysical surveys indicate that an unfrozen near-surface layer (ice contents ∼0 in the uppermost 5–10 m) overlies frozen areas. Further on, lower resistivity values at depths of 20–30 m are measured in the rock glaciers than in the moving part of the rockslide, even if velocities in the rock glacier landform are much higher (Fig. 13e). These observations relate to different processes of movement in the two parts of the instability. While in the rockslide the movement is influenced by possible ice deformation due to inferred higher ice content with depth in this part or block movement below a frozen layer, the rock glacier movement seems governed by movement related to water–ice mixtures close to the melting point, where shear strength is greatly reduced and ice deformation increases (Arenson et al., 2002; Davies et al., 2001; Cicoira et al., 2019).
The rock glacier has markedly higher velocities. Such velocities are common for rock glaciers in alpine environments (Kääb et al., 2007) and often facilitated by a block motion within a deforming massive ice body (Arenson et al., 2002; Haeberli et al., 1998, 2006; Cicoira et al., 2019; Kenner et al., 2017). The ERT measurements show a local resistivity peak under the rock glacier (at ca. 120 m distance, Fig. 8b), and GST loggers indicate permafrost presence in the landform (Figs. 1b and 8b). A rock glacier in the neighbouring valley from Gámanjunni-3 (Adjet rock glacier) had velocity averages increasing from ∼4.9 to ∼9.8 m a−1 (2009–2016) and maximum velocities from ∼12 to ∼69 m a−1 (Eriksen et al., 2018). There, permafrost warming, topographic controls, and increased water access to deeper permafrost layers and internal shear zones have been used to explain the kinematic behaviour at Adjet rock glacier (Eriksen et al., 2018). The higher velocities of the rock glacier in relation to the rockslide mass may indicate higher ice content or higher ground temperatures, influencing rock glacier kinematics (Kääb et al., 2007; Ikeda et al., 2008; Cicoira et al., 2019).
For Mannen the highest velocities and resistivity values are observed below the back scarp and behind the large fracture present between the back scarp and the unstable moving part of the slope. A similar setting is observed at Jettan at Nordnesfjellet, which lies close to the Gámanjunni-3 site. There, ground ice patches are observed in these cracks, governing movement rates (Blikra and Christiansen, 2014). The ERT measurements indicate very high resistivity values in this zone (>100 kΩm), indicating either air or snow–ice fill. However, there are no direct observations of ice.
Temporal movement
The displacement measurements indicate a clear seasonal pattern in Mannen based on GNSS and laser measurements, as well as a possible seasonal pattern at Gámanjunni-3 based on the GB InSAR time series (Fig. 5). At both sites, there seems to be an acceleration during late winter and spring, with lower velocities during summer and fall. Wirz et al. (2014) found a maximum displacement at Mattertal (Switzerland) during fall and early winter and a minimum in spring. They point to meltwater infiltration and a phase lag from GST of 2–4 months for landslide displacement. Weber et al. (2017) presented a series of 8 years of fracture kinematics at 3500 m a.s.l. on the steep and highly fractured Hörnligrat ridge (Matterhorn, Swiss Alps). They showed that reversible displacements dominate in winter, while irreversible enhanced fracture displacements are mainly observed in summer, likely indicating thawing-related processes (e.g. meltwater percolation into fractures). However, this behaviour can strongly differ from one fracture to another as seen at the Aiguille du Midi at 3842 m a.s.l. in France (Guillet et al., unpublished). A similar pattern is observed for Veslemannen, where meltwater infiltration and thawing of seasonal frost along with precipitation episodes are discussed (Kristensen et al., 2021). The instability on the Zugspitze crest (Germany and Austria) shows movements of ca. 20 mm a−1 and the highest displacement rates during summer, with a reduction of up to 85 % during the remaining seasons (Mamot et al., 2021). Gischig et al. (2011) found high winter and low summer velocities at the Randa rock slope instability (Switzerland) and no correlation with rainfall. They could reproduce this pattern by thermomechanical modelling, whereby surface temperature governed the variation. At the Jettan site near Gámanjunni-3, Blikra and Christiansen (2014) documented ice in fractures and the highest velocities during summer, probably caused by melting of ice patches in fractures.
The possible higher early spring and summer velocities and lower displacement rates during fall and winter might be related to high water input in the fractures due to snowmelt, causing hydraulic and/or hydrostatic pressures and contributing to the melting of ice and snow in fractures formed during the winter. During summer and fall, the fractures might be free of ice and snow at the end of the melting season and water infiltration might have less impact. The lower velocities at Mannen during years with lower snow cover (Fig. 5f) also support this interpretation. However, only thermomechanical modelling, like applied by Gishig et al. (2011) and Mamot et al. (2021), may increase the understanding of how this signal can influence rock mass deformation.
At both study sites, long-term Holocene displacement variations seem to be related to climate signals (Hilger et al., 2021). These observations also agree with other studies such as a study by Philips et al. (2017), who report on 6000-year-old ice sampled from a tension crack associated with a rock pillar at Piz Kesch in the eastern Swiss Alps. The rock pillar collapsed in 2014 and had a volume of around 150 000 m3. Permafrost aggradation and degradation decrease the stability of intact rocks by both weakening rock bonds (rock fatigue) and critical and subcritical fracture propagation at sites with strongly varying cryostatic and hydrostatic conditions (Draebing and Krautblatter, 2019; Voigtländer et al., 2018). There certainly has been a long-term warming of our study sites since the LIA and an accelerated warming since ca. 2000. This warming trend has been documented all over Europe (Etzelmüller et al., 2020) and is responsible for permafrost degradation in Norway (Borge et al., 2017), possibly influencing both rock glacier velocities and landslide triggering (Eriksen et al., 2018; Frauenfelder et al., 2018).
In summary, both sites show corresponding seasonality with increased early summer velocities. Combined with the knowledge of at least discontinuous permafrost to patchy permafrost at the sites, snow and ice melt processes with associated water drainage in cracks are realistic explanations for a possible seasonality. There is evidence that the recently measured higher displacement rates in relation to Holocene values (Hilger et al., 2021) may be related to a warmer atmosphere and can accelerate into the future. The triggering of Veslemannen described in detail by Kristensen et al. (2021) might be a first sign.
For Gámanjunni-3, a rapid acceleration of the rock-glacier-like landform forming the southern part of the rockslide is possible, as described for various cases in the recent past in northern Norway (Eriksen et al., 2018), in the European Alps (Delaloye et al., 2008) and in Central Asia (Kääb et al., 2021). It could possibly lead to the triggering of secondary rockfalls or debris flow, as described elsewhere (Lugon and Stoffel, 2010; Kummert et al., 2018), or movement can stop when the deforming ice is melted out.
The following conclusions are drawn based on this study.
-
Temperature measurements, numerical modelling and geophysical soundings indicate the existence of permafrost at both study sites: at Gámanjunni-3 permafrost seems to extend down to 700 m a.s.l. today, while at Mannen sporadic pockets of permafrost are possible.
-
Surface air and ground temperatures have increased significantly since ca. 1900 by 1 and 1.5 ∘C, and the highest temperatures have been measured and modelled since 2000 at both study sites.
-
Displacement rates of Gámanjunni-3 rockslide co-vary significantly with subsurface resistivity and modelled ground temperatures. Increasing displacement rates seem to be associated with sub-zero ground temperatures and higher ground resistivity. This might be related to the presence of ground ice in fractures and pores close to the melting point, facilitating increased deformation.
-
A seasonality of displacement has been observed, with increased velocities during late winter and early summer at both sites. This pattern may be linked to the timing of snowmelt and water infiltration, leading to high water pressure. At Mannen, inter-annual variations may be related to snow cover thickness.
-
The rock glacier associated with the Gámanjunni-3 rockslide shows 2 to 3 times higher velocities (>100 mm a−1) and lower electrical resistivity than the rockslide part. The movement mechanisms are clearly different for both systems, and a mixture of water and ice contributing to the rock glacier movement is suggested.
-
The permafrost in the study sites has certainly warmed and probably degraded since the LIA, with an accelerated pace since ca. 2000. This atmospheric and associated permafrost warming might be a factor for the high measured deformation rates in relation to the Holocene average.
-
A possible permafrost degradation and probable thawing at Gámanjunni-3 may result in the destabilisation of the upper part of the plateau south of Gámanjunni-3, considerably increasing the susceptible volume for a worst-case collapse scenario.
The thermal modelling requires a set of parameters and boundary conditions. For our modelling we defined zones with crisp boundaries, defining surface sediment cover, bedrock or fractured bedrock. For each of the zones a set of material properties were defined, following the system in earlier publications (e.g. Westermann et al., 2013). Most cover sediments are quite coarse-grained, with no organic material (Fig. A1). For Gámanjunni-3 we used a well-defined geological model to delineate the rockslide (Böhme et al., 2016, 2019), while for Mannen the instability is much less defined. In the latter surficial material is thin, and bedrock at the surface in the slope and in the coarse blocks at the plateau dominates. For the sensitivity analysis we varied forcing air temperature, snow cover (by changing the Nf factor) and the water content, but the latter only for Gámanjunni because of bedrock dominance with assumed low water content for the Mannen site (Fig. A2). Permafrost distribution and geometry vary with these parameters, indicating that reality is probably somewhere in between. Especially for the Mannen site located in the sporadic permafrost zone, the parameter variations show the influence of less snow or cooler SAT on the possible permafrost presence at the site (Fig. A2b).
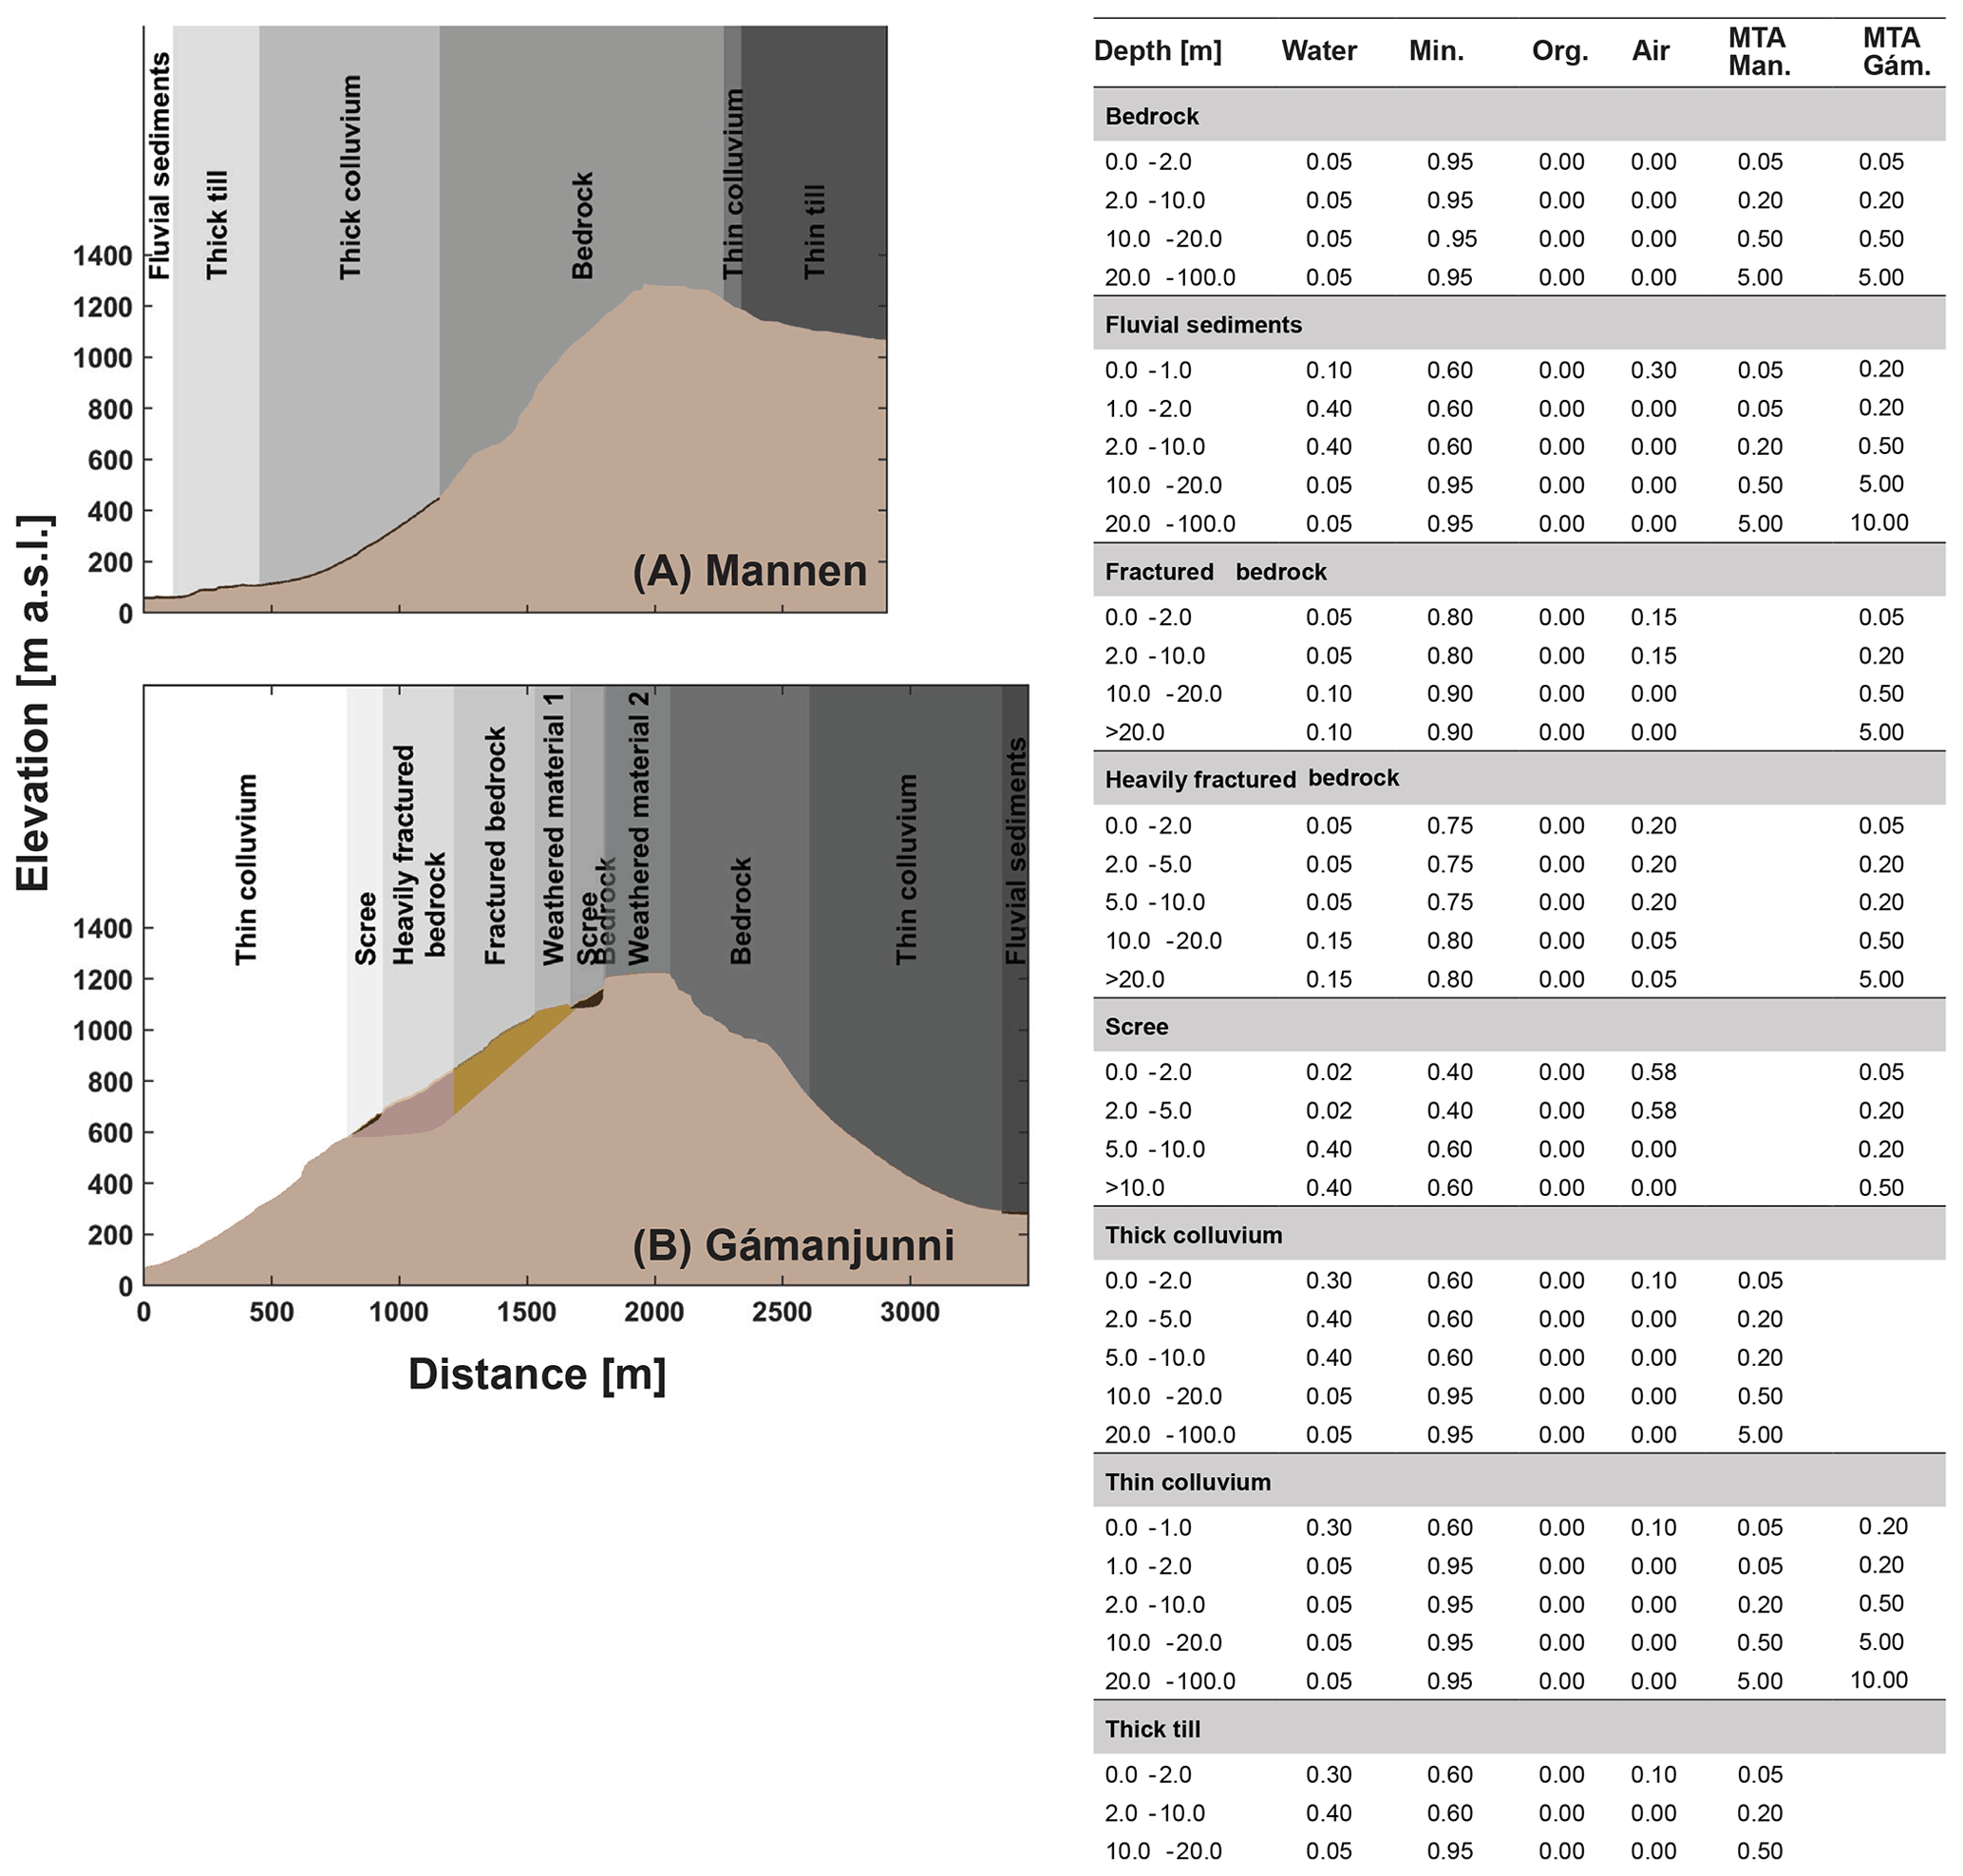
Figure A1The subsurface regions and parameterisation for the 2D thermal modelling for (a) the Gámanjunni-3 and (b) Mannen profile. MTA: maximum triangle area, which is a measure describing the spatial resolution of the triangles in the employed finite-element method solver. The table shows the stratigraphy chosen for the different regions, along with the depth parameterisation and volumetric contents of water–ice, mineral, and organic and air components following Westermann et al. (2013).
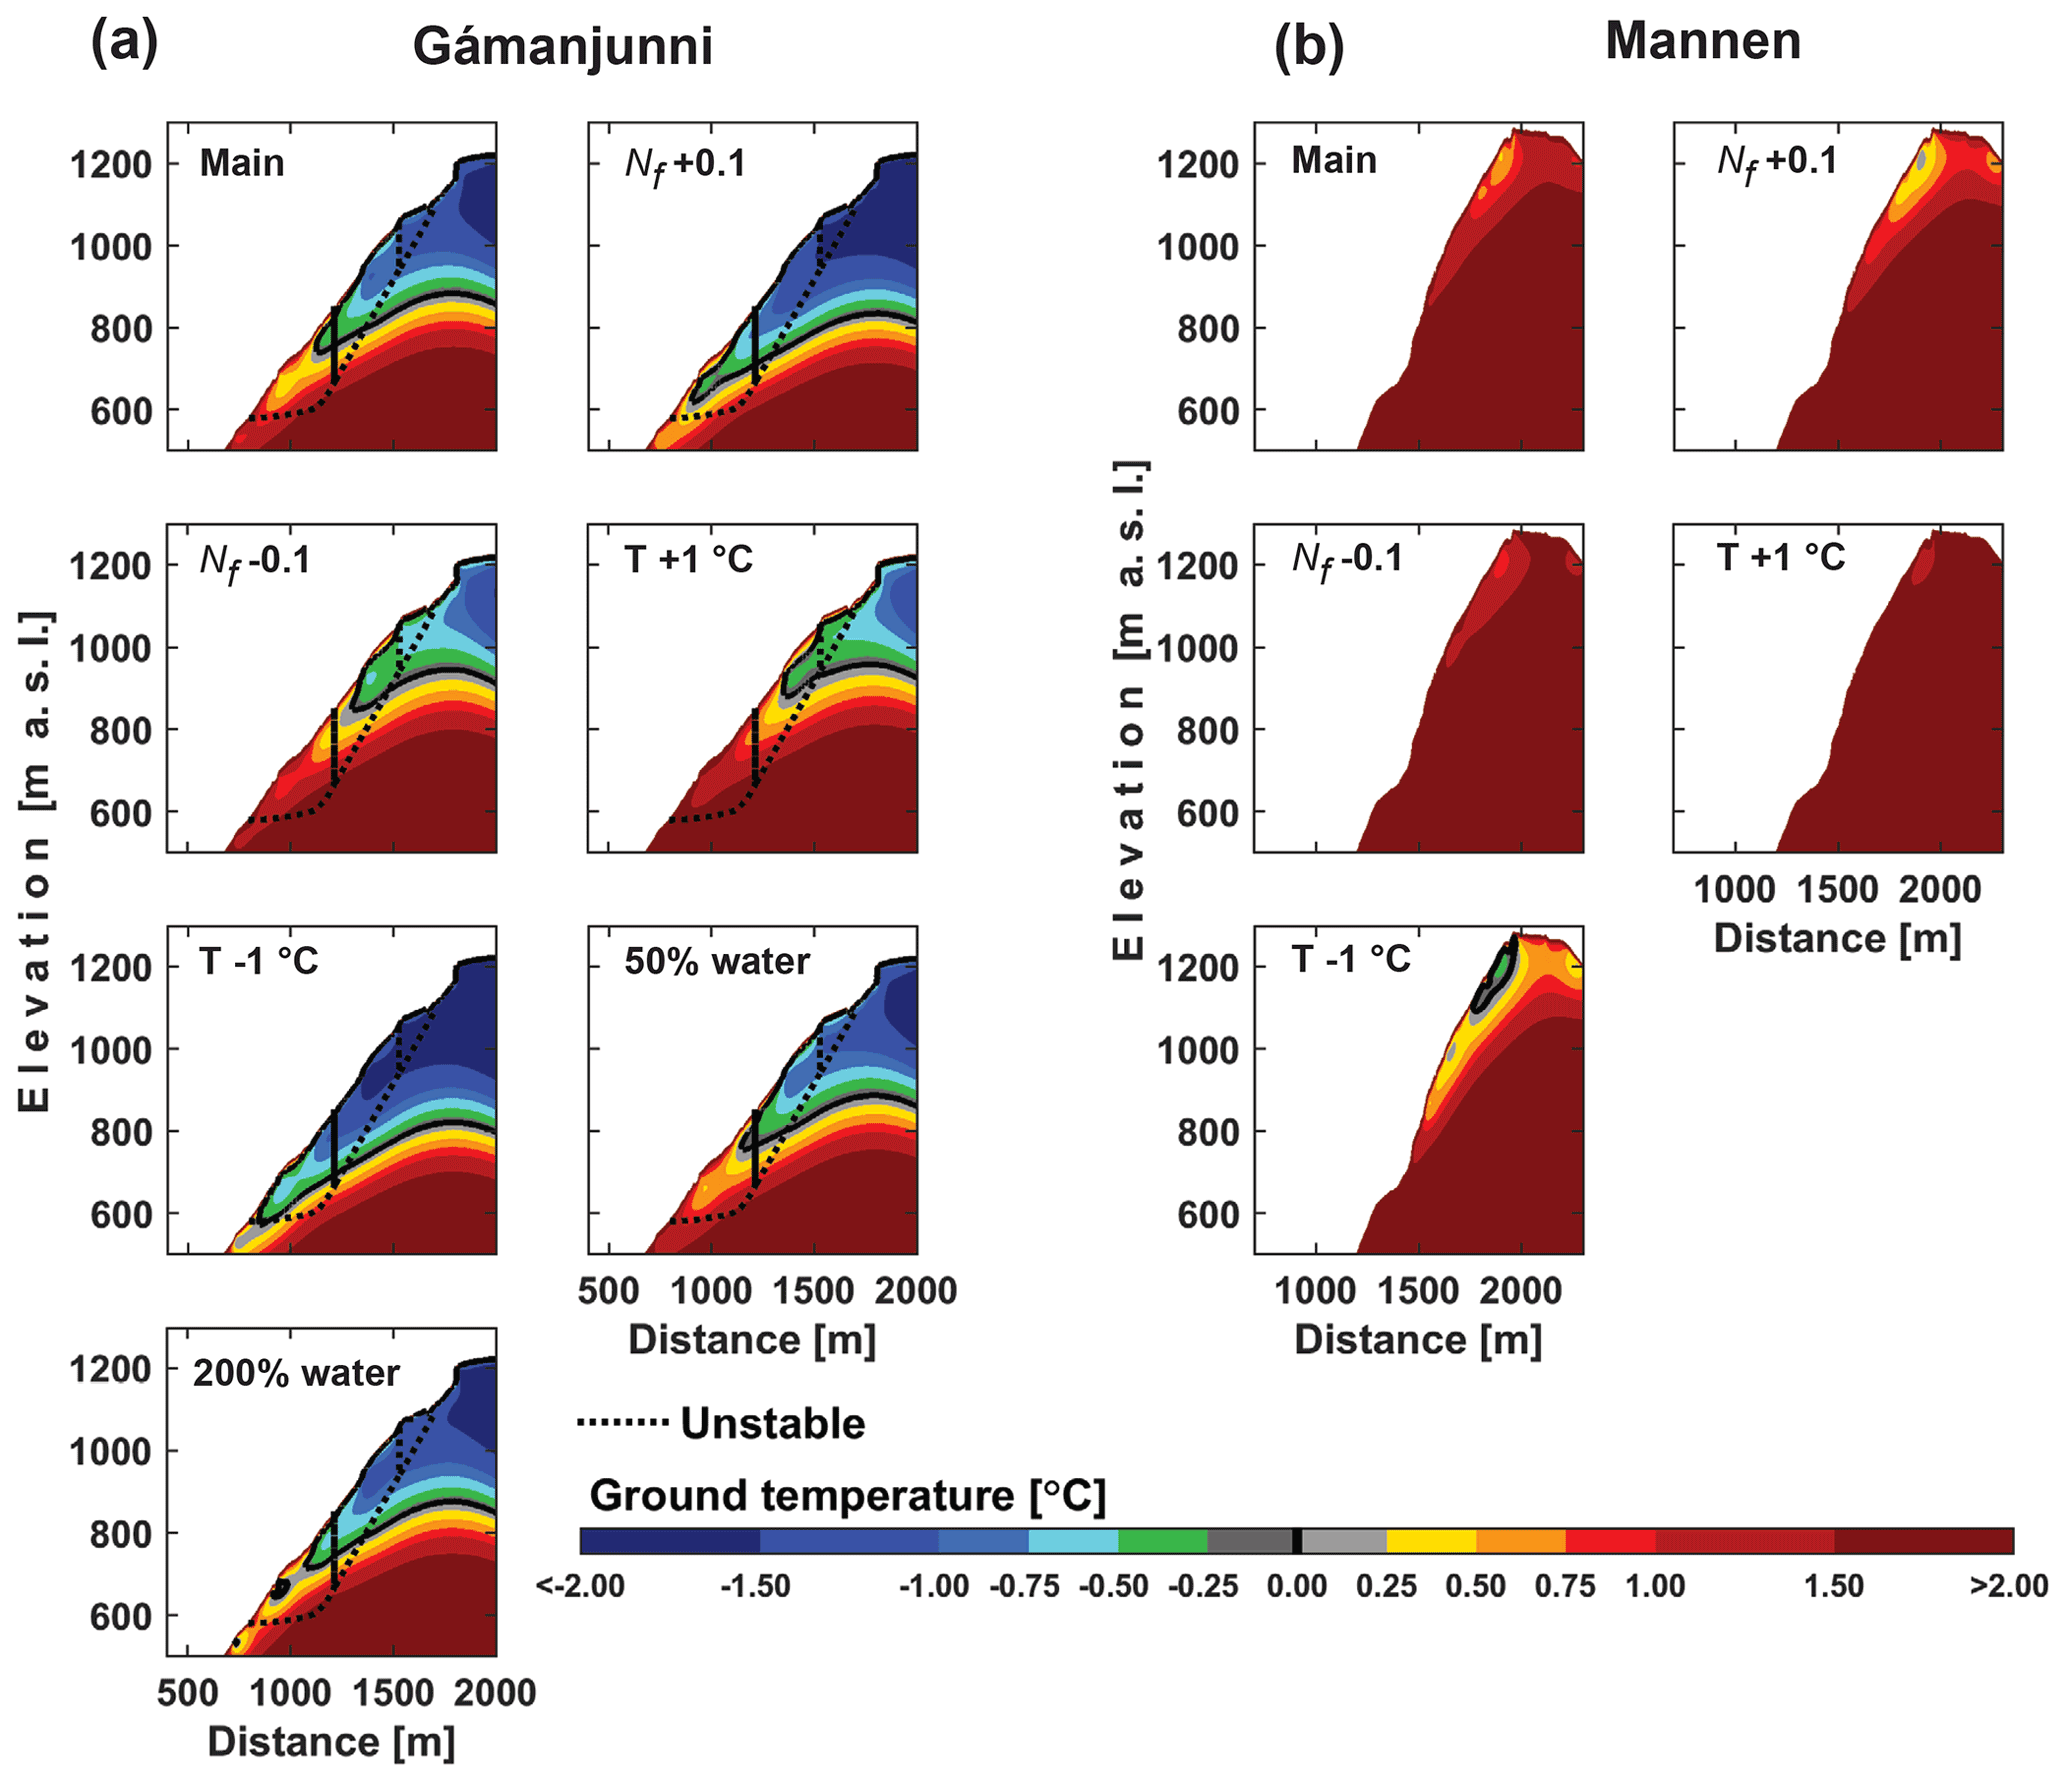
Figure A2Sensitivity plots for the modelled ground thermal regime of (a) Gámanjunni-3 and (b) Mannen. The main run is the presented run in Fig. 7, and the panels show modelled ground temperature in response to changes in Nf factor (Nf 0.1 means that Nf is increased by 0.1; Nf−0.1 means that Nf is decreased by 0.1), forcing SAT (T1 ∘C means that SAT is increased by 1 ∘C; T–1 ∘C means that SAT is decreased by 1 ∘C) and water content in the subsurface (50 % water means that water content is halved and the remaining fraction is added to the mineral fraction; 200 % water means that water content is doubled by reducing the mineral fraction). GT and permafrost geometry change in response to these variations. It is noteworthy at Mannen that only small changes in snow or forcing temperatures would produce considerably more permafrost in the unstable area. Due to limited assumed sediment cover for the Mannen site, we did no sensitivity plot for the water content in bedrock, which is low.
We projected all ERT profiles in a 3D topographic model in MATLAB (© MathWorks) (Figs. B1 and B2). The inversion was performed with the same parameters, and the colours follow the transition between possible thawed to possible frozen conditions derived from the laboratory analysis (Fig. 3). The profiles in the rock walls and steep slopes do not always follow straight lines because of security issues in the field. In the plots we indicate the moving block at Gámanjunni-3 and the plateau crests at both sites. It is clear that the inversion procedures may have produced artefacts at strong topographic transitions. However, the clear patterns described in the main text associated with fractures and snow-free rock walls are visible.
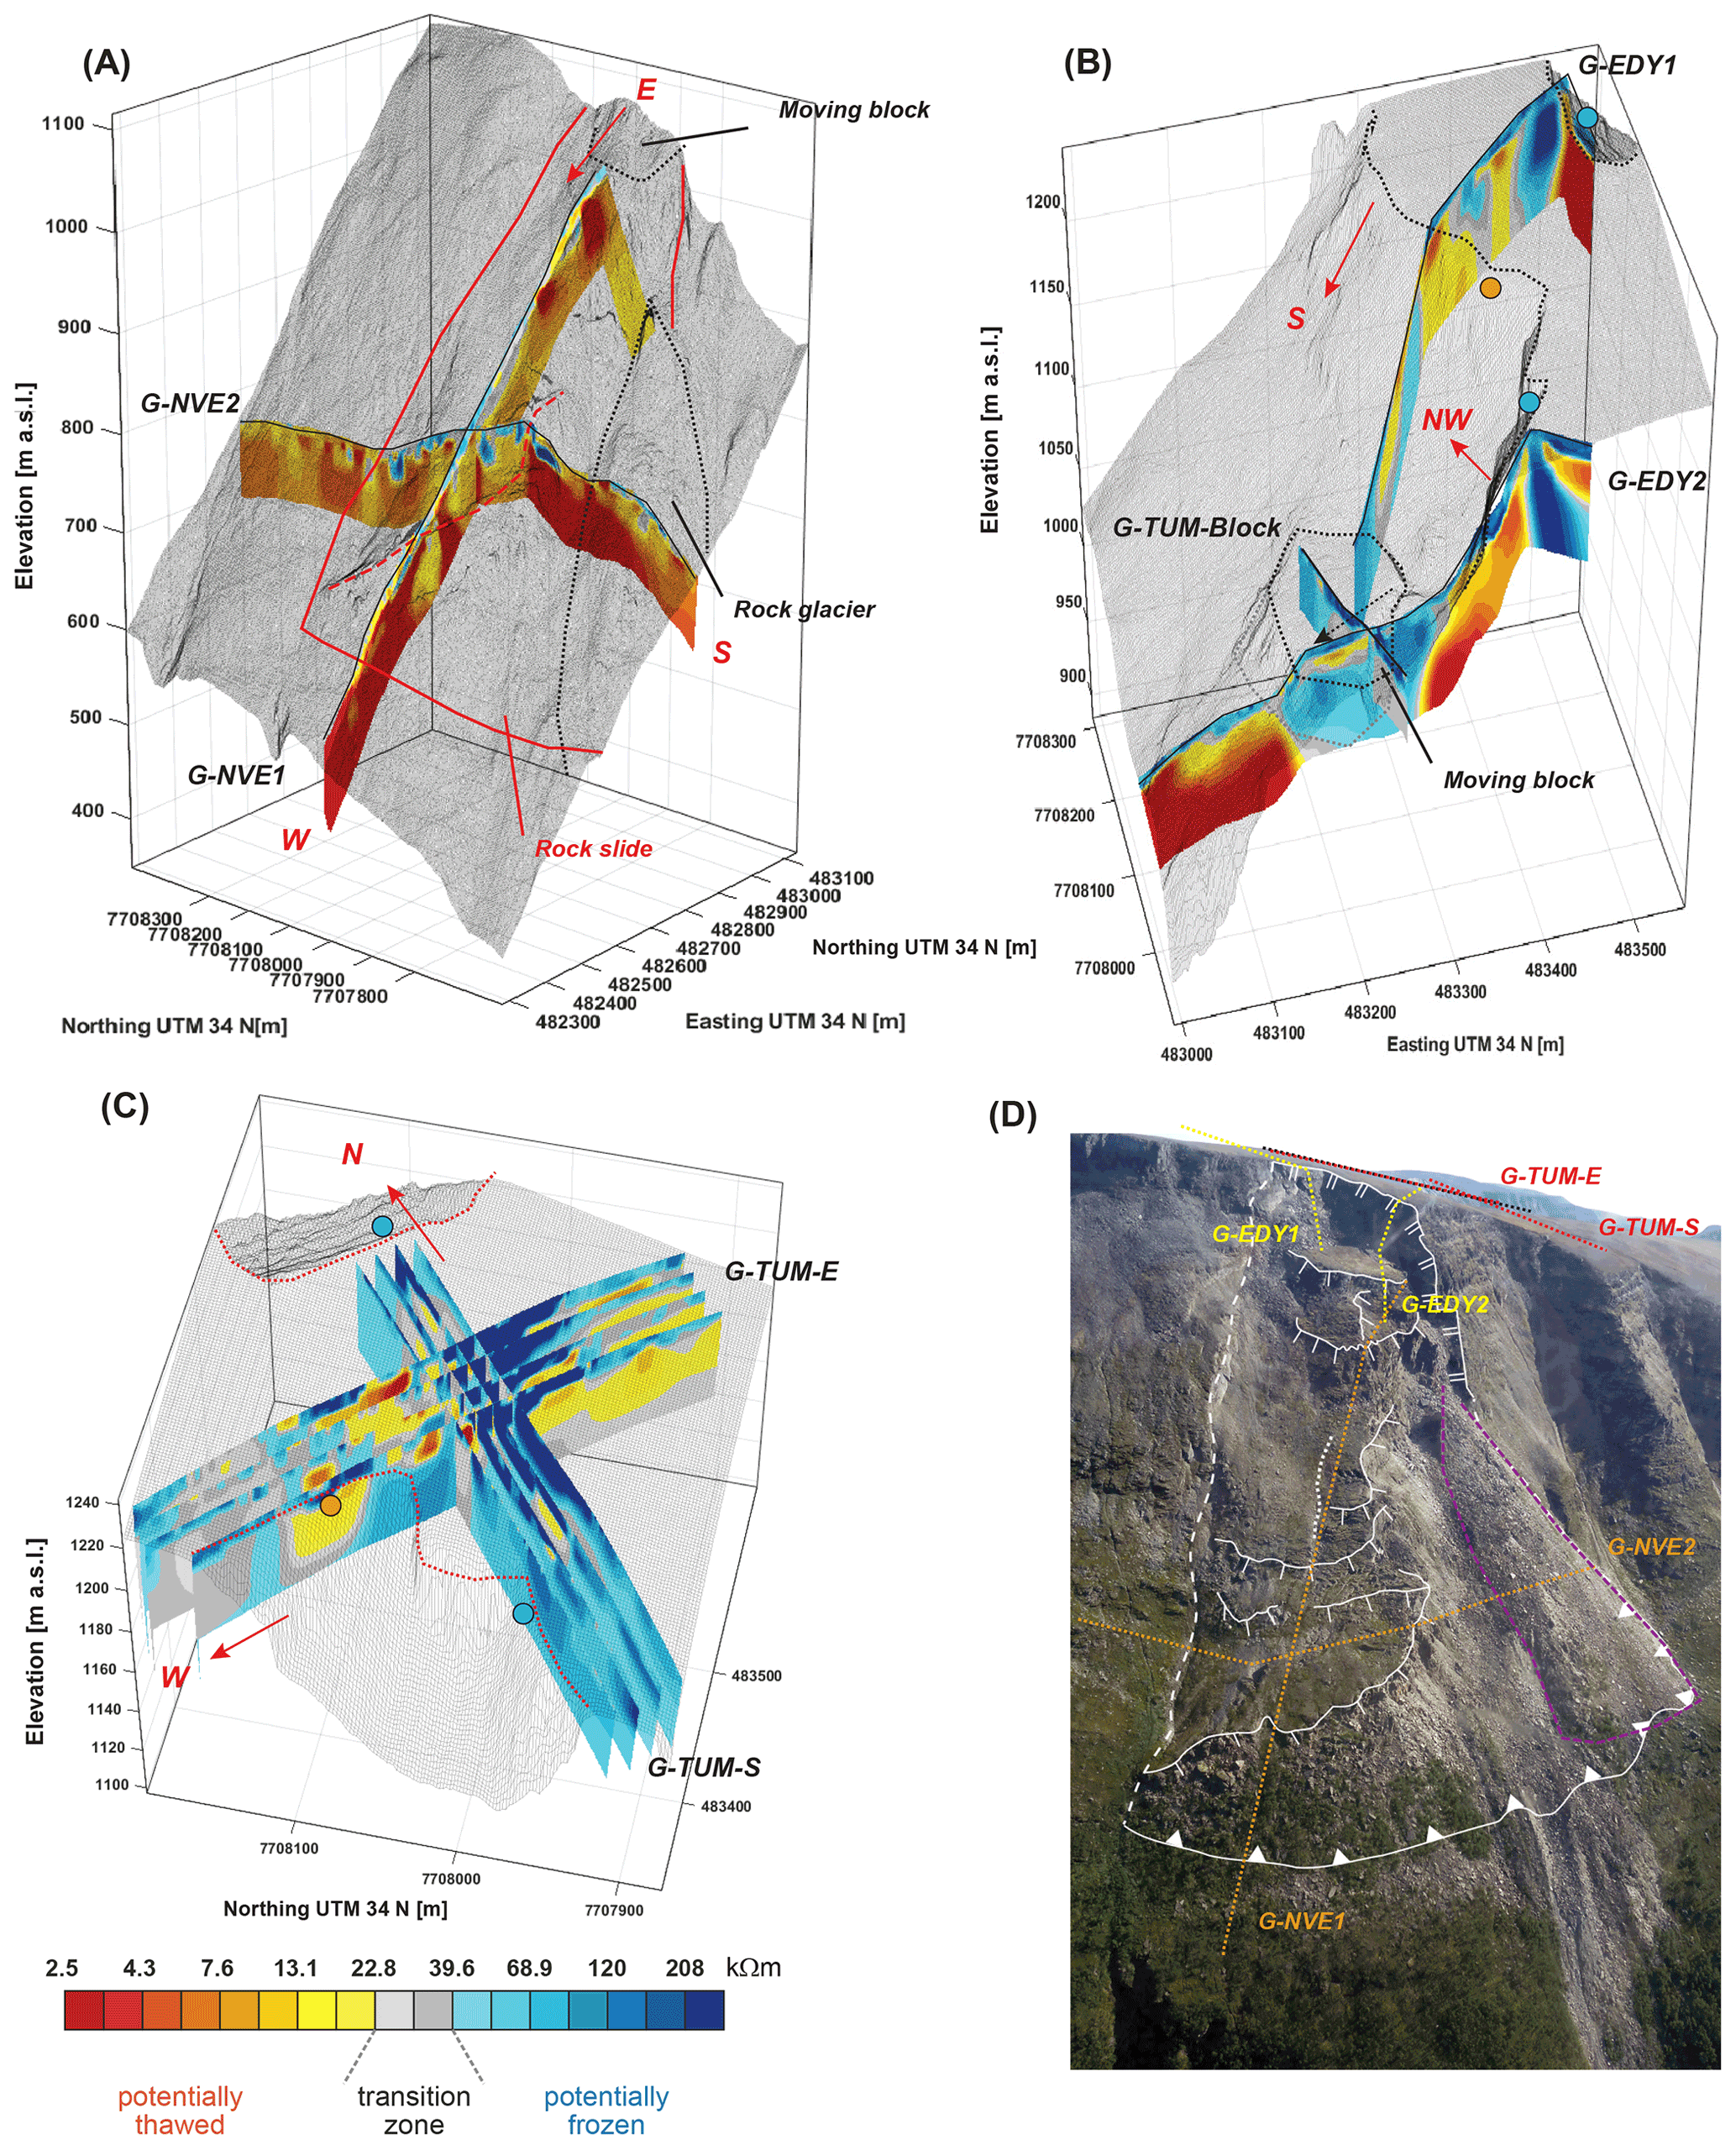
Figure B13D plots showing the ERT profiles in relation to topography for Gámanjunni-3. (a) G-NVE1 and G-NVE2. The rockslide (red) and rock glacier (black) are delineated. The black stippled line indicates the lower limit of the moving block. (b) The rock wall profiles G-EDY1 and G-EDY2 and the ERT profile over the moving block (G-TUM block). The moving block is indicated by the black line, as is the crest between the rock wall and top plateau. The circles show the location of the rock wall loggers (orange: >0 ∘C in annual average, blue: <0 ∘C. (c) Quasi-3D profiles on the plateau (G-TUM-S and E). The red line shows the crest, with the circles like in (b). (d) Oblique image of the instability at Gámanjunni-3 as in Fig. 2a. The approximate location of the ERT profiles is drawn on the images. © NGU.
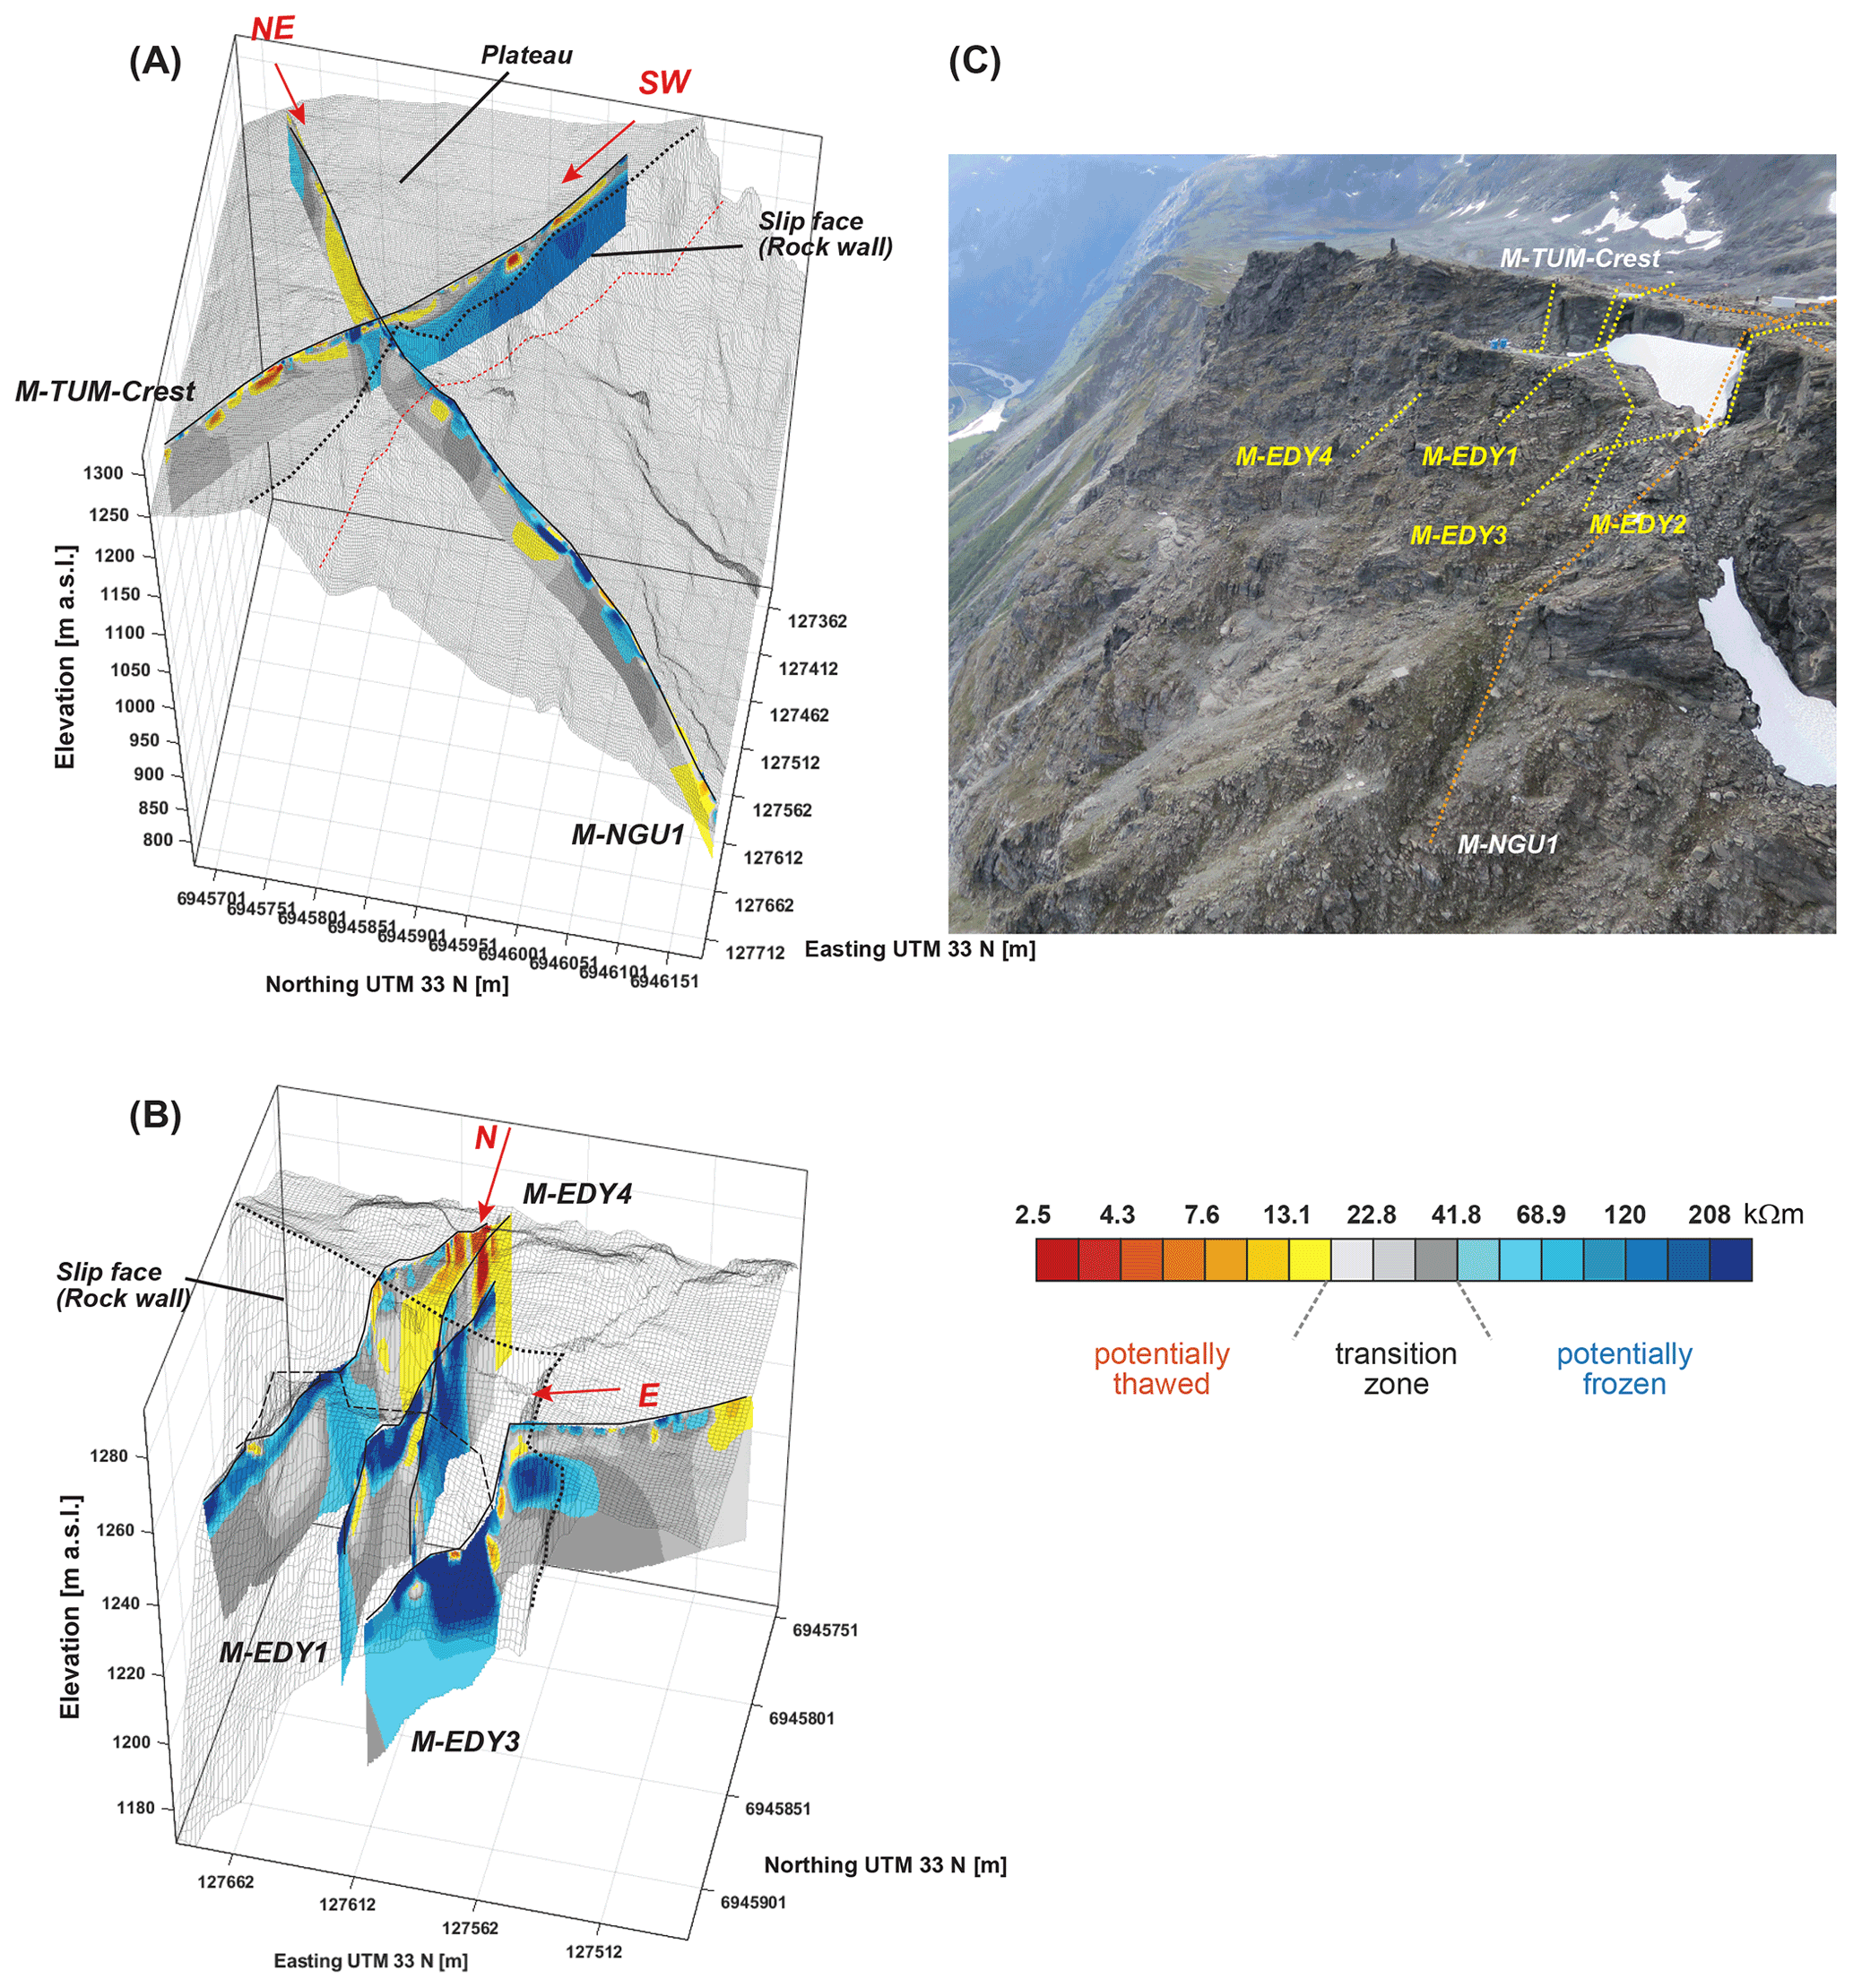
Figure B23D plots showing the ERT profiles in relation to topography for the Mannen instability. The arrows indicate topographic orientation of the profiles. The black stippled line indicates the crest forming the transition between plateau and rock walls. (a) M-TUM-Scarp and M-NGU. Plateau and rock wall are indicated in the plot. (b) Rock wall ERT profiles M-EDY1 to 4. They deviate from straight lines because of high topography and safety constraints. (c) Oblique air photo (© Pierre-Allain Duvillard), with approximate location of the ERT profile lines.
The main principles for the 4P model are (see Hauck et al., 2011 and Mewes et al., 2017):
-
the electrical mixing rule (Archie's law, which was found empirically by Archie, 1942, and later theoretically confirmed by e.g. Sen et al., 1981),
-
an extension to a four-phase medium of the seismic time-averaged approach for P-wave velocities (modified after Timur, 1968) and
-
the necessary assumption that the sum of all volumetric fractions of the ground is equal to 1.

Figure C1Resistivity and seismic velocities for the 4PM at Gámanjunni-3 for (a) G-NVE1 and (b) G-NVE2. Note that the profiles are subsets of G-NVE1 and G-NVE2 and are thus shorter than shown in Figs. 8 and B1. Note also that the colours for the electrical resistivity do no correspond to the colour scale derived from the laboratory analysis (Fig. 3) but are the original results first presented in Hauck and Hilbich (2018). The possible fracture zones mentioned in the paper are indicated as a box, while the possible lower permafrost limit is drawn as a line in (a).
Based on these principles, the 4PM uses the following equations to determine the volumetric ice (fi), water (fw) and air content (fa) for a given porosity model Φ (x, z) (; fr being the rock content).
Here, a (1 in many applications), m (cementation exponent) and n (saturation exponent) are empirically determined parameters (Archie, 1942), ρw is the resistivity of the pore water, vr, vw, va and vi are the theoretical P-wave velocities of the four components, and ρ(x,z) and v(x,z) are the inverted resistivity and P-wave velocity distributions, respectively.
The pore water resistivity (ρw) and the porosity Φ are the most sensitive for the calculation of the ice and water content (Hauck et al., 2011). As there is often a lack of borehole or laboratory data, given exact information around these parameters, there is a uncertainty involved in the modelling approach. This uncertainty has been addressed in several publications and can be found in e.g. Pellet et al. (2016) and Mewes et al. (2017).
While Fig. 11 in the main text shows and discusses the results of the 4PM for two profiles at Gámanjunni-3, Fig. C1 shows the original inverted ERT and SRT tomograms of the two profiles.
ERT profiles, measured rock surface temperatures, modelled ground temperatures, point velocity data from laser and GNSS, and velocity surfaces from GB-INSAR can be downloaded under https://doi.org/10.11582/2022.00004 (Etzelmüller, 2022). The long ERT profile from Mannen (M-NGU1) is available on request to the author. The corner reflector data and the TerraSAR-X data are available on request from Tom Rune Lauknes (NORCE). The climate data used can be retrieved from https://www.met.no/en/free-meteorological-data/Download-services. Code is available on request from the corresponding authors.
BE took the initiative for the study and coordinated the synthesis of the various datasets. He wrote the first drafts of the paper and designed most of the figures. JC carried out the numerical modelling of the ground thermal regime at both sites, provided background information and modelling results, and developed visualisation tools for the ERT profiles. SW developed much of the principles of the numerical modelling code and supervised the analysis. FM coordinated and participated in the field investigation of the ground temperature and ERT rock wall surveys at both sites. PAD and EM participated in the ERT surveys at Mannen and PAD and LR at Gámanjunni-3. AA, LK and IS contributed on-site knowledge as well as interpretation and displacement data from lasers, GNSS and GB InSAR on behalf of NVE. BJ, JL and MK contributed to the laboratory analysis of the bedrock samples at the Technical University of Munich (Germany) and ERT profiles conducted in the field at both sites. RH and MB from NGU contributed to a structural–geological model of the sites. CHa and CHi from the University of Fribourg, Switzerland, applied the four-phase model and submitted a report from the two long profiles at Gámanjunni-3. They also commented on and improved the inversion and interpretation of all the other ERT profiles. HØE provided and interpreted the TerraSAR-X data from Gámanjunni-3, along with ground temperature logger data. TRL coordinated installation and development of the satellite corner reflector processing chain and supervised the TerraSAR-X InSAR processing. All authors contributed actively to the final versions of the paper.
The contact author has declared that neither they nor their co-authors have any competing interests.
Publisher's note: Copernicus Publications remains neutral with regard to jurisdictional claims in published maps and institutional affiliations.
The TerraSAR-X satellite dataset was provided through the German Aerospace Centre (DLR) TerraSAR-X AO projects GEO0565 and GEO0764. The satellite corner reflectors were initially funded by the Norwegian Space Agency, and the processing of these data is now carried out as part of the InSAR Norway ground motion service hosted by NGU (http://insar.ngu.no, last access: 21 January 2022). Jan Steinar Rønning from NGU provided raw data for the ERT profile M-NGU at Mannen. Thanks for the extensive help in the field to go NVE colleagues, in particular Anders Furuseth and Roald Elvenes at NVE-Kåfjord, as well as Kjell R. Jogerud and Pål R. Hagen Røssevold at NVE-Stranda. Lars Harald Blikra from NVE supported the study extensively. Ove Brynhildsvoll, Jaroslav Obu, Juditha Schmidt, Erling Thokle Hovden, Trond Eiken (UiO), Paula Hilger (Høyskolen i Vestlandet, Sogndal), Regina Pläsken and Maximilian Reinhard (TUM) took part in fieldwork. Finally, thanks for the very insightful reviews go to Oliver Sass and Louise Vick, which improved the paper significantly.
This study was part of the project “Cry35 oWALL – Permafrost slopes in Norway” (243784/CLE) funded by the Research Council of Norway (RCN). Additional funding was provided by the Norwegian Geological Survey (Trondheim), the Department of Geosciences at the University of Oslo, the Norwegian Water and Energy Directorate (NVE), the EDYTEM (Chambéry, France), and the Deutsche Forschungsgemeinschaft (DFG) through the Technical University of Munich (TUM) International Graduate School of Science and Engineering (IGSSE), GSC 81.
This paper was edited by Arjen Stroeven and reviewed by Louise M. Vick and Oliver Sass.
Archie, G. E.: The electrical resistivity log as an aid in determining some reservoir characteristics, Transactions of the AIME, 146, 54–62, https://doi.org/10.2118/942054-g, 1942.
Arenson, L., Hoelzle, M., and Springman, S.: Borehole deformation measurements and internal structure of some rock glaciers in Switzerland, Permafrost Periglac., 13, 117–135, 2002.
Bardi, F., Raspini, F., Ciampalini, A., Kristensen, L., Rouyet, L., Lauknes, T. R., Frauenfelder, R., and Casagli, N.: Space-borne and ground-based InSAR data integration: the Åknes test site, Remote Sens., 8, 237, https://doi.org/10.3390/rs8030237, 2016.
Barker, R.: Depth of investigation of collinear symmetrical four-electrode arrays, Geophysics, 54, 1031–1037, 1989.
Blikra, L., Majala, G., Anda, E., Berg, H., Eikenæs, O., Helgås, G., Oppikofer, T., Hermanns, R., and Böhme, M.: Fare-og risikoklassifisering av ustabile fjellparti–Faresoner, arealhåndtering og tiltak, Norges vassdrags- og energidirektorat (NVE), Rapport No. 77-2016, 50 pp., available at: https://publikasjoner.nve.no/rapport/2016/rapport2016_77.pdf (last access: 22 January 2022), ISBN 978-82-410-1530-4, in Norwegian, 2016.
Blikra, L. H. and Christiansen, H. H.: A field-based model of permafrost-controlled rockslide deformation in northern Norway, Geomorphology, 208, 34–49, https://doi.org/10.1016/j.geomorph.2013.11.014, 2014.
Borge, A. F., Westermann, S., Solheim, I., and Etzelmüller, B.: Strong degradation of palsas and peat plateaus in northern Norway during the last 60 years, The Cryosphere, 11, 1–16, https://doi.org/10.5194/tc-11-1-2017, 2017.
Brenning, A., Gruber, S., and Hoelzle, M.: Sampling and statistical analyses of BTS measurements, Permafrost Periglac., 16, 383–394, 2005.
Böhme, M., Bunkholt, H., Dehls, J., Oppikofer, T., Hermanns, R., Dalsegg, E., Kristensen, L., Lauknes, T., and Eriksen, H.: Geologisk modell og fare-og risikoklassifisering av det ustabile fjellpartiet Gamanjunni 3 i Manndalen, Troms, NGU Rapport Nr. 2016.31, 64 pp., available at: https://www.nve.no/Media/5412/ngu-rapport-2016_031-gamanjunni-3.pdf (last access: 22 January 2022), ISSN: 2387-3515 (online), 2016.
Böhme, M., Hermanns, R., Gosse, J., Hilger, P., Eiken, T., Lauknes, T., and Dehls, J.: Comparison of monitoring data with paleo–slip rates: Cosmogenic nuclide dating detects acceleration of a rockslide, Geology, 47, 339–342, 2019.
Cicoira, A., Beutel, J., Faillettaz, J., and Vieli, A.: Water controls the seasonal rhythm of rock glacier flow, Earth Planet. Sci. Lett., 528, 115844, ISSN 0012-821X, 2019.
Crosta, G., Agliardi, F., Rivolta, C., Alberti, S., and Dei Cas, L.: Long-term evolution and early warning strategies for complex rockslides by real-time monitoring, Landslides, 14, 1615–1632, 2017.
Dabrowski, M., Krotkiewski, M., and Schmid, D. W.: MILAMIN: MATLAB-based finite element method solver for large problems, Geochem. Geophy. Geosy., 9, Q04030, https://doi.org/10.1029/2007GC001719, 2008.
Dahle, H., Anda, E., Saintot, A., and Sætre, S.: Faren for fjellskred fra fjellet Mannen i Romsdalen, NGU, Trondheim, 21 pp., available at: https://hdl.handle.net/11250/2664779 (last access: 26 January 2022), 2008.
Dahle, H., Saintot, A., Blikra, L., and Anda, E.: Geofagleg oppfølging av ustabilt fjellparti ved Mannen i Romsdalen, NGU report, 23 pp., available at: https://hdl.handle.net/11250/2664581 (last access: 26 January 2022), 2010.
Dahlin, T. and Zhou, B.: A numerical comparison of 2D resistivity imaging with 10 electrode arrays, Geophys. Prospect., 52, 379–398, 2004.
Dalsegg, E. and Rønning, J. S.: Geofysiske målinger på Mannen i Rauma kommune, Møre og Romsdal, Norwegian Geological Survey (NGU) report, available at: https://openarchive.ngu.no/ngu-xmlui/bitstream/handle/11250/2664546/2012_024.pdf?sequence=1&isAllowed=y (last access: 21 January 2022), 2012.
Davidson, E. A. and Janssens, I. A.: Temperature sensitivity of soil carbon decomposition and feedbacks to climate change, Nature, 440, 165, https://doi.org/10.1038/nature04514, 2006.
Davies, M. C. R., Hamza, O., and Harris, C.: The effect of rise in mean annual temperature on the stability of rock slopess containing ice-filled discontinuities, Permafrost Periglac., 12, 137–144, 2001.
Delaloye, R., Perruchoud, E., Avian, M., Kaufmann, V., Bodin, X., Hausmann, H., Ikeda, A., Kääb, A., Kellerer-Pirklbauer, A., and Krainer, K.: Recent interannual variations of rock glacier creep in the European Alps, Proceedings, Ninth International Conference on Permafrost, Zürich, Switzerland, 343–348, available at: https://www.zora.uzh.ch/id/eprint/7031/2/Delaloye_Perruchoud_Recent_Interannual_2008V.pdf (last access: 22 January 2022), 2008.
Draebing, D. and Krautblatter, M.: The efficacy of frost weathering processes in alpine rockwalls, Geophys. Res. Lett., 46, 6516–6524, 2019.
Eriksen, H., Rouyet, L., Lauknes, T., Berthling, I., Isaksen, K., Hindberg, H., Larsen, Y., and Corner, G.: Recent acceleration of a rock glacier complex, Adjet, Norway, documented by 62 years of remote sensing observations, Geophys. Res. Lett., 45, 8314–8323, 2018.
Eriksen, H. Ø.: Instrumentation and temperature data (2013–2017), Gámanjunni 3 rockslide and rock glacier, Manndalen, Troms., NORUT, Tromsø9/2018, ISBN 978-82-7492-360-7, 2018.
Eriksen, H. Ø., Lauknes, T. R., Larsen, Y., Corner, G. D., Bergh, S. G., Dehls, J., and Kierulf, H. P.: Visualizing and interpreting surface displacement patterns on unstable slopes using multi-geometry satellite SAR interferometry (2D InSAR), Remote Sens. Environ., 191, 297–312, 2017.
Etzelmüller, B.: Gamanjunni_and_mannen_rockwall_data [data set], Norstore, https://doi.org/10.11582/2022.00004, 2022.
Etzelmüller, B., Guglielmin, M., Hauck, C., Hilbich, C., Hoelzle, M., Isaksen, K., Noetzli, J., Oliva, M., and Ramos, M.: Twenty years of European mountain permafrost dynamics – the PACE legacy, Environ. Res. Lett., 15, 104070, https://doi.org/10.1088/1748-9326/abae9d, 2020.
Evans, S. G. and DeGraff, J. V.: Catastrophic landslides: effects, occurrence, and mechanisms, Geological Society of America, 420 pp., ISBN 0-8137-4115-7, 2002.
Farbrot, H., Isaksen, K., Etzelmuller, B., and Gisnas, K.: Ground Thermal Regime and Permafrost Distribution under a Changing Climate in Northern Norway, Permafrost Periglac., 24, 20–38, https://doi.org/10.1002/Ppp.1763, 2013.
Fischer, L., Purves, R. S., Huggel, C., Noetzli, J., and Haeberli, W.: On the influence of topographic, geological and cryospheric factors on rock avalanches and rockfalls in high-mountain areas, Nat. Hazards Earth Syst. Sci., 12, 241–254, https://doi.org/10.5194/nhess-12-241-2012, 2012.
Frauenfelder, R., Isaksen, K., Lato, M. J., and Noetzli, J.: Ground thermal and geomechanical conditions in a permafrost-affected high-latitude rock avalanche site (Polvartinden, northern Norway), The Cryosphere, 12, 1531–1550, https://doi.org/10.5194/tc-12-1531-2018, 2018.
GeoExpert: Gamanjunni rock mass movement site/Kåfjord, Norway, Hybrid seismic mapping of the subsurface structures, Embrach, Austria, available at: https://www.nve.no/Media/5410/1_gamanjunni_seismic_report.pdf (last access: 22 January 2022), 2016.
Gischig, V. S., Moore, J. R., Evans, K. F., Amann, F., and Loew, S.: Thermomechanical forcing of deep rock slope deformation: 2. The Randa rock slope instability, J. Geophys. Res.-Earth, 116, https://doi.org/10.1029/2011JF002007, 2011.
Gisnås, K., Etzelmuller, B., Farbrot, H., Schuler, T. V., and Westermann, S.: CryoGRID 1.0: Permafrost Distribution in Norway estimated by a Spatial Numerical Model, Permafrost Periglac., 24, 2–19, https://doi.org/10.1002/Ppp.1765, 2013.
Gisnås, K., Westermann, S., Schuler, T. V., Litherland, T., Isaksen, K., Boike, J., and Etzelmüller, B.: A statistical approach to represent small-scale variability of permafrost temperatures due to snow cover, The Cryosphere, 8, 2063–2074, https://doi.org/10.5194/tc-8-2063-2014, 2014.
Gisnås, K., Etzelmüller, B., Lussana, C., Hjort, J., Sannel, B., Isaksen, K., Westermann, S., Kuhry, P., Christiansen, H. H., Frampton, A., and Åkermann, J.: Permafrost map for Norway, Sweden and Finland, Permafrost Periglac., 28, 359–378, https://doi.org/10.1002/ppp.1922, 2016a.
Gisnås, K., Westermann, S., Schuler, T. V., Melvold, K., and Etzelmüller, B.: Small-scale variation of snow in a regional permafrost model, The Cryosphere, 10, 1201–1215, https://doi.org/10.5194/tc-10-1201-2016, 2016b.
Gruber, S. and Haeberli, W.: Permafrost in steep bedrock slopes and its temperature-related destabilization following climate change, J. Geophys. Res.-Earth, 112, F02s18, https://doi.org/10.1029/2006jf000547, 2007.
Gruber, S. and Haeberli, W.: Mountain permafrost, in: Permafrost soils, Springer, 33–44, edited by: Margesin, R., ISBN 978-3-540-69371-0, 2009.
Gruber, S., Hoelzle, M., and Haeberli, W.: Rock-wall temperatures in the Alps: Modelling their topographic distribution and regional differences, Permafrost Periglac., 15, 299–307, https://doi.org/10.1002/Ppp.501, 2004.
GSA: Electrical Resistivity Tomography at Gamanjunni, Troms, Norway, Gelogical Survey of Austria, Vienna, GSA, Internal report: 12, 12 pp. (Available on request), 2016.
Haberkorn, A., Hoelzle, M., Phillips, M., and Kenner, R.: Snow as a driving factor of rock surface temperatures in steep rough rock walls, Cold Reg. Sci. Technol., 118, 64–75, 2015.
Haberkorn, A., Wever, N., Hoelzle, M., Phillips, M., Kenner, R., Bavay, M., and Lehning, M.: Distributed snow and rock temperature modelling in steep rock walls using Alpine3D, The Cryosphere, 11, 585–607, https://doi.org/10.5194/tc-11-585-2017, 2017.
Haeberli, W.: Die Basis Temperatur der winterlichen Schneedecke als möglicher Indikator für die Verbreitung von Permafrost, Zeitschrift für Gletscherkunde und Glazialgeologie, 9, 221–227, 1973.
Haeberli, W., Hoelzle, M., Kaeaeb, A., Keller, F., Vonder, M. D., and Wagner, S.: Ten years after drilling through the permafrost of the active rock glacier Murtel, Eastern Swiss Alps; answered questions and new perspectives, in: Permafrost; Seventh International Conference on Permafrost, Proceedings, ISBN 2920197576 9782920197572, edited by: Lewkowicz, A. G. and Allard, M., Collection Nordicana, Centre d'Etudes Nordiques, Universite Laval, Quebec, PQ, Canada, 403–410, 1998.
Haeberli, W., Hallet, B., Arenson, L., Elconin, R., Humlun, O., Kaab, A., Kaufmann, V., Ladanyi, B., Matsuoka, N., Springman, S., and Vonder Muhll, D.: Permafrost creep and rock glacier dynamics, Permafrost Periglac., 17, 189–214, https://doi.org/10.1002/ppp.561, 2006.
Haeberli, W., Noetzli, J., Arenson, L., Delaloye, R., Gaertner-Roer, I., Gruber, S., Isaksen, K., Kneisel, C., Krautblatter, M., and Phillips, M.: Mountain permafrost: development and challenges of a young research field, J. Glaciol., 57, 1043–1058, 2010.
Hasler, A., Gruber, S., Font, M., and Dubois, A.: Advective Heat Transport in Frozen Rock Clefts: Conceptual Model, Laboratory Experiments and Numerical Simulation, Permafrost Periglac., 22, 378–389, https://doi.org/10.1002/ppp.737, 2011.
Hauck, C.: Frozen ground monitoring using DC resistivity tomography, Geophys. Res. Lett., 29, 12-11–12-14, 2002.
Hauck, C. and Hilbich, C.: 4-phase model simulations Gamanjunni, Norway, 2018, NVE report, available at: https://www.nve.no/media/7646/report-gamanjunni-4phasemodel-unifr-2018.pdf (last access: 21 January 2022), NVE, Oslo, 2018.
Hauck, C., Isaksen, K., Vonder Mühll, D., and Sollid, J. L.: Geophysical surveys designed to delineate the altitudinal limit of mountain permafrost: an example from Jotunheimen, Norway, Permafrost Periglac., 15, 191–205, 2004.
Hauck, C., Böttcher, M., and Maurer, H.: A new model for estimating subsurface ice content based on combined electrical and seismic data sets, The Cryosphere, 5, 453–468, https://doi.org/10.5194/tc-5-453-2011, 2011.
Henderson, I. and Saintot, A.: Fjellskredundersøkelser i Møre og Romsdal, NGU report, available at: https://hdl.handle.net/11250/2664802 (last access: 22 January 2022), 2007.
Henderson, I. H. and Saintot, A.: Regional spatial variations in rockslide distribution from structural geology ranking: an example from Storfjorden, western Norway, Geological Society, London, Special Publications, 351, 79–95, 2011.
Hermanns, R., Blikra, L., Anda, E., Saintot, A., Dahle, H., Oppikofer, T., Fischer, L., Bunkholt, H., Böhme, M., Dehls, J., Lauknes, T., Redfield, T., Osmundsen, P., and Eiken, T.: Systematic Mapping of Large Unstable Rock Slopes in Norway, in: Landslide Science and Practice, edited by: Margottini, C., Canuti, P., and Sassa, K., Springer Berlin Heidelberg, 29–34, https://doi.org/10.1007/978-3-642-31325-7_3, 2013a.
Hermanns, R. L., Dahle, H., Bjerke, P. L., Crosta, G. B., Anda, E., Blikra, L. H., Saintot, A., and Longva, O.: Rockslide Dams in Møre og Romsdal County, Norway, in: Landslide Science and Practice, Springer, 3–12, https://doi.org/10.1007/978-3-642-31319-6-1, 2013b.
Hermanns, R. L., Oppikofer, T., Roberts, N. J., and Sandøy, G.: Catalogue of historical displacement waves and landslide-triggered tsunamis in Norway, in: Engineering geology for society and territory, edited by: Lollino, G., Springer, https://doi.org/10.1007/978-3-319-08660-6_13, 2014.
Hilbich, C., Hauck, C., Hoelzle, M., Scherler, M., Schudel, L., Voelksch, I., Muehll, D. V., and Maeusbacher, R.: Monitoring mountain permafrost evolution using electrical resistivity tomography: A 7-year study of seasonal, annual, and long-term variations at Schilthorn, Swiss Alps, J. Geophys. Res.-Earth, 113, F01S90, https://doi.org/10.1029/2007JF000799 2008.
Hilger, P., Hermanns, R. L., Gosse, J. C., Jacobs, B., Etzelmüller, B., and Krautblatter, M.: Multiple rock-slope failures from Mannen in Romsdal Valley, western Norway, revealed from Quaternary geological mapping and 10Be exposure dating, The Holocene, 28, 1841–1854, 2018.
Hilger, P., Hermanns, R., Czekirda, J., Myhra, K. S., Gosse, J., and Etzelmüller, B.: Permafrost as a first order control on long-term rock-slope deformation in the (Sub-)Arctic, Quat. Sci. Rev., 251, 106718, https://doi.org/10.1016/j.quascirev.2020.106718, 2021.
Hjort, J., Karjalainen, O., Aalto, J., Westermann, S., Romanovsky, V. E., Nelson, F. E., Etzelmüller, B., and Luoto, M.: Degrading permafrost puts Arctic infrastructure at risk by mid-century, Nat. Commun., 9, 5147, https://doi.org/10.1038/s41467-018-07557-4, 2018.
Hughes, A. L., Gyllencreutz, R., Lohne, Ø. S., Mangerud, J., and Svendsen, J. I.: The last Eurasian ice sheets – a chronological database and time-slice reconstruction, DATED-1, Boreas, 45, 1–45, 2016.
Ikeda, A., Matsuoka, N., and Kaab, A.: Fast deformation of perennially frozen debris in a warm rock glacier in the Swiss Alps: An effect of liquid water, J. Geophys. Res.-Earth, 113, F01021, https://doi.org/10.1029/2007JF000859, 2008.
Isaksen, K., Holmlund, P., Sollid, J. L., and Harris, C.: Three deep alpine-permafrost boreholes in Svalbard and Scandinavia, Permafrost Periglac., 12, 13–25, 2001.
Isaksen, K., Hauck, C., Gudevang, E., Ødegård, R. S., and Sollid, J. L.: Mountain permafrost distribution on Dovrefjell and Jotunheimen, southern Norway, based on BTS and DC resistivity tomography data, Norsk Geogr. Tidsskr., 56, 122–136, 2002.
Jia, H., Xiang, W., and Krautblatter, M.: Quantifying rock fatigue and decreasing compressive and tensile strength after repeated freeze-thaw cycles, Permafrost Periglac., 26, 368–377, 2015.
Kenner, R., Phillips, M., Beutel, J., Hiller, M., Limpach, P., Pointner, E., and Volken, M.: Factors controlling velocity variations at short-term, seasonal and multiyear time scales, Ritigraben rock glacier, Western Swiss Alps, Permafrost Periglac., 28, 675–684, 2017.
Krautblatter, M. and Hauck, C.: Electrical resistivity tomography monitoring of permafrost in solid rock walls, J. Geophys. Res.-Earth, 112, F02S20, https://doi.org/10.1029/2006JF000546, 2007.
Krautblatter, M., Verleysdonk, S., Flores-Orozco, A., and Kemna, A.: Temperature-calibrated imaging of seasonal changes in permafrost rock walls by quantitative electrical resistivity tomography (Zugspitze, German/Austrian Alps), J. Geophys. Res.-Earth, 115, 2010.
Krautblatter, M., Funk, D., and Günzel, F. K.: Why permafrost rocks become unstable: a rock–ice-mechanical model in time and space, Earth Surf Proc. Land, 38, 876–887, https://doi.org/10.1002/esp.3374, 2013.
Kristensen, L., Czekirda, J., Nicolet, P., Etzelmüller, B., Abellan, A., Skrede, I., Blikra, L. H., Pullarello, J., Penna, I., and Oldani, S.: Movements, failure and climatic control of the Veslemannen rockslide, Western Norway, Landslides, 1963–1980, https://doi.org/10.1007/s10346-020-01609-x, 2021.
Kummert, M., Delaloye, R., and Braillard, L.: Erosion and sediment transfer processes at the front of rapidly moving rock glaciers: Systematic observations with automatic cameras in the western Swiss Alps, Permafrost Periglac., 29, 21–33, 2018.
Kääb, A., Frauenfelder, R., and Roer, I.: On the response of rockglacier creep to surface temperature increase, Glob. Planet. Change, 56, 172–187, https://doi.org/10.1016/j.gloplacha.2006.07.005, 2007.
Kääb, A., Strozzi, T., Bolch, T., Caduff, R., Trefall, H., Stoffel, M., and Kokarev, A.: Inventory and changes of rock glacier creep speeds in Ile Alatau and Kungöy Ala-Too, northern Tien Shan, since the 1950s, The Cryosphere, 15, 927–949, https://doi.org/10.5194/tc-15-927-2021, 2021.
Larsen, Y., Engen, G., Lauknes, T., Malnes, E., and Høgda, K.: A generic differential InSAR processing system, with applications to land subsidence and SWE retrieval, Proc. Advances in SAR interferometry from ENVISAT and ERS missions (FRINGE 2005), ESA ESRIN, Frascati, Italy, 28, 2005.
Lauknes, T. R., Shanker, A. P., Dehls, J. F., Zebker, H. A., Henderson, I. H. C., and Larsen, Y.: Detailed rockslide mapping in northern Norway with small baseline and persistent scatterer interferometric SAR time series methods, Remote Sens. Environ., 114, 2097–2109, https://doi.org/10.1016/j.rse.2010.04.015, 2010.
Leinauer, J.: Controls of permafrost-related rock slope instabilities exemplified at the Gamanjunni (Norway), MSc thesis, Engineering Geology & Hydrogeology, Technical University of Munich, Munchen, 2017.
Lewkowicz, A. G., Bonnaventure, P. P., Smith, S. L., and Kuntz, Z.: Spatial and Thermal Characteristics of Mountain Permafrost, Northwest Canada, Geogr. Ann. A, 94A, 195–213, https://doi.org/10.1111/j.1468-0459.2012.00462.x, 2012.
Loke, M. H. and Barker, R. D.: Rapid least-squares inversion of apparent resistivity pseudosections using a quasi-Newton method, Geophys. Prospect., 44, 131–152, 1995.
Luethi, R., Phillips, M., and Lehning, M.: Estimating non-conductive heat flow leading to intra-permafrost Talik formation at the Ritigraben Rock Glacier (Western Swiss Alps), Permafrost Periglac., 28, 183–194, 2017.
Lugon, R., and Stoffel, M.: Rock-glacier dynamics and magnitude–frequency relations of debris flows in a high-elevation watershed: Ritigraben, Swiss Alps, Global Planet. Change, 73, 202–210, 2010.
Lussana, C., Saloranta, T., Skaugen, T., Magnusson, J., Tveito, O. E., and Andersen, J.: seNorge2 daily precipitation, an observational gridded dataset over Norway from 1957 to the present day, Earth Syst. Sci. Data, 10, 235–249, https://doi.org/10.5194/essd-10-235-2018, 2018.
Magnin, F., Deline, P., Ravanel, L., Noetzli, J., and Pogliotti, P.: Thermal characteristics of permafrost in the steep alpine rock walls of the Aiguille du Midi (Mont Blanc Massif, 3842 m a.s.l), The Cryosphere, 9, 109–121, https://doi.org/10.5194/tc-9-109-2015, 2015a.
Magnin, F., Krautblatter, M., Deline, P., Ravanel, L., Malet, E., and Bevington, A.: Determination of warm, sensitive permafrost areas in near-vertical rockwalls and evaluation of distributed models by electrical resistivity tomography, J. Geophys. Res.-Earth, 120, 745–762, 2015b.
Magnin, F., Josnin, J.-Y., Ravanel, L., Pergaud, J., Pohl, B., and Deline, P.: Modelling rock wall permafrost degradation in the Mont Blanc massif from the LIA to the end of the 21st century, The Cryosphere, 11, 1813–1834, https://doi.org/10.5194/tc-11-1813-2017, 2017.
Magnin, F., Etzelmüller, B., Westermann, S., Isaksen, K., Hilger, P., and Hermanns, R. L.: Permafrost distribution in steep rock slopes in Norway: measurements, statistical modelling and implications for geomorphological processes, Earth Surf. Dynam., 7, 1019–1040, https://doi.org/10.5194/esurf-7-1019-2019, 2019.
Majala, G., Anda, E., Berg, H., Eikenæs, O., Helgås, G., Oppikofer, T., Hermanns, R., and Böhme, M.: Fare- og risikoklassifisering av ustabile fjellparti NVE, Oslo77-2016, 50, ISBN 978-82-410-1530-4, 2016.
Mamot, P., Weber, S., Schröder, T., and Krautblatter, M.: A temperature- and stress-controlled failure criterion for ice-filled permafrost rock joints, The Cryosphere, 12, 3333–3353, https://doi.org/10.5194/tc-12-3333-2018, 2018.
Mamot, P., Weber, S., Eppinger, S., and Krautblatter, M.: A temperature-dependent mechanical model to assess the stability of degrading permafrost rock slopes, Earth Surf. Dynam., 9, 1125–1151, https://doi.org/10.5194/esurf-9-1125-2021, 2021.
Marmy, A., Rajczak, J., Delaloye, R., Hilbich, C., Hoelzle, M., Kotlarski, S., Lambiel, C., Noetzli, J., Phillips, M., Salzmann, N., Staub, B., and Hauck, C.: Semi-automated calibration method for modelling of mountain permafrost evolution in Switzerland, The Cryosphere, 10, 2693–2719, https://doi.org/10.5194/tc-10-2693-2016, 2016.
McGuire, A. D., Macdonald, R. W., Schuur, E. A. G., Harden, J. W., Kuhry, P., Hayes, D. J., Christensen, T. R., and Heimann, M.: The carbon budget of the northern cryosphere region, Curr. Opin. Env. Sust., 2, 231–236, https://doi.org/10.1016/j.cosust.2010.05.003, 2010.
Mewes, B., Hilbich, C., Delaloye, R., and Hauck, C.: Resolution capacity of geophysical monitoring regarding permafrost degradation induced by hydrological processes, The Cryosphere, 11, 2957–2974, https://doi.org/10.5194/tc-11-2957-2017, 2017.
Mollaret, C., Hilbich, C., Pellet, C., Flores-Orozco, A., Delaloye, R., and Hauck, C.: Mountain permafrost degradation documented through a network of permanent electrical resistivity tomography sites, The Cryosphere, 13, 2557–2578, https://doi.org/10.5194/tc-13-2557-2019, 2019.
Mollaret, C., Wagner, F. M., Hilbich, C., Scapozza, C., and Hauck, C.: Petrophysical joint inversion applied to alpine permafrost field sites to image subsurface ice, water, air and rock contents, Front. Earth Sci., 8, 85, https://doi.org/10.3389/feart.2020.00085, 2020.
Myhra, K. S.: Modelling Permafrost Conditions in Steep Mountain Environments, Faculty of Mathematics and Natural Sciences, University of Oslo, Doktorgradsavhandling, 159, 2016.
Myhra, K. S., Westermann, S., and Etzelmüller, B.: Modelled Distribution and Temporal Evolution of Permafrost in Steep Rock Walls Along a Latitudinal Transect in Norway by CryoGrid 2D, Permafrost Periglac., 28, 172–182, https://doi.org/10.1002/ppp.1884, 2017.
Myhra, K. S., Westermann, S., and Etzelmüller, B.: Modelling conductive heat flow between steep rock walls and talus slopes–thermal processes and geomorphological implications, Front. Earth Sci., 7, 192, https://doi.org/10.3389/feart.2019.00192, 2019.
Obu, J., Westermann, S., Bartsch, A., Berdnikov, N., Christiansen, H. H., Dashtseren, A., Delaloye, R., Elberling, B., Etzelmüller, B., and Kholodov, A.: Northern Hemisphere permafrost map based on TTOP modelling for 2000–2016 at 1 km2 scale, Earth-Sci. Rev., 300–318, https://doi.org/10.1016/j.earscirev.2019.04.023, 2019.
Pellet, C., Hilbich, C., Marmy, A., and Hauck, C.: Soil moisture data for the validation of permafrost models using direct and indirect measurement approaches at three alpine sites, Front. Earth Sci., 3, 91, 2016.
Phillips, M., Wolter, A., Lüthi, R., Amann, F., Kenner, R., and Bühler, Y.: Rock slope failure in a recently deglaciated permafrost rock wall at Piz Kesch (Eastern Swiss Alps), February 2014, Earth Surf. Proc. Land., 42, 426–438, 2017.
Ravanel, L., Allignol, F., Deline, P., Gruber, S., and Ravello, M.: Rock falls in the Mont Blanc Massif in 2007 and 2008, Landslides, 7, 493–501, https://doi.org/10.1007/s10346-010-0206-z, 2010.
Ravanel, L., Magnin, F., and Deline, P.: Impacts of the 2003 and 2015 summer heatwaves on permafrost-affected rock-walls in the Mont Blanc massif, Sci. Total Environ., 609, 132–143, 2017.
Riseborough, D., Shiklomanov, N., Etzelmuller, B., Gruber, S., and Marchenko, S.: Recent advances in permafrost modelling, Permafrost Periglac., 19, 137–156, https://doi.org/10.1002/Ppp.615, 2008.
Saintot, A., Oppikofer, T., Derron, M.-H., and Henderson, I.: Large gravitational rock slope deformation in Romsdalen valley (Western Norway), Revista de la Asociación Geológica Argentina, 69, 354–371, 2012.
Saloranta, T. M.: Simulating snow maps for Norway: description and statistical evaluation of the seNorge snow model, The Cryosphere, 6, 1323–1337, https://doi.org/10.5194/tc-6-1323-2012, 2012.
Schuur, E. A., McGuire, A. D., Schädel, C., Grosse, G., Harden, J., Hayes, D. J., Hugelius, G., Koven, C. D., Kuhry, P., and Lawrence, D. M.: Climate change and the permafrost carbon feedback, Nature, 520, 171–179, https://doi.org/10.1038/nature14338, 2015.
Sen, P., Scala, C., and Cohen, M.: A self-similar model for sedimentary rocks with application to the dielectric constant of fused glass beads, Geophysics, 46, 781–795, 1981.
Slagstad, T., Balling, N., Elvebakk, H., Midttømme, K., Olesen, O., Olsen, L., and Pascal, C.: Heat-flow measurements in Late Palaeoproterozoic to Permian geological provinces in south and central Norway and a new heat-flow map of Fennoscandia and the Norwegian–Greenland Sea, Tectonophysics, 473, 341–361, https://doi.org/10.1016/j.tecto.2009.03.007, 2009.
Svennevig, K., Dahl-Jensen, T., Keiding, M., Merryman Boncori, J. P., Larsen, T. B., Salehi, S., Munck Solgaard, A., and Voss, P. H.: Evolution of events before and after the 17 June 2017 rock avalanche at Karrat Fjord, West Greenland – a multidisciplinary approach to detecting and locating unstable rock slopes in a remote Arctic area, Earth Surf. Dynam., 8, 1021–1038, https://doi.org/10.5194/esurf-8-1021-2020, 2020.
Timur, A.: Velocity of compressional waves in porous media at permafrost temperatures, Geophysics, 33, 584–595, 1968.
Vick, L. M., Böhme, M., Rouyet, L., Bergh, S. G., Corner, G. D., and Lauknes, T. R.: Structurally controlled rock slope deformation in northern Norway, Landslides, 17, 1745–1776, https://doi.org/10.1007/s10346-020-01421-7, 2020.
Voigtländer, A., Leith, K., and Krautblatter, M.: Subcritical crack growth and progressive failure in Carrara marble under wet and dry conditions, J. Geophys. Res.-Sol. Ea., 123, 3780–3798, 2018.
Weber, S., Beutel, J., Faillettaz, J., Hasler, A., Krautblatter, M., and Vieli, A.: Quantifying irreversible movement in steep, fractured bedrock permafrost on Matterhorn (CH), The Cryosphere, 11, 567–583, https://doi.org/10.5194/tc-11-567-2017, 2017.
Westermann, S., Schuler, T. V., Gisnås, K., and Etzelmüller, B.: Transient thermal modeling of permafrost conditions in Southern Norway, The Cryosphere, 7, 719–739, https://doi.org/10.5194/tc-7-719-2013, 2013.
Williams, P. J. and Smith, M. W.: The Frozen Earth: Fundamentals of geocryology, Cambridge, Cambridge University press, 300 pp., https://doi.org/10.1017/CBO9780511564437, 1989.
Wirz, V., Beutel, J., Gruber, S., Gubler, S., and Purves, R. S.: Estimating velocity from noisy GPS data for investigating the temporal variability of slope movements, Nat. Hazards Earth Syst. Sci., 14, 2503–2520, https://doi.org/10.5194/nhess-14-2503-2014, 2014.
- Abstract
- Introduction
- Setting
- Methods and data processing
- Results
- Discussion
- Conclusions
- Appendix A: Thermal modelling
- Appendix B: 3D visualisation of ERT profiles
- Appendix C: Background information for the 4PM modelling
- Code and data availability
- Author contributions
- Competing interests
- Disclaimer
- Acknowledgements
- Financial support
- Review statement
- References
The requested paper has a corresponding corrigendum published. Please read the corrigendum first before downloading the article.
- Article
(38455 KB) - Full-text XML
- Abstract
- Introduction
- Setting
- Methods and data processing
- Results
- Discussion
- Conclusions
- Appendix A: Thermal modelling
- Appendix B: 3D visualisation of ERT profiles
- Appendix C: Background information for the 4PM modelling
- Code and data availability
- Author contributions
- Competing interests
- Disclaimer
- Acknowledgements
- Financial support
- Review statement
- References