the Creative Commons Attribution 4.0 License.
the Creative Commons Attribution 4.0 License.
 | 02 Nov 2023
On the use of packing models for the prediction of fluvial sediment porosity
Christoph Rettinger
Mina Tabesh
Ulrich Rüde
Stefan Vollmer
Roy M. Frings
Obtaining accurate porosity information of fluvial sediment deposits is helpful and desirable for many tasks of river engineers. Besides direct measurements of single samples and empirical formulas specialized for specific cases, packing models promise efficient predictions due to their theoretical and extensible foundation. The objective of this work is thus to investigate the usability of three such models in order to obtain a suitable porosity prediction method for the challenging case of fluvial sediment packing. There, the complexity originates from wide continuous size distributions, from silt to gravel, and different grain shapes. We use data obtained from extensive numerical packing simulations to determine the required model parameters and to verify the models' accuracy for moderate size ratios. This study reveals systematic deficits in one of the models, which can be attributed to the absence of a built-in mixture packing model. By combining these findings with data from laboratory measurements and extending the model to include cohesive effects, we exemplify that reasonable porosity predictions can be obtained with the Compressible Packing Model for the Rhine river in Germany. Through an additional comparison with data from French rivers, guidelines for a successful prediction in cases with limited prior knowledge of the model parameters are developed. Future model enhancements of the packing models directly, and by incorporating more effects that are known to influence porosity, are expected to improve the predictive performance.
- Article
(3961 KB) - Full-text XML
- BibTeX
- EndNote


Porosity is one of the key structural properties of sediment deposits, as it determines the hydraulic conductivity of the soil (Fraser, 1935; El-Husseiny, 2021), is linked to the problem of land subsidence (Zhao et al., 2019), and is thus of high relevance in the environmental sciences. In the domain of fluvial sediment, porosity relates bed level changes to the amount of transported material (Coleman and Nikora, 2009), affects the mobility of the riverbed (Rettinger et al., 2022a), and defines the quality of habitats for aquatic organisms (Noack et al., 2017). River-related research thus requires its accurate and efficient assessment where it is known to vary along a river's length and width (Frings et al., 2011; Tabesh et al., 2022). This variation originates from spatial changes in factors that influence porosity, often quite significantly (Fraser, 1935; Frings et al., 2011). Examples of such factors are the sediment grain size distribution (Frings et al., 2011; Tabesh et al., 2022), the grain form and shape (Cho et al., 2006; Chang et al., 2018; Zhang et al., 2020; Rettinger et al., 2022b), the deposition conditions leading to loose or dense packing (An et al., 2008; Chang et al., 2018), and the type of micromechanical grain interaction like friction and cohesive forces (Yu et al., 2003; An et al., 2008; Zou et al., 2011; Liu et al., 2017; Zhang et al., 2020).
Porosity of sediment packing can be determined in various ways, which all come with individual benefits and challenges. The straightforward way is to carry out field or laboratory measurements for which different techniques have been developed (Frings et al., 2011; Seitz et al., 2018; Tabesh et al., 2019). While field studies are extremely laborious and might suffer from measurement uncertainties, laboratory studies might additionally influence porosity through the confined setting and the packing process (Zou and Yu, 1995). Numerically simulating the packing process is a more recent approach and offers the advantage of having full control over all parameters (Liang et al., 2015; Schruff et al., 2018; Seelen et al., 2018; Zhang et al., 2020), thus allowing for systematic studies of the different porosity controlling factors (Suhr and Six, 2020; Rettinger et al., 2022b). What all of these techniques have in common is that they provide direct evaluations of porosity for specific cases, making them a valuable source for porosity data sets. However, they are generally too costly to be applied for assessing porosity on a larger scale and require sediment samples for field or laboratory studies or precise knowledge about their properties to be used in numerical simulations.
On the other hand, empirical porosity predictors can be an effective alternative. They commonly rely on statistical descriptors of the grain properties, like the mean grain size (Carling and Reader, 1982; Wu and Wang, 2006), its standard deviation (Wooster et al., 2008), or the percentage of fine grains (Frings et al., 2011). These predictors are typically given by a concise mathematical formula and, by construction, require only very limited information about the packed sediment, making them easily applicable. However, as they were obtained through fitting to a specific data set, their accuracy for other cases is low (Frings et al., 2011), and there is no systematic way to extend them to other porosity-modifying factors. Thus, a more theoretical, model-based description of packing properties and their effect on porosity is desirable in order to obtain a generally applicable and extensible predictor.
Such a framework is offered by so-called packing, or mixture, models. Pioneered by Furnas (1931) and Westman (1936), the general idea of these models is to regard the system as one consisting of a finite number of separate grain classes with different properties. The most important property is the so-called initial porosity of each class, which is the porosity that would be obtained for a homogeneous packing, i.e., consisting only of grains from this specific class. Then, the pair-wise interaction among these classes and its effect on porosity is modeled and, finally, adequately combined to obtain an estimation of the system's porosity. While some of these models have been applied to packing of distinct grain shapes, like sphere–cylinder systems (Yu et al., 1996), the majority focuses on the grain size to distinguish the classes (Jones et al., 2002; Kwan et al., 2013; Liu et al., 2020). Most of them have been developed in the context of industrial and engineering applications, where usually only a small number of well-defined and well-separated size classes are mixed together, resulting in a large number of models for binary (Kamann et al., 2007; Zhang et al., 2011; Chang and Deng, 2017; Roquier, 2017; Wu and Li, 2017) and ternary packing (Kwan et al., 2015; Perera et al., 2022). Commonly, they consider the filling effect, meaning that fine grains fill the pores between the tightly packed coarse grains, and the occupation effect, meaning that some coarse grains completely occupy the space in place of tightly packed fine grains (see Fig. 1 for a binary packing). In both cases, the main component of the packing, i.e., coarse for filling and fine for occupying, is essentially left unchanged, and the presence of the second component decreases porosity proportionally to its volume fraction. For cases between these two idealized limits and more generally, however, there is a mutual interaction between the different components of the packing. As a consequence, the packing structure of one component is altered by the presence of the other. There, the models differ with respect to the type of these interactions that are included and how these are taken into account, where typically each additional effect introduces new model parameters. Examples are the loosening effect, where the smaller grains prevent a direct contact and thus a dense packing of the larger grains, and the wall effect, where the packing of the small grains in the vicinity of a larger one is disrupted (Kwan et al., 2013). Both are visualized in Fig. 1b. In comparative studies for binary mixtures of sand (Liu et al., 2020) and ternary mixtures of cement (Jones et al., 2002), the general applicability of these models has been demonstrated, with minor differences in specific cases.
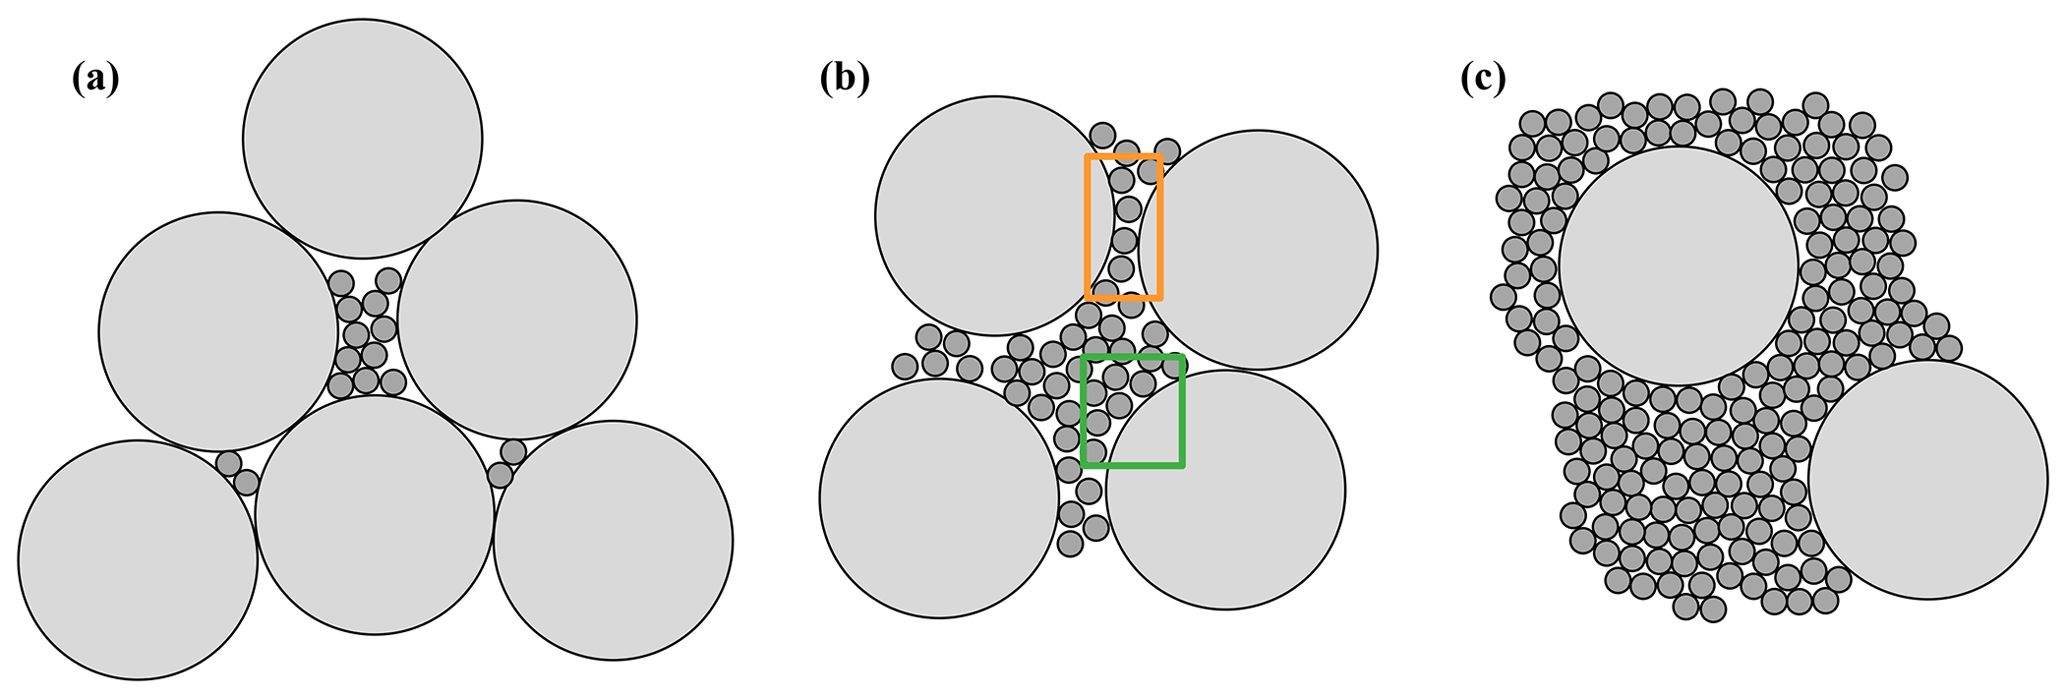
Figure 1Packing configurations considered and modeled by packing models that have been exemplified for a binary packing. (a) Filling. (b) Interacting, as illustrated with loosening (orange box) and wall (green box) effects. (c) Occupation.
For fluvial sediment, an immediate challenge arises due to the large grain size range, spanning from silt, over sand, to gravel, and there is thus 4 orders of magnitude between the diameter of the largest and the smallest grains. The naturally occurring grain size distributions cover the whole aforementioned range, in stark contrast to strictly binary or ternary packing for which these packing models have been primarily designed and used. Only a small subset of the abovementioned packing models was developed for such multi-sized cases (Yu and Standish, 1991; De Larrard, 1999; Chang and Deng, 2018; Liu et al., 2019), and often, they were verified only for a limited number of size classes, which are different to those found in rivers. Additionally, size-dependent effects like cohesion become relevant once small grains like fine sand and silt are involved, which again influence the packing (Yu et al., 2003; Zou et al., 2011). Furthermore, the grain shape varies from river to river (Oakey et al., 2005; Liang et al., 2015; Rettinger et al., 2022b), in contrast to the usually rather similar and often simpler shapes encountered in industrial applications. The shape is known to strongly influence the interaction among grains, which must be accounted for in the model (Yu et al., 1996). Frings et al. (2011) demonstrated that the model proposed by Yu and Standish (1991) is generally able to produce reasonable predictions of porosity for fluvial packing, but the model parameters and their influence on the results remained difficult to determine. All in all, the applicability and accuracy of such packing models, their adequate parameterization, and a guideline on which one to use for predicting porosity of fluvial sediment deposits is currently missing.
The main objective of the present work is thus to fill this gap by providing a systematic and comparative study of multi-sized packing models in order to derive a suitable porosity predictor. The models are parameterized with data from laboratory experiments and numerical simulations with fluvial sediment and subsequently verified for different grain size distributions. In line with this idea, the paper is structured as follows: Sect. 2 reviews different packing models proposed in literature for the packing of a large number of size classes. Then, the model interaction parameters are calibrated in Sect. 3, with the help of numerical simulations of binary packing. In Sect. 4, these models are validated for sand–gravel mixtures that were again obtained from numerical simulations to check their accuracy for multi-sized packing with a narrow size range. Section 5 extends the validation to the full size range of fluvial sediment originating from two different rivers, necessitating a model extension for cohesion and comparing to laboratory measurements. Based on these results, Sect. 6 provides a detailed discussion of the models' applicability to fluvial sediment packing. Section 7 summarizes the main findings and outlines future directions.
This section presents several packing models that have been proposed for multi-size packing. For all of them, we provide a concise but complete summary, followed by a direct comparison of the models.
2.1 Definitions
Depending on the scientific community, the packing of solids is commonly described by different quantities like porosity, the solid packing fraction, the void ratio, or the specific volume. As a consequence, the available packing models are formulated differently. However, all of them can be directly converted to provide an estimate for porosity, which is the focus of this work.
Considering a system of total volume V that contains solid grains of volume Vs and pore (or void) volume Vp, such that , then the quantities mentioned above are given as
Generally, the solid volume contains grains of various sizes and shapes, as commonly encountered in fluvial sediment deposits. Analogous to sieving the grains with a hierarchy of sieves of mesh sizes si, we assume that the grains can be partitioned into N classes, based on their size. The average class size di is calculated as the geometric mean of the respective sieve interval [si si+1], i.e.,
This measure, like the sieving procedure, corresponds to a discretization of the continuous grain size distribution and is necessary as the here-considered packing models can only cope with discrete classes of a given size. The N size classes are ordered, such that . The size ratio of two size classes is defined as
such that and rij=rji. The subscripts i, j, and later on also k are used to denote quantities of distinct size classes.
The partial volume fraction of size class i is obtained as
such that . Since we assume a constant material density for all grains, the yi values correspond to the mass fractions obtained by the sieving procedure. Additionally, we further assume a known porosity n0,i, which would be observed for a system containing only grains of a single size class i, i.e., a uniform packing, under the same packing conditions as the packing to be investigated. In the context of packing models, n0,i is referred to as initial porosity.
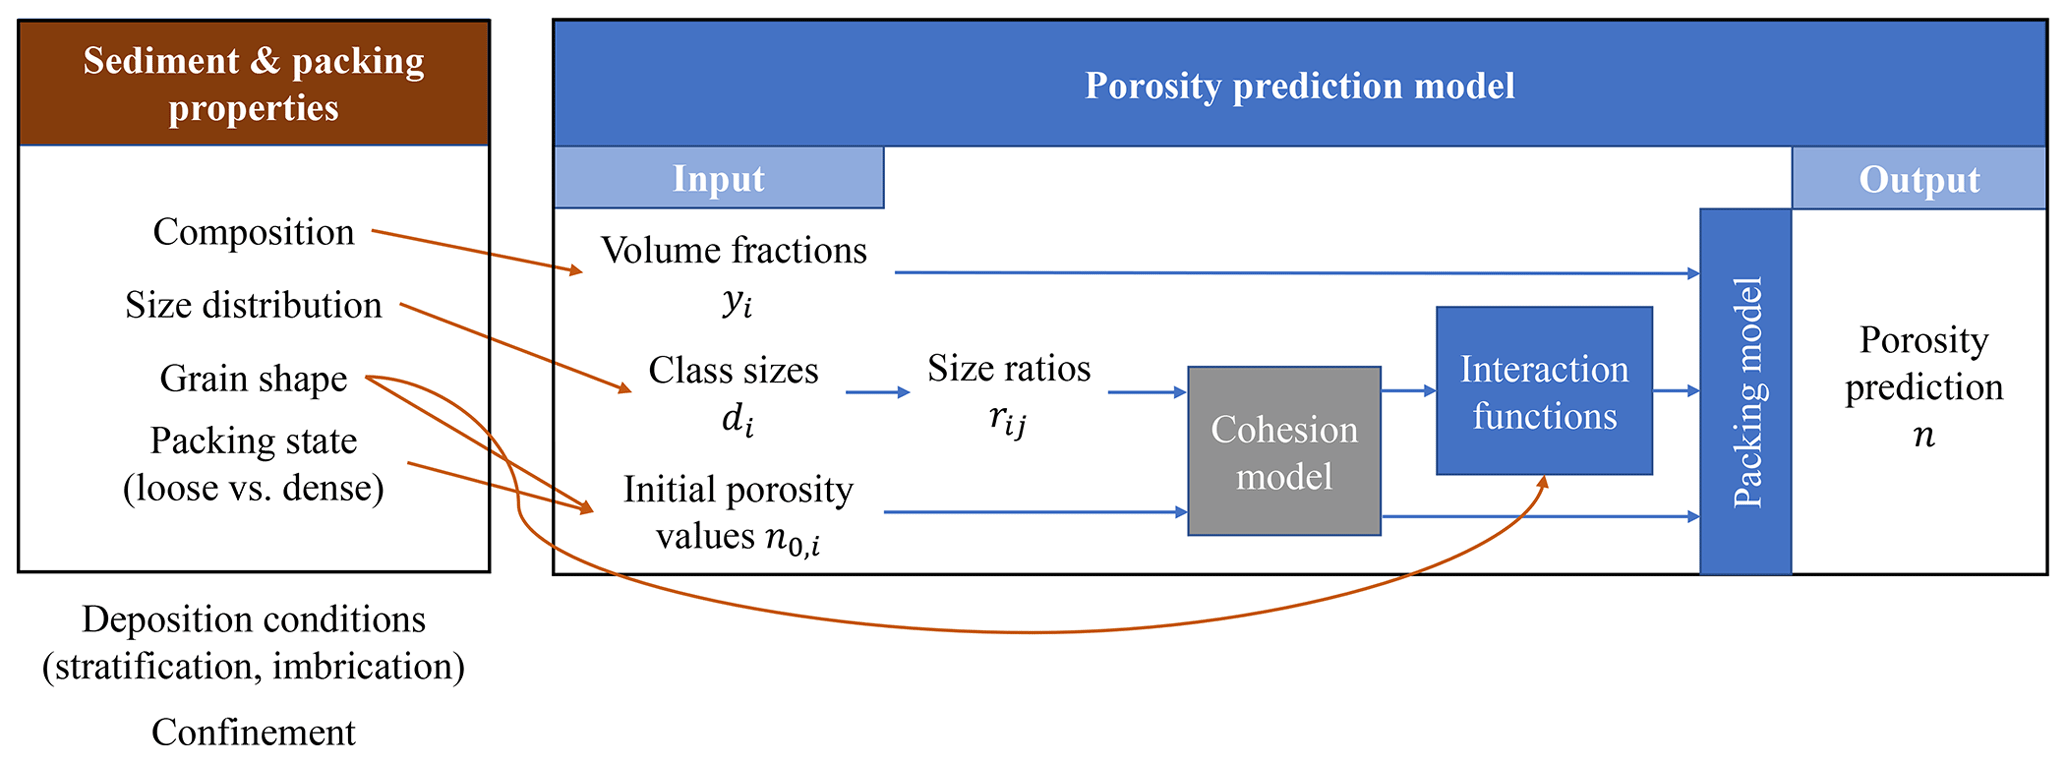
Figure 2Sketch of a packing model and its parameterization. The brown arrows denote the influence of a property on one of the model components, as considered in the present work. Blue arrows indicate the flow of data within the model.
2.2 General overview
We provide a sketch of the input and output of a packing model in Fig. 2, where the peculiarities of its application to fluvial sediment packing are also denoted.
The previously defined quantities and n0,i are the input for all packing models considered here. Generally, the idea of such a packing model is to assume that one or several size classes form the dominant component, and the others are either fillers or embedded into this dominant size class. Differences between the models mainly originate from the way in which and how the porosity-modifying effects of these other size classes are modeled. These formulations primarily use the size ratios between the size classes and rely on model-specific interaction functions. The latter contain parameters that determine the interaction among size classes, which is, e.g., influenced by the grain shape.
Since it is not known a priori which of the N size classes is the dominant one, all possibilities are considered. In the last step, the one yielding the densest packing is taken, which then produces the final porosity prediction as the model output.
For very fine grains typically encountered in fluvial sediment deposits, porosity is affected by cohesive effects which then have to be included in the model. This extension is discussed in Sect. 5.1.
Next, we present three different packing models. We stick mostly to the original formulation and notation, with slight adaptions for clarity and consistency. While an in-depth discussion of the derivation and specifics of each model is beyond the scope of our paper and can be found in the original work, we mention the resulting model and mention the underlying assumptions.
For all models, the simplified binary versions are given in Appendix B. Additionally, we provide a Python implementation, together with exemplary cases (Rettinger and Frings, 2022).
2.3 Linear Mixture Packing Model
The Linear Mixture Packing Model (LMPM) was originally proposed by Yu and Standish (1991) and combines a Linear Packing Model (LPM) with a Mixture Model (MM). Later, the packing model was slightly modified by Yu et al. (1996) to account for different initial porosities of the individual classes, as, e.g., encountered for deposits with differently shaped grains. We here present the modified variant, which also simplified some of the involved parameters. The model is formulated in terms of the specific volume, where νi denotes the one of a uniform packing of a single size class, i.e.,
Considering the size class i, the general idea is to separate all size classes into three categories, depending on their relative sizes. Then, the partial specific volume can be obtained as
with the interaction functions aLMPM (Eq. A3) and bLMPM (Eq. A4). The second term represents the controlling component, containing not only the class i but also all classes [L,M], which interact according to the mixture packing model
where , and cLMPM and dLMPM are the quadratic and cubic mixture parameters, respectively, as given by Eqs. (A5) and (A6). Thus, in total, the model requires four parameters.
By introducing the critical size ratio of entrance rc, the classes L and M are the minimum and maximum ones, with sizes between and di rc (see Eqs. A1 and A2). If , then the LMPM reduces to the Linear Packing Model by Yu et al. (1996), whereas the Mixture Model is recovered for L=1 and M=N. Based on geometric arguments for tetrahedral sphere packing, rc=0.154 was suggested (Yu and Standish, 1991). A graphical representation of the model is given in Fig. 3a.
Finally, the specific volume of the packing is obtained as
By introducing more parameters, the LPM has recently been extended to take into account additional interaction mechanisms, like the wedging effect (Kwan et al., 2013, 2015); however, this applies on only for binary and ternary packing. Furthermore, the combination with a mixture model has recently been revised (Chang and Deng, 2017, 2018), which led to a system of nonlinear equations that needs to be solved. For simplicity, we will here make use of the model presented above.
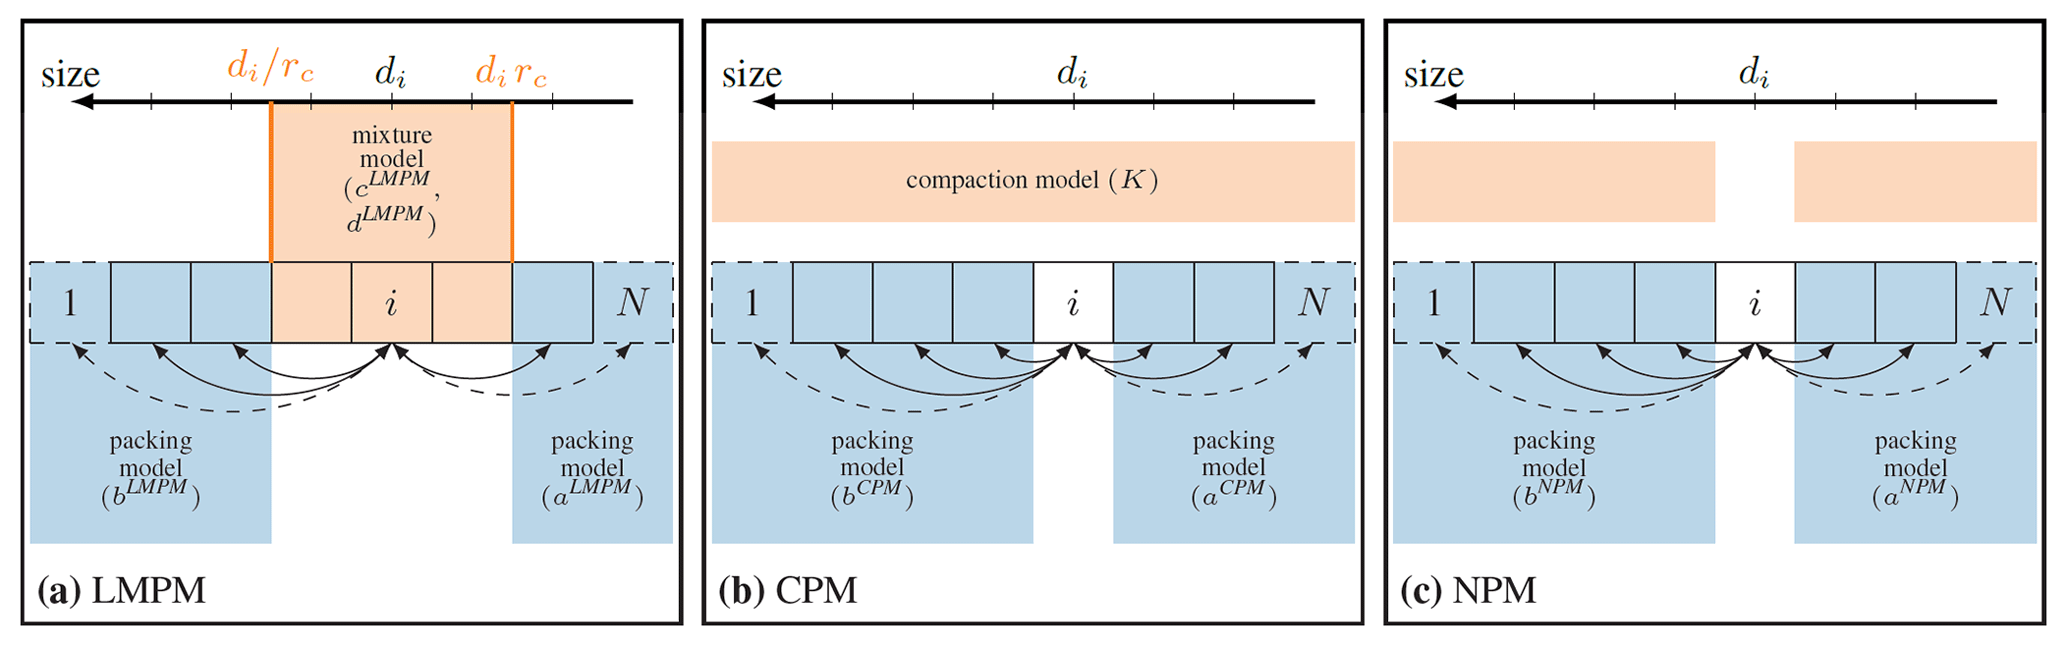
Figure 3Graphical representation of the packing models considered in this study (in Sect. 2.3 to 2.5) and their modeled interactions among the discrete size classes 1 to N (depicted as boxes) via the given interaction functions. Blue shading indicates pair-wise interaction, while orange shading implies multi-component interaction among the contained size classes.
2.4 Compressible Packing Model
The Compressible Packing Model (CPM) was presented by De Larrard (1999) in the context of concrete mixing. It is a three-parameter model that is formulated in terms of solid packing densities and first constructs an ideal packing with maximal packing density. Then, the effect of the imperfect packing process is considered by a compaction index, which determines the actual packing density of the deposit.
The ideal case is obtained by using another LPM, similar to the LPM above, and assuming a single dominant size class i for which the solid packing fraction is obtained as
where βi and βj are the so-called ideal, i.e., maximum, packing densities of classes i and j, respectively, and aCPM and bCPM are the model interaction functions (see Eqs. A7 and A8).
The ideal packing density of the complete packing would then be obtained as
The actual packing density ϕ is implicitly obtained as the solution of
The compaction index models the packing process and state, since the actual packing is generally not ideal and exhibits less densely packed configurations. In the literature, suggested values for K that vary from 4 for a loose packing (De Larrard, 1999) to 12.5 for a compressed one (Jones et al., 2002) can be found, while K→∞ would recover the ideal packing density γ. By construction, there is only a single ϕ that satisfies this equation in the range , which we here determine via a bisection line search after reformulation into a root-finding problem. Figure 3b visualizes this model.
To be consistent with our notion of n0,i, which is the actually observed porosity for a uniform packing, we apply Eq. (14) for a single size class and obtain
The CPM has been extended, based on geometrical considerations for the loosening effect by an additional parameter (Roquier, 2017); however, this is again only for binary packing. Therefore, we will apply the original CPM.
2.5 Nonlinear Packing Model
Recently, Liu et al. (2019) developed the Nonlinear Packing Model (NPM) in order to improve upon deficits of the LPM for binary mixtures. It is formulated based on void ratios, where ϵi is the void ratio of a single size class i, i.e.,
Assuming i to be the single, dominant component, the corresponding void ratio is then modeled as1
The two interaction functions aNPM and bNPM are given in Eqs. (A9) and (A10).
The void ratio of the packing is then obtained as
The model is sketched in Fig. 3c.
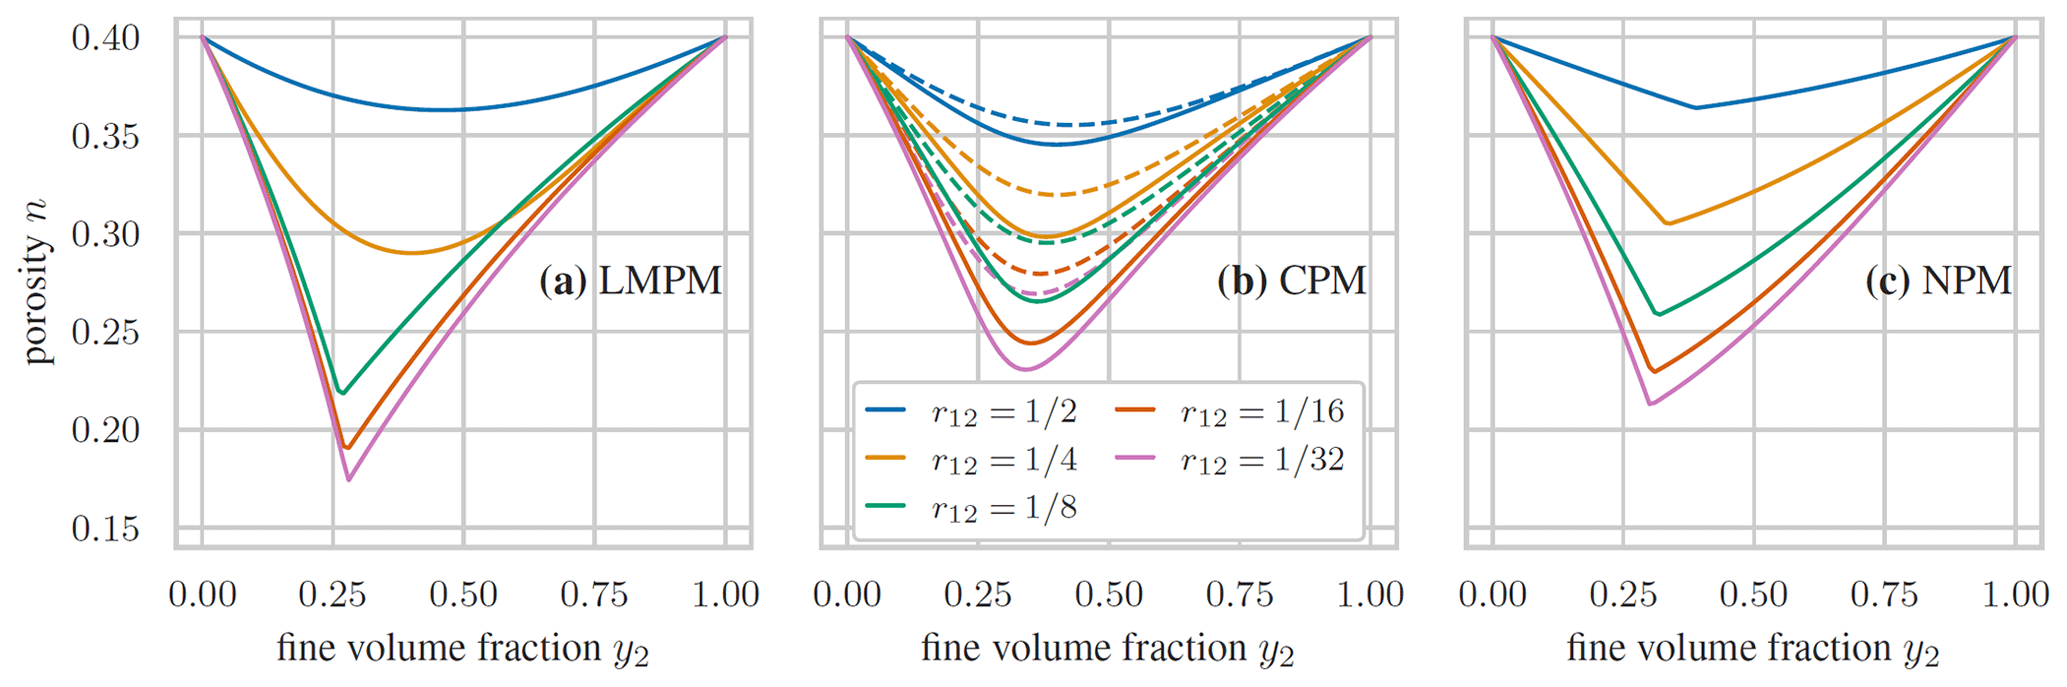
Figure 4Comparison of the three different packing models for binary cases with . (a) LMPM. (b) CPM, with K=4 (dashed) and K=9 (solid). (c) NPM.
2.6 Comparison
While an in-depth comparison of the models and their performance for the specific case of fluvial sediment will be given in the upcoming sections, it is worthwhile to compare them more generally for the parameterization commonly applied in the literature. A direct comparison in terms of predicted porosity for binary packing with varying volume fractions and size ratios is shown in Fig. 4, using the parameterization as stated in Appendix A. For the two extreme cases, y2=0 and y2=1, where only a single size class is present in the packing, and all models yield the same porosity, as here imposed through . In between, the differences between the three models are directly visible in the general shape of the curves and the obtained porosity values. Considering a single model, the different predictions for changing size ratios originate solely from the fact that the interaction parameters are modified as a function of the size ratio. Specifically, for the LMPM, the switching between the two intrinsic models, packing and mixing, is apparent in the distinct shape of the curve once the size ratio is below 0.154, with the value of rc. For the CPM, the influence of the compaction index K can be seen in cases where smaller porosity values are obtained for larger values.
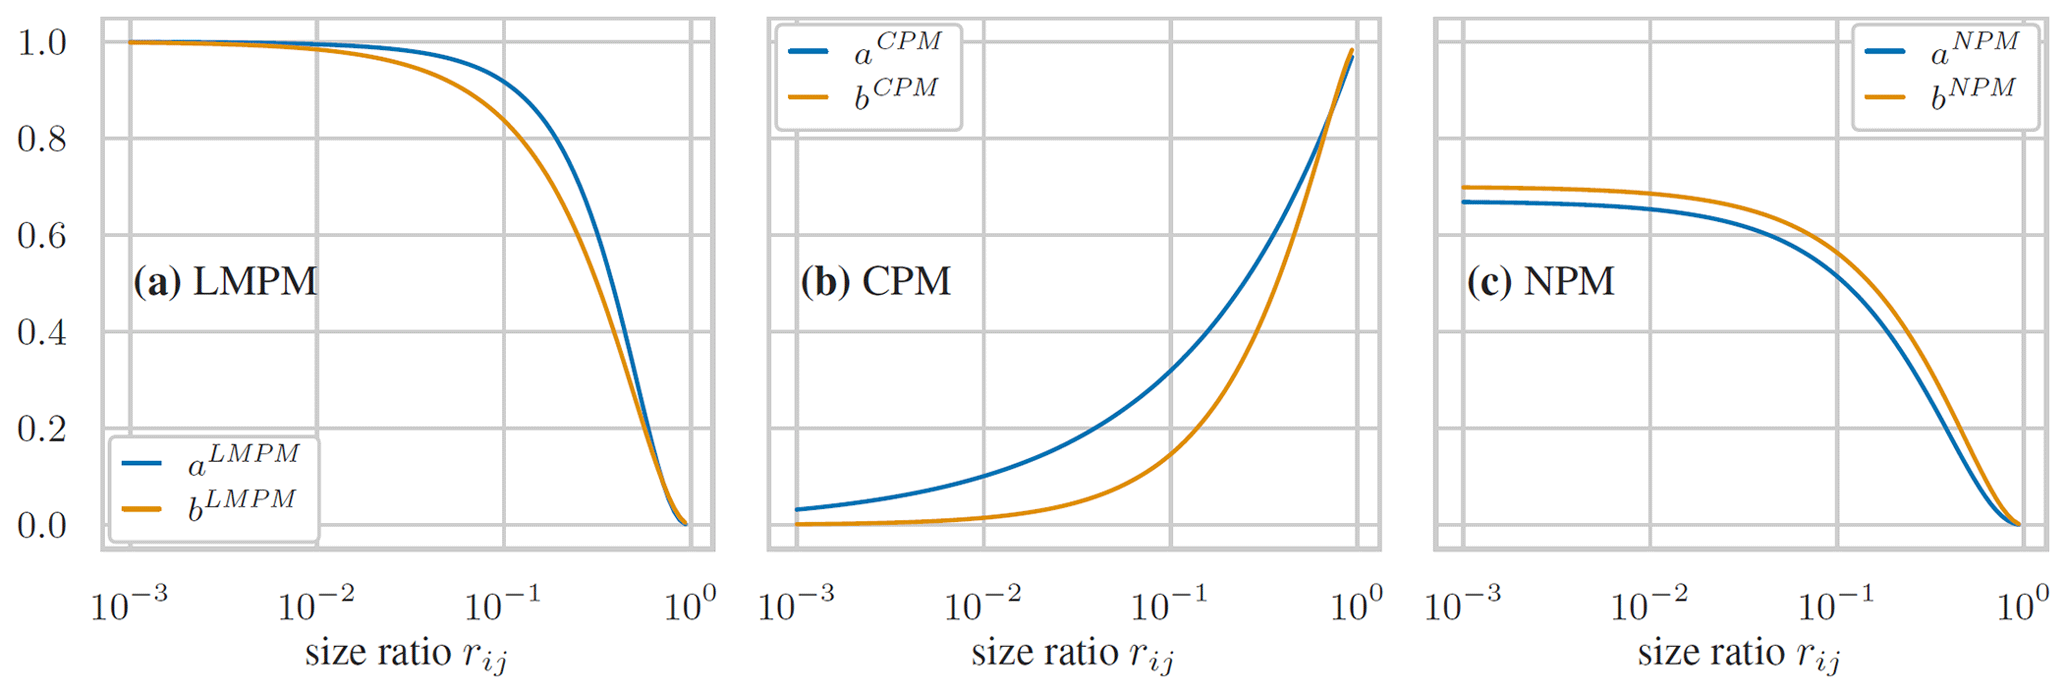
Figure 5Comparison of interaction functions proposed in the literature for spherical grains for the three different packing models. (a) LMPM, (b) CPM, and (c) NPM.
Apart from the general model itself, the differences originate from the applied interaction functions. All models feature the parameters a and b that were introduced to express similar interactions between the size classes as a function of rij. However, those interaction functions should usually be seen in the context of the model itself and thus take different forms and values, which does not permit a comparative interpretation of whether or not certain interactions are taken into account. These interaction functions are shown in Fig. 5. While the functions for the LMPM and the NPM reach their maximum for the case rij→0 and are 0 for rij=1, it is the other way around for the CPM. Due to the introduction of additional prefactors in Eqs. (A9) and (A10), the maximum of the NPM is below 1, while this is the explicitly enforced value in the LMPM and CPM. Still, there is a general similarity between the models which have inspired different modifications of the functional form of these interaction parameters (Kwan et al., 2013; Chan and Kwan, 2014; Knop and Peled, 2016; Chang and Deng, 2017; Roquier, 2017). Furthermore, as noticed by several authors, the interaction functions usually depend on the shape of the grains (Kwan et al., 2013; Liu et al., 2019). Consequently, the coefficients of these functions have to be calibrated for a specific case in order to yield accurate predictions of the packing porosity. This calibration is carried out next for our specific case of fluvial sediment.
In this section, the binary packing of sedimentary grains was simulated, and their porosity was evaluated in order to obtain the interaction parameters required for the packing models presented in Sect. 2 via function fitting.
3.1 Simulation setup
For this study, we made use of the numerical method, the simulation setup, and the evaluation approach that had been validated extensively in a similar recent study by Rettinger et al. (2022b) and contained in the waLBerla simulation framework (Bauer et al., 2021). Here, for brevity, we just summarize the key aspects and specifics of the simulation setup and refer to the original work for an in-depth discussion of all parts.
The packing was simulated in a horizontally periodic domain sized 0.25 m ×0.25 m by generating and dropping 25 kg of grains onto the bottom plane. All grains had a density of ρp=2650 kg m−3. We used a sieve-size-based definition of the grain size, given as , with the short (S) and intermediate (I) axis obtained from the grain shape. For each grain, the size was chosen from the complete interval of the sieve mesh size corresponding to the respective size class, assuming a uniform distribution within this interval. Following the previous findings (Rettinger et al., 2022b), we also assumed that the shape of all grains is similar and independent of the actual size, such that there are no shape differences between size classes. Thus, each grain shape was randomly sampled from a set of meshes (Rettinger et al., 2022c) obtained by computer tomography (CT) scans of actual gravel-sized sediment from the Rhine river in Germany. The form analysis by Rettinger et al. (2022b) revealed an approximate normal distribution for flatness and elongation, with a mean value of 0.647 and standard deviations of 0.175 and 0.682 and 0.139, respectively, with no significant correlation between these two form factors. During the grain generation phase of the simulation that continued for 12 s, we applied a slight horizontal shaking of the whole domain to consolidate the packing. Afterward, a force-based damping, similar to Zhao et al. (2017), was applied until all grains had settled. Porosity was determined from the bulk region of the resulting packing, thus excluding possible finite size effects due to the bottom wall and top surface. This evaluation was achieved by first assessing the horizontally averaged porosity profile as a function of the packing height, based on the available grain positions and their size information, and then computing the average of this profile over the height interval of the bulk region.
Table 1Sieve mesh sizes and correspondingly considered mean sizes di.

The binary packing was here generated for grains with sizes between 2.8 and 31.5 mm. The extent of the size classes and their mean sizes, according to Eq. (5), are given in Table 1. The packing was composed of a mixture of the coarse size class and one of the others, which varies the size ratio, and applying nominal mass fractions and . Due to the random sampling in the generation routine, the actually generated mass fractions might vary. Three examples are visualized in Fig. 6. Each of these simulations was typically run on 100–1824 compute cores for several hours, depending on the number of grains.
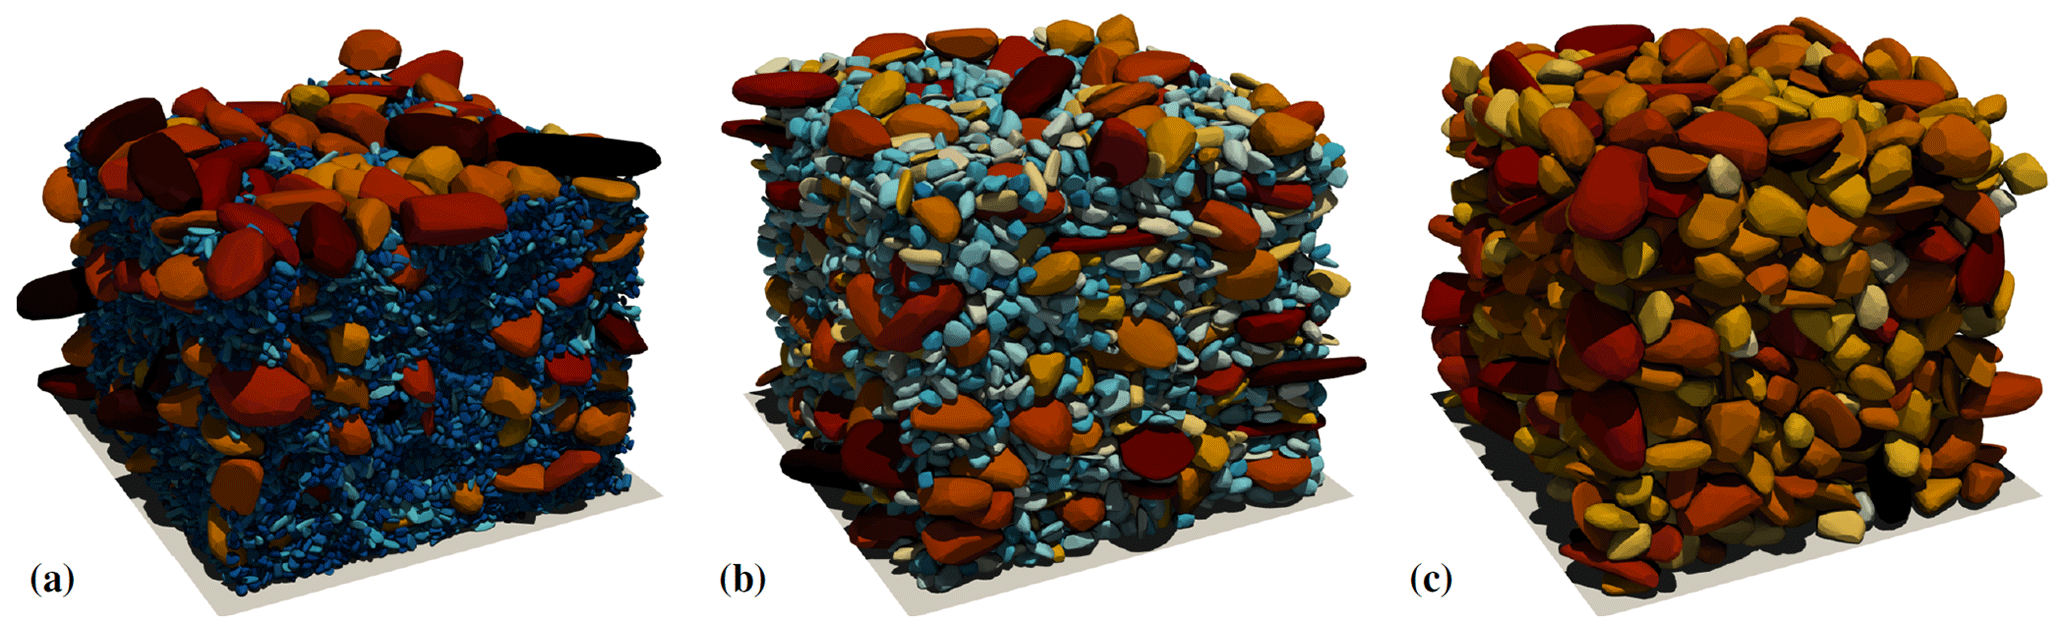
Figure 6Visualization of three different binary packing for the case , with d1=26.56 mm, and (a) d2=4.73 mm, with 49 788 grains. (b) d2=9.47 mm, with 7 625 grains. (c) d2=18.93 mm, with 1190 grains. The color depicts the size on a logarithmic scale.
3.2 Evaluation
For gravel-sized sediment with non-cohesive interactions, the actual grain size of uniform packing should not influence porosity (Frings et al., 2011). Thus, the initial porosity values n0,i were assumed to be constant for all size classes and taken as the average of the porosity values for the uniform cases from the simulations. Here, this resulted in for all size classes i. This value is slightly less than the typically used value of 0.36 for random sphere packing, which can be attributed to the non-spherical sediment shape (Rettinger et al., 2022b).
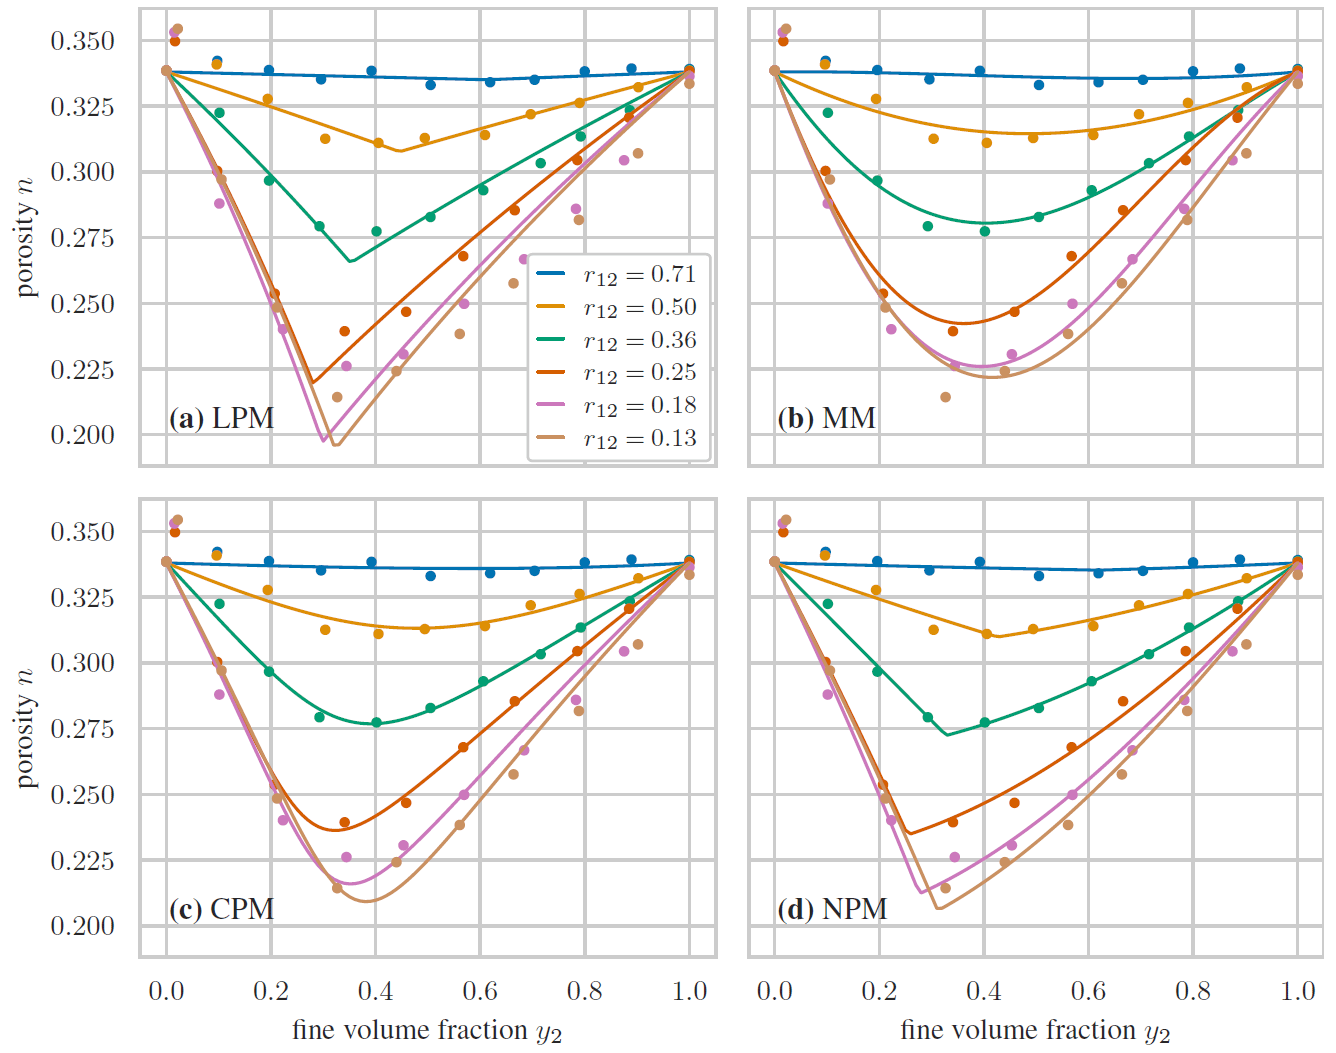
Figure 7Comparison of different model predictions (lines) for the simulated binary setups with Rhine sediment (markers). (a) LPM (R2=0.95; RMSE =0.008). (b) MM (R2=0.97; RMSE =0.007). (c) CPM (R2=0.97; RMSE =0.006). (d) NPM (R2=0.98; RMSE =0.006).
Then, for each of the combinations of two different size classes, the binary variants of the packing models, as given in Appendix B, were directly fitted to the resulting curves as a function of the mass fraction in order to determine the two free parameters. This function fitting was carried out via the curve_fit functionality provided by the SciPy Python package. Here, we consider the two components of the LMPM, namely LPM and MM, separately, as they are essentially two distinct models with separate model parameters. For the CPM, the only three-parameter model, a compaction index of K=9, was used as suggested for vibrated packing (De Larrard, 1999). The result for the different models is shown in Fig. 7, where the overall R2 values and root mean square errors (RMSEs) are also given. All of those individually calibrated models were able to yield accurate predictions for the binary cases considered here, with slightly better results for CPM and NPM.
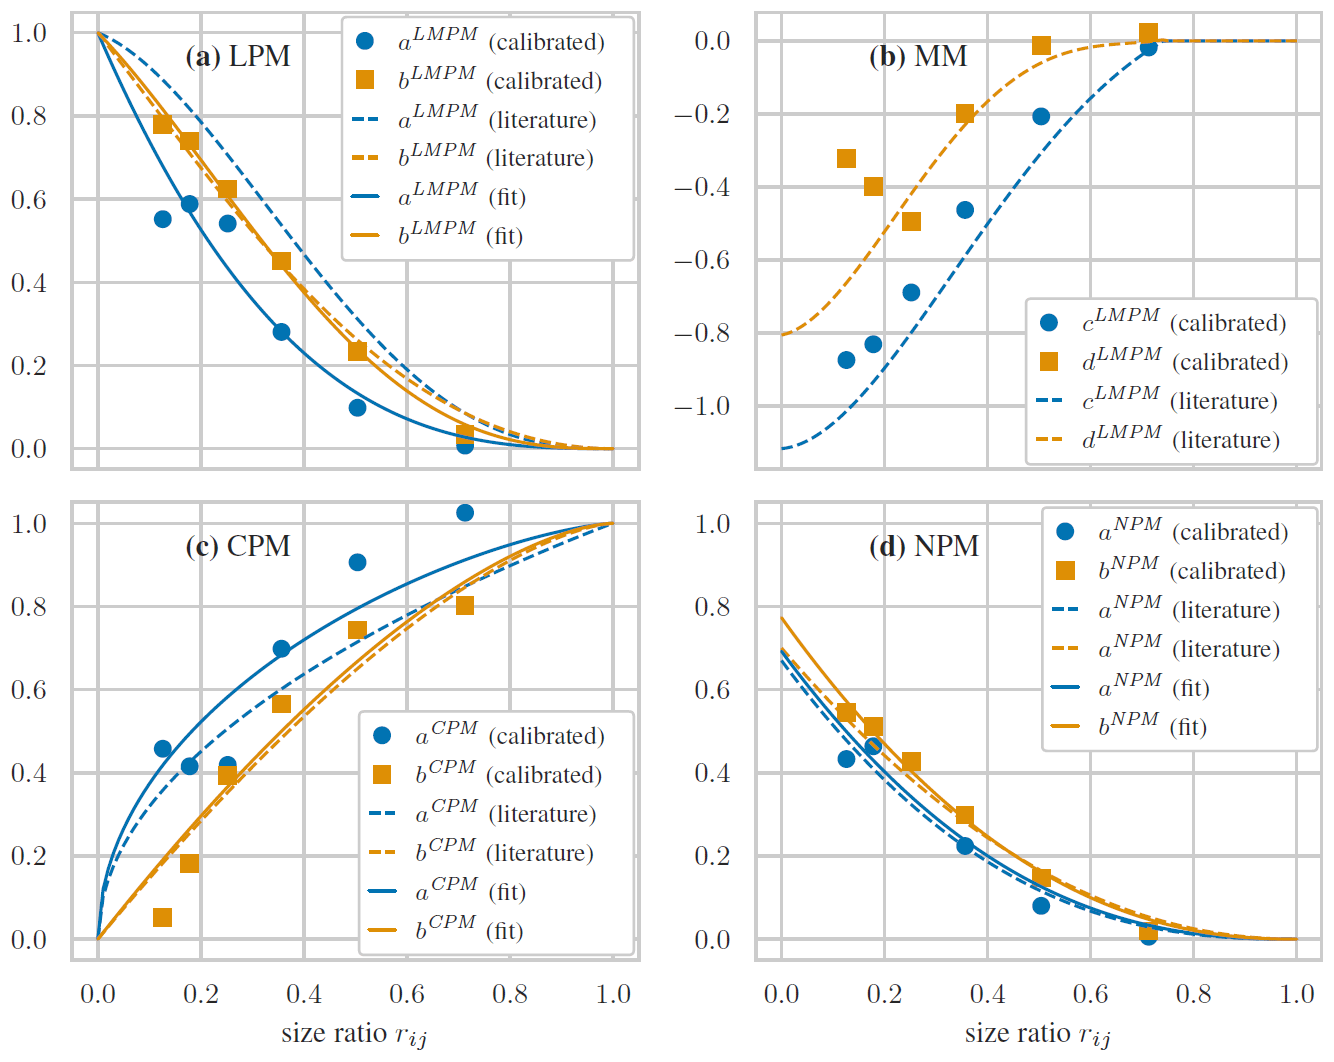
Figure 8Interaction parameters of the different prediction models for the simulated binary setups with Rhine sediment. (a) LPM, (b) MM, (c) CPM, and (d) NPM.
The obtained interaction parameters for each model are shown in Fig. 8 as a function of the size ratio alongside the interaction function, which is parameterized as proposed in the literature (see Appendix A). While in some cases, e.g., NPM, a good agreement between both could be seen, larger deviations were generally observed, e.g., for LPM. These differences are expected, as the majority of the suggested parameterizations were obtained for spherical grains, whereas the interaction depends on the shape. Therefore, we fitted the individual interaction functions with the help of their coefficients to our obtained interaction parameters, as suggested by others (Kwan et al., 2015; Liu et al., 2019). The resulting fitted interaction functions are also shown in Fig. 8, and the corresponding coefficients are reported in Table 2. For LPM and NPM, the agreement between the individually obtained parameters and the fitted functions is overall very good. For the CPM, however, the functional form itself, with only one coefficient, seems to be insufficient to accurately capture the actual trend, which would call for an in-depth investigation and an improvement of the model for binary packing. For the MM, we refrained from fitting the interaction function, since the proposed functions in Eqs. (A5) and (A6) contain too many coefficients that would promote overfitting, and the additional dependency on porosity would require much more data. Still, the original functions exhibited a reasonable agreement with the found parameters. When combining the findings for the individual model calibration and the fitting of the interaction functions, we find that the NPM works best overall for the case considered here.
This step finalized the calibration of the interaction functions for all models, which we kept, as here determined, for the remainder of this work.
Table 2Interaction function and fitted coefficients, as shown in Fig. 8.
This section applies the packing models with just the calibrated interaction functions for continuous size distributions that contain coarse sand to gravel. The reference results were again obtained by means of numerical simulations. The purpose of this study is the validation of the packing models, given conditions comparable to the ones used in their calibration in Sect. 3.
4.1 Simulation setup
The packing was simulated and evaluated with the same method as for the binary packing in Sect. 3. In this way, it is ensured that all process-related factors that possibly influence the packing behavior are also similar to the setup used for the calibration. This controlled environment thus effectively removes sources of uncertainties usually present in experiments and allows for a direct analysis of the predictive power of the packing models.
Packing simulations become increasingly challenging for larger size differences, as the number of grains grows cubically, and numerical stability has to be ensured at the cost of smaller time steps. To limit the computational cost of the present simulations, we restricted this validation study to a narrow size range that corresponds to coarse sand and gravel. For the first set of setups, we applied the same seven size fractions as in Table 1. There, we used the six size distributions already considered by Liang et al. (2015) and Rettinger et al. (2022b), i.e., unimodal and bimodal distributions obtained from different log-normal distributions. Additionally, seven random size distributions for the same size range and for an extended size range, respectively, were generated. The extended size range added two smaller sieve mesh sizes, 1.4–2 and 2–2.8 mm, to the ones given in Table 1, resulting in nine size classes. Generally, for N size fractions, these random size distributions were constructed by selecting N−1 random numbers sampled from a uniform distribution between 0 and 1. Those numbers, together with the values 0 and 1, were then sorted in ascending order to yield the discretized cumulative distribution function from which the mass fractions per size class could be obtained as the difference between the neighboring values.
Thus, in total, 20 size distributions were simulated, and we provide their size distributions and evaluated porosity values (Rettinger and Frings, 2022).
4.2 Evaluation
To obtain the porosity prediction, the coefficients of all interaction functions were taken as found via the previous calibration study and given in Table 2. As before, we set as the initial porosity for all size classes. Therefore, we did not have to adapt the models for the validation.
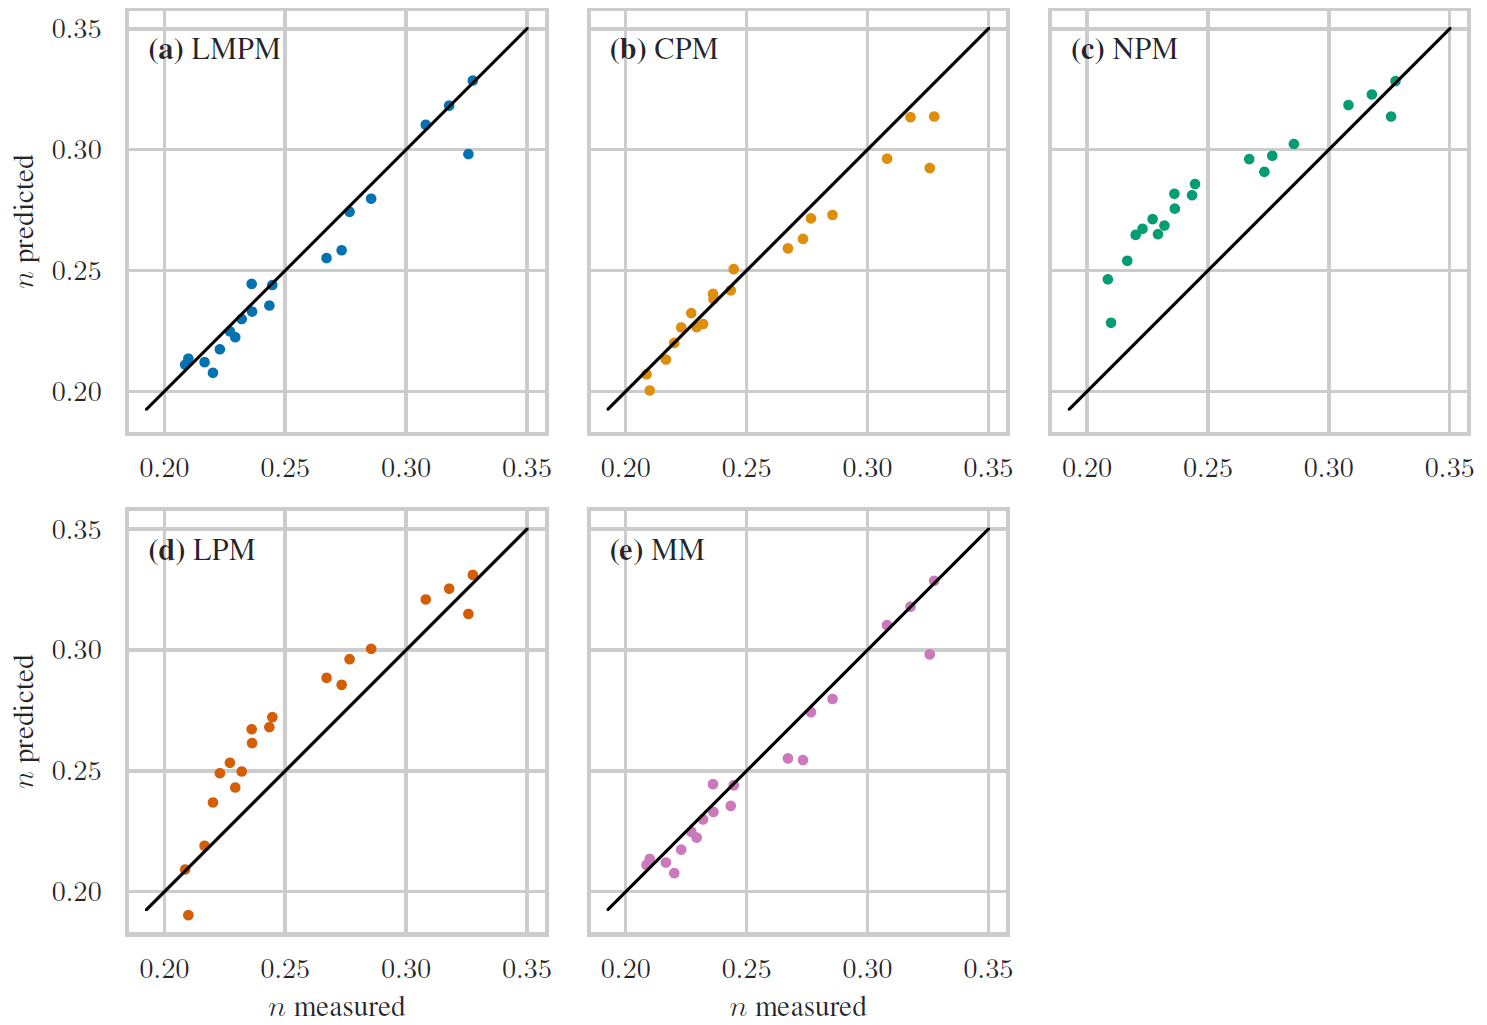
Figure 9Measured (from simulations) vs. predicted porosity for the different packing models. (a) LMPM (R2=0.946; RMSE =0.009). (b) CPM (R2=0.931; RMSE =0.010). (c) NPM (R2=0.308; RMSE =0.032). (d) LPM (R2 =0.762; RMSE =0.019). (e) MM (R2 =0.942; RMSE =0.009).
The evaluation of the obtained predictions for the three different models for the 20 size distributions is shown in Fig. 9, together with the R2 score and the RMSE. There, the LMPM exhibited the overall best prediction performance, which is only slightly worse than for the bidisperse cases in Fig. 7. It was closely followed by the CPM, with an error of 0.01. The NPM showed a systematic overprediction in porosity, with maximum errors up to 0.046 and a large RMSE. This deviation is in stark contrast to its accurate predictions of the bidisperse case and might hint towards intrinsic deficits for such multi-sized packing.
These findings revealed that the NPM does not permit accurate porosity predictions for continuous size distributions, whereas this is seemingly the case for LMPM and CPM. One possibly decisive difference between these two groups is that the LMPM and CPM both have built-in mixture models for the size class i, either explicitly via the MM or implicitly via the compaction model. Such a model is absent in the NPM which, by construction, assumes that only a single size class i forms the dominant component (see Fig. 3). To partially check this assumption, we additionally used the LPM, i.e., the LMPM without mixture packing model, and the MM, i.e., the LMPM without linear packing model. The outcome is also shown in Fig. 9 in the second row. The predictions from the LPM visually exhibited a strong resemblance to the NPM, with predicted porosity values that were mostly too large, especially for the intermediate value range, thus resulting in large errors. In contrast, the MM produced results that are almost identical to the LMPM, indicating that for the comparably narrow grain size range investigated here, such a mixture model is of vital importance, as no single size class can really be considered dominant, as assumed in the NPM. Since adding a mixture model to the NPM is not straightforward, we decided to exclude this packing model from further comparisons.
As a final step, we applied the prediction models to laboratory measurement data obtained for sediment from different rivers. These data contained samples in the size range of 0.02 to 200 mm, thus ranging from silt to coarse gravel. This evaluation significantly extends the size range compared to the previous validation in Sect. 4 and requires an explicit treatment of cohesion effects.
5.1 Modeling the effect of cohesion
The packing of very fine grains, like clay or fine silt, differs from larger grains, as additional grain interactions, like van der Waals or electrostatic forces, can become dominant over all other friction-based or gravitational forces. As a result, such grains often form aggregates (Yu et al., 2003; Zou et al., 2011). This cohesion effect strongly depends on the actual grain size, which is here generally assumed to become notable when the grain size is below a critical value and influences porosity. Consequently, in order to accurately describe packing that at least partially contains the grain sizes where such effects are relevant, the cohesion has to be included in the prediction model. These cohesion models are briefly outlined next.
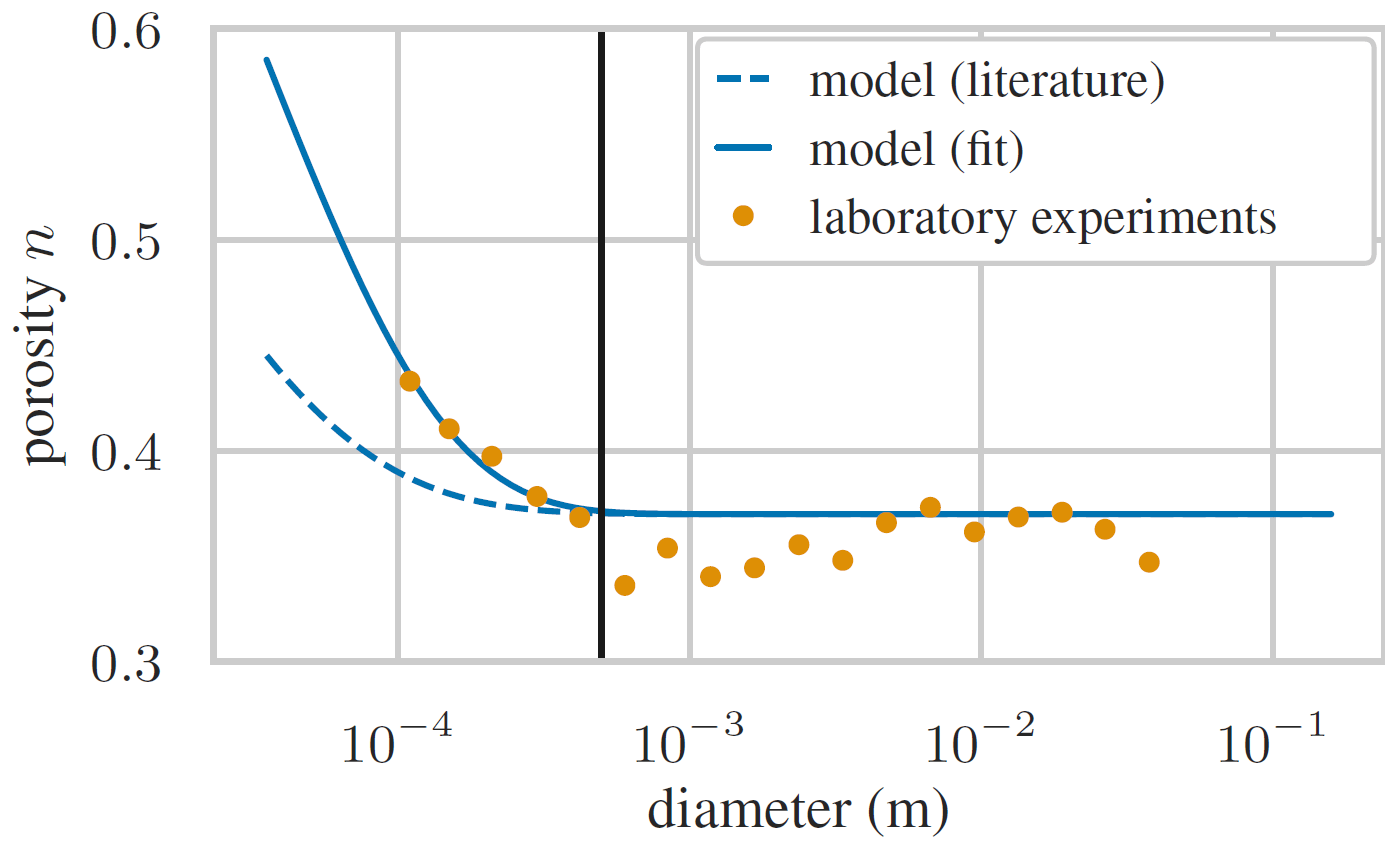
Figure 10Effect of cohesion on the porosity of a uniform packing of a given mean diameter. Data from laboratory experiments with sediment from the Rhine river (Frings et al., 2011) are corrected for the edge effects of the used container for the measurements. The solid black vertical line denotes the assumed of 0.5 mm.
By considering uniform packing, Yu et al. (1997) modeled the increase in the porosity due to cohesive interactions for small grain sizes by
where we introduced m to remove the units from the original expression and follow the definition of the phi size scale. The two coefficients ecoh and fcoh depend on the grain shape and packing process and need to be calibrated to measurements (Yu et al., 1997). There, Yu et al. (2003) suggested ecoh=10.141 and fcoh=0.468, which was also adopted by Zou et al. (2011), and showed a good agreement for grains and powders used in industrial applications. Based on these findings, the critical grain size for cohesion was estimated to be around 0.15 mm for dry glass beads (Zou et al., 2011) and sand (El-Husseiny, 2020).
For fluvial sediment, we carried out an analogous evaluation to determine suitable coefficients of Eq. (19) and the critical cohesion size. This analysis is shown in Fig. 10 for the porosity values obtained by Frings et al. (2011) from laboratory measurements of the uniform packing of sediment taken from the Rhine river. A strong increase in porosity for small grains is clearly visible for diameters smaller than roughly 0.5 mm, which we take as . Using the average porosity reported for the laboratory measurements, we fitted Eq. (19) to the data and obtained ecoh=8.916 and fcoh=0.615. The resulting curve was able to predict the increase in porosity, improving upon the available parameterization.
In addition to affecting the porosity of uniform packing, Yu et al. (1997) noticed that the interaction among different size classes changes once cohesive effects play a role. As, for example, small grains would not simply fill the void between larger grains but might form agglomerates or stick to the larger grain surface, the gaps inside the packing are increased which, by implication, increase the porosity. Thus, the binary interactions expressed by the size ratio rij and the interaction functions in the packing models should be adapted as well. For that reason, a modified size ratio was proposed (Zou et al., 2011) and given as
where the coefficient quantifies the cohesive packing degree. The weighting factor ξcoh combines the actual size ratio rij for coarse grains with a power law model for the fine ones (Yu et al., 1997) and was determined as
for di<dj (Zou et al., 2011). For the coefficient pcoh, values of 0.15 for natural sand–silt mixtures (El-Husseiny, 2020) up to 0.593 for alumina powder (Yu et al., 1997) have been suggested and applied successfully. As the former is presumably similar to the fluvial sediment, we adopted pcoh=0.15, noting, however, that an appropriate choice might also depend on the packing conditions (Yu et al., 1997). Following these model assumptions, the interaction functions were here left unchanged and evaluated with the modified size ratio instead of the nominal one.
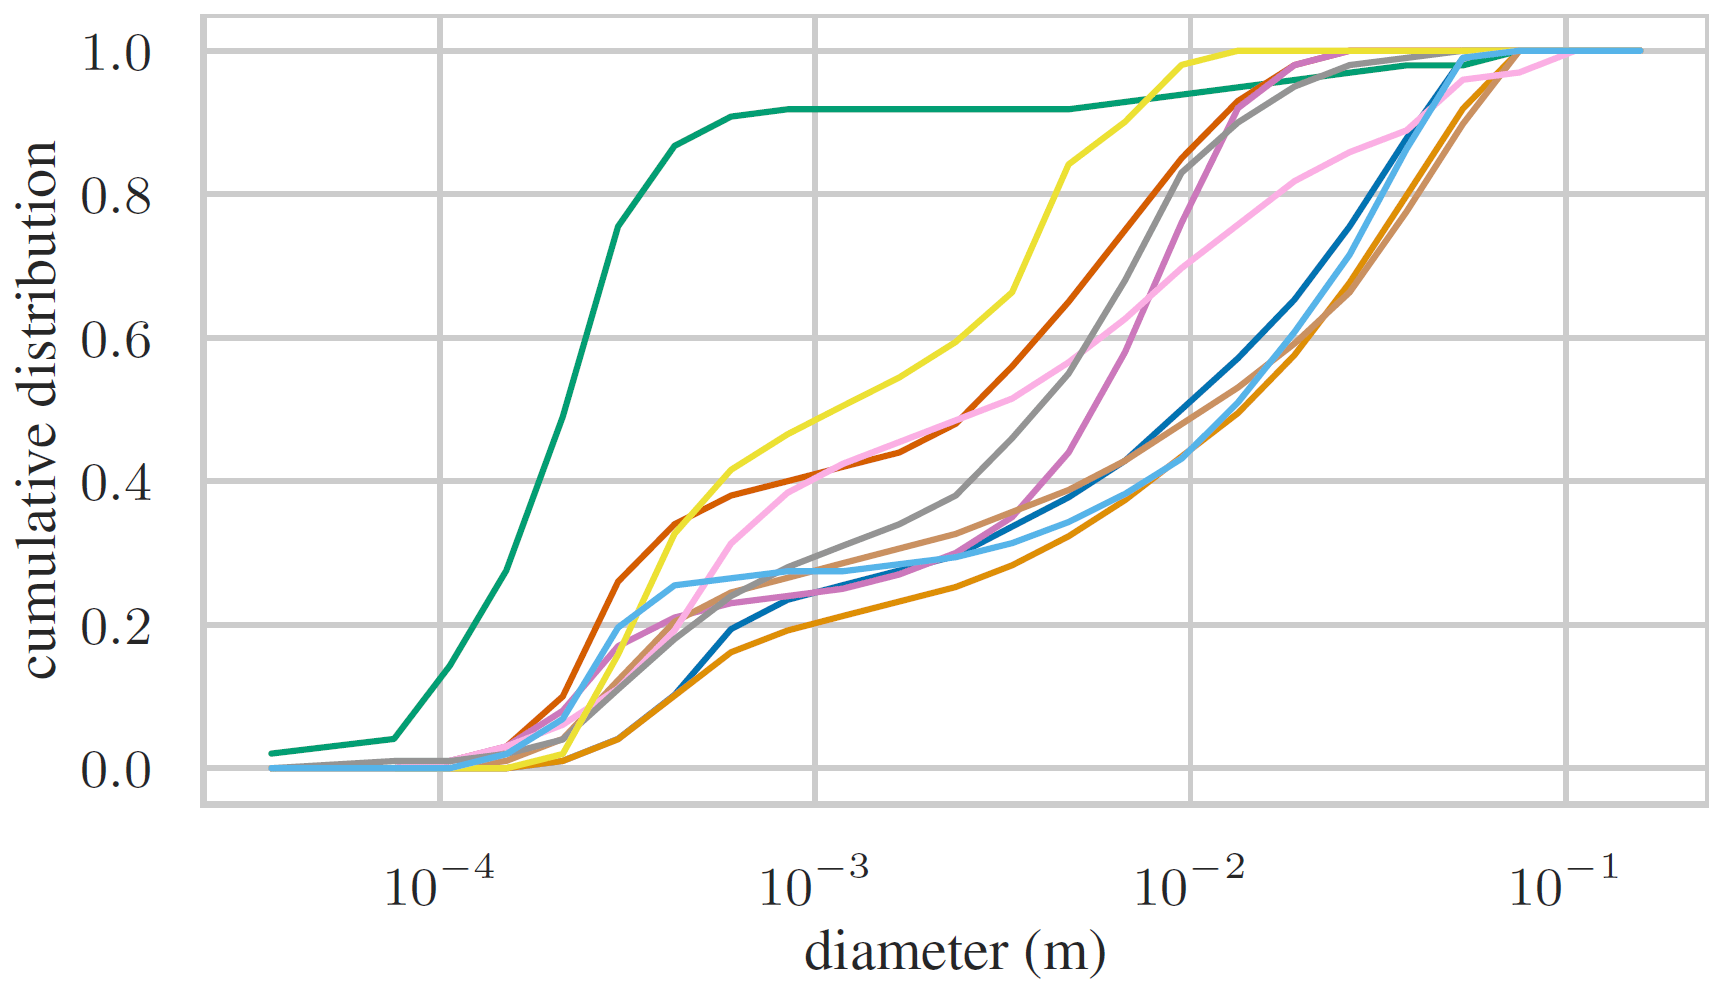
Figure 11A total of 10 examples of the size distribution of the Rhine sediment samples shown as a cumulative distribution.
5.2 Data from the Rhine river
As part of their porosity measurement campaign in the Rhine river, Frings et al. (2011) carried out 46 laboratory measurements with sediment obtained from sub-surface layers of the channel bed and riverbank, consisting mainly of quartz. The sediment was put inside a cylindrical container, and the water displacement method was used to determine porosity of the individual samples that featured a size range of 0.02–200 mm. Some examples of the size distribution of these samples are shown in Fig. 11, where the full data are provided by Frings et al. (2011).
To set up the porosity predictors for this data set, we assumed that the sediment form was generally similar to the ones we used for calibration in Sect. 3. This can be justified, as the samples for the CT scans were taken from the sediment used in the laboratory measurements, even though the calibration only made use of gravel-sized grains. Consequently, we applied the same interaction functions as in Sect. 4. The initial porosity n0,i was taken as 0.37 for all size classes, corresponding to the average of all laboratory measurements with uniform packing with similar sediment from Frings et al. (2011) and as also applied for the parameterization of the cohesion model in Sect. 5.1 (see Fig. 10). The choice to deviate from the value of 0.338 obtained from the simulations and used in the previous sections was made to rule out further factors possibly influencing porosity. These include process-based ones affecting the obtained packing state and differences in the setup, where a cylindrical container was used in the laboratory, and horizontal periodicity was applied in the simulations. This step put the predictions and the measurements on the same foundation. Since the packing contained very fine grains below the assumed size threshold for cohesion, mm, that we determined above, we used the adaptions as given by Eqs. (19) and (20) to incorporate the effect of cohesion by increasing the initial porosity of small size classes and redefining the size ratio. For comparison, we carried out predictions with the original and cohesion-modified variant of the LMPM and the CPM.
Table 3Comparison of porosity prediction performance (R2, root mean square error RMSE, and maximum absolute error ME) of packing models for the Rhine river data (Frings et al., 2011).
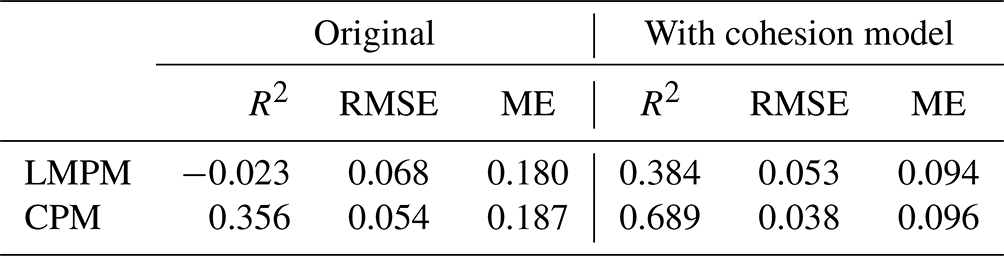
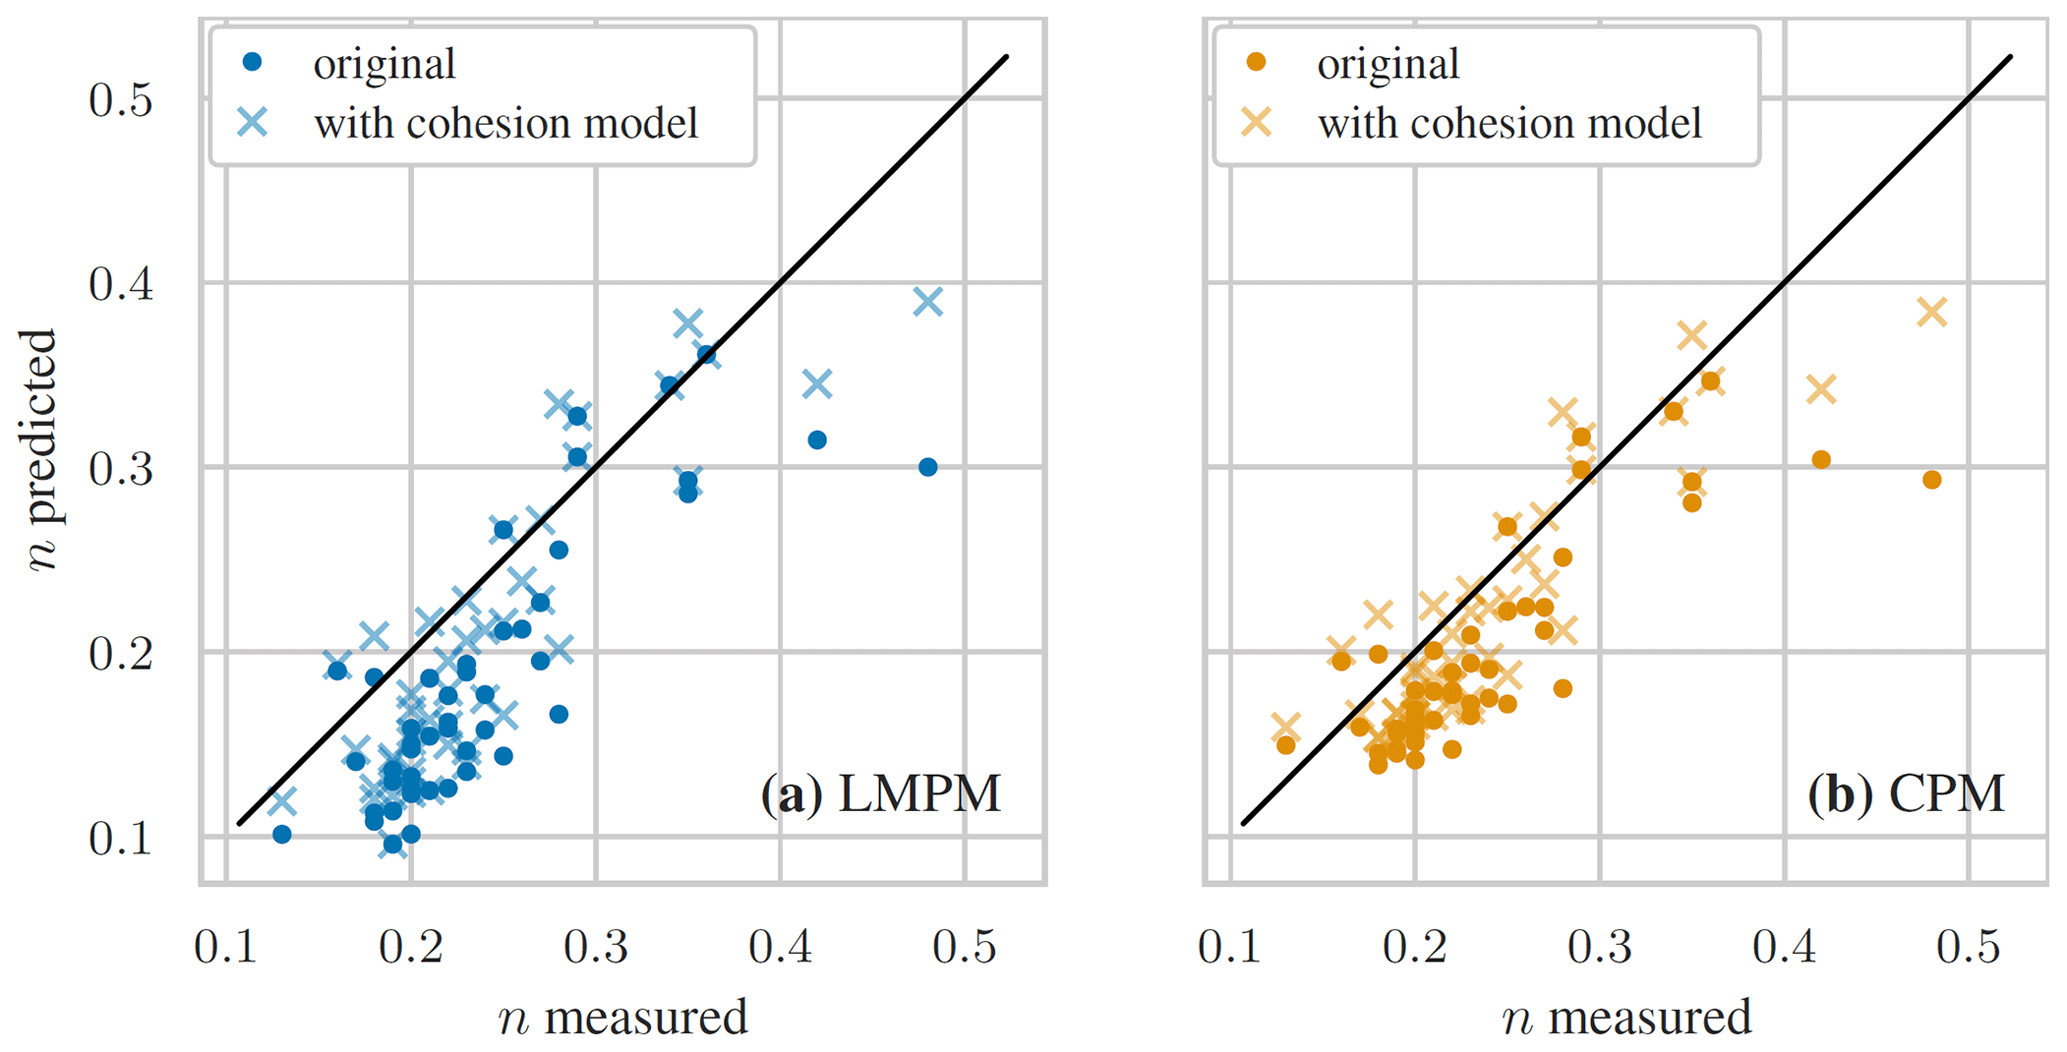
Figure 12Measured (from laboratory) vs. predicted porosity for the different packing models with fluvial sediment from the Rhine river (Frings et al., 2011). (a) LMPM. (b) CPM.
The outcome of this comparative study is stated in Table 3 and visualized in Fig. 12. The original variants of LMPM and CPM did not perform well, with low determination coefficients and high mean and maximum errors. As can be seen, both models underpredicted porosity for almost all packing. Once the modifications by the cohesion model were included, the predictions improved significantly in both cases. There, the CPM was performing best and achieved a mean error of 0.038, while the LMPM still exhibited larger errors and only a low R2 score. This improvement was apparently achieved by an increase in the predicted porosity for all cases, which is in agreement with the expected action of cohesion in packing.
5.3 Data from the Bès and Galabre rivers
To investigate the generalizability of the packing models and their parameterizations to other rivers, we made use of a second extensive data set obtained by Tabesh et al. (2022) from the banks of two rivers in the Rhône-Alpes in France, named Bès and Galabre. These rivers are significantly smaller than the Rhine in terms of width, depth, and discharge and feature a different composition of the sediment, both in terms of lithology and shape. Samples were collected at four different sites with varying sediment characteristics, and their porosity was analyzed later in the laboratory via the water displacement method. The resulting 52 data points again featured size distributions in the range of 0.02–200 mm. In contrast to the Rhine data set above, no information about the porosity values of uniform packing of the different size classes was provided, and also no details about the form characteristics of the sediment were given.
Therefore, in the context of the packing models, no calibration of the interaction and cohesion models was possible as in Sects. 3 and 5.1 for the Rhine river, and we kept the same parameterization as for the Rhine. Also, n0,i as one of the major input quantities of the models, remained unknown. We varied its value in the interval [0.37,0.49] as a sensitivity study, always keeping it constant for all size classes but allowing for modifications based on the cohesion model via Eq. (19).
Table 4Comparison of porosity prediction performance (R2 score, RMSE, and maximum absolute error or ME) of packing models for the data from the Bès and Galabre rivers (Tabesh et al., 2022) for varying values of the assumed initial porosity n0,i. RMSE values given in bold indicate the best outcome for a certain model.
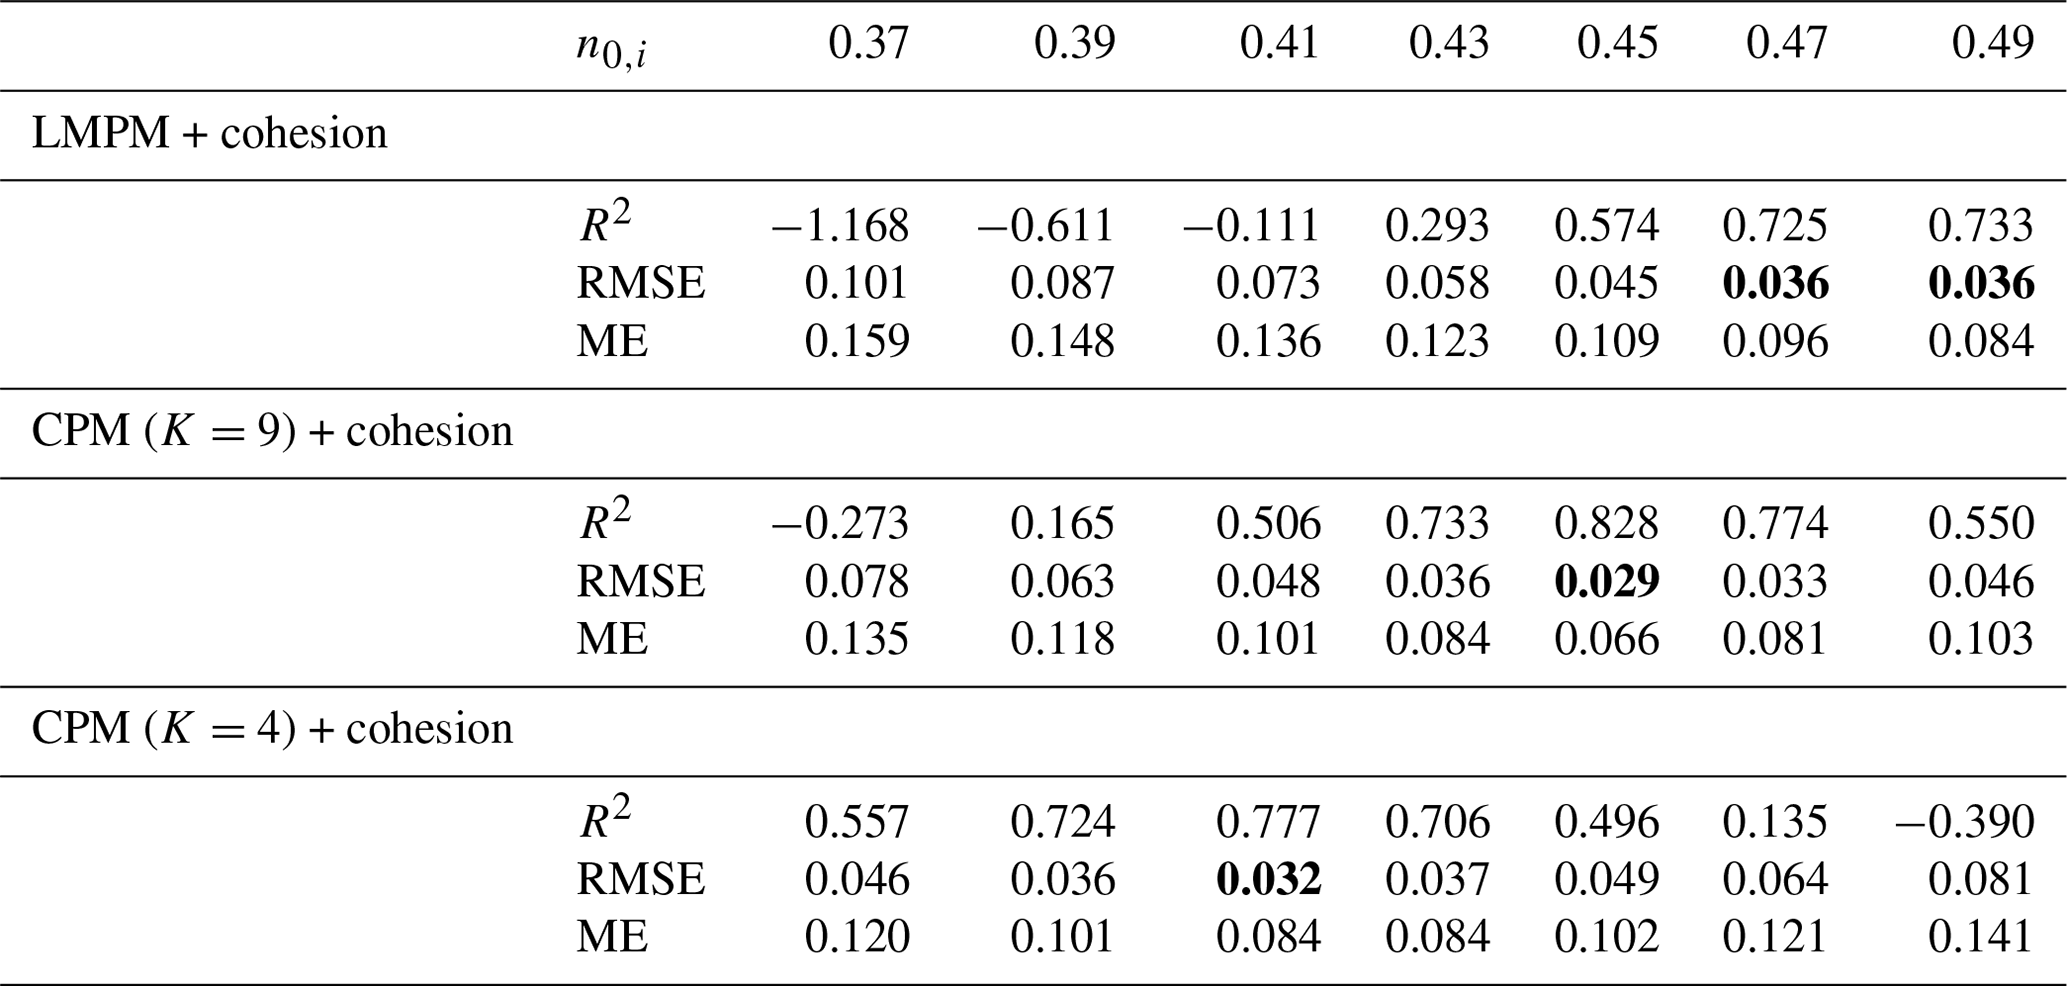
The results of this study are given in Table 4. The initial porosity had a significant influence on the prediction quality. For the value of 0.37 that we used for the Rhine river and where it provided reasonable predictions for both packing models, none of the two was able to yield satisfactory results for the present data set, with mean errors of more than 0.078. The agreement improved for increasing initial porosity values, where a value of 0.45 was the most accurate choice for the CPM and 0.47 to 0.49 for the LMPM. Since both models consistently required such a large initial porosity, one could assume that its actual value might be in the same range. Such a large value would hint towards packing conditions that result in a rather loose packing state. Depending on the form characteristics of the sediment (Rettinger et al., 2022b), and with rather loose packing conditions during the preparation of the samples (Chang and Deng, 2018; Maroof et al., 2022), such high porosity values for uniform packing could be reasonable.
By construction, the CPM allows for another option to account for loose rather than dense packing, i.e., via the compaction index K. Using K=4, as suggested for loose packing conditions, instead of K=9, as for all previous results, the most accurate prediction was achieved with an initial porosity of 0.41. This difference is primarily achieved by the model's internal modification of the ideal packing densities via Eq. (15), which has a similar effect to instances in which a larger initial porosity value is provided.
Applying the packing models as porosity predictors to actual fluvial sediment data in the previous section has revealed their capabilities and also some challenges. The latter primarily arose in the determination or estimation of the various input parameters and quantities; i.e., the initial porosity and the interaction functions that depend on the grain shape. To facilitate the following discussion, we refer again to the overview sketch in Fig. 2.
Two of the main model parameters, the volume fractions yi and corresponding size information di, were here determined by sieving the collected samples in the laboratory; this is a standard procedure which is thus not considered problematic. If the sediment density is known to vary between the size classes, e.g., as a result of different lithologies in the deposit, then these variations should be accounted for when converting the mass fractions to volume fractions. Especially for field studies, photogrammetric approaches are a promising alternative to sieving but are currently still limited to rather large grain sizes (Mair et al., 2022).
Regarding the other relevant parameters, the above study with the Rhine data can be considered to be the ideal case. Since we had some digital scans of similar sedimentary grains available, simulations were used to calibrate the interaction functions to binary packing (see Sect. 3). The common alternative would be to carry out such measurements in a laboratory setting (Yu et al., 1996; De Larrard, 1999; Liu et al., 2019). The validation in Sect. 4 with simulated packing under equal conditions but various size distributions showcased that accurate predictions are possible with these packing models. When applied directly to laboratory measurements, however, differences already occurred in the initial porosity n0,i. Here, we had to adapt its value to the one found in laboratory, which was larger (0.37) than the one found via simulations (0.338). Furthermore, the laboratory measurements of uniform packing were also useful for the parameterization of the cohesion model, which turned out to be of importance for such wide size distributions containing very fine grains. The porosity that we predicted by this combination of findings from laboratory measurements and simulations was reasonably accurate, given the fact that also other effects might perturb the measured data, like the porosity-increasing effect of the container boundaries and the top of the packing. Such influence factors were fully captured by the applied measurement method in the laboratory but were not accounted for in the packing model or in the simulations. One of the largest sources of uncertainty is given by the packing state that we capture here by interpreting the initial porosity as the porosity of a homogeneous packing, which has been obtained for the same packing conditions as the mixed packing. The packing state itself, however, is largely influenced by the packing process and sediment properties, which renders it difficult to quantify and to keep it similar for different laboratory or simulated packing.
For the comparison to the data from the two French rivers, neither detailed information about the sediment form nor dedicated measurements of uniform packing were available. This lack of information made it necessary to assume that the Rhine-based parameterization of the interaction functions and the cohesion model were still applicable here. This might be justified, since the actual sediment form is probably similar to the one of the Rhine, and thus, no large differences in the calibrated parameters can be expected. A major challenge, however, was to determine the initial porosity for each size class. The subsequent sensitivity study revealed its large influence on the resulting predictions. In practice, the initial porosity that resulted in the best predictions for the available data could be used to essentially calibrate this input to the cases at hand, i.e., specific to the fluvial environment.
Generally, if form information like the average elongation or flatness is available, then the porosity predictions for dense uniform packing derived by Rettinger et al. (2022b) could be used to determine n0,i, where the effect of the form is explicitly taken into account. Since the porosity also strongly depends on the packing conditions, the available relations for minimal and maximal porosity of dense and loose packing, respectively, can be used to define a valid range of initial porosity values. For clean sand, e.g., the relation
was found for the two limiting void ratios (Cubrinovski and Ishihara, 2002). Assuming that the porosity of the dense uniform packing is 0.37, as for the Rhine laboratory measurements, then a porosity of 0.49 would correspond to the loose packing state according to this relation. Thus, the found initial porosity of roughly 0.46 for the French river case could be considered reasonable, provided that the grain form was also similar. Other refined relations are available using form and shape information (Chang et al., 2018; Maroof et al., 2022). Alternatively, the CPM offers the possibility of adapting the compaction index K to account for different packing conditions, which can be utilized to avoid supplying unreasonably large initial porosity values for this model.
If the actual form is strongly different from the grains considered here, then porosity measurements for uniform and binary packing should be carried out to verify or recalibrate the parameters of the interaction functions. This analysis can be achieved either in the laboratory or via simulations (Liu et al., 2017). Ideally, and if relevant for the case at hand, those studies could be extended to very small grains to capture the regime of cohesive interactions in order to determine the parameters of the cohesion model as well.
Furthermore, by using the same initial porosity for all size classes and the interaction functions calibrated through measurements for gravel-sized sediment, we implicitly assumed that the grain shape is similar for all size classes. Such an assumption was found to be applicable for gravel-sized grains from the Rhine by Rettinger et al. (2022b), but no shape information for the smaller size classes was available. If such an assumption cannot be made, then the actual sizes or shapes of the interacting classes would need to be added as an additional dependency to the interaction functions. This step, however, would significantly increase the number of measurements necessary to calibrate the functions, perhaps to the point where such a procedure is no longer feasible.
Moving towards field measurements, the challenges associated with the determination of the input variables grow further. There, the underlying model assumption that the packing is a random grain mixture could be violated by selective deposition conditions that might have led to imbrication or stratification inside the sediment bed. Additionally, it is usually not possible to obtain field measurements for uniform packing, as those do not occur naturally. These effects lead to additional uncertainties in the obtained predictions and might essentially limit the applicability of the models considered here. Advanced simulation studies that closely resemble the deposition conditions in actual rivers, could be used there as a promising yet demanding alternative to determine the required model input and promote further model improvements.
All in all, the intrinsic complexity of grain packing with the large number of influence factors directly carries over to corresponding prediction models, where all of them should be taken into account, i.e., modeled. The more these factors can be quantified or excluded, the better the expected outcome using the prediction models considered here will be.
We have compared three different porosity prediction models for the packing of fluvial sediment, which is characterized by a wide range of size ratios and complex grain shapes. These packing models, the Linear Mixture Packing Model (LMPM), Compressible Packing Model (CPM), and Nonlinear Packing Model (NPM), partition the grains into distinct size classes for which the respective average size, the mass fraction, and the porosity of a single class packing have to be provided. By considering the interaction between the contained size classes, modeled via interaction parameters and depending on the size ratios of the classes, they provide predictions of porosity.
These interaction parameters were calibrated by simulating the packing of several binary cases, using digital scans of actual sediment grains from the Rhine river in Germany. This study showed that all of these packing models are able to capture binary cases well if calibrated adequately, with a slightly better performance of the NPM. Based on the individually calibrated cases, the interaction parameters of the models could be formulated as functions of the size ratio, making them applicable for the general, multi-sized case.
We verified the models further by comparing them to 20 simulations, now featuring continuous size distributions between 1.4 and 31.5 mm. Keeping all other variables, like the packing process and porosity evaluation, the same, the LMPM and CPM predicted porosity reasonably well. On the other hand, the study revealed a systematic deficit of the NPM for these continuous size distributions, which we could attribute to a missing built-in mixture packing model for the dominant size class as opposed to the two other models.
Finally, we applied the LMPM and the CPM to two different data sets obtained from laboratory porosity measurements, with sediment from the Rhine river and two French rivers. Both featured size distributions ranging from 0.02 to 200 mm, thus covering the range from silt to coarse gravel. There, we demonstrated that the packing models should be augmented with a dedicated cohesion model, as it improved the predictions significantly. However, the models were less accurate than for the simulated packing, since not all the effects of the laboratory experiments could be quantified and were thus not included in the models. The comparison for the French rivers acted primarily as a sensitivity study regarding unknown input parameters for the packing models, as here information about the porosity of the size classes or about the sediment shape was not available. Given a sensible estimate of the single class porosity values, we could predict the porosity of mixtures reasonably well. Based on these findings, we discussed several ways that a suitable porosity predictor can be obtained for fluvial sediment deposits, with the general recommendation to make use of the CPM due to its flexibility.
Overall, we show the great potential that lies within these packing models, given a detailed knowledge of the packing process and some sediment properties. The observed discrepancy for the case of laboratory measurements and the expected even larger challenge for field measurements highlight that many different aspects of such a packing play a role that might not yet be properly accounted for in the present models or the provided model input. Further improvements are expected once the recent extensions of the LMPM and the CPM that aim to cover additional interaction effects among the size classes become available for multi-sized packing in combination with the here-found importance of a proper mixture packing model and a cohesion model. Simulations augmented by cohesive effects and featuring different deposition conditions can help to identify, quantify, and model these effects systematically here.
A1 Linear Mixture Packing Model
The range of size classes that defines the mixture for a specific class i is given as
This definition uses the modification proposed by Frings et al. (2008), who also provided a detailed explanation of the model.
The interaction parameters aLMPM and bLMPM are functions of the size ratio and were proposed to be
By considering binary packing of spherical grains, Yu et al. (1996) determined the coefficients as , , , , , and .
The quadratic and cubic mixture parameters cLMPM and dLMPM, respectively, were found to be a function of the size ratio rjk and the initial mixture porosity n0,mix, as obtained from the specific volume (Yu and Standish, 1991).
A2 Compressible Packing Model
The model's interaction parameters, aCPM and bCPM, are functions of the size ratio rij and were, found from binary experiments with rounded and crushed aggregates, to be
with coefficients and (De Larrard, 1999).
A3 Nonlinear Packing Model
The two interaction functions, aNPM and bNPM are generally given as
where the coefficient values , , , and were extracted from experiments with binary spherical glass beads (Liu et al., 2019).
In the following, we state the binary versions of the packing models presented in Sect. 2, which were then used in Sect. 3.
B1 Linear Mixture Packing Model
As the LMPM (Yu and Standish, 1991; Yu et al., 1996) combines a LPM and a MM with individual parameters, we consider them separately here. The specific volume according to the LPM for a binary packing is (Yu et al., 1996)
with parameters and . The MM for a binary packing is given as
with parameters and .
B2 Compressible Packing Model
The packing densities of the two ideal packing models considered by the CPM (De Larrard, 1999) are given as
with the parameters and . The final ϕ is obtained by solving the quadratic equation
for the chosen value of K.
B3 Nonlinear Packing Model
The void ratio of a binary packing according to the NPM (Liu et al., 2019) is given as
with the parameters and .
The simulation software, including the numerical method and the setups, is publicly available via the waLBerla main repository (https://doi.org/10.5281/zenodo.10054460, Chair for System Simulation, 2023). The sediment geometries used in the simulative studies are available on Zenodo (Rettinger et al., 2022c, https://doi.org/10.5281/zenodo.6412071). Additionally, a Python implementation of the packing models, including examples, can be found on Zenodo (Rettinger and Frings, 2022, https://doi.org/10.5281/zenodo.7465313), alongside the results of the binary and multi-sized packing obtained by the simulations presented here.
CR and RMF conceptualized the study. CR performed the simulations, developed the model implementation, and carried out the analysis. MT and RMF compiled and prepared the laboratory measurement data. CR prepared the paper, with contributions from all co-authors. RMF acquired the funding. UR provided access to the computational resources. SV administered the project.
The contact author has declared that none of the authors has any competing interests.
Publisher’s note: Copernicus Publications remains neutral with regard to jurisdictional claims made in the text, published maps, institutional affiliations, or any other geographical representation in this paper. While Copernicus Publications makes every effort to include appropriate place names, the final responsibility lies with the authors.
The authors want to thank Axel Winterscheid and Wenjia Xu for fruitful discussions that helped to shape the research. The authors gratefully acknowledge the HPC resources provided by the Erlangen National High Performance Computing Center (NHR@FAU) of the Friedrich-Alexander-Universität Erlangen-Nürnberg (FAU). NHR funding is provided by federal and Bavarian state authorities. NHR@FAU hardware is partially funded by the DFG (grant no. 440719683). Furthermore, the authors gratefully acknowledge the Gauss Centre for Supercomputing e.V. (https://www.gauss-centre.eu/, last access: 27 October 2023) for funding this project by providing computing time on the GCS Supercomputer SuperMUC-NG at the Leibniz Supercomputing Centre (https://www.lrz.de/, last access: 27 October 2023).
This research has been supported by the Deutsche Forschungsgemeinschaft (grant nos. FR 3509/4-2 and 433735254).
This paper was edited by Paola Passalacqua and reviewed by two anonymous referees.
An, X. Z., Yang, R. Y., Zou, R. P., and Yu, A. B.: Effect of vibration condition and inter-particle frictions on the packing of uniform spheres, Powder Technol., 188, 102–109, https://doi.org/10.1016/j.powtec.2008.04.001, 2008. a, b
Bauer, M., Eibl, S., Godenschwager, C., Kohl, N., Kuron, M., Rettinger, C., Schornbaum, F., Schwarzmeier, C., Thönnes, D., Köstler, H., and Rüde, U.: waLBerla: A block-structured high-performance framework for multiphysics simulations, Comput. Math. Appl., 81, 478–501, https://doi.org/10.1016/j.camwa.2020.01.007, 2021. a
Carling, P. A. and Reader, N. A.: Structure, composition and bulk properties of upland stream gravels, Earth Surf. Proc. Land., 7, 349–365, https://doi.org/10.1002/esp.3290070407, 1982. a
Chair for System Simulation: waLBerla (widely applicable Lattice Boltzmann from Erlangen), v6.1, Zenodo [code], https://doi.org/10.5281/zenodo.10054460, 2023. a
Chan, K. and Kwan, A.: Evaluation of particle packing models by comparing with published test results, Particuology, 16, 108–115, https://doi.org/10.1016/j.partic.2013.11.008, 2014. a
Chang, C. S. and Deng, Y.: A particle packing model for sand–silt mixtures with the effect of dual-skeleton, Granul. Matter, 19, 1–15, https://doi.org/10.1007/s10035-017-0762-1, 2017. a, b, c
Chang, C. S. and Deng, Y.: A nonlinear packing model for multi-sized particle mixtures, Powder Technol., 336, 449–464, https://doi.org/10.1016/j.powtec.2018.06.008, 2018. a, b, c
Chang, C. S., Deng, Y., and Meidani, M.: A multi-variable equation for relationship between limiting void ratios of uniform sands and morphological characteristics of their particles, Eng. Geol., 237, 21–31, https://doi.org/10.1016/j.enggeo.2018.02.003, 2018. a, b, c
Cho, G.-C., Dodds, J., and Santamarina, J. C.: Particle Shape Effects on Packing Density, Stiffness, and Strength: Natural and Crushed Sands, J. Geotechn. Geoenviron., 132, 591–602, https://doi.org/10.1061/(ASCE)1090-0241(2006)132:5(591), 2006. a
Coleman, S. E. and Nikora, V. I.: Exner equation: A continuum approximation of a discrete granular system, Water Resour. Res., 45, W09421, https://doi.org/10.1029/2008WR007604, 2009. a
Cubrinovski, M. and Ishihara, K.: Maximum and Minimum Void Ratio Characteristics of Sands, Soils Found., 42, 65–78, https://doi.org/10.3208/sandf.42.6_65, 2002. a
De Larrard, F.: Concrete mixture proportioning: a scientific approach, CRC Press, https://doi.org/10.1201/9781482272055, 1999. a, b, c, d, e, f, g
El-Husseiny, A.: Improved Packing Model for Functionally Graded Sand-Fines Mixtures–Incorporation of Fines Cohesive Packing Behavior, Appl. Sci., 10, 562, https://doi.org/10.3390/app10020562, 2020. a, b
El-Husseiny, A.: Unified Packing Model for Improved Prediction of Porosity and Hydraulic Conductivity of Binary Mixed Soils, Water, 13, 455, https://doi.org/10.3390/w13040455, 2021. a
Fraser, H. J.: Experimental Study of the Porosity and Permeability of Clastic Sediments, J. Geol., 43, 910–1010, https://doi.org/10.1086/624388, 1935. a, b
Frings, R. M., Kleinhans, M. G., and Vollmer, S.: Discriminating between pore-filling load and bed-structure load: a new porosity-based method, exemplified for the river Rhine, Sedimentology, 55, 1571–1593, https://doi.org/10.1111/j.1365-3091.2008.00958.x, 2008. a
Frings, R. M., Schüttrumpf, H., and Vollmer, S.: Verification of porosity predictors for fluvial sand-gravel deposits, Water Resour. Res., 47, W07525, https://doi.org/10.1029/2010WR009690, 2011. a, b, c, d, e, f, g, h, i, j, k, l, m, n, o
Furnas, C.: Grading aggregates-I.-Mathematical relations for beds of broken solids of maximum density, Ind. Eng. Chem., 23, 1052–1058, https://doi.org/10.1021/ie50261a017, 1931. a
Jones, M., Zheng, L., and Newlands, M.: Comparison of particle packing models for proportioning concrete constitutents for minimum voids ratio, Mater. Struct., 35, 301–309, https://doi.org/10.1007/BF02482136, 2002. a, b, c
Kamann, P. J., Ritzi, R. W., Dominic, D. F., and Conrad, C. M.: Porosity and Permeability in Sediment Mixtures, Groundwater, 45, 429–438, https://doi.org/10.1111/j.1745-6584.2007.00313.x, 2007. a
Knop, Y. and Peled, A.: Packing density modeling of blended cement with limestone having different particle sizes, Constr. Build. Mater., 102, 44–50, https://doi.org/10.1016/j.conbuildmat.2015.09.063, 2016. a
Kwan, A., Chan, K., and Wong, V.: A 3-parameter particle packing model incorporating the wedging effect, Powder Technol., 237, 172–179, https://doi.org/10.1016/j.powtec.2013.01.043, 2013. a, b, c, d, e
Kwan, A., Wong, V., and Fung, W.: A 3-parameter packing density model for angular rock aggregate particles, Powder Technol., 274, 154–162, https://doi.org/10.1016/j.powtec.2014.12.054, 2015. a, b, c
Liang, R., Schruff, T., Jia, X., Schüttrumpf, H., and Frings, R. M.: Validation of a stochastic digital packing algorithm for porosity prediction in fluvial gravel deposits, Sediment. Geol., 329, 18–27, https://doi.org/10.1016/j.sedgeo.2015.09.002, 2015. a, b, c
Liu, Q., Jia, D., and Miao, J.: Study of the linear and nonlinear packing model based on mixing of quartz sand, Powder Technol., 366, 382–394, https://doi.org/10.1016/j.powtec.2020.02.056, 2020. a, b
Liu, W., Chen, S., and Li, S.: Influence of adhesion on random loose packings of binary microparticle mixtures, AIChE J., 63, 4296–4306, https://doi.org/10.1002/aic.15775, 2017. a, b
Liu, Z.-R., Ye, W.-M., Zhang, Z., Wang, Q., Chen, Y.-G., and Cui, Y.-J.: A nonlinear particle packing model for multi-sized granular soils, Constr. Build. Mater., 221, 274–282, https://doi.org/10.1016/j.conbuildmat.2019.06.075, 2019. a, b, c, d, e, f, g, h
Mair, D., Do Prado, A. H., Garefalakis, P., Lechmann, A., Whittaker, A., and Schlunegger, F.: Grain size of fluvial gravel bars from close-range UAV imagery – uncertainty in segmentation-based data, Earth Surf. Dynam., 10, 953–973, https://doi.org/10.5194/esurf-10-953-2022, 2022. a
Maroof, M. A., Mahboubi, A., Vincens, E., and Noorzad, A.: Effects of particle morphology on the minimum and maximum void ratios of granular materials, Granul. Matter, 24, 41, https://doi.org/10.1007/s10035-021-01189-0, 2022. a, b
Noack, M., Ortlepp, J., and Wieprecht, S.: An Approach to Simulate Interstitial Habitat Conditions During the Incubation Phase of Gravel-Spawning Fish, River Res. Appl., 33, 192–201, https://doi.org/10.1002/rra.3012, 2017. a
Oakey, R. J., Green, M., Carling, P. A., Lee, M. W., Sear, D. A., and Warburton, J.: Grain-shape analysis – A new method for determining representative particle shapes for populations of natural grains, J. Sediment. Res., 75, 1065–1073, https://doi.org/10.2110/jsr.2005.079, 2005. a
Perera, C., Wu, W., and Knack, I.: Porosity of bimodal and trimodal sediment mixtures, Int. J. Sediment Res., 37, 258–271, https://doi.org/10.1016/j.ijsrc.2021.09.008, 2022. a
Rettinger, C. and Frings, R. M.: Packing Models for Porosity Prediction, Zenodo [code] and [data set], https://doi.org/10.5281/zenodo.7465313, 2022. a, b, c
Rettinger, C., Eibl, S., Rüde, U., and Vowinckel, B.: Rheology of mobile sediment beds in laminar shear flow: effects of creep and polydispersity, J. Fluid Mech., 932, A1, https://doi.org/10.1017/jfm.2021.870, 2022a. a
Rettinger, C., Rüde, U., Vollmer, S., and Frings, R. M.: Effect of sediment form and form distribution on porosity: a simulation study based on the discrete element method, Granul. Matter, 24, 118, https://doi.org/10.1007/s10035-022-01275-x, 2022b. a, b, c, d, e, f, g, h, i, j, k
Rettinger, C., Rüde, U., Vollmer, S., and Frings, R. M.: Effect of Sediment Form and Form Distribution on Porosity, Zenodo [data set], https://doi.org/10.5281/zenodo.6412071, 2022c. a, b
Roquier, G.: The 4-parameter Compressible Packing Model (CPM) for crushed aggregate particles, Powder Technol., 320, 133–142, https://doi.org/10.1016/j.powtec.2017.07.028, 2017. a, b, c
Schruff, T., Liang, R., Rüde, U., Schüttrumpf, H., and Frings, R.: Generation of dense granular deposits for porosity analysis: assessment and application of large-scale non-smooth granular dynamics, Computational Particle Mechanics, 5, 59–70, https://doi.org/10.1007/s40571-016-0153-0, 2018. a
Seelen, L. J. H., Padding, J. T., and Kuipers, J. A. M.: A granular Discrete Element Method for arbitrary convex particle shapes: Method and packing generation, Chem. Eng. Sci., 189, 84–101, https://doi.org/10.1016/j.ces.2018.05.034, 2018. a
Seitz, L., Haas, C., Noack, M., and Wieprecht, S.: From picture to porosity of river bed material using Structure-from-Motion with Multi-View-Stereo, Geomorphology, 306, 80–89, https://doi.org/10.1016/j.geomorph.2018.01.014, 2018. a
Suhr, B. and Six, K.: Simple particle shapes for DEM simulations of railway ballast: influence of shape descriptors on packing behaviour, Granul. Matter, 22, 1–17, https://doi.org/10.1007/s10035-020-1009-0, 2020. a
Tabesh, M., Hoffmann, T., Vollmer, S., Schüttrumpf, H., and Frings, R. M.: In-situ measurement of river-bed sediment porosity using Structure-from-Motion image analysis, Geomorphology, 338, 61–67, https://doi.org/10.1016/j.geomorph.2019.04.011, 2019. a
Tabesh, M., Vollmer, S., Schüttrumpf, H., and Frings, R. M.: Spatial variability in river bed porosity determined by nuclear density gauging: A case study from a French gravel-bed river, Sedimentology, 69, 823–844, https://doi.org/10.1111/sed.12928, 2022. a, b, c, d
Westman, A. E. R.: The packing of particles: empirical equations for intermediate diameter ratios, J. Am. Ceram. Soc., 19, 127–129, https://doi.org/10.1111/j.1151-2916.1936.tb19809.x, 1936. a
Wooster, J. K., Dusterhoff, S. R., Cui, Y., Sklar, L. S., Dietrich, W. E., and Malko, M.: Sediment supply and relative size distribution effects on fine sediment infiltration into immobile gravels, Water Resour. Res., 44, W03424, https://doi.org/10.1029/2006WR005815, 2008. a
Wu, W. and Li, W.: Porosity of bimodal sediment mixture with particle filling, Int. J. Sediment Res., 32, 253–259, https://doi.org/10.1016/j.ijsrc.2017.03.005, 2017. a
Wu, W. and Wang, S. S. Y.: Formulas for Sediment Porosity and Settling Velocity, J. Hydraul. Eng., 132, 858–862, https://doi.org/10.1061/(ASCE)0733-9429(2006)132:8(858), 2006. a
Yu, A. B. and Standish, N.: Estimation of the porosity of particle mixtures by a linear-mixture packing model, Ind. Eng. Chem. Res., 30, 1372–1385, https://doi.org/10.1021/ie00054a045, 1991. a, b, c, d, e, f
Yu, A. B., Zou, R. P., and Standish, N.: Modifying the Linear Packing Model for Predicting the Porosity of Nonspherical Particle Mixtures, Ind. Eng. Chem. Res., 35, 3730–3741, https://doi.org/10.1021/ie950616a, 1996. a, b, c, d, e, f, g, h
Yu, A. B., Bridgwater, J., and Burbidge, A.: On the modelling of the packing of fine particles, Powder Technol., 92, 185–194, https://doi.org/10.1016/S0032-5910(97)03219-1, 1997. a, b, c, d, e, f
Yu, A. B., Feng, C. L., Zou, R. P., and Yang, R. Y.: On the relationship between porosity and interparticle forces, Powder Technol., 130, 70–76, https://doi.org/10.1016/S0032-5910(02)00228-0, 2003. a, b, c, d
Zhang, T., Zhang, C., Yang, Q., and Fu, R.: Inter-particle friction and particle sphericity effects on isotropic compression behavior in real-shaped sand assemblies, Comput. Geotech., 126, 103741, https://doi.org/10.1016/j.compgeo.2020.103741, 2020. a, b, c
Zhang, Z. F., Ward, A. L., and Keller, J. M.: Determining the Porosity and Saturated Hydraulic Conductivity of Binary Mixtures, Vadose Zone J., 10, 313–321, https://doi.org/10.2136/vzj2009.0138, 2011. a
Zhao, L., Luo, Z., Wang, Q., Du, J., Lu, W., and Ning, D.: A three-dimensional fluid-solid model, coupling high-rise building load and groundwater abstraction, for prediction of regional land subsidence, Hydrogeol. J., 27, 1515–1526, https://doi.org/10.1007/s10040-018-01920-x, 2019. a
Zhao, S., Zhang, N., Zhou, X., and Zhang, L.: Particle shape effects on fabric of granular random packing, Powder Technol., 310, 175–186, https://doi.org/10.1016/j.powtec.2016.12.094, 2017. a
Zou, R. P. and Yu, A. B.: The packing of spheres in a cylindrical container: the thickness effect, Chem. Eng. Sci., 50, 1504–1507, https://doi.org/10.1016/0009-2509(94)00483-8, 1995. a
Zou, R. P., Gan, M. L., and Yu, A. B.: Prediction of the porosity of multi-component mixtures of cohesive and non-cohesive particles, Chem. Eng. Sci., 66, 4711–4721, https://doi.org/10.1016/j.ces.2011.06.037, 2011. a, b, c, d, e, f, g
We corrected a mistake in the original work in Eq. (18) (Liu et al., 2019) in the fourth term, with , as can be verified by checking against the results for the ternary packing in Eqs. (13)–(15).
- Abstract
- Introduction
- Review of packing models
- Calibration of interaction parameters
- Application to packing with a narrow size range
- Extension and application to fluvial sediment packing
- Discussion
- Conclusions
- Appendix A: Details of packing models
- Appendix B: Binary versions of packing models
- Code and data availability
- Author contributions
- Competing interests
- Disclaimer
- Acknowledgements
- Financial support
- Review statement
- References