the Creative Commons Attribution 4.0 License.
the Creative Commons Attribution 4.0 License.
 | 21 Nov 2023
Numerical modelling of the evolution of a river reach with a complex morphology to help define future sustainable restoration decisions
Rabab Yassine
Ludovic Cassan
Hélène Roux
Olivier Frysou
François Pérès
The prediction of river morphology evolution is very complicated, especially in the case of mountain and Piedmont rivers with complex morphologies, steep slopes, and heterogeneous grain sizes. The Lac des Gaves (LDG) reach, located within the Gave de Pau River in the Hautes-Pyrénées department, France, has precisely the complex morphological characteristics mentioned above. This reach has gone through severe sediment extractions for over 50 years, leading to the construction of two weirs for riverbed stabilisation. Two large floods resulted in changes in the LDG's hydromorphological characteristics as it went from a single channel river section to a braided river reach. In this study, a 2D hydromorphological model is developed with the TELEMAC-MASCARET system to reproduce the evolution of the channel following a flood that occurred in 2018. The model's validity is assessed by comparing the simulated topographic evolution to the observed one. The results reveal the challenge to choose well-fitted sediment transport equations and friction laws that would make it possible to reproduce such complex morphology. Although the exact localisation of the multiple channels forming the braided nature of the LDG was challenging to reproduce, our model was able to provide reliable volumetric predictions as it reproduces the filling of the LDG correctly. The influence of the two weirs on the river's current and future morphology is also studied. The aim is to provide decision-makers with more reliable predictions to design suitable restoration measures for the LDG reach.
- Article
(19331 KB) - Full-text XML
- BibTeX
- EndNote


Flood events can lead to considerable sediment transport that has an influence on flow dynamics. Understanding the interactions between flow dynamics and morphological changes is thus of growing interest in the research community (Guan et al., 2015), especially in mountainous regions where the interactions between water and sediment are complex. Rickenmann et al. (2016) highlighted the critical influence of sediment transport during flood events in alpine catchments and the inherent damage. Reisenbüchler et al. (2019a) showed that morphodynamics can increase the flood intensity, leading to more dramatic consequences. This is particularly true in mountainous catchments where an important sediment supply from the upstream torrents and torrential rivers may expose the downstream fluvial system to great danger during flood episodes and increase the related damage (Reid et al., 2007; Badoux et al., 2014). For instance, channel conveyance capacity can decrease when consequent amounts of sediment are deposited within the riverbed, increasing river diversion risks toward surrounding areas (Badoux et al., 2014; Recking et al., 2012; Reid et al., 2007; Rickenmann et al., 2016; Rinaldi and Darby, 2007). Understanding sediment transport and especially bedload is thus essential for establishing a coherent flood control plan and defining sustainable restoration strategies (Kang and Yeo, 2015). Besides safety issues, bedload transport, combined with water discharge, is considered a fundamental driver of river morphodynamics and risks of overflowing. They can affect habitat, aquatic ecosystems, river stability, and natural hazards (Wohl et al., 2015).
River restoration for flood prevention purposes is generally related to achieving a sufficient degree of protection through the design of solutions ranging from the installation of physical infrastructures to alternative measures for risk reduction (Arnaud-Fassetta et al., 2009). Reliable numerical modelling of flow and sediment dynamics with good field expertise can be useful in this case for better river management. Numerical models can provide quantified answers regarding the configuration of flows during a flood event, which can be challenging to measure on the ground (Chapuis, 2012). Morphological models coupled to hydrodynamic ones (Reisenbüchler et al., 2019a) have now been applied to various rivers of different sizes and characteristics to examine the evolution of alluvial river channels (Carr et al., 2015; Guan et al., 2015, 2016; Ham and Church, 2012; Rinaldi and Darby, 2007; Tal and Paola, 2010; Tu et al., 2017; Ramirez et al., 2020). This means that the hydrodynamic model provides information on the turbulence, shear stress, and flow to the morphological model that uses it to compute sediment transport rates and bed elevation changes (i.e. erosion and deposition rates). Simultaneously, the morphological modifications have an influence on the hydrodynamic simulation. However, sediment transport rates are usually calculated with empirical equations (Meyer-Peter and Müller, 1948a; van Rijn, 1984a; Einstein, 1950; Wilcock and Crowe, 2003) mostly derived from laboratory experiments with numerous simplifications of real field conditions although more recent equations are partially based on field data (Recking, 2013a; Lefort, 2007). To have a physically realistic simulation, it is necessary to provide the model with realistic bedload transport rates to introduce reliable boundary conditions and physical modelling within the study area. In addition, the morphological processes occurring in the field are often simplified. This is why a field investigation and scientific monitoring before developing the model must be very well conducted to help the model operator criticise and improve its predictive abilities.
When the model is well calibrated and sufficiently validated with real field data, the main advantage of modelling is that it is possible to simulate restoration scenarios challenging to implement in the field (Arnaud, 2012). Two-dimensional (2D) numerical models are increasingly being used for flood modelling and river management in general. The majority of these models consider the resolution of shallow water equations (SWE) (Hervouet, 2003). As the impacts of morphological modifications on flow dynamics can be considerable, considering sediment transport is of primary importance when the purpose is to design sustainable restoration solutions. Morphodynamic simulations are thus required to represent bed evolution following the implementation of a restoration measure, especially in Piedmont rivers, where these factors can highly influence hydrodynamics. Numerical models allow for considering complex geometries with several channels and various sediment classes. For instance, they can provide information about the velocity and the suspended concentration of transported sediment, which has to be known for ecological purposes. They can estimate the timescale of erosion or deposition for flood impact forecasts. They can also evaluate morphological evolution in areas lacking expertise, for instance, close to hydraulic structures with a specific design.
The effects of the interactions between hydrodynamics and morphodynamics have proven to be particularly dramatic during the flood of 2013, an almost 100-year return period event that severely impacted the Gave de Pau catchment, especially the Lac des Gaves reach in the Hautes-Pyrénées department in France, named LDG here. This former artificial lake within the Gave de Pau riverbed, delimited by two weirs, has undergone years of sediment extractions. These activities have led to a robust hydromorphological imbalance that is disturbing the watercourse's normal functioning in this area. Since the flood of June 2013, the lake has been almost completely filled with sediment, which may lead to river diversion towards populated areas. Upstream the second weir, the Gave de Pau has precisely the complex morphological properties mentioned above. In this area, the river presents specific aspects of Piedmont rivers, characterised by very heterogeneous grain sizes and a complex braided morphology, which indicates considerable sediment delivery from the upstream catchments. Conversely, downstream the weir, an active channel shrinkage is observed, characteristic of a sediment deficit and a sediment discontinuity that has led to serious ecological damage and navigation problems.
The TELEMAC-MASCARET (http://www.opentelemac.org/, last access: 9 October 2023) modelling system has been considered well suited to perform 2D morphodynamic simulations on the LDG reach. Indeed, previous studies have shown that TELEMAC/Sisyphe was able to reproduce processes of erosion/deposition accurately in similar configurations (Reisenbüchler et al., 2020, 2019b; Cordier et al., 2019). Sisyphe enables the use of different transport equations (Meyer-Peter and Müller, 1948a; van Rijn, 1984b) and also takes into account various factors influencing sediment transport, such as the effect of the bed slope (Koch and Flokstra, 1981; Soulsby, 1997) on the magnitude of the bedload transport (Riesterer et al., 2016). It also offers the possibility to program other equations, both for the parameterisation of friction and for solid transport, a possibility which has been used here to introduce formulations more adapted to the context of mountain rivers. However, it is necessary to note that this type of calculation has been little explored on such complex morphologies specific to Piedmont rivers. Most simulations considering sediment transport with this model have been carried out in the laboratory or real case studies with lower slopes and/or simpler morphologies (Lepesqueur et al., 2019; Orseau et al., 2021). For braided morphodynamic modelling, the model performance can be provided by a specific indicator at the scale of the area of interest (Williams et al., 2013, 2016b, a; Rifai et al., 2014; Gonzales de Linares et al., 2021). Thus, it is interesting to evaluate the model's performance with such complex morphology.
The present work serves to illustrate (1) the ability of a 2D numerical model to reproduce hydromorphological processes in complex river morphology, (2) the performance of different friction laws and sediment transport equations, and (3) how a 2D hydromorphological model can help river managers better understand the dynamics within the LDG reach in order to evaluate the impacts of a given restoration measure on the system and adopt a sustainable and rational management orientation (De Linares, 2007).
The paper is organised as follows: Sect. 2 introduces the study site and its characteristics. Section 3 describes the model with an emphasis on the friction laws and bedload equation. Section 4 presents the methodology to implement the hydromorphological model on the LDG area as well as the performance evaluation. The results are detailed and analysed in Sect. 5, with special attention to the sensitivity of the simulated behaviour with respect to the friction laws and the bedload equation. The main findings are summarised in Sect. 7.
2.1 The Gave de Pau catchment
The Gave de Pau watershed (Fig. 1) is located in the western Pyrenees between the lowlands of Lourdes (420 m a.s.l.) and the Spanish border in the south, where the highest French Pyrenean peaks culminate (Vignemale 3298 m a.s.l., Taillon 3144 m a.s.l.). The Gave de Pau River originates in the well-known Cirque de Gavarnie around 2600 m a.s.l. (UNESCO World Heritage). The upstream part of the catchment has typical mountainous characteristics described by steep slopes, important sediment transport, high-water seasons observed between the end of spring and the beginning of summer, and a very dense hydrographic network. The two rivers constituting the Gave de Pau main stream are the Gave de Gavarnie (right bank) and the Gave de Cauterets (left bank). In high flow seasons, these two watercourses showed that they could transport significant amounts of sediment. They are thus considered as the primary sources of sediment coming from the upstream part of the catchment and deposited in the downstream central valley of Argelès-Gazost, where the LDG and most of the stakes are located (Fig. 2).
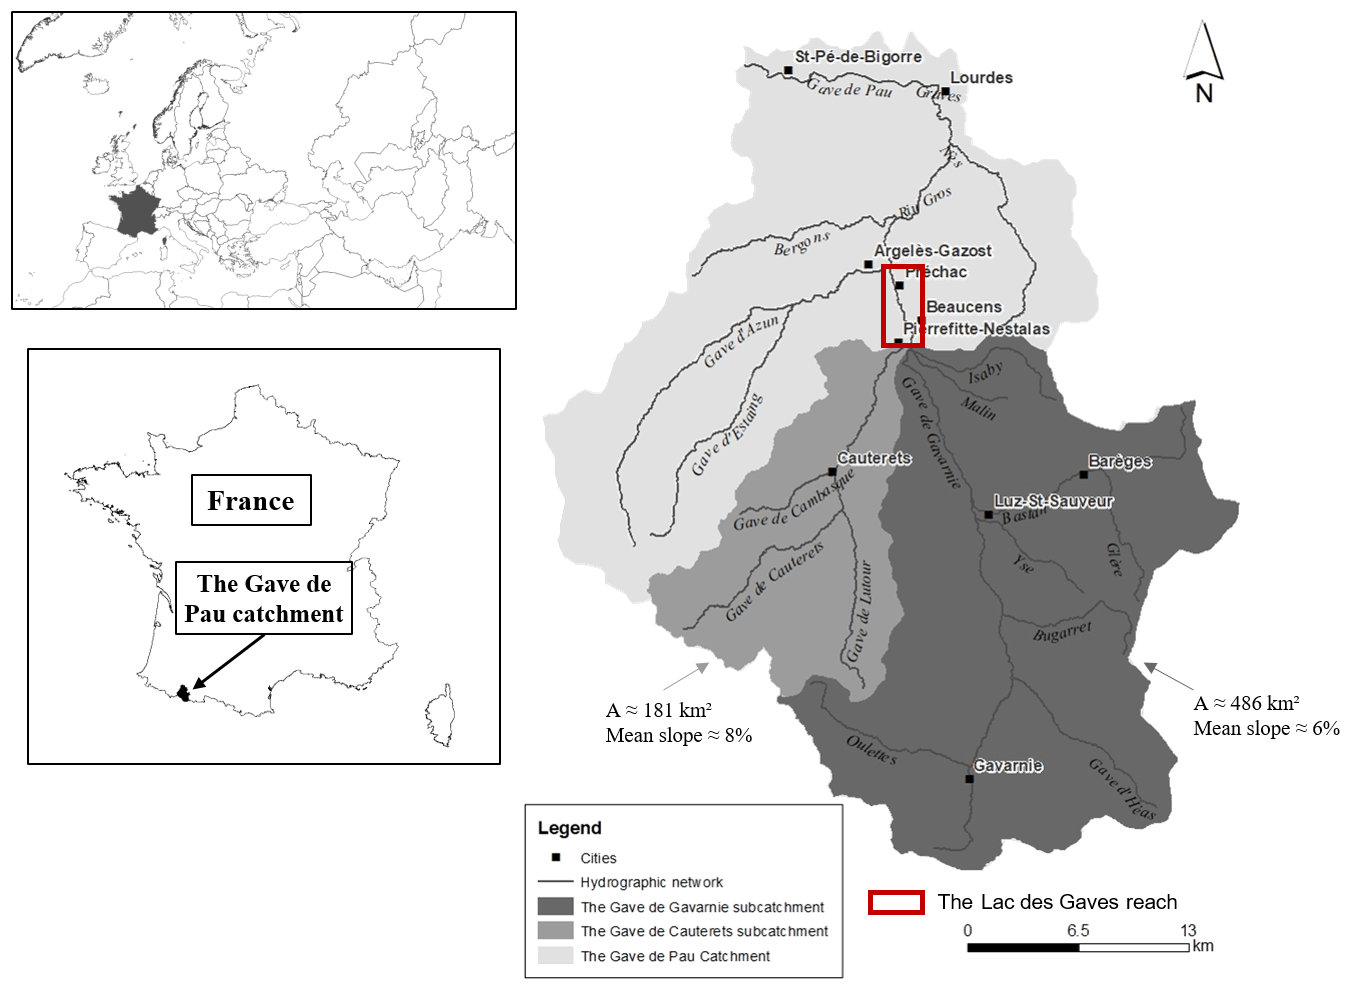
Figure 1The Gave de Pau catchment and its main upstream sub-catchments: the Gave de Cauterets and the Gave de Gavarnie sub-catchments (A is the drainage area and the mean slope of the watercourses is also introduced). The LDG reach is represented by the red rectangle between the cities of Pierrefitte-Nestalas and Argelès-Gazost, Hautes-Pyrénées, France.
2.1.1 The Gave de Cauterets subcatchment
The Gave de Cauterets subcatchment has a compact shape and besides the Cambasque (left bank) and Lutour (right bank) rivers, its other tributaries are very small and they have a typical torrent morphology with very steep slopes. The main valley and its tributary valleys have a south–north orientation. In these conditions, we may expect a simultaneous hydrological functioning of its main tributaries in case of widespread precipitation and thus a rapid concentration of overland flow as soon as we reach the city of Cauterets. From the Spanish border (south), where its main tributaries originate, to its outlet, the drainage slope is rarely below 2 %, and it reaches its maximum in the gorges areas. The mean elevation of the watershed is above 2000 m a.s.l. and two-thirds of its surface is between 1500 and 2500 m a.s.l.
2.1.2 The Gave de Gavarnie subcatchment
Before its junction with the Gave de Cauterets, the Gave de Gavarnie drains a very wide catchment, whose area is approximately 486 km2. From its origin (Cirque of Gavarnie) to its outlet, its main stream is supplied by active torrents (the Gave d'Héas: 75 km2, the Yse torrent: 13.5 km2, and the Bastan torrent: 100 km2). The Bastan torrent was the tributary that showed the most impressive sediment transport activity during the flood of 2013. Today, it is considered the main contributor in terms of sediment supply to the Gave de Gavarnie and even the downstream valley.
As for the Gave de Cauterets and its main tributaries, the Gave de Gavarnie valley has a south–north orientation. Unlike the Gave de Cauterets catchment with its compact morphology, the Gave de Gavarnie watershed is wider and the supplies of its main tributaries are gradually distributed from upstream to downstream. It is thus very probable that these physiographic factors condition an uneven distribution of precipitation at the catchment scale. During rainy events, we may expect contrasted repartitions from one tributary to another. Therefore, different hydrological situations may sometimes lead to the same discharge and volume at the outlet. The main morphometric characteristics of each subcatchment are presented in Table 1. Catchment characteristics were obtained thanks to a GIS analysis of several spatial local databases (BD ORTHO®, BD ALTI®, Corine Land Cover®, IGN®).
Table 1Main characteristics of the Gave de Cauterets and the Gave de Gavarnie subcatchments.
2.2 The LDG reach
The LDG (Fig. 2) is an artificial lake located in the main stream of the Gave de Pau River. Like many rivers and lakes worldwide, it has gone through very intensive sediment extractions, estimated to be around 4×10⁶ m−3 over the past century. These activities led to constructing two weirs, one upstream and one downstream of the lake, to stabilise the riverbed. The large flood of 2013 highlighted a critical number of impairments at the catchment scale, especially within this reach. It showed that the lake is now acting like a sediment trap, blocking all sediment coming from upstream mountain streams. An extreme longitudinal profile discontinuity is observed and leads to an increased risk of river diversion towards populated areas, destruction of hydraulic structures’ foundations, shrinkage of the active channel, and a global incision (more than 3 m), to name a few. This is mainly due to the LDG reach position, which is located immediately after the junction of the two mountain streams presented above.
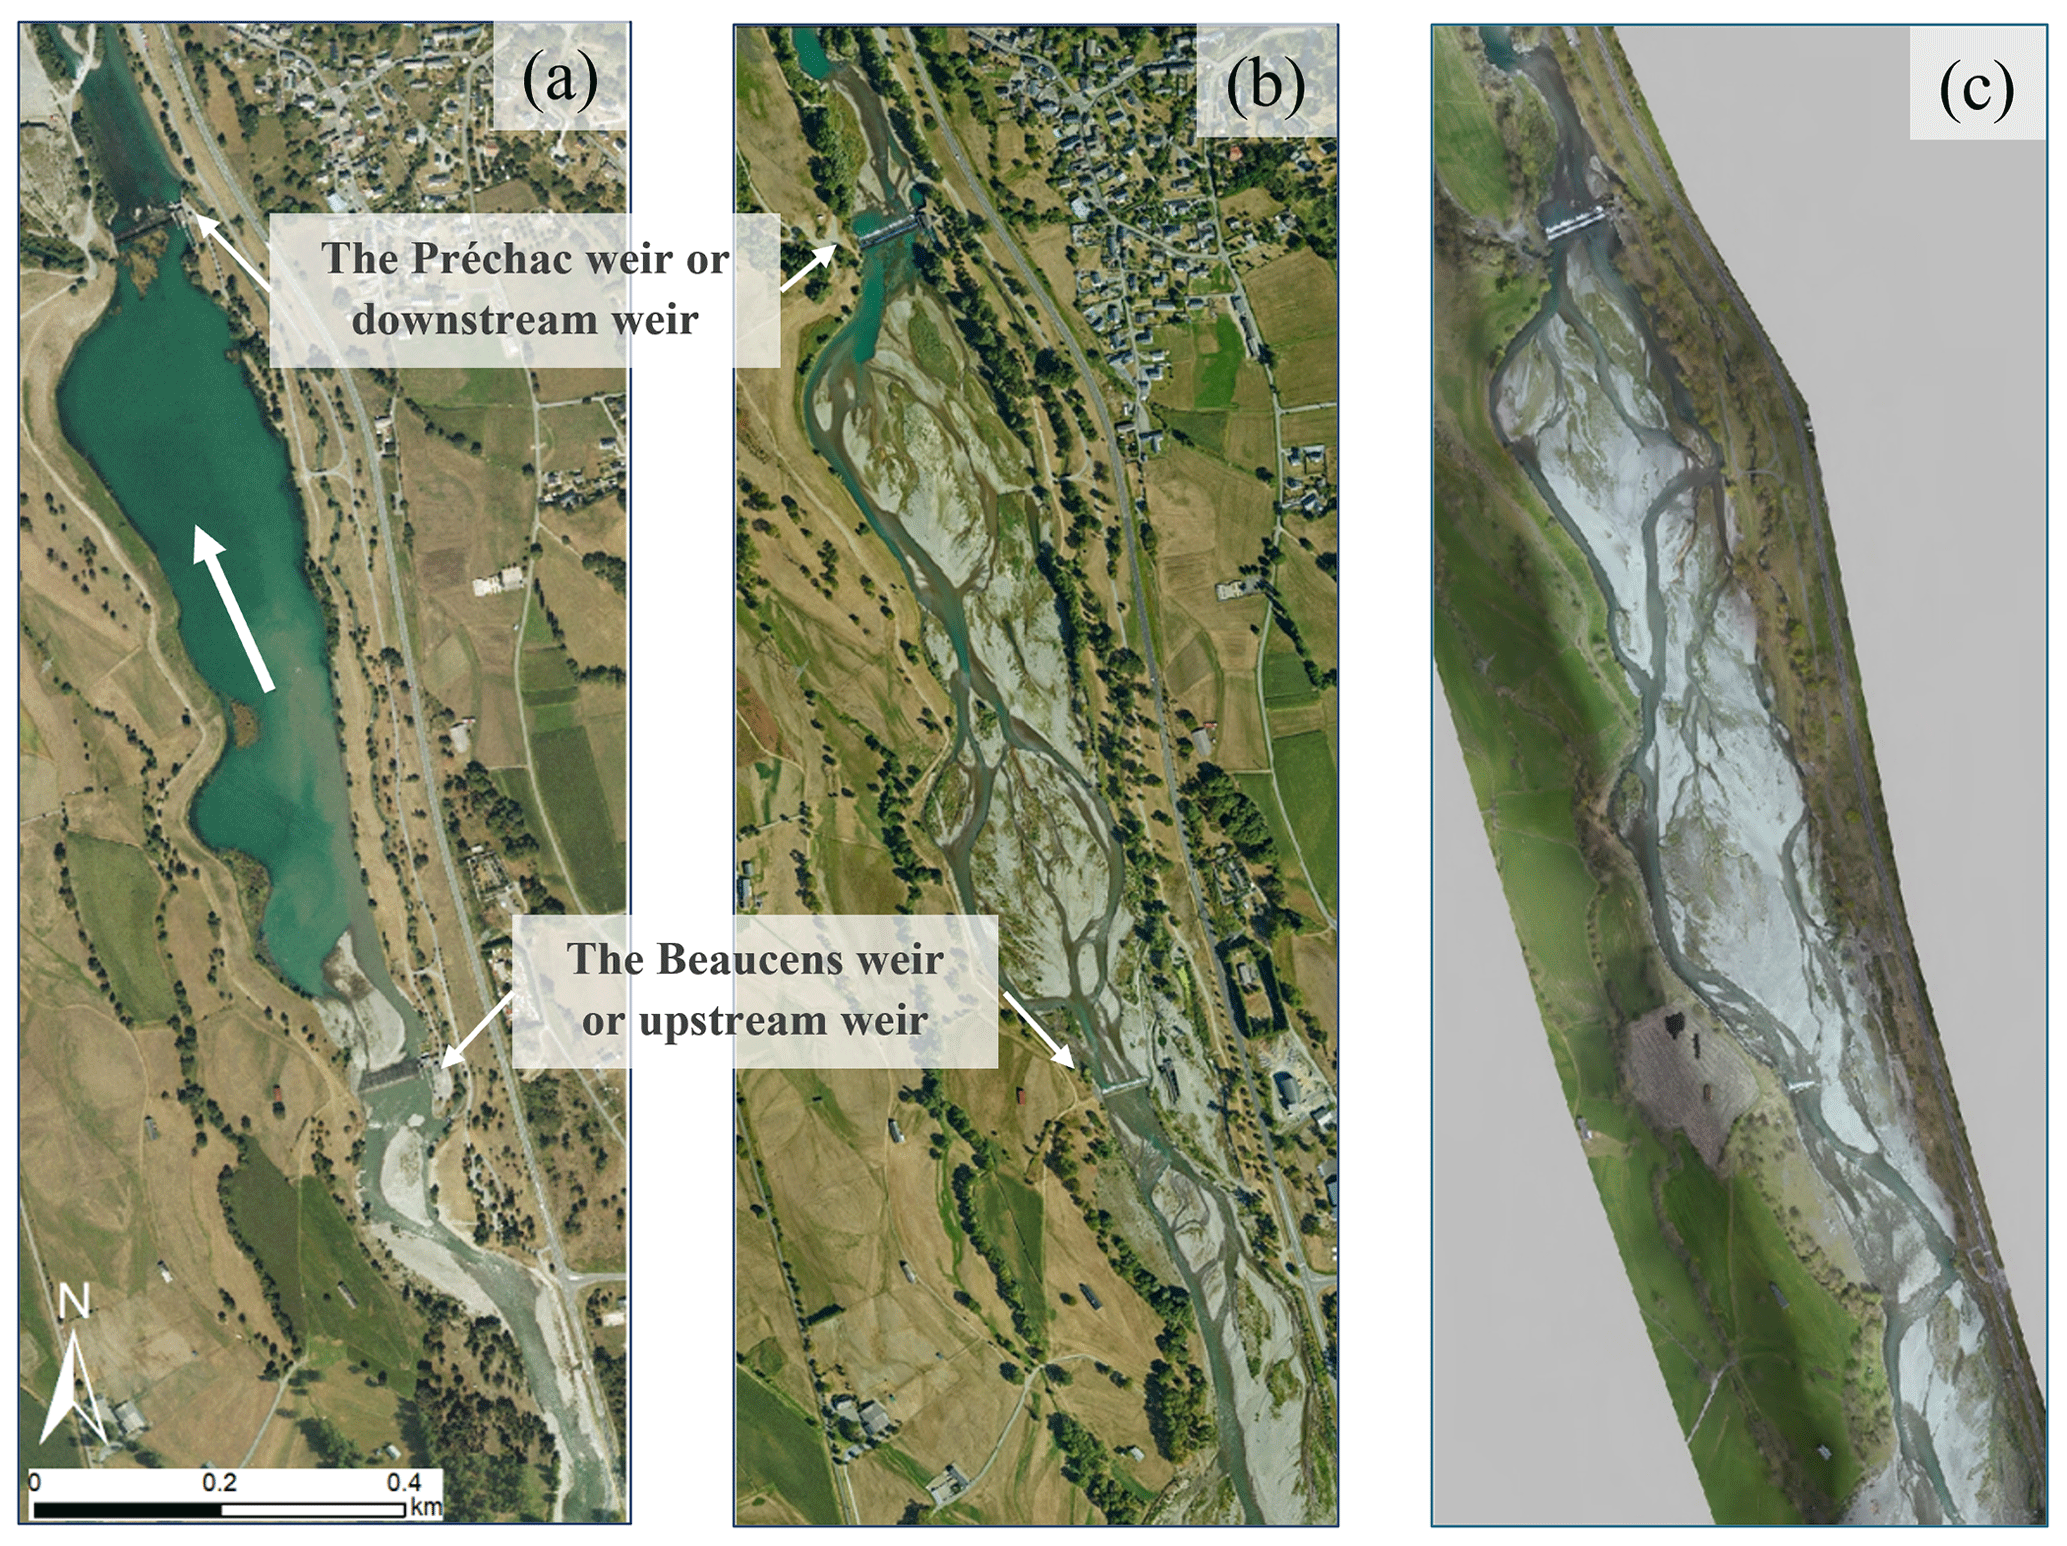
Figure 2Morphological changes observed in the LDG reach. Aerial photo in (a) 2006, (b) 2016 after the flood of June 2013, and (c) 2019 after the flood of June 2018 (source: IGN BD ORTHO, PLVG).
2.3 Flood events
Like several research (Blanpied, 2019) and engineering projects (IDEALP, 2014; PLVG, 2015; SUEZ Consulting, 2019), this work was initiated by the exceptional flood of June 2013, which had a very strong impact on the entire central Pyrenees. This extreme event was caused by heavy rainfall combined with rapid and abundant snowmelt due to an extreme increase in temperature after a very cold spring. The peak discharge was estimated to be about 742 m3 s−1 in Lourdes, corresponding to a 100-year return period flood compared to the monthly averaged discharge of 90 m3 s−1 (DREAL Midi-Pyrénées, 2013; PLVG, 2015). Besides the two casualties and the catastrophic material damage estimated at nearly EUR 300 million, this event has demonstrated the major influence of sediment transport in the hydromorphological dynamic of the catchment’s streams. In fact, the extreme hydrology combined with a very high rate of sediment delivery from the upstream catchments exposed the downstream fluvial system to great danger in terms of very important sediment deposition, serious bank erosion that caused the collapse of roads and buildings, destruction of hydraulic structures’ foundations, and significant ecological damage (Fig. 3).
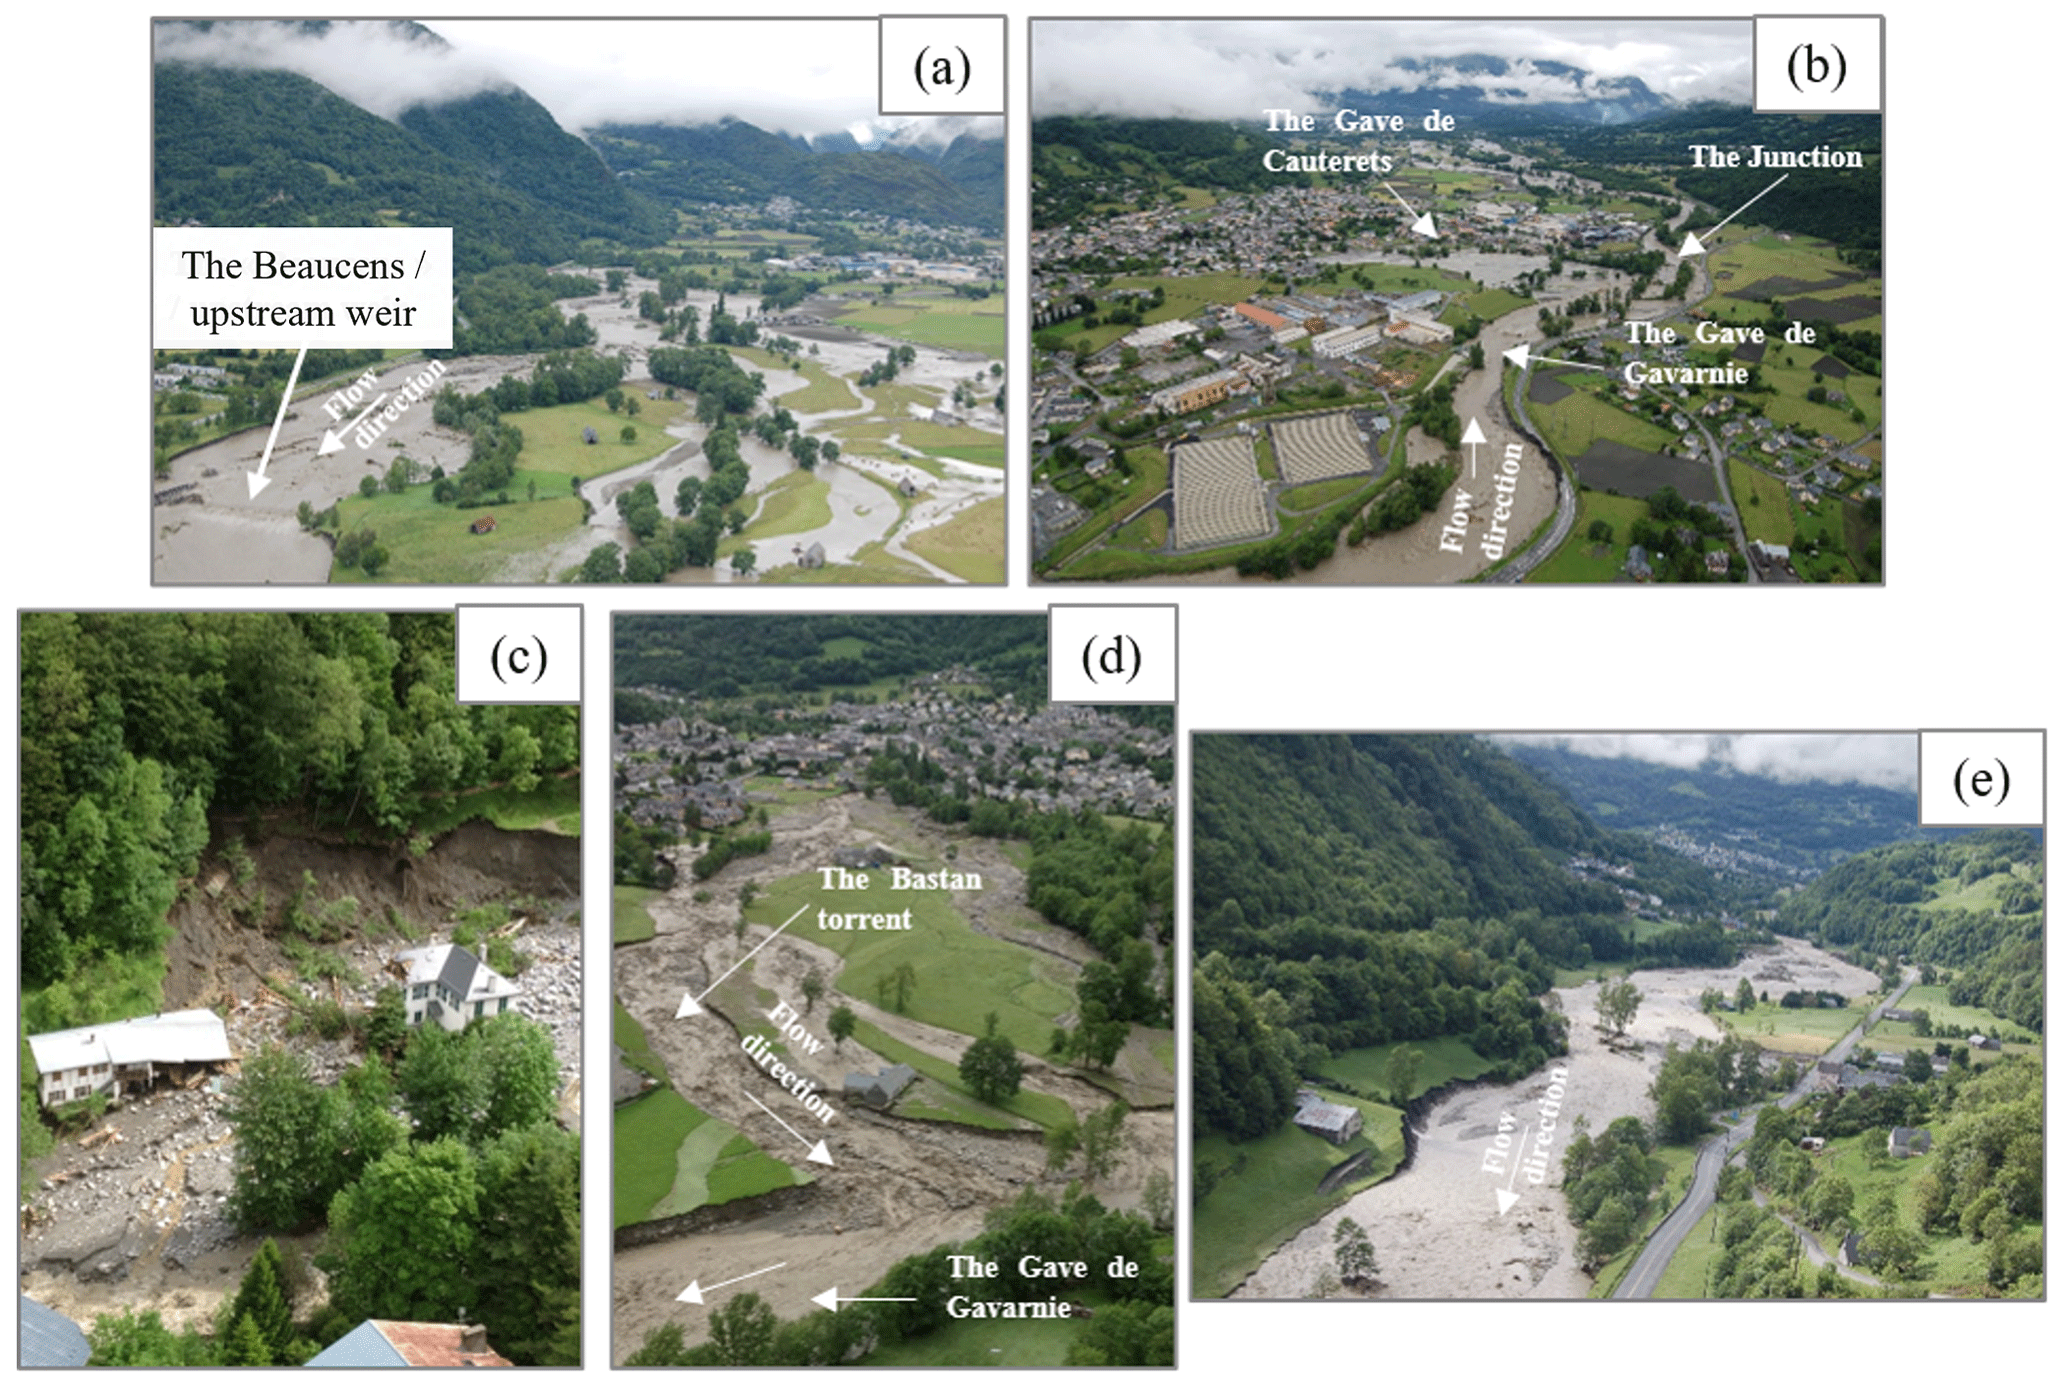
Figure 3Some examples of damage caused by the flood of June 2013 at different locations and different streams. (a) The upstream part of LDG reach during the flood; this photo illustrates the river avulsion that occurred; the riverbed created a few channels in the Adast plain: left bank (upstream (south) view) (DDT65 and PLVG). (b) The Gave de Gavarnie and Gave de Cauterets at their junction. During the event, the erosion of the Gave de Gavarnie right bank destroyed the main access road, and the villages of Pierrefitte and Soulom were flooded by the Gave de Cauterets (DDT65 and PLVG). (c) Significant erosion and destruction of buildings located in the Gave de Cauterets active channel (RTM65). (d) The Bastan torrent and the Gave de Gavarnie at their junction; this photo illustrates the important morphological activities that occurred during the flood at this location (RTM65). (e) The Gave de Gavarnie at the Saligos plain immediately after its junction with the Bastan torrent. Significant bank erosion is observed in this area (DDT65 and PLVG).
During this event, the LDG acted like a sediment trap as it intercepted almost all sediment coming from the upstream catchments (Figs. 2 and 4). Its morphology completely changed as it went from a lake/single-channel river section to a braided river reach. Five years after the flood of June 2013, another highly morphogenetic, but of lesser magnitude, flood occurred in June 2018. The peak discharge was estimated to be about 332 m3 s−1, corresponding to a 10-year return period. Even if the damage is not comparable to that caused by the flood of 2013, the 2018 flood event greatly impacted the morphology of all the watercourses of the Gave de Pau catchment and exacerbated the filling phenomenon in the LDG. Today, the lake is almost completely filled, and avulsion risks are observed as the left bank elevation is lower than the bed elevation.
2.4 Restoration implications
To re-establish the natural flow, reduce flood risks, and restore ecological continuity, river managers are considering lowering or even suppressing the weirs. However, even if these restoration measures seem to be relevant over the long term, many hydromorphological and ecological effects might emerge, such as backward erosion, over-delivery of sediment to the downstream fluvial system, to name a few (Malavoi et al., 2011). In addition, due to mining activities over almost 3 decades (1941–1969) immediately upstream the LDG reach, there are still many excavations and waste on the former plot that could, in some instances, be dangerous from a human or environmental point of view. Today, these metallic residues (zinc, mercury, lead, arsenic) are suspected of accumulating in living beings (fish, mosses, invertebrates) or fixed in the fine fraction of the alluvial stock (clay- and silt-type sediments). Most of these sediments are now suspected to be stored in the LDG, located approximately 5 km downstream from the former mining site. Thus, depending on which restoration measure is selected, this information must be considered alongside the risks of contamination of the downstream area.
A hydromorphological 2D model was developed at the LDG reach scale to understand the different morphological processes within this channel and help river managers make an informed decision on the restoration of this reach. One of the processes on which the modelling efforts will focus is the deposition phenomenon within the LDG as it represents the potential volumes that might be mobilised if the weir-lowering/removal restoration measure is considered.
The system TELEMAC-MASCARET is considered for the numerical simulations. TELEMAC-MASCARET is an open-source software package with numerous modules to compute free surface flows, sediment transport, swell, and water quality (Hervouet, 2003). Among these modules, we selected the ones related to hydrodynamic and morphodynamic processes: TELEMAC2D and SISYPHE. In this section, the hydrodynamic module is introduced as well as its morphodynamic module SISYPHE. Then its application to the study area is presented. Finally, the model's performance will be assessed, and we will conclude on the difficulties encountered while performing the simulation on such complex morphology.
3.1 Hydrodynamic module
The hydrodynamic module, TELEMAC2D, solves shallow water equations (SWE) simultaneously (de Saint-Venant, 1871) (Eq. 1).
where t [s] is the time, , is the gradient vector field, g=9.81 m s−2 the gravitational acceleration, h [m] is the water depth, [m s−1] is the depth-averaged flow velocity vector with u and v [m s−1] the components along the longitudinal x axis and transversal y axis direction respectively, with {u} [m s−1] the module of u, and vt [m2 s−1] is the turbulent eddy viscosity term.
The TELEMAC model treats turbulence from a diffusion term. Four options are available and they were all tested in the framework of the study.
-
Constant viscosity model: the associated coefficient represents molecular viscosity, turbulent viscosity, and dispersion.
-
Elder model: this takes into account the dispersion by assuming that the vertical profiles of the velocities are logarithmic.
-
k–ϵ model: this solves the transport equations for k (the turbulent energy) and ϵ (turbulent dissipation). The latter is known to be more expensive in terms of computational time and requires a finer mesh compared to the other models.
-
Smagorinsky model: this is generally used for maritime domains with large-scale fluctuation phenomena.
3.2 Sediment transport and bed elevation change module
The morphodynamic module is based on the Exner (1920) equation (Eq. 2), which can be coupled with the equation of the hydrodynamic module:
where n is the non-cohesive bed porosity [–], Zf [m] corresponds to the river bottom elevation, and Qs [m2 s−1] is the bedload rate per unit width. Further information on this module can be found in Tassi and Villaret (2014).
3.2.1 Friction laws
Two friction laws were considered: the widely known Manning–Strickler (1923) equation (Eq. 4) and the Ferguson (2007) equation. The Ferguson (2007) friction law has been proposed to ensure the transition between a uniform profile related to relative shallow depths and larger relative water depths, whereas the Manning–Strickler equation is better suited for larger relative depths. This equation of Ferguson (2007) has been tested on a wide range of data and has proved to be efficient to cover all hydraulic configurations encountered from headwaters to lowland rivers. It is expressed as follows (Eq. 3):
with S [m m−1] the riverbed slope, D84 [m] the diameter for which 84% of sediments are finer, Rh (m) the hydraulic radius, U [m s−1] the mean flow velocity, and g [9.81 m s−2] the gravitational acceleration. The Ferguson law uses D84 as a proxy of bed roughness (Ferguson, 2007).
The Manning–Strickler friction law can be expressed as follows (Eq. 4):
with U [m s−1] the mean flow velocity, S [m m−1] the riverbed slope, Rh [m] the hydraulic radius, and K [m s−1] the friction coefficient.
3.2.2 Bedload transport equations
The morphodynamic module SISYPHE considers several semi-empirical sediment transport equations (Tassi and Villaret, 2014). The module also allows one to code an equation if it is not included. In our case, we considered two bedload transport equations: the Meyer-Peter and Müller (1948a) equation (Eq. 5) and the Recking (2013b) equation (Eq. 6).
The Meyer-Peter–Müller equation
The Meyer-Peter–Müller equation is a threshold equation and its original formulation considers a critical Shields parameter equal to 0.047. A sensitivity analysis was performed on this parameter as its value can highly influence sediment transport. The equation is written as follows (Eq. 5):
Φ is the dimensionless solid transport, calculated as with qsv [m3 s−1 m−1] the unit solid volume transport: with Qsv [m3 s−1] the solid volume flow rate, W [m] the river width, ρs [kg m−3] the density of the sediments, ρ [kg m−3] the density of water, g the gravity acceleration, and D [m] the grain diameter. is the ratio between the flow Strickler coefficient K and the grain roughness coefficient K′. This term makes it possible to correct the total constraint in order to take into account only the grain shear stress. K is given by , and according to Meyer-Peter and Müller (1948a) the grain roughness coefficient can be estimated as a function of the grain-size distribution , with D90 the diameter at about 90 % by weight of the grains [m]. τ* [–] is the Shield number, calculated as with τ [N m−2] the shear stress.
This formulation is primarily based of laboratory experimentation with uniform and non-uniform sediments. It is one of the most used equations when it comes to studying a river or a laboratory case study with a heterogeneous grain size. This characteristic makes it adapted to the LDG reach. However, the fact that it is only calibrated with laboratory measurements can lead to non-realistic results with in situ input data. In addition, the Meyer-Peter–Müller equation is an excess shear relationship, and its original formulation considers a critical Shields parameter equal to 0.047 as a threshold for characterising the incipient motion of bed grains.
The Recking equation
This non-threshold equation results from the work of Recking (2010, 2013b) and Recking et al. (2016). We used the version of this equation compatible with 2D calculation and local data (Recking et al., 2016). It can be written as follows (Eq. 6):
[–] is a dimensionless bedload discharge, qb [kg s−1 m−1] is the unit bedload discharge per unit width, is the specific gravity, and g the gravity acceleration. [–] is the Shield number, calculated from the diameter D84: with τ [N m−2] the shear stress. Here the calculations were made using D84 as the grain diameter. The parameter is a mobility term that defines the transition between partial transport () and full mobility () (Recking et al., 2016). The Recking equation was calibrated on field data () and laboratory data (). It is the value of that gives its shape to the model. Therefore the value of strongly impacts the result, and its determination is difficult, especially for mountain streams. Ideally, it should be based on measurements. Failing that, the available data suggest that an estimate is possible using Eq. (7) (Recking et al., 2016).
The Recking equation was coded in the subroutine “qsform.f” as it was not available among the proposed sediment transport equation in the SISYPHE module. The main advantages of this formulation are that (Gonzales De Linares et al., 2020)
-
it considers partial transport,
-
it has been developed based on field data, which makes it adapted to cross-section-averaged calculations,
-
it has been validated with a wide data set for different independent watercourses, and
-
it is adapted to mountain and Piedmont rivers with steep slopes and coarse grain size.
A model was developed at the LDG's reach scale to reproduce the hydrodynamic and morphodynamic processes that occurred during the 10-year return flood of June 2018. In fact, it was the only event for which we had the before and after topo-bathymetric data, necessary to check the model's ability to reproduce the observed bed evolution modifications. The followed methodology considered field data collection for the model's development and performance evaluation, the model generation, the selection of a relevant hydrodynamic model, after which a clear hydrodynamic calibration with a fixed bed to select the riverbed roughness was performed, to finally run the morphodynamic model with the two different bedload transport equations.
4.1 Input data
4.1.1 Field data
The model starts at the junction of the Gave de Gavarnie and the Gave de Cauterets and extends up to the weir of the municipality of Agos-Vidalos (Fig. 5). The available field data for the model's implementation are as follows.
-
A lidar digital elevation model (DEM) surveyed in 2016: the planimetric resolution is 1 m and the Z precision is 1 cm.
-
A lidar DEM surveyed in 2019 a few months after the flood of June 2018.
-
Dredging data (SHEM) provided by the former operators of the weirs: these data give information on the possible bedload fraction that fills the LDG. Unfortunately, no grain-size distribution was available.
-
Grain-size data, collected on the ground over four sediment bars along the considered river reach. The value of the sediment diameter is directly obtained thanks to these grain-size measurements: the hydro-morphodynamic computations considered only D50=50 mm for the Meyer-Peter–Müller (MPM) equation and D84=163 mm for the Ferguson and the Recking equations. These data were collected thanks to the Wolman (1954) sampling technique, upstream the Beaucens weir. C4 and G3 are the grain-size distributions on the Gave de Cauterets and the Gave de Gavarnie, upstream tributaries of the Gave de Pau.
-
Hydraulic data representing water levels surveyed during the recession time of the 2018 flood event.
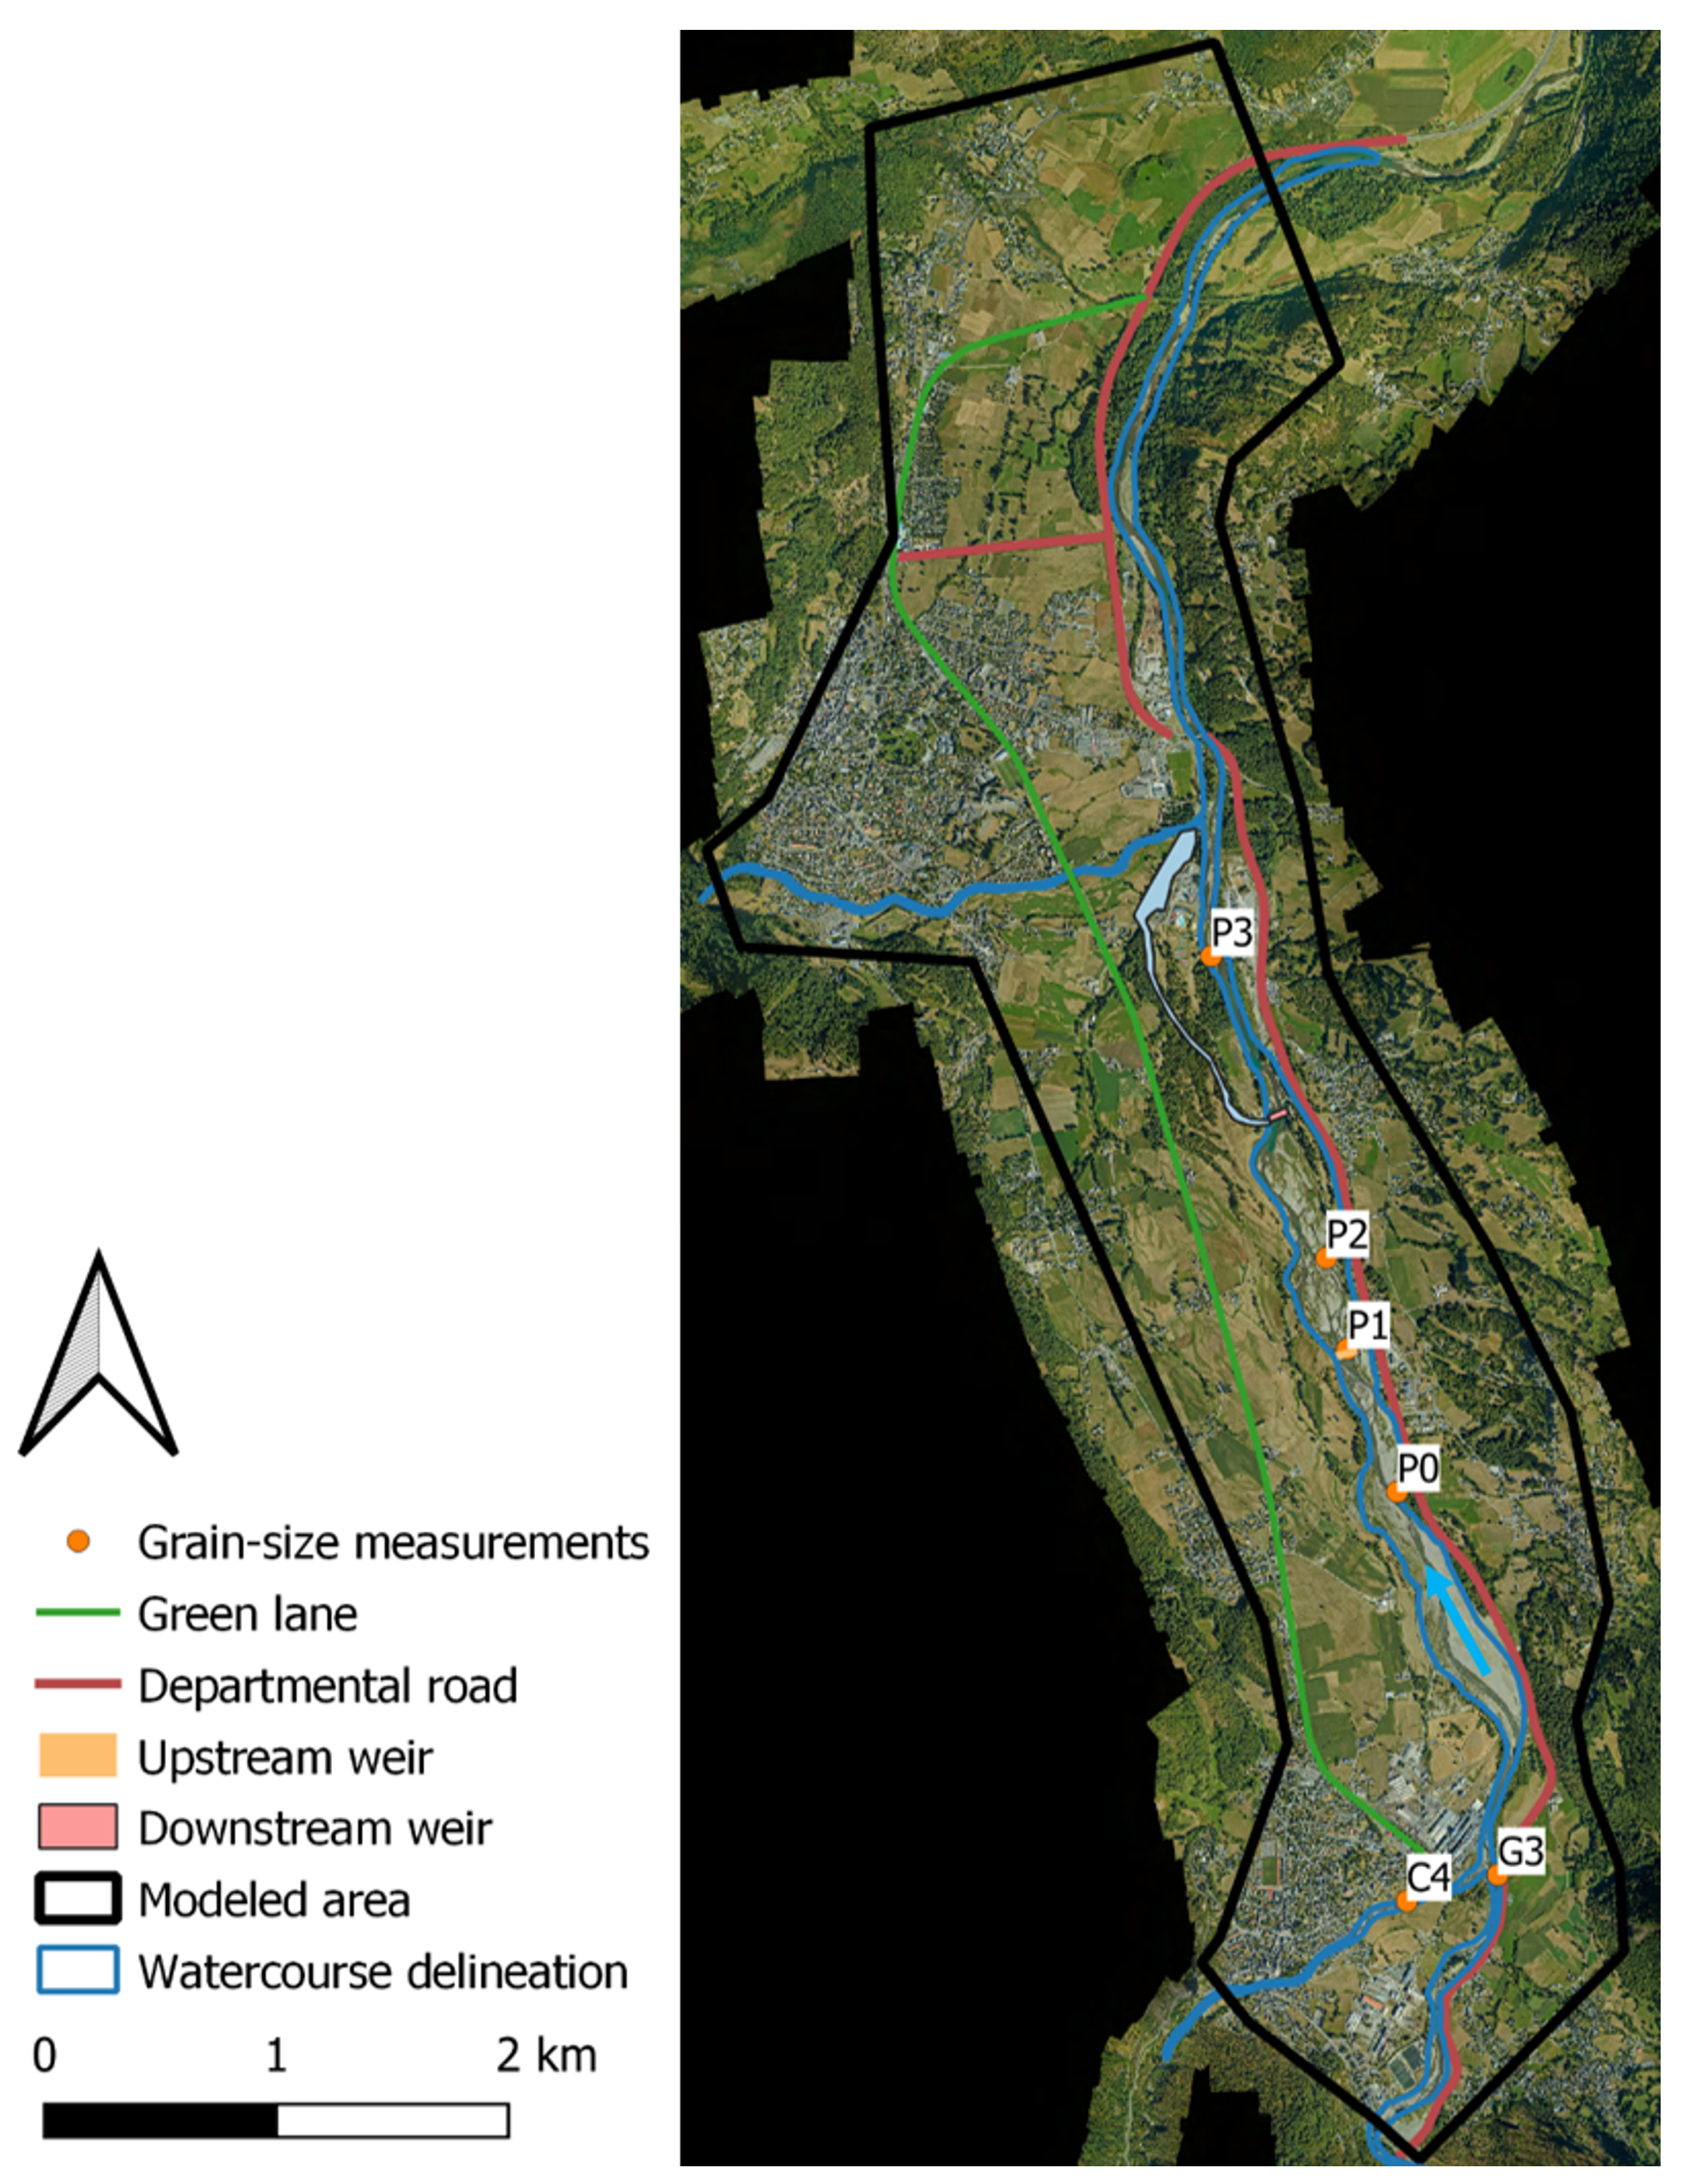
Figure 5Overview of the considered area for hydromorphological modelling and identification of the different areas of interest.
It is common to use sediment trap dredging data to estimate event-driven sediment transport in mountainous catchments as its measurement can be complicated in such flow conditions (Liébault et al., 2010). It appears that the LDG seems to have similar behaviour, even if it was not designed for this purpose. However, the recorded volumes represent both very fine sediment probably transported by suspension and very coarse sediment via bedload transport. Coarse sediment dredging data over 11 years were also collected upstream the first weir by the former hydropower operators and were used to estimate the bedload volume. This bedload volume is estimated to represent between 8 % and 16 % of the total transport, which is coherent with the feedback from the literature on similar configurations (Misset et al., 2020) and will allow for differentiating bedload from suspended load. This range of variation will be considered to compare simulated deposited volumes to observed ones.
4.1.2 Input hydrograph
The input discharges were generated by the physically based distributed hydrological model MARINE (Roux et al., 2011; Douinot et al., 2018; Roux et al., 2020) developed at the catchment scale. The data used for implementing the MARINE model include rainfall (source: Météo-France), topography (source: IGN), soil properties (source: INRA), land use (source: CORINE Land Cover), and event discharge (source: HydroEau France (DREAL) and EDF). The model is structured in three main modules. The first module separates precipitation into surface runoff and infiltration, the second represents subsurface runoff, and the last one represents surface runoff on hillslopes and in the drainage network. This last module is based on a transfer function that allows for the routing of excess precipitation to the watershed outlet through the use of the kinematic wave approximation of the Saint-Venant equations. The spatial discretisation of the catchment area is done using the grid resolution of the DEM.
The MARINE model is capable of simulating flood hydrographs at any point in the drainage network, which is a real advantage in the accurate approximation of the inputs to the Lac des Gaves system. Thus, three hydrographs were extracted for the big mesh (Fig. 6, left) for the three tributaries (the Gave de Cauterets, the Gave de Gavarnie, and the Gave d'Azun) and one was extracted for the smaller mesh (Fig. 6, right). The details about the two different meshes used for 2D hydromorphological simulations are presented in the following section. The MARINE model has been calibrated based on the available observed discharges at three stations: the Gave de Cauterets, the Gave de Gavarnie, and the Gave de Pau after the confluence with the Gave d'Azun. Six events extracted from these observed time series allowed for calibrating the model with good confidence.
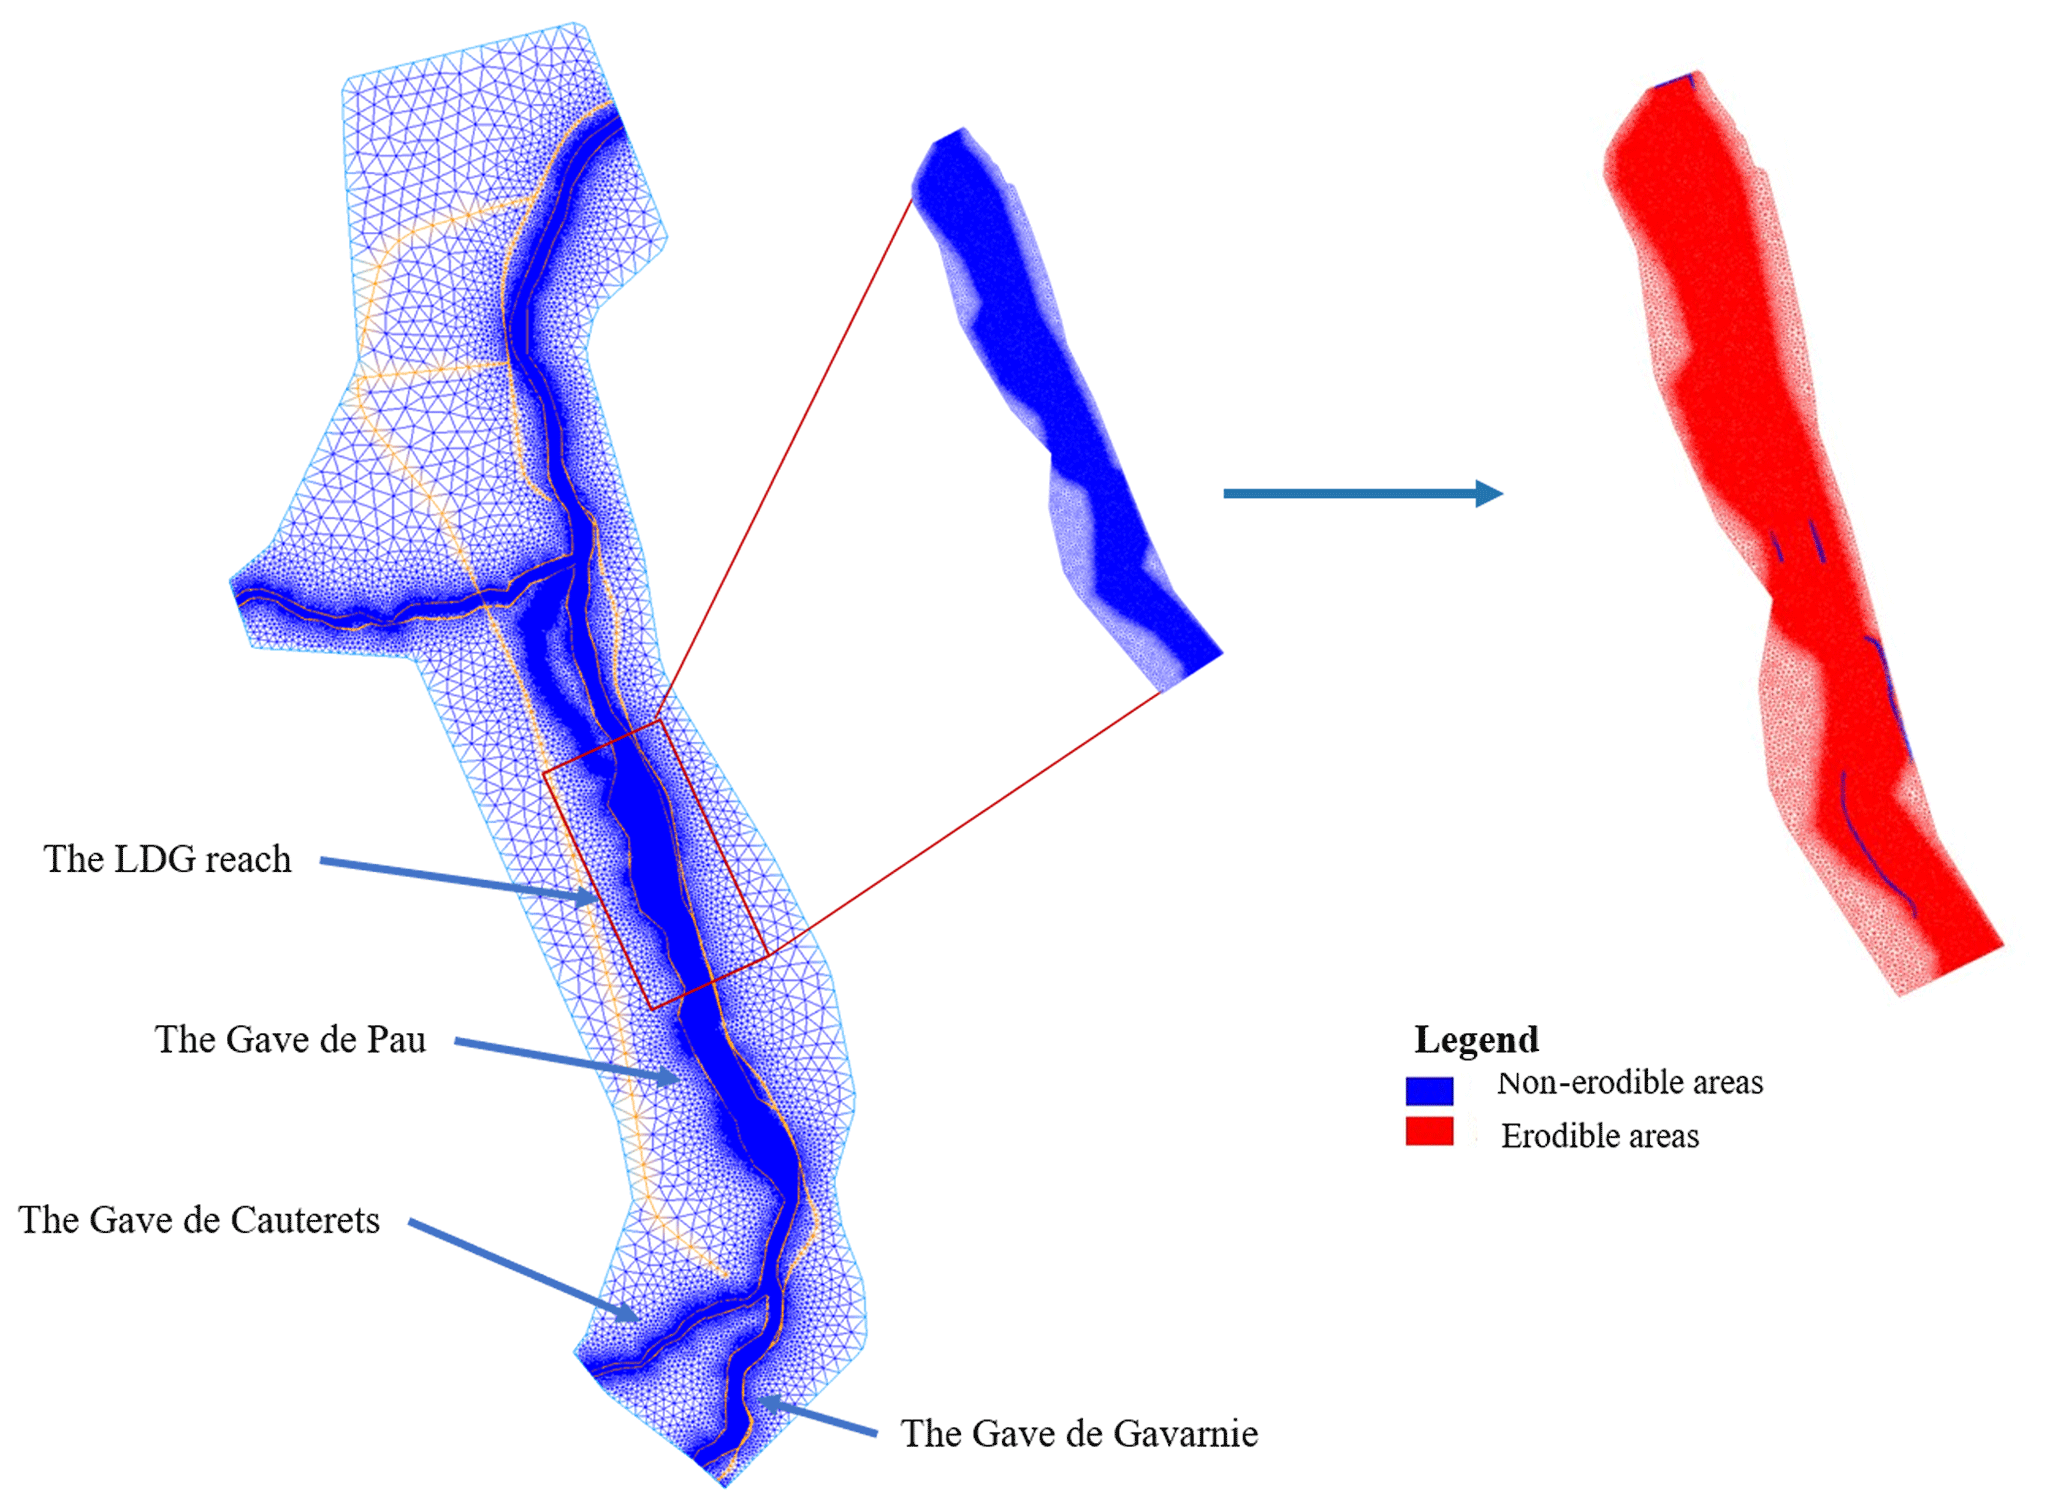
Figure 6Considered meshes for the hydromorphological modelling. The orange lines represent soft lines corresponding to roads or river banks where we force the mesher to pass through.
4.2 Model setup
4.2.1 Mesh generation
We built unstructured triangulated meshes using the software BlueKenue (http://www.nrc-cnrc.gc.ca/fra/solutions/consultatifs/blue kenue index.html, last access: 18 September 2023). Sediment transport modelling is very sensitive to mesh size. Thus, two approaches were considered to create the meshes (Fig. 6).
-
An 8 km long unstructured triangulated mesh that covers the whole study area (355 062 elements) was built. The mesh size is 3 m within the watercourse, 2 m in the fishery water intake area, and 100 m in the floodplain.
-
A finer, 2 km long mesh in the LDG area around the two weirs (201 569 elements) was built. The mesh size for this smaller domain is 1 m in the riverbed, 2 m in the fishery water intake, and 20 m in the floodplain.
The finer mesh covers a much smaller area. Indeed, the computational cost with such a fine mesh on the whole domain would have been too high, so the finer mesh is used to perform a less time-consuming fine analysis of the sediment transport behaviour around the area of interest: the LDG between the two weirs. The obtained results with this small mesh allowed us to pick the best performing parameters for the whole domain with which we only simulated restoration scenarios, resulting in a substantial saving of time. To represent the anthropogenic structures along the river, fixed embankments, weirs and rip-raps were considered as non-erodible (blue in Fig. 6) in the context of sediment transport computations. The simulations with both meshes considered sediment transport.
4.2.2 Boundary conditions
For the mesh representing the entire study area, four boundary conditions were defined. Upstream, discharges are set as an input for the Gave de Gavarnie and Gave de Cauterets branches and the Gave d'Azun branch downstream the LDG. The downstream boundary condition is a free surface elevation determined by a rating curve calculated with a weir law (Eq. 8) respecting the characteristics of the Agos-Vidalos weir:
with L [m] the spillway width, g [m s−2] the gravitation acceleration, h [m a.s.l.] the free surface elevation, and Zweir [m a.s.l.] the weir elevation.
As for the sediment transport boundary conditions, we first attempted to prescribe solid discharges estimated thanks to the 2018 hydrograph and the Recking (2013a) equation as no bedload measurements were available for this event. Unfortunately, this generated many instabilities around the upstream boundary that led to aberrant erosion and sediment deposition, extremely high and localised on only one or two cells around the upstream boundary. To overcome this limitation, a morphological equilibrium condition is set at the inlet (Tassi and Villaret, 2014). At this location, the bed slope is 0.018 m m−1 (Fig. 6). The particularity of this boundary condition is that it delivers sufficient bedload at the model inlet to keep the riverbed elevation at the inlet cross section constant in time. It has been assumed that the upstream boundary condition on solid discharge has low influence in the area of interest which is the Lac des Gaves: the upstream condition is located sufficiently far from it to reduce its influence. This is a relatively good assumption for the flood event of 2018 for which little material seems to have come from upstream the area of interest.
For the smaller mesh, two boundary conditions were defined. The 2018 flow hydrograph for the Gave de Pau River is set as an input upstream. The downstream boundary condition is a free surface elevation estimated with the same weir law presented above (Eq. 8), this time respecting the characteristics of the Préchac weir.
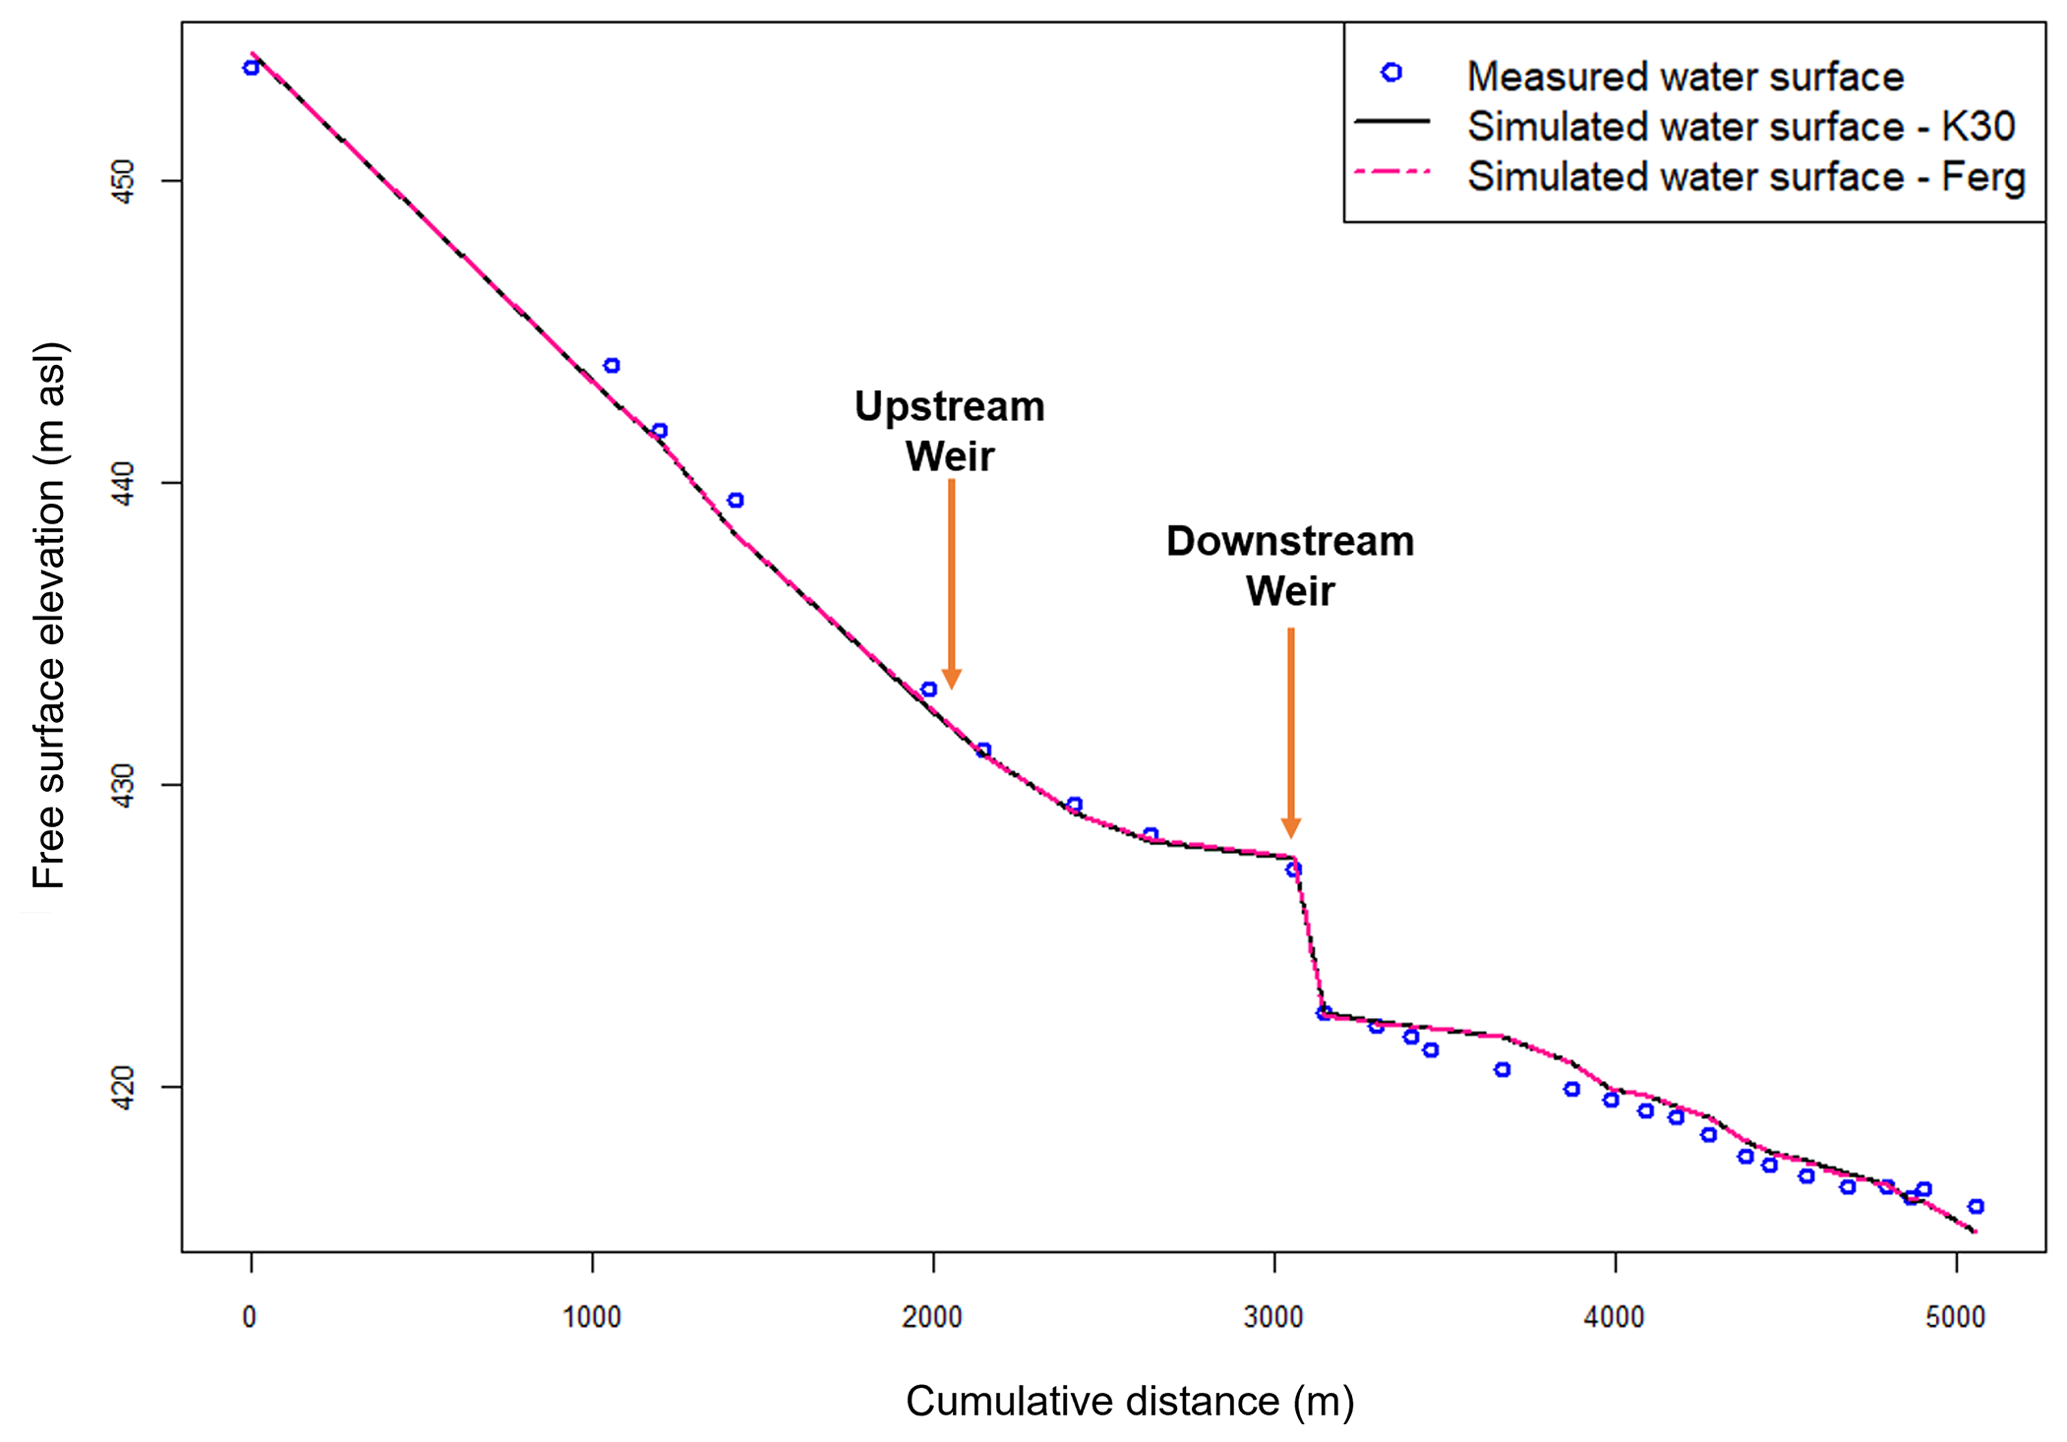
Figure 7Longitudinal profile of observed and simulated water surfaces corresponding to a discharge of 58.4 m3 s−1 measured on 9 July 2018. K30: simulation with Strickler; Ferg: simulation with the Ferguson friction law.
4.3 Calibration strategy
4.3.1 Hydrodynamic model
In a classical way, first hydrodynamic calculations are carried out. To calibrate the hydrodynamics, simulations on a steady state were performed for a discharge of 58.4 m3 s−1 measured on 9 July 2018 by the DREAL French public service and represented in Fig. 7. Under the hydrodynamic calibration conditions, morphological changes and bedload transport were limited. The fact that no bathymetric data were available can lead to a non-negligible uncertainty in water surface elevation. However since the water depth during the lidar surveys was approximately the same, we can consider that this is acceptable compared to other uncertainties.
In the TELEMAC-MASCARET system, two categories of parameters can be adjusted: the numerical parameters (time step, type of solver, and its accuracy) and the physical ones (De Linares, 2007). In our case, we focused on the physical one with a variation of Strickler friction coefficient from 20 to 60 m s−1. Water surface measurements along the river are used to quantify simulation accuracy. The model's accuracy is evaluated using the root mean square error (RMSE). The best results were obtained with the K=30 m s−1 friction coefficient for the constant viscosity turbulence model (Fig. 7). The LDG area is well represented as the errors do not exceed 20 cm between the two weirs and the RMSE value obtained for this simulation is 0.31. The 1D longitudinal profiles presented in this paper are plotted from an extraction of the lowest bathymetric points of the 2D model.
4.3.2 Hydro-morphodynamic model
The hydro-morphodynamic simulations were based on the flood event of 2018 that we assumed to be responsible for the visible morphological changes between the two topographic campaigns of 2016 and 2019. Unfortunately, there have been no topographic campaigns between 2016 and 2019 that would account for the effects of the 2018 flood only. First, the friction coefficient and the turbulence model selected during the hydrodynamic calibration process were used for the first hydro-morphodynamic simulations. Then, other simulations for the two sediment transport (MPM and Recking) and friction (Ferguson and Strickler) equations were performed. The specific parameters of each sediment transport equation (Shields number, MPM coefficient, slope effect, etc.) were tested afterwards to analyse their influence on the performance of the simulations.
4.4 Performance evaluation
4.4.1 General comparison of erosion and deposition areas
The model's qualitative performance evaluation was first done by visually comparing the simulated bed elevation changes maps to the DEM of difference (DoD). This allows for qualitative evaluation of the model's capacity to reproduce the spatial variability of the processes (erosion and deposition) and to locate possible aberrations. Longitudinal profiles and cross sections where significant morphodynamic processes occurred were also compared to acquire a more refined vision of the bed elevation changes at the local scale. However, in braided rivers, as in the Gave de Pau, significant variability is observed between two measurements considering the channel migration phenomena.
4.4.2 The Brier skill score
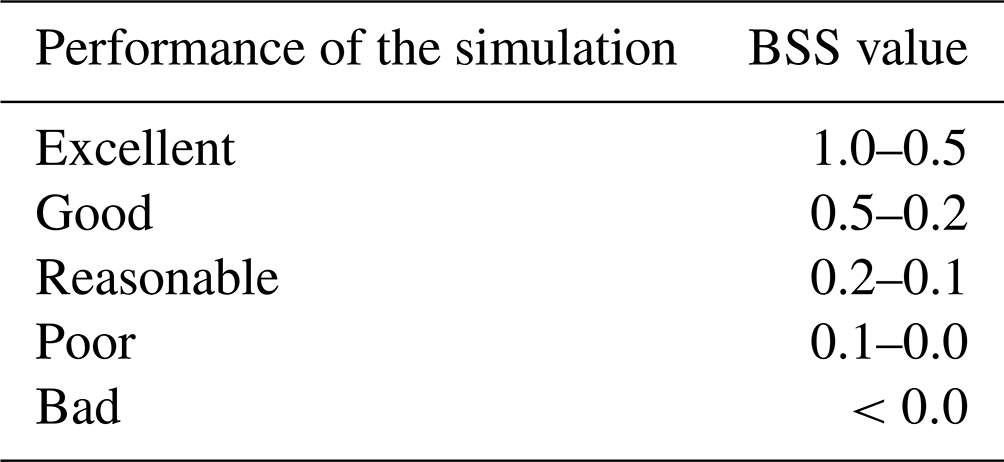
The model's calibration requires a considerable amount of computations where different parameters are modified. Rapidly identifying the best-performing model with a cost function can thus be time saving. The selected cost function for this is the Brier skill score (BSS). It was developed initially for the assessment of meteorological model performance and uses a baseline prediction to quantify a model's new prediction skill. Furthermore, over the last decades, many hydromorphological studies have considered it to evaluate the model's skill to simulate the sediment erosion and deposition processes along the whole domain (Aguirre et al., 2020; De Linares, 2007; Sutherland et al., 2004). It can be expressed as follows (Eq. 9):
with N the number of measurement points, bi the baseline (here we use initial riverbed elevation (DEM of 2016)), xi the observed riverbed elevation (DEM of 2019) and yi the simulated riverbed elevation. Table 2 shows the recommended model performance classification for the BSS. One of the major advantages of considering the BSS for hydromorphological model performance is that its value is not impacted if measurement points do not present any evolution. The number of considered grid points should only have little influence on the BSS value.
Table 2Classification of BSS values for model performance evaluation (Aguirre et al., 2020).
4.4.3 Comparison of the deposited volumes
Using a cost function to evaluate a hydromorphological model's performance with a braided morphology can be quite pessimistic. To date, numerical models cannot predict channel migration processes that occur in braided rivers. These phenomena are uncertain and random. A modeller should thus not expect the model to predict channel migration accurately during a flood. Despite these limitations, the choice of a 2D model has been made because it allows for better representation of the hydrodynamics and in particular of the friction taking into account a spatialisation of the water height. Even if the representation of the braiding and of the different flow arms is not the real one, the 2D model has the advantage of a continuity of the dynamics, contrary to the 1D model with interpolation between two profiles and water height projected on the DEM to estimate the extent of the flooded area.
As the issue here is the filling of the LDG and the high amount of sediment that might be delivered to the downstream system if the weirs are levelled, the comparison of the simulated deposited volumes with the field data appears to be a relevant model performance indicator. Field erosion and deposition areas were estimated through topo-bathymetric differencing between two lidar DEMs surveyed in 2016 and 2019 (Fig. 8). The 10-year return period flood of June 2018 is considered the only morphodynamic flood that occurred during this period.
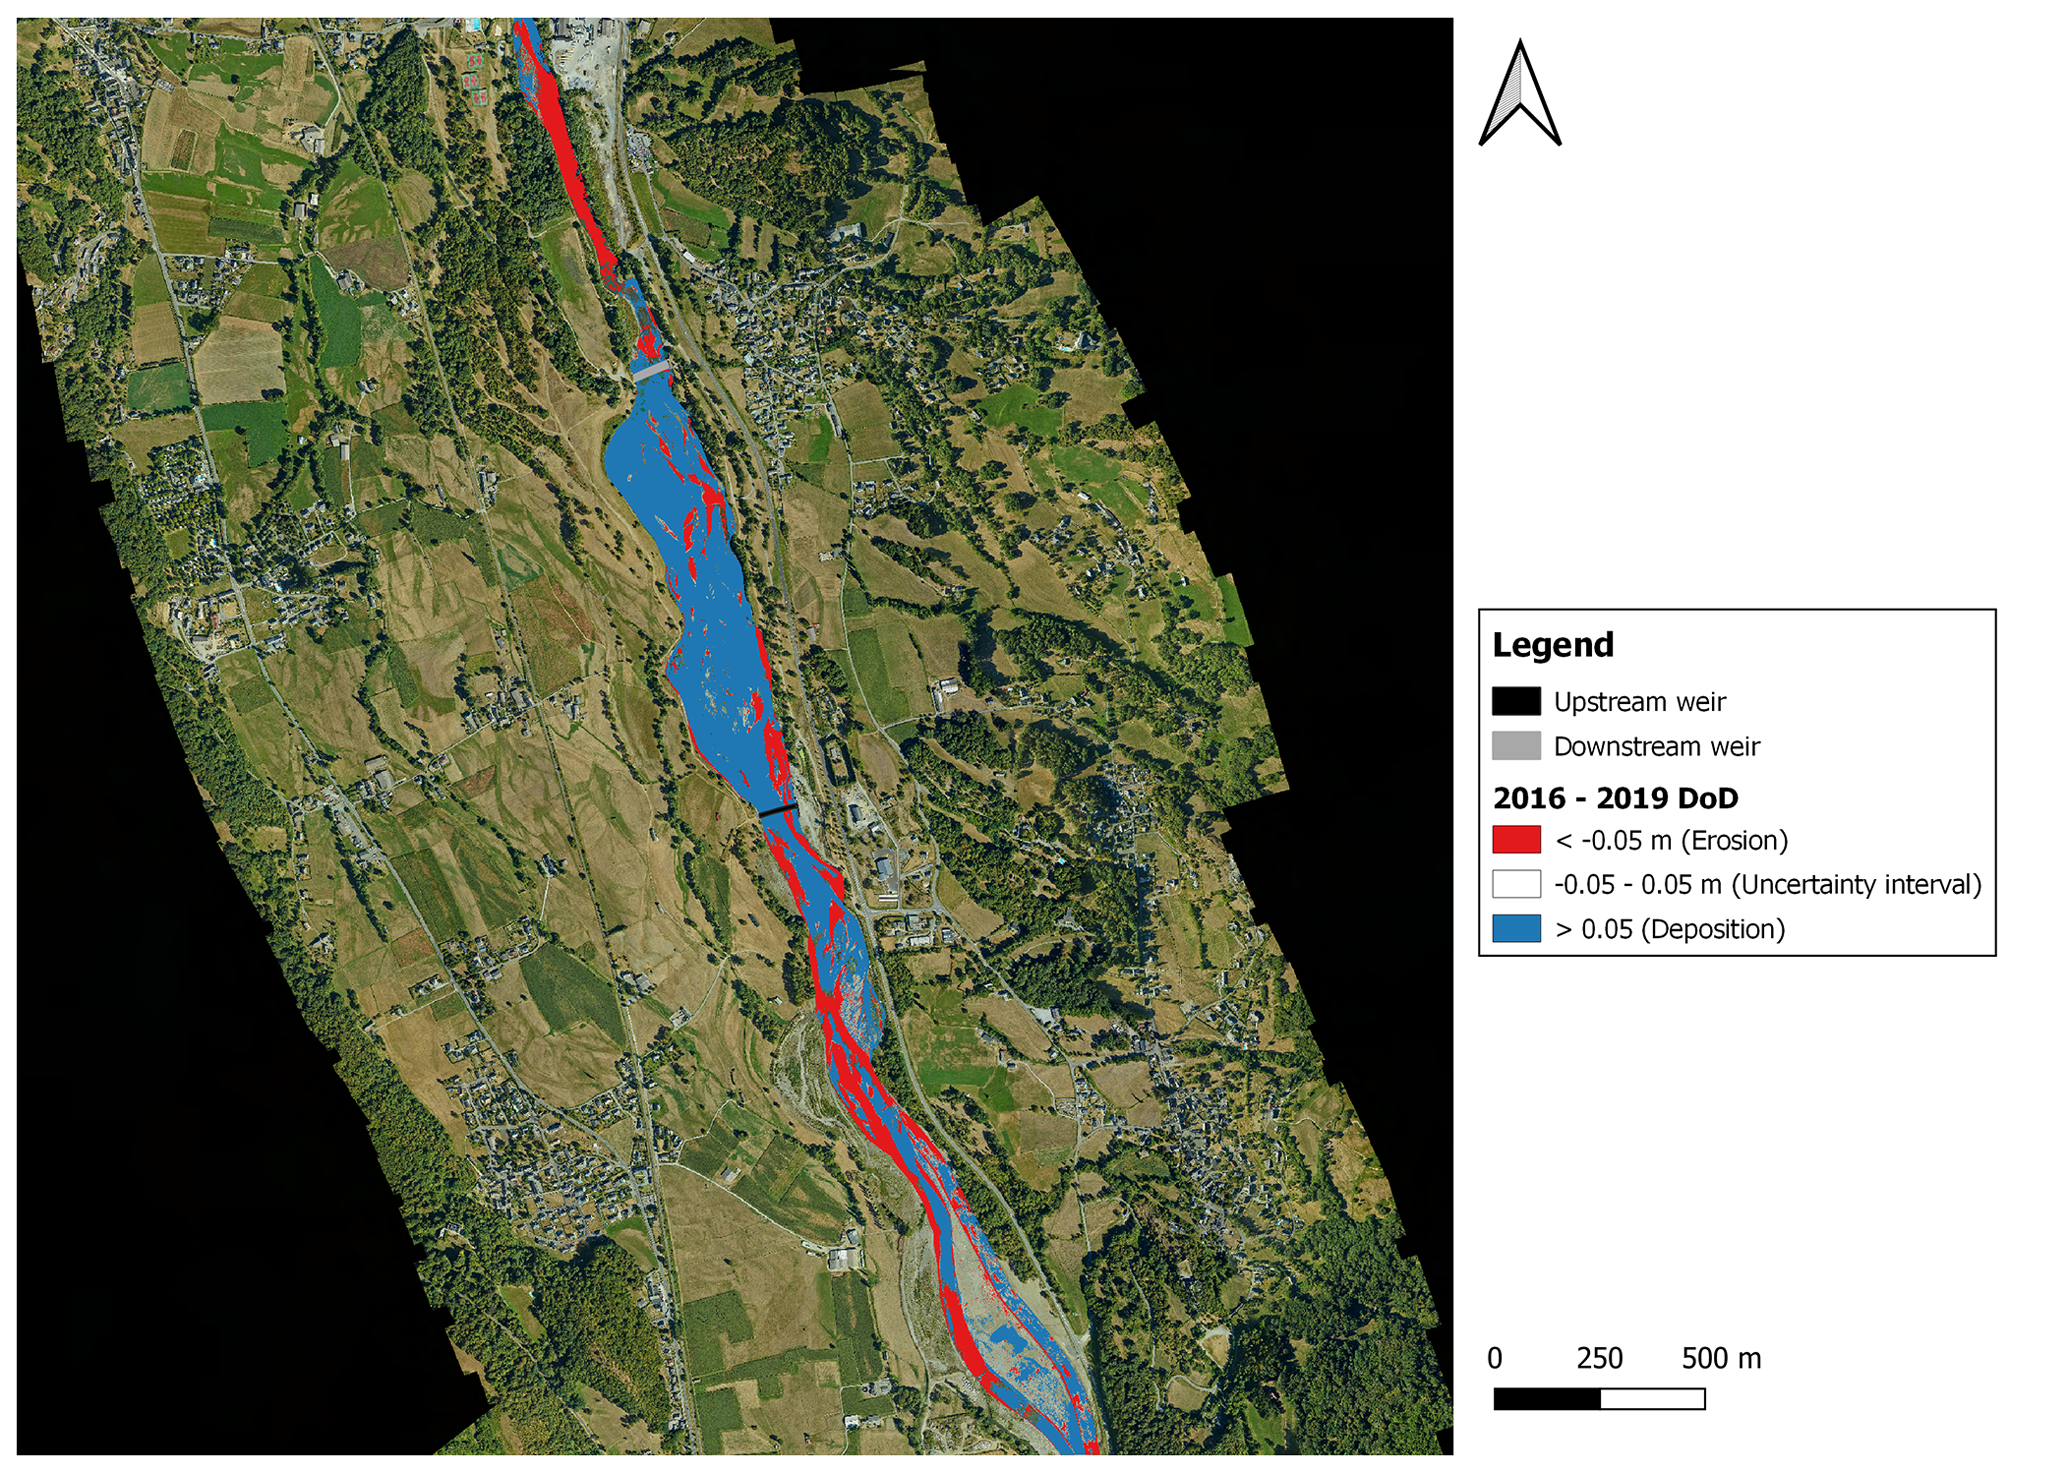
Figure 8Eroded (red) and deposited (blue) areas in the LDG reach estimated through topo-bathymetric differencing between the two lidar DEMs surveyed in 2016 and 2019. The upstream weir is represented in black and the downstream weir in grey. This figure illustrates the filling of the LDG as almost all its surface represents deposited materials.
4.4.4 Statistical distribution of erosion and deposition
We also considered plotting on a histogram the area of bed experiencing morphological changes as performed by Williams et al. (2016a). The statistical distribution of erosion and deposition could then be qualitatively compared; this was particularly useful for comparing simulations with different bedload transport and friction equations.
The TELEMAC-MASCARET modelling system can run in parallel mode using domain decomposition and codes based on the Message Passing Interface (MPI) standard. The calibration scenarios have been carried out on a Linux server over 16 processors at the Institut de Mécanique des Fluides de Toulouse (IMFT). The performance of the two friction laws and the two bedload equations was assessed with the three performance indicators previously mentioned: longitudinal profile and cross-section comparison, BSS scores along with the whole domain, and comparison of the deposited volumes.
5.1 General visual comparison of eroded and deposited areas
The simulated results are compared only within the intersection of areas that were emerged during the two lidar campaigns (2016–2019) as this technique does not collect submerged bathymetric data. In general, the model seems to correctly represent the filling tendency of the LDG as a deposition front can clearly be observed, which is coherent with what is observed in the field (Fig. 9). The simulated bed elevation changes show that the selection of a friction law has more impact on the results than the sediment transport equation. In fact, for both sediment transport equations, the Strickler friction law tends to overestimate erosion and deposition processes within the LDG reach, whereas they seem to be minimised with the Ferguson friction law (Figs. 9 and 10). The observed bed elevation changes (Fig. 9a) seem to be more matching with the results obtained with the MPM bedload transport equation and the Strickler friction law (Fig. 9d). This is probably due to the fact that the Strickler equation seems to overestimate erosion and deposition processes. Since the simulations only take into account bedload and the difference in DEMs obviously represents total load, it is therefore logical that the results of the equation overestimating the bedload seem closer to the observations of the total load. Of course this is only a qualitative method of comparison. The erosion and deposition volumes by bedload only for all these cases are compared later in the article (Sect. 5.3, Table 3).
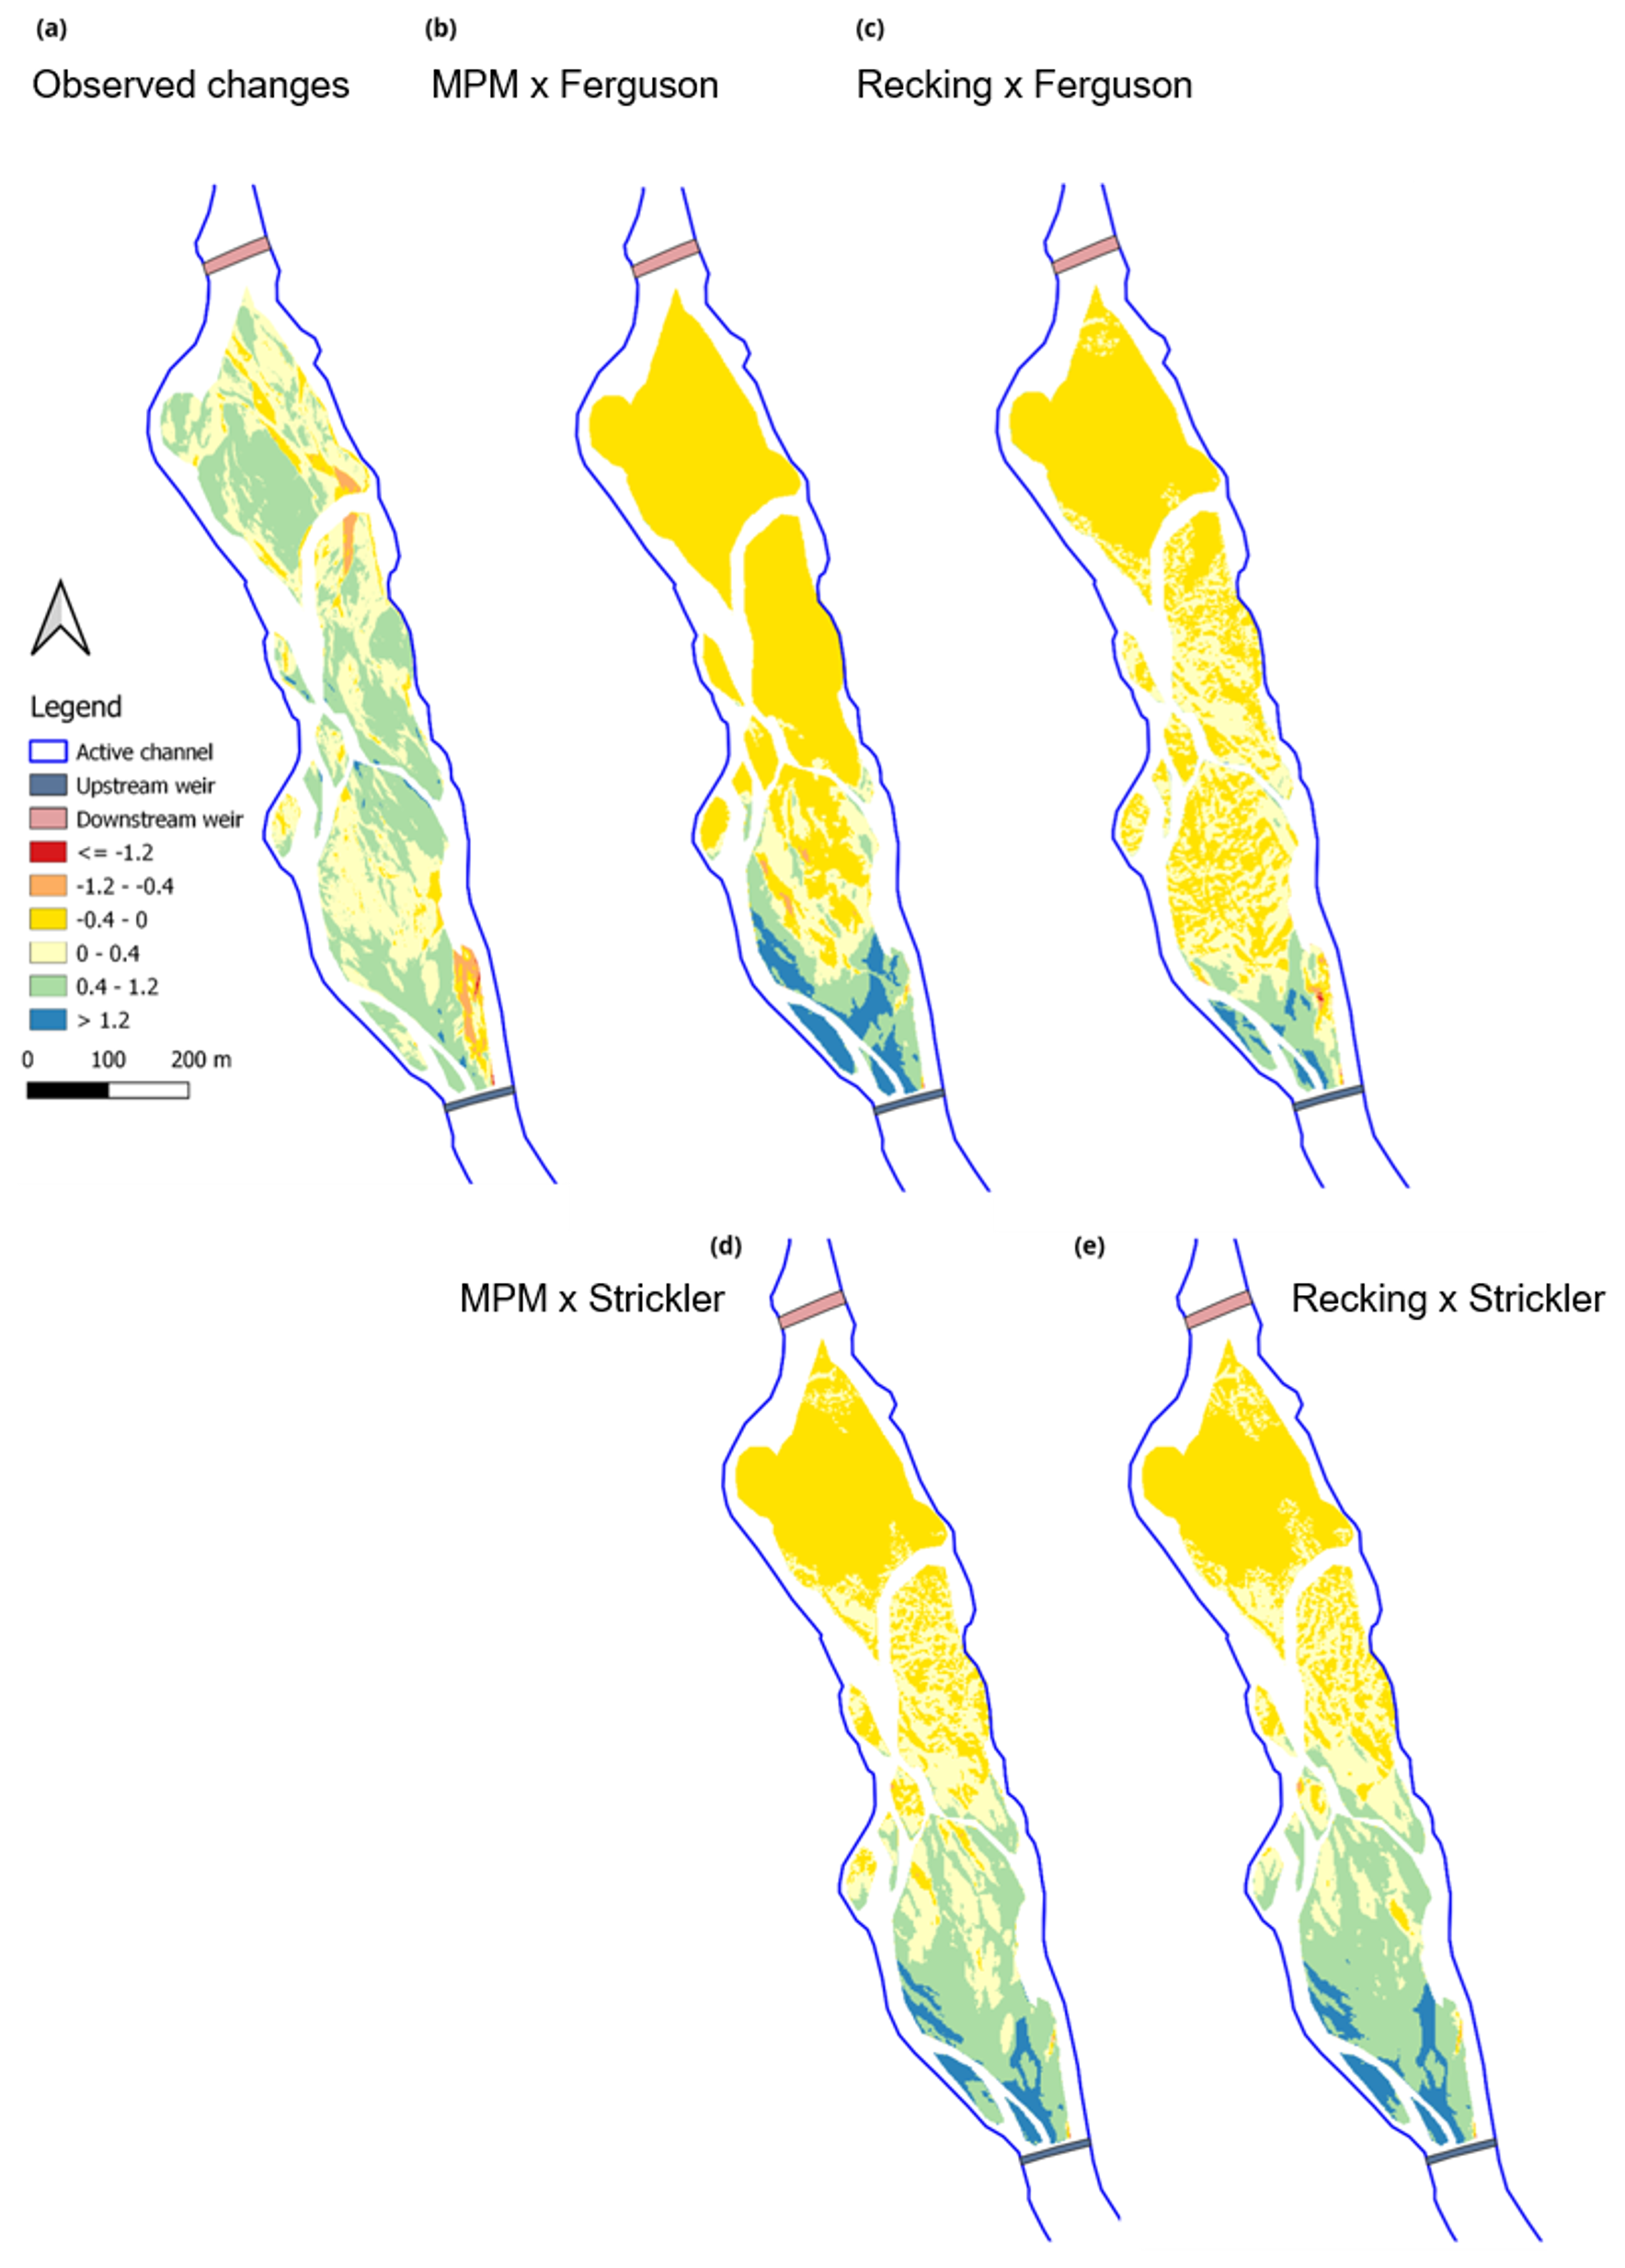
Figure 9Comparison of the simulated bed elevation changes with the two bedload equations (MPM and Recking) and the two friction laws (Strickler and Ferguson). (a) 2016–2019 DoD; the simulated bed elevation changes are represented with (b), the MPM equation and the Ferguson friction law; (c) the Recking Formula and the Ferguson friction law; (d) the MPM equation with the Strickler friction law; and (e) the Recking equation with the Strickler friction law.
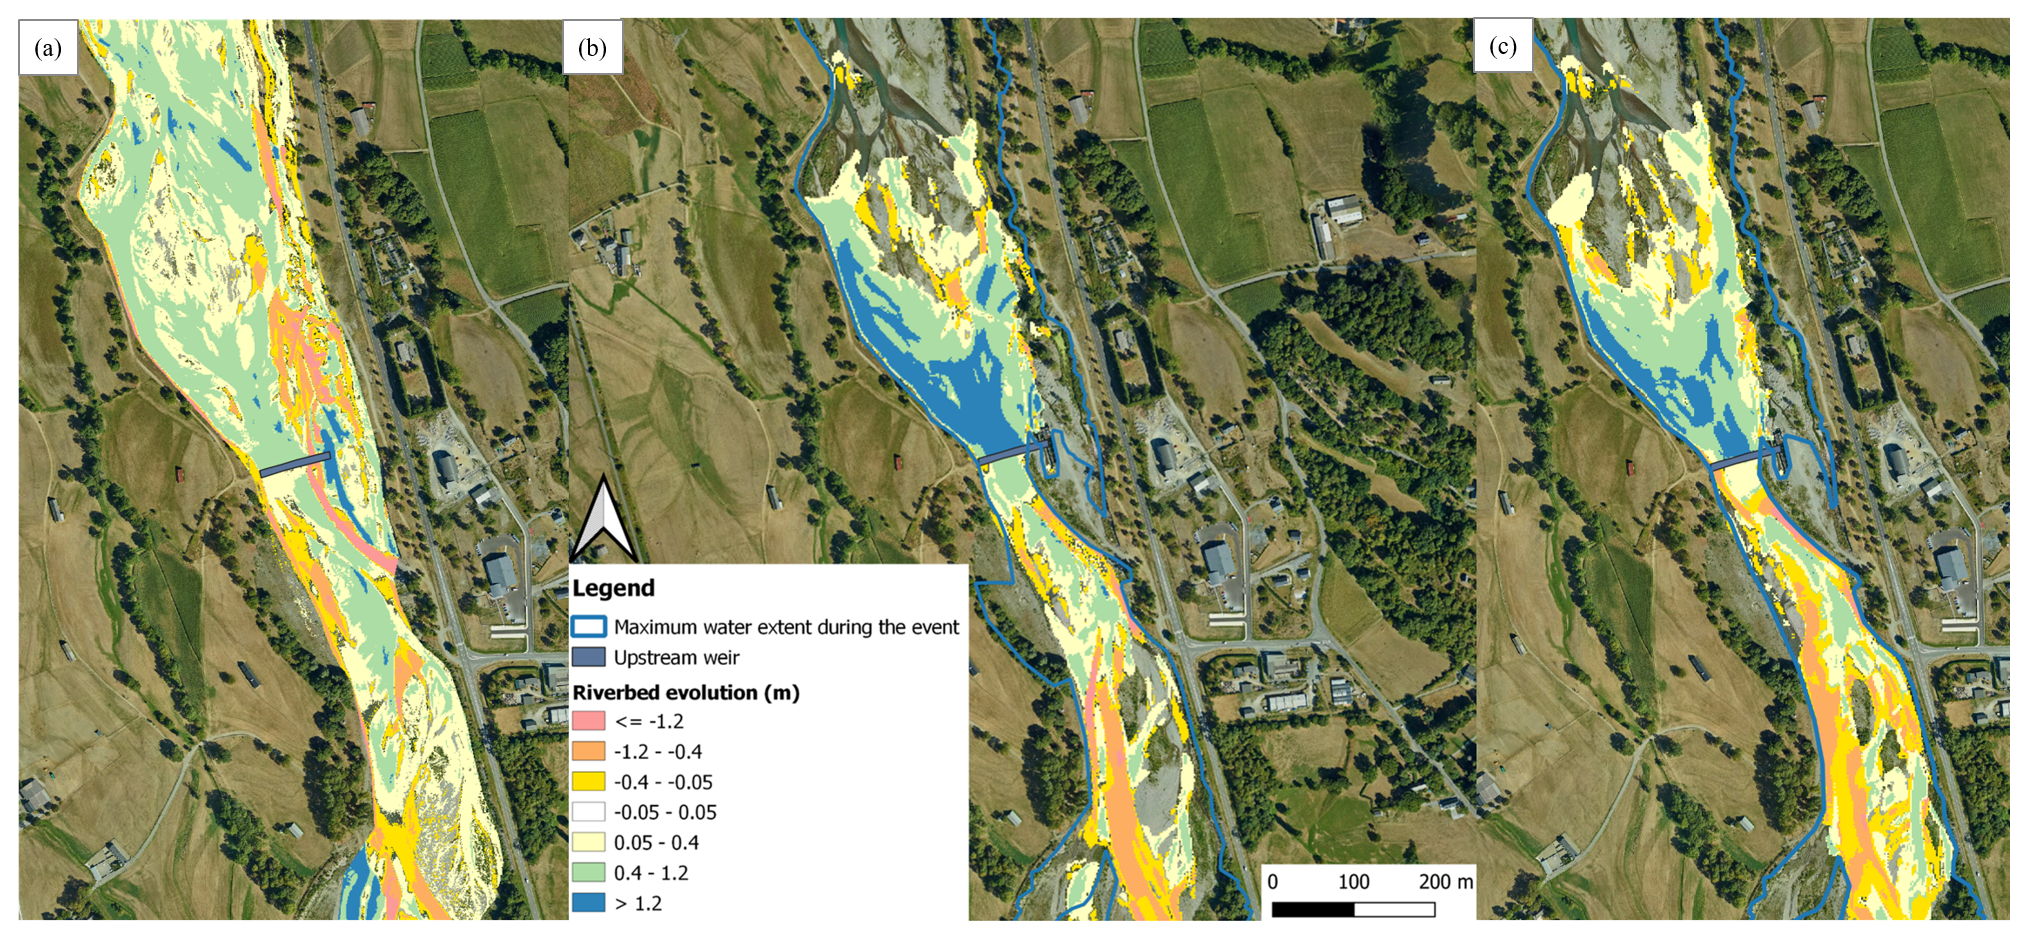
Figure 10Bed elevation changes around the Beaucens weir. (a) Experimental bed elevation change estimated through the difference between the 2016 and the 2019 topography; (b) bed elevation change estimated with the MPM sediment transport equation and the Ferguson friction law; and (c) simulated bed elevation change with the Recking sediment transport equation and the Ferguson friction law.
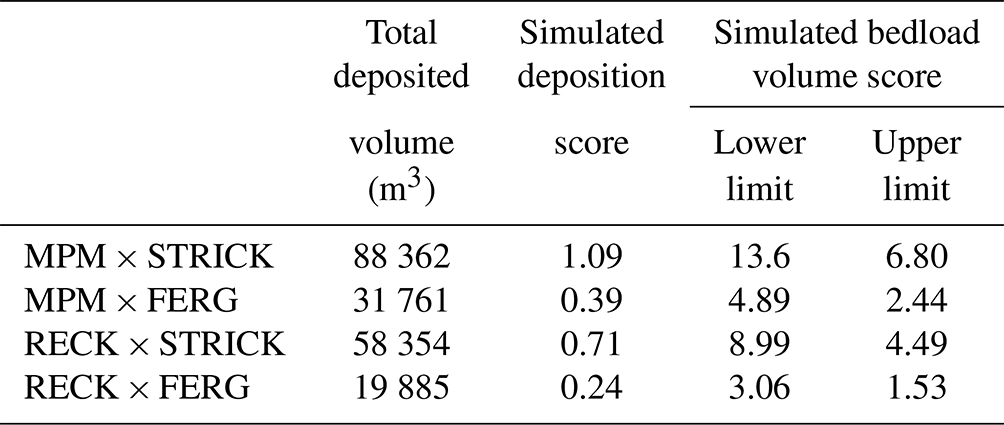
Table 3Comparison of simulated deposited volumes and observed ones using the score . The lower interval limit represents 8 % of the total sediment transport and the upper interval limit 16 % of the total transport. STRICK stands for Strickler friction law, FERG for the Ferguson friction equation, and RECK for the Recking equation.
If we compare the obtained results with the Ferguson friction law for the two bedload transport equations, the simulations with the MPM equation tend to predict higher sediment deposition and erosion amounts. As it is a threshold equation, the results below or around the critical shear stress can be poor because of a zero prediction or an overestimation of sediment transport. This equation is considered efficient when and thus for rather strong flow conditions (Recking et al., 2012). In our case, as we consider the whole 2018 hydrograph (10 d), we are not always in these conditions. Hence, the observed overestimation can be due to fluctuations around the threshold during the 2018 flood event.
The morphodynamics around the upstream weir (Fig. 10) are more complex. During the 2018 flood event, two main river branches were created (left and right bank) with very strong erosion around the right bank and considerable deposition elsewhere. The comparison with the experimental bed elevation changes has to be taken carefully as the bathymetry under the water surface cannot be captured by the lidar technique. However, as the two measurement campaigns were conducted in severe low-water seasons, we can thus estimate that these uncertainties are reduced. Figure 10 shows that the two sediment transport equations can reproduce the observed erosion processes around the right bank but to a lesser extent. The strong erosion observed in the right bank during the flood (pink in Fig. 10a) is actually due to the disappearance of a river protection element that was washed out by the flood. It seems like the model is not able to reproduce this phenomenon. In fact, the maximum simulated water extent for both sediment transport equations (Fig. 10b and c) does not reach this area, which explains why this extreme erosion process is not reproduced. However, the MPM sediment transport equation tends to estimate stronger erosion and deposition processes compared to the Recking equation, which seems to minimise them.
5.2 Longitudinal profile and cross-section comparison
Further quantitative investigations were done by comparing longitudinal profiles for both sediment transport equations and friction laws. For the MPM equation, longitudinal profile comparison confirms that the Strickler friction law tends to overestimate bedload deposition within the LDG (Fig. 11). The same conclusions can be drawn with the Recking equation and Strickler friction law (Fig. 12). It seems thus that the Ferguson friction law is the one providing the most realistic results for both bedload equations, which is coherent with the visual interpretation made in Sect. 5.1.
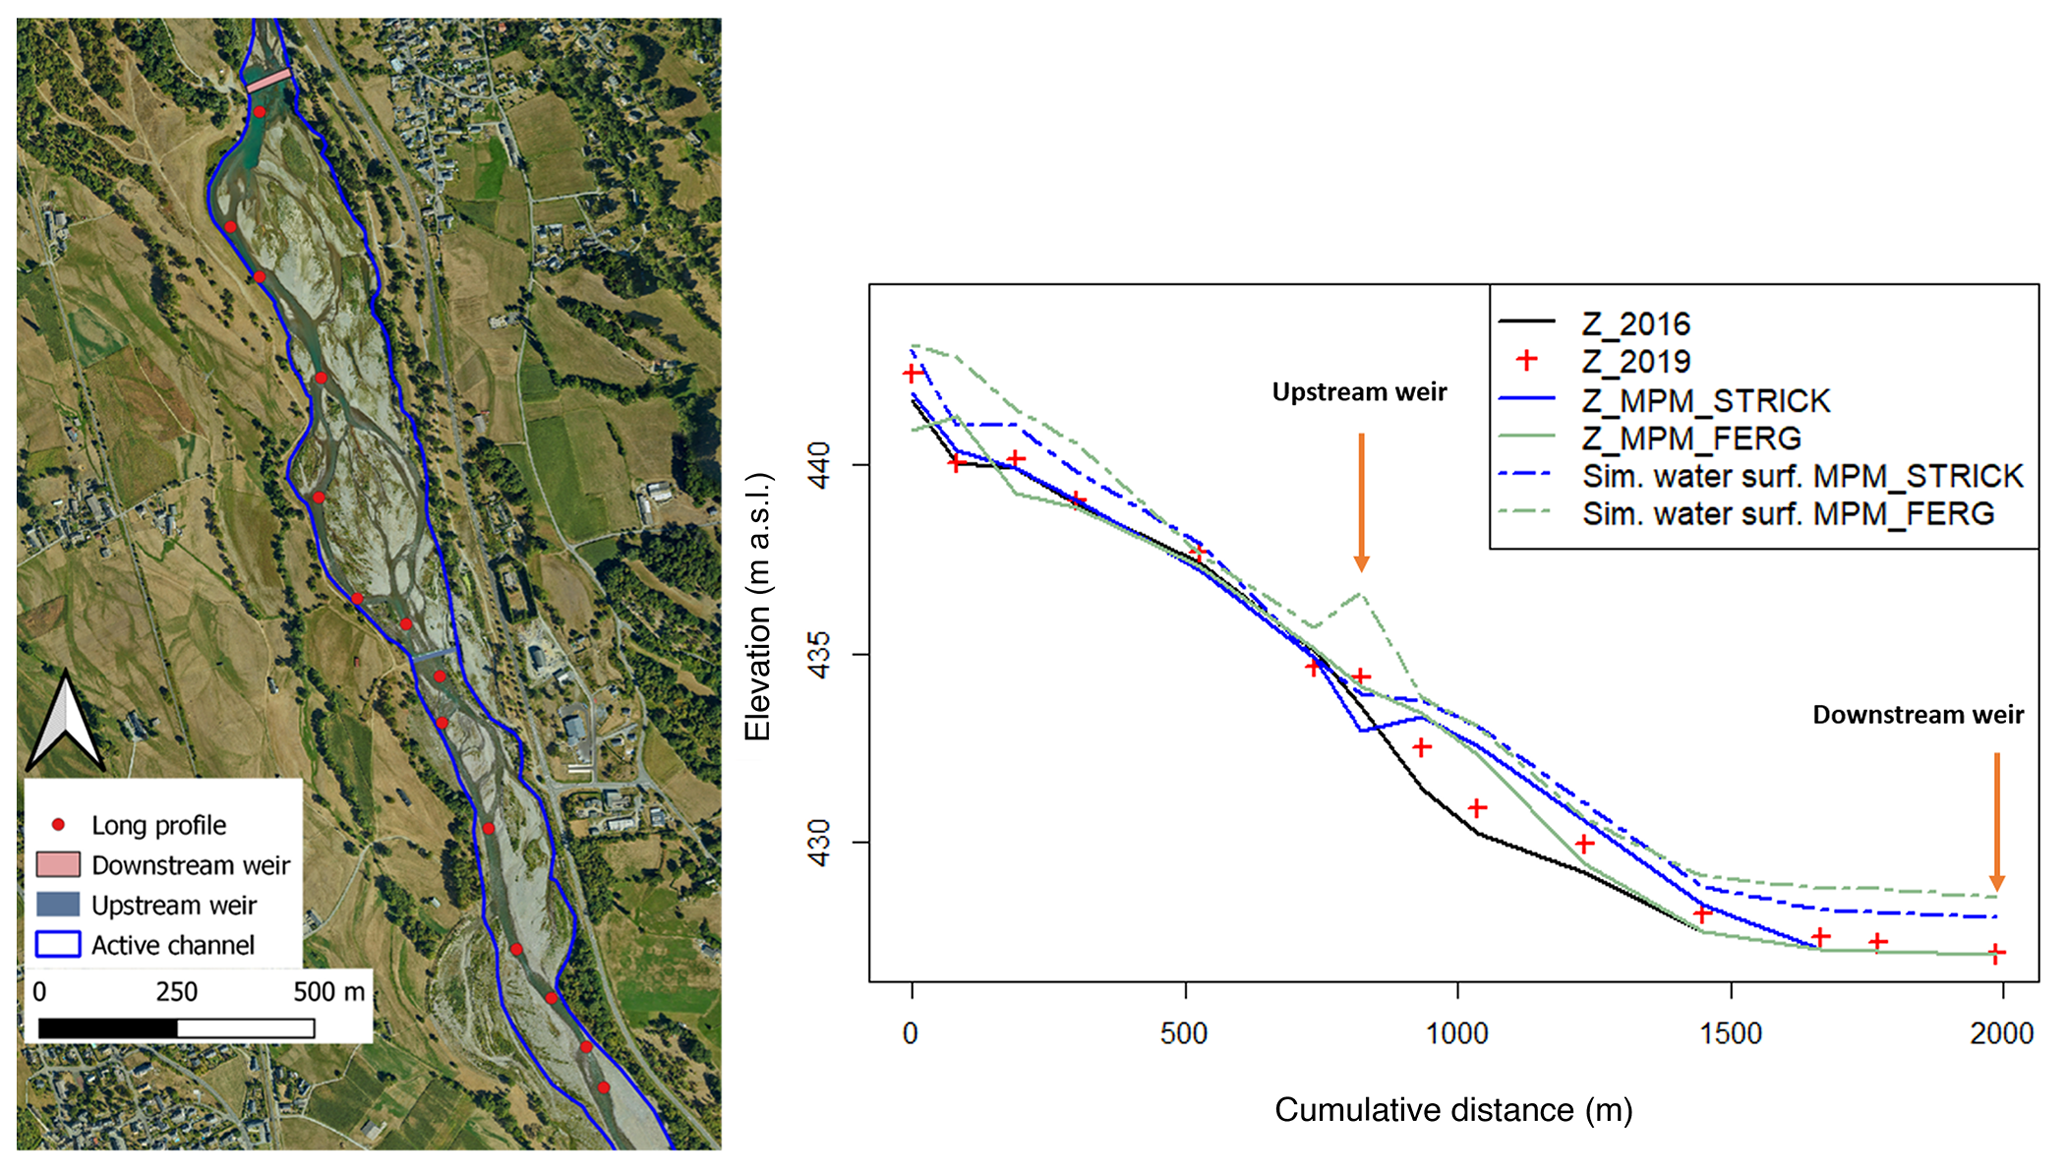
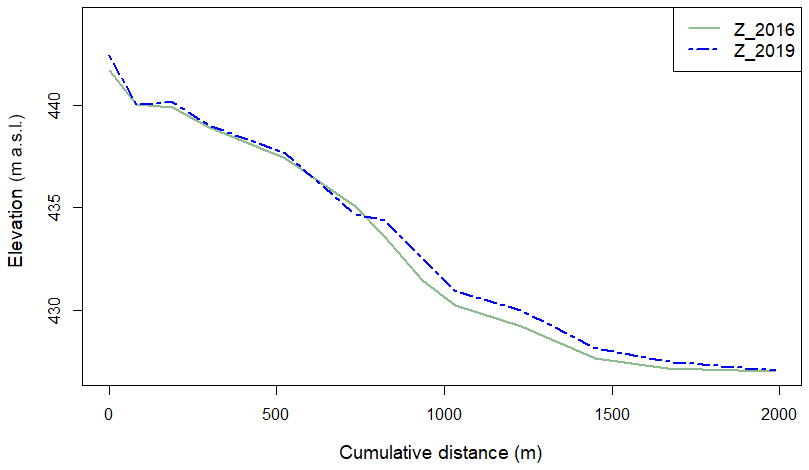
Figure 11Simulated longitudinal profile (solid lines) and maximum simulated water surface (dashed lines) comparison for the MPM equation and the two considered friction laws: STRICK for Strickler friction law, FERG for the Ferguson friction equation – Z_2016: DEM of 2016, Z_2019: DEM of 2019. The first point of the long profile is not located at the inlet of the model.
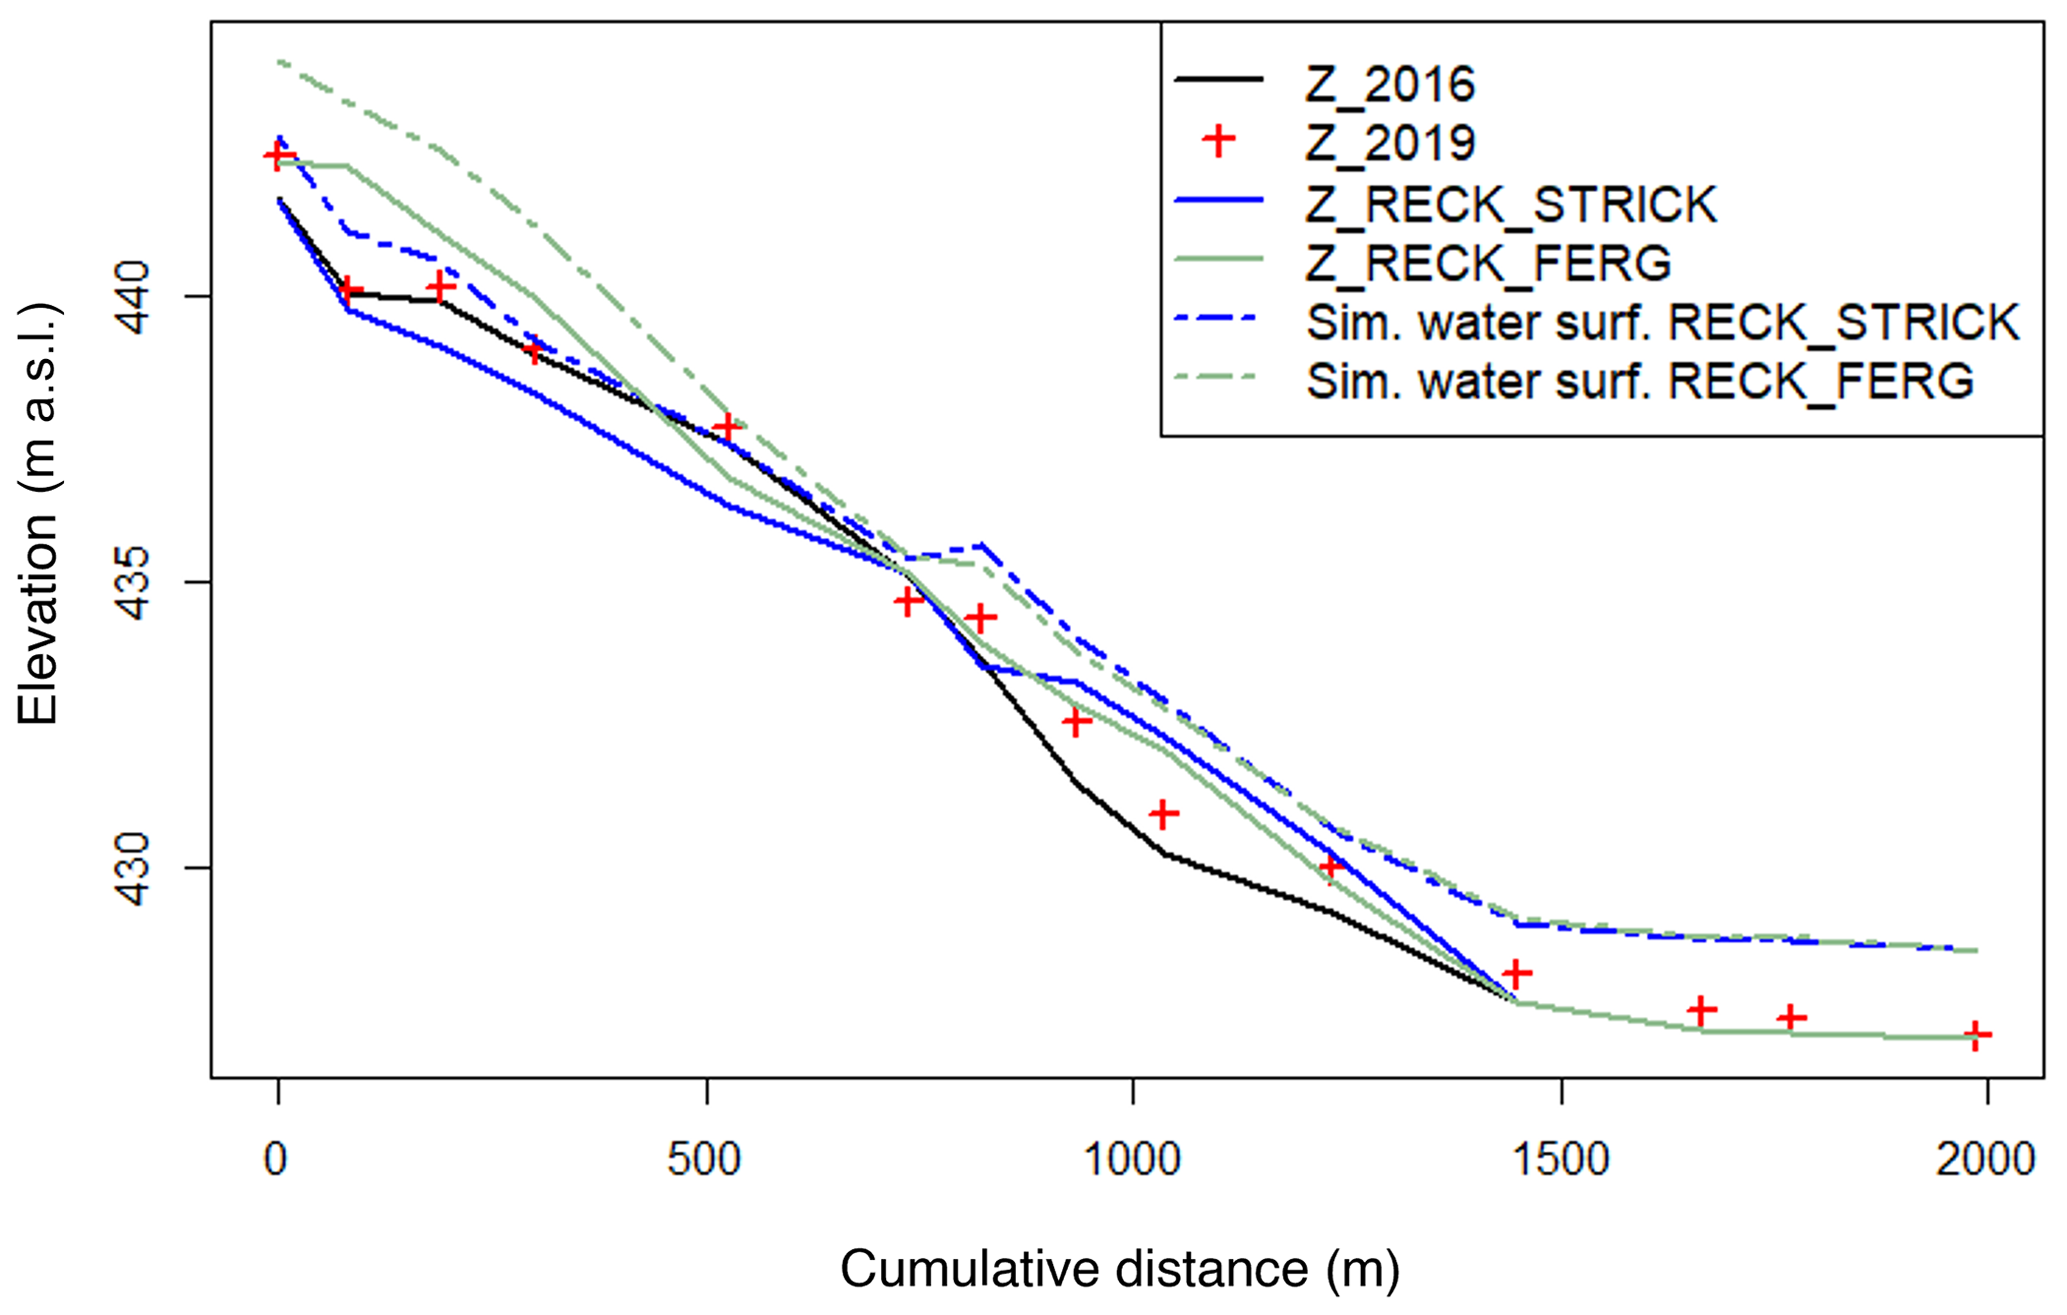
Figure 12Simulated longitudinal profile (solid lines) and maximum simulated water surface (dashed lines) comparison for the Recking equation and the two considered friction laws: STRICK for Strickler friction law, FERG for the Ferguson friction equation – Z_2016: DEM of 2016, Z_2019: DEM of 2019.
The longitudinal profile comparison for both bedload transport equations with the Ferguson friction law (Fig. 13) shows that MPM equation tends to overestimate sediment deposition within the first half of the LDG (950–1400 m) compared to the Recking equation. However, the sediment deposition front progression seems to be more accurately simulated with the MPM equation. Visually speaking, the simulated long profile with the Recking equation seems to be closer to the observed bed elevation changes. This is confirmed by the score of this simulation (BSS = −0.01) calculated over the long profile, whereas the MPM equation has a score of −0.3. As we can see, both simulations seem to perform poorly according to the BSS criteria only. This questions the relevance of this criteria for complex morphologies such as the braided LDG reach as the hydromorphological model cannot simulate exactly where a channel or a bar will be.
The evaluation of the model's performance over the cross sections confirms this statement (Fig. 14). As mentioned above, Fig. 14 shows that the model experiences difficulties in geographically matching the location of channels and bars forming the braided morphology of the LDG reach. Strong erosion is observed for both equations upstream the Beaucens weir within the main channel, which is not coherent with the observations on the ground. However, this comparison can be biased by the fact that we are manipulating lidar data, not taking into account the bathymetry below the water surface. For the upstream cross section, the two bedload transport equation perform poorly with a BSS of −0.04 for the MPM equation and −0.06 for the Recking equation. The comparison of the cross sections downstream the weir shows that the Recking equation seems to perform better (BSS = 0.35) compared to the MPM sediment transport equation (BSS = −1.2), which overestimates sediment deposition within the lake.
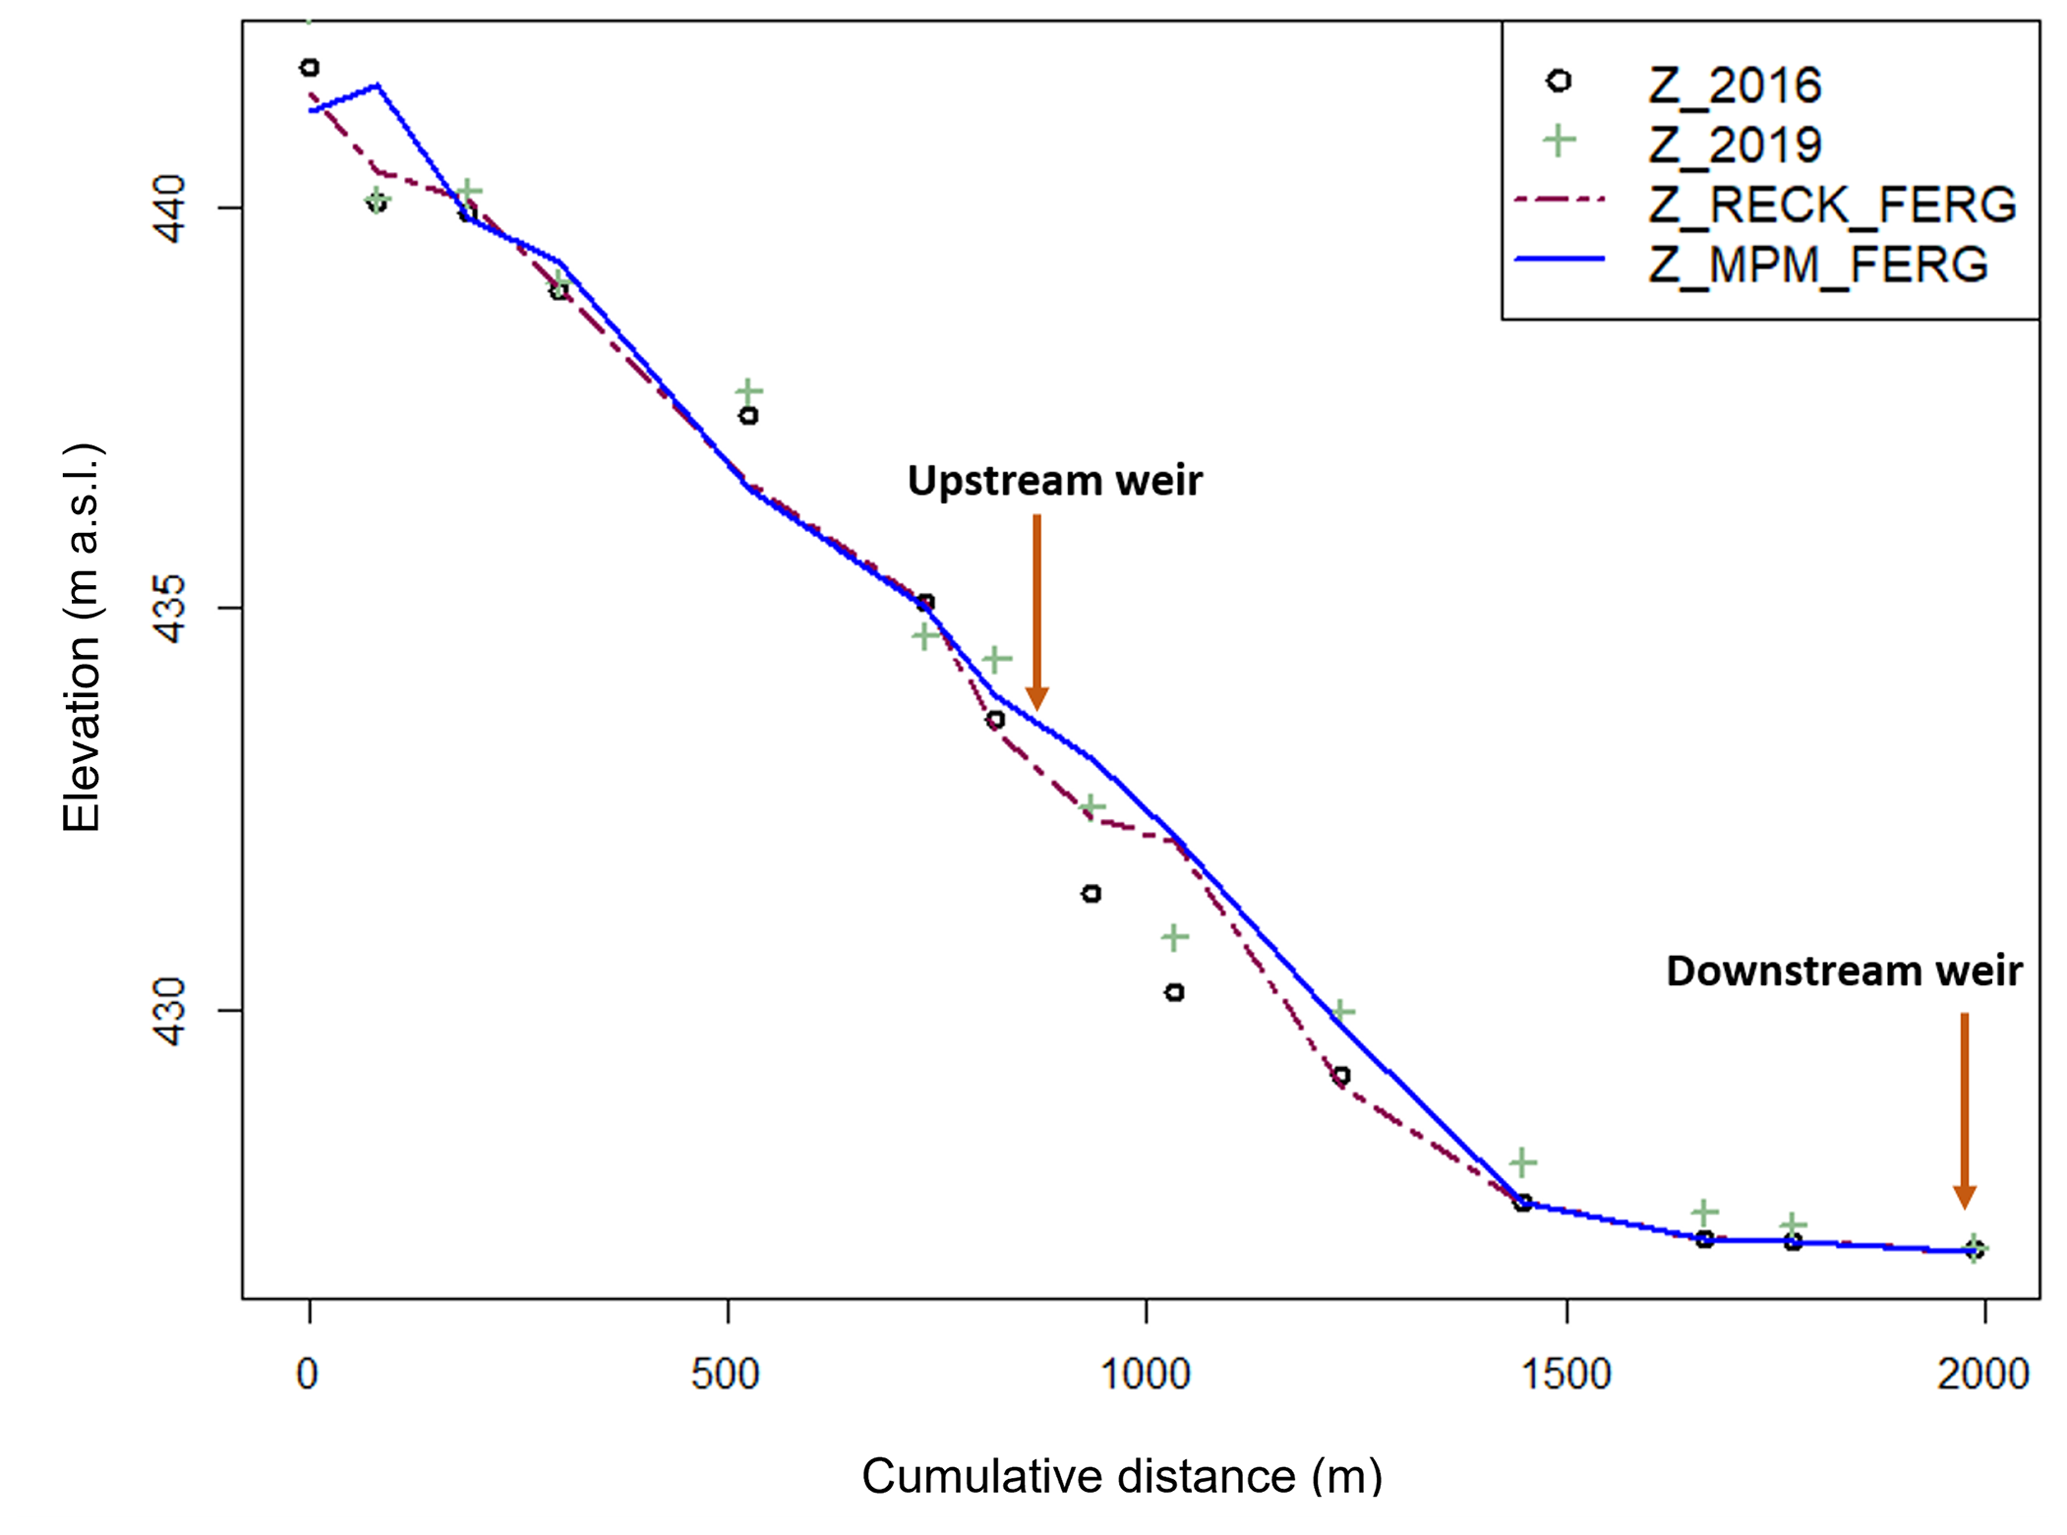
Figure 13Simulated longitudinal profile comparison for the Recking and the MPM bedload equations and Ferguson friction law – Z_2016: DEM of 2016, Z_2019: DEM of 2019.
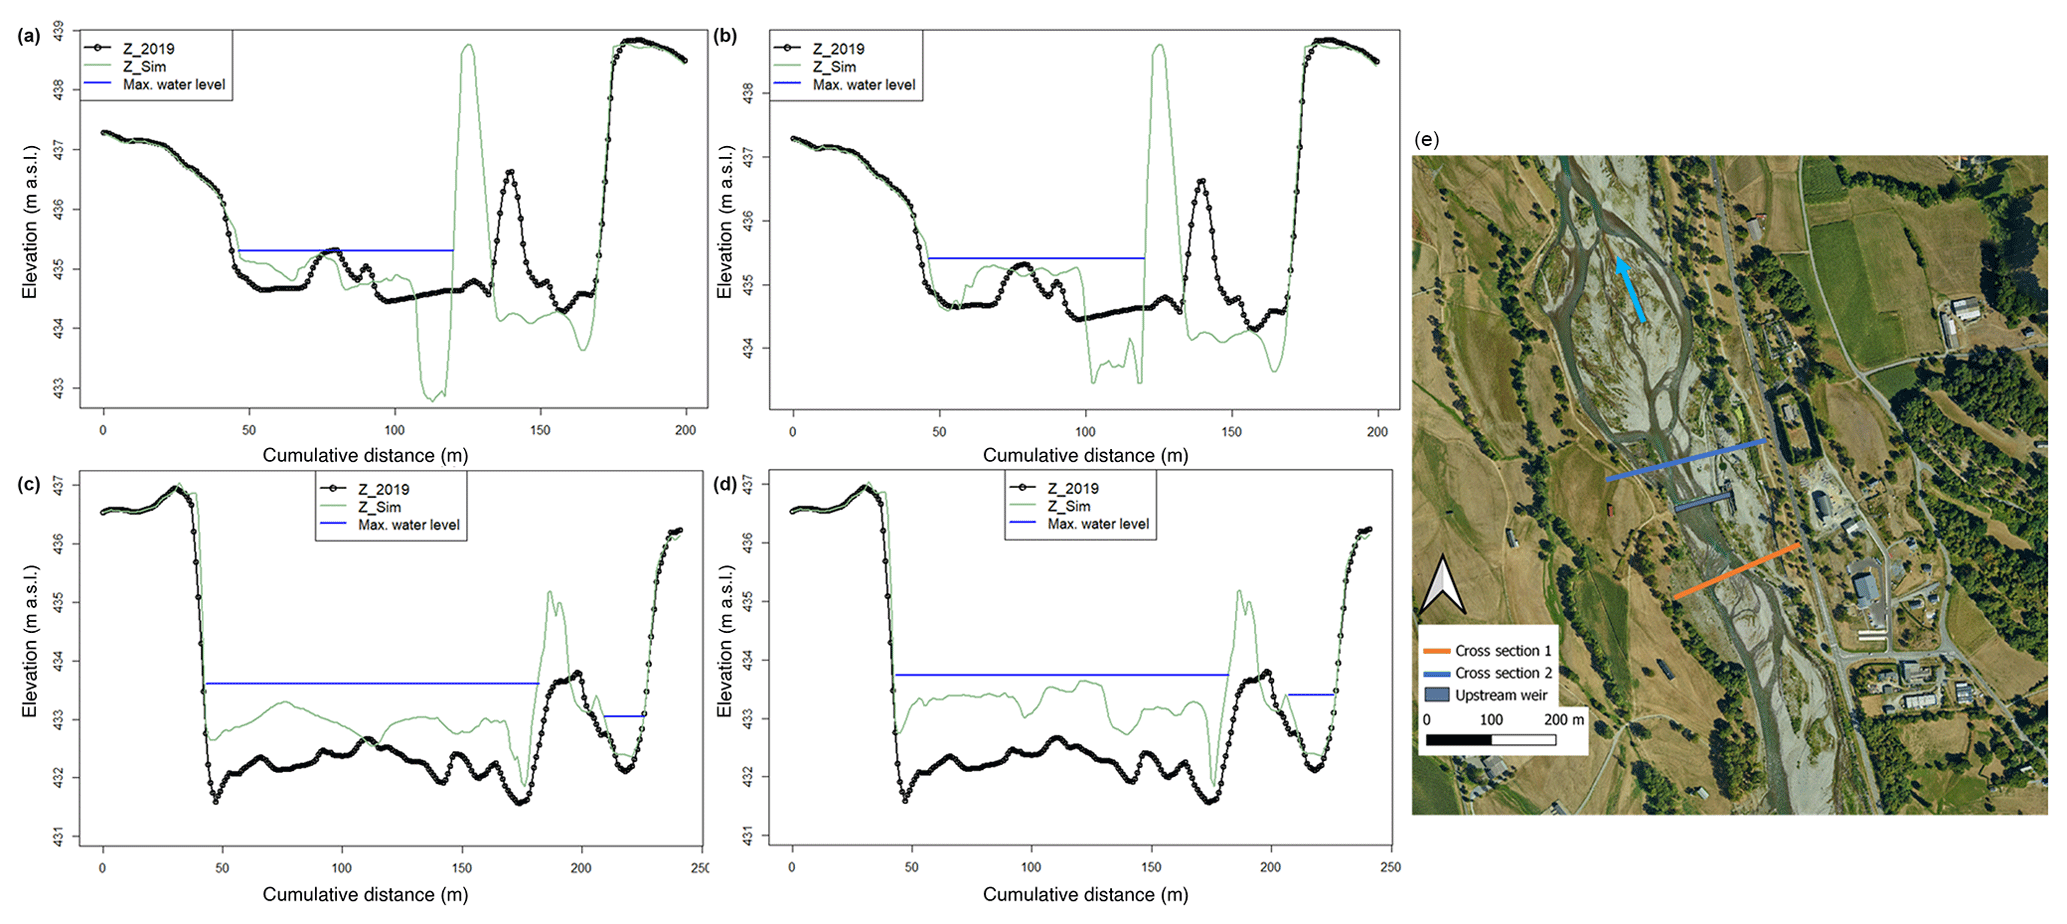
Figure 14Cross-section comparison upstream (orange cross section) and downstream (blue cross section) the Beaucens weir (e). The presented simulations were performed with the Ferguson friction law. Panels (a) and (b) show upstream cross sections for the Recking equation and the MPM equation respectively; (c) and (d) show downstream cross sections for the Recking equation and the MPM equation respectively.
Finally, this topographic examination questions the classical performance analysis methods for morphodynamic models. Knowing the multiple variabilities in a mountain braided watercourse, performance criteria combined with local altimetric analysis might be too strict and incomplete to assess the ability of the model to reproduce the mobilised sediment volumes over a flood event. As the aim is to give the local elected representatives indications regarding possible sustainable restoration scenarios, a volumetric analysis can provide valuable additional insights as it gives information on the possible volumes that might end up downstream if a weir-lowering/removal solution is considered.
5.3 Comparison of deposited volumes
To compare the simulated deposited volumes to the ones observed in the field, the score , with Vscal [m3] the simulated deposited volume and Vsmeas [m3] the measured deposited volume, was calculated between the two weirs (Table 3). When r>1, the simulation overestimates sediment deposition within the LDG; when r<1, it is the opposite: the simulation underestimates sediment deposition. The deposition phenomenon within the LDG is one of the most important processes to reproduce as it represents the potential volumes that might be mobilised if the weir-lowering/removal restoration measure is considered.
The reconstruction of the filling of the lake through different periods has allowed for the collection of interesting data that provide annual trends of material input. These results are derived from an analysis of bathymetric profiles from which the volumes were extracted. For the flood of 2018, a total (bedload and suspension) sediment deposition volume of 81 220 m3 was estimated. In order to distinguish the bedload phenomenon and as our model only considers this process, dredging data were collected for approximately 10 years. These data allowed us to estimate the fraction of bedload of the total sediment transport. This fraction is estimated to be between 8 % and 16 % of the total transport, representing the lower and upper uncertainty interval limits.
As mentioned above, the model only considers bedload transport. Hence, the score calculation was performed on the fraction of sediment estimated to be deposited via a bedload transport process. Generally speaking, the model seems to simulate sediment deposition close to the upper interval limit (16 % of the total deposited volume observed including both suspension and bedload transport). The best results (r=1.53) seem to be obtained with the combination of the Recking bedload transport equation and the Ferguson friction law, which is coherent with the interpretations made above with the longitudinal profile comparison. The MPM equation tends to overestimate the deposited volumes; however, acceptable results were obtained with the Ferguson friction law (r=2.44). This supports the fact that the Ferguson friction equation seems to be the most suitable one for the LDG reach.
5.4 Distribution of erosion and deposition
The statistical distribution was analysed upstream the LDG (Fig. 15b) and within the LDG (Fig. 15a). The simulated bed elevation change for both bedload transport equations and friction equations is lower than the observed bed elevation changes. However, some simulations are able to better reproduce the spatial distribution of bed evolution even if a calibration process should be done to reproduce the real bed elevation changes. The distribution of bed elevation changes with the Ferguson friction equation corresponds more closely to the one observed. We also observe that the Strickler friction equation has a completely different distribution and is characterised by a longer deposition tail attributed to more important sediment deposition upstream and within the LDG. As we can see, model predictions were relatively sensitive to the choice of friction equation and bedload transport equation.
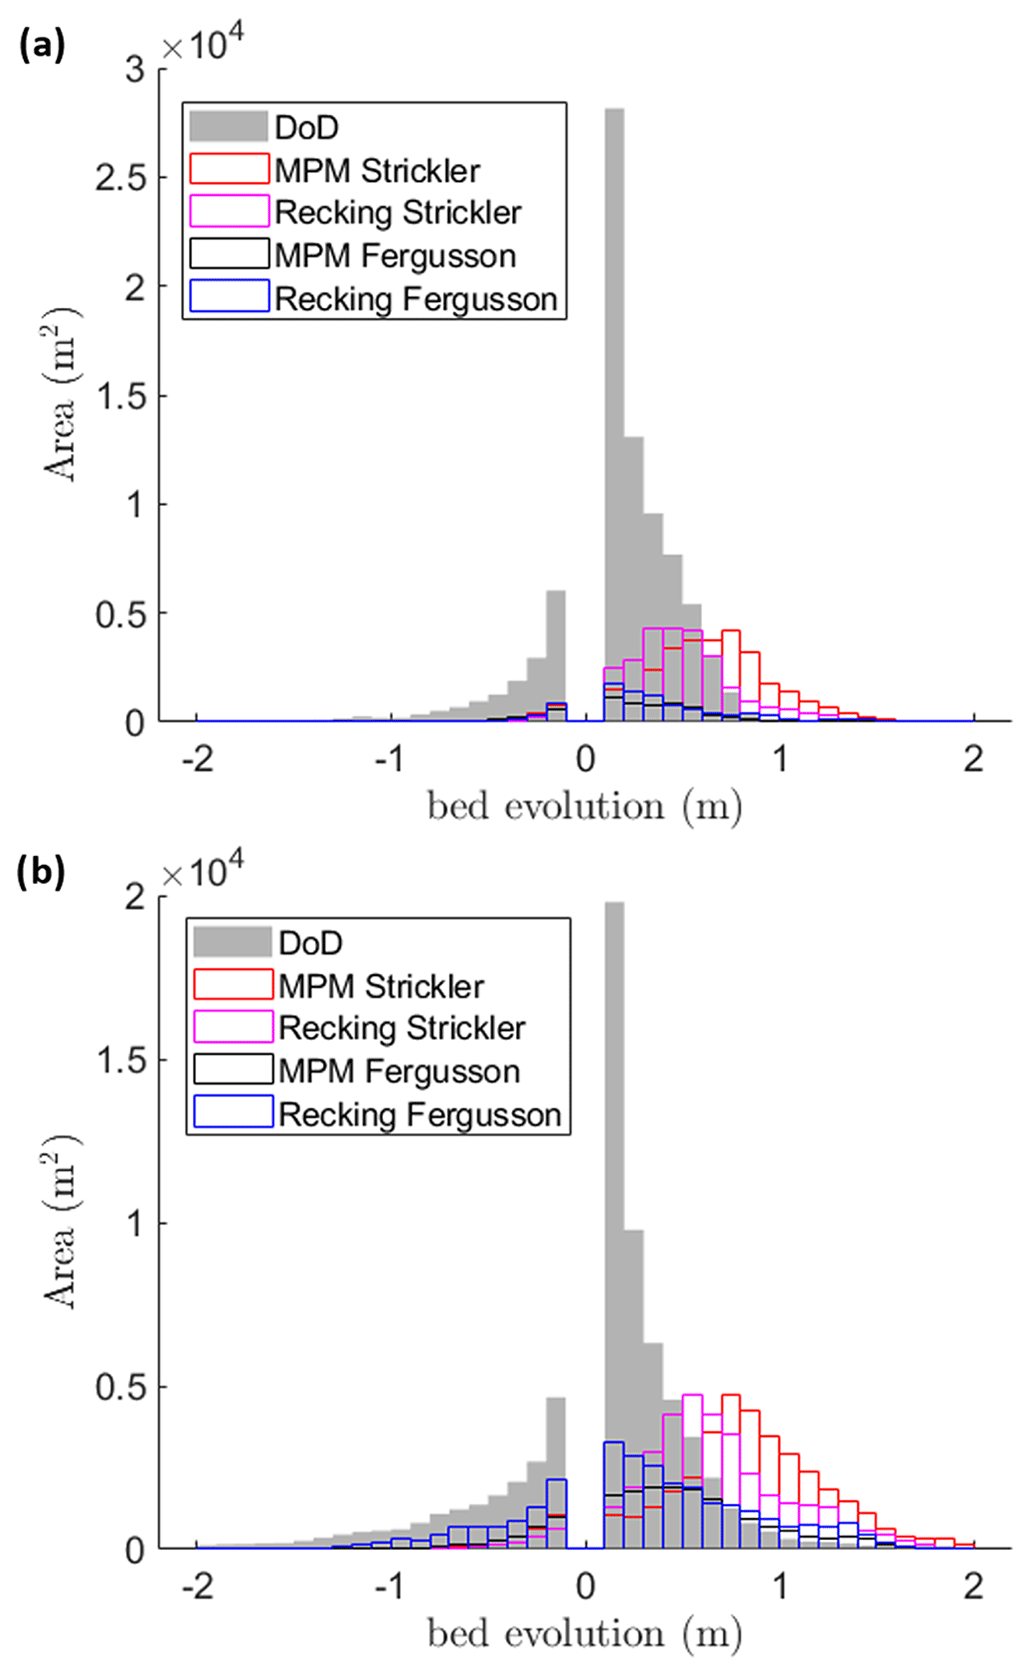
Figure 15Statistical distribution of erosion/deposition. The grey histogram shows observed bed elevation changes and the coloured ones show model predictions with the different bedload and friction equations within the LDG (a) and upstream the LDG (b).
5.5 Implementation of restoration scenarios
The model seems to provide reliable results with the Ferguson friction law, so this equation was selected to perform restoration scenario simulations. The two bedload transport equations (MPM and Recking) were considered. The MPM is considered to provide more extreme results that we view as the worst-case scenario, whereas the Recking equation is considered more realistic or even to minimise the transported volumes. Two restoration scenarios were performed using the lidar DEM surveyed in 2019 as the initial topography: business-as-usual (BAU), corresponding to the current situation, where we consider that no restoration measure has been implemented, and weir lowering (WL), implemented through the modification of the bathymetry, for which the downstream weir (Préchac) is lowered by 2 m. To assess the influence of each scenario, two cross sections, upstream and downstream the weir, were analysed (Fig. 16). For each restoration scenario (BAU and WL), the first simulation considered the 2019 topography and a flood event similar to the 2018 flood is injected. Then another “2018-type” flood event is injected on the resulting bathymetries of these two first simulations (Z_Sim_BAU and Z_Sim_WL). As a result, we can have an overview of the LDG reach behaviour depending on the selected restoration measure and the bedload equations after two flood events with 10-year return periods. Such events were chosen because they are both relatively large flood events with a rather low return period. In addition, this was also discussed with river managers, who want to be prepared for such events that might occur increasingly frequently.
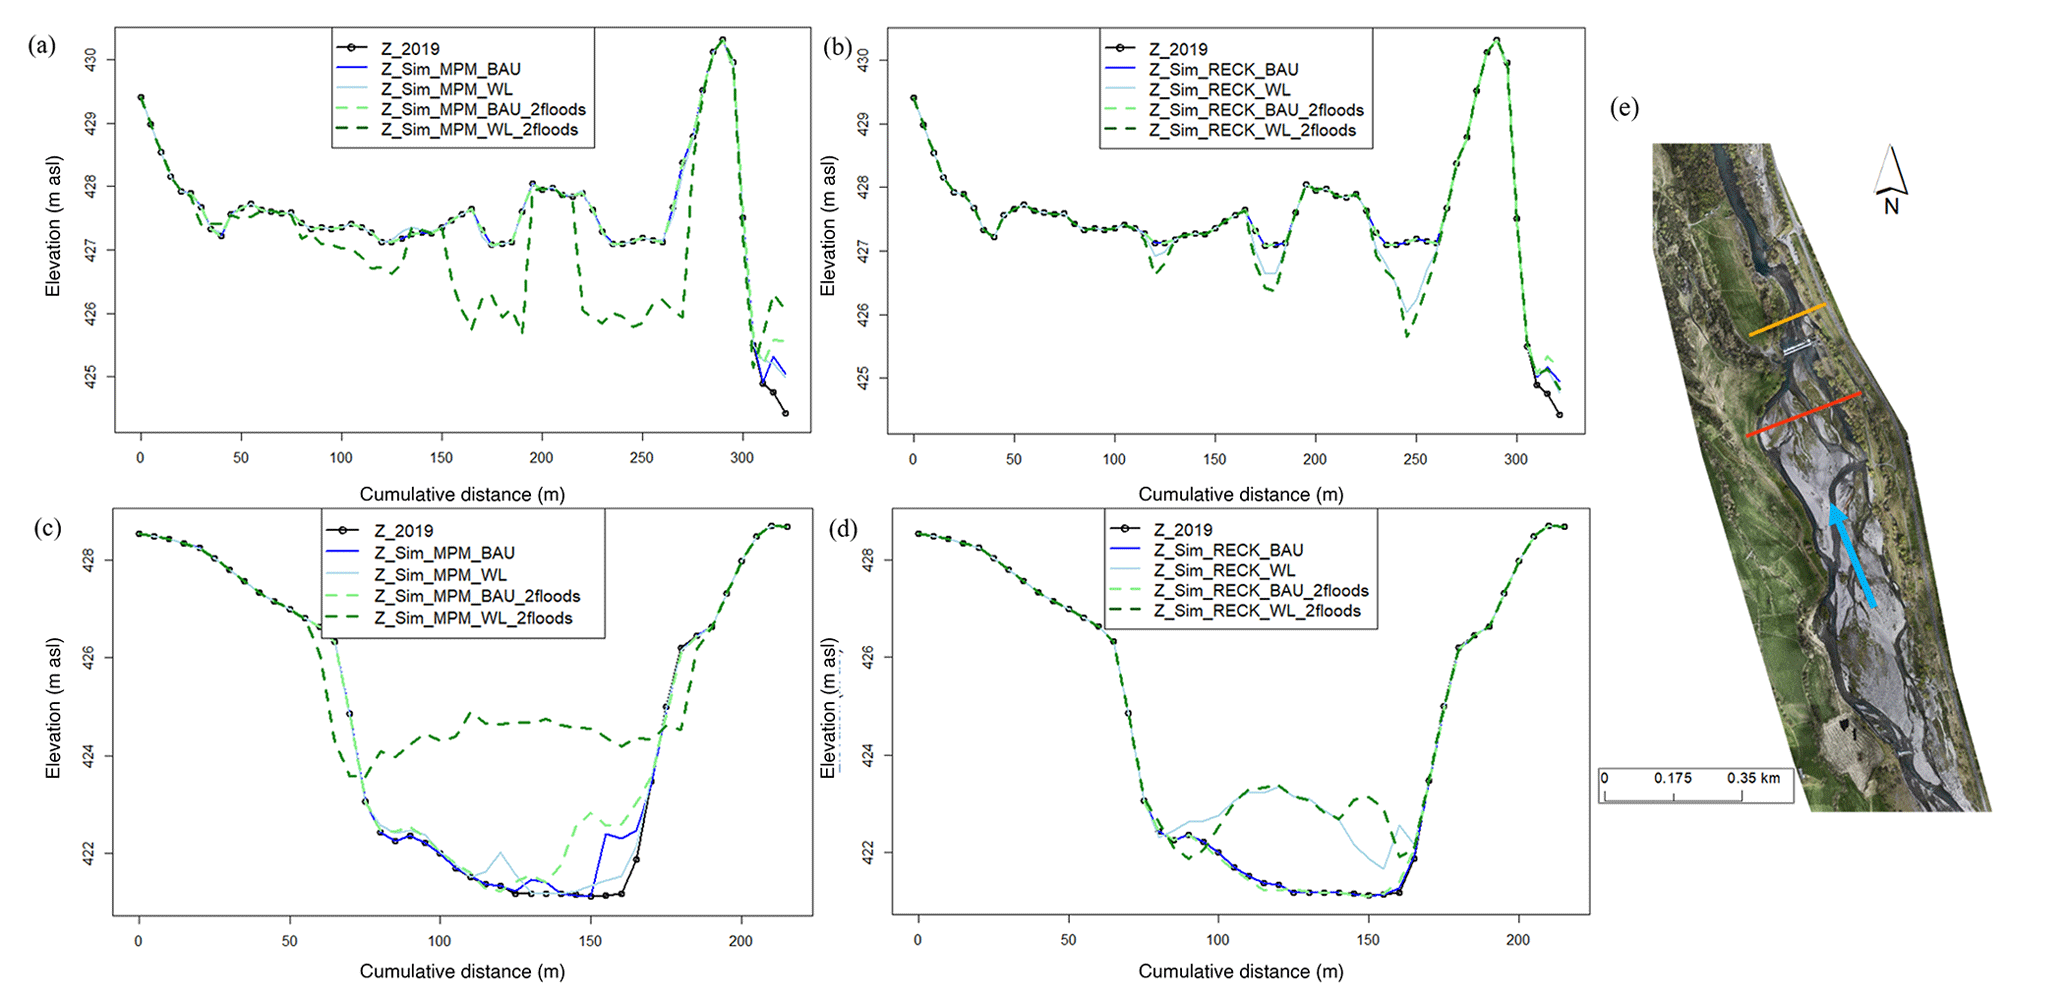
Figure 16Panels (a) and (b) show simulated cross sections for the MPM equation and Recking equation respectively upstream the Préchac weir (red cross section in (e)) for the BAU and the WL scenarios. Panels (c) and (d) show simulated cross sections for the MPM equation and the Recking equation respectively downstream the Préchac weir (orange cross section in (e)) for the same scenarios. Z_2019 represents the lidar DEM surveyed in 2019 that is the initial topography.
For the BAU scenario, very few morphological changes are observed upstream of the Préchac weir. Downstream, some deposition is observed with the MPM equation for the two different flood scenarios (one with a single 2018-like flood event and one with two consecutive 2018-like flood events). This consolidates the observations made above regarding the fact that this sediment transport equation tends to estimate more important sediment transport volumes than the Recking one for high flow situations. Very few changes are observed for the Recking equation for the BAU scenario. As expected, the WL scenario shows more bed elevation modifications for both sediment transport equations. Upstream the Préchac weir, very few changes are observed for the scenario with a single 2018-like flood event with the MPM equation. However, severe incisions are seen in the scenario with two consecutive 2018-like flood events (up to −2 m). For the Recking equation, the incision phenomenon is less exacerbated for the scenario with two consecutive 2018-like flood events. The opposite phenomenon is observed downstream for both sediment transport equations but with different amplitudes. Impressive sediment deposition can be seen with the MPM equation for the scenario with two consecutive 2018-like flood events (up to +2.5 m). Considerable aggradation for the Recking equation can be observed as well but with a lower amplitude (up to +1 m).
The surprising nature of the results is the fact that the reaction of the model with the MPM equation for the scenario with a single 2018-like flood event seems to be very modest, whether it is upstream or downstream the Préchac weir. This might be due to the fact that this is a threshold equation and that the critical shear stress in this area might not be exceeded in order to generate sediment transport and thus morphological modification. Conversely, as the Recking equation is not a threshold one, partial transport is estimated even for small discharges, which can explain the observed morphological changes.
6.1 Performance of sediment transport and friction equations
The results highlight the importance of the friction law as it conditions the results of the shear stress calculation and thus bedload transport. Friction laws are equations that usually link flow velocity to depth and roughness (Rickenmann and Recking, 2011). The Manning–Strickler equation is particularly suited for high submersion flows (Ferguson, 2007; Rickenmann and Recking, 2011). The Ferguson friction law is known to have the best performance from low to high submergence (Rickenmann and Recking, 2011), which is probably more suited to our case study and for which the water height is of the same order of magnitude as the roughness at the beginning of the flood. Then the submergence becomes high during the peak flood. This explains why sediment deposition and erosion appear to be overestimated with the Strickler equation. The Ferguson friction law seems thus better suited to the complexity of the processes that occur within the LDG.
For the two sediment transport equations, the model predicts that all deposition only occurs within the first half of the LDG. This could be due to the fact that many factors are not considered in the model such as the consideration of the whole grain-size distribution for bedload transport. In addition, the downstream part of the LDG is mainly composed of very fine sediment: bed elevation changes within this section are thus, for the most part, probably due to suspended load, not considered in our model. In addition, it is likely that the roughness parameters used by the two considered friction laws (K or D84) are not constant in both space and time. This can also explain some of the differences between the modelled and measured evolutions.
6.2 Is the BSS adapted to complex morphologies?
Each simulation was assessed with the BSS since this score was considered relevant for morphological change evaluation by the recent literature. More than 60 simulations were performed with different model parameter combinations. The best BSS results were obtained for simulations with very few riverbed changes (BSS = 0.06), which are not presented here. However, this simulation was not the best performing one in terms of deposited volumes and long profile changes. For the two best-performing simulations according to the longitudinal profile analysis and the deposited volumes (RECK × FERG and MPM × FERG), the BSS results are poor (−0.04 and −0.12 respectively). This raises the question of the relevance of the BSS criterion for morphologies as complex as the LDG reach. The fact that the model cannot accurately reproduce the different river branches due to the braiding phenomenon is approached in a very strict manner by the BSS. To our knowledge, models have difficulties predicting channel migration processes that occur in a braided river as this phenomenon is uncertain and random, especially during flood events. In addition, our model was not developed to reproduce braiding or deal with suspended sediment; however it is one of few models available that are able to model bed elevation changes (erosion and deposition) during large flood events. Here we use this well-constrained example to assess its ability to reproduce volumes and cross sections and to assess its suitability as a tool to inform policy-makers. Although the BSS can be advantageous as it helps to rapidly evaluate the performance of numerous simulations, using it on braided and thus complex morphologies does not seem relevant in our study site. Therefore another criterion adapted to braided rivers has also been considered: the statistical distribution of erosion and deposition, which is considered better suited for this kind of morphology (Fig. 15; Williams et al., 2016a).
6.3 Restoration of the LDG
Two restoration scenarios were performed around the LDG reach: weir lowering (WL) and business-as-usual (BAU). As expected, the WL scenario showed significant bed elevation changes for both sediment transport equations (MPM and Recking), whereas the BAU scenario predicted very few changes. In any case, even if the simulated bed elevation changes after the weir lowering considerably enhances the ecological situation of the LDG reach by reactivating sediment continuity, allowing for the circulation of anadromous fishes, this scenario might pose serious operational problems for river managers. The upstream incision can, for example, induce
-
temporary bank erosion that can lead to the loss of portions of agricultural lands;
-
the propagation of the incision upstream until it meets a blocking point (the Beaucens weir, and then the same problem will be observed);
-
the lowering of the water table on which farmers depend;
-
the disconnection of the fishery water intake.
The significant deposition observed downstream can increase flood risks considering that it is already vulnerable as many stakes are located in this area. As we can see in Fig. 16, the simulated riverbed with the MPM equation for the two 2018 flood events is very close to the left bank's altitude.
However, our model's simulated over-deposition and incision have some limitations. Indeed, only bedload was considered with coarse sediment and not the total sediment mixture. The suspended load is completely neglected. Still, a significant percentage of the LDG is composed of very fine sediments (silt, clay), especially downstream, which might be mobilised quickly after an action on the downstream weir. This means that a portion of the mobilised sediment will certainly be flushed far downstream and not have time to settle and induce the simulated morphological changes. Deposition would still be observed but to a lesser extent. In addition, our model only considers one homogeneous grain size in the whole domain, which might also explain the over-deposition simulated downstream. One potential improvement for the model would thus be to consider the whole grain-size distribution spatially distributed over the studied domain to have a more realistic view of the impacts of any restoration measure. This can be done with the brand new sediment transport module GAIA developed to handle grain-size issues better. To sum up, our model reproduces realistic tendencies but can still be improved to make better volumetric estimations. One recommendation to decision-makers is to not only consider the downstream weir but to consider both weirs in the restoration project. In addition, in such kinds of complex morphologies, the main advice is to consider an adaptive management strategy with step-by-step monitoring and eventual corrections if needed.
The evolution of river morphology is very complicated to predict, especially in the case of mountain and Piedmont rivers with complex morphologies. River restoration in such terrain can thus be challenging for river managers due to the random nature of riverbed evolution. Reliable hydromorphological numerical modelling combined with good field expertise can be helpful in this case for better river management. Within this framework, our study focused on the development of a 2D hydro-morphodynamic model over the Lac des Gaves reach in the Hautes-Pyrénées, France, with the TELEMAC-MASCARET system. This river reach has precisely the morphological characteristics mentioned above as it is a braided channel with a very heterogeneous grain-size distribution. The aim was to reproduce the bed elevation changes following the 2018 flood event that considerably impacted the channel's morphology to propose relevant and sustainable restoration solutions. Two bedload transport equations, Meyer-Peter–Müller and Recking, were used with the Ferguson and the Strickler friction laws to assess sediment transport processes. Three performance criteria were considered to assess the validity of the developed model: the comparison of longitudinal profiles, the Brier skill score, and the analysis of deposited volumes within the LDG.
The 2D hydro-morphodynamic model performed realistic simulations with the Ferguson friction law for both sediment transport equations (Recking and MPM). These results confirm the necessity of using a friction equation adapted to river reaches with high relative roughness and significant sediment load. The developed model tends to overestimate sediment deposition within the LDG. This might be due to the fact that it is a monodisperse model, considering bedload only with one homogeneous grain size, whereas in reality, finer sediments are also available. These are likely to be “flushed” and travel longer distances before being deposited, which is not simulated here. The simulated bed elevation changes can thus be considered to overestimate that which can actually be seen on the ground. Further improvements regarding these aspects are necessary, knowing the heterogeneity of sediment sizes within the LDG reach. Simulations on the updated sediment transport module GAIA, developed to handle the grain-size distribution issue better, are considered to improve the hydro-morphodynamic model.
Moreover, this study shows that the BSS might not be the right performance criterion to consider for rivers with braided morphologies. These complex configurations remain very difficult to reproduce using 2D models. The BSS score can thus give very pessimistic results, whereas the model correctly reproduces the most important processes (erosion and deposition areas). We recommend considering an integrative approach where the modeller combines multiple assessment criteria such as long profiles and cross-section elevation changes and volumetric estimations to evaluate the model's performance.
Finally, even if our model can still be improved, it provides valuable information on the possible consequences of a restoration scenario to river managers. Many operational issues were raised for the weir-lowering scenario, such as the increase in flood risks downstream or severe erosion upstream that could translate the issue to the upstream weir. Knowing the complexity of river restoration projects in these kinds of complex morphologies, considering an adaptive management strategy with step-by-step monitoring, and eventual corrections might be more appropriate rather than a radical measure. In addition, enhancing the hydro-morphodynamic model after considering the whole grain-size distribution and its actualisation after each morphogenetic event can be used as a decision-making tool that can assist river managers and help them communicate with elected representatives.
The Mascaret code is available at https://www.opentelemac.org/index.php/download (open TELEMAC-MASCARET, 2023).
Data can be accessed by contacting Olivier Frysou: olivier.frysou@plvg.fr.
RY carried out the simulations and the field experiments in collaboration with HR, LC, and OF. RY wrote the article with support from LC and HR. FP helped supervise the project and organise a stakeholder meeting to communicate the results with elected representatives.
The contact author has declared that none of the authors has any competing interests.
Publisher's note: Copernicus Publications remains neutral with regard to jurisdictional claims made in the text, published maps, institutional affiliations, or any other geographical representation in this paper. While Copernicus Publications makes every effort to include appropriate place names, the final responsibility lies with the authors.
We are grateful to the Pays de Lourdes et des Vallées des Gaves public institution for having given us the opportunity to undertake this work. This research was funded by the three following groups: the Adour-Garonne Water Agency, the government, and the Occitanie Pyrénées Méditerranée region, whom we thank sincerely.
This research has been supported by the Agence de l'Eau Adour-Garonne (grant no. 240651666) and the Région Occitanie Pyrénées-Méditerranée (grant no. 16002759).
This paper was edited by Tom Coulthard and Lina Polvi Sjöberg and reviewed by Damien Kuss, Clément Misset, and Saraswati Thapa.
Aguirre, D., Bui, M., Giehl, S., Reisenbüchler, M., and Rutschmann, P.: Development of a hydro-morphodynamic Model for Sediment Management in the Rosenheim Reservoir, in: Proceedings of the Telemac User Conference 2019 (TUC2019), Zenodo, https://doi.org/10.5281/zenodo.3611498, 2020. a, b
Arnaud, F.: Approches géomorphologiques historique et expérimentale pour la restauration de la dynamique sédimentaire d'un tronçonfluvial aménagé: le cas du Vieux Rhin entre Kembs et Breisach (France, Allemagne), PhD thesis, Université Lumière Lyon 2, https://doi.org/10.58165/evs-2z6x55, 2012. a
Arnaud-Fassetta, G., Astrade, L., Bardou, E., Corbonnois, J., Delahaye, D., Fort, M., Gautier, E., Jacob, N., Peiry, J.-L., Piégay, H., and Penven, M.-J.: Fluvial geomorphology and flood-risk management, Géomorphologie, 15, 109–128, https://doi.org/10.4000/geomorphologie.7554 2009. a
Badoux, A., Andres, N., and Turowski, J. M.: Damage costs due to bedload transport processes in Switzerland, Nat. Hazards Earth Syst. Sci., 14, 279–294, https://doi.org/10.5194/nhess-14-279-2014, 2014. a, b
Blanpied, J.: La torrentialité dans les Pyrénées centrales: évolution depuis la fin du Petit Âge Glaciaire, spécificités et dynamiques géomorphologiques actuelles, PhD thesis, Université de Toulouse – Jean Jaurès, 2019. a
Carr, K. J., Tu, T., Ercan, A., Kavvas, M. L., and Nosacka, J.: Two-Dimensional Unsteady Flow Modeling of Flood Inundation in a Leveed Basin, in: World Environmental and Water Resources Congress 2015, 1597–1606, https://doi.org/10.1061/9780784479162.156, 2015. a
Chapuis, M.: Mobilité des sédiments fluviaux grossiers dans les systèmes fortement anthropisés: éléments pous la gestion de la basse vallée de la Durance, PhD thesis, Université Aix Marseille, 2012. a
Cordier, F., Tassi, P., Claude, N., Crosato, A., Rodrigues, S., and Pham Van Bang, D.: Numerical Study of Alternate Bars in Alluvial Channels With Nonuniform Sediment, Water Resour. Res., 55, 2976–3003, https://doi.org/10.1029/2017WR022420, 2019. a
De Linares, M.: Two-dimensional numerical modelling of bed load transport and fluvial morphology. Validation on two sites on the Loire river and on the Arc river, Theses, Université Joseph-Fourier, Grenoble I, https://tel.archives-ouvertes.fr/tel-00193119 (last access: January 2019), 2007. a, b, c
de Saint-Venant, M.: Théorie du mouvement non permanent des eaux, avec application aux crues des rivières et à l'introduction des marées dan leur lit, Paris, frei, https://www.sudoc.abes.fr/cbs/xslt/DB=2.1//SRCH?IKT=12&TRM=14531846X (last access: 17 November 2023), 1871. a
Douinot, A., Roux, H., Garambois, P.-A., and Dartus, D.: Using a multi-hypothesis framework to improve the understanding of flow dynamics during flash floods, Hydrol. Earth Syst. Sci., 22, 5317–5340, https://doi.org/10.5194/hess-22-5317-2018, 2018. a
DREAL Midi-Pyrénées: Crues des Pyrénées des 18 et 19 Juin 2013. Retour d'expérience global, Tech. rep., DREAL, 2013. a
Einstein, H. A.: The bed-load function for sediment transportation in open channel flows, 1026, US Government Printing Office, https://doi.org/10.22004/ag.econ.156389, 1950. a
Exner, F. M.: Zur Physik der Düunen, 1920. a
Ferguson, R.: Flow resistance equations for gravel- and boulder-bed streams, Water Resour. Res., 43, W05427, https://doi.org/10.1029/2006WR005422, 2007. a, b, c, d, e
Gonzales De Linares, M., Mano, V., Piton, G., and Recking, A.: Modelling of massive bedload deposition in a debris basin: cross comparison between numerical and small scale modelling, in: RiverFlow 2020, Proceedings of the 10th Conference on Fluvial Hydraulics, Delft, the Netherlands, https://hal.archives-ouvertes.fr/hal-02935173 (last access: 17 November 2023), 2020. a
Gonzales de Linares, M., Ronzani, F., Recking, A., Mano, V., and Piton, G.: Coupling Surface Grain-Size and Friction for Realistic 2D Modelling of Channel Dynamics on Massive Bedload Deposition, in: Conference: SimHydro 2021: Models for complex and global water issues – Practices and expectations, vol. 30 of Actes de la conférence SimHydro 2021, Sophia-Antipolis, France, 1–10, https://hal.archives-ouvertes.fr/hal-03363327 last access: 17 November 2023), 2021. a
Guan, M., Wright, N. G., and Andrew Sleigh, P.: Multiple effects of sediment transport and geomorphic processes within flood events: Modelling and understanding, Int. J. Sediment Res., 30, 371–381, https://doi.org/10.1016/j.ijsrc.2014.12.001, 2015. a, b
Guan, M., Carrivick, J. L., Wright, N. G., Sleigh, P. A., and Staines, K. E.: Quantifying the combined effects of multiple extreme floods on river channel geometry and on flood hazards, J. Hydrol., 538, 256–268, https://doi.org/10.1016/j.jhydrol.2016.04.004, 2016. a
Ham, D. and Church, M.: Morphodynamics of an extended bar complex, Fraser River, British Columbia, Earth Surf. Proc. Land., 37, 1074–1089, https://doi.org/10.1002/esp.3231, 2012. a
Hervouet, J.-M.: Hydrodynamique des écoulements à surface libre: modélisation numérique avec la méthode des éléments finis, Presses de l'école nationale des ponts et chaussées, Paris, ISBN 2-85978-379-2 (br.), 2003. a, b
IDEALP: Etude d'hydraulique torrentielle et morphodynamique du Bastan, Tech. rep., IDEALP, 2014. a
Kang, J. and Yeo, H.: Survey and analysis of the sediment transport for river restoration: The case of the Magyeong river, Open J. Civ. Eng., 5, 399–411, https://doi.org/10.4236/ojce.2015.54040, 2015. a
Koch, F. and Flokstra, C.: Bed level computations for curved alluvial channels, in: XIXth Congress of the International Association for Hydraulics Research, New Delhi, India, 1981. a
Lefort, P.: Une formule semi-empirique pour le transport solide des rivières et des torrents, in: Colloque SHF – Transport solide et gestion des sédiments en milieux naturels et urbains, 2007. a
Lepesqueur, J., Hostache, R., Martínez-Carreras, N., Montargès-Pelletier, E., and Hissler, C.: Sediment transport modelling in riverine environments: on the importance of grain-size distribution, sediment density, and suspended sediment concentrations at the upstream boundary, Hydrol. Earth Syst. Sci., 23, 3901–3915, https://doi.org/10.5194/hess-23-3901-2019, 2019. a
Liébault, F., Peteuil, C., Jousse, C., Fragnol, B., Theule, J., Berger, F., Saez, J. L., Gotteland, A., Jaboyedoff, M., and Loye, A.: L'utilisation des plages de dépôts pour la mesure du transport solide torrentiel: applications dans le département de l'Isère, Tech. rep., Conseil général de l'Isère, https://irsteadoc.irstea.fr/cemoa/PUB00032641 (last access: 17 November 2023), 2010. a
Malavoi, J., Garnier, C. C., Landon, N., Recking, A., and Baran, P.: Eléments de connaissance pour la gestion du transport solide en rivière, ONEMA, 2011. a
Meyer-Peter, E. and Müller, R.: Formulas for Bed-Load Transport, in: 2nd meeting of the International Association for Hydraulic Structures Research, 7 May 1948, Stockholm, http://resolver.tudelft.nl/uuid:4fda9b61-be28-4703-ab06-43cdc2a21bd7 (last access: 17 November 1948), 1948a. a, b, c, d
Misset, C., Recking, A., Legout, C., Bakker, M., Bodereau, N., Borgniet, L., Cassel, M., Geay, T., Gimbert, F., Navratil, O., Piegay, H., Valsangkar, N., Cazilhac, M., Poirel, A., and Zanker, S.: Combining multi-physical measurements to quantify bedload transport and morphodynamics interactions in an Alpine braiding river reach, Geomorphology, 351, 106877, https://doi.org/10.1016/j.geomorph.2019.106877, 2020. a
open TELEMAC-MASCARET: Downloading the TELEMAC system, https://www.opentelemac.org/index.php/download (last access: 17 November 2023), 2023. a
Orseau, S., Huybrechts, N., Tassi, P., Pham Van Bang, D., and Klein, F.: Two-dimensional modeling of fine sediment transport with mixed sediment and consolidation: Application to the Gironde Estuary, France, Int. J. Sediment Res., 36, 736–746, https://doi.org/10.1016/j.ijsrc.2019.12.005, 2021. a
PLVG: Mise en place d'un Programme d'Actions de Prévention des Inondations (PAPI) sur le bassin versant du Gave de Pau Bigourdan – Etat des lieux – Diagnostic, Tech. rep., PLVG, 2015. a, b
Ramirez, J. A., Zischg, A. P., Schürmann, S., Zimmermann, M., Weingartner, R., Coulthard, T., and Keiler, M.: Modeling the geomorphic response to early river engineering works using CAESAR-Lisflood, Anthropocene, 32, 100266, https://doi.org/10.1016/j.ancene.2020.100266, 2020. a
Recking, A.: A comparison between flume and field bed load transport data and consequences for surface-based bed load transport prediction, Water Resour. Res., 46, W03518, https://doi.org/10.1029/2009WR008007, 2010. a
Recking, A.: Simple method for calculating reach-averaged bed-load transport, J. Hydraul. Eng., 139, 70–75, 2013a. a, b
Recking, A.: An analysis of nonlinearity effects on bedload transport prediction, J.Geophys. Res., 118, 1264–1281, https://doi.org/10.1002/jgrf.20090, 2013b. a, b
Recking, A., Leduc, P., Liébault, F., and Church, M.: A field investigation of the influence of sediment supply on step-pool morphology and stability, Geomorphology, 139–140, 53–66, https://doi.org/10.1016/j.geomorph.2011.09.024, 2012. a, b
Recking, A., Piton, G., Vazquez-Tarrio, D., and Parker, G.: Quantifying the Morphological Print of Bedload Transport, Earth Surf. Proc. Land., 41, 809–822, https://doi.org/10.1002/esp.3869, 2016. a, b, c, d
Reid, S. C., Lane, S. N., Berney, J. M., and Holden, J.: The timing and magnitude of coarse sediment transport events within an upland, temperate gravel-bed river, Geomorphology, 83, 152–182, https://doi.org/10.1016/j.geomorph.2006.06.030, 2007. a, b
Reisenbüchler, M., Bui, M. D., Skublics, D., and Rutschmann, P.: Enhancement of a numerical model system for reliably predicting morphological development in the Saalach River, Int. J. River Basin Manage., 18, 335–347, https://doi.org/10.1080/15715124.2019.1628034, 2019a. a, b
Reisenbüchler, M., Bui, M. D., Skublics, D., and Rutschmann, P.: An integrated approach for investigating the correlation between floods and river morphology: A case study of the Saalach River, Germany, Sci. Total Environ., 647, 814–826, https://doi.org/10.1016/j.scitotenv.2018.08.018, 2019b. a
Reisenbüchler, M., Bui, M. D., Skublics, D., and Rutschmann, P.: Enhancement of a numerical model system for reliably predicting morphological development in the Saalach River, Int. J. River Basin Manage., 18, 335–347, https://doi.org/10.1080/15715124.2019.1628034, 2020. a
Rickenmann, D. and Recking, A.: Evaluation of flow resistance in gravel-bed rivers through a large filed data set, Water Resour. Res., 47, W07538, https://doi.org/10.1029/2010WR009793, 2011. a, b, c
Rickenmann, D., Badoux, A., and Hunzinger, L.: Significance of sediment transport processes during piedmont floods: the 2005 flood events in Switzerland, Earth Surf. Proc. Land., 41, 224–230, https://doi.org/10.1002/esp.3835, 2016. a, b
Riesterer, J., Wenka, T., Brudy-Zippelius, T., and Nestmann, F.: Bed load transport modeling of a secondary flow influenced curved channel with 2D and 3D numerical models, J. Appl. Water Eng. Res., 4, 54–66, https://doi.org/10.1080/23249676.2016.1163649, 2016. a
Rifai, I., Le Bouteiller, C., and Recking, A.: Numerical study of braiding channels formation, in: Telemac Mascaret User Club Conference, Grenoble, France, 159–167, https://hal.inrae.fr/hal-02606139 (last access: 17 November 2023), 2014. a
Rinaldi, M. and Darby, S. E.: 9 Modelling river-bank-erosion processes and mass failure mechanisms: progress towards fully coupled simulations, in: Gravel-Bed Rivers VI: From Process Understanding to River Restoration, vol. 11 of Developments in Earth Surface Processes, edited by: Habersack, H., Piégay, H., and Rinaldi, M., Elsevier, 213–239, https://doi.org/10.1016/S0928-2025(07)11126-3, 2007. a, b
Roux, H., Labat, D., Garambois, P.-A., Maubourguet, M.-M., Chorda, J., and Dartus, D.: A physically-based parsimonious hydrological model for flash floods in Mediterranean catchments, Nat. Hazards Earth Syst. Sci., 11, 2567–2582, https://doi.org/10.5194/nhess-11-2567-2011, 2011. a
Roux, H., Amengual, A., Romero, R., Bladé, E., and Sanz-Ramos, M.: Evaluation of two hydrometeorological ensemble strategies for flash-flood forecasting over a catchment of the eastern Pyrenees, Nat. Hazards Earth Syst. Sci., 20, 425–450, https://doi.org/10.5194/nhess-20-425-2020, 2020. a
Soulsby, R.: Dynamics of Marine Sands: A Manual for Practical Applications, Thomas Telford, London, http://site.ebrary.com/id/10868638 (last access: 17 November 2023), 1997. a
Strickler, A.: Beiträge zur Frage der Geschwindigkeitsformel und der Rauhigkeitszahlen für Ströme, Kanäle und geschlossene Leitungen: mit … Tab., Im Selbstverlag, 1923. a
SUEZ Consulting: Étude hydraulique et AMC pour évaluer l'intérêt de considérer la Voie Verte des Gaves comme un ouvrage de protection contre les crues. Phase 2: Diagnostic – étude hydrologique, Tech. rep., PLVG, 2019. a
Sutherland, J., Peet, A., and Soulsby, R.: Evaluating the performance of morphological models, Coast. Eng., 51, 917–939, https://doi.org/10.1016/j.coastaleng.2004.07.015, 2004. a
Tal, M. and Paola, C.: Effects of vegetation on channel morphodynamics: results and insights from laboratory experiments, Earth Surf. Proc. Land., 35, 1014–1028. https://doi.org/10.1002/esp.1908, 2010. a
Tassi, P. and Villaret, C.: Sisyphe User Manual, 2014. a, b, c
Tu, T., Carr, K. J., Ercan, A., Trinh, T., Kavvas, M. L., and Nosacka, J.: Assessment of the effects of multiple extreme floods on flow and transport processes under competing flood protection and environmental management strategies, Sci. Total Environ., 607–608, 613–622, https://doi.org/10.1016/j.scitotenv.2017.06.271, 2017. a
van Rijn, L. C.: Sediment Transport, Part I: Bed Load Transport, J. Hydraul. Eng., 110, 1431–1456, https://doi.org/10.1061/(asce)0733-9429(1984)110:10(1431), 1984a. a
van Rijn, L. C.: Sediment Transport, Part II: Suspended Load Transport, J. Hydraul. Eng., 110, 1613–1641, https://doi.org/10.1061/(ASCE)0733-9429(1984)110:11(1613), 1984b. a
Wilcock, P. R. and Crowe, J. C.: Surface-based transport model for mixed-size sediment, J. Hydraul. Eng., 129, 120–128, 2003. a
Williams, R. D., Brasington, J., Hicks, M., Measures, R., Rennie, C. D., and Vericat, D.: Hydraulic validation of two-dimensional simulations of braided river flow with spatially continuous aDcp data, Water Resour. Res., 49, 5183–5205, https://doi.org/10.1002/wrcr.20391, 2013. a
Williams, R. D., Brasington, J., and Hicks, D. M.: Numerical Modelling of Braided River Morphodynamics: Review and Future Challenges, Geogr. Compass, 10, 102–127, https://doi.org/10.1111/gec3.12260, 2016a. a, b, c
Williams, R. D., Measures, R., Hicks, D. M., and Brasington, J.: Assessment of a numerical model to reproduce event-scale erosion and deposition distributions in a braided river, Water Resour. Res., 52, 6621–6642, https://doi.org/10.1002/2015WR018491, 2016b. a
Wohl, E., Bledsoe, B. P., Jacobson, R. B., Poff, N. L., Rathburn, S. L., Walters, D. M., and Wilcox, A. C.: The Natural Sediment Regime in Rivers: Broadening the Foundation for Ecosystem Management, BioScience, 65, 358–371, https://doi.org/10.1093/biosci/biv002, 2015. a
Wolman, M. G.: A method of sampling coarse river-bed material, Eos Trans. AGU, 35, 951–956, https://doi.org/10.1029/TR035i006p00951, 1954. a