the Creative Commons Attribution 4.0 License.
the Creative Commons Attribution 4.0 License.
 | 19 Jan 2023
Entrainment and deposition of boulders in a gravel bed river
Eric Lajeunesse
Olivier Devauchelle
Vincent J. Langlois
Bedload transport, entrainment of coarse sediment by a river, is inherently a stochastic and intermittent process whose monitoring remains challenging. Here, we propose a new method to characterize bedload transport in the field. Using an uncrewed aerial vehicle (UAV) equipped with a high-resolution camera, we recorded yearly images of a bar of the Grande Rivière des Vieux-Habitants, a gravel bed river located on Basse-Terre Island (Guadeloupe, French West Indies). These images, combined with high-frequency measurements of the river discharge, allow us to monitor the evolution of the population of sediments of a diameter between 0.5 and 0.75 m on the riverbed. Based on this dataset, we estimate the smallest discharge that can move these boulders and calculate the duration of effective transport. We find that the transport of boulders occurs for approximately 10 h yr−1. When plotted as a function of the effective transport time, a given population of boulders decreases exponentially with an effective residence time of approximately 17 h. This exponential decay suggests that the probability of dislodging a grain from the bed is proportional to the number of grains at repose on the bed, an observation consistent with laboratory experiments. Finally, the residence time of bedload particles on a riverbed can be used to evaluate bedload discharge.
- Article
(5965 KB) - Full-text XML
- BibTeX
- EndNote


Rivers collect sediment from the surrounding hillslopes and carry it to the ocean (Leopold and Emmett, 1976). The resultant sediment discharge is often intermittent: only during floods does the river exert a force strong enough to move the sediments that make up its bed (Phillips and Jerolmack, 2014; Phillips et al., 2018). Flood after flood, a river gradually exports sediment from its catchment. The frequency of floods and the quantity of sediment that it transports thus set the erosion rate within the catchment (Wolman and Miller, 1960).
The fate of a particle entrained during a flood depends on its size. Fine sediments are often carried in suspension. In contrast, coarse sediments travel as bedload: they roll, slip and bounce on the riverbed, until their motion eventually ceases and the grains settle at a downstream location. This process is inherently stochastic (Einstein, 1937). A turbulent burst or a collision with a traveling grain can dislodge a particle from the bed (Charru et al., 2004; Ancey et al., 2008; Houssais and Lajeunesse, 2012). Once in motion, the particle's velocity fluctuates and its eventual deposition is, again, a random process (Lajeunesse et al., 2010; Furbish et al., 2012b). Even in a steady flow, a sediment particle spends most of its time at rest on the bed; its journeys downstream are rare and short events (Lajeunesse et al., 2017). Overall, the combination of these stochastic events generates a downstream discharge of sediment, referred to as “bedload transport”, whose intensity depends on the properties of the flow and on the size, density and shape of the sediment particles (Einstein, 1950; Bagnold, 1973, 1977).
Bedload transport accounts for a large part of the sediment load exported from mountainous catchments (Métivier et al., 2004; Meunier et al., 2006; Liu et al., 2008). It carves the channels of bedrock rivers, controls the shape and size of alluvial rivers, and generates ripples, dunes, bars and terraces (Gomez, 1991; Church, 2006; Seminara, 2010; Devauchelle et al., 2010; Aubert et al., 2016; Métivier et al., 2017; Dunne and Jerolmack, 2020; Abramian et al., 2020). In the field, geomorphologists measure bedload by collecting the moving particles in traps or baskets (Helley and Smith, 1971; Leopold and Emmett, 1976; Habersack et al., 2017). These direct measurements are laborious and can be dangerous during flood events. These difficulties have motivated the development of alternative methods. One may, for example, estimate the intensity of bedload transport from the acoustic or seismic noise it generates (Burtin et al., 2008, 2011, 2014; Turowski and Rickenmann, 2009; Mao et al., 2016). However, the calibration of these seismic and acoustic proxies still requires direct measurements (Gimbert et al., 2014; Thorne, 2014; Burtin et al., 2016).
An alternative is to monitor the displacements of individual particles (Dietrich and Smith, 1984). These tracers, often painted pebbles or boulders or radio frequency identification passive integrated transponders (RFID PITs) inserted into the pebbles or the boulders, travel with the flow during floods (Cassel et al., 2020). Between two floods, one may locate the tracers on the exposed riverbed. By repeating this procedure, one gradually reveals the trajectories of the tracers. Although laborious, this method provides reliable information, without perturbing the flow. Tracer particles have been used to evaluate the storage of particles in the sediment bed (Haschenburger and Church, 1998; Bradley, 2017) and to estimate the distance that a bedload particle travels before it settles downstream (Ferguson and Wathen, 1998; Martin et al., 2012). When the population of tracers is large enough, its transport results in a plume that disperses as it travels downstream (Bradley and Tucker, 2012; Phillips and Jerolmack, 2014). It is then possible to infer the mean bedload discharge from the elongation of this plume (Lajeunesse et al., 2018).
Measuring bedload transport, nonetheless, remains arduous and some questions are still open. On average, how often does a river transport its coarsest sediment? How long does a boulder remain on the riverbed? We address these questions with a new approach. Instead of tracking the particles when they travel, we monitor the evolution of their population at a fixed location. In that sense, our method can be called “Eulerian” as opposed to Lagrangian particle tracking. Using a drone, we recorded yearly images of the bed of the Grande Rivière des Vieux-Habitants (hereafter “Vieux-Habitants river”) (Sect. 2), a gravel bed river located in Basse-Terre Island (Guadeloupe, French West Indies). As the resolution of our images does not allow us to observe particles smaller than 0.10 to 0.15 m, we restrict our analysis to sediment of a size of between 0.5 and 0.75 m. Given the resolution of our images, these boulders are indeed easier to track. However, the method we propose can be extended to smaller grains given the appropriate image resolution. Combined with high-frequency measurements of the river discharge, these images allow us to (1) follow the population of boulders (Terry and Goff, 2014) that make up the bed and (2) characterize the evolution of bedload transport in this river over 8 years.
We conducted our investigation on Basse-Terre Island, a volcanic island of the Guadeloupe archipelago, which is part of the subduction arc of the Lesser Antilles (Feuillet et al., 2002 – Fig. 1a). Basse-Terre's climate is tropical with daily temperatures between 24 and 28 ∘C and an average rainfall rate of about 5200 mm yr−1. Rainfall occurs mainly as short and intense events. During the rainy season, which extends from June to January, storms and hurricanes are frequent and the rainfall rate may reach up to 590 mm d−1. As a result, the discharge of rivers varies rapidly with frequent flash floods.
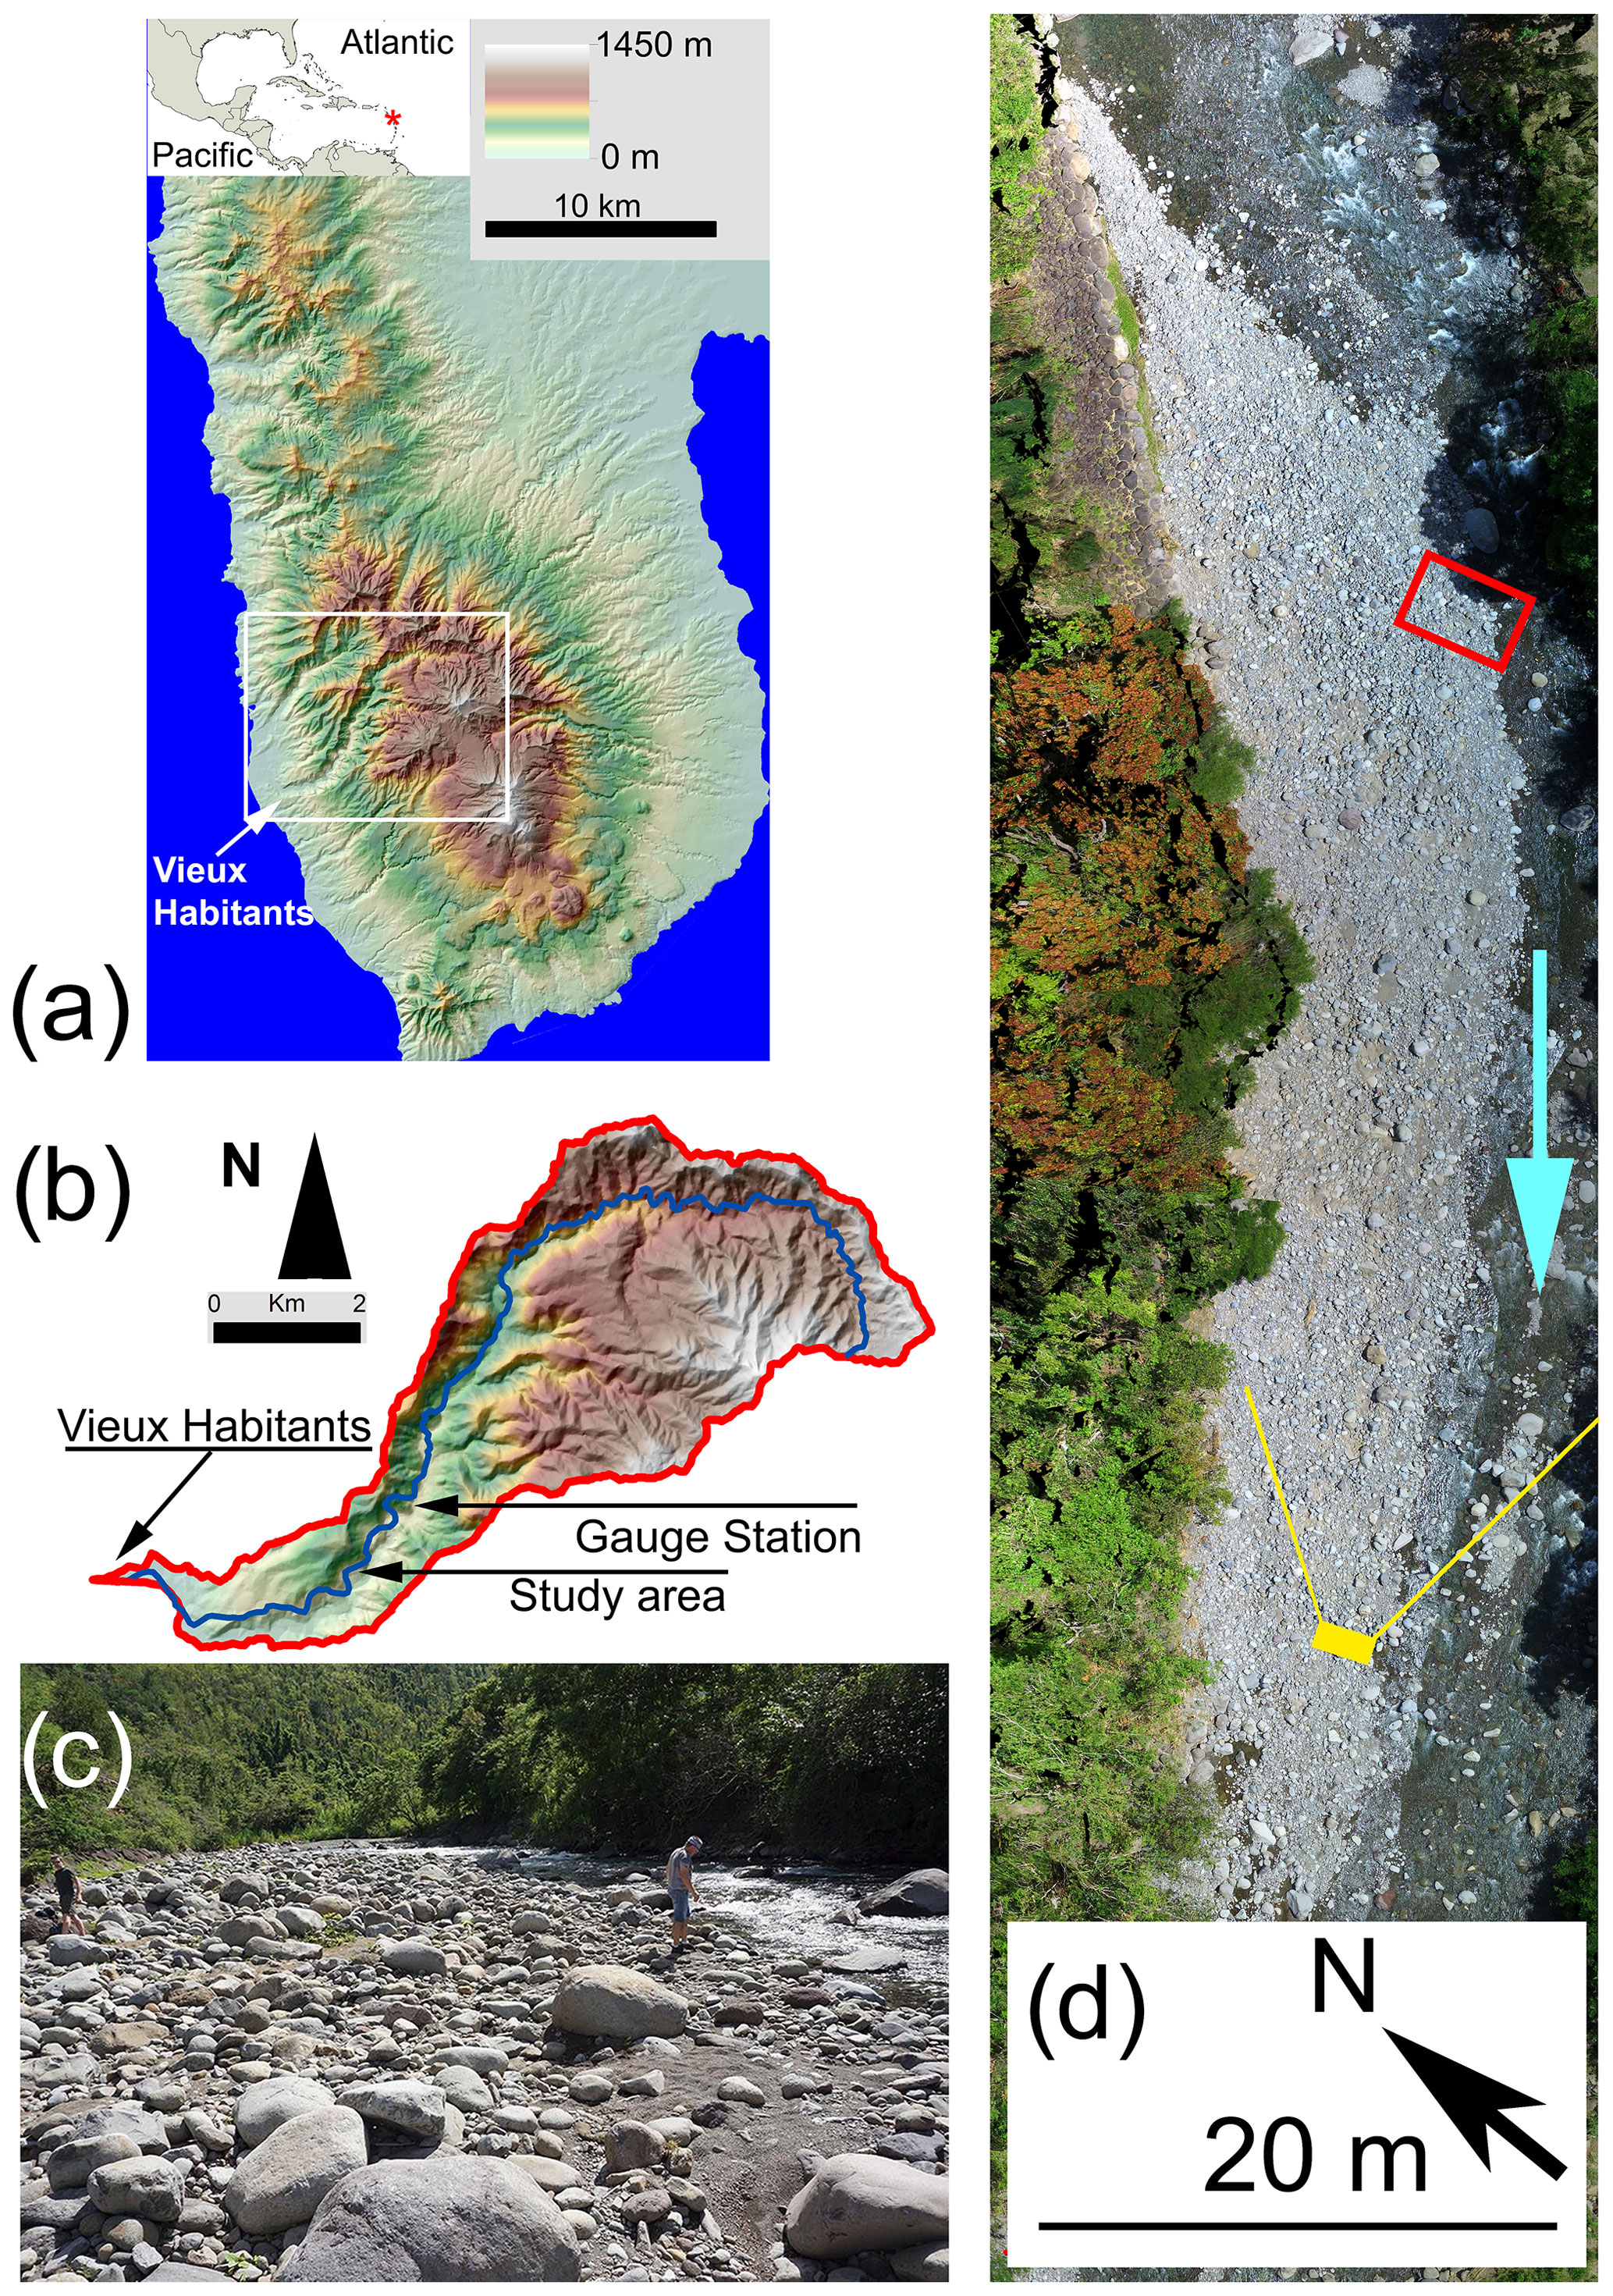
Figure 1(a) Basse-Terre Island in the Guadeloupe archipelago. The island separates the Atlantic Ocean in the east from the Caribbean Sea in the west. The white rectangle shows the position of the map displayed in (b). (b) Map of Vieux-Habitants catchment, showing the course of the river (blue line). Two arrows indicate the positions of the Barthole gauge station and of our field site. (c) Image of the bar taken from the ground, looking in the upstream direction. Two persons visible in the image provide an approximate scale, from which the size of the boulders and their distribution can be deduced. (d) Aerial image of the bar, acquired with our UAV. The bar is about 300 m long and 15 to 35 m wide. It lies on the right side of the river 3 km upstream of the seashore. In fair weather conditions, the bar is bounded on its left by the channel of the river, which is 5 to 10 m wide and less than 1 m deep. The boulder bar is flooded one to three times a year. The red square shows the location of Fig. 3. The position of the camera and the field of view of (c) is shown in yellow. A turquoise arrow indicates the direction of the flow.
Rad et al. (2006) estimated the mechanical erosion rate of several Basse-Terre catchments based on a comparison between the chemical composition of the dissolved load, the solid weathered load and the unweathered rocks. They found that the chemical erosion is about 100–120 t km−2 yr−1, while the mechanical erosion varies between 800 and 4000 t km−2 yr−1 or, equivalently, 0.3 and 1.5 mm yr−1 for a rock density of about 2900 kg m−3. These values are consistent with the volume of sediment mobilized by landslides during extreme climatic events (Allemand et al., 2014). These estimates make Basse-Terre Island one of the fastest eroding places on Earth (Summerfield and Hulton, 1994). This observation led to the creation of the “Observatoire de l'Eau et de l'éRosion aux Antilles” (ObsERA), an observatory which monitors erosion within the French Network of Critical Zone Observatories (Gaillardet et al., 2018). Our field site is located in the Vieux-Habitants catchment, which is monitored by ObsERA.
The Vieux-Habitants river (Fig. 1b) drains a 30 km2 watershed on the leeward (west) side of the island. Most of the watershed, made up of andesitic lava and pyroclastic deposits between 600 to 400 kyr old (Samper et al., 2007), is covered with a dense rain forest. The Vieux-Habitants river flows over 19 km, from its headwater at an altitude of 1300 m, down to the Vieux-Habitants village, where it discharges into the Caribbean Sea. The channel is made of bedrock partly covered with a thin layer of alluvial sediment. Five kilometers from the sea, the river becomes alluvial and its slope gradually decreases. Our study focuses on a reach of the Vieux-Habitants river located 3 km from the sea at an elevation of 45 m a.s.l. There, the riverbed is alluvial and the channel meanders between two steep banks about 2.5 m high. A large bar of pebbles and boulders, 300 m long and 35 m wide, lies on the inner side of the channel (Fig. 1c and d).
The Direction de l'Environnement, de l'Aménagement et du Logement (DEAL-Guadeloupe) operates a stream gauge at the Barthole station, 3 km upstream of our field site (Fig. 1b). This station has been measuring the river discharge every 10 min for more than 15 years except for a hiatus between 2009 and 2011. As no major tributary joins the main stream between Barthole and our field site, we shall assume that the data acquired in Barthole provide a reasonable estimate of the river discharge at our site.
Between 2011 and 2018, the discharge stayed below 10 m3 s−1 for 91 % of the time (Fig. 2a). In this low-flow state, the bar emerges and the river flows in a channel that forms between the bar and the left bank of the river (Fig. 1d). There, the water depth is about 0.3 m but may locally exceed 0.7 m (Fig. 1c and d). Floods are characterized by a steady increase in the discharge for 1 to 6 h followed by a recession that lasts typically 4 to 18 h (Fig. 2b – Guérin et al., 2019). The largest flood ever recorded in Barthole occurred during Hurricane Maria from 18 to 19 September 2017. The water discharge then reached more than 250 m3 s−1, and the river flooded not only the bar but also its banks. After the hurricane, the river returned to its normal course along the left side of the bar.

Figure 2(a) Percentage of time during which the Vieux-Habitants river stays above a given discharge. This distribution is calculated from the data acquired between 2011 and 2018 at the Barthole station. (b) Hydrograph of the Vieux-Habitants river during the year 2017. The high peak in September 2017 corresponds to Hurricane Maria, which struck Guadeloupe on 19 September 2017. During this hurricane, the discharge reached up to 263 m3 s−1. Inset: typical flood event.
To understand how floods affect the river's bed, we acquired aerial images of our field site with an uncrewed hexacopter aerial vehicle named DRELIO (DRone hELIcoptère pour l'Observation de l'environnement). This aircraft, specially designed for tropical conditions, is capable of flying in steep and densely vegetated watersheds. It requires only a small takeoff area (Delacourt et al., 2009) and carries a high-resolution camera. We started working in 2011, with a Nikon D700 reflex camera, equipped with a 35 mm lens. In 2016, we replaced it with a Sony Alpha 7 reflex, still in use at present. As a result, the resolution of our images improved from 0.04 m per pixel in 2011 to 0.02 m per pixel starting from 2016.
From 2011 to 2018, we performed eight field campaigns following the same procedure. We flew DRELIO at an elevation of 80 m above the riverbed and used the on-board camera to acquire a series of images that covered the entire bar with a 30 % overlap between two neighboring images. Using the MicMac Photogrammetric suite (Rupnik et al., 2017), we compute a digital surface model (DSM) and an orthoimage of the bar for each campaign. The orthoimages are georeferenced using fixed ground control points whose coordinates are measured by a differential global navigation positioning system. The resulting resolution of the orthoimages ranges from 0.04 to 0.02 m depending on the acquisition year.
To monitor the evolution of the bar, we superimpose the georeferenced orthoimages using a GIS software (QGIS in our case). However, the georeferencing is not perfect. The quality of the superimposition degrades with the distance from the ground control points (e.g., Jaud et al., 2019a). To reduce this distortion, we use the 2012 orthoimage as the “base image” and warp the others on that base using a minimum of 15 control points (Jaud et al., 2019b).
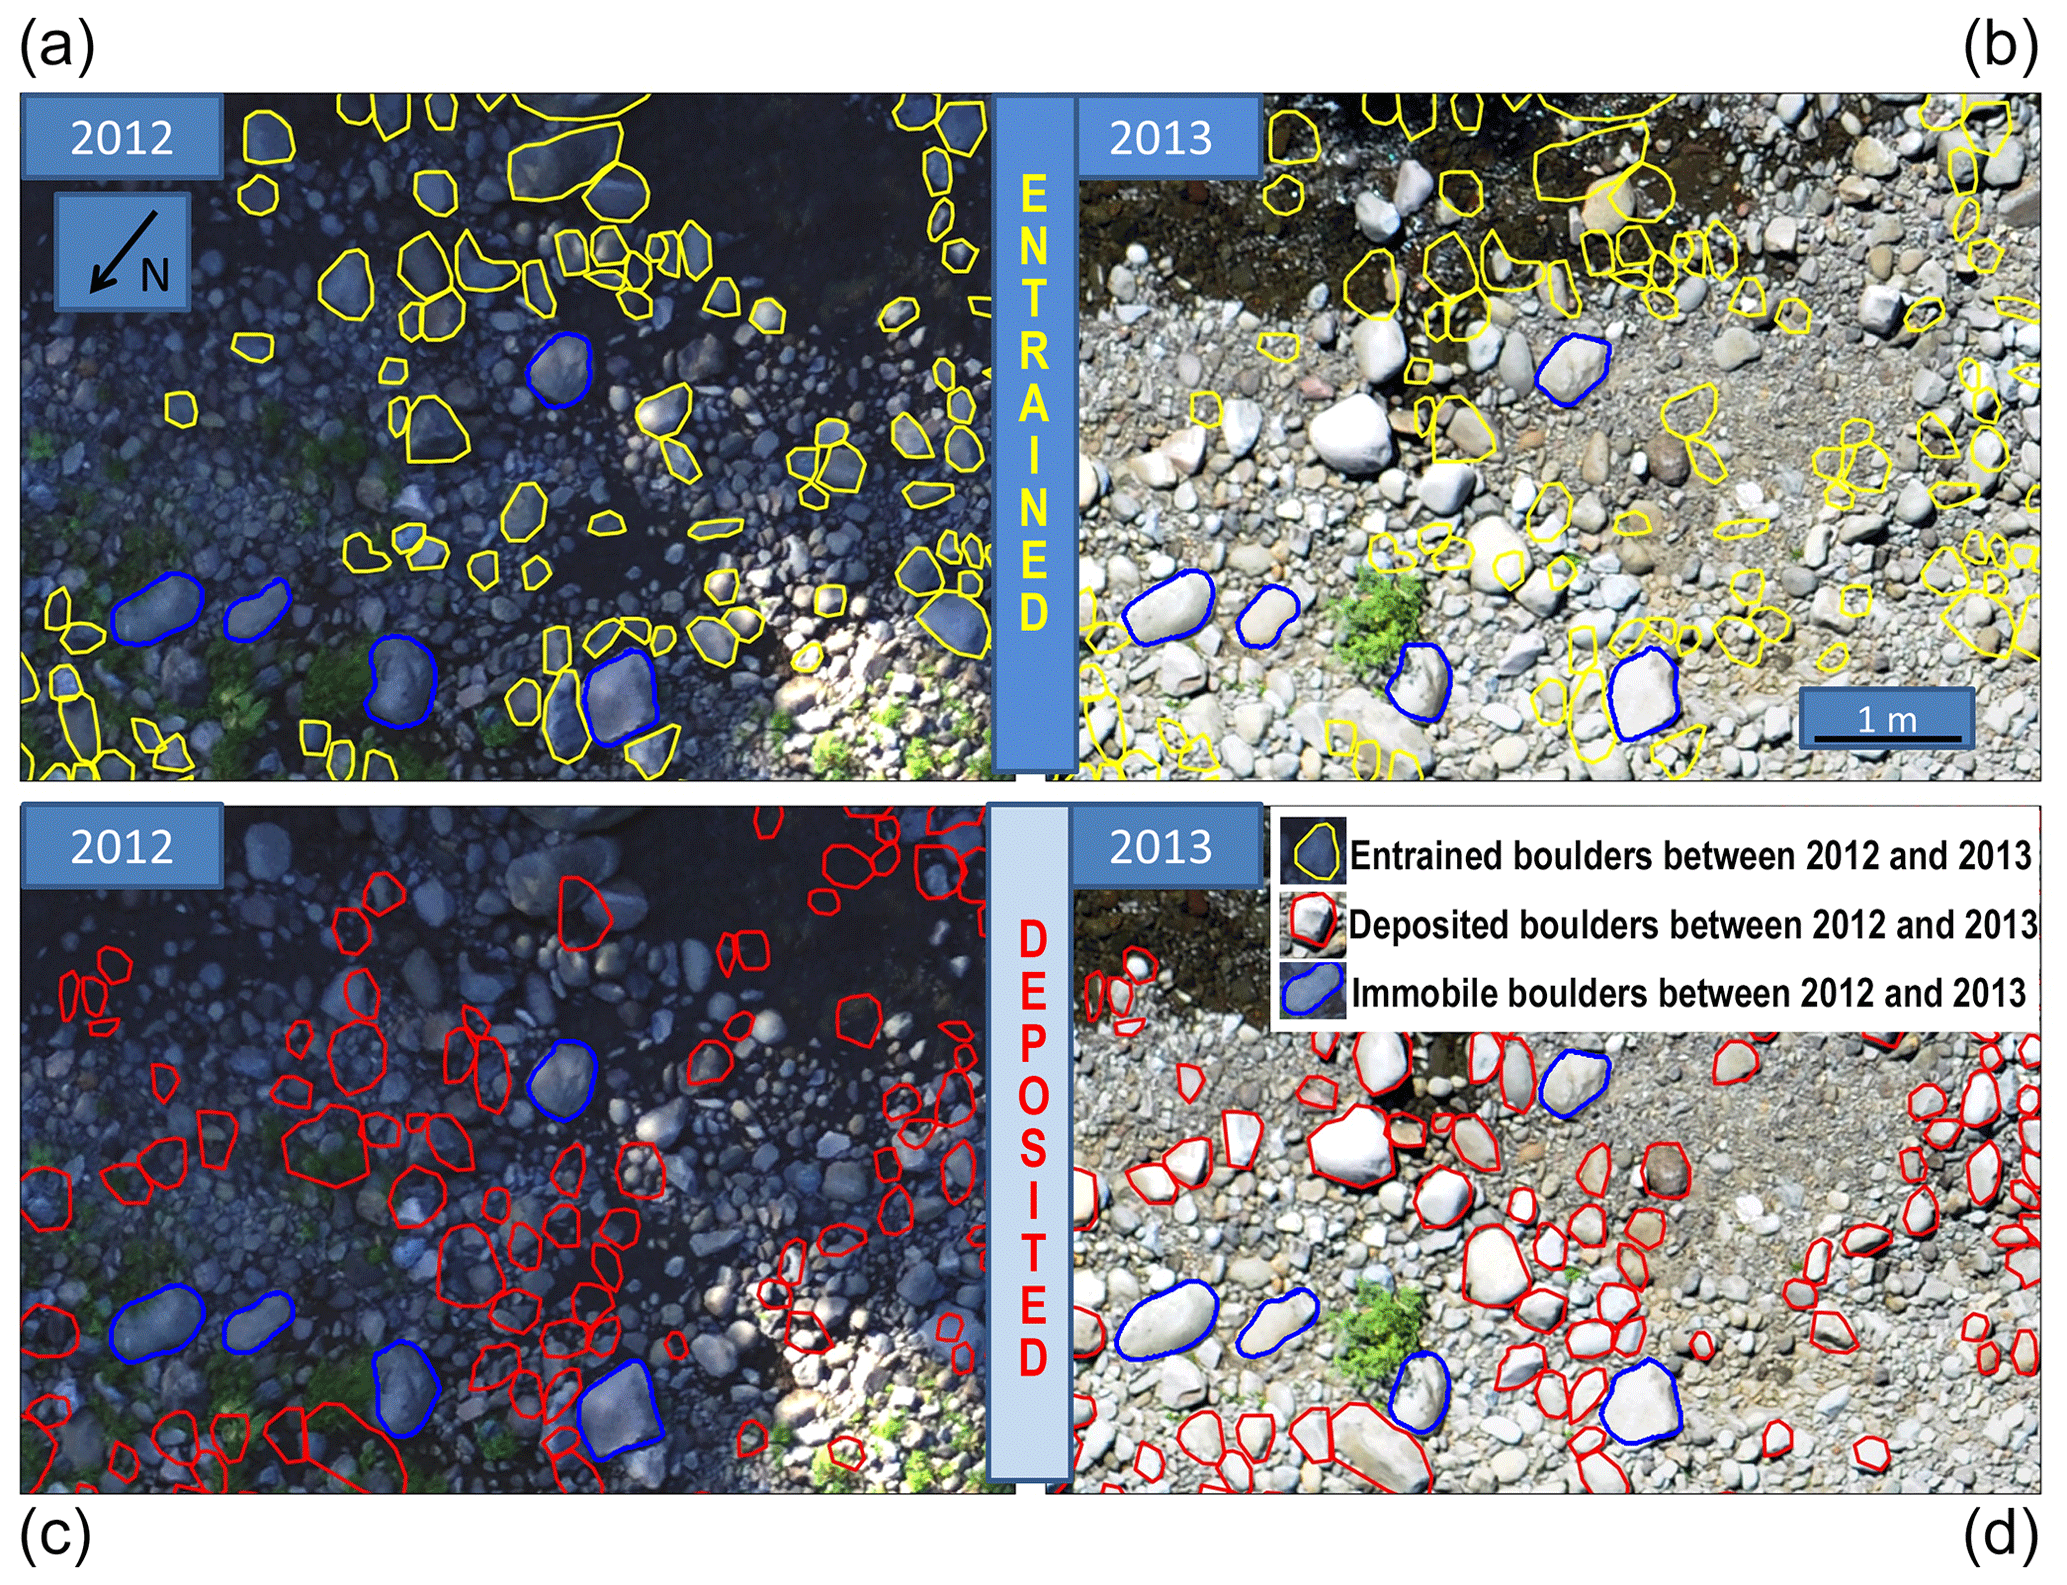
Figure 3Surface of the bar in March 2012 (a, c) and June 2013 (b, d). Boulders entrained by the river between 2012 and 2013 are marked by yellow contours (a, b). Boulders deposited by the river between 2012 and 2013 are marked by red contours (c, d). Boulders that stay in place between 2012 and 2013 are marked by blue contours.
We then trace the contour of the boulders visible on each orthoimage using a raster graphic editor. The diameter of the smallest visible grains is five pixels (0.1 to 0.15 m). On the bar, however, most boulders have a diameter larger than 0.2 m, and some are larger than 1 m (Terry and Goff, 2014). In practice, we restrict our analysis to boulders with a diameter larger than 0.5 m as they are clearly distinguishable in the images. Using QGIS, we then vectorize the contours of the boulders and calculate their exposed area, A, from which we deduce the boulder equivalent diameter defined as the diameter D of a disk with the same surface area: . We estimate that the uncertainty on the area, A, is between 15 % and 20 % for the smaller diameters. With this method, we obtain eight diachronic superimposable orthoimages and eight vector files of the boulders' shapes, position and equivalent diameter.
We visually compared two orthoimages of the bar (Fig. 3) from 2012 and 2013 and found that several boulders have been removed or deposited in between. Several boulders (yellow contours in Fig. 3), lying on the bar in 2012, are not visible in 2013: they were entrained downstream by the river at some time between two acquisition campaigns. In 2013, we also find several boulders that were absent in 2012 (red contours in Fig. 3): these boulders were deposited on the bar sometime between the two image campaigns. Finally, the rest of the boulders (blue contours in Fig. 3) remained in place. The comparison between two consecutive orthoimages thus allows us to identify the fate of each boulder. Based on this method, we attribute a label to each boulder of each image which specifies whether the boulder was already in place during the previous campaign or if it was deposited recently. Some cases turn out to be ambiguous: a few boulders disappeared and then reappeared on more recent images, as floods covered them with sediment, before exposing them again. Those ambiguous cases were duly labeled and the corresponding boulders were considered immobile. Following this procedure, we produce a dataset that contains the position, size and transport history (deposited, entrained or immobile) of all the boulders larger than 0.5 m. In short, we treat the boulders as tracers to characterize their transport in the Vieux-Habitants river.
3.1 Structure of the bar: mobile and consolidated layers
A visual inspection of our data shows that entrained and deposited boulders are uniformly distributed over the whole bar. There is no particular place from which boulders are preferentially exported nor onto which they are preferentially deposited. This suggests that, during floods, bedload transport is uniform over the bar.
Our dataset also reveals the existence of two populations of immobile boulders. The first corresponds to boulders that were deposited on the bar during the course of our survey and remained immobile for several years until the river entrained them again. The second corresponds to boulders that are partially buried in a matrix of fine sediments and remained immobile for the whole duration of the survey. These observations are consistent with the concept of active layer (e.g., Church and Haschenburger, 2017). We therefore interpret them as an indication that there are two distinct layers of boulders: (i) an active surface layer of mobile boulders and (ii) an underlying basal layer of static ones. Laboratory experiments report a similar partition between an active layer of mobile grains that regularly settle on the bed until the flow eventually dislodges them and sets them back into motion and a layer of static grains (Charru et al., 2004; Lajeunesse et al., 2010). In the following, we investigate the layer of mobile boulders.
3.2 Grain-size distribution
We first focus on the motion of boulders of a size between 0.5 and 2 m. To characterize their distribution, we divide the population of boulders into six 0.25 m wide bins. We then compute the dimensionless surface density of each class i, defined as the number of grains per unit surface, normalized by the area of a grain:
where Ni is the number of boulders in class i, Di is their equivalent diameter, and Sb=2000 m2 is the area of the bar. The dimensionless surface density can also be interpreted as the fraction of the bar area occupied by the boulders of class i.
The number of boulders in each class and the corresponding surface density vary from year to year. To account for these variations, we compute these two quantities for each field campaign (Fig. 4a). We find that the surface density of each class varies by less than 27 % around its median. The size distribution of the boulders thus does not change significantly over time but appears to be roughly at equilibrium. This equilibrium is not static but dynamic. Indeed, distinguishing the boulders freshly deposited (Fig. 4a, green boxes) from those that were already in place during the preceding campaign (Fig. 4a, yellow boxes) shows that about half of the population of boulders is renewed each year. In short, the number of boulders entrained by floods balances, on average, the number of fresh boulders deposited on the bar, thus keeping their surface density constant (Fig. 4b).
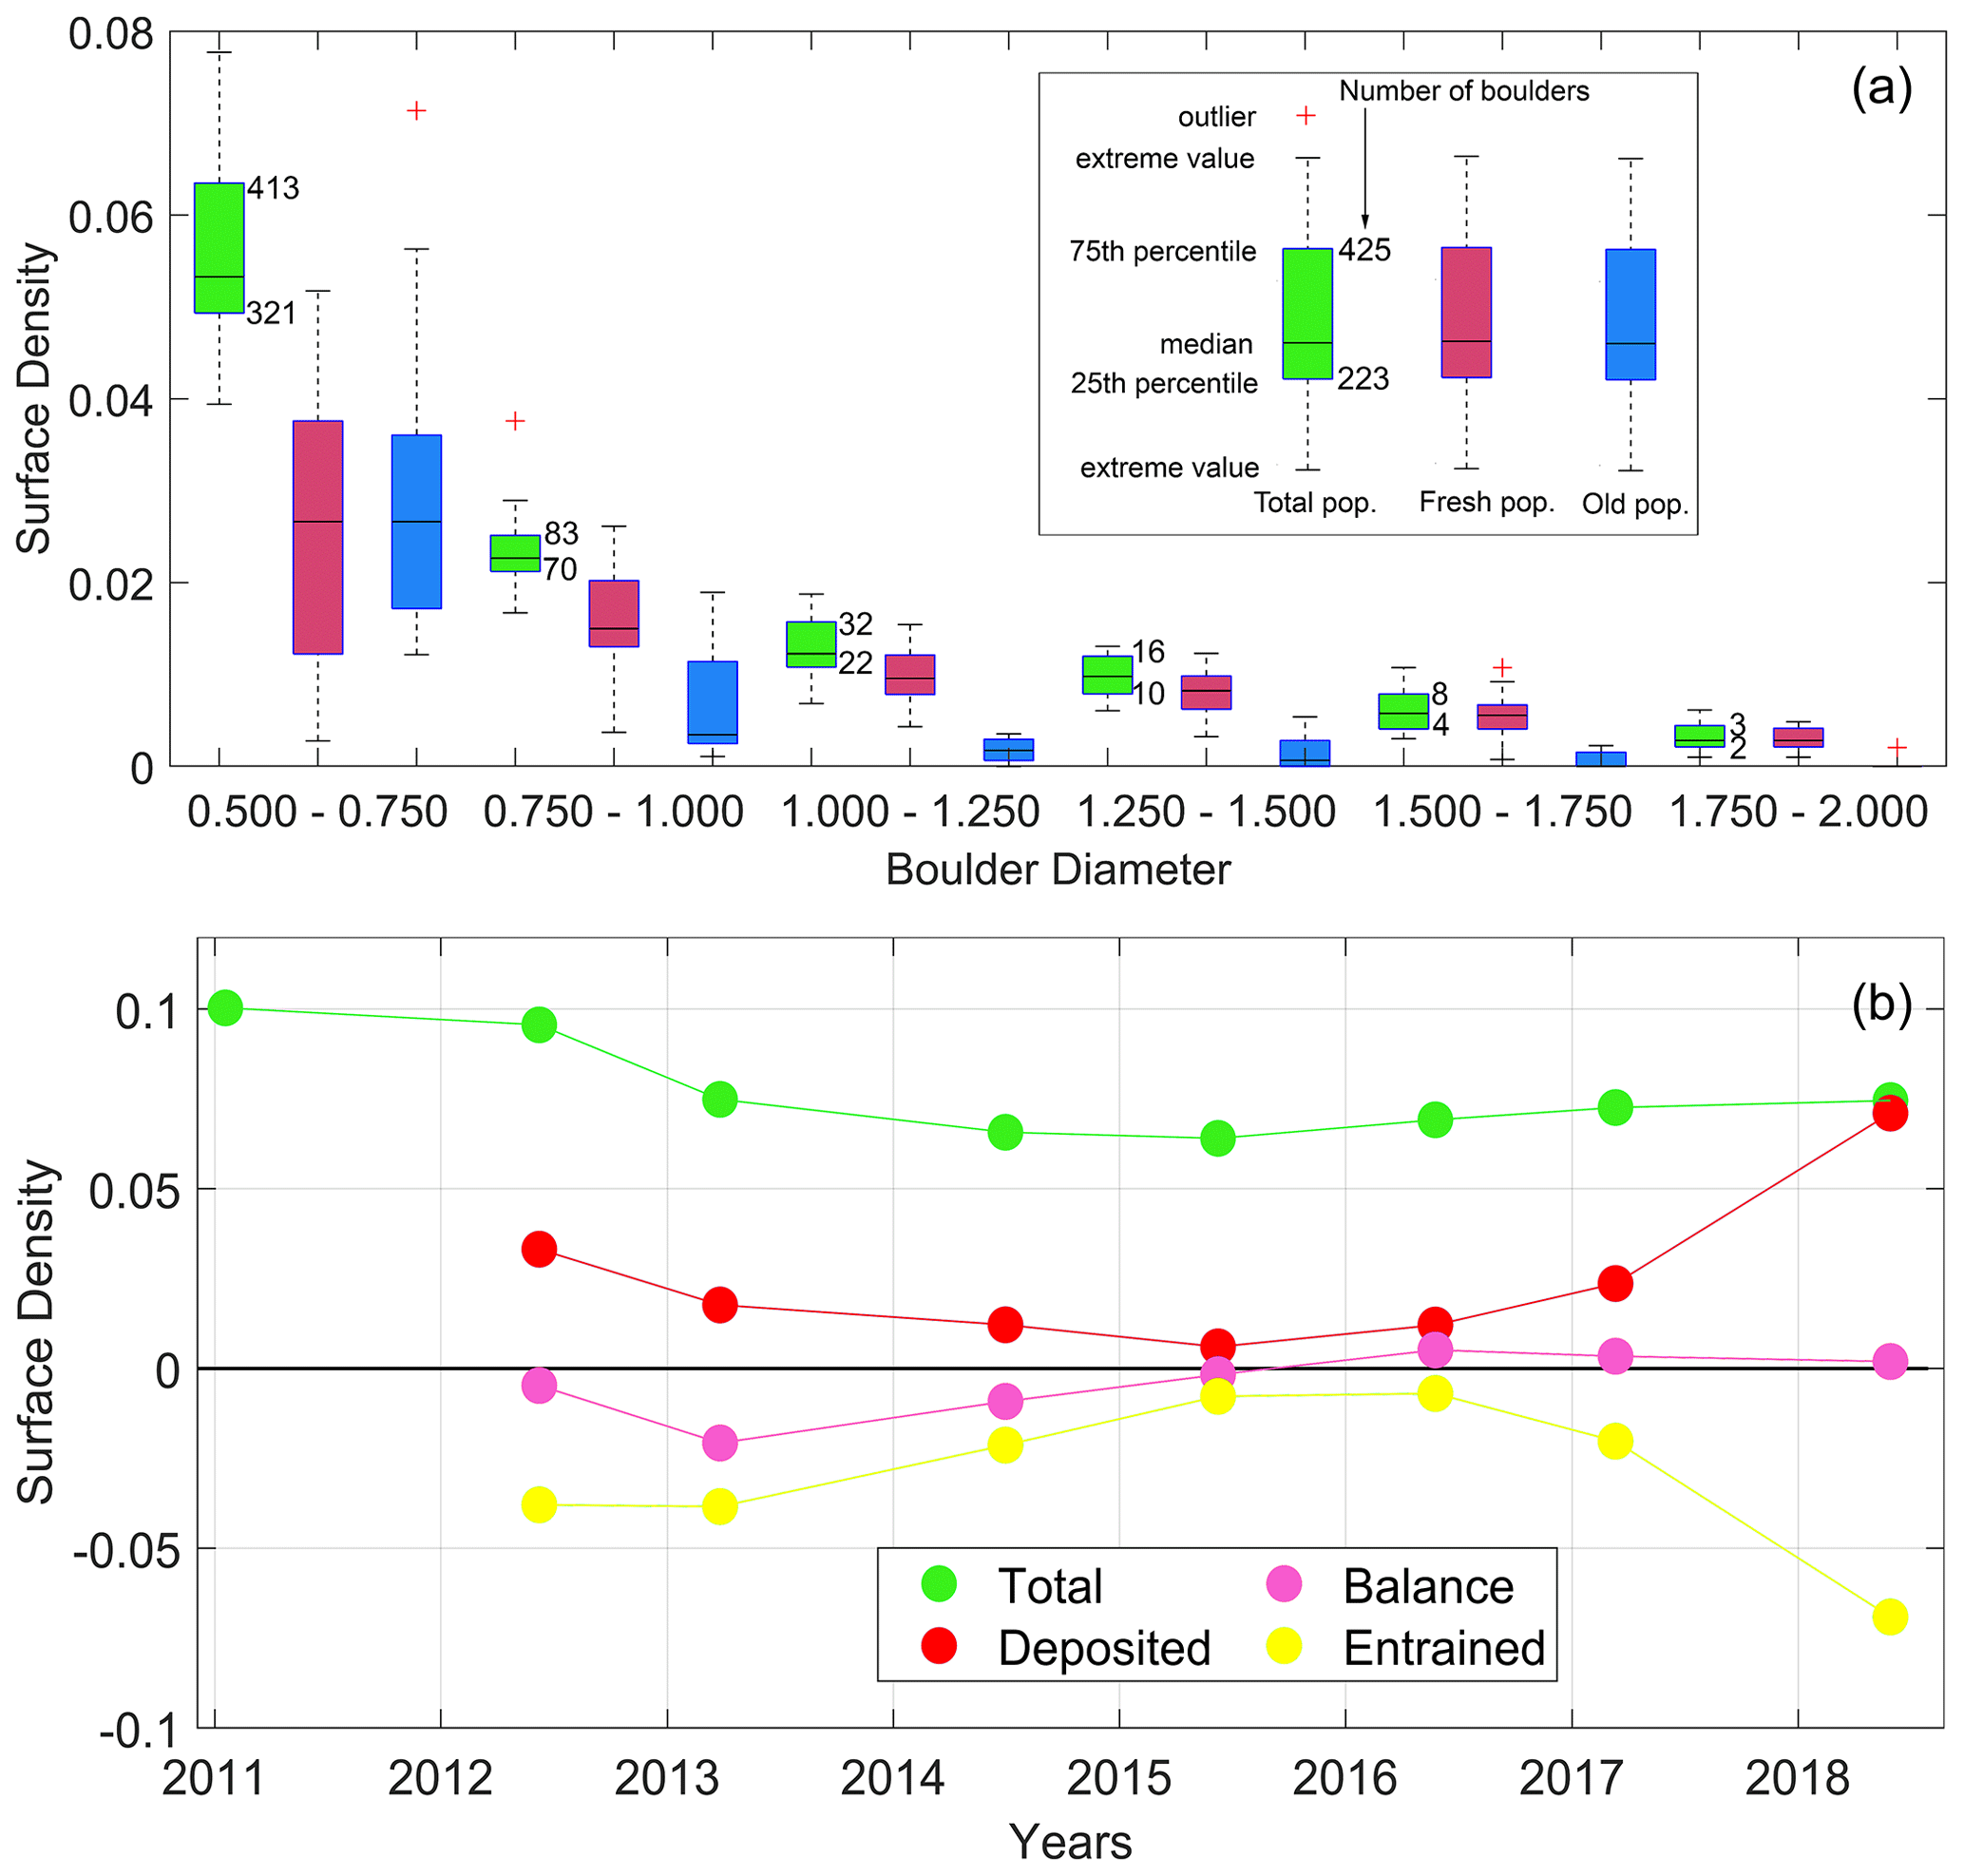
Figure 4(a) Box plot of the dimensionless surface density of boulders (Eq. 1) at the surface of the bar as a function of their diameter, computed over the whole survey. Green: total number of boulders; red: freshly deposited boulders; green: boulders already in place during the previous campaign of observation. (b) Surface density of entrained (yellow), deposited (red) and total (green) boulder population. Balance between deposited and entrained boulder population in pink. Data from 2011 have been obtained from a preliminary campaign. Entrained boulders are counted negatively as they have been entrained out of the bar. Purple dots show the balance between entrained and deposited boulders.
Finally, our analysis shows that the surface density rapidly decreases with grain size (Fig. 4a). With a surface density of σ=0.23 boulders per square meter, or equivalently, a total number of about 350 boulders over the 2000 m2 of the bar, boulders of a size of 0.5 to 0.75 m dominate the bar, at least in the range of diameters accessible to our measurements. The transport rate of these boulders is also sufficiently high to allow for significant statistics. In the following, we shall therefore focus on the transport of boulders of a size of 0.5 to 0.75 m.
3.3 Threshold for the initiation of transport
Based on our dataset, we can identify the largest boulders deposited on, or entrained from, the bar between two consecutive campaigns for each of the eight campaigns we performed. We find that the maximum size of both entrained and deposited boulders increases with the maximum discharge (Fig. 5). Assuming that the largest boulders are transported when the discharge is at its highest, the resulting curve provides a reasonable estimate of the threshold discharge beyond which grains of a given size are entrained by the flow. This method allows us to estimate the threshold discharge of particles larger than 0.75 m. Below this size, particles are entrained during floods of lesser amplitude that occur several times a year, and we cannot measure their threshold discharge based on our yearly observations. Instead, we shall now try to calculate it by extrapolating our observations towards smaller grain sizes.

Figure 5Maximum discharge recorded at the gauge station between two consecutive campaigns as a function of the size of the largest deposited (red dot) or entrained (yellow square) boulder. Orange line: fit of the data by Eq. (2).
In practice, the threshold discharge corresponds to the discharge for which the shear stress exerted by the river on its bed exceeds a critical value (Shields, 1936). The instantaneous turbulent stress exerted on the riverbed is, however, highly variable in space and in time: it depends on the flow, the shape of the channel, the river slope, and the bed roughness. Its measurement in the field is challenging (Henderson, 1963; Parker, 1978; Chauvet et al., 2014; Métivier et al., 2017; Nezu and Nakagawa, 1993). Here, to simplify the problem, we assimilate the river geometry to that of a rectangle of width W, depth H and slope S. Based on the Darcy–Weisbach equation, we then derive the threshold discharge required to transport a boulder (see Appendix for a full derivation):
where Δρ is the difference between the rock density (ρs) and water density (ρ), Cf is the Darcy–Weisbach friction parameter, g is the acceleration of gravity, and Θc is the threshold Shields parameter (Shields, 1936). Our model is crude and some of the parameters in Eq. (2) are difficult to estimate. Based on direct field measurements, we estimate the river width to be W=30 m. Using the digital elevation model (DEM), we calculate an average slope of about S=0.03. For the friction coefficient, we use the value Cf=0.1, typical of mountain streams (Limerinos, 1970). A fit of Eq. (2) to our data reasonably accounts for our observations (Fig. 5) and yields a threshold Shields stress Θc=0.032, which falls in the range reported by previous compilations of critical Shields stress measurements from field settings (Buffington and Montgomery, 1997; Lamb et al., 2008). Combining this value with Eq. (2), we find that the threshold discharge of the boulders of a size of 0.5 to 0.7 m is 45±20 m3 s−1, where the uncertainty range derives from the bounds of the size class. In the next section, we use this central value of 45 m3 s−1 to estimate the time during which the river effectively transports these boulders.
3.4 Effective transport time
In the previous section, we calculated that boulders of a size of 0.5 to 0.75 m move only when the river discharge exceeds the threshold value of 45±20 m3 s−1. The corresponding effective transport time, i.e., the cumulative time that the river spends above this threshold, amounts to a total of 85 h for the period that extends from January 2011 to May 2018 (Fig. 6). The time fraction during which the river is above the entrainment threshold is thus I=0.12 %. This means that, on average, boulders are transported during about 10 h each year.
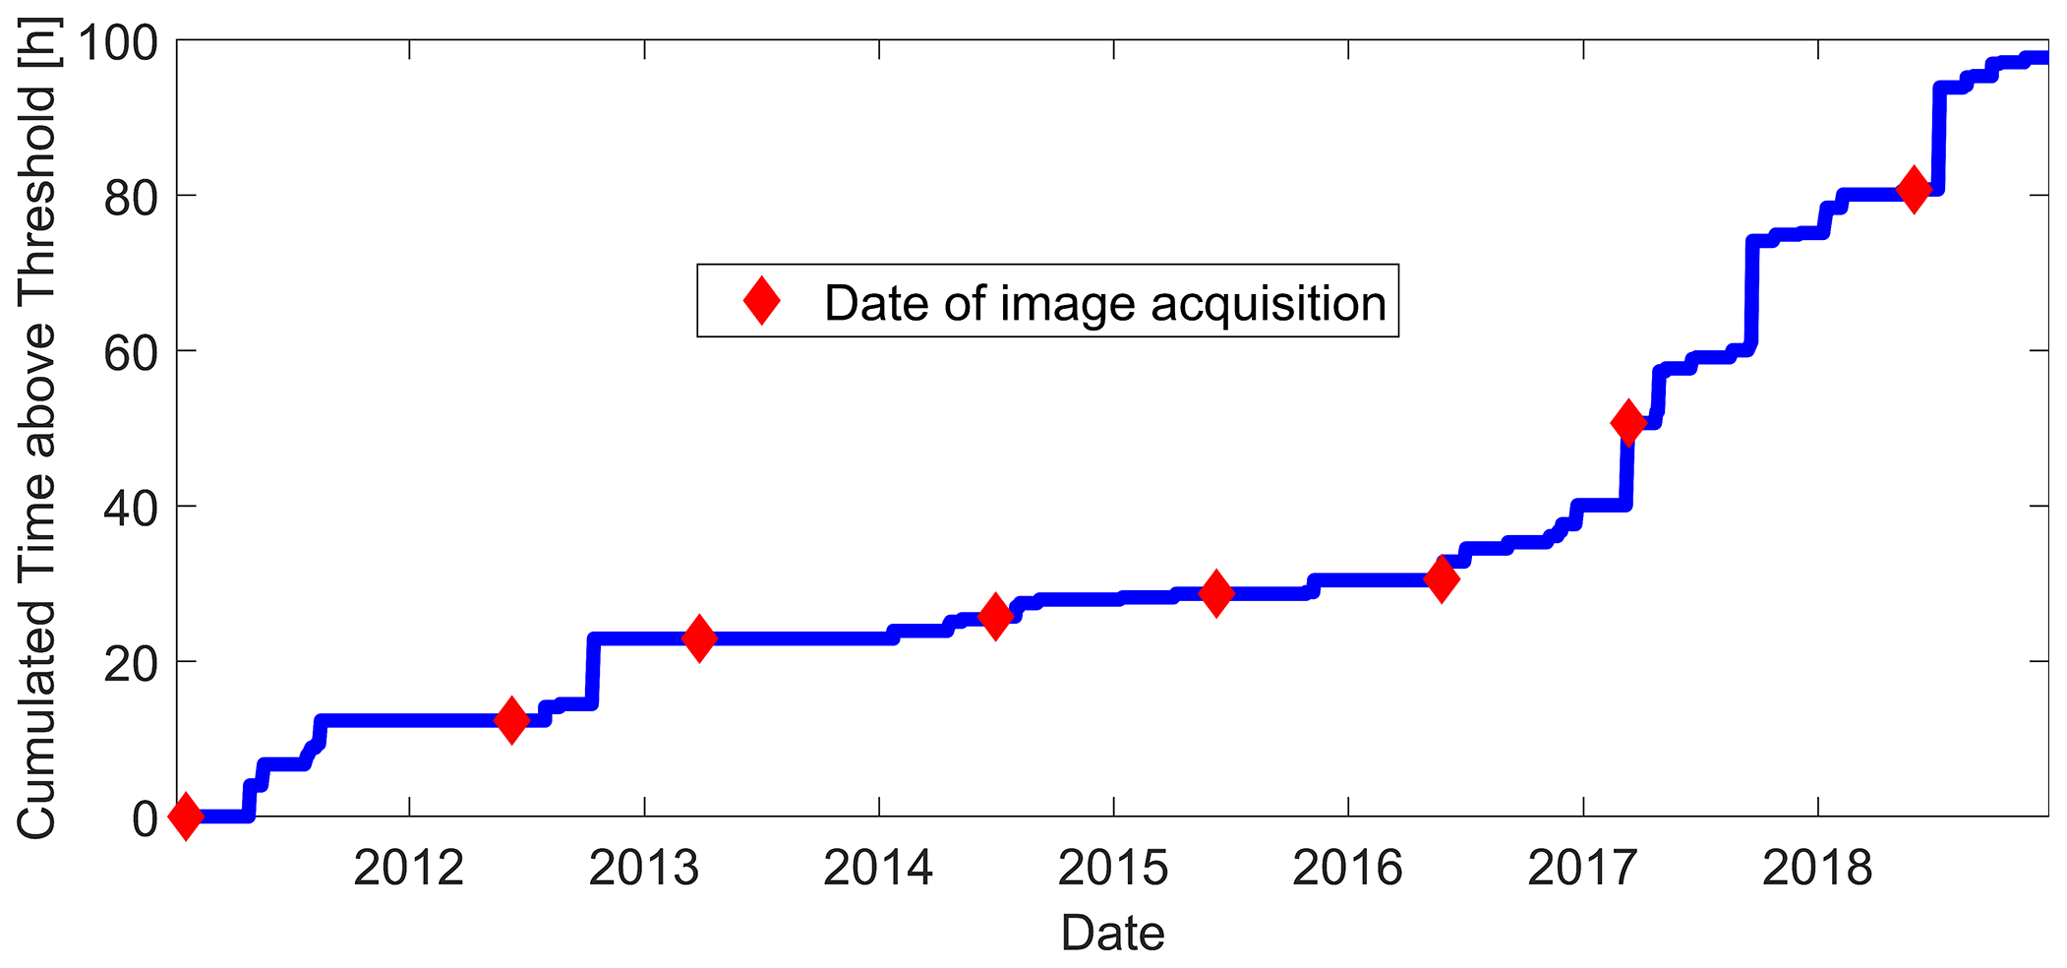
Figure 6Effective transport time, i.e., cumulative time spent by the Vieux-Habitants river above the threshold discharge of 45 m3 s−1.
The effective transport time depends on the occurrence of floods and therefore on the distribution of rainfalls. As the latter varies from year to year, so does the effective transport time (Fig. 6). The river spent less than 5 h above 45 m3 s−1 between 2014 and 2016 (an unusually dry period). Conversely, it spent 32 h above 45 m3 s−1 between 2017 and 2018, a period that includes Hurricane Maria. Even then, the annual effective transport time did not exceed 0.36 % of the year. On a tropical volcanic island like Guadeloupe, boulders move only during very short periods of time whose cumulative duration depends on the frequency and the intensity of the storms.
3.5 Evolution of the population of boulders
In the previous section, we calculated the threshold of transport and the effective transport time of boulders. Based on these results, we now use our dataset to measure the evolution of the populations of boulders as function of the effective transport time. As in the previous sections, we restrict our analysis to boulders of a size of 0.5 to 0.75 m. Using our GIS, we identify all the boulders of this size present on the bar in 2011. We find that 619 boulders make up the 2011 boulder population. We then monitor the evolution of this population, year after year, until 2018. We find that the 2011 population decreases monotonously with the effective transport time as boulders are progressively entrained by floods (Fig. 7), an observation similar to those of Wilcock and McArdell (1997) and Haschenbucher and Wilcock (2003).
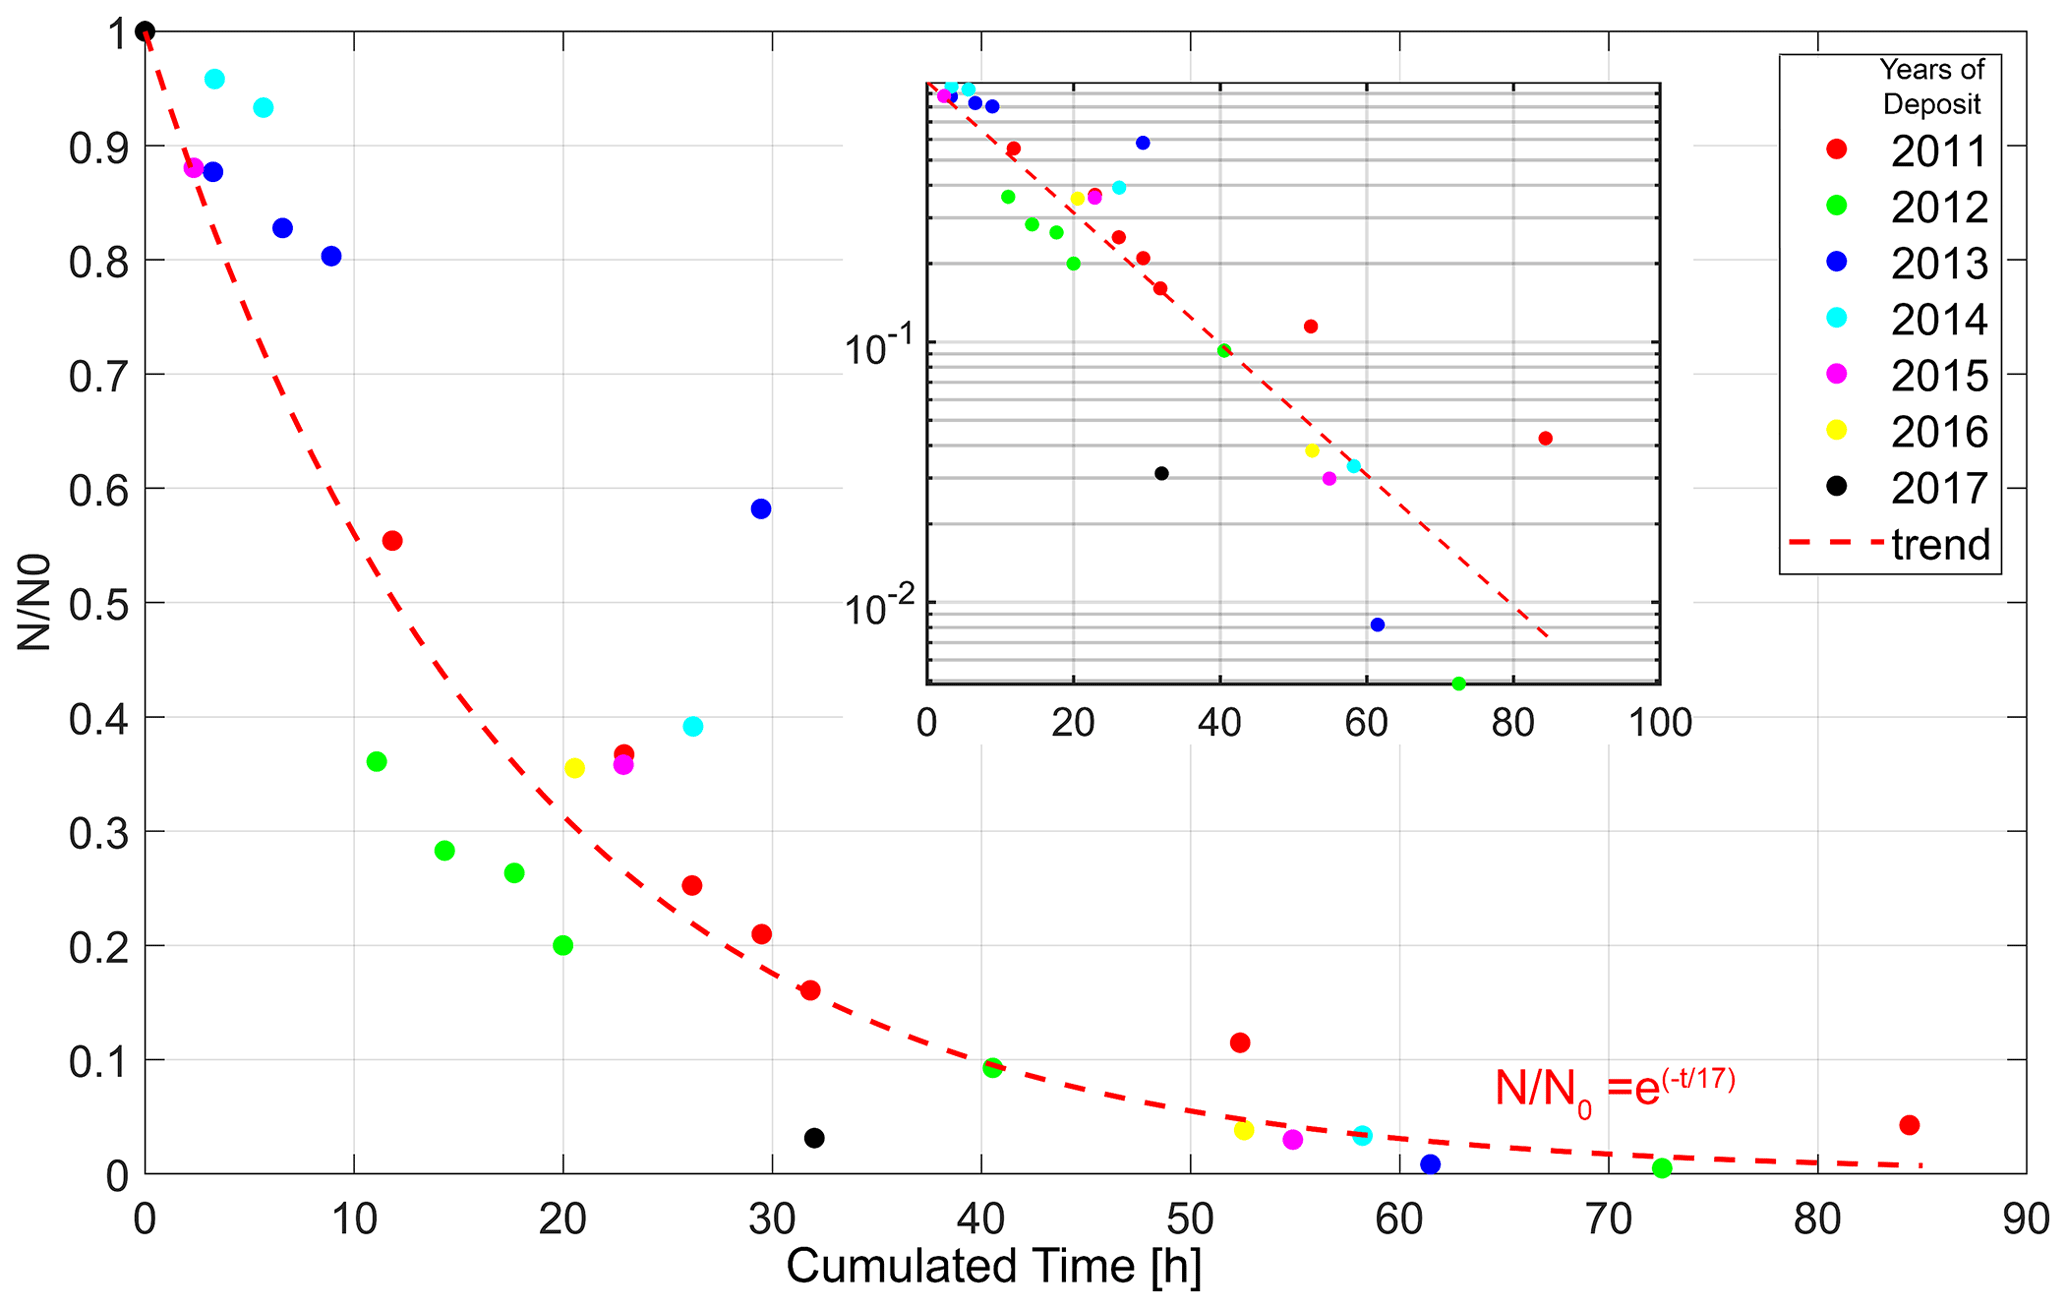
Figure 7Population of boulders, normalized to its initial size, as a function of the cumulative effective transport time, calculated for a threshold discharge of 45 m3 h−1. The seven populations of boulders that we monitor are plotted using different colors, as indicated on the plot. Red curve: fit of the data by Eq. (3) (exponential decay) with a residence time of 17 h (half-life of 12 h). Inset: same plot with semi-logarithmic axes.
To check the robustness of this observation, we apply the same procedure to a new population of boulders that is the 2012 population composed of the boulders deposited on the bar between the campaigns of 2011 and 2012. We find that it follows the same trend as the 2011 population (Fig. 7). Repeating the same procedure with the populations of boulders deposited in 2013, 2014, 2015, 2016, and 2017, we end up monitoring a total of seven populations of boulders. To compare their evolution, we normalize the number of boulders in each population with its initial value and plot the result as function of the effective transport time (Fig. 7). We find that all data points gather around the same trend: the number of boulders decreases rapidly at first. With time, the rate gradually slows down.
As the surface density of boulders is small (σ=0.23 boulder per m−2 – see Sect. 3.2), we expect little interaction between them during transport. Following Einstein (1937) and Charru et al. (2004), we thus assume that the number of boulders that leave the bar is proportional to the number of boulders available on its surface, that is
where t is the effective transport time, N is the number of boulders on the bar surface at time t and τ is a characteristic entrainment time. The solution of Eq. (3), , is a decaying exponential of characteristic time τ, where N0 is the initial number of boulders. Fitting this exponential solution to our data yields a good representation of the evolution of N (R2=0.84) with a characteristic time τ=17 h (Fig. 7).
The model proposed here is simplistic. It does not take into account the variations in discharge during a flood and relies on a crude description of the threshold of transport. Yet, the exponential decrease in an initial population of boulders is consistent with the data plotted in Fig. 7. We therefore expect that the value of the characteristic time τ is a reasonable estimate of the residence time of boulders on the bar expressed in terms of the effective sediment transport time. This residence time is short. Expressed in terms of half-life, it takes an effective transport time of log 2τ=12 h to entrain half of the boulders initially present on the bar. As the total boulder population on the bar is in steady state (Fig. 4b), each boulder entrained out of the bar is, on average, replaced by a new one.
To the best of our knowledge, we present here the first attempt at characterizing bedload transport based on yearly uncrewed aerial vehicle (UAV) image acquisition. As the resolution of our images does not allow us to observe particles smaller than 0.10 to 0.15 m, we restrict our analysis to boulders of a size between 0.5 and 0.75 m, which are easier to track. In principle, however, the method we propose can be extended to smaller grains, given the appropriate image resolution.
Obviously, our approach has many limitations. The major one is that the intermittent burial of boulders that may occur at high sediment discharge is not accounted for. In the Vieux-Habitants river, such burial is unlikely because the sedimentary active layer has a thickness of about one boulder diameter. In other settings, however intermittent burial might play a significant role (e.g., Yager et al., 2012). The use of boulders marked with RFID PIT tags might help to counter this problem.
Despite – or, maybe, owing to – its simplicity, the method proves robust: the comparison of images taken 1 year apart allows us to monitor the evolution of the population of boulders at the surface of the Vieux-Habitants river. Using high-frequency measurements of the river discharge, we determine the threshold discharge necessary to set these boulders in motion and estimate the time during which the flow is strong enough to transport them.
In the Vieux-Habitants river, this effective transport time amounts to an average of 10.5 h yr−1, that is about I=0.12 % of the total time. The transport of boulders is therefore a rare event controlled by the occurrence of floods, which, in its turn, depends on the rainfall regime. This result is consistent with previous observations reported for different contexts (e.g., Lague et al., 2005; Phillips and Jerolmack, 2016; Pfeiffer and Finnegan, 2018). Since climate models predict a change in the rainfall regime in the Antilles, with an increase in the frequency of extreme events (e.g., Jury and Bernard, 2020), we expect a significant increase in the sediment load delivered by Caribbean rivers to the ocean.
Einstein (1937) first proposed that the entrainment of bedload particles is an inherently random process. This hypothesis is at the core of most models of bedload transport (Charru et al., 2004; Ancey, 2010; Lajeunesse et al., 2010, 2018; Furbish et al., 2012a, b). All these models assume that, for a given shear stress, the probability of dislodging a grain from the bed is proportional to the number of grains at repose on the bed. Laboratory experiments have long confirmed this hypothesis in flumes, where a steady flow shears a flat bed of homogenous sediment (Charru et al., 2004; Ancey, 2010; Lajeunesse et al., 2010, 2018; Furbish et al., 2012a, b). The results reported in this article suggest that this same assumption holds in natural rivers as well, even though their bed, made of very heterogeneous grains, is subject to large flow variations. Indeed, when expressed in terms of effective transport time, the population of boulders on the bed of the Vieux-Habitants river decreases exponentially as expected for a Poisson process.
The characteristic time of this exponential decay – in fact, the typical residence time of the boulders on the bar – is short: τ=17 h of effective transport time. The half-life of a boulder on the bar, that is the time after which a boulder population is halved, is around 10.5 h. The surface layer of the bar is thus entirely renewed every 4 to 5 years. This suggests that the residence times of a boulder in a river is likely much shorter than the time it spends trapped on hillslopes, a hypothesis consistent with assumptions commonly used in cosmogenic dating (e.g., Carretier et al., 2020).
On a yearly timescale, the discharge of boulders scales like , where τ is the residence time of the boulders on the bar, σ is their number per unit area of the bed, W is the river width and Lf is the average distance traveled by a boulder during a year (Einstein, 1937). At present, we cannot use this formula to calculate the discharge of boulders in the Vieux-Habitants river, for lack of measurement of the traveled distance Lf. However, this distance has been measured in other contexts with tracer pebbles equipped with radio frequency identification (RFID) PIT tags (e.g., Bradley and Tucker, 2012; Phillips and Jerolmack, 2014; Papangelakis et al., 2019). The combination of this RFID technique with the UAV method that we report here should allow us to estimate both the residence time and the distance traveled by bedload particles and therefore the bedload discharge (Papangelakis et al., 2022).
Here, we estimate the threshold discharge above which the river can transport its sediment. To do so, we assimilate the channel to a rectangle of width W, depth H and slope S. The Darcy–Weisbach equation then relates the average flow velocity V to the shear stress τ exerted on the riverbed (Limerinos, 1970):
where ρ is the density of water and Cf is the Darcy–Weisbach friction coefficient. In steady state, the momentum balance requires that
At the onset of sediment motion, the Shield number, Θ, defined as the ratio between the driving force acting on the grains and the weight of a grain, must equal a threshold value Θc:
where Δρ is the difference between the density of a grain and that of water, g is the acceleration of gravity, and D is the grain size. Combining Eq. (A2) with Eq. (A3) yields the expression of the flow depth H at the threshold of entrainment:
Similarly, combining Eqs. (A1) with Eqs. (A2) and (A3) yields the average flow velocity at the threshold of entrainment:
Injecting the velocity and the flow depth into the expression of the water discharge, Q=WHV, we find the threshold discharge above which the river can transport a boulder of diameter D:
This expression, of course, is only a crude estimate, if only because the river is not a straight rectangular channel. Nonetheless, it provides a decent approximation of the flow conditions that are necessary to initiate the transport of a given class of boulders (Fig. 5).
Discharge data used for Figs. 2 and 6 are available at http://www.hydro.eaufrance.fr/ (Hydroportail – Ministère de la Transition Ecologique, 2023). UAV Images and dataset are available at Harvard Dataverse https://doi.org/10.7910/DVN/QRHM8E (Allemand, 2021).
PA designed and performed the field measurements and processed the resulting data. All authors developed the overall ideas and were responsible for critical contributions, approving the final paper, and editing text and figures.
At least one of the (co-)authors is a member of the editorial board of Earth Surface Dynamics. The peer-review process was guided by an independent editor, and the authors also have no other competing interests to declare.
Publisher's note: Copernicus Publications remains neutral with regard to jurisdictional claims in published maps and institutional affiliations.
This work was carried out in the framework of ObsERA (Observatoire de l'Eau et de l'Erosion aux Antilles). ObsERA is part of OZCAR infrastructure. Philippe Grandjean, Sophie Passot, Vincent Robert and Thierry Kitou are warmly thanked for their efficiency and involvement in this work. We are grateful to Claire Masteller and two anonymous reviewers for their constructive comments and their work on this paper.
This paper was edited by Claire Masteller and reviewed by two anonymous referees.
Abramian, A., Devauchelle, O., and Lajeunesse, E.: Laboratory rivers adjust their shape to sediment transport, Phys. Rev. E, 102, 053101, https://doi.org/10.1103/PhysRevE.102.053101, 2020.
Allemand, P.: Entrainment and deposition of boulders in a gravel bed river, Harvard Dataverse [data set], https://doi.org/10.7910/DVN/QRHM8E, 2021.
Allemand, P., Delacourt, C., Lajeunesse, E., Devauchel, O., and Beauducel, F.: Erosive effects of the storm Helena (1963) on Basse Terre Island (Guadeloupe – Lesser Antilles Arc), Geomorphology, 206, 79–86, https://doi.org/10.1016/j.geomorph.2013.09.020, 2014.
Ancey, C.: Stochastic modeling in sediment dynamics: Exner equation for planar bed incipient bed load transport conditions., J. Geophys. Res.-Earth, 115, F00A11, https://doi.org/10.1029/2009JF001260, 2010.
Ancey, C., Davison, A., Bohm, T., Jodeau, M., and Frey, P.: Entrainment and motion of coarse particles in a shallow water stream down a steep slope, J. Fluid Mech., 595, 83–114, https://doi.org/10.1017/S0022112007008774, 2008.
Aubert, G., Langlois, V. J., and Allemand, P.: Bedrock incision by bedload: insights from direct numerical simulations, Earth Surf. Dynam., 4, 327–342, https://doi.org/10.5194/esurf-4-327-2016, 2016.
Bagnold, R.: The nature of saltation and of Bedload transport in water, P. Roy. Soc. Lond. A, 332, 473–504, 1973.
Bagnold, R.: Bedload transport by natural rivers, Water Resour. Res., 13, 303–312, 1977.
Bradley, D. N.: Direct Observation of Heavy-Tailed Storage Times of Bedload Tracer Particles Causing Anomalous Superdiffusion, Geophys. Res. Lett., 44, 12227–12235, https://doi.org/10.1002/2017GL075045, 2017.
Bradley, D. N. and Tucker, G. E.: Measuring gravel transport and dispersion in a mountain river using passive radio tracers, Earth Surf. Proc. Land., 37, 1034–1045, https://doi.org/10.1002/esp.3223, 2012.
Buffington, J. and Montgomery, D.: A systematic analysis of eight decades of incipient motion studies, with special reference to gravelbedded rivers, Water Resour. Res., 33, 1993–2029, https://doi.org/10.1029/97WR03138, 1997.
Burtin, A., Bollinger, L., Vergne, J., Cattin, R., and Nábelek, J.: Spectral analysis of seismic noise induced by rivers: A new tool to monitor spatiotemporal changes in stream hydrodynamics, J. Geophys. Res.-Solid, 113, B05301, https://doi.org/10.1029/2007JB005034, 2008.
Burtin, A., Cattin, R., Bollinger, L., Vergne, J., Steer, P., Robert, A., Findling, N., and Tiberi, C.: Towards the hydrologic and bedload monitoring from high-frequency seismic noise in a braided river: The “torrent de St Pierre”, French Alps, J. Hydrol., 408, 43–53, https://doi.org/10.1016/j.jhydrol.2011.07.014, 2011.
Burtin, A., Hovius, N., McArdell, B., Turowski, J., and Vergne, J.: Seismic constraints on dynamic links between geomorphic processes and routing of sediment in a steep mountain catchment, Earth Surf. Dynam., 2, 21–33, https://doi.org/10.5194/esurf-2-21-2014, 2014.
Burtin, A., Hovius, N., and Turowski, J. M.: Seismic monitoring of torrential and fluvial processes, Earth Surf. Dynam., 4, 285–307, https://doi.org/10.5194/esurf-4-285-2016, 2016.
Carretier, S., Guerit, L., Harries, R., Regard, V., Maffre, P., and Bonnet, S.: The distribution of sediment residence times at the foot of mountains and its implications for proxies recorded in sedimentary basins, Earth Planet. Sc. Lett., 546, 116448, https://doi.org/10.1016/j.epsl.2020.116448, 2020.
Cassel, M., Piegay, H., Fantino, G., Lejot, J., Bultingaire, L., Michel, K., and Perret, F.: Comparison of ground-based and UAV a-UHF artificial tracer mobility monitoring methods on a braided river, Earth Surf. Proc. Land., 5, 1123–1140, https://doi.org/10.1002/esp.4777, 2020.
Charru, F., Mouilleron, H., and Eiff, O.: Erosion and deposition of particles on a bed shared by a viscous flow, J. Fluid Mech., 519, 55–80, https://doi.org/10.1017/S0022112004001028, 2004.
Chauvet, H., Devauchelle, O., Métivier, F., Lajeunesse, E., and Limare, A.: Recirculation cells in a wide channel, Phys. Fluids, 26, 016604, https://doi.org/10.1063/1.4862442, 2014.
Church, M.: Bed material transport and the morphology of alluvial river channels, Annu. Rev. Earth Planet. Sci., 34, 325–354, https://doi.org/10.1146/annurev.earth.33.092203.122721, 2006.
Church, M. and Haschenburger, J. K.: What is the “Active Layer”?, Water Resour. Res., 53, 5–10, https://doi.org/10.1002/2016WR019675, 2017.
Delacourt, C., Allemand, P., Jaud, M., Grandjean, P., Deschamps, A., Ammann, J., Cuq, V., and Suanez, S.: DRELIO: An unmanned helicopter for imaging coastal areas, SI 56, in: Proceedings of the 10th International Coastal Symposium, Lisbon, Portugal, 1489–1493, APR 13–18, 2009.
Devauchelle, O., Malverti, L., Lajeunesse, E., Lagrée, P., Josserand, C., and Thu-Lam, K.: Stability of bedforms in laminar flows with free surface: from bars to ripples, J. Fluid Mech., 642, 329–348, https://doi.org/10.1017/S0022112009991790, 2010.
Dietrich, W. and Smith, J.: Bedload Transport in a River Meander, Water Resour. Res., 20, 1355–1380, https://doi.org/10.1029/WR020i010p01355, 1984.
Dunne, K. B. and Jerolmack, D. J.: What sets river width?, Sci. Adv., 6, eabc1505, https://doi.org/10.1126/sciadv.abc1505, 2020.
Einstein, H. A.: Bed load transport as a probability problem, in: Sedimentation: Symposium to Honor Professor H. A. Einstein, 1972 (translation from German of H. A. Einstein doctoral thesis), Originally presented to Federal Institute of Technology, Zurich, Switzerland, C1–C105, 1937.
Einstein, H. A.: The bed-load function for sediment transportation in open channel flows, US Department of Agriculture, Soil Conservation Service, 74 pp., https://naldc.nal.usda.gov/download/CAT86201017/PDF (last access: 17 January 2023), 1950.
Ferguson, R. and Wathen, S.: Tracer-pebble movement along a concave river profile: Virtual velocity in relation to grain size and shear stress, Water Resour. Res., 34, 2031–2038, https://doi.org/10.1029/98WR01283, 1998.
Feuillet, N., Manighetti, I., and Tapponnier, P.: Arc parallel extension and localization of volcanic complexes in Guadeloupe, Lesser Antilles, J. Geophys. Res., 107, 1–29, https://doi.org/10.1029/2001JB000308, 2002.
Furbish, D., Roseberry, J., and Schmeeckle, M.: A probabilistic description of the bedload sediment flux: 3. The particle velocity distribution and the diffusive flux, J. Geophys. Res.h, 117, F03033, https://doi.org/10.1029/2012JF002356, 2012a.
Furbish, D. J., Haff, P. K., Roseberry, J. C., and Schmeeckle, M. W.: A probabilistic description of the bed load sediment flux: 1. Theory, J. Geophys. Res., 117, F03031, https://doi.org/10.1029/2012JF002352, 2012b.
Gaillardet, J., Braud, I., Hankard, F., Anquetin, S., Bour, O., Dorfliger, N., et al.: OZCAR: The French network of critical zone observatories, Vadose Zone J., 17, 180067, https://doi.org/10.2136/vzj2018.04.0067, 2018.
Gimbert, F., Tsai, V. C., and Lamb, M. P.: A physical model for seismic noise generation by turbulent flow in rivers, J. Geophys. Res.-Earth, 119, 2209–2238, https://doi.org/10.1002/2014JF003201, 2014.
Gomez, B.: Bedload transport, Earth-Sci. Rev., 31, 89–132, https://doi.org/10.1016/0012-8252(91)90017-A, 1991.
Guérin, A., Devauchelle, O., Robert, V., Kitou, T., Dessert, C., Quiquerez, A., Allemand, P., and Lajeunesse, E.: Stream-discharge surges generated by groundwater flow, Geophys. Res. Lett., 46, 7447–7455, https://doi.org/10.1029/2019GL082291, 2019.
Habersack, H., Kreisler A., Rindler R., Aigner J., Seitz, H., Liedermann, M., and Laronne, J. B.: Integrated automatic and continuous bedload monitoring in gravel bed rivers, Geomorphology, 291, 80–93, https://doi.org/10.1016/j.geomorph.2016.10.020, 2017.
Haschenburger, J. K. and Church, M.: Bed material transport estimated from the virtual velocity of sediment, Earth Surf. Proc. Land., 23, 791–808, https://doi.org/10.1002/(SICI)1096-9837(199809)23:9<791::AID-ESP888>3.0.CO;2-X, 1998.
Haschenburger, J. K. and Wilcock, P. R.: Partial transport in a natural gravel bed channel, Water Resour. Rese., 39, 1020, https://doi.org/10.1029/2002WR001532, 2003.
Helley, E. J. and Smith, W.: Development and calibration of a pressure-difference bedload sampler, Geological Survey Open-File Report, US Geological Survey, https://doi.org/10.3133/ofr73108, 1971.
Henderson, F. M.: Stability of alluvial channels, T. Am. Soc. Civ. Eng., 128, 657–686, 1963.
Houssais, M. and Lajeunesse, E.: Bedload transport of a bimodal sediment bed, J. Geophys. Res., 117, F04015, https://doi.org/10.1029/2012JF002490, 2012.
Hydroportail – Ministère de la Transition Ecologique: Hydro-Portail, http://www.hydro.eaufrance.fr/, last access: 17 January 2023.
Jaud, M., Passot, S., Allemand, P., Le Dantec, N., Grandjean, P., and Delacourt, C.: Suggestions to Limit Geometric Distortions in the Reconstruction of Linear Coastal Landforms by SfM Photogrammetry with PhotoScan and MicMac for UAV Surveys with Restricted GCPs Pattern, Drones, 3, 2, https://doi.org/10.3390/drones3010002, 2019a.
Jaud, M., Delacourt, C., Le Dantec, N., Allemand, P., Ammann, J., Grandjean, P., Nouaille, H., Prunier, C., Cuq, V.; Augereau, E., Cocquenpot, L., and Floc'h, F.: Diachronic UAV Photogrammetry of a Sandy Beach in Brittany (France) for a Long-Term Coastal Observatory, ISPRS Int. J. Geo-Inform., 8, 267, https://doi.org/10.3390/ijgi8060267, 2019b.
Jury, M. R. and Bernard, D.: Climate trends in the East Antilles Islands, Int. J. Climatol., 40, 36–51, https://doi.org/10.1002/joc.6191, 2020.
Lague, D., Hovius, N., and Davy, P.: Discharge, discharge variability, and the bedrock channel profile, J. Geophys. Res., 110, F04006, https://doi.org/10.1029/2004JF000259, 2005.
Lajeunesse, E., Malverti, L., and Charru, F.: Bedload transport in turbulent flow at the grain scale: experiments and modeling, J. Geophys. Res, 115, F04001, https://doi.org/10.1029/2009JF001628, 2010.
Lajeunesse, E., Devauchelle, O., Lachaussée, F., and Claudin, P.: Bedload transport in laboratory rivers: the erosion-deposition model, in: Gravel-bed Rivers: Gravel Bed Rivers and Disasters, Wiley-Blackwell, Oxford, UK, 415–438, https://doi.org/10.1002/9781118971437.ch15, 2017.
Lajeunesse, E., Devauchelle, O., and James, F.: Advection and dispersion of bed load tracers, Earth Surf. Dynam., 6, 389–399, https://doi.org/10.5194/esurf-6-389-2018, 2018.
Lamb, M. P., Dietrich, W. E., and Venditti, J. G.: Is the critical Shields stress for incipient sediment motion dependent on channel-bed slope?, J. Geophys. Res., 113, F02008, https://doi.org/10.1029/2007JF000831, 2008.
Leopold, L. B. and Emmett, W. W.: Bedload measurements, East 85 Fork River, Wyoming, P. Natl. Acad. Sci. USA, 73, 1000–1004, 1976.
Limerinos, J. T.: Determination of the Manning coefficient from measured bed roughness in natural channels, United States Geological Survey Water-Supply Paper 1898-B, US Geological Survey, https://doi.org/10.3133/wsp1898B, 1970.
Liu, Y., Metivier, F., Lajeunesse, E., Lancien, P., Narteau, C., and Meunier, P.: Measuring bedload in gravel bed mountain rivers: Averaging methods and sampling strategies, Geodin. Acta, 21, 81–92, https://doi.org/10.3166/ga.21.81-92, 2008.
Mao, L., Carrillo, R., Escauriaza, C., and Iroume, A.: Flume and field-based calibration of surrogate sensors for monitoring bedload transport, Geomorphology, 253, 10–21, https://doi.org/10.1016/j.geomorph.2015.10.002, 2016.
Martin, R. L., Jerolmack, D. J., and Schumer, R.: The physical basis for anomalous diffusion in bedload transport, J. Geophys. Res., 117, F01018, https://doi.org/10.1029/2011JF002075, 2012.
Métivier, F., Meunier, P., Moreira, M., Crave, A., Chaduteau, C., Ye, B., and Liu, G.: Transport dynamics and morphology of a high mountain stream during the peak flow season: The ürümqi River (Chinese Tianshan), in: River Flow 2004: Proceedings of the Second International Conference on Fluvial Hydraulics, edited by: Massimo Greco, M., Carravetta, A., and Della Morte, R., Taylor and Francis, Philadelphia, PA, 761–777, ISBN 90 5809 658 0, 2004.
Métivier, F., Lajeunesse, E., and Devauchelle, O.: Laboratory rivers: Lacey's law, threshold theory, and channel stability, Earth Surf. Dynam., 5, 187–198, https://doi.org/10.5194/esurf-5-187-2017, 2017.
Meunier, P., Metivier, F., Lajeunesse, E., Meriaux, A. S., and Faure, J.: Flow pattern and sediment transport in a braided river: The “torrent de St Pierre” (French Alps), J. Hydrol., 330, 496–505, https://doi.org/10.1016/j.jhydrol.2006.04.009, 2006.
Nezu, I. and Nakagawa, H.: Turbulence in Open Channel Flows, in: IAHR Monograph, A. A. Balkema, Rotterdam, https://doi.org/10.1061/(ASCE)0733-9429(1994)120:10(1235), 1993.
Papangelakis, E., MacVicar, B., and Ashmore, P.: Bedload sediment transport regimes of semi-alluvial rivers conditioned by urbanization and stormwater management, Water Resour. Res., 55, 10565–10587, https://doi.org/10.1029/2019WR025126, 2019.
Papangelakis, E., MacVicar, B. J., Montakhab, A. F., and Ashmore, P.: Flow strength and bedload sediment travel distance in gravel bed rivers, Water Resour. Res., 58, e2022WR032296, https://doi.org/10.1029/2022WR032296, 2022.
Parker, G.: Self-formed straight rivers with equilibrium banks and mobile bed. Part 1. The sand-silt river, J. Fluid Mech., 89, 109–125, 1978.
Pfeiffer, A. M. and Finnegan, N. J.: Regional variation in gravel riverbed mobility, controlled by hydrologic regime and sediment supply, Geophys. Res. Lett., 45, 3097–3106, https://doi.org/10.1002/2017GL076747, 2018.
Phillips, C., Hill, K. M., Paola, C., Singer, M., and Jerolmack, D.: Effect of flood hydrograph duration, magnitude, and shape on bed load transport dynamics, Geophys. Res. Lett., 45, 8264–8271, https://doi.org/10.1029/2018GL078976, 2018.
Phillips, C. B. and Jerolmack, D. J.: Dynamics and mechanics of bed-load tracer particles, Earth Surf. Dynam., 2, 513–530, https://doi.org/10.5194/esurf-2-513-2014, 2014.
Phillips, C. B. and Jerolmack, D. J.: Self-organization of river channels, as a critical filter on climate signals, Science, 352, 694–697, https://doi.org/10.1126/science.aad3348, 2016.
Rad, S., Louvat, P., Gorge, C., Gaillardet, J., and Allègre, C. J.: River dissolved and solid loads in the Lesser Antilles: new insight into basalt weathering processes, J. Geochem. Explor., 88, 308–312, https://doi.org/10.1016/j.gexplo.2005.08.063, 2006.
Rupnik, E., Daakir, M., and Deseilligny, M. P.: Open Geospatial Data, Software and Standards, MicMac – a free, open-source solution for photogrammetry, Open geospatial data, softw. stand., 2, 14, https://doi.org/10.1186/s40965-017-0027-2, 2017.
Samper, A., Quidelleur, X., Lahitte, P., and Mollex, D.: Timing of effusive volcanism and collapse events within an oceanic arc island: Basse-Terre, Guadeloupe archipelago (Lesser Antilles Arc), Earth Planet. Sc. Lett., 258, 175–191, https://doi.org/10.1016/j.epsl.2007.03.030, 2007.
Seminara, G.: Fluvial sedimentary patterns, Annu. Rev. Fluid Mech., 42, 43–66, https://doi.org/10.1146/annurev-fluid-121108-145612, 2010.
Shields, A. S.: Anwendung der Aehnlichkeitsmechanik und der Turbulenzforschung auf die Geschiebebewegung, Mitteilung der Preussischen Versuchsanstalt für Wasserbau und Schiffbau, 26 pp., http://resolver.tudelft.nl/uuid:61a19716-a994-4942-9906-f680eb9952d6 (last access: 17 January 2023), 1936.
Summerfield, M. A. and Hulton, N. J.: Natural controls of fluvial denudation rates in major world drainage basins, J. Geophys. Res., 99, 13871–13883, https://doi.org/10.1029/94JB00715, 1994.
Terry, J. P., and Goff, J.: Megaclasts: proposed revised nomenclature at the coarse end of the Udden-Wentworth grain-size scale for sedimentary particles, J. Sediment. Res., 84, 192–197, https://doi.org/10.2110/jsr.2014.19, 2014.
Thorne, P. D.: An overview of underwater sound generated by interparticle collisions and its application to the measurements of coarse sediment bedload transport, Earth Surf. Dynam., 2, 531–543, https://doi.org/10.5194/esurf-2-531-2014, 2014.
Turowski, J. M. and Rickenmann, D.: Tools and cover effects in bedload transport observations in the Pitzbach, Austria, Earth Surf. Proc. Land., 34, 26–37, https://doi.org/10.1002/esp.1686, 2009.
Wilcock, P. R. and McArdell, B. W.: Partial transport of a sand/gravel sediment, Water Resour. Rese., 33, 235–245, https://doi.org/10.1029/96WR02672, 1997.
Wolman, M. G. and Miller, J. P.: Magnitude and frequency of forces in geomorphic processes, J. Geol., 68, 54–74, 1960.
Yager, E. M., Dietrich, W. E., Kirchner, J. W., and McArdell, B. W.: Prediction of sediment transport in step-pool channels, Water Resour. Res., 48, W01541, https://doi.org/10.1029/2011WR010829, 2012.