the Creative Commons Attribution 4.0 License.
the Creative Commons Attribution 4.0 License.
 | 14 Apr 2023
Pristine levels of suspended sediment in large German river channels during the Anthropocene?
Thomas O. Hoffmann
Yannik Baulig
Stefan Vollmer
Jan H. Blöthe
Karl Auerswald
Peter Fiener
Suspended sediment is an integral part of riverine transport and functioning that has been strongly altered during the Anthropocene due to the overwhelming human pressure on soils, sediments, and the water cycle. Understanding the controls of changing suspended sediment in rivers is therefore vital for effective management strategies. Here we present results from a trend analysis of suspended sediments covering 62 monitoring stations along the German waterways (catchment sizes range between 2000 and 160 000 km2) with more than 440 000 water samples taken between 1990 and 2010. Based on daily monitoring of suspended sediment concentration (SSC), we found significant declines in mean annual SSC and annual suspended sediment loads (SSLs) at 49 of 62 monitoring stations totaling −0.92 mg L−1 yr−1. At some stations decreases during the 20 years represent up to 50 % of the long-term average SSC. Significant decreases in SSC are associated with declining SSL despite an increase in sheet and rill erosion by almost 150 % derived from modeling due to changes in land use and management as well as rainfall erosivity. The contemporary suspended sediment loads of the Rhine at the German–Dutch border are approaching the natural base level of ∼1 Mt yr−1, which was reached by the Rhine during the mid-Holocene when the suspended sediment load was adjusted to the Holocene climatic conditions and before the onset of increased loads due to human-induced land use changes in the Rhine catchment. At this point we can only speculate regarding potential reasons for a decline in sediment transport in larger rivers despite erosion increase. We argue that increased sediment retention in upstream headwaters is presumably the major reason for declining SSC in the large river channels studied.
- Article
(5805 KB) - Full-text XML
- Companion paper
-
Supplement
(607 KB) - BibTeX
- EndNote


Suspended sediment transport from land to ocean is a key component of the global sediment budget that strongly changed in response to human impacts during the Anthropocene. Recent estimates of the pre-Anthropocene magnitude of the land–ocean transfer range around ∼15 Gt yr−1, with suspended sediment transport representing the largest fraction (∼14 Gt yr−1) (Syvitski et al., 2022; Syvitski and Kettner, 2011). Human-induced land cover changes accelerated hillslope erosion compared to natural background rates by several orders of magnitude (Golosov and Walling, 2019; Montgomery, 2007; Nearing et al., 2017), strongly increasing the supply of fine sediments to river systems in large parts of the world. During the same time, increased sediment supply is counterbalanced by sediment retention due to the rapidly increasing number of large dams (Vörösmarty et al., 2003), disrupting the flow path of almost all large rivers in the world, with less than 23 % of the global rivers flowing uninterrupted to the ocean (Grill et al., 2019). Global sediment retention in reservoirs increased by a factor of ∼23 from 2.8 Gt yr−1 in 1950 to 65 Gt yr−1 in 2010 (Syvitski et al., 2022). Owing to the large retention of sediment behind dams, global sediment supply to the oceans decreased by ∼50 % to about 7.3 Gt yr−1 in 2010.
The evolution of regional sediment budgets during the Anthropocene may strongly deviate from the global figures due to multiple trajectories of socio-environmental changes around the world. While countries with strongly increasing populations typically show intensified erosion (Golosov and Walling, 2019) and sediment retention in reservoirs (Annandale et al., 2018), high-income countries start to remove large dams and reestablish the sediment continuity in river systems as a necessary prerequisite for healthy riverine ecosystems. In Europe, where more than 1 million barriers fragment rivers (Belletti et al., 2020), efforts are undertaken to reestablish the sediment connectivity and natural functionality of rivers as requested by the European Water Framework Directive (EC-WFD, 2000). However, dam removal is hardly possible along waterways (i.e., navigable river channels). Here sediment management plans were developed to maintain navigability, hydropower, flood protection, and other usages, while reducing the negative effects of dams, as well as to increase the (sediment) connectivity without dam removal (BAW and BfG, 2016).
Different trajectories of socio-environmental change can be found in Germany after the reunion of the former German Democratic Republic in the east and the Federal Republic of Germany in the west. In particular, land use and management affecting soil erosion developed differently since 1990. While farm size in the east decreased, there was a strong increase in farm sizes and in turn field sizes in the west (BMLE, 2021). The acreage of potatoes, which is the most erosion-prone crop in rotation (Auerswald et al., 2021), was halved in the east, while there was a pronounced increase in silage maize, another erosion-prone crop, in the west for biogas production (DESTATIS, 2021a, b). In the east, soil conservation is widely applied with more than 70 % in some administrative regions, while this is far less popular in the west with less than 20 % in some administrative regions. These changes in land use should have caused different trajectories of soil erosion and sediment supply in the east and in the west, which are overlain and dominated, however, by a strong increase in rain erosivity due to climate change (Auerswald et al., 2019).
Overall, the effect of potential changes in the sediment supply to rivers and their effect on suspended sediment in Germany remains unknown so far.
In this study we use data from the long-term suspended sediment monitoring network that is maintained by the German Waterways and Shipping Authority for sediment management purposes to study the changing suspended sediment dynamics during the last decades. The monitoring started in the 1960s based on daily sampling of suspended sediment at ∼60 monitoring stations along the German waterways to secure navigability in the context of efficient sediment management. So far, no systematic study of changing suspended sediment concentrations (SSCs) and suspended sediment loads (SSLs) using this dataset has been undertaken. Here we aim to detect changing SSCs between 1990 and 2010 and discuss potential drivers for the observed changes. The timescale from 1990 and 2010 was chosen because most monitoring stations were active during this time, and it therefore allows us to compare the trends between the different stations and between western and eastern Germany.
In this study we mainly focus on SSC instead of SSL as the former is the primary characteristic of the river system, and the latter is calculated based on the product of SSC and discharge (Q). In most river systems SSC is strongly conditioned by Q, but it is an independent variable that does not require the estimation of Q. Thus, we argue that changing SSC is an immediate response of changing sediment sources and dynamics and less likely due to climate-driven changes in Q.
2.1 Suspended sediment monitoring
SSC in German inland waterways is monitored by the Federal Waterways and Shipping Administration (Wasserstraßen- und Schifffahrtsverwaltung des Bundes, WSV). SSC monitoring started in 1963 at Hitzacker (Elbe River) and in 1964 in Maxau (River Rhine). Further stations were added to the monitoring network in the 1960s (10 stations), 1970s (23 stations), and 1980s (17 stations). In East Germany (i.e., in the former Democratic Republic of Germany) monitoring began only in November 1991, adding 20 stations along the Elbe, Oder, Havel, and Spree. By 2020, many monitoring stations provided long-term records that cover more than 30 years. Due to the decommission of some stations after 2000, the maximum number of stations was maintained between 1991 and 2010. For ease of comparability of the calculated trends between stations, we focus the trend analysis for all stations on this time interval even though single stations have been monitored much longer. For selected stations we discuss the stability of the trend analysis in comparison to extended time periods.
At each monitoring site, 5 L water samples are taken each work day (i.e., excluding weekends and public holidays). During floods the sampling frequency is increased to up to three samples per day, unless sampling is prohibited due to safety reasons. At some stations sampling gaps resulted from shortages of technical staff or from technical issues. Typically, data gaps during weekends and holidays (i.e., shorter than or equal to 5 d) were filled using linear regression. Larger data gaps were not considered in the trend analysis of SSC (for a sensitivity analysis of calculated trends for selected stations using data with data gaps and with filled data gaps, see Fig. S1 in the Supplement). Water samples are filtered using commercial coffee filters, which are weighed before and after filtering in dry conditions to calculate the daily SSC (mg L−1 = g m−3). The use of coffee filters is cost-efficient and facilitates measuring a large number of SSCs (i.e., ∼70 samples per day at the national scale) of sufficient quality. However, these filters do not have a well-defined pore diameter, and a significant fraction of clay is lost (Hoffmann et al., 2020). Since the production of the coffee filters did not change during the monitoring period, we argue that the lost clay fraction did not change through time and therefore does not affect the calculated SSC trends. Furthermore, calculated SSC values presented in this study include both the mineral and organic material of suspended sediment and are therefore equivalent to the concentration of the total suspended solids (for more details on sampling of suspended sediment see Hoffmann et al., 2020).
Daily SSC time series for each monitoring station cover variable times due to variable start dates of monitoring at each site, decommissioning of monitoring stations, and larger data gaps due to maintenance issues. Therefore, we only analyzed the long-term SSC trends of those stations that cover more than 15 years with more than 150 samples per year (representing approx. 50 % of the samples taken during a year at a station) between 1990 and 2010, resulting in 62 monitoring stations that are included in this study. The monitoring stations are located along 18 waterways in Germany, including the rivers Danube, Rhine, Ems, Weser, Elbe, and Oder and their larger tributaries (Fig. 1). The gauging stations cover contributing areas from 2076 to 159 555 km2 (Table S1 in the Supplement). The topography of the river catchments includes the steep high mountain terrain of the European Alps (e.g., Alpine Rhine and Danube) as well as mountainous regions with various geological settings in central Europe and the flat terrain of northern Germany, which is mainly composed of glacial and fluvial Quaternary deposits. Daily discharge for each station was taken from the Water Information System (WISKI) of the Federal Waterways and Shipping Administration from gauging stations at or near the suspended monitoring station. The long-term annual average discharge of the stations ranges from 7.5 to 2261 m3 s−1 (Table S1).
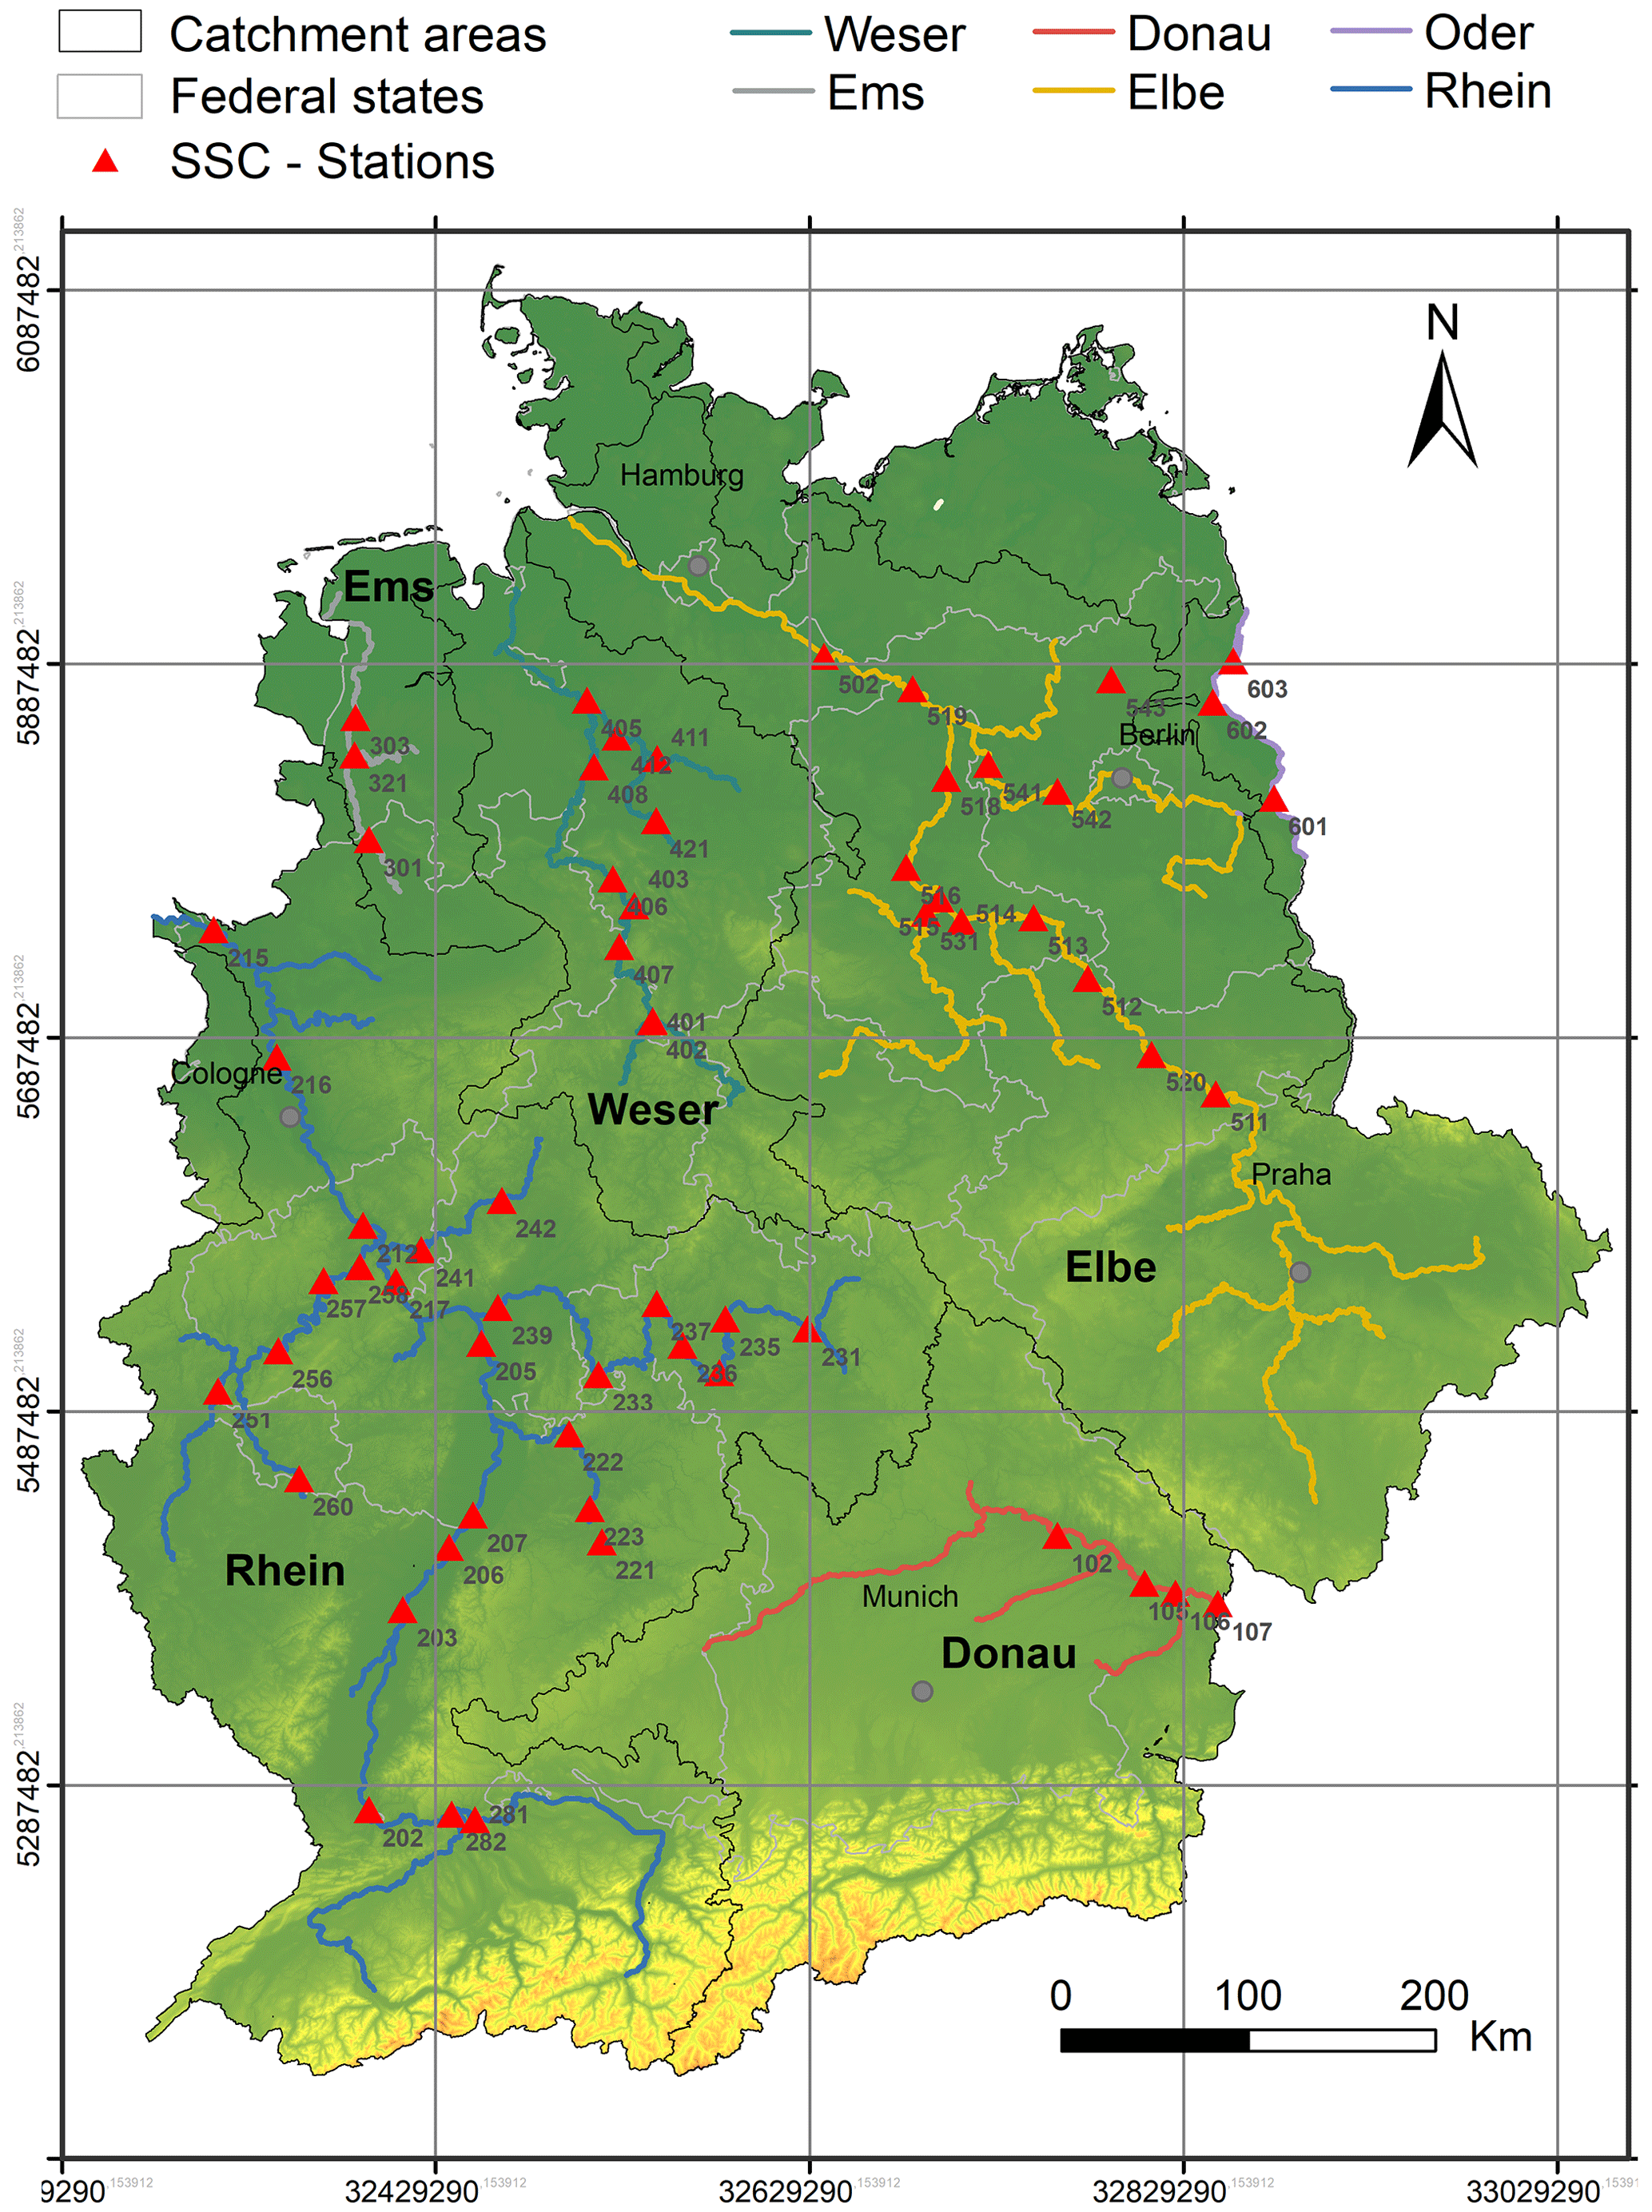
Figure 1Spatial distribution of sampling stations, major river systems, and catchment boundaries in Germany.
Annual suspended sediment loads (SSLs in t yr−1) were calculated based on the discharge-weighted averaging according to Walling and Webb (1981):
where is a unit conversion factor, (m3 s−1) and (mg L−1) are daily averages of discharge and SSC, respectively, during days with SSC measurements, and is the annual average discharge. Equation (1) considers time gaps without SSC measurements and interpolates them based on the ratio of the mean annual discharge () and the average discharge during days with SSC observations. As mentioned above, years with fewer than 150 measurements (e.g., due to operational issues at the monitoring station) were ignored in the trend analysis.
Infrequent sampling or large data gaps may result in strong underestimation of the annual average SSC or the annual SSL, especially in small and flashy river systems (Horowitz et al., 2015; Moatar et al., 2006; Walling and Webb, 1981). The monitoring stations considered in this study are all located along larger rivers that show smoothed and buffered behavior compared to smaller river systems (Slabon and Hoffmann, 2023), and no major data gaps were observed during severe floods. Therefore, we are confident that existing data gaps did not strongly alter the conclusions drawn from our analysis.
2.2 Trend analysis
The trend analysis of the SSC from 1990 and 2010 was performed on annual average SSCs for hydrological years starting with the flood period on 1 November and ending 31 October. We applied linear least-squared regression (LSR), the Mann–Kendall test, and Sen's slope, which are frequently used in trend analysis of suspended sediment transport (Pohlert, 2018; Walling and Fang, 2003). We applied the LSR due to its simplicity, knowing that (i) residuals of the LSR may not be normally distributed (e.g., due to the existence of extreme SSC values), or (ii) mean annual SSC data may show autocorrelation. Thus, we checked for normality of the residuals using Q–Q plots with 95 % confidence intervals and for autocorrelation using the Box–Pierce test. A total of 12 stations show non-normally distributed residuals of the LSR, indicated by italic plin values in Table S2. Furthermore, 46 of the 62 stations show autocorrelation of the mean annual SSC at the p<0.05 level, indicating limited applicability of the LSR for trend analysis.
To evaluate the limitations of the linear regression on time series data we additionally used the nonparametric Mann–Kendall test to detect monotonic trends of SSC for each station. In contrast to LSR, the rank-based Mann–Kendall test does not rely on normally distributed residuals and does not make any assumptions about the type of trend (i.e., linear or nonlinear) as long as values are changing monotonically. In the case of significant trends at a 5 % level (i.e., Mann–Kendall p<0.05), we estimate the magnitude of the annual SSC trend in milligrams per liter per year (mg L−1 yr−1) using Sen's slope. The calculation of the magnitude using Sen's slope provides robust estimates in the presence of extreme values. The Mann–Kendall test and Sen's slope are calculated using the R package “trend” (Pohlert, 2018).
To check for seasonal differences, we calculated trends based on annual averages for the summer months from June to August and winter seasons from December to February. The winter season covers large parts of the flood period of large rivers and is controlled by prolonged advective rainfall with little evapotranspiration, while the summer months are characterized by frequent short and intense convective rainfall of small spatial extension and high rainfall erosivity (Fiener and Auerswald, 2009; Fiener et al., 2013) that cause floods in small catchments.
Under the assumption that SSCs change linearly with time (, where t is time in years since an arbitrary chosen date, and a and b are coefficients) and that the discharge Q remains unchanged, changes in SSC translate to changes in the suspended sediment load (SSL):
with the conversion factor to obtain annual SSL in units of tons per year, for SSC given in milligrams per liter (mg L−1), and Q in cubic meters per second (m3 s−1) (compare Eq. 1). Equation (2b) implies a linear decline in annual SSL for negative b, as suggested by the trend analysis in this study (see results on SSC trend).
2.3 Trend of rating parameters
In many studies, sediment rating curves of the form
are used to predict SSC (Doomen et al., 2008) or to understand source and transport characteristics in the form of hysteresis analysis (Asselmann, 2000; Hoffmann et al., 2020). In this study, we do not use the rating approach to predict SSC for infrequent measurements or for SSC data gaps but use the rating coefficients to identify changes in suspended sediment transport conditions. The rating coefficients α [mg L−1] and β [–] represent the suspended sediment concentration at unit discharge and the steepness of the increase in SSC with Q, respectively. The steepness β is often related to the topography of the contributing catchment area, with higher increases in SSC for a given increase in Q for steeper catchments that supply more sediment than gentle contributing catchments (Syvitski et al., 2000). Changing conditions of suspended sediment in rivers are translated to changes in the rating coefficients (Warrick, 2015). An increase or decrease in α relates to parallel upwards or downward shift of the rating curve, thus changing SSC equally at all discharges. Changes in β modify the frequency–magnitude of suspended sediment transport, with increasing steepness raising the effect of large-magnitude events, while decreasing steepness shifts the formative events towards smaller discharges (Warrick, 2015).
Here we calculate the rating coefficients in Eq. (3) using log-linear regression for each station and for each year with more than 150 measurements per year between 1990 and 2010. Rating coefficients for a certain year were only used for the trend analysis if the log-linear regression resulted in significant p values < 0.05. Hoffmann et al. (2020) showed that rating curves of almost all monitoring stations used here are characterized by a bilinear relation in the log–log diagram, with a scale break at discharges close to the geometric mean discharge QGM of each station. Therefore, we normalized all SSC and Q data by the geometric mean of each station, , and used only data for the high-flow regime , which is mainly controlled by sediment supply from hillslopes during surface-runoff-generating rainfall events. According to Warrick (2015) the use of normalized data minimized the effect of the interrelation of α and β, which arises if rating curves are estimated with non-normalized data.
2.4 Driving factors
A multitude of natural and anthropogenic factors potentially control SSC in German waterways, and some are inherently difficult to quantify. Changes in SSC are either linked to changes in sediment supply to river systems or sediment retention along the flow path within the river channels or their neighboring floodplains.
Here, we tried to grasp the influence of drivers that are frequently discussed in the context of changing SSC and SSL in large river systems. With respect to changes in the sediment supply from the contributing catchments, the considered drivers include changes in (i) rainfall amount and characteristic, (ii) river discharge (as an integrative parameter for water supply to river systems), and (iii) land cover (i.e., coverage by plants protecting the soil from erosion).
Discharge for all SSC monitoring stations is taken from the Water Information System (WISKI) of the German Waterways and Shipping Authority. Here we used daily discharge data from gauging stations located at or close to the suspended monitoring stations. For the trend analysis, daily discharge data are aggregated to mean annual discharges using the hydrological year (similar to SSC and SSL).
To analyze changes in sediment supply due to changes in soil erosion within the catchments between 1990 and 2010 changes in the factors representing rainfall erosivity (R factor) and soil cover (C factor) are used in the framework of the Universal Soil Loss Equation, USLE (Wischmeiner and Smith, 1978). The R factor quantifies rainfall erosivity, which linearly relates to the soil loss caused by rainfall under otherwise constant boundary conditions. Hence, rainfall erosivity of individual events can be summed up to yield the annual R factor. Until 2016 R is available annually from rain gauge measurements, and since 2001 it has been determined with 1×1 km2 resolution from rain radar measurements (Auerswald et al., 2019). Land use and land management are quantified in the C factor of the USLE and mainly depend on the shares of grassland and arable land as well as the proportions of different crops on arable land.
We used statistical yearbooks for the Federal Republic of Germany between 1990 and 2020 (provided at https://www.destatis.de/DE/Home/_inhalt.html, last access: 1 November 2022) to derive the extent of arable land and grassland for each year, including proportions of grain and silage maize, potatoes, and sugar beets on arable land. These data were converted to C factors following Auerswald et al. (2021). Since land use and management developed differently in West and East Germany after the reunification in 1990, we separately present the changes in C for West and East Germany. We did not consider changes in the length of the erosive slopes, which is quantified by the L factor of the USLE, because such data are not available, and the effect is small because many fields are larger than the geomorphologic slope length. The change in erosion over time is then given by the product of R and C because all other factors of the USLE are assumed to remain constant between 1990 and 2010.
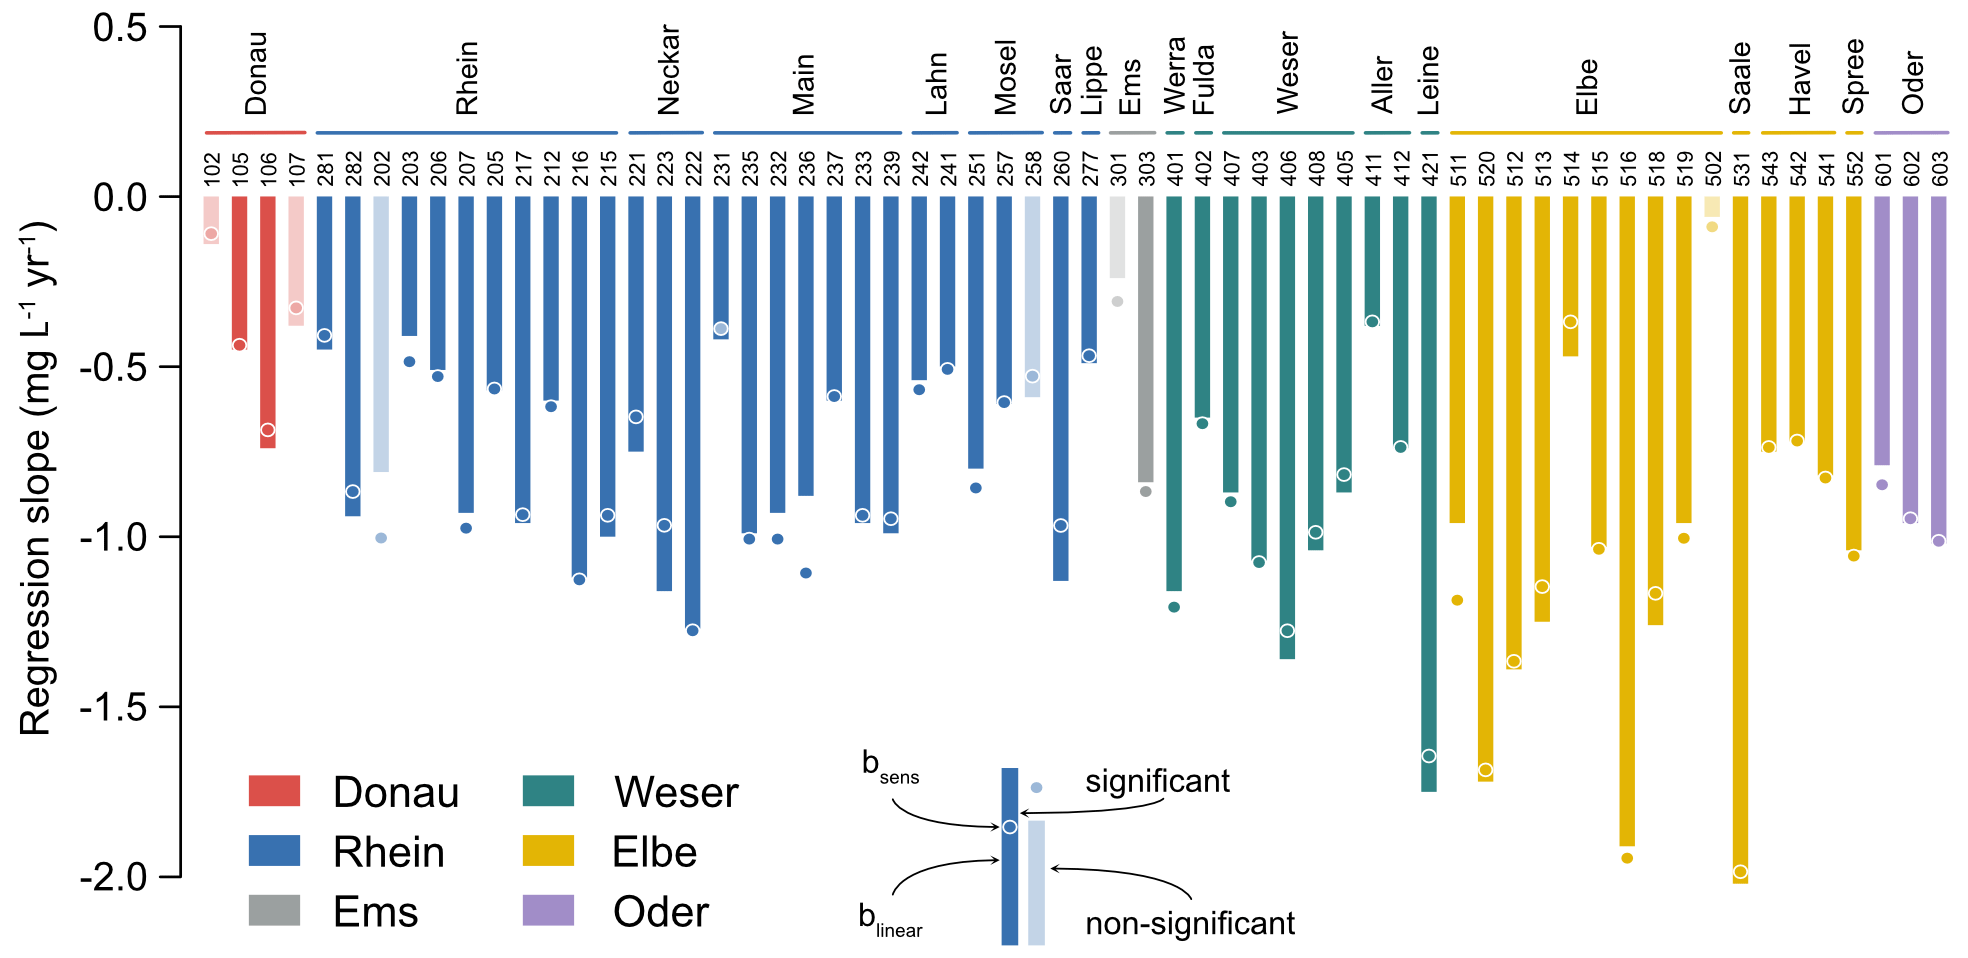
Figure 2Overview of SSC trends for all 62 stations ordered according to the river systems and flow path from upstream (left) to downstream (right) showing the trends from least-square linear regression and Sen's slope.
Drivers affecting sediment retention in river systems are represented here by the numbers of dams along the German waterways and the volume of reservoirs in Germany (Heimerl et al., 2013). The latter is limited to reservoirs with a dam height larger than 15 m. This excludes many small barriers and dams that disconnect sediment transport in medium and small river systems as indicated by Belletti et al. (2020), who assume a total barrier number of more than 18 000 in Germany. While reservoirs are typically located in smaller headwater catchments, their cumulative volume is a first-order proxy for disconnectivity of sediment supply from hillslopes to river channels. In contrast, dams along the waterways (constructed mainly to produce hydropower and to improve navigation) retain suspended sediments within the river channel. Their trapping efficiency in terms of suspended sediments is typically much lower than that of reservoirs. The cumulative increase in both numbers between 1900 and 2010 is used as a first-order proxy for the timing of sediment retention.
3.1 SSC trends
For both trend algorithms (i.e., linear regression and Sen's slope) 56 stations show significant changes in mean annual SSCs between 1990 and 2010 (Figs. 2 and 3 and Table S2). Only six stations show no significant change at the 5 % level. SSC gradients of stations with significant changes derived from the linear regression (blin) range between −2.02 and −0.38 mg L−1 yr−1 with a mean of −0.92 mg L−1 yr−1. Relative to the mean SSC, the gradients represent declines of −0.2 to −8.7 % yr−1. Sen's slopes (bsen) for stations with significant p values at the 5 % level range of the same order between −1.99 and −0.37 mg L−1 yr−1 (or −8.9 and −0.26 % yr−1) with a mean of −0.92 mg L−1 yr−1 (3.7 % yr−1) (Fig. 2).
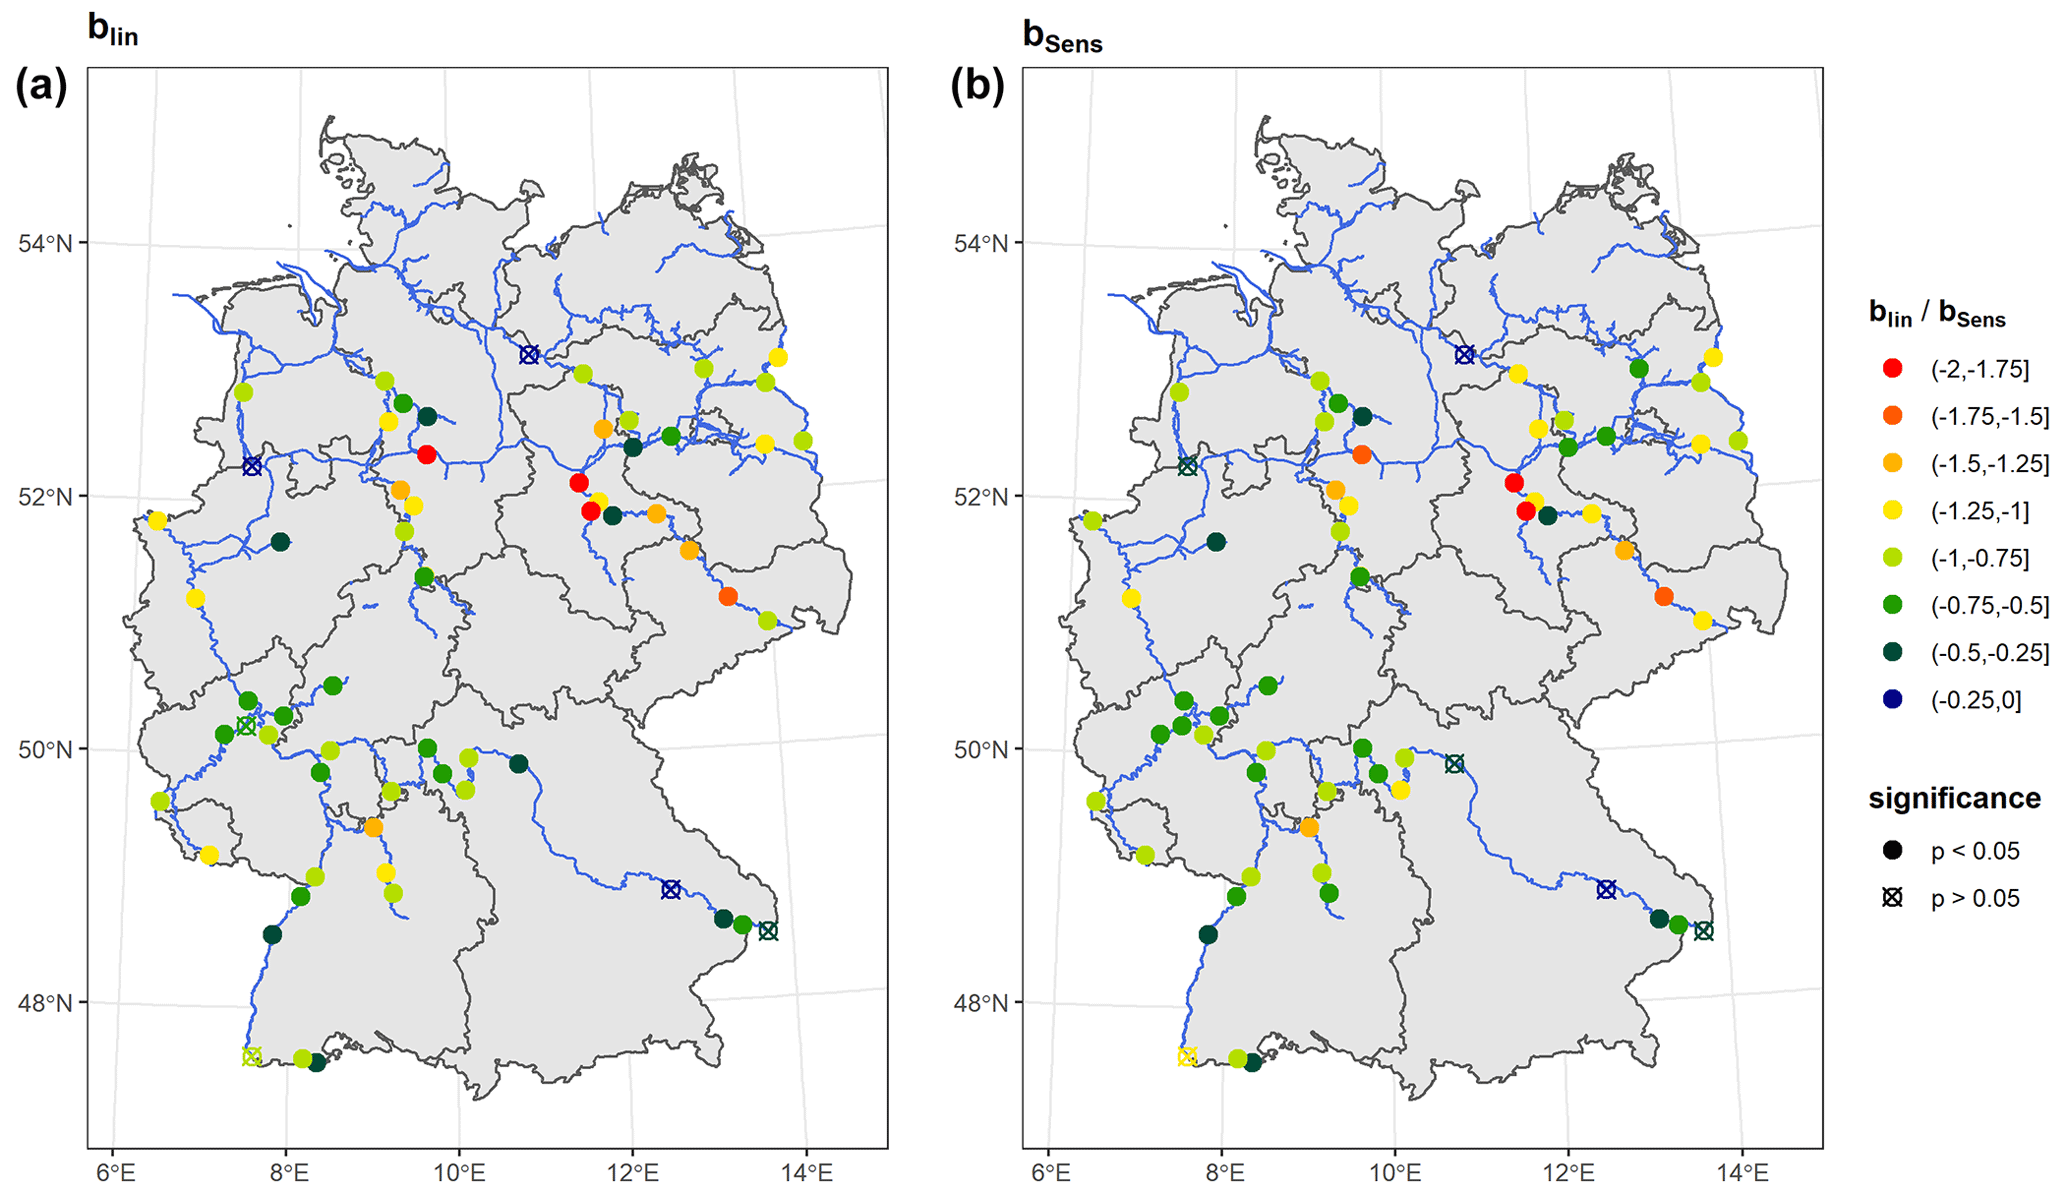
Figure 3Spatial distribution of trends of annual average SSC (in mg L−1 yr−1) between 1990 and 2010 along the waterways in Germany. Panel (a) shows trend magnitudes derived from linear regression, and panel (b) shows trend magnitudes derived from Sen's slopes.
Negative b values indicate that 56 out of 62 stations are characterized by a significant decline in mean annual SSCs between 1990 and 2010. Both trend algorithms show comparable trends with only marginal differences between Sen's slope and the linear gradient – see Fig. 4 for examples from stations at Maxau (207) and Emmerich (215) along the Rhine or Fig. S2 for all stations. The similarity of the two approaches suggests that in our case autocorrelation of annually averaged SSCs and outliers (due to extremes) do not play a major role for the trend estimation. However, for statistical correctness we use Sen's slope for further analysis as residuals of the LSR are mostly not normally distributed, which violates the assumptions of the LSR.
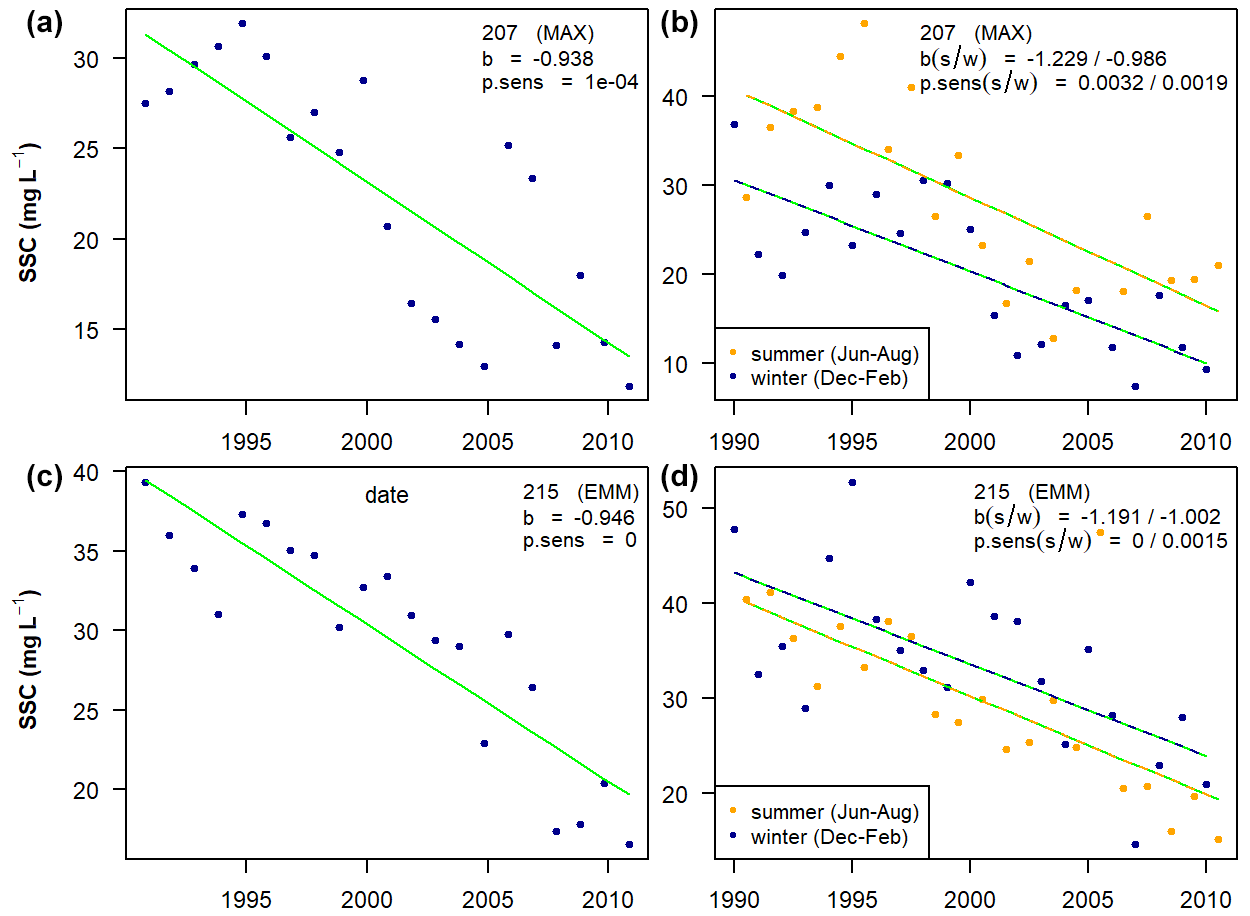
Figure 4Examples of SSC trends between 1990 and 2010 for monitoring station Maxau (a, b) and Emmerich (c, d). Panels (a, c) show annual average SSC, and panels (b, d) show trends during summer and winter months.
Stations without significant changes for both trend algorithms between 1990 and 2010 include Straubing (ID 102) and Jochenstein (ID 107) along the Danube River, Weil (202) at the Rhine River, Rheine (301) at the Weser River, and Hitzacker (502), the most downstream station along the Elbe River (Fig. 3). Additionally, for linear regression station Brodenbach (258) at the Moselle River and for the Sen's slope regression station Viereth (231) at the Main River show no significant decreases (see Fig. 3).
The magnitude of the decline seems to be unaffected by the average discharge at the stations but is weakly correlated with the average SSC between 1990 and 2010 (Fig. 5). Stations with high average SSCs show generally stronger declines than stations with low average SSCs. This is especially evident along the Rhine; the stations in the upper Rhine show lower average SSCs and either no (station Weil, ID 202) or lower (station IDs 203, 205, 206, and 207) declining trends compared to the stations at the middle and lower Rhine (station IDs 212, 215, 216, and 217), where average SSCs are higher and trend magnitudes are larger (Fig. 3). The strongest declines along the German waterways with mg L−1 yr−1 are observed at four stations in the Elbe and Weser catchments (station IDs 531, 516, 520, and 421). However, there is no indication of a general spatial pattern of the SSC decline (Fig. 3).
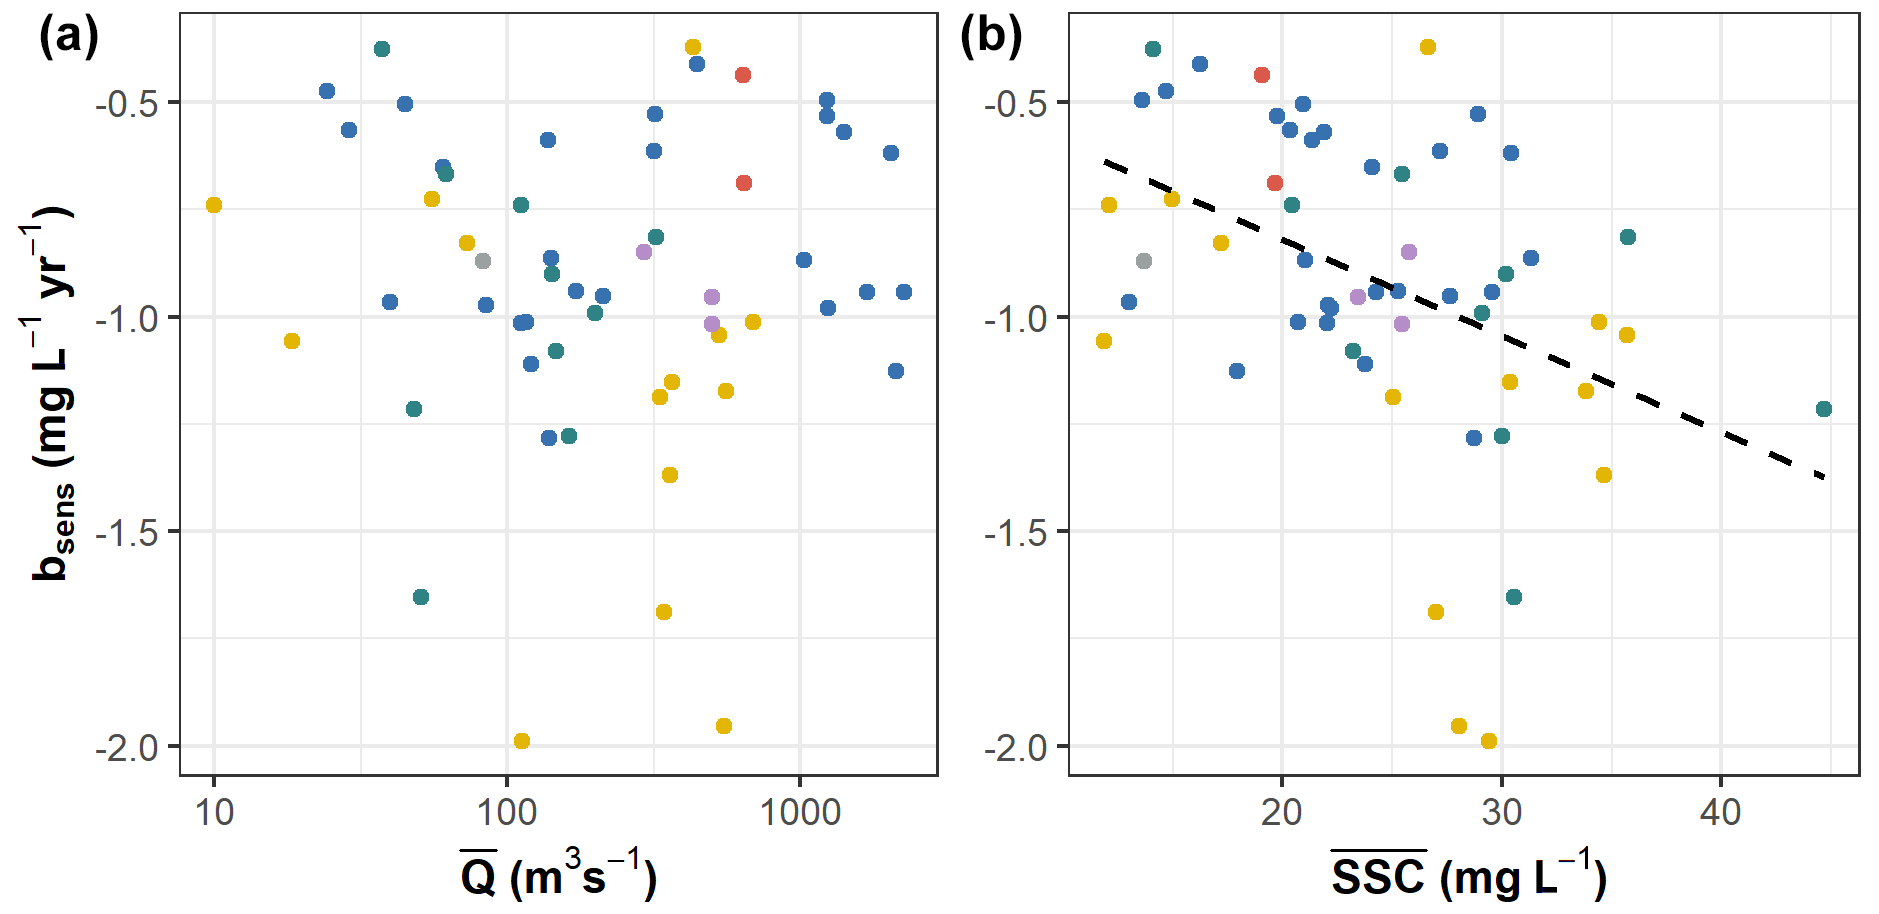
Figure 5Sen's slope for SSC of all stations as a function of mean discharge (a) and mean SSC (b). Mean values refer to the period between 1990 and 2010. Colors represent river systems (for legend see Fig. 2). The dashed line in (b) shows the linear regression between and bSens, with p∼0.007 and R2=0.18.
The seasonal trend analysis confirms the general picture of the annual trends (see Table S2 and Fig. 4 for examples at Maxau and Emmerich). A total of 52 of 62 stations show a significant trend of the average SSC during June, July, and August (summer trend) from 1990 to 2010. Except for Hitzacker, the most downstream station at the Elbe, all significant summer trends of the monitoring stations in Germany are negative, ranging from −2.87 to −0.36 mg L−1 yr−1 (or −10.6 to −0.3 % yr−1). At Hitzacker the summer trend is increasing with 0.76 mg L−1 yr−1 (or 2.3 % yr−1). Interestingly, the largest summer decline is also observed at the Elbe in Magdeburg ( mg L−1 yr−1 or 10.2 % yr−1) approximately 190 km upstream of Hitzacker. Average SSCs during the winter months (December to February) decline significantly at 49 of 62 stations, with 13 stations showing no significant change and no station showing a significant increase. The bwinter value ranges −3.55 to −0.39 mg L−1 yr−1 (or −11.6 to −0.2 % yr−1), while most stations scatter between −1.5 and 0.5 mg L−1 yr−1. At Hitzacker, the winter months show a significant decline with −0.61 mg L−1 yr−1 (or −1.8 % yr−1), despite the increase in SSC during the summer months. These contrasting seasonal trends result in insignificant changes at Hitzacker during the whole year.
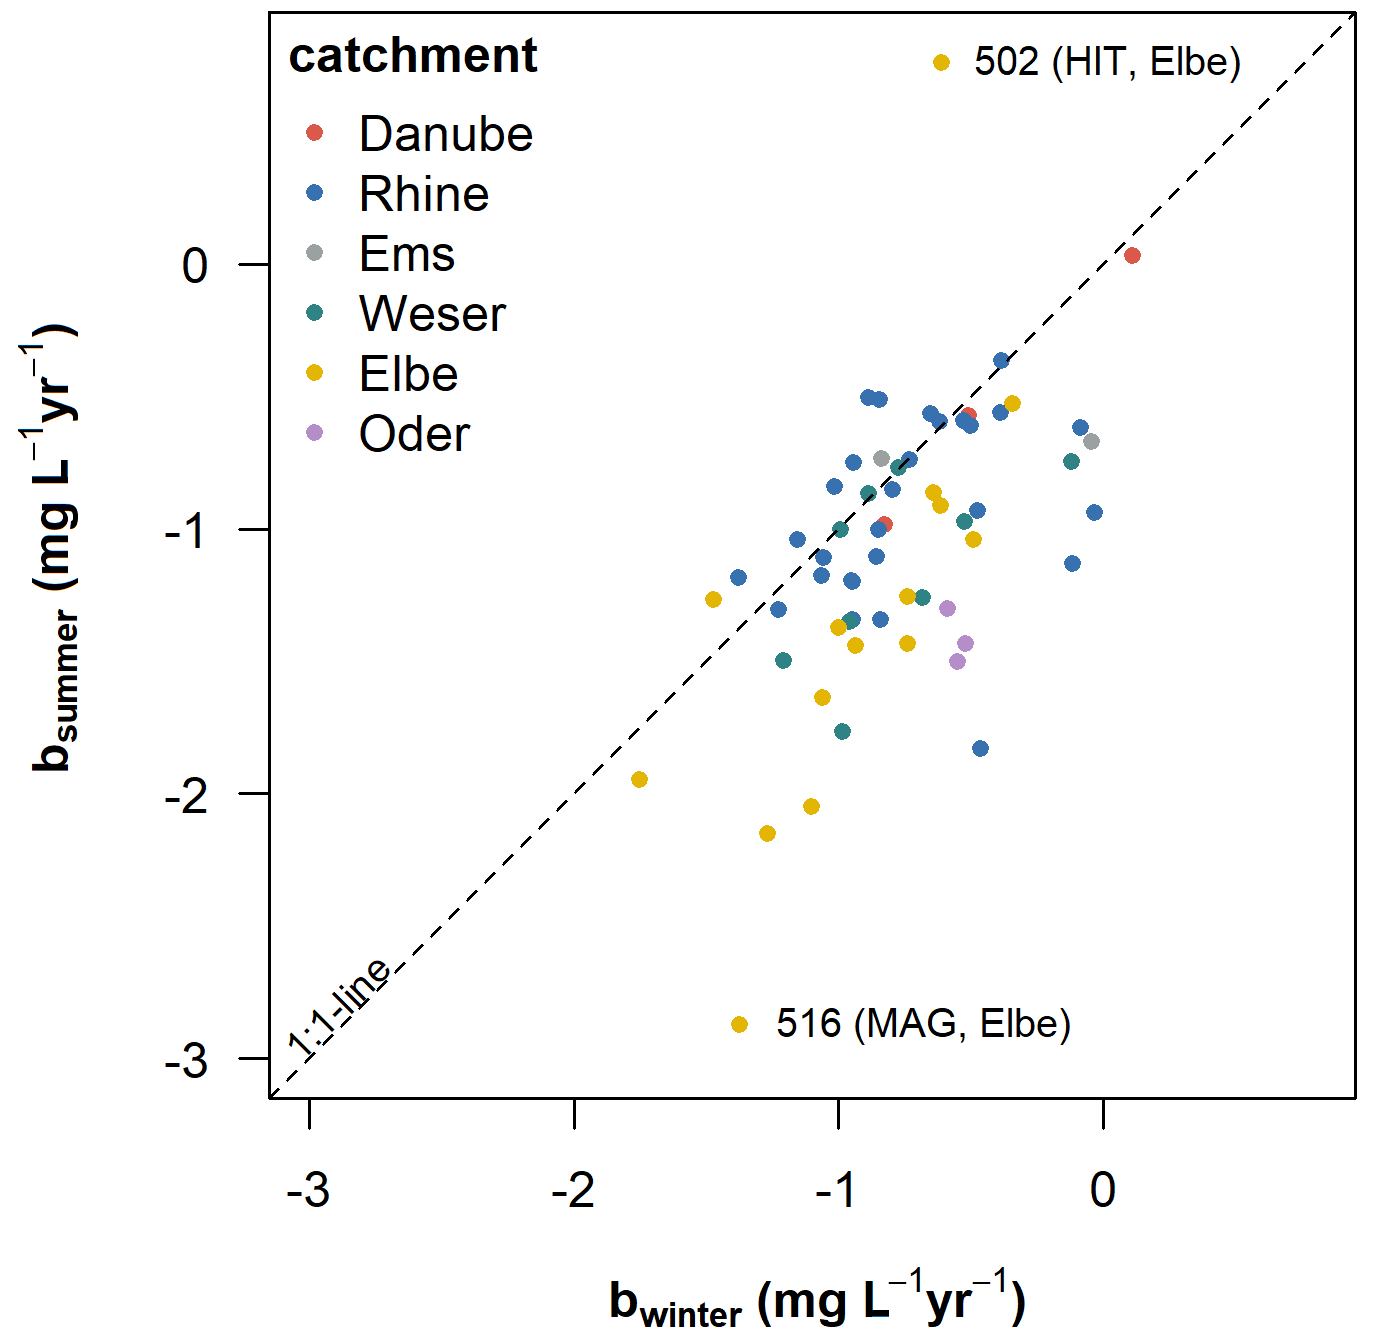
The comparison of the seasonal trends (Fig. 6) indicates that declines during the summer months are somewhat larger (i.e., more negative) for 30 stations, and only 10 stations show stronger decreases during the winter. This agrees with the slightly stronger average decrease in the summer months (−1.11 mg L−1 yr−1, or −4.7 % yr−1) than in the winter months (on average −0.94 mg L−1 yr−1 or −3.7 % yr−1).
SSC changes for all 62 monitoring stations covering their full monitoring period between 1970 and 2020 are shown in Fig. 7 using annual residual SSCs. The annual residuals are calculated based on the annual average SSCs and the average SSC of the entire monitoring period for each station (compare Table S1). The annual SSC residuals of all stations show a strong interannual variability before 1995 without any major trend (Fig. 7). After 1995, SSC residuals declined for almost all stations. Interestingly, the pattern of the variability also changes; before 1995, the interannual variability of many stations showed the same pattern as indicated by the variability of average residuals (thick red line in Fig. 7), while after 1995, the stations show a random pattern with arbitrary ups and downs with respect to the annual SSC residuals (smooth course of the average SSC). After 2010, the decline stopped at mg L−1 relative to the long-term average SSC of each station. The compilation of the residual SSCs suggests that the SSC decline between 1990 and 2010 is mainly characterized by a gradual decline, which was accentuated between 1995 and 2010 at most stations. Due to the strong variability of the annual SSC residuals, single stations might have a different trajectory than the average behavior (bold blue line in Fig. 7). However, the consistent behavior of the majority of stations indicates a major change between 1995 and 2010 in the environmental factors controlling the suspended sediment dynamics in the Germany waterways.
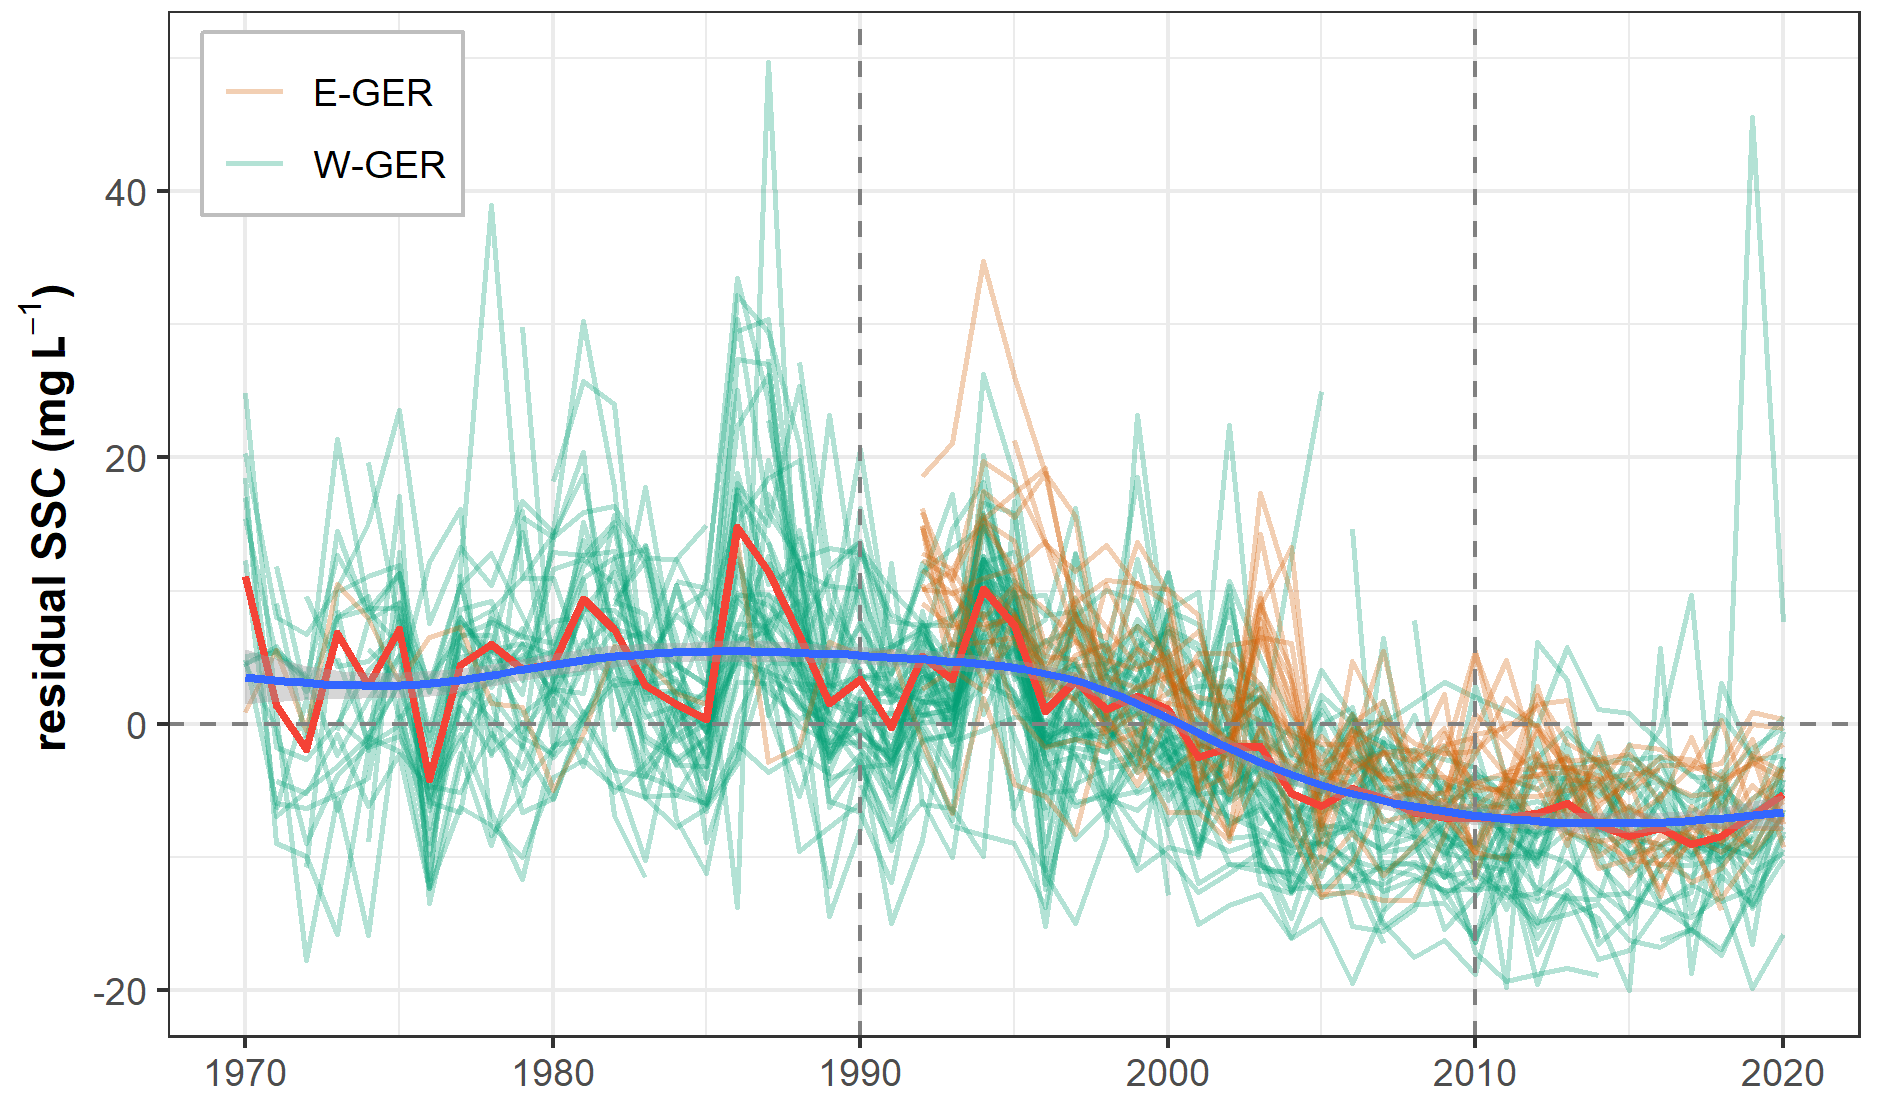
Figure 7Trends of residual SSC between 1970 and 2020. SSC residuals are calculated based on daily SSC data and the average SSC of all available SSCs covering the full monitoring length for each station. Light red lines indicate the annual average of SSC residuals for each station. The bold red line represents the average annual SSC residual of all stations. The blue line represents a smooth spline of the average annual SSC residuals.
3.2 Trends of rating parameters
We were able to calculate a significant annual sediment rating with more than 15 years per station for 59 stations. A total of 41 stations show a significant decline in the α coefficient with ranging between −1.08 and −0.28 mg l L−1 yr−1 (or −6.0 % yr−1 and −1 % yr−1). Stations with an insignificant change in α include the stations of Jochenstein (107), Viereth (231), Rheine (301), and Hitzacker (502), which show insignificant Sen's slopes. Interestingly, Straubing (102) and Weil (202) show insignificant Sen's slopes but significant changes in α. The mean and median value of for all stations is −0.71 and −0.72 mg L−1 yr−1 (−3.2 % yr−1), respectively, which is a little smaller than the average Sen's slope. The strongest declines are observed at the stations along the Rhine (Table S2), and none of the 59 stations showed a significant increase in α. Only 14 of 59 stations show a significant change in the rating exponent β; 9 stations show an increase in β (increasing reactivity) and 5 stations show a decrease in β (decreasing reactivity). Overall ranges between −0.072 and +0.078 yr−1 (Table S2). At some stations with a strongly increasing rating exponent the α coefficient strongly declines, indicating an inverse relationship between changes in α and β despite the normalization of the rating analysis.
3.3 SSL trends
Only one station – i.e., Marktbreit (231) at the Main River – of 63 stations shows a significant change in the mean annual discharge at the 5 % significance level based on the Mann–Kendall test; all other stations show strong interannual variability of mean discharge, but no general trend (not shown). In conjunction with the declining SSC at the monitoring stations studied, SSL is expected to strongly decrease between 1990 and 2010. A total of 48 of 63 stations show a significant negative trend of SSL with annual declines ranging between 0.1 and 94.9 kt yr−2, with an average of 14.7 kt yr−2. As suggested by Eq. (2) the magnitude of the SSL decline grows linearly with discharge (Fig. 8). For instance, the annual load at Maxau (207) declined on average by 28.5 kt yr−2 from around 1.3 to 0.8 Mt yr−1 between 1990 and 2010, and the decline in Emmerich (215) was twice as high (i.e., 66.3 kt yr−2) from 2.8 to 1.8 Mt yr−1 for the same time.
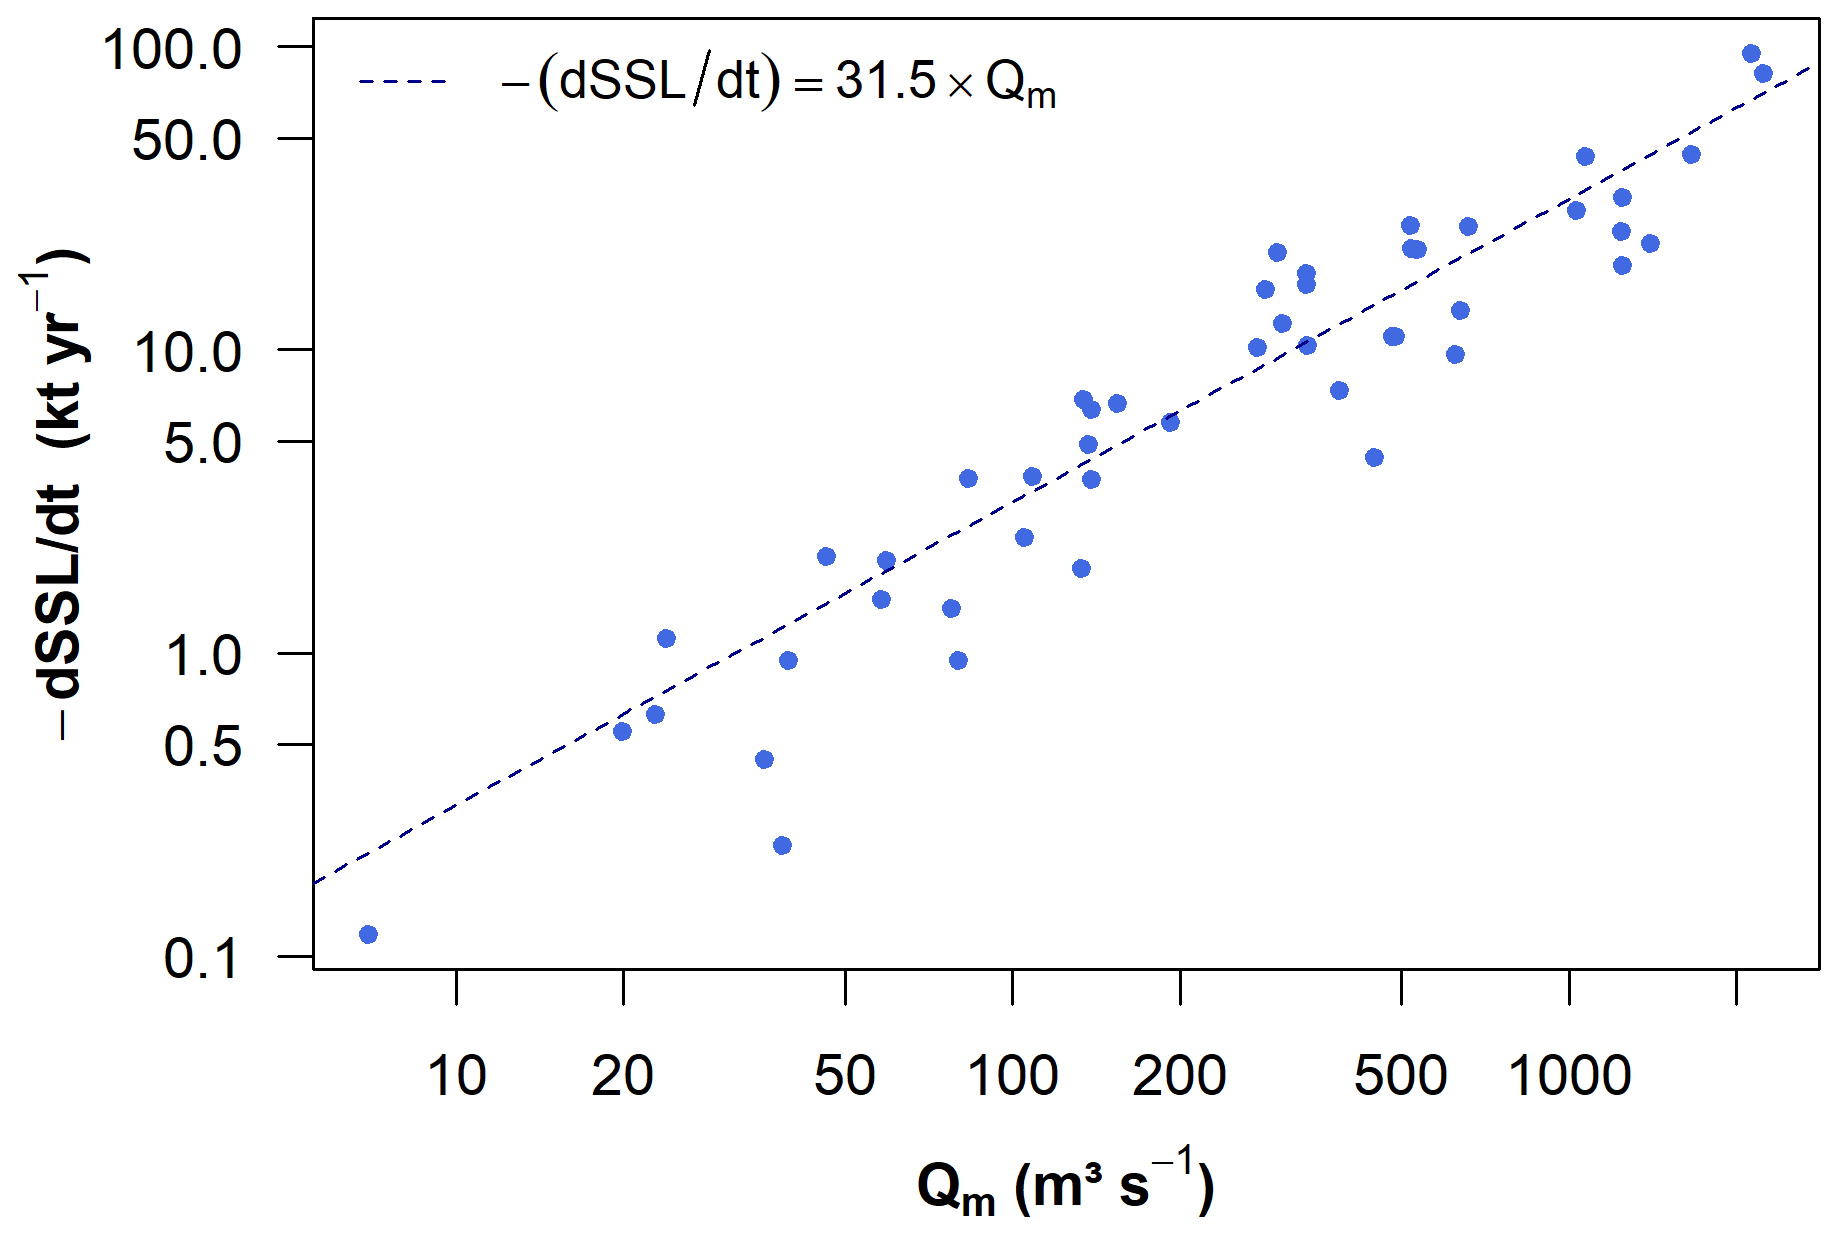
Figure 8SSL decline () as a function of discharge for all stations with a significant change in SSL between 1990 and 2010. Linear regression.
Based on Eq. (2), a mean decline in SSC between 1990 and 2010 of mg L−1 yr−1 was used to calculate an annual decline in SSL of ∼30 kt yr−2 per 1 m3 s−1 of discharge, which is in general accordance with regression of and Qm, resulting in a regression slope of 31.5 kt yr−1 per 1 m3 s−1 as shown by the blue dotted line in Fig. 7. The linearity of the relationship between and Qm indicates that the assumption of a linear decrease in SSC is valid and results in the simple relationship as derived in Eq. (2b).
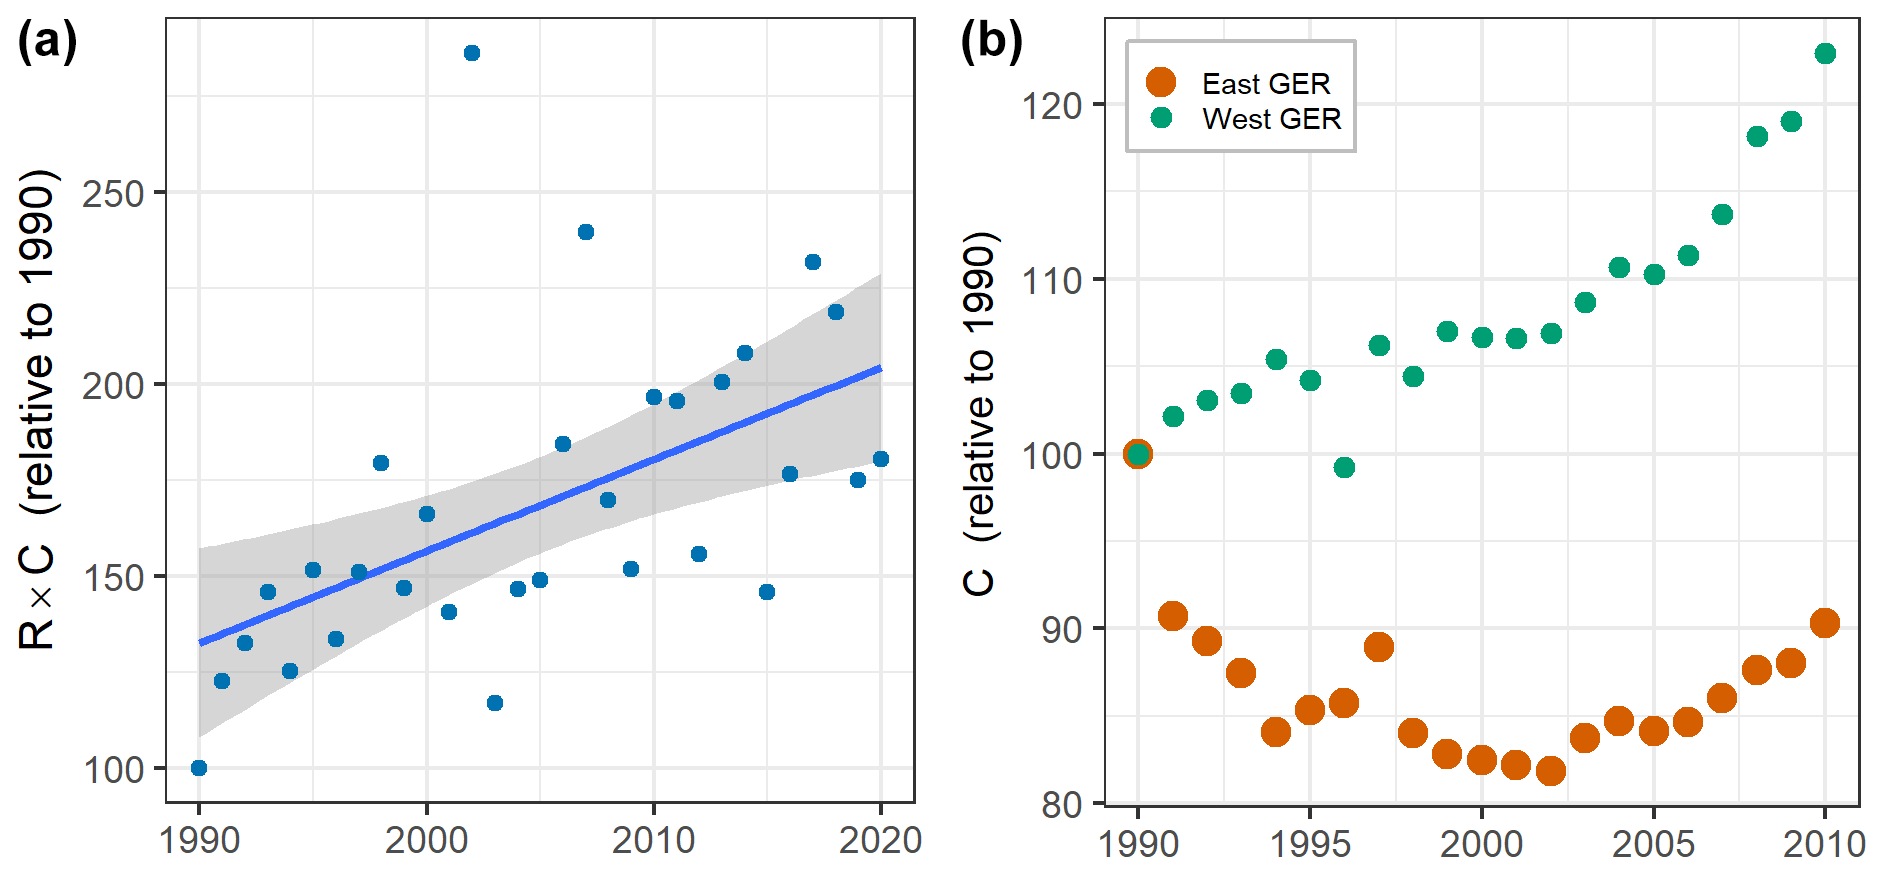
Figure 9Change in erosion as quantified by the Universal Soil Loss Equation relative to erosion in 1990. (a) Combined influence of rain erosivity (R factor) and land use (C factor). (b) Influence of land use and management in West and East Germany upon C factor.
3.4 Trends of erosion factors
Despite the declining trend of SSC at the majority of monitoring stations, soil erosion by rainfall derived from the combined change in the R and C factors of the USLE almost doubled in Germany between 1990 and 2020 (Fig. 9a). This increase is entirely caused by the increase in R, while C almost did not change at the national level because of the different changes in East and West Germany, which exhibit opposing trends (Fig. 9b). In East Germany, the C factor dropped by about 10 %, mainly due to the breakdown of potato production following the reunification, which mainly occurred from 1990 to 1991 (potato acreage about halved; data not shown) and caused a sudden drop in the C factor. Most other changes in East Germany were similar but weaker compared to those in West Germany and almost leveled out when combined. In contrast, land use change in West Germany increased the C factor by about 25 %. This was largely due to a 20 % loss of grassland, which mainly occurred between 1990 and 2000, while the increase between 2000 and 2010 was mainly caused by a 50 % increase in the acreage of silage maize due to incentives for biogas production (data not shown).
Due to the strong change in R, erosion has increased in both parts of Germany, but the increase in West Germany must have been much stronger than in East Germany due to a stronger increase in land use effects. From this, an increase in SSC over time could be expected that should be larger in West Germany than in East Germany. In contrast to this expectation, stations in East Germany show slightly larger SSC decreases on average (average bsens∼1 mg L−1 yr−1) than stations in West Germany (average bsens∼0.8 mg L−1 yr−1).
The presented trend analysis is based on 62 monitoring stations along large river channels, with an average monitoring interval of 19.9 years and almost 440 000 SSC samples in total. Overall, the monitoring stations are characterized by a low fraction of data gaps, with an average rate of only 4 % of missing data with data gaps longer than 2 d. Weekends and federal holidays ≤2 d add approximately 30 %. However, these data gaps are filled by linear interpolation as long as no major floods took place. Due to the large size of the rivers studied, their variability is small compared to much smaller tributary streams. In large rivers floods with increased SSCs and loads last several days, suggesting that daily sampling is sufficient to cover the importance of floods (Slabon and Hoffmann, 2023). In contrast to the calculation of annual loads, which require continuous sampling, irregularities in sampling frequency less strongly affect the average annual SSC, which is the focus of this study. Thus, we are confident that the data gaps are not substantially affecting our trend analysis. Furthermore, we can exclude the possibility that changes in monitoring techniques are affecting our results, since the measuring and monitoring approach has not been changed since its introduction in the 1960s. Furthermore, for the analysis of the time span between 1990 and 2010 we only used sampling stations without a change in sampling location.
As mentioned above, sampling is limited to surface water samples, suggesting an underestimation of the cross-sectional average SSC. The sampling design was not changed over time and thus could not affect the temporal trends, while it may lead to an underestimation of the cross-sectional average SSC and in turn of SSL (as supported from unpublished results from the suspended sediment monitoring of the cross-sectional variability).
In summary, we are confident that the estimated trends are real and not biased due to the techniques and approaches of the suspended sediment monitoring in the German waterways. Furthermore, the similarity of results derived from the Man–Kendall test in combination with the Sen's slope test and the trends derived from the least-square linear regression suggest that the calculated trends are robust.
4.1 Declining trends of SSC and SSL in German river systems
Despite the strong year-to-year variability of the annual average SSC at each station, our trend analysis shows a widespread declining trend of SSC at 58 out of 62 monitoring stations. At some stations annual average SSC declined by 50 % between 1990 and 2010. No station shows increasing trends during the same time. This consistent decrease in SSC is surprising as the stations cover a broad range of river catchments with different sizes (ranging between about 2000 and 160 000 km2), as well as variable topographic and geological conditions. Topographic conditions range from mountain topography of the European Alps, which cover parts of the Rhine and Danube catchments, to the lowland topography of northern Germany, mainly covering the Ems and northern parts of the Weser and Elbe catchments. Climate conditions range from maritime in West Germany to more continental climates in the east. Furthermore, land use history in West and East Germany followed different trajectories before and shortly after the reunification in 1990. Despite these differences in controlling factors, SSC declines consistently without any larger spatial pattern of the observed trends.
The station at Hitzacker is among the few monitoring stations that do not show a significant decline at the annual scale. Here declining SSC in the winter months and increasing SSC in the summer months counterbalance each other at the annual scale (Table S2). However, a trend analysis by Hillebrand et al. (2018) using the same data, but a longer timescale from 1964 to 2014, indicated a significantly declining trend. This monitoring station is located at the downstream end of the Elbe River and shows strong plankton growth during the summer months. Since SSC represents the total suspended matter here (including mineral and organic particles), increasing SSC during the summer months may be mainly controlled by the autotrophic production within the river channel, which represents 28 % of the total SSC on average during the summer months (Hillebrand et al., 2018), while decreasing winter SSC likely results from changing supply conditions. While many monitoring stations show evidence of increased autotrophic production during the summer months this effect is most pronounced at Hitzacker at the lower Elbe River (Hardenbicker et al., 2014; Hoffmann et al., 2020). The higher frequency of low-flow conditions during dry and warm summer months in combination with reduced flow velocities in the impounded sections of the waterways increased the potential for strong algal blooms in these rivers as an effect of future climate changes and will likely affect future SSC trends.
Similar to the station at Hitzacker, the negative trend at Straubing (102, Danube River) becomes significant (p<0.01 with a Sen's slope of −0.3) if the full monitoring period between 1982 and 2019 of this station is considered, indicating a consistent declining trend for the Danube River upstream of its confluence with the Inn River. The station Jochenstein (107), which is located downstream of that confluence, shows no significant change at any time interval. Suspended sediment at Jochenstein is strongly influenced by the high SSCs of the Inn River, which drains a large part of the Austrian Alps with high sediment contributions by glacial erosion and gravitational mass movements. Similarly, the station Weil, located at the transition between the high and upper Rhine, is also strongly characterized by a glacial discharge regime with no significant changes in SSC. This further supports the notion that rivers with strong alpine contributions are less affected or even unaffected by declining SSC levels.
A positive relationship of SSC and discharge at almost all monitoring stations (Hoffmann et al., 2020) suggests that declining SSC levels might be related to decreasing discharges. The trend of the rating parameters indicates that changes are mainly related to the rating coefficient a, which shows a significant decrease at 41 out of 59 stations. Changes in the rating coefficient a are related to parallel shifts of the rating curve (Warrick, 2015) and therefore represent the changing SSC at all discharge levels. Significant changes in the rating exponent b, which represents SSC shifts between high- and low-magnitude discharges, are much less pronounced (only 14 of 59 stations show significant changes) and more or less equally distributed around zero.
In addition to the changes in the sediment rating relationship, mean annual discharges did not significantly change between 1990 and 2010. Therefore, we argue that changes in SSC are mainly driven by decreased sediment supply to the large river channels or decreased connectivity (e.g., sedimentation within the river channels) within the river network, while they are not related to changing discharge conditions. Furthermore, we argue that the strong decline in the suspended load, which is dominated by the fine fraction (i.e., silts and clays), has no major impact on the channel morphology, which is dominantly formed by sand and gravel. Therefore, decreases in suspended loads had no major impact on sediment management in the German waterways, which is mainly related to the nourishment and dredging of sand and gravel to secure navigability in the waterways (Frings et al., 2019).
In contrast to the general and widespread decreasing trend in the German waterways, trends of suspended sediment transport in neighboring river systems outside Germany are more variable. Poulier et al. (2019) studied the annual flow-averaged suspended matter concentration (fw-SSC) at six stations in the Rhône catchment in France between 2000 and 2016. The Rhône catchment is characterized by alpine topography in the north and steep torrential characteristics with a Mediterranean climate in the south. Since the end of the Second World War, river management has strongly altered the flow characteristics and hydro-morphology of the rivers. However, none of the stations show a significant change in the SSC between 2000 and 2016 due to the strong interannual variability and the rather short time period. Mean annual SSC in the Warta River (Poland) increased between 1961 and 1980 by 2.6 mg L−1 yr−1 (Skolasińska and Nowak, 2018). The increase is mainly attributed to river channel management (i.e., deepening and cleaning of channel bed), the opening of a large lignite mine, and the increased growth of phytoplankton during the summer months in response to increased nutrient levels and rising summer temperatures (similar to our results from the lower Elbe River).
The stations along the upper Danube River, upstream of the German–Austrian border, are characterized by declining trends (station 105 Vilshofen and 106 Kachlet) or insignificant changes (station 102 Straubing and 107 Jochenstein), as discussed above. Habersack et al. (2016) present marginal declines in suspended sediment loads along the middle Danube River for the period between 1985 and 2000 compared to loads before 1960. In contrast to small decreases in the suspended load upstream of the Iron Gate I and II hydropower complex in Romania downstream of these reservoirs, which was constructed in 1972 and 1984, suspended sediment loads of the lower Danube River massively decreased, with suspended sediment supply to the Black Sea decreasing from more than 1 Mt yr−1 around 1960 to 0.4 Mt yr−1 from 1985 to 2000 (Habersack et al., 2016). Therefore, the strong declines in SSL in the lower Danube are related to the control of the two dams in the main river channel.
The trend of decreasing SSC in Germany is paralleled by the decline in nutrient (C, N, and P) and contaminant levels in the river channels in Germany (https://www.umweltbundesamt.de/en/topics/water/rivers/nutrients-in-watercourses, last access: 11 April 2023). For instance, total organic carbon (TOC) declined from 5–6 mg L−1 in 1990 to ∼3 mg L−1 in 2010 in the Rhine River at Koblenz (FGG Elbe, 2013). This suggests that declining SSC levels in the German waterways may be related to decreased nutrient supplies, either because both trends have a common origin or because one trend is the reason for the other. Due to the consideration of total suspended matter, which includes mineral and organic fractions, differences between changes in summer and winter SSC can be partially explained by the effect of decreasing TOC. TOC in the German waterways originates from aquatic biomass-derived organic matter and mineral-associated organic matter originating from eroded hillslopes (Hoffmann et al., 2020). Biomass-derived organic matter dominates during summer months, which are characterized by low-flow conditions with long residence times of biomass in the river system, high availability of light, and warm temperatures, promoting algal growth and causing higher TOC contents during the summer. Thus, declining TOC between 1990 and 2010 is mainly observed during the summer months, as in the case of the station at Hitzacker, which is strongly influenced by biomass-derived organic matter (Hardenbicker et al., 2014; Hillebrand et al., 2018).
4.2 Long-term context of contemporary SSC and SSL changes
In this paper we focus on the time frame from 1990 to 2010, as most monitoring stations were active during that time and calculated trends are therefore directly comparable to each other. However, looking at longer-term changes is helpful to evaluate the trends and to derive primary controls of these trends.
To evaluate the long-term context of the contemporary decline in the SSC and SSL beyond the start of suspended sediment monitoring in Germany, we use reconstructed suspended sediment supply rates to the Rhine delta below the Dutch–German border (Erkens, 2009). The suspended sediment load to the Rhine delta for the last 9000 years stratified into 500-year time slices was reconstructed by Erkens (2009) using a sediment budget approach based on a detailed stratigraphical analysis of alluvial deposits of the Rhine–Meuse delta. Based on various assumptions of the trapping efficiency of the Rhine–Meuse delta, the author relates the deposition of silt and clay to the sediment supply from the upstream contributing catchment. Increased early Holocene suspended sediment loads ∼2.3 Mt yr−1 are associated with the delayed response of the Rhine to environmental changes from postglacial to Holocene conditions (Fig. 10). This transition was completed around 6000 BP, when suspended sediment loads achieved a minimum of around 1 Mt yr−1 under a well-established forest cover in the Rhine catchment during the mid-Holocene. Suspended sediment loads at the delta apex coincide with low geomorphic activity during that time as indicated by a low frequency of dated alluvial deposits in central Europe (Hoffmann et al., 2009). The increase in the reconstructed suspended load in the late Holocene is related to the intensified deforestation and agricultural land use starting during the Bronze Age and continuing during the Roman and Medieval periods. Again, this increase is evidenced by enhanced overbank deposition in central European floodplains starting in the Bronze age and culminating during the Medieval period (Hoffmann et al., 2009). In summary, low mid-Holocene sediment yields of around 1 Mt yr−1 can be considered the natural baseline during the Holocene before the start of human impact (Fig. 10).
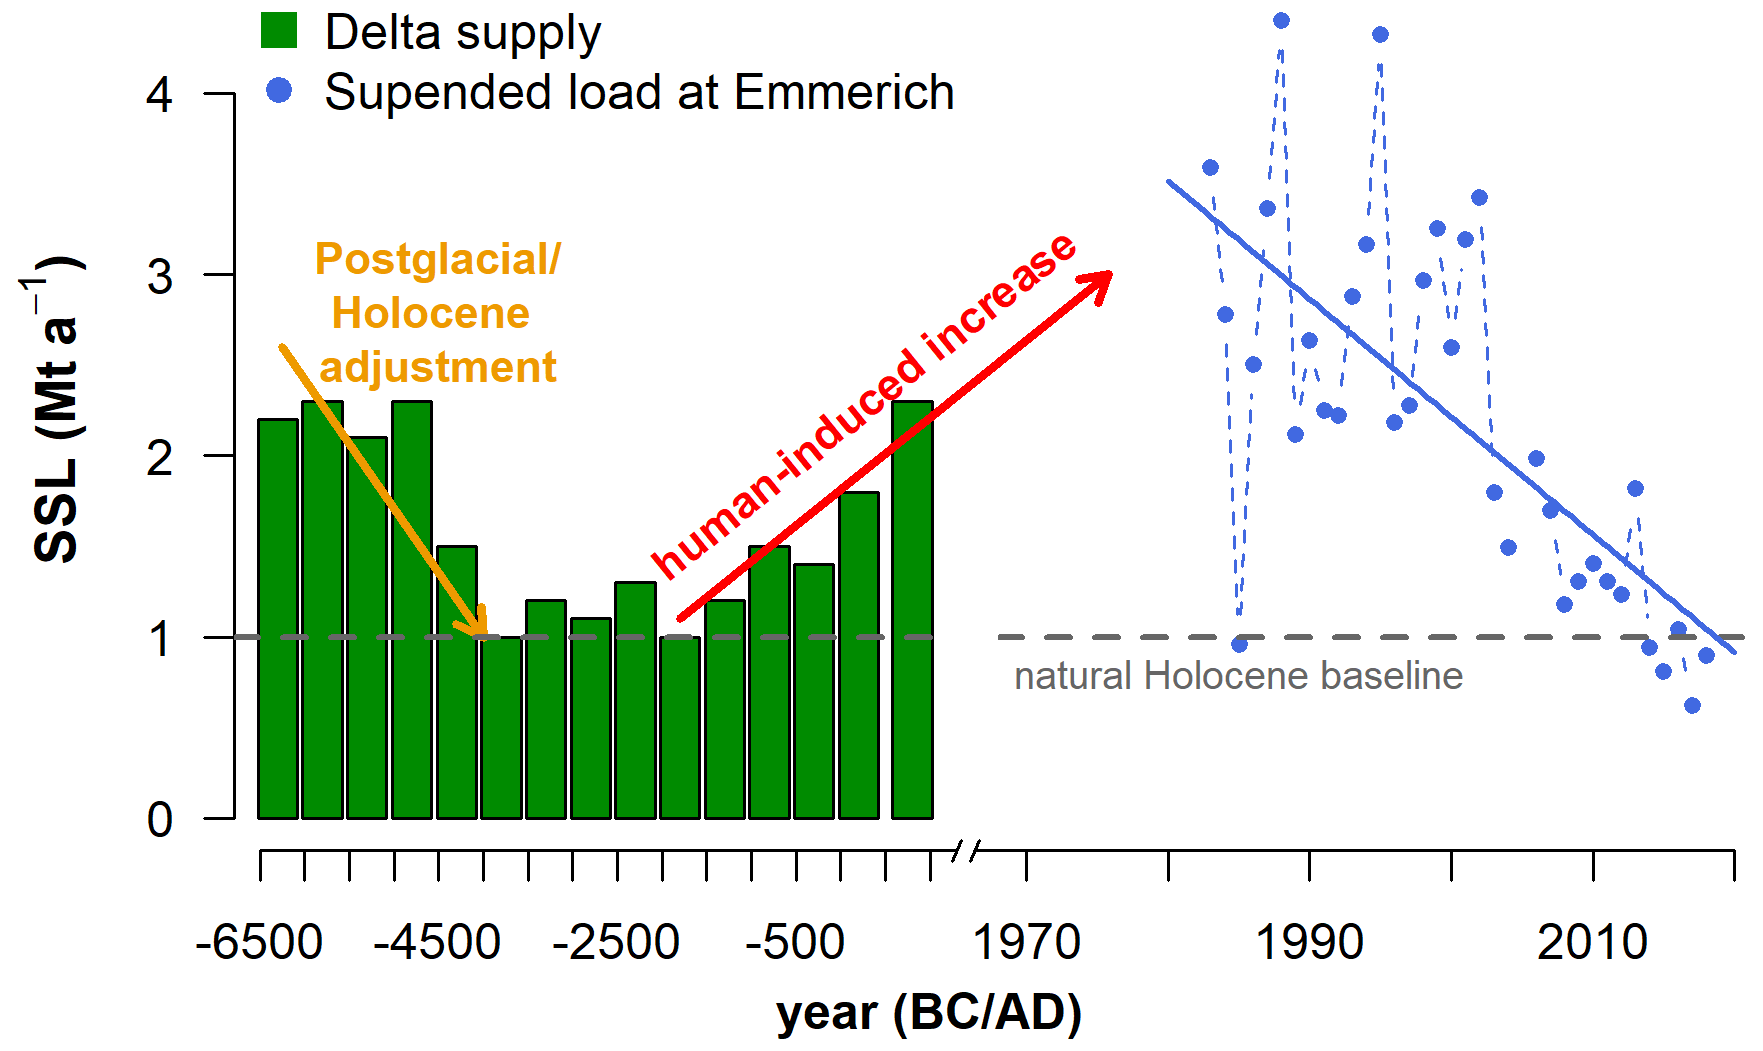
Figure 10Reconstructed and monitored suspended sediment loads (SSLs) of the lower Rhine at the Dutch–German border. Reconstructed loads (green bars) are derived from a long-term sediment budget analysis of the Rhine–Meuse delta in the Netherlands (Erkens, 2009). Blue points represent the suspended annual loads at the monitoring station in Emmerich (representing the most downstream station of the German suspended monitoring network).
SSLs at the station in Emmerich (215) in the 1980s and early 1990s are of the same order but slightly larger than reconstructed loads during the late Holocene. Due to the temporal gap between the reconstruction and the start of the monitoring the timing and magnitude of the maximum SSL in the Rhine River in response to the increased human-induced impact are unknown. However, measured annual loads of the Rhine River at Emmerich (blue dots in Fig. 10) indicate that SSL declined from 3–4 Mt yr−1 in the 1980s to 1 Mt yr−1 in 2010 and is therefore approaching the minimum during mid-Holocene conditions without a strong human impact. Assuming an increase of ∼2 Mt yr−1 since the mid-Holocene (approx. 3000 years) and a similar decrease between 1980 and 2010 (30 years) indicates a decrease 100 times faster compared to the long-term increase. The similarity of suspended sediment loads during the mid-Holocene and the contemporary load at Emmerich can be pure coincidence and does not imply that the Rhine River and its catchment are in a natural or good ecological state. Interestingly, in fact, Frings et al. (2019) point out that the largest sediment budget components of the river Rhine are induced by sediment management measures along the Rhine River, supporting the notion that the functioning of the Rhine River is dominated by human controls during the Anthropocene. However, our results imply that the suspended sediment loads are approaching the Holocene minimum at an overwhelming pace. Furthermore, it raises the question of what driving forces are causing the rapid decline in SSL and SSC in the large German river systems.
4.3 Causes of decreasing SSC and SSL
Soil erosion is a major source of suspended sediment to river systems in agricultural landscapes. Therefore, it has been shown that suspended sediment loads are adjusting to changing supply conditions in many parts of the world during the Anthropocene (Syvitski et al., 2022). However, numerous studies highlighted the buffering and delaying effects of sediment transport through the channel network (Hoffmann, 2015; Richards, 2002), which might even lead to constant sediment yields despite rapid increases and decreases in hillslope erosion, as evidenced for Coon Creek Basin, Wisconsin (Trimble, 1999).
We demonstrate that soil erosion in Germany must have increased between 1990 and 2010 as indicated by the temporally variable R×C factor of the USLE (Fig. 9). This increase mainly results from increasing rainfall erosivity and the intensified agricultural land use, especially in West Germany. There might be some effects due to potential changes in soil conservation measures between 1990 and 2010, but data for Germany are only available starting in 2009–2010 (DESTATIS, 2011). If soil conservation changed substantially, one would expect larger effects in East Germany where 53.7 % of arable land is under soil conservation compared to 29.7 % in West Germany. However, most soil conservation measures include reduced no-inversion tillage, while only about 1 % was under no-till. Therefore, we argue that the effects of soil conservation are small and (if at all) only slightly modify the increases in soil erosion (Auerswald et al., 2018).
The substantial intensification of soil erosion is in stark contrast to the declining SSC at most monitoring stations in Germany. While higher erosion likely increases the sediment supply to river systems, decreasing SSC in large rivers suggests lower sediment supply from headwater basins and tributary rivers. The decoupling of the SSC trends in the large river systems and increased erosivity might be partially explained by the change in the delivery process from large-scale advective rainfall and snowmelt happening in many catchments simultaneously to very localized impacts of intense convective summer extremes (Fiener and Auerswald, 2009; Fischer et al., 2018) that result in massive fluxes in small- to medium-scale river systems, but hardly affect rivers with contributing catchment areas that are more than 100 times larger than large convective summer cells. This change is evident from the residual SSCs in Fig. 7. Before 1995 residual SSCs synchronously increased and decreased at many stations in certain years due to large-scale processes. In contrast, after 1995 interannual variability of residual SSCs was still present but shows more random patterns and a much smoother course of the average SSC residuals (i.e., the red line in Fig. 7), as expected by more localized delivery processes. This process may explain decreased sediment connectivity with respect to large river systems; however, it does not explain the stronger decreases in SSC during the summer months, as observed in Fig. 6. Therefore, we argue that additional processes must be in action that decouple the increasingly eroding headwaters from the large river systems that are characterized by decreasing SSC levels.
Reservoirs strongly decrease the longitudinal connectivity of suspended matter in river channels and are the primary cause of the strong global decline in sediment supply to the world's oceans (Syvitski et al., 2022). The upper Rhine between Basel (CH) and Iffezheim (GER) is controlled by 10 barrages. Furthermore, all tributary waterways are managed by sequences of barrages that halt bed-load transport and retain substantial amounts of suspended sediment. The barrages along the upper Rhine retain suspended matter of the order of 0.3 Mt yr−1 between the gauging station at Weil (202) and Plittersdorf (203) (Frings et al., 2019; Hillebrand and Frings, 2017), representing 20 % of the 1.45 Mt yr−1 upstream inflow at Weil. Therefore, it is frequently argued (van der Perk et al., 2019) that suspended sediment load in the lower Rhine is reduced in response to the construction of barrages and reservoirs in the catchment. However, barrages along the German waterways were mainly constructed between 1930 and 1940 and between 1955 and 1970 (Fig. 11). Furthermore, the construction of large reservoirs for hydropower generation along the main waterways and for storage of drinking water in the upstream headwaters was almost completed by 1990, and only a small number of upstream reservoirs were built after 1990 in single regions. In many cases, river systems react with immediate, stepwise declining sediment transport rates in response to dam closures (Habersack et al., 2016; Kondolf et al., 2018; Sun et al., 2016; Walling and Fang, 2003), suggesting that post-damming loads remain constant and low after dam construction.
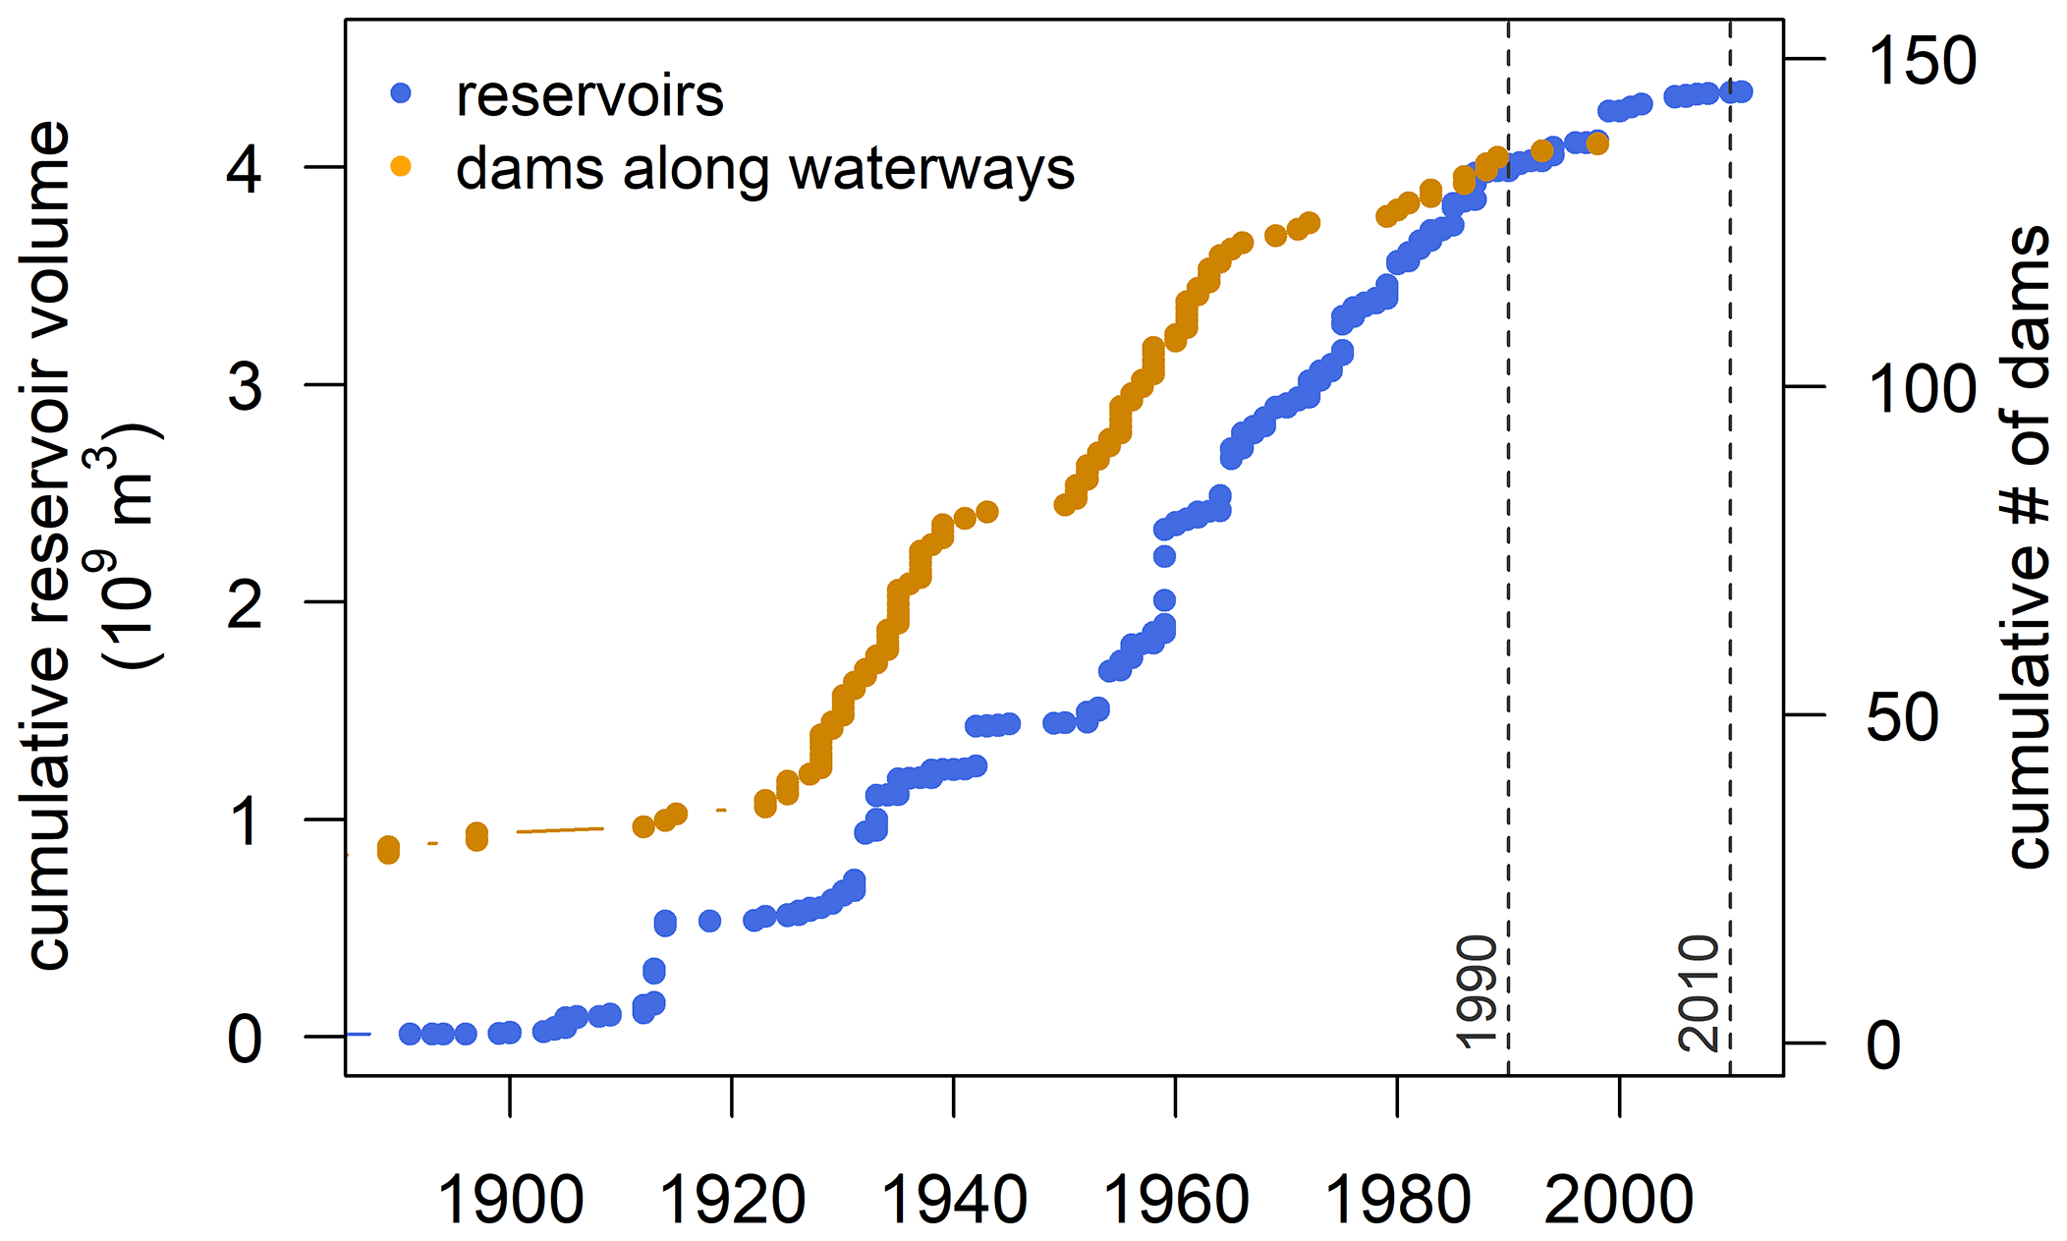
Figure 11Cumulative volume of reservoirs in Germany and number of dams (barrages) along the German waterways since the start of construction in the 1880s. The cumulative volume of reservoirs includes only large reservoirs with volumes > 0.04 × 10⁶ m3 and was taken from Wikipedia (“Liste der Talsperren in Deutschland”, https://de.wikipedia.org/wiki/Liste_von_Talsperren_in_Deutschland, last access: January 2021).
SSC and SSL changes indicate that there are no abrupt declines in the suspended sediments in the German river systems, but they continuously declined between 1990 and 2010, indicating that the supply to the river systems must have decreased or sediment retention must have increased more or less continuously each year. The decline in the annual SSLs provides a benchmark for the evaluation of the effects of dams in river systems. For instance, along the Rhine River upstream of Emmerich (215), SSL declined by 66.3 kt each year between 1990 and 2010. Continued declines in response to dams, however, require the amount of sediment deposited in the reservoir to increase each year after dam closure. However, as reservoirs fill up with sediment, trapping efficiencies decrease and the amount of deposited in the reservoir likely decreases (Brune, 1953; Kondolf et al., 2014). Therefore, we argue that the construction of barrages and reservoirs is unlikely to explain the widespread and continued decline in SSL in the larger river channels in Germany. This notion is further supported by the constant SSC level between 1970 and 1990 (Fig. 7) and the “delayed” decline, which mainly started around 1995 (see Fig. 7), 2 decades after the construction of the last dams in the German waterways.
Little is known about the evolution of soil erosion and sediment supply to river systems in Germany in the last century including the time between 1990 and 2010. Figure 9 suggests that there was a maximum of sediment supply to the Rhine system sometime between 1750 and 1970 CE. Furthermore, the magnitude of that maximum is not known. It is very likely that the construction of barrages in the river systems and reservoirs in the headwater river systems resulted in an initial decline in the middle of the last century (Fig. 11). However, the decline in the SSC after 1990 must be related to decreasing sediment supply from tributary river systems.
At the global scale, the discussion on disconnected sediment fluxes focuses mainly on large reservoirs as dams (i.e., dams with a height exceeding 15 m) that are included in global inventories, ignoring the effects of many small barriers and dams that disconnect sediment transport in medium and small river systems. The European database of dams and reservoirs, which was compiled by Belletti et al. (2020), indicates that their total number exceed 18 000 in Germany. While the construction of large reservoirs and dams ceased by the 1980s, many small-scale rainwater retention basins were built between 1990 and 2010 to reduce the flooding potential of small- to medium-sized creeks and rivers. The trapping efficiency of such a single small-scale feature is certainly low, but given the large number of such features, their overall cumulative effect might be significant for the reduction of suspended sediment in large rivers. Furthermore, artificial (urban) surfaces strongly increased between 1990 and 2010, and wastewater treatment plants that collect surface runoff from these surfaces became more effective during the same time. Thus, an increasing fraction of sediment is trapped (i) in headwater river systems, which are characterized by strong siltation (Geist and Auerswald, 2019), (ii) stormwater reservoirs, (iii) wastewater treatment plants, and (iv) a large number of small-scale sedimentary sinks in response to urban construction (e.g., sediment disconnection through road construction).
Overall, there are several potential reasons for the disconnection between increasing hillslope erosion and decreasing sediment supply to the waterways, which are associated with changing land use and infrastructure within the tributary catchments and/or climate-driven changes in rainfall characteristics.
Based on daily monitoring of SSC along large German river channels, we found significant declines in mean annual average SSC at 56 of 62 monitoring stations between 1990 and 2010. On average SSC declines by −0.92 mg L−1 yr−1. At some stations decreases during the 20 years represent up to 50 % of the long-term average SSC. Significant decreases in SSC are associated with declining SSLs.
The decline contrasts with the strong increase in soil erosion resulting from increases in rain erosivity as a result of climate change and partly erosion-inducing changes in land use and management. Furthermore, different land-use-induced trajectories of erosion in eastern and western Germany did not translate into different developments of changing SSC in the waterways. The coherent and strong decline in suspended sediment concentrations and loads is difficult to explain due to multiple influences affecting the flow path between erosive hillslopes and sediment transport in large river channels. At this point we can only speculate regarding potential reasons for a decline in sediment supply to larger rivers. We argue that changes in sediment connectivity in micro-scale to mesoscale catchments, which result from a combination of changes in rainfall characteristics (reduced spatial extent of large-scale advective rainfall events and shifts in snow cover and hence snowmelt events) and an increasing number of retention basins and infrastructure-driven barriers, are the major reasons for declining SSC in the river channels studied. In contrast to the unclear situation in the catchments, there were few changes in the construction of dams and reservoirs along the large river channels during the observation period 1990–2010. Therefore, management changes along the large rivers seemed to be less important for the change in SSC. However, it remains questionable if increasing rainfall extremes during the last years, which are predicted to continue in the next decades, will shift the trends of SSC and result in increasing SSC levels in large German river channels after 2 decades of SSC decline.
In the context of long-term changes in suspended sediment transport, the contemporary suspended sediment loads of the Rhine River at the German–Dutch border are approaching 1.0 Mt yr−1, which is similar to the natural conditions of the Rhine system in the mid-Holocene when the suspended sediment load was adjusted to the Holocene climate and before the onset of increased loads due to human-induced land use changes in the Rhine catchment. However, it must be stressed that the similarity of modern suspended sediment loads of the Rhine River and the pristine mid-Holocene load is a simple coincidence as sediment dynamics in German river systems are being strongly conditioned by human actions within the contributing catchments and along the river channels during the Anthropocene.
R scripts used in this study for data analysis are accessible upon request by contacting Thomas Hoffmann (thomas.hoffmann@bafg.de).
The data used in this study are accessible upon request by contacting Thomas Hoffmann (thomas.hoffmann@bafg.de).
The supplement related to this article is available online at: https://doi.org/10.5194/esurf-11-287-2023-supplement.
TOH performed the trend analysis of all stations and prepared the paper with the cooperation of all co-authors. PF and KA provided land cover data, calculated R and C factors of the USLE, and provided feedback on data analysis and discussion of results. YB provided SSC data and analyzed the spatial distribution of the trends. JHB contributed to the trend analysis and supported discussion on the results. SV provided support regarding SSC data analysis and discussion on river management of German waterways.
The contact author has declared that none of the authors has any competing interests.
Publisher's note: Copernicus Publications remains neutral with regard to jurisdictional claims in published maps and institutional affiliations.
The data used in this paper were provided by the suspended sediment monitoring network of the German waterways that was established in the 1960s by the Federal Waterways and Shipping Administration (Wasserstraßen- und Schifffahrtsverwaltung des Bundes, WSV). We acknowledge the WSV for maintaining the monitoring network and for suspended sediment sampling. Furthermore, we thank Oliver Francis and an anonymous reviewer for their helpful comments and suggestions that greatly improved the quality of this paper.
This paper was edited by Valier Galy and reviewed by Oliver Francis and one anonymous referee.
Annandale, G. W., Randle, T. J., Langendoen, E. J., Hotchkiss, R. H., and US National Reservoir Sedimentation and Sustainability Team: Reservoir Sedimentation Management: a Sustainable Developement Challange, Hydrolink, 3/2018, 72–75, 2018.
Asselmann, N.: Fitting and interpretation of sediment rating curves, J. Hydrol., 234, 228–248, 2000.
Auerswald, K., Fischer, F. K., Kistler, M., Treisch, M., Maier, H., and Brandhuber, R.: Behavior of farmers in regard to erosion by water as reflected by their farming practices, Sci. Total Environ., 613–614, 1–9, 2018.
Auerswald, K., Fischer, F. K., Winterrath, T., and Brandhuber, R.: Rain erosivity map for Germany derived from contiguous radar rain data, Hydrol. Earth Syst. Sci., 23, 1819–1832, https://doi.org/10.5194/hess-23-1819-2019, 2019.
Auerswald, K., Ebertseder, F., Levin, K., Yuan, Y., Prasuhn, V., Plambeck, N. O., Menzel, A., and Kainz, M.: Summable C factors for contemporary soil use, Soil Till. Res., 213, 105155, https://doi.org/10.1016/j.still.2021.105155, 2021.
BAW and BfG: Sedimentdurchgängigkeit der Bundeswasserstraßen im Binnenbereich. Metastudie, Bundesanstalt für Wasserbau (BAW) und Bundesanstalt für Gewässerkunde (BfG), https://doi.org/10.5675/BfG-1893, 2016.
Belletti, B., Garcia de Leaniz, C., Jones, J., Bizzi, S., Borger, L., Segura, G., Castelletti, A., van de Bund, W., Aarestrup, K., Barry, J., Belka, K., Berkhuysen, A., Birnie-Gauvin, K., Bussettini, M., Carolli, M., Consuegra, S., Dopico, E., Feierfeil, T., Fernandez, S., Fernandez Garrido, P., Garcia-Vazquez, E., Garrido, S., Giannico, G., Gough, P., Jepsen, N., Jones, P. E., Kemp, P., Kerr, J., King, J., Lapinska, M., Lazaro, G., Lucas, M. C., Marcello, L., Martin, P., McGinnity, P., O'Hanley, J., Olivo Del Amo, R., Parasiewicz, P., Pusch, M., Rincon, G., Rodriguez, C., Royte, J., Schneider, C. T., Tummers, J. S., Vallesi, S., Vowles, A., Verspoor, E., Wanningen, H., Wantzen, K. M., Wildman, L., and Zalewski, M.: More than one million barriers fragment Europe's rivers, Nature, 588, 436–441, 2020.
BMLE: Entwicklung der Betriebsstruktur landwirtschaftlicher Betriebe ab 5 ha LF in Deutschland, Bundesministerium für Ernährung und Landwirtschaft, https://www.bmel-statistik.de/landwirtschaft/landwirtschaftliche-betriebe (last access: 1 April 2023), 2021.
Brune, G. M.: Trap efficiency of reservoirs, EOS Trans. Am. Geophys. Union, 34, 407–418, 1953.
DESTATIS: Land- und Forstwirtschaft, Fischerei – Bodenbearbeitung, Bewässerung, Landschaftselemente Erhebung über landwirtschaftliche Produktionsmethoden (ELPM) 2010, Fachserie 3, Heft 5, Statistisches Bundesamt, Wiesbaden, https://www.destatis.de/DE/Themen/Branchen-Unternehmen/Landwirtschaft-Forstwirtschaft-Fischerei/Produktionsmethoden/Publikationen/Downloads-Produktionsmethoden/bodenbearbeitung-bewaesserung-2032805109004.pdf (last access: 13 April 2023), 2011.
DESTATIS: Anbaufläche (Feldfrüchte und Grünland): Deutschland, Jahre, Fruchtarten, Wiesbaden, Germany, Statistisches Bundesamt, https://www-genesis.destatis.de/genesis//online?operation=table&code=41241-0001&bypass=true&levelindex=1&levelid=1626847204889#abreadcrumb (last access: 6 April 2023), 2021a.
DESTATIS: Land- und Forstwirtschaft, Fischerei – Bodenfläche nach Art der tatsächlichen Nutzung 2020, Fachserie 3, Heft 5.1, Statistisches Bundesamt, Wiesbaden, https://www.destatis.de/DE/Themen/Branchen-Unternehmen/Landwirtschaft-Forstwirtschaft-Fischerei/Flaechennutzung/Publikationen/Downloads-Flaechennutzung/bodenflaechennutzung-2030510207004.pdf (last access: 13 April 2023), 2021b.
Doomen, A. M. C., Wijma, E., Zwolsman, J. J. G., and Middelkoop, H.: Predicting suspended sediment concentrations in the Meuse river using a supply-based rating curve, Hydrol. Process., 22, 1846–1856, 2008.
EC-WFD: Directive 2000/60/EC of the European Parliament and of the Council of 23 October 2000 establishing a framework for Community action in the field of water policy, Official J. Europ. Commun., L327, 1–72, 2000.
Erkens, G.: Sediment dynamics in the Rhine catchment. Quantification of fluvial response to climate change and human impact, Netherlands Geographical Studies 38, PhD thesis, University of Utrecht, Utrecht, 2009.
FGG Elbe: Sedimentmanagementkonzept der FGG Elbe – Vorschläge für eine gute Sedimentmanagementpraxis im Elbegebiet zur Erreichung überregionaler Handlungsziele, Flussgebietsgemeinschaft Elbe, Magdeburg, 85 pp., https://www.fgg-elbe.de/files/Download-Archive/Fachberichte/Sedimentmanagement/sedimentmanagementkonzept_fgg_final.pdf (last access: 11 April 2023), 2013.
Fiener, P. and Auerswald, K.: Spatial variability of rainfall on a sub-kilometre scale, Earth Surf. Proc. Land., 34, 848–859, 2009.
Fiener, P., Neuhaus, P., and Botschek, J.: Long-term trends in rainfall erosivity – analysis of high resolution precipitation time series (1937–2007) from Western Germany, Agr. Forest Meteorol., 171–172, 115–123, 2013.
Fischer, F. K., Winterrath, T., and Auerswald, K.: Temporal- and spatial-scale and positional effects on rain erosivity derived from point-scale and contiguous rain data, Hydrol. Earth Syst. Sci., 22, 6505–6518, https://doi.org/10.5194/hess-22-6505-2018, 2018.
Frings, R. M., Hillebrand, G., Gehres, N., Banhold, K., Schriever, S., and Hoffmann, T.: From source to mouth: Basin-scale morphodynamics of the Rhine River, Earth-Sci. Rev., 196, 102830, https://doi.org/10.1016/j.earscirev.2019.04.002, 2019.
Geist, J. and Auerswald, K.: Synergien im Gewässer-, Boden-, Arten- und Klimaschutz am Beispiel von Flussauen, Wasserwirtschaft, 11, 11–16, 2019.
Golosov, V. and Walling, D. E.: Erosion and sediment problems: Global Hotspots, UNESCO – Intergovernmental Hydrological Programme, Paris, 40 pp., https://unesdoc.unesco.org/ark:/48223/pf0000369887.locale=en (last access: 11 April 2023), 2019.
Grill, G., Lehner, B., Thieme, M., Geenen, B., Tickner, D., Antonelli, F., Babu, S., Borrelli, P., Cheng, L., Crochetiere, H., Ehalt Macedo, H., Filgueiras, R., Goichot, M., Higgins, J., Hogan, Z., Lip, B., McClain, M. E., Meng, J., Mulligan, M., Nilsson, C., Olden, J. D., Opperman, J. J., Petry, P., Reidy Liermann, C., Saenz, L., Salinas-Rodriguez, S., Schelle, P., Schmitt, R. J. P., Snider, J., Tan, F., Tockner, K., Valdujo, P. H., van Soesbergen, A., and Zarfl, C.: Mapping the world's free-flowing rivers, Nature, 569, 215–221, 2019.
Habersack, H., Hein, T., Stanica, A., Liska, I., Mair, R., Jager, E., Hauer, C., and Bradley, C.: Challenges of river basin management: Current status of, and prospects for, the River Danube from a river engineering perspective, Sci. Total Environ., 543, 828–845, 2016.
Hardenbicker, P., Rolinski, S., Weitere, M., and Fischer, H.: Contrasting long-term trends and shifts in phytoplankton dynamics in two large rivers, Int. Rev. Hydrobiol., 99, 287–299, 2014.
Heimerl, S., Kohler, B., Ebert, M., and Libisch, C.: Die grossen Stauanlagen Deutschlands im Portrait, in: Talsperren in Deutschland, Springer Fachmedien, Wiesbaden, https://doi.org/10.1007/978-3-8348-2107-2_2, 2013.
Hillebrand, G. and Frings, R.: Von der Quelle zur Mündung: Die Sedimentbilanz des Rheins im Zeitraum 1991–2010, Bericht KHR/CHR II-22, Internationale Kommission für die Hydrologie des Rheingebietes, Lelystad, ISBN 978-90-70980-39-9, https://doi.org/10.5675/KHR_22.2017, 2017.
Hillebrand, G., Hardenbicker, P., Fischer, H., Otto, W., and Vollmer, S.: Dynamics of total suspended matter and phytoplankton loads in the river Elbe, J. Soils Sediments, 18, 3104–3113, 2018.
Hoffmann, T.: Sediment residence time and connectivity in non-equilibrium and transient geomorphic systems, Earth-Sci. Rev., 150, 609–627, 2015.
Hoffmann, T., Erkens, G., Gerlach, R., Klostermann, J., and Lang, A.: Trends and controls of Holocene floodplain sedimentation in the Rhine catchment, Catena, 77, 96–106, 2009.
Hoffmann, T. O., Baulig, Y., Fischer, H., and Blöthe, J.: Scale breaks of suspended sediment rating in large rivers in Germany induced by organic matter, Earth Surf. Dynam., 8, 661–678, https://doi.org/10.5194/esurf-8-661-2020, 2020.
Horowitz, A. J., Clarke, R. T., and Merten, G. H.: The effects of sample scheduling and sample numbers on estimates of the annual fluxes of suspended sediment in fluvial systems, Hydrol. Process., 29, 531–543, 2015.
Kondolf, G. M., Rubin, Z. K., and Minear, J. T.: Dams on the Mekong: Cumulative sediment starvation, Water Resour. Res., 50, 5158–5169, 2014.
Kondolf, G. M., Schmitt, R. J. P., Carling, P., Darby, S., Arias, M., Bizzi, S., Castelletti, A., Cochrane, T. A., Gibson, S., Kummu, M., Oeurng, C., Rubin, Z., and Wild, T.: Changing sediment budget of the Mekong: Cumulative threats and management strategies for a large river basin, Sci. Total Environ., 625, 114–134, 2018.
Moatar, F., Person, G., Meybeck, M., Coynel, A., Etcheber, H., and Crouzet, P.: The influence of contrasting suspended particulate matter transport regimes on the bias and precision of flux estimates, Sci. Total Environ., 370, 515–531, 2006.
Montgomery, D. R.: Soil erosion and agricultural sustainability, P. Natl. Acad. Sci. USA, 104, 13268–13272, 2007.
Nearing, M. A., Xie, Y., Liu, B., and Ye, Y.: Natural and anthropogenic rates of soil erosion, Int. Soil Water Conserv. Res., 5, 77–84, 2017.
Pohlert, T.: trend: Non-Parametric Trend Tests and Change-Point Detection, https://cran.r-project.org/web/packages/trend/vignettes/trend.pdf (last access: 11 April 2023), 2018.
Poulier, G., Launay, M., Le Bescond, C., Thollet, F., Coquery, M., and Le Coz, J.: Combining flux monitoring and data reconstruction to establish annual budgets of suspended particulate matter, mercury and PCB in the Rhône River from Lake Geneva to the Mediterranean Sea, Sci. Total Environ., 658, 457–473, 2019.
Richards, K.: Drainage basin structure, sediment delivery and the response to environmental change, in: Sediment Flux to Basins: Causes, Controls and Consequences, Special Publications, edited by: Jones, S. J. and Frostick, L. E., Geological Society, London, 149–160, ISBN 9781862390959, https://doi.org/10.1144/GSL.SP.2002.191.01.10, 2002.
Skolasińska, K. and Nowak, B.: What factors affect the suspended sediment concentrations in rivers? A study of the upper Warta River (Central Poland), River Res. Appl., 34, 112–123, 2018.
Slabon, A. and Hoffmann, T.: Uncertainties of annual suspended sediment transport estimates driven by temporal variability, Water Ressour. Res., accepted, 2023.
Sun, L., Yan, M., Cai, Q., and Fang, H.: Suspended sediment dynamics at different time scales in the Loushui River, south-central China, Catena, 136, 152–161, 2016.
Syvitski, J., Ángel, J. R., Saito, Y., Overeem, I., Vörösmarty, C. J., Wang, H., and Olago, D.: Earth's sediment cycle during the Anthropocene, Nat. Rev. Earth Environ., 3, 179–196, 2022.
Syvitski, J. P. and Kettner, A.: Sediment flux and the Anthropocene, Philos. T. Roy. Soc. A, 369, 957–975, 2011.
Syvitski, J. P., Morehead, M. D., Bahr, D. B., and Mulder, T.: Estimating fluvial sediment transport: The rating parameters, Water Resour. Res., 36, 2747–2760, 2000.
Trimble, S. W.: Decreased rates of alluvial sediment storage in the Coon Creek Basin, Wisconsin, 1975–93, Science, 285, 1244–1246, 1999.
van der Perk, M., Sutari, C. A. T., and Middelkoop, H.: Examination of the declining trend in suspended sediment loads in the Rhine River in the period 1952–2016, Land of Rivers, NCR Days 2019, Utrecht, 73–73, https://cdn.bullit.digital/ncr-web/20200918091502/ncr-43-ncrdays2019-bookofabstracts-web.pdf (last access: 11 April 2023), 2019.
Vörösmarty, C. J., Meybeck, M., Fekete, B., Sharma, K., Green, P., and Syvitski, J. P. M.: Anthropogenic sediment retention: major global impact from registered river impoundments, Global Planet. Change, 39, 169–190, 2003.
Walling, D. E. and Fang, D.: Recent trends in the suspended sediment loads of the world's rivers, Global Planet. Change, 39, 111–126, 2003.
Walling, D. E. and Webb, B. W.: The reliability of suspended sediment load data. Erosion and Sediment Transport Measurement (Proceedings of the Florence Symposium, June 1981), IAHS Publ., 133, 177–194, 1981.
Warrick, J. A.: Trend analyses with river sediment rating curves, Hydrol. Process., 29, 936–949, 2015.
Wischmeiner, W. H. and Smith, D. D.: Predicting rainfall erosion losses. A guide to conservation planning, Agriculture Handbook No. 537, US Department of Agriculture, https://naldc.nal.usda.gov/download/CAT79706928/PDF (last access: 13 April 2023), 1978.