the Creative Commons Attribution 4.0 License.
the Creative Commons Attribution 4.0 License.
 | 10 May 2023
Constraints on long-term cliff retreat and intertidal weathering at weak rock coasts using cosmogenic 10Be, nearshore topography and numerical modelling
Jennifer R. Shadrick
Martin D. Hurst
Matthew D. Piggott
Klaus M. Wilcken
Alexander J. Seal
The white chalk cliffs on the south coast of England are one of the most iconic coastlines in the world. Rock coasts located in a weak lithology, such as chalk, are likely to be most vulnerable to climate-change-triggered accelerations in cliff retreat rates. In order to make future forecasts of cliff retreat rates as a response to climate change, we need to look beyond individual erosion events to quantify the long-term trends in cliff retreat rates. Exposure dating of shore platforms using cosmogenic radionuclide analysis and numerical modelling allows us to study past cliff retreat rates across the Late Holocene for these chalk coastlines. Here, we conduct a multi-objective optimisation of a coastal evolution model to both high-precision topographic data and 10Be concentrations at four chalk rock coast sites to reveal a link between cliff retreat rates and the rate of sea-level rise. Furthermore, our results strengthen evidence for a recent acceleration in cliff retreat rates at the chalk cliffs on the south coast of England. Our optimised model results suggest that the relatively rapid historical cliff retreat rates observed at these sites spanning the last 150 years last occurred between 5300 and 6800 years ago when the rate of relative sea-level rise was a factor of 5–9 times more rapid than during the recent observable record. However, results for these chalk sites also indicate that current process-based models of rock coast development are overlooking key processes that were not previously identified at sandstone rock coast sites. Interpretation of results suggest that beaches, cliff debris and heterogenous lithology play an important but poorly understood role in the long-term evolution of these chalk rock coast sites. Despite these limitations, our results reveal significant differences in intertidal weathering rates between sandstone and chalk rock coast sites, which helps to inform the long-standing debate of “wave versus weathering” as the primary control on shore platform development. At the sandstone sites, subaerial weathering has been negligible during the Holocene. In contrast, for the chalk sites, intertidal weathering plays an active role in the long-term development of the shore platform and cliff system. Overall, our results demonstrate how an abstract, process-based model, when optimised with a rigorous optimisation routine, can not only capture long-term trends in transient cliff retreat rates but also distinguish key erosion processes active in millennial-scale rock coast evolution at real-world sites with contrasting rock types.
- Article
(4996 KB) - Full-text XML
-
Supplement
(423 KB) - BibTeX
- EndNote


Rock coasts are dynamic, erosional landscapes that form as a result of landward retreat of bedrock at the coastline (Kennedy et al., 2014) and are often identified by features such as a sea cliff and shore platform. Climate change threatens the stability of rock coasts and is expected to increase rock coast erosion through accelerations in relative sea-level (RSL) rise and increased storminess (Trenhaile, 2011; Oppenheimer et al., 2019). However, the quantification of sea cliff response to climate change is challenging because both marine and terrestrial factors at variable temporal and spatial scales influence rock coast evolution. Improving forecasts of future cliff retreat rates is necessary because of the socioeconomic importance of rock coasts and associated hazards, which are further threatened by climate change and increased urbanisation (Hurst et al., 2016). Understanding the long-term, antecedent trajectory of rock coast evolution is central to the development of predictive models of cliff retreat that account for a changing climate (Hurst et al., 2016; Trenhaile, 2018).
In order to understand the trajectory of long-term rock coast evolution, the interactions between cliff and shore platform dynamics and their combined impact on cliff retreat need to be considered. Cliff retreat is foremost driven by assailing wave force at the cliff base, and the cliff-platform junction corresponds to the elevation of maximum horizontal marine erosion (Trenhaile, 2018). The shore platform fronting the sea cliff plays an important role in mediating the wave energy available to erode the cliff. It is, therefore, vital to understand wave and weathering processes working concurrently to result in lowering of the shore platform and landward retreat of the cliff (Sunamura, 1992).
The relative importance of “waves versus weathering” as the primary control on shore platform development has been debated (Stephenson and Kirk, 1998; Trenhaile and Kanyaya, 2007; Kennedy et al., 2011; Retallack and Roering, 2012; Matsumoto et al., 2018). Whereas weathering relates to the weakening of the rock material through a combination of physical, chemical and biological processes, wave erosion relates to the physical removal of (weakened) rock material from the shore platform surface and cliff by means of wave action. The dominance of either wave or weathering processes in rock coast evolution still remains uncertain, but it is recognised to vary in importance in different marine, lithological (i.e. rock type) and climatic settings (Dickson, 2006). In general, weathering processes often dominate in low wave energy, micro-mesotidal, weak lithology and warmer climate rock coast sites, whereas wave processes often dominate in high wave energy, meso- or megatidal, more resistant lithology and temperate climate rock coast sites (Stephenson and Kirk, 2000; Dickson, 2006; Trenhaile and Porter, 2007; Kennedy et al., 2011; Retallack and Roering, 2012).
The erosion of rock coasts is highly contingent on the type and structure of the bedrock present at the coast (Rosser et al., 2013; Sunamura, 2015; Buchanan et al., 2020). In fact, a global database identified rock resistance, rather than climate or marine forcings, as the strongest factor controlling rock coast erosion rates (Prémaillon et al., 2018). Rock coasts located in a weak lithology, such as chalk (Hoek and Brown, 1997), are therefore likely to be most vulnerable to climate change-triggered accelerations in cliff retreat rates. Correspondingly, Trenhaile (2011) conducted a theoretical investigation into the prediction of rock coast response to climate change using a numerical model and compared results from different rock resistances. He concluded that, although absolute cliff retreat rates will be greatest in weaker rock types, the proportional increase in cliff retreat rates will be greater at rock coasts with more resistant material and historically slower cliff retreat rates (Trenhaile, 2011). Further work is needed to understand the sensitivity of long-term rock coast evolution in real-world settings in different lithologies to external changes in climate.
A methodology that has facilitated the study of site-specific, millennial-scale rock coast evolution is the application of cosmogenic radionuclide (CRN) analysis on shore platforms. Concentrations of CRNs across a shore platform are proportional to the time of surface exposure to cosmic rays and rate of erosion, and long-term cliff retreat rates can be quantified when coupled with a coastal evolution model (Regard et al., 2012; Hurst et al., 2017). Relatively few studies of CRN applications at chalk rock coast sites have been conducted to date. However, previous applications of CRN analysis at rock coasts across a range of rock types were able to date shore platform surfaces (Choi et al., 2012) and quantify long-term cliff retreat rates (Regard et al., 2012; Rogers et al., 2012; Hurst et al., 2016; Swirad et al., 2020; Duguet et al., 2021; Shadrick et al., 2021). By quantifying past long-term cliff retreat rates, comparisons can be made to observed historical cliff retreat rates. Using these techniques, both Hurst et al. (2016) and Duguet et al. (2021) identified modern accelerations in cliff retreat rates for chalk cliffs on the south coast of England and Normandy coast in France, respectively.
Previous CRN analyses at chalk rock coasts have given novel insights into the long-term cliff retreat, yet these studies have always assumed a simplistic, steady-state geometric model of coastal evolution (Regard et al., 2012; Hurst et al., 2016). The validity of cliff retreat rates derived from CRN concentrations is dependent on the coastal evolution models that are used to interpret the measured CRN concentration data (Trenhaile, 2018). It is important, therefore, to ensure the coastal evolution model that is applied faithfully approximates cliff and shore platform weathering and erosion processes as accurately as possible across the millennial timescales over which CRNs accumulate. Furthermore, a rigorous optimisation routine is required to optimise a process-based coastal evolution model to high-precision 10Be CRN concentrations and topographic data (Shadrick et al., 2021).
Long-term cliff retreat rates for the past 7000 years, and, in turn, projections of future cliff retreat rates to the year 2100 have been made for two sandstone rock coast sites in the UK by combining the best available rock coast morphodynamic model with simulated CRN accumulation and optimising the model to high-precision CRN concentration measurements and topographic survey data (Shadrick et al., 2022). Application of a process-based, transient coastal evolution model to interpret 10Be concentrations has revealed a linear positive relationship between cliff retreat rates and the rate of relative sea-level rise (Shadrick et al., 2021). These results indicated that negligible subaerial weathering occurred at these sandstone sites, which was required for the model to match the measured topography and concentrations at the two sandstone sites (Shadrick et al., 2021).
Until now, a process-based model has not been used to quantify long-term cliff retreat rates for chalk rock coast sites. Here, we apply a process-based model at contrasting lithological settings, including both chalk and sandstone rock coasts, to provide further insights into the dominant coastal erosion processes acting across millennial timescales at sites with varied rock types, which helps to inform the “wave versus weathering” debate (e.g. Stephenson and Kirk, 1998; Trenhaile and Kanyaya, 2007; Kennedy et al., 2011; Retallack and Roering, 2012; Matsumoto et al., 2018). This study expands on the application of CRN exposure analysis of shore platforms in the UK by investigating the long-term rate and nature of cliff retreat using our coastal evolution model and multi-objective optimisation approach (Shadrick et al., 2021; see Sect. 3.1) for two new UK, chalk rock coast sites: Seven Sisters and St Margaret's. As well as modelling the new datasets, we revisit data from two previously studied UK chalk rock coast sites: Hope Gap and Beachy Head (Hurst et al., 2016). Revisiting previous studies provides a unique opportunity to compare long-term cliff retreat results from dissimilar coastal evolution models. Here, we compare results between different models and discuss the influence of, for example, beach material and cliff debris, as well as cliff retreat rates derived from historical records, which helps to advance our understanding of how rock coasts evolved both in the long-term past and more recently.
The white chalk cliffs found on the south coast of England are iconic and recognisable landforms in the UK and worldwide. Their towering heights of up to ∼165 m at Beachy Head (Robinson, 2020) and white chalk lithology are both visually striking and extremely hazardous. As a result, the chalk cliffs on the south coast of England are some of the most well-studied rock coast settings in the world (Moses and Robinson, 2011). A range of previous studies located at the south coast chalk cliffs have, for example, quantified the following: (1) millennial-scale cliff retreat rates using CRN analysis (Hurst et al., 2016); (2) modern cliff retreat rates using historical maps (Dornbusch et al., 2008); (3) modern cliff failure using UAV photogrammetry (Barlow et al., 2017; Gilham et al., 2019); (4) hazard classification and risk assessment (Mortimore et al., 2004a; Stavrou et al., 2011); and (5) platform downwear rates using micro-erosion meters (MEMs) (Foote et al., 2006).
The retreat of chalk cliffs is primarily a function of episodic cliff collapses, where the type, volume and frequency of collapse are controlled primarily by the chalk type and structure and cliff height (Mortimore et al., 2004a; Dornbusch et al., 2008; Robinson, 2020). The porosity of chalk means that groundwater saturation, rainfall and storms also play an important role in cliff collapse occurrence at these vulnerable coastlines (Duperret et al., 2004, 2005; Mortimore et al., 2004a). One of the largest recent cliff collapses occurred near Beachy Head in 1999 with a total chalk volume loss of up to 150 000 m3, which produced a debris apron that extended up to 130 m across the shore platform (Mortimore et al., 2004a; Moses and Robinson, 2011; Robinson, 2020). In contrast, smaller collapses of volumes <1000 m3 occur much more frequently and often multiple times within a year (Duperret et al., 2004; Williams et al., 2004; Robinson, 2020). The removal rate of fallen cliff debris is widely unquantified (Moses and Robinson, 2011). Nevertheless, it is suggested that small-scale falls (<1000 m3) may be removed in a matter of days to weeks, medium-scale falls (1000–10 000 m3) can be removed over a few months, and large-scale falls (>10 000 m3) may take decades to transport all the material (Mortimore et al., 2004a; Moses and Robinson, 2011). As well as the total volume of fallen cliff debris, the size of debris produced can also influence the rate of removal, but this has not been fully explored (Moses and Robinson, 2011).
The Cretaceous white chalk cliffs and shore platforms contain bands of nodular and continuous sheets of flint parallel to bedding (Robinson, 2020; Mortimore et al., 2001). Because flints are composed of diagenetic silica and are, therefore, more resistant to weathering (and, by proxy, erosion) than the carbonate chalk itself, beach material is made up of flint gravels left behind after the chalk is eroded as well as sediment from palaeo-gravel barriers (Dornbusch et al., 2006a; Mellett and Plater, 2018). These flint beaches, which have a harder material strength relative to the chalk, are therefore effective abrasion tools that contribute to the erosion of both the shore platform and cliff base (Costa et al., 2006; Robinson, 2020). Conversely, beach material can also act as protection from incoming wave erosion (Trenhaile, 2016; Earlie et al., 2018). There is evidence of beach thinning across these southern English coastlines across the Holocene due to diminishing supplies of flints from cliff erosion (Dornbusch et al., 2006a, 2008), increased regional storminess and the introduction of coastal defences (Hurst et al., 2016).
A review of datasets acquired from a range of techniques, including MEM measurements, laser scanning and historical maps, estimated average cliff retreat rates of 11–87 cm yr−1 and average platform downwear rates of 0.8–7.2 mm yr−1 for the chalk cliffs and platforms, respectively, at the south coast in England and north in France (Moses and Robinson, 2011). In England, the longest record of historical cliff retreat rates was quantified using digitised cliff positions from historical Ordnance Survey maps for a time period of 130 years, which calculated an average cliff retreat of 35 cm yr−1 for the chalk coastline between Brighton and Eastbourne between 1873 and 2001 (Dornbusch et al., 2008). As well as platform downwearing, step backwearing is another erosional mechanism active on chalk shore platforms. Irregular steps form across the shore platform due to the chalk and flint bedding of variable resistances. The seaward edge of the step erodes landward primarily by means of mechanical wave processes and, although highly spatially variable, the rate of step retreat is of similar magnitude to platform downwear at the same sites (Dornbusch and Robinson, 2011; Moses and Robinson, 2011; Robinson, 2020).
We focus our study on two new chalk rock coast sites at Seven Sisters and St Margaret's at Cliffe (St Margaret's hereafter) as well as two previously studied chalk rock coast sites at Hope Gap and Beachy Head (Hurst et al., 2016) (Fig. 1). The Seven Sisters site is located on the south coast in Sussex between the two coastal towns of Seaford and Eastbourne (Fig. 1). This rock coast site is located within the Seaford Chalk Formation within the White Chalk Subgroup, which is composed of weak, fine-grained chalk with extensive bands of nodular and tabular flints (Mortimore et al., 2001) (Fig. 1). A series of low-amplitude anticlinal and synclinal structures shape the sinuous cliff forms found at Seven Sisters (Mortimore et al., 2004b). As a result, cliffs range from maximum heights of 60–165 m associated with the termination of valley peaks to minimum heights of 12–14 m associated with the termination of valley troughs (Robinson, 2020). At this field site, the shore platform extends ∼226 m offshore from the cliff base with a beach of ∼50 m width overlying the cliff-platform junction. Cliff height reaches ∼47 m above the shore platform where we collected samples for CRN analyses. Mean spring tidal range is measured as 5.97 m at the Newhaven tide gauge site (National Tidal and Sea Level Facility, 2021).
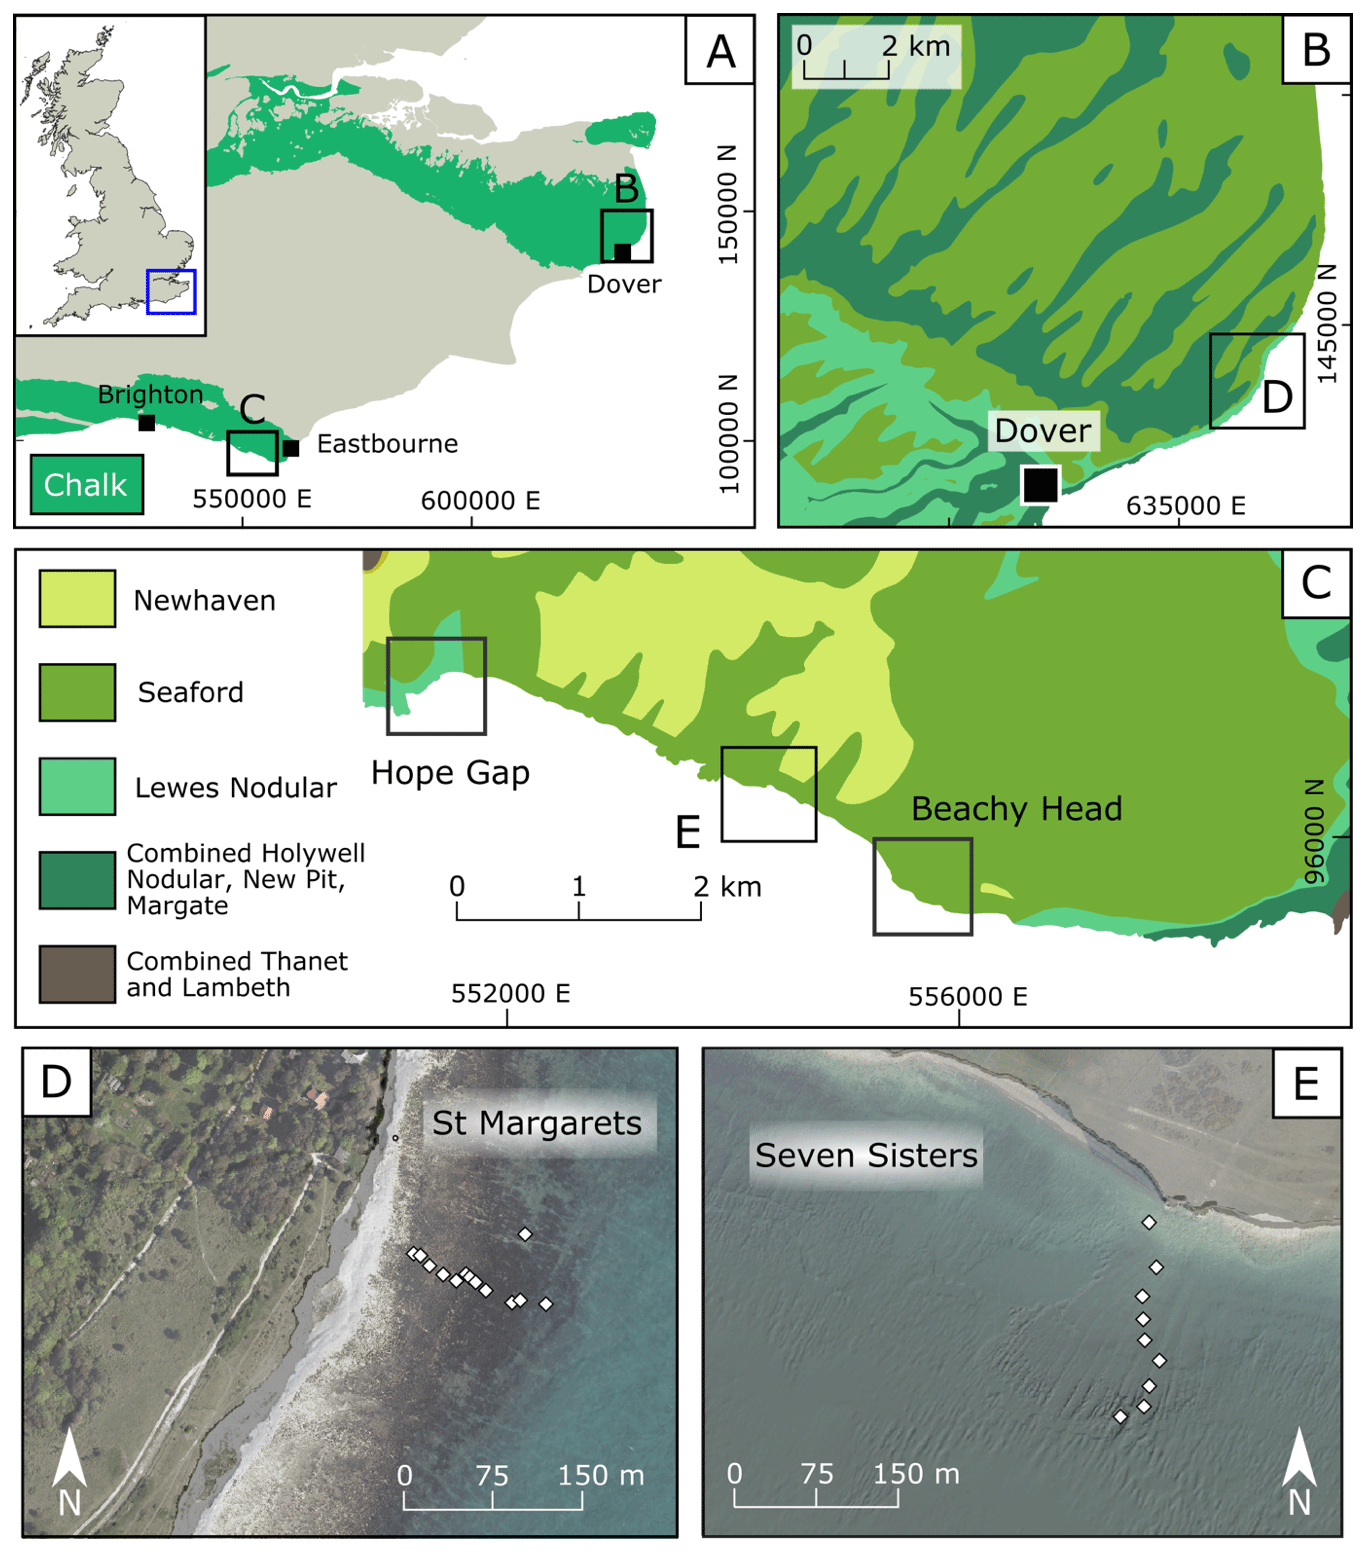
Figure 1Locations and regional geology for the St Margaret's and Seven Sisters sites. (a) Location of rock coast sites on the south coast of England and chalk bedrock shown. (b) Regional chalk geology for Kent coastline and St Margaret's site. (c) Regional chalk geology for Sussex coastline and location of new Seven Sisters site and previously studied sites Hope Gap and Beachy Head. (d) Hillshade (lidar) draped with aerial imagery (Channel Coastal Observatory, 2021) and 10Be sample locations at St Margaret's. (e) Hillshade (lidar) draped with aerial imagery (Channel Coastal Observatory, 2021) at high tide (platform is submerged) and 10Be sample locations at Seven Sisters.
The St Margaret's site, on the south-east coast of Kent, is situated ∼5 km north along the coastline from Dover (Fig. 1). The rock coast at St Margaret's is located within the Lewes Nodular Chalk formation within the White Chalk Subgroup, which is composed of hard to very hard nodular chalk interbedded with softer chalks and marls (Mortimore, 1987; Mortimore et al., 2001) (Fig. 1). Beach widths range from 15 to 73 m in the area with the shore platform extending ∼195 m offshore from the cliff base along the CRN sampling transect. Just east of the field site is St Margaret's Bay, where substantial beach material and groyne coastal defences are present. The cliff height is ∼60 m directly above the shore platform where we sampled for CRN analysis, but cliff heights reach >90 m ∼1 km further west along the coastline. Mean spring tidal range is measured as 5.82 m at the Dover tide gauge site (National Tidal and Sea Level Facility, 2021).
RSL histories have been supplied from a glacial isostatic adjustment (GIA) model (Bradley et al., 2011). The three sites, including Seven Sisters, Hope Gap and Beachy Head, on the Sussex coast have the same reference location for the GIA model (“Sussex”, Bradley et al., 2011). The GIA reference location for the St Margaret's site was “Kent” (Bradley et al., 2011). All four chalk sites show very comparable RSL histories and show that RSL was at an elevation ∼15 m lower than present day 8000 years BP (Fig. 2). Results from the GIA model for the chalk sites also shows that the rate of RSL rise reached a maximum of ∼7 mm yr−1 at 8000 years BP; this quickly declined to ∼2.6 mm yr−1 at 7000 years BP and continued to gradually decline to rates of ∼0.3 mm yr−1 at present day (Fig. 2).
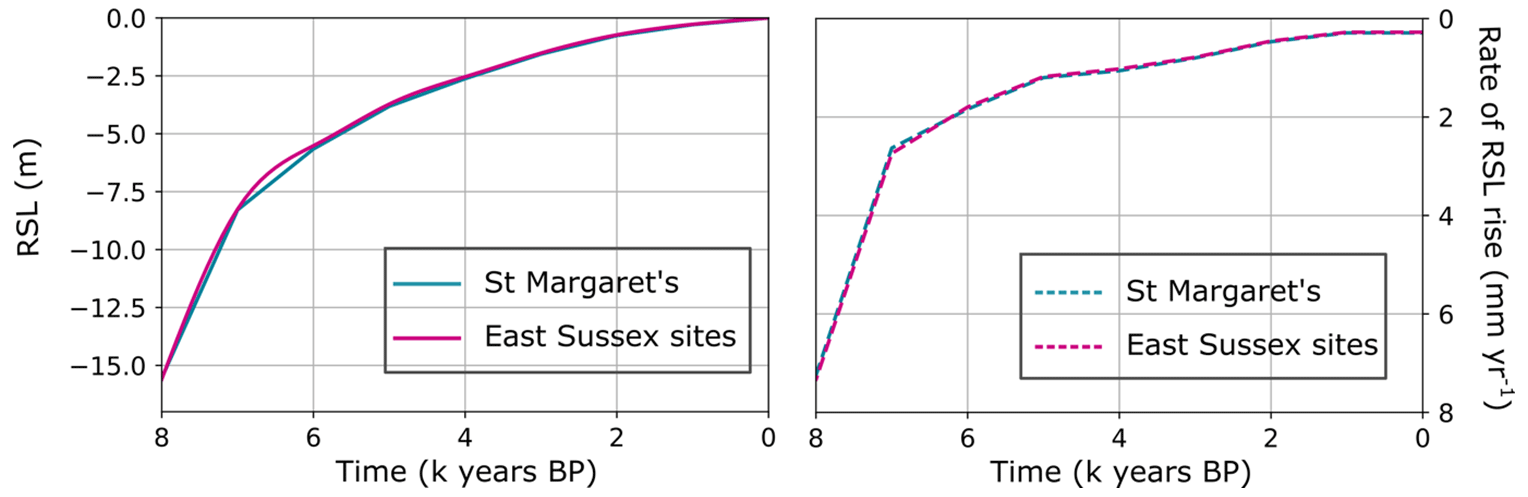
Figure 2Relative sea-level (RSL) (m) and the rate of RSL rise (mm yr−1) calculated every 1000 years for the site St Margaret's (blue) and the East Sussex sites, including Seven Sisters, Beachy Head, and Hope Gap (pink). RSL histories were provided by the GIA model of Bradley et al. (2011).
3.1 Numerical modelling and model optimisation
Methods associated with our coastal evolution model and multi-objective optimisation approach are provided in detail by Shadrick et al. (2021); however, a basic overview is provided here.
The numerical model couples an exploratory rock coast evolution model (Matsumoto et al., 2016) and a dynamic model for shore platform evolution and 10Be production (Hurst et al., 2017) to simultaneously model rock coast erosion and 10Be production. The model applies a dynamic form of coastal evolution that allows for transient cliff retreat, rather than Holocene-averaged cliff retreat rates, in order to quantify a time series of cliff retreat across millennial timescales. Platform morphology is an emergent model element instead of being fixed through model simulation time (e.g. Regard et al., 2012; Hurst et al., 2016; Swirad et al., 2020). Simulated wave erosion is highly simplified by expressing wave hydraulic and mechanical properties as wave assailing force and follows established conceptual rock coast evolution models (Sunamura, 1992; Trenhaile, 2008; Payo et al., 2015). Erosion of the shore platform and cliff is achieved once wave assailing force exceeds a material resistance value assigned to the rock material. Subaerial weathering is also simulated and works to lower the resistance of the rock material value (Matsumoto et al., 2016). Free parameters chosen to vary within the Markov chain Monte Carlo (MCMC) simulation were wave erodibility by means of wave height decay rate (y), material resistance (FR) and maximum intertidal weathering rate (K). Free parameter selection was informed by previous investigations that found these variables had the greatest influence on whether rock coast evolution was dominated by either wave or weathering-driven erosion (Matsumoto et al., 2018). The defined parameter space was informed by modelling-based and field-based investigations (Sunamura, 1992; Ogawa et al., 2011; Matsumoto et al., 2018; Trenhaile, 2000; Porter et al., 2010a). Altering the value of wave height decay rate (y), with units m−1, varies the spatial distribution and magnitude of wave energy. A greater value for y means wave height will decay more quickly and wave erosion covers a shorter distance across the shore platform, whereas a lower value for y means wave height will decay more slowly and wave energy dissipates across a greater distance across the shore platform. The conceptual value for material resistance (FR), with units , simplifies mechanical, geological and structural rock factors into a single value (Matsumoto et al., 2016). Maximum weathering rate (K), with units , occurs at the mean high water neap (MHWN) tidal level defined by a weathering efficacy function (Porter et al., 2010a). The range of K explored encompasses a parameter space where negligible intertidal weathering and where weathering rate equal to the material resistance (FR) can be replicated in the MCMC simulations. Maximum weathering rate (K) was varied as a function of the material resistance (FR) within the MCMC simulations. The 10Be concentration is calculated across the shore platform surface and as a function of depth for every annual time step. Both spallation-produced 10Be and muon-produced 10Be are calculated as a function of depth by summing the exponential functions specific to spallation and muon production (Braucher et al., 2013). Cliff retreat exposes new shore platform material to 10Be spallation production. Exposure to 10Be production is modulated through time by the rate of cliff retreat, platform lowering, water cover (including tidal variation and RSL) and topographic shielding (Choi et al., 2012; Regard et al., 2012; Rogers et al., 2012). These factors combine to result in the predicted “humped” 10Be concentration horizontal profile offshore. A full description of the 10Be production model can be found in Hurst et al. (2017).
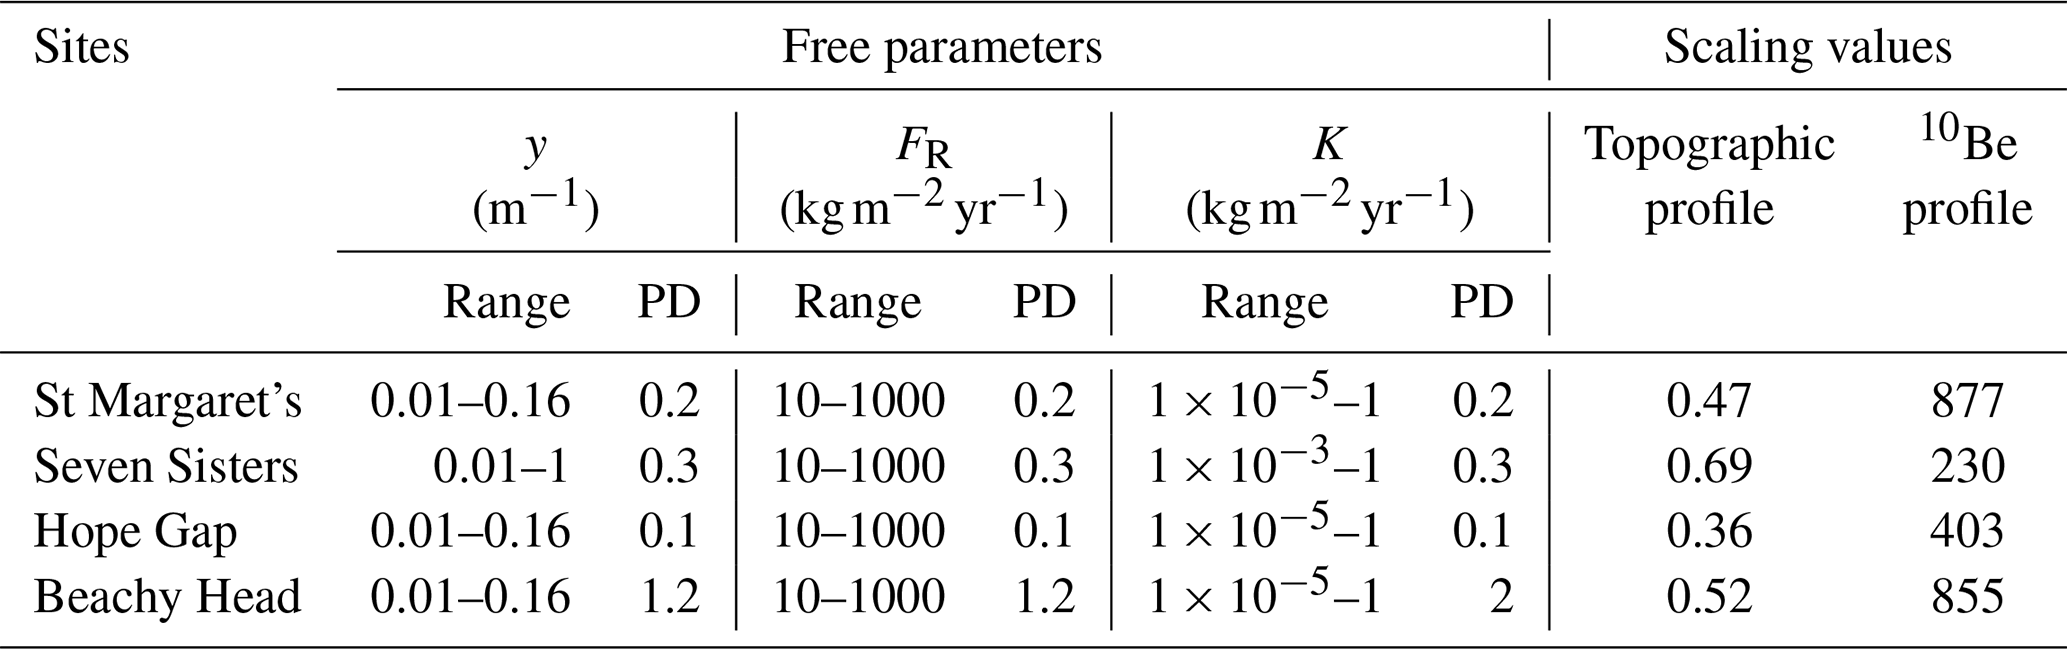
For each site, the two model outputs, including a topographic profile and 10Be concentration profile, were optimised simultaneously using multi-objective optimisation with the QUESO Bayesian calibration library (Estacio-Hiroms et al., 2016) within Dakota optimisation environment (Adams et al., 2019). Before implementing the full optimisation routine, exploration of the parameter space using random sampling was performed to (1) refine the parameter ranges and (2) tailor the proposal distribution variance for optimal chain mixing with acceptance values of ∼23 % (Gelman et al., 1997). The proposal distribution is used to select and move to new samples in the MCMC chain, which directly impacts the acceptance rate. The scaling values, which were used before the topographic and 10Be concentration residual scores were combined, also impact the acceptance rates. These scaling values are needed to equalise the magnitude ranges of the two single residual scores. The topographic profile scaling value is equal to the standard error from a linear regression of the topographic profile; the 10Be concentration scaling value is the average measurement error of the 10Be concentrations (Shadrick et al., 2021). Table 1 includes inputs and ranges for values used for the optimisation routine implemented using Dakota for all four chalk sites.
Table 1Ranges and proposal distributions (PDs) for the free parameters y (wave height decay rate), FR (material resistance) and K (maximum weathering rate) for the St Margaret's, Seven Sisters, Hope Gap and Beachy Head sites. Maximum weathering rate is varied as a function of material resistance following Matsumoto et al. (2018) (maximum weathering rate = K×FR). Scaling values for the weighted multi-objective MCMC routine for the topographic profile and 10Be concentration profile are also shown.
A 10 000-iteration Metropolis–Hastings MCMC (Metropolis et al., 1953) simulation was used to target a set of model input parameters that produce a model output that best matches the measured data. Optimisation is achieved by minimising the negative log-likelihood score from an equally weighted objective function that combines both topographic profile residuals and 10Be concentration residuals between modelled and measured results. Shadrick et al. (2021) provide a full explanation of how this objective function is formulated and applied within the Dakota environment.
Long-term cliff retreat rates are measured from the model simulation with the best set of input parameters from the MCMC simulation. Uncertainty on best-fit results was defined by the 16 % and 84 % confidence intervals of likelihood weighted posterior distributions of accepted sample positions. Time stamps of modelled cliff positions were back calculated and used to estimate at what time cliff positions occurred at different distances relative to the present-day cliff position.
3.2 GIS-based methods for topographic data acquisition
To quantify recent cliff retreat rates for the past ∼130 years, georectified historical Ordnance Survey maps were used to digitally map past cliff positions, and then these past cliff positions were compared to the most recent cliff positions taken from aerial photographs. Historical cliff retreat rates were previously quantified between the years 1873 and 2001 across all chalk sites on the south coast (Dornbusch et al., 2008). We have used these historical cliff retreat rates as a comparison to the long-term cliff retreat rates produced from the coastal evolution model. At St. Margaret's, we updated previous historical cliff retreat calculations made by Dornbusch et al. (2008) to include up to the year 2020. Here, we used a similar approach to Dornbusch et al. (2008) and used the Digital Shoreline Analysis System (DSAS) 5.0 (Himmelstoss et al., 2018) to quantify cliff retreat rates between the years 1898 and 2020. Historical cliff positions were digitised from OS maps (Digimap, 2021), and present-day cliff positions were digitised from recent aerial photographs and light detection and ranging (lidar) imagery (Channel Coastal Observatory, 2021). Historical cliff retreat rates were quantified for ∼5.5 km of the coastline that included the site where rock samples for CRN analysis were collected. Using DSAS, a total of 1081 transects were made perpendicular to the shoreline at 5 m intervals to intersect the past and present-day digitised cliff positions. The cliff retreat rate was calculated by dividing the distance between the two cliff lines by the time interval (122 years). The uncertainty is calculated by propagating the uncertainty of the historical and present-day cliff positions in quadrature and dividing by the time interval (Jonah et al., 2016; Himmelstoss et al., 2018).
A modern cross-shore topographic profile of the shore platform was required for optimisation of the cross-shore profile generated by the rock coast evolution model (described in Sect. 3.1). The model tries to match the intertidal topography to the observed cross shore profile. The Channel Coast Observatory (Channel Coastal Observatory, 2021) provides high-quality coastal lidar and multibeam bathymetry that were combined and from which an intertidal topographic cross-section 10 m wide swath profile was extracted to a distance of 300 m from the modern cliff. The location of the swath profile follows the same transect as the 10Be rock sample collection.
3.3 10Be sample collection and processing
The second output of the coastal evolution model is a predicted 10Be concentration profile along the same transect as the topographic profile. Flint nodules, which are composed of amorphous SiO2, in the chalk have the required target elements needed for cosmogenic 10Be production (e.g. primarily O) (Gosse and Phillips, 2001). Flint samples were collected from the intertidal platforms at Seven Sisters in July 2013 and at St Margaret's in August 2018 (Fig. 3). Before sampling, field reconnaissance was conducted to locate a flint bed with sufficient number and size of flint nodules that followed roughly the same transect, which extended from the beach toe to the low tide level. We maximised the distance offshore because the offshore sampling distance is proportional to the duration of time to which we can calibrate our coastal evolution model. As exactly as possible, field studies were timed to sample the shore platform at the lowest annual tides to ensure sampling could extend to the furthest offshore and widest width of the shore platform. In situ, exposed flint nodules were then excavated from the chalk shore platform at ∼10 m intervals, which resulted in 9 samples at Seven Sisters and 16 samples at St. Margaret's. High-accuracy (1–3 cm) Global Navigation Satellite System (GNSS) coordinates and elevation data were taken at each sample point using a Trimble Geo 7X and external antenna. A laser range finder was used to measure ∼10 m intervals between sample points. As well as the shore platform samples, where possible, a sample from a sea cave (Fig. 3b) was also taken to correct for inherited, muogenic-produced 10Be; i.e. the 10Be concentration present in the rock before the intertidal platform was exposed by erosion during cliff retreat. We assume the concentration of the sea cave sample at each site is entirely muon-produced and use this as our inheritance correction concentration for the shore platform samples at that site. At Seven Sisters, 10Be concentrations were corrected for inheritance using the full concentration of sample (SS09), which is closest to the modern cliff, because there was not a sea cave (Table 2); this was the same approach taken by Hurst et al. (2016) for the Beachy Head site where a sea cave was not present. The concentration at SS09 is similar to that which would be expected directly beneath a 47 m high cliff for a secular equilibrium between muon production at depth and radioactive decay. However, some minor (300–400 atoms g−1) additional 10Be accumulation may have occurred since the cliff retreat from the site of SS09 over the last 100 years.
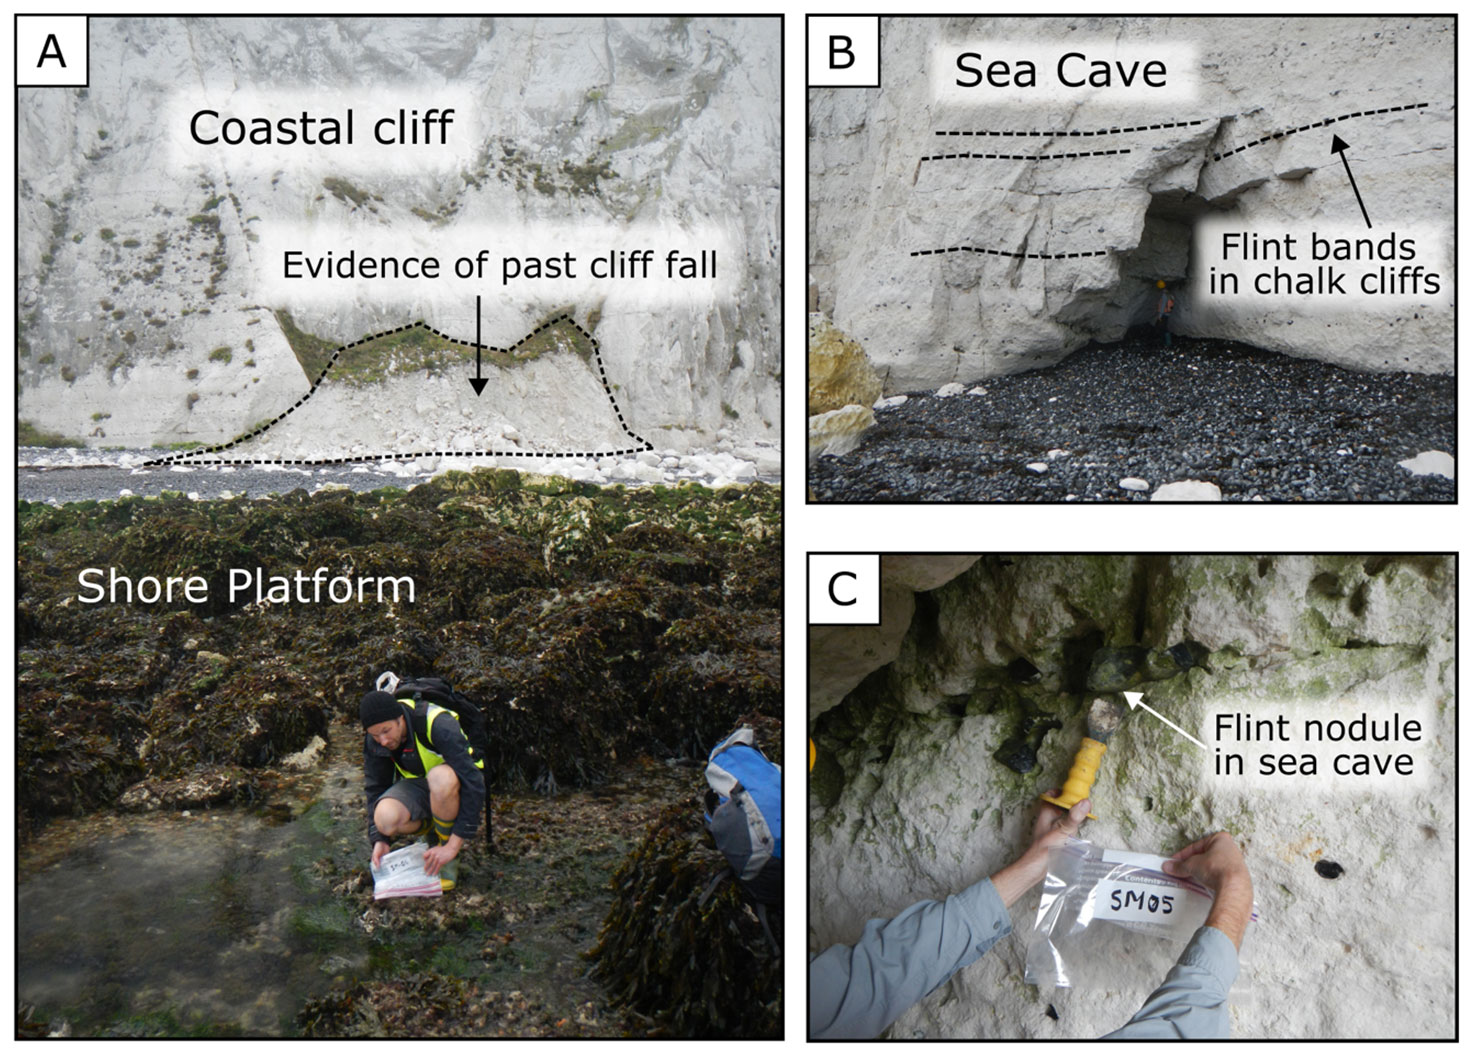
Figure 3Photos taken in the field at the St. Margaret's site. (a) The chalk coastal cliff and shore platform identified at the site showing evidence of previous cliff fall. (b) Example of flint bands found in the chalk cliffs and sea cave. (c) Photo of sample SM05, which was taken from the sea cave in photo (b). Sample SM05 was used as the shielded sample to correct shore platform samples for inherited 10Be concentrations.
Table 210Be sample and concentration data for Seven Sisters.
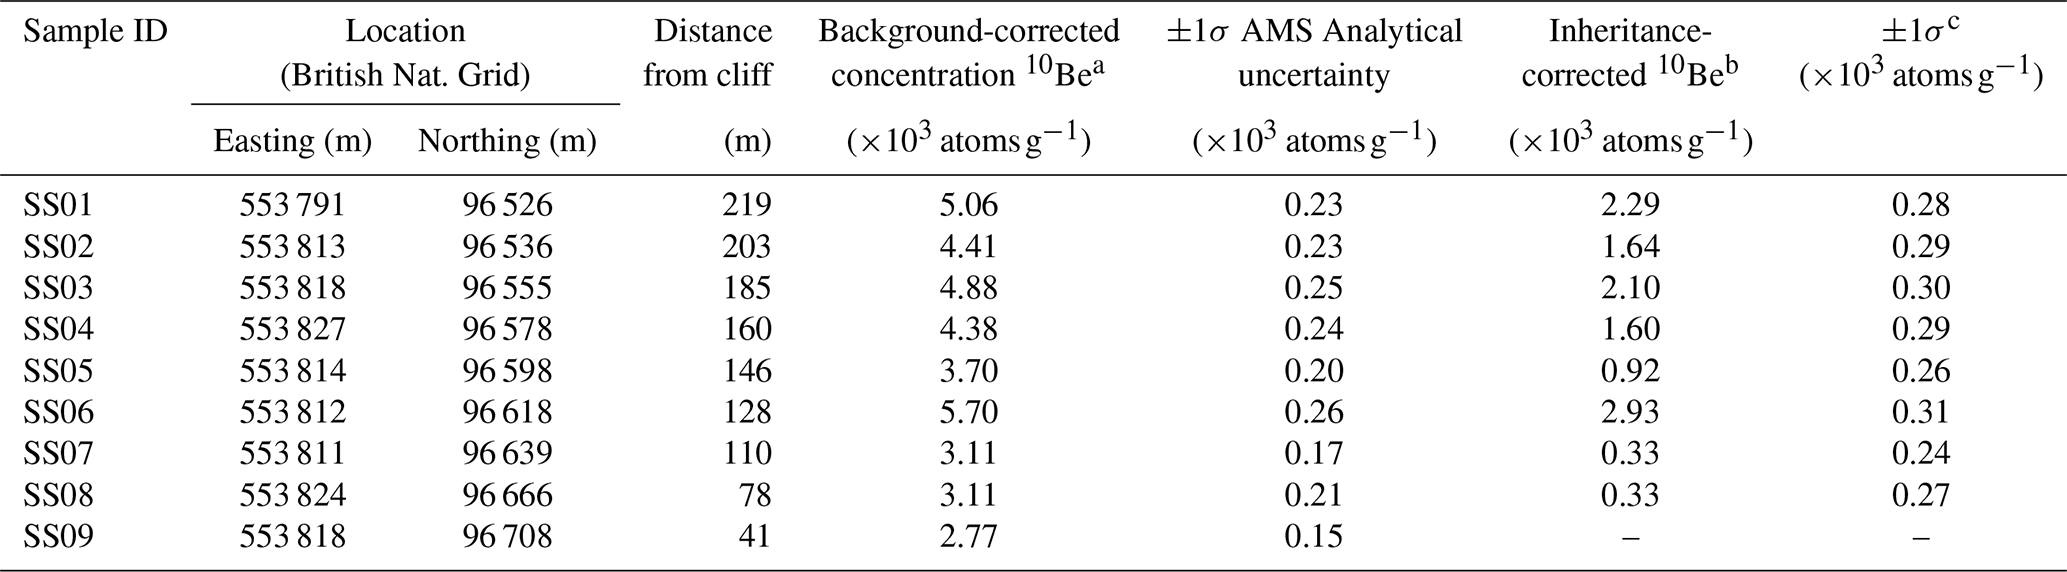
a Normalised to the 07KNSTD3110 standard with an assumed ratio of . Values corrected for chemistry background using average and standard deviation of two full chemistry blanks CFG1416A and CFG1416B (Table S1) processed in each batch with errors in sample and blank propagated in quadrature. b All SS samples were corrected for inheritance with SS09, the sample closest to the cliff base, assuming little accumulation of 10Be concentrations. c Error propagated as , where σa is the error of the measured concentration, and σb is the error of the measured concentration used for the inheritance correction SS09.
The shore platform samples were prepared using mineral separation and isotope dilution chemistry methods based on either standard procedures (Kohl and Nishiizumi, 1992; Corbett et al., 2016) or methods previously used for flint samples (Hurst et al., 2016) at the CosmIC laboratory at Imperial College London (St Margaret's) and the Scottish Universities Environmental Research Centre (SUERC) (Seven Sisters), respectively. The analyses by accelerator mass spectrometry (AMS) of the St Margaret's samples were conducted at the Centre for Acceleration Science at the Australian Nuclear Science and Technology Organisation (ANSTO) using the 6 MV Sirius tandem accelerator (Wilcken et al., 2017). For the Seven Sisters samples, analyses were conducted at Lawrence Livermore National Laboratory (LLNL) (Rood et al., 2010). For St Margaret's samples, measured 10Be concentrations were normalised to the KN-5-3 standard with an assumed ratio of ( Ma, Nishiizumi et al., 2007). For Seven Sisters samples, measured 10Be concentrations were normalised to the 07KNSTD3110 standard with an assumed ratio of . Measured ratios were then corrected for background and inherited 10Be concentrations using the process blank samples and “shielded” cliff (St Margaret's) or shore platform (Seven Sisters) sample, with errors propagated in quadrature, allowing for calculation of absolute 10Be concentrations (Tables 2, 3, S1, and S2 in the Supplement). Chemistry background blanks for St Margaret's contained 19 100–71 710 10Be atoms, equivalent to 4 %–40 % of total atoms in shore platform samples. For Seven Sisters, chemistry background blanks contained 34 794–35 599 10Be atoms, equivalent to 10 %–20 % of total atoms in shore platform samples.
Table 310Be sample and concentration data for St Margaret's.
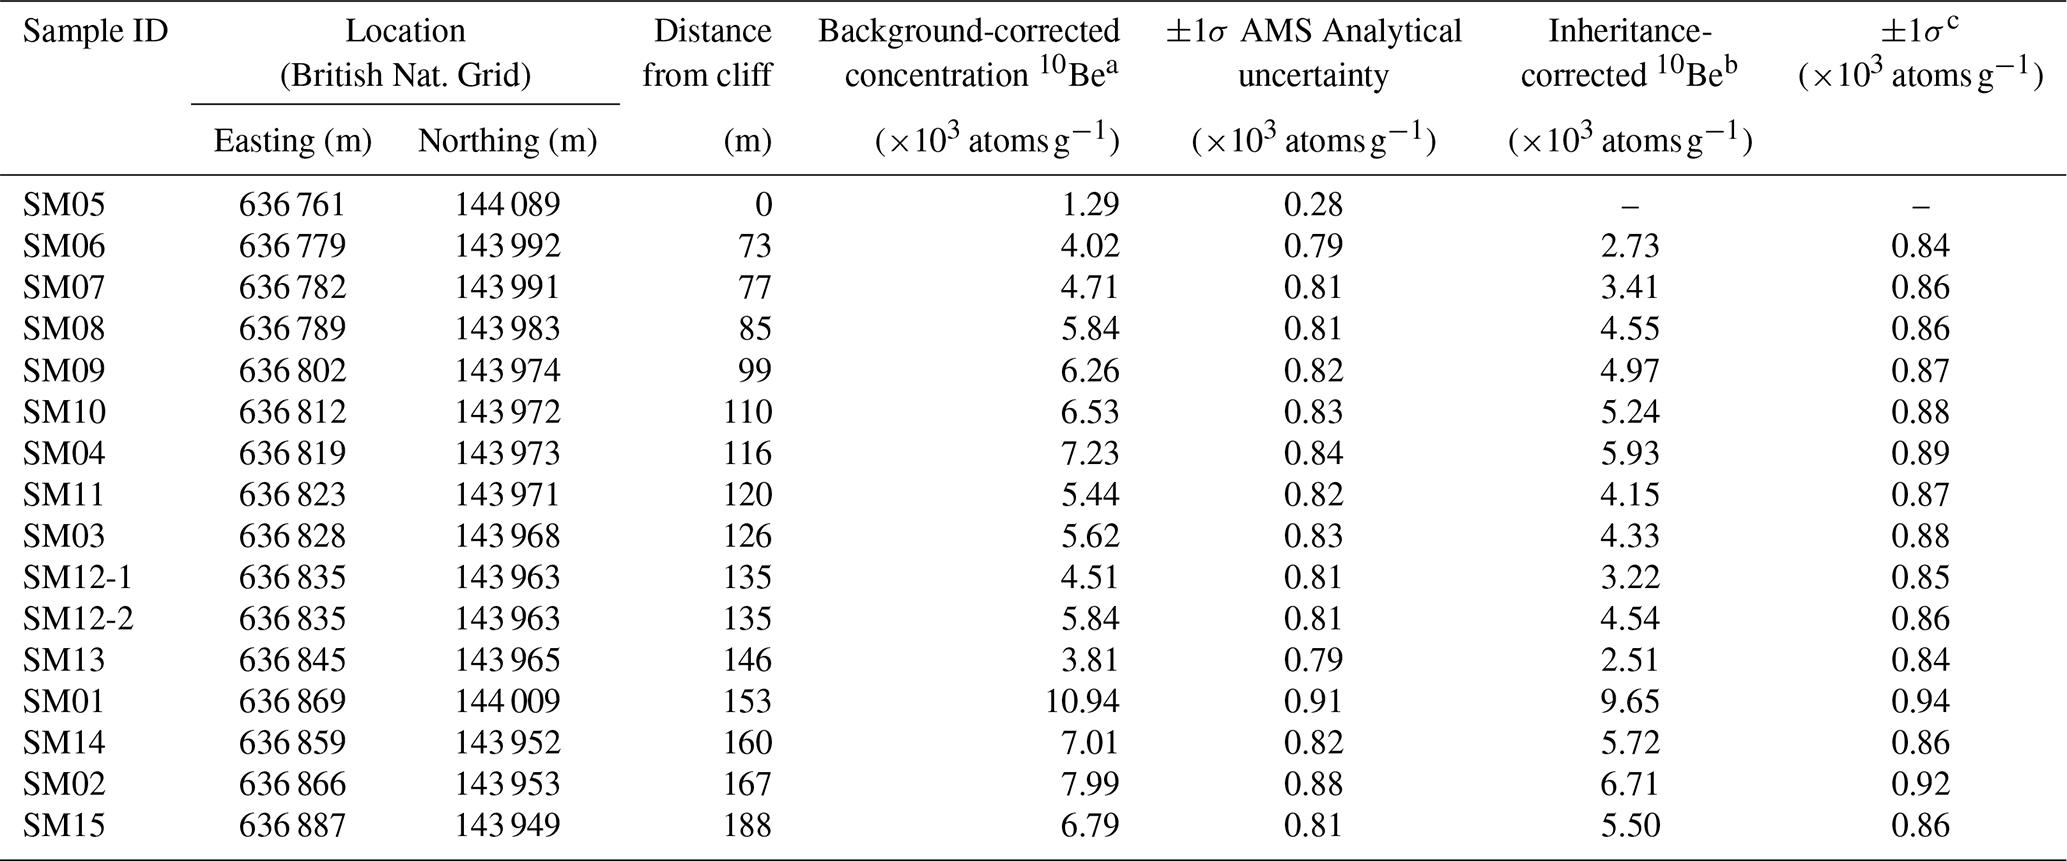
a Normalised to the KN-5-3 standard with an assumed ratio of ( Ma, Nishiizumi et al., 2007). Values corrected for chemistry background using average and standard deviation of three full chemistry blanks BLK101218, BLK1090119 and BLK2090119 (Table S2) processed in each batch; except for SM05 was background corrected with batch-specific chemistry blank BLK101218, with errors in sample and blank propagated in quadrature. b All SM samples were corrected for inheritance with SM05, a fully shielded cave sample. c Error propagated as , where σa is the error of the measured concentration, and σb is the error of the measured concentration used for the inheritance correction SM05.
4.1 Historical cliff retreat rates
At the St Margaret's site, historical cliff retreat rates that were quantified using DSAS are on average 7 cm yr−1 with an uncertainty of ±4.3 cm yr−1 across the ∼5.5 km of coastline (Fig. 4). The maximum cliff retreat rate was measured as 29 cm yr−1 at St Margaret's, which coincides with locations that have evidence of cliff failure. The historical cliff retreat rates for all three Sussex coast sites, including Seven Sisters, Hope Gap and Beachy Head, were on average 31 cm yr−1, according to Dornbusch et al. (2008), and are an order of magnitude greater than the historical retreat rate at St Margaret's (Table 4).
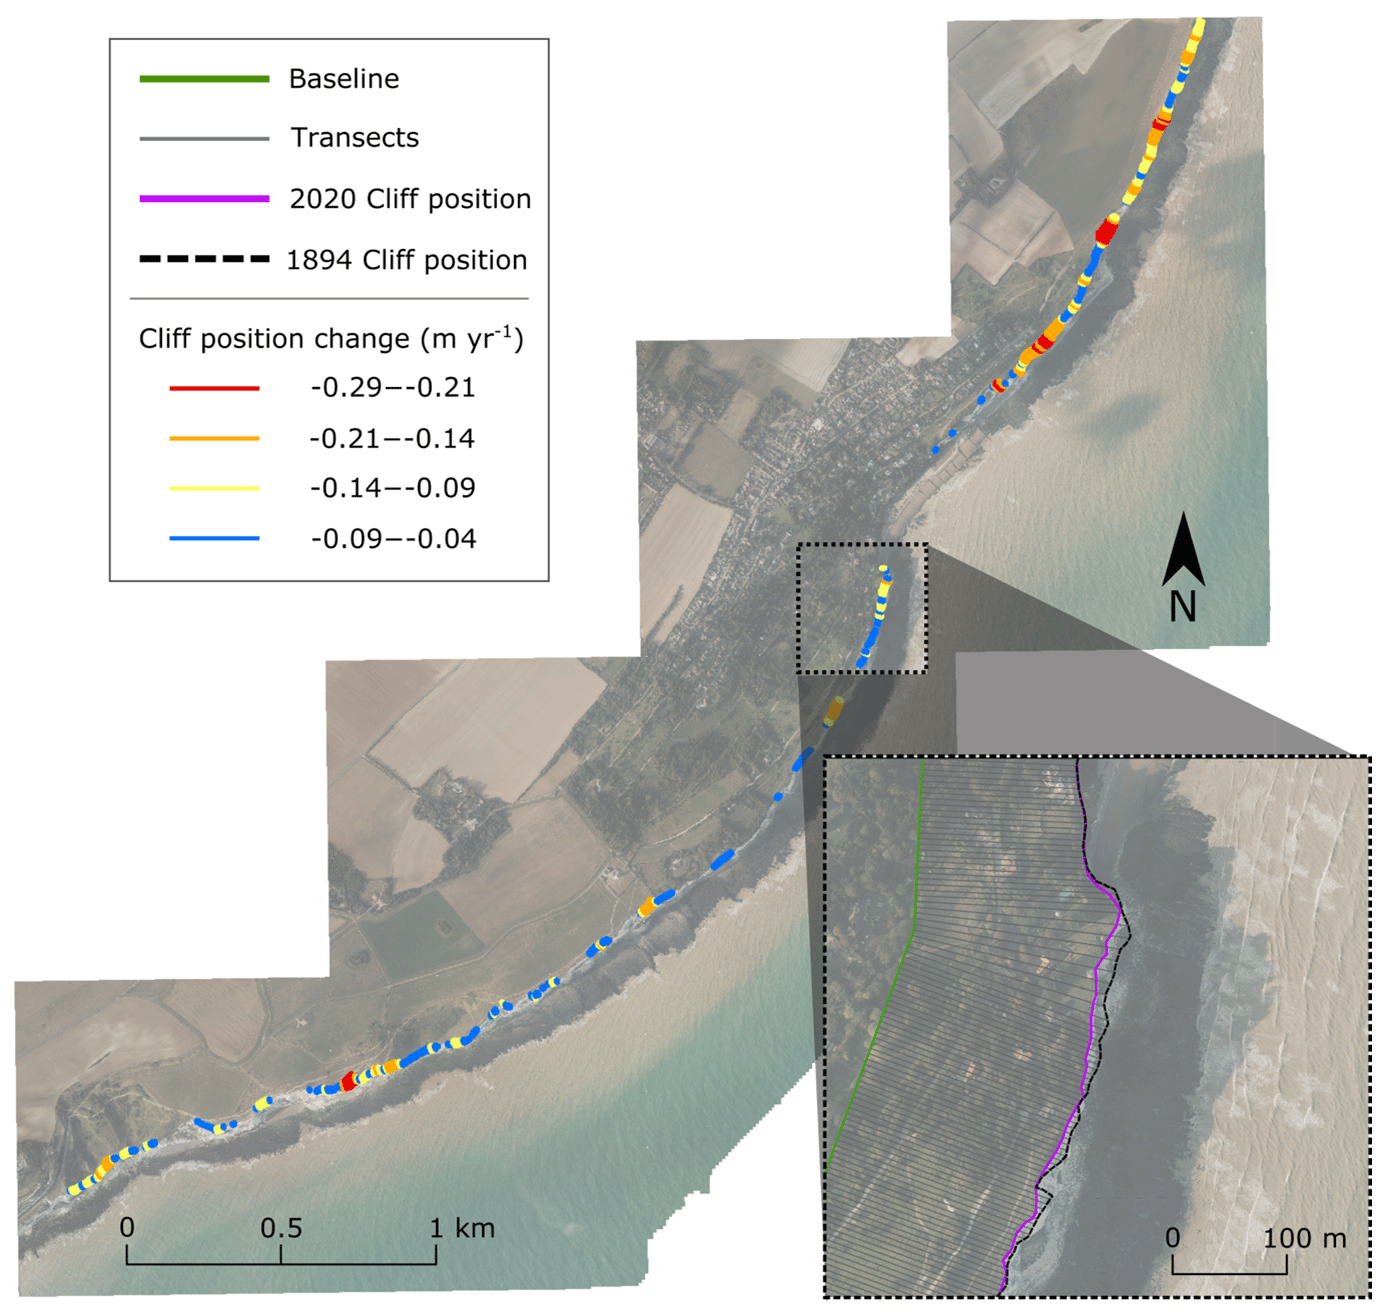
Figure 4Historical cliff retreat rates (change in cliff edge position) over the period 1894–2020 calculated for ∼5.5 km coastline including St Margaret's site using DSAS (Himmelstoss et al., 2018).
Table 4Measured historical cliff retreat rates for Seven Sisters, Hope Gap and Beachy Head (Dornbusch et al., 2008, 2006b). Also using DSAS (Himmelstoss et al., 2018) for St Margaret's. Uncertainty and variability across the ∼5.5 km Kent and East Sussex coastline are also shown.

4.2 Long-term cliff retreat rates
Acceptance ratios of the MCMC chains were between 23 % and 31 %, which ensures chain mixing and that the parameter space was explored within the optimal range (Gelman et al., 1997). Best-fit results of the three free parameters FR, K and y from the 50 %–50 %, topographic 10Be concentration MCMC inversion are shown in Table 5. For the best-fit results for wave height decay rate (y), the slowest wave height decay (0.07 m−1) is found for the St Margaret's and Beachy Head sites. The slowest wave height decay rates will result in greatest wave erosion being distributed across the longest distance across the shore platform. The faster wave height decay rate (i.e. rapid wave energy dissipation), as fast as 0.01 m−1, is found for the Seven Sisters and Hope Gap sites, which results in less wave erosion localised across a shorter distance and closer to where wave breaking is initialised offshore from the cliff, i.e. when wave height water depth. For the best-fit results for material resistance (FR), all sites generally show large uncertainty; however, the exception is for the Seven Sisters site, which shows material resistance must be low (16–127 ) to match the datasets. Results also show that subaerial weathering (K) is active in the long-term evolution of all chalk rock coast sites that were studied with the greatest weathering rates (0.73–4.00 ) calculated at Beachy Head.
Table 5Optimised model parameters from a 50 %–50 % weighted topographic–10Be concentration MCMC inversion. Range of best-fit results expressed as 16 %–84 % confidence intervals calculated from likelihood-weighted accepted parameter posterior distributions.
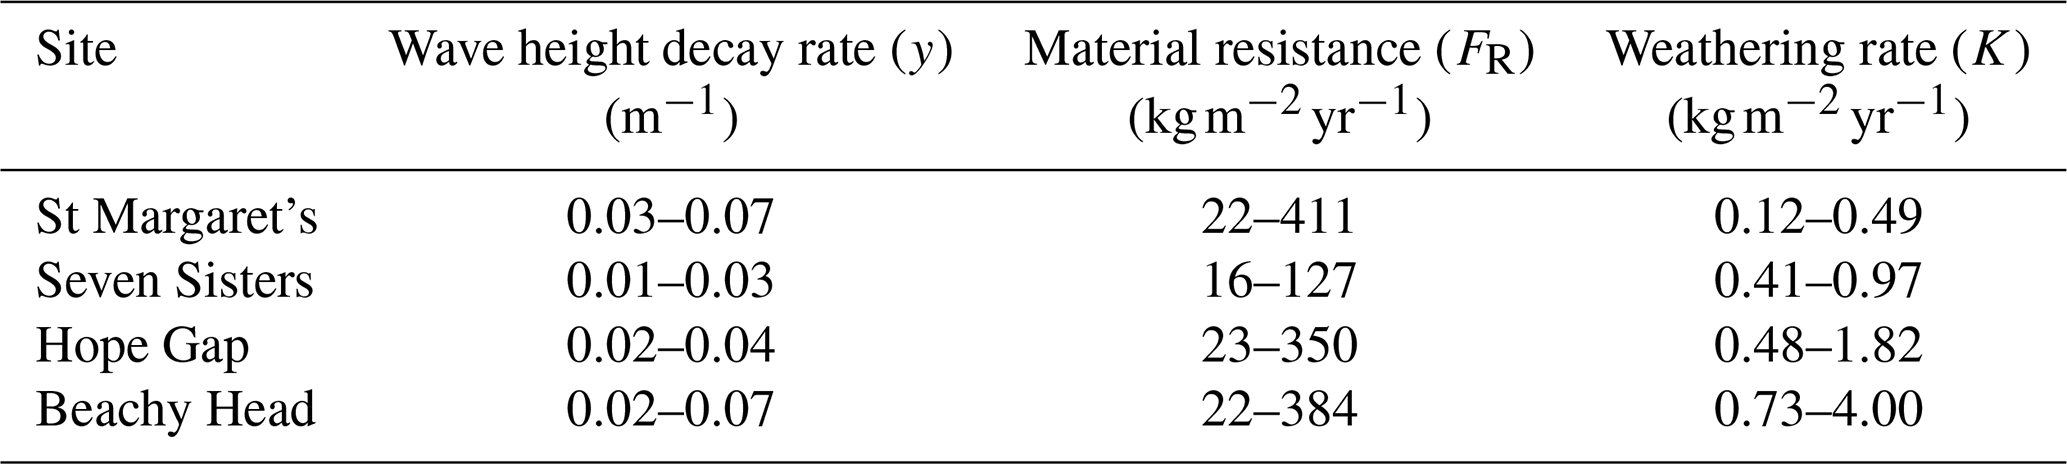
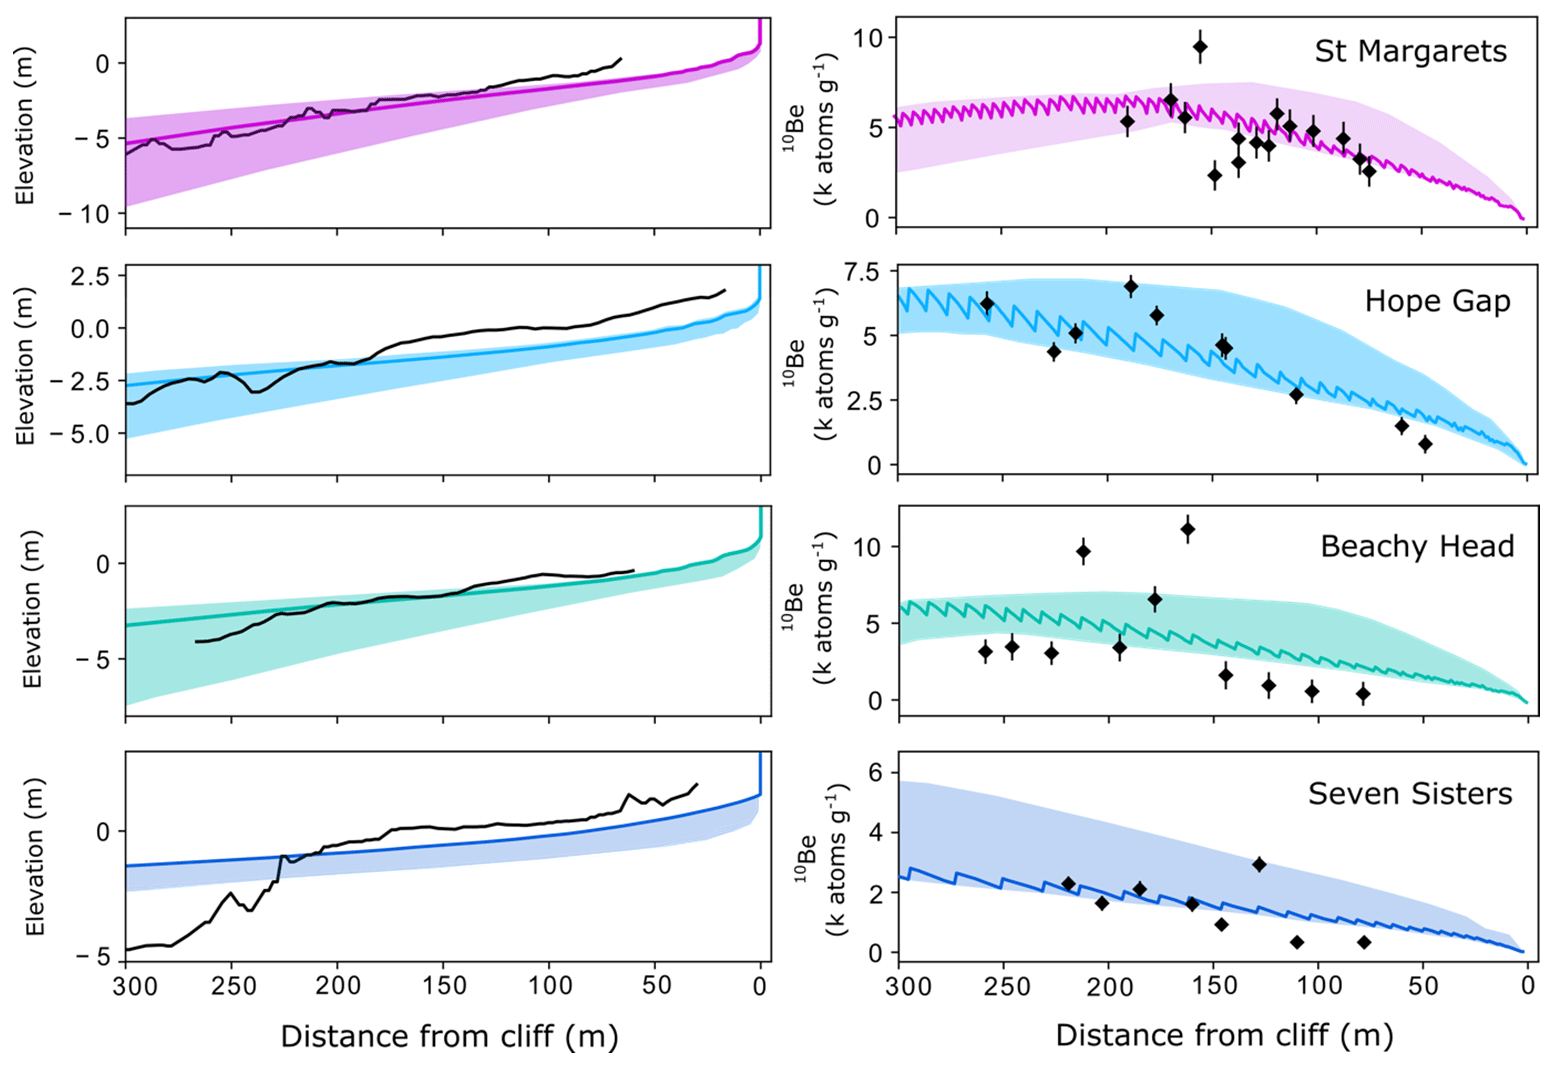
Figure 5Best-fit model results from a 50 %–50 % topographic–10Be concentration weighted MCMC inversion for chalk sites at St Margaret's, Hope Gap, Beachy Head and Seven Sisters. Dark lines show best-fit results, and shaded areas show the confidence interval uncertainty range. The 16 %–84 % confidence interval for each free parameter in the MCMC inversion (FR, K, and y) was simulated against the median results for the other parameters. The shaded uncertainty was constructed from the upper and lower limits of the model outputs. For both the topographic profile and 10Be concentrations, the width of the modern-day, 300 m intertidal shore platform is shown. The modern-day cliff position is at 0 m. The panels on the left side compare the modelled results (coloured) to the measured data (black line) of the topographic profile. The panels on the right side compare the modelled results (coloured) to the measured data (black scatter points) of the 10Be concentration profile. Measured 10Be concentrations plotted here have been corrected for inheritance as described in Sect. 3.3.
Comparisons between the modelled output and measured data are shown using the best-fit results and uncertainty defined by the 50 %–50 % weighted topographic–10Be concentration MCMC results (Fig. 5). These results are shown for the present-day timestamp when time is equal to 0 kyr before present (BP) and the present-day cliff position is at 0 m. The best-fit topographic profiles at St Margaret's and Beachy Head best fit the measured data furthest offshore from the cliff; however, the model output is at a lower elevation than the measured topographic profile further inshore and closer to the cliff base. This mismatch suggests that the gradient of the modelled topographic profile is not as steep as the observed shore platform profile. Most notably, the modelled topographic profiles at the Hope Gap and Seven Sisters sites poorly match the section of the shore platform in the upper-intertidal zone; the modelled elevation is considerably lower than the measured topographic profile in this zone. While the model can replicate the general slope of the platform, it has not been able to capture the topographic step in the shore platform observed at the Hope Gap and Seven Sisters sites. The measured nearshore platform extending from ∼0–200 m from the cliff base is at a higher elevation relative to the general slope of the shore platform with a stepped increase from the offshore platform of ∼5 m at Seven Sisters and ∼2 m at Hope Gap (Fig. 5). The model best-fit results (shown by the solid lines) at these two sites are located at the upper elevation of the model uncertainty. These best-fit results relative to the uncertainty range suggests the model was unable to move into a parameter space in the MCMC inversion to match these elevations while trying to simultaneously match the 10Be concentrations (see Sect. 5.5.2 for discussion).
The best-fit model results for 10Be concentration profiles show the general trends in the 10Be concentration distributions match the measured data. The best match between modelled results and measured 10Be concentration data is for the Hope Gap site. In contrast, at the Beachy Head site, although the modelled 10Be concentration profile replicates the average magnitude in measured 10Be concentrations, the model has not captured the peak in 10Be concentrations (Fig. 5). In fact, the peak in modelled 10Be concentrations at Beachy Head is atoms g−1 lower than the measured 10Be concentration peak. The model also underestimates the peak in 10Be concentrations by atoms g−1 at St Margaret's. Moreover, at St Margaret's, a localised drop in measured 10Be concentrations ∼120–150 m from the cliff base is not captured in the modelled 10Be concentrations. Similar to the topographic results, the 10Be concentrations closest to the cliff base cannot be well matched, especially at the Beachy Head and Seven Sisters sites. Specifically, the model is overestimating the 10Be concentrations by at most atoms g−1 at ∼50–150 m offshore from the cliff, in the upper-intertidal zone at both Beachy Head and Seven Sisters sites. Also similar to the topographic results, the best-fit results are at the lowest limit of the model uncertainty for 10Be concentrations. Best-fit results found at the outer limits of the uncertainty range further suggest that optimisation of the topography and 10Be concentrations occurred in contrasting areas of the parameter space, and, therefore, the model was unable to simultaneously optimise both datasets.
The long-term trend in these new cliff retreat rates calculated from the optimised models across the past 7000 years reflect the trend in the rate of RSL for all four chalk sites (Figs. 2 and 6). For all chalk sites, cliff retreat rates are fastest at 7000 years BP and then decline most rapidly between 7000 and 6000 years BP and then continue to decline gradually to present day. Overall, the slowest cliff retreat rates are calculated for the St Margaret's site where cliff retreat rates decline from 15–35 cm yr−1 at 7000 years BP to 1–3 cm yr−1 at present day. The Hope Gap and Beachy Head sites show similar patterns of cliff retreat rates through time, which decline from 20–55 cm yr−1 at 7000 years BP to 1–5 cm yr−1 at present day. The fastest cliff retreat rates are calculated for the Seven Sisters site where cliff retreat rates of 60–110 cm yr−1 at 7000 years BP were up to approximately 7 times faster than the other chalk sites at 7000 years BP. The cliff retreat rates at Seven Sisters follow the same trend and decline to 4–12 cm yr−1 at present day. The greatest decline in cliff retreat rates is also seen at Seven Sisters where cliff retreat rates declined by as much as 27 times the cliff retreat rate from 7000 years BP to present day.
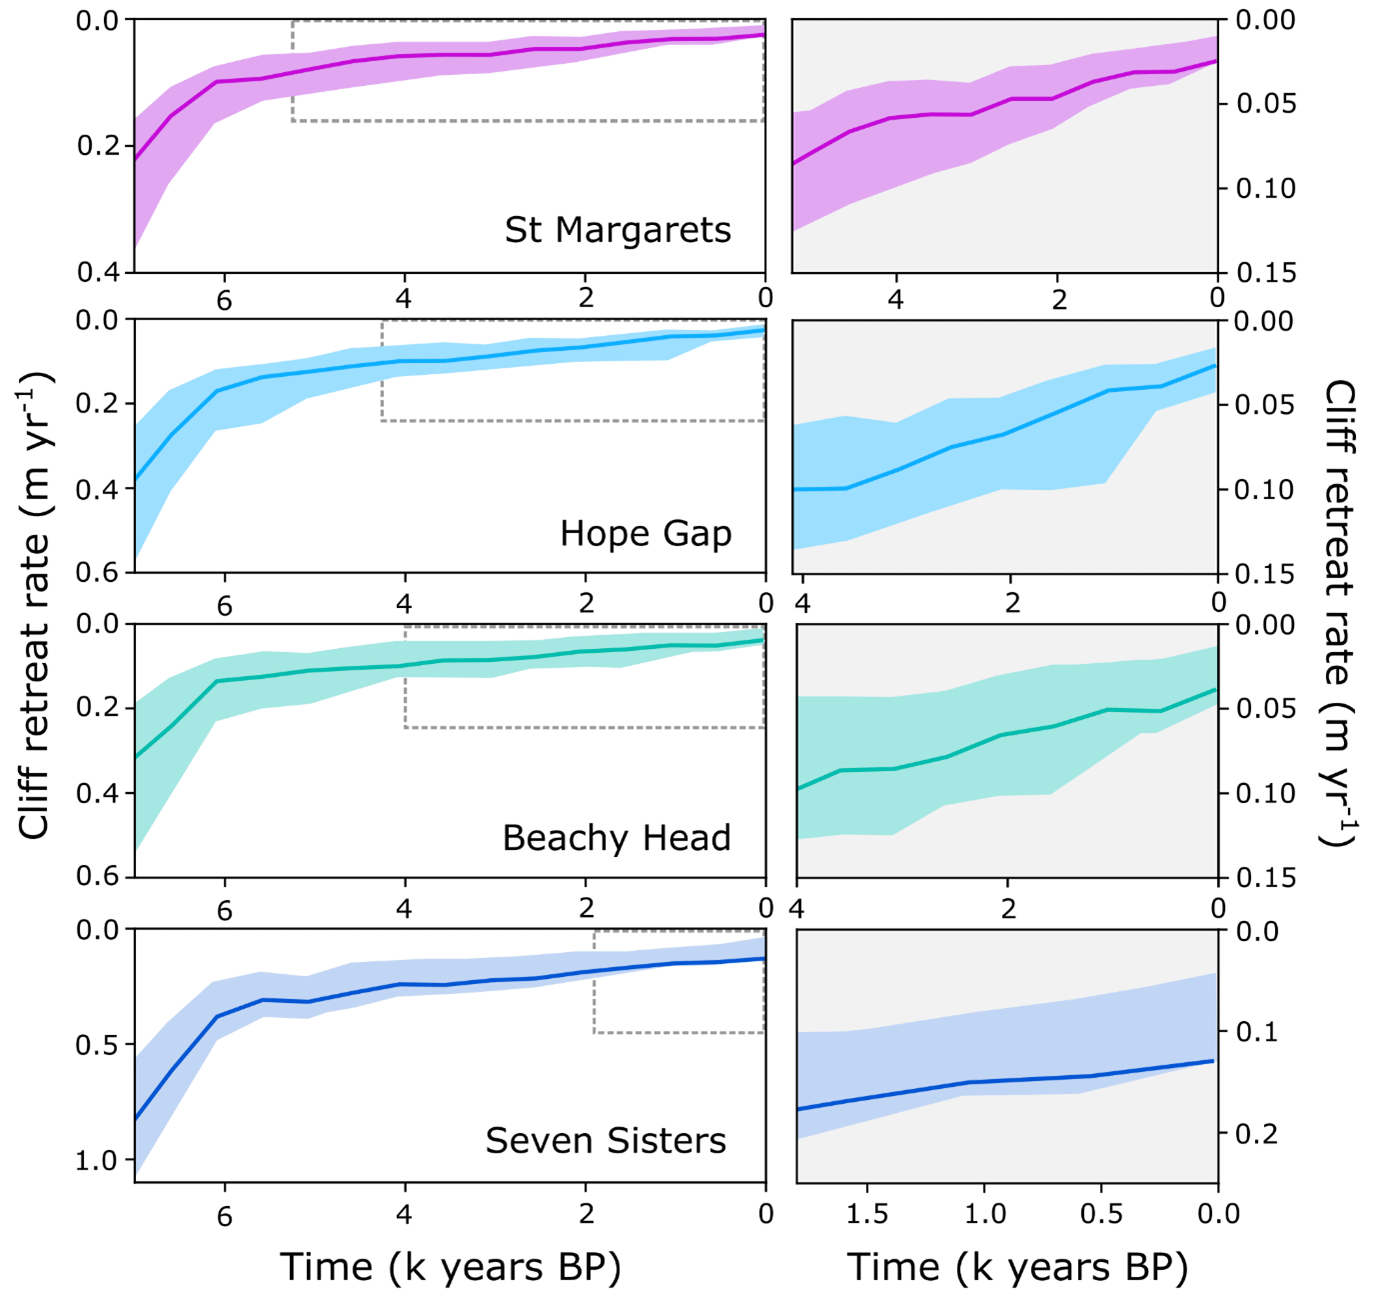
Figure 6Time series of cliff retreat rates (m yr−1) and uncertainty shown by the solid line and shaded area from 7000 years BP to present day. Cliff retreat rates are calculated from modelled cliff positions every 100 years. The time period between 8000 and 7000 years BP is excluded as this corresponds to the burn-in period of the model. The cliff retreat rates highlighted by the dashed-line box are shown at a larger scale on the right and correspond to the distance across the shore platform over which measured data were analysed (∼250 m).
Time stamps of cliff positions were back calculated to estimate the duration of time required to erode the present-day, ∼250 m wide intertidal platform. According to these best-fit MCMC results, the slowest cliff retreat rates at St Margaret's eroded the present-day intertidal platform during the past ∼5300 years. Faster cliff retreat rates modelled at Hope Gap and Beachy Head eroded the present-day intertidal shore platform during the past ∼4100 and ∼4000 years, respectively. The fastest cliff retreat rates modelled at Seven Sisters eroded the present-day intertidal shore platform during the past ∼1800 years. Overall, the low 10Be concentrations and long-term cliff retreat rates at all four of these chalk sites confirm the observed shore platforms at these sites are Holocene features and not reoccupied from a previous interglacial period.
Our results show that long-term cliff retreat rates reflect the rate of RSL rise across the Holocene for all four chalk sites. Comparisons between these model results and historical observations further support previous findings of a recent acceleration in cliff retreat rates at the south coast (Hurst et al., 2016). Our results also reveal contrasting results between chalk and previously studied sandstone sites (Shadrick et al., 2022) regarding the key erosional mechanisms controlling long-term evolution. However, best-fit model results for the chalk sites have inconsistent, and, in some cases, relatively poor fit to the measured data, which contrasts the well-fit model to data comparisons at the sandstone sites (Shadrick et al., 2021). Below, we make comparisons between long-term cliff retreat trends at rock coast sites with differing lithologies using our dynamic model, as well as comparisons between different model results of cliff retreat rates at our same chalk sites. We also discuss what factors are likely to contribute to the contrasting success of the model when applied to different lithologies. Nevertheless, despite these potential limitations, we are still able to use results from our dynamic, process-based model to identify key distinctions in erosion processes active across millennial timescales at coasts with differing lithology.
5.1 Long-term trends in cliff retreat rates
Our model results for the chalk sites are consistent with previous results for two sandstone sites (Bideford and Scalby) and suggest that long-term trends in cliff retreat rate are reflective of the rate of RSL rise (Shadrick et al., 2021). As a result, the model suggests that the fastest rates of cliff retreat for the Late Holocene are found when the rates of RSL are greatest. Due to similar RSL histories for all chalk rock coast sites, the greatest rate of RSL rise during the model simulation time is found at 7000 years BP (Fig. 5). We have excluded the time period between 8000 and 7000 years BP because this interval occurred during the model's burn-in period. For the two sandstone sites previously studied, Bideford and Scalby, best-fit cliff retreat rates were ∼5.2 and ∼14.4 times faster, respectively, at 7000 years BP in comparison to historical rates of cliff retreat (Shadrick et al., 2021). As for the chalk sites, cliff retreat rates were ∼1.2 times faster at Hope Gap, ∼1.4 times faster at Beachy Head, and ∼2.1 times faster at Seven Sisters 7000 years BP in comparison to historical rates of cliff retreat. These results are generally consistent with Trenhaile's (2011) findings, which concluded that a greater proportional increase will be found at historically slower sites in relation to increased rates of RSL rise. However, Trenhaile's (2011) predictions are for future cliff retreat response to projected accelerations in RSL rise and are entirely theoretical with no calibration to measured data. In contrast, here, we have used empirical data to reconstruct how cliff retreat responded in the past when rates of RSL rise were comparable to these future projections.
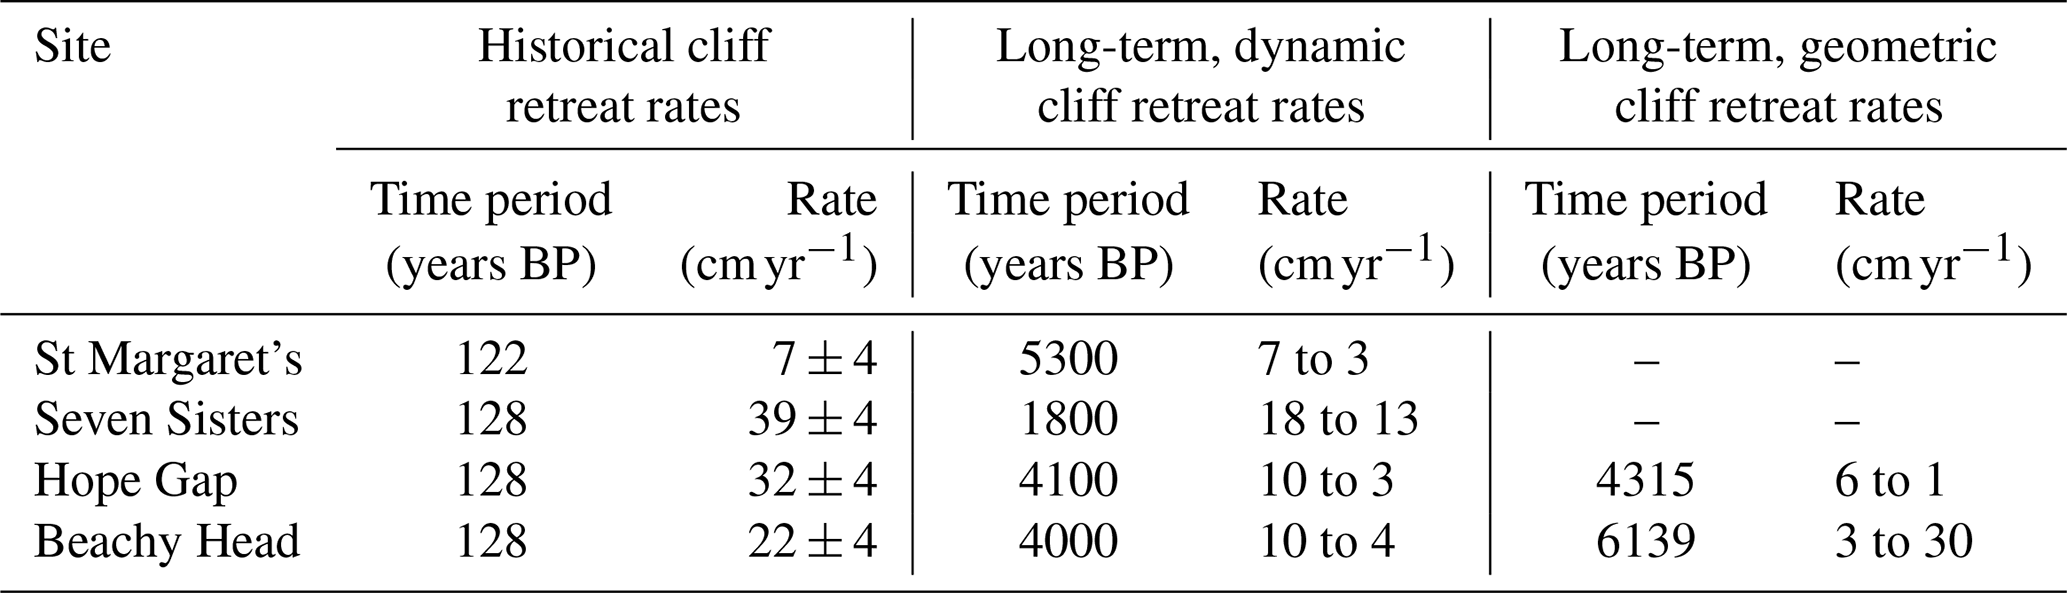
Table 6Comparisons between historical cliff retreat rates and long-term cliff retreat rates derived from both a dynamic model and a geometric model. Note that the decline in long-term transient cliff retreat rates follows the pattern of RSL rise rate, and the long-term steady-state cliff retreat rates are a step change (see Fig. 7).
5.2 Comparisons of long-term to historical cliff retreat rates
Contradictory to the long-term trends in modelled cliff retreat rates that reflect the rate of RSL rise, the discrepancies between long-term modelled and short-term, historically observed cliff retreat rates suggest that RSL does not have the greatest control of cliff retreat rates at these chalk sites. Comparisons between short-term, historically observed cliff retreat rates, long-term retreat rates derived from the dynamic model, and, where available, long-term retreat rates from a geometric model (Hurst et al., 2016) (see Sect. 5.3) are shown (Table 6). Using the steady-state model, previous work by Hurst et al. (2016) identified up to an order of magnitude increase in recent cliff retreat rates compared to long-term, Holocene-average rates at Beachy Head and Hope Gap. This previous work is consistent with our new results from the dynamic model, which suggests that long-term rates of cliff retreat across the Late Holocene are an order of magnitude less than the historical rates quantified by Dornbusch et al. (2008). Furthermore, our antecedent cliff retreat rates quantified using the dynamic model reveal that the historical rates of 22 cm yr−1 at Beachy Head last occurred ∼6400 years BP and historical rates of 32 cm yr−1 at Hope Gap last occurred ∼6800 years BP. The rates of RSL rise during these times of accelerated cliff retreat were 2.2 mm yr−1 at Beachy Head and 2.6 mm yr−1 at Hope Gap, which are approximately 7.3 and 8.7 times faster than the rate of RSL rise experienced during the observational record, respectively. Similarly, observed rates of 39 cm yr−1 at Seven Sisters last occurred ∼6200 years ago when the rate of RSL was 2 mm yr−1, which is 7 times faster than the rate of RSL rise over the observable record. The acceleration in recently observed cliff retreat rates must, therefore, be caused by additional factors other than accelerations in RSL rise (see Sect. 5.5).
Although recent observations of cliff retreat rates at St Margaret's are not as fast as those on the Sussex coast, by using the dynamic model, we calculate these recent rates of cliff retreat (7 cm yr−1) were last experienced at St Margaret's 5300 years BP. At this time, the rate of RSL rise was ∼1.4 mm yr−1, which is nearly 5 times the rate of RSL rise experienced during the past 122 years (0.3 mm yr−1) over which the historical cliff retreat rates were quantified. The slower historical cliff retreat rates calculated at St Margaret's in comparison to the Sussex coast sites could be a result of the harder Lewes Nodular Chalk lithology at St Margaret's, in comparison to the soft, low-density, more densely fractured and high-porosity Seaford Chalk Formation on the Sussex coast (Mortimore et al., 2004b). Furthermore, Dornbusch et al. (2006b) suggest that cliff retreat along the Kent coast is linked to larger-scale erosion events with return periods longer than the observational record. Larger-scale erosion events with longer return periods can, therefore, result in apparent slower retreat rates if a mass erosion event has not occurred within the survey period. In contrast, episodic, large erosion events can also result in apparent faster retreat rates if a mass erosion event has occurred within the survey period relative to the long-term trend in cliff retreat, which requires integration across multiple events to quantify. Return periods that are longer than the observational record again highlight the relatively large uncertainty in short records and the need for cliff retreat rates quantified across millennial timescales (Sunamura, 2015).
5.3 Geometric retreat versus dynamic retreat evolution
Long-term cliff retreat rates were previously quantified for the chalk coasts at the Hope Gap and Beachy Head sites using a geometric coastal evolution model (Hurst et al., 2016). This geometric model was optimised to the same 10Be concentration datasets used here. We next compared the best-fit cliff retreat rates derived for both our new dynamic and the previous geometric model and discuss their key similarities and differences (Fig. 7).
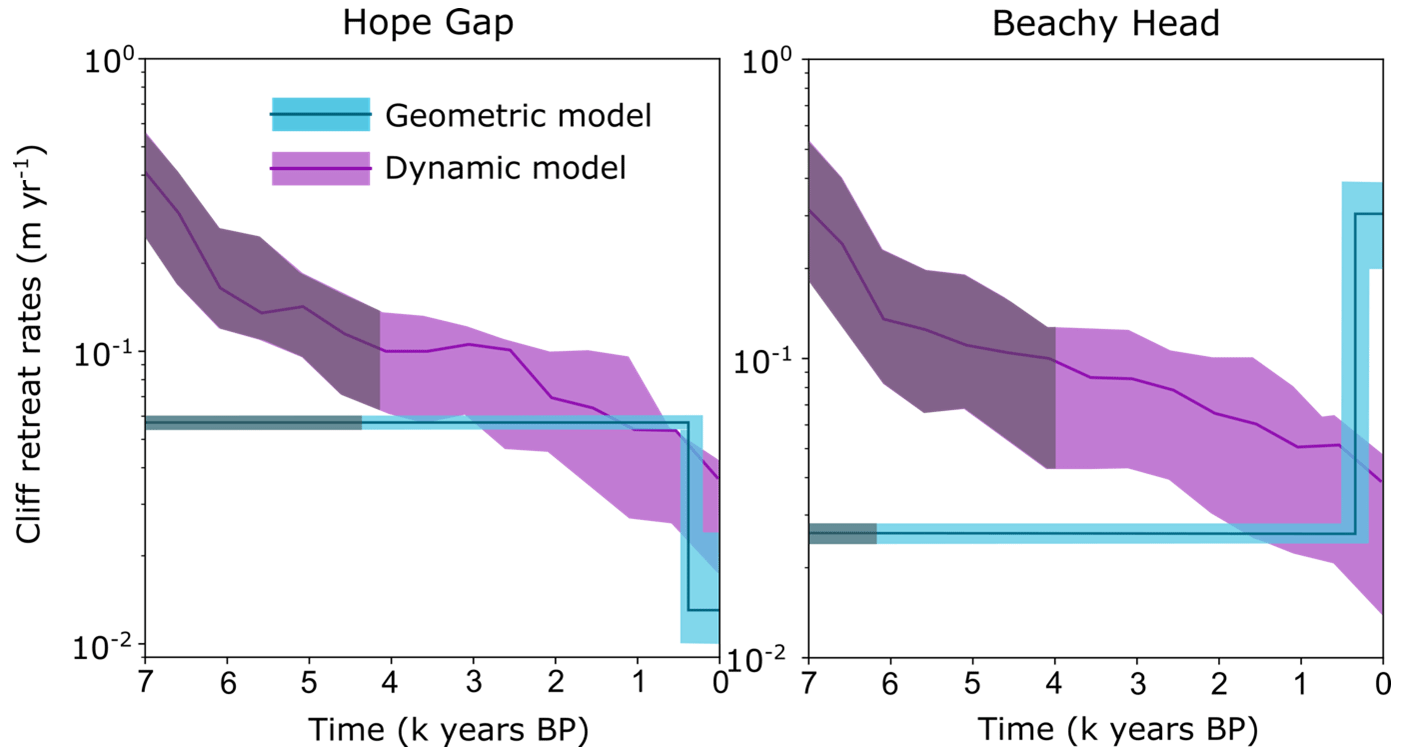
Figure 7Comparisons between cliff retreat rates produced from a dynamic coastal evolution model (Matsumoto et al., 2016), in purple; and a geometric coastal evolution model (Hurst et al., 2016), in blue; for sites Hope Gap and Beachy Head. Cliff retreat rates (m yr−1) are shown for 7000 years BP to present day. The darker shaded regions highlight the time frames that extend beyond the measured data in the past.
At Hope Gap, both the geometric and dynamic models reveal that cliff retreat rates declined during the Holocene, but the trend of decline differs between each model (Fig. 7). The best-fit result from the geometric model finds a step change in cliff retreat rates from 5.7 to 1.3 cm yr−1 at 308 years BP (Hurst et al., 2016). The best-fit results from the dynamic model show a decrease in cliff retreat rates from 10 cm yr−1 4100 years ago to 3 cm yr−1 at present day. Although the geometric model cannot capture transient cliff retreat like the dynamic model, both models show the 250 m intertidal platform at Hope Gap was formed over comparable time frames: ∼4100 years using the dynamic model and ∼4315 years using the geometric model (Fig. 7). Moreover, the present-day cliff retreat rates found by both models are within uncertainty of each other: 1–2.4 cm yr−1 from the steady-state model and 2–4 cm yr−1 using the dynamic model. These comparable results found at Hope Gap validate both models' findings of declining rates of cliff retreat across the Late Holocene. Nevertheless, neither model captures the recent acceleration evidenced with historic observations (see Sect. 5.2).
At Beachy Head, results for the two models do not agree as well. The best-fit result from the geometric model finds a step change in cliff retreat rates with a significant increase in cliff retreat rates from 2.6 to 30.4 cm yr−1 at 293 years ago (Hurst et al., 2016). In contrast, the best-fit results from the dynamic model shows a declining trend in cliff retreat rates. The dynamic model reveals best-fit cliff retreat rates that fall from 10 cm yr−1 at ∼4000 years ago to 4 cm yr−1 at present day. Observed cliff retreat rates for the past 130 years at Beachy Head were previously quantified as 22 cm yr−1 (Dornbusch et al., 2008; Hurst et al., 2016), which agrees with the geometric model's scenario of a step increase in cliff retreat rates to 30.4 cm yr−1 at 293 years ago. This step increase in cliff retreat rates had to be forced in the geometric model to match the low 10Be concentrations <150 m from the cliff. We, however, cannot force changes in cliff retreat rates in the dynamic model because cliff retreat rates are emergent from the topographic evolution that is controlled by physical erosion processes. Moreover, the best-fit 10Be concentration results found for the dynamic model at Beachy Head could not match the inshore low concentrations (Fig. 5; see Sect. 5.5.2 for discussion). This mismatch between measured and modelled 10Be concentrations could support the finding that there was a significant increase in cliff retreat rates in the recent past at Beachy Head that could not be captured by the processes represented in the dynamic model.
5.4 Comparisons between weathering rates and processes at chalk and sandstone rock coasts
Unlike the two previously studied sandstone rock coast sites (Bideford and Scalby; Shadrick et al., 2021), all the chalk sites in this study (St Margaret's, Hope Gap, Beachy Head and Seven Sisters) show well-defined normal posterior distributions for weathering rates (Fig. 8). For all four chalk sites over the 8000-year simulation time, we calculated that if the magnitude of weathering rates fell below approximately material resistance (FR) () (shown by the dashed line in Fig. 8), the material resistance of the rock cells could not be lowered enough by intertidal weathering for waves to erode the rock cells. In other words, when as a fraction of material resistance, intertidal weathering has limited influence on reducing rock cell material resistance and wave erosion is the dominant erosion process. In contrast, for the previous sandstone site at Bideford, zero weathering () had to occur to match both the topographic and 10Be concentration dataset (Shadrick et al., 2021). The 10Be concentrations at the other previous sandstone site at Scalby could be matched with active weathering, hence the spread of accepted K samples above 5−5 (Fig. 8). However, like at Bideford, only with negligible weathering could the 10Be concentrations and topographic data be matched simultaneously at Scalby (Shadrick et al., 2021). For both previous sandstone sites, once weathering rates become negligible (), there is no change to the model output, which results in broad, near-uniform distributions in K to which the model is insensitive (Fig. 8). For all chalk rock coast sites, however, the best-fit results contrast with the sandstone sites and show that active subaerial weathering is needed to match the topographic and 10Be concentration data.
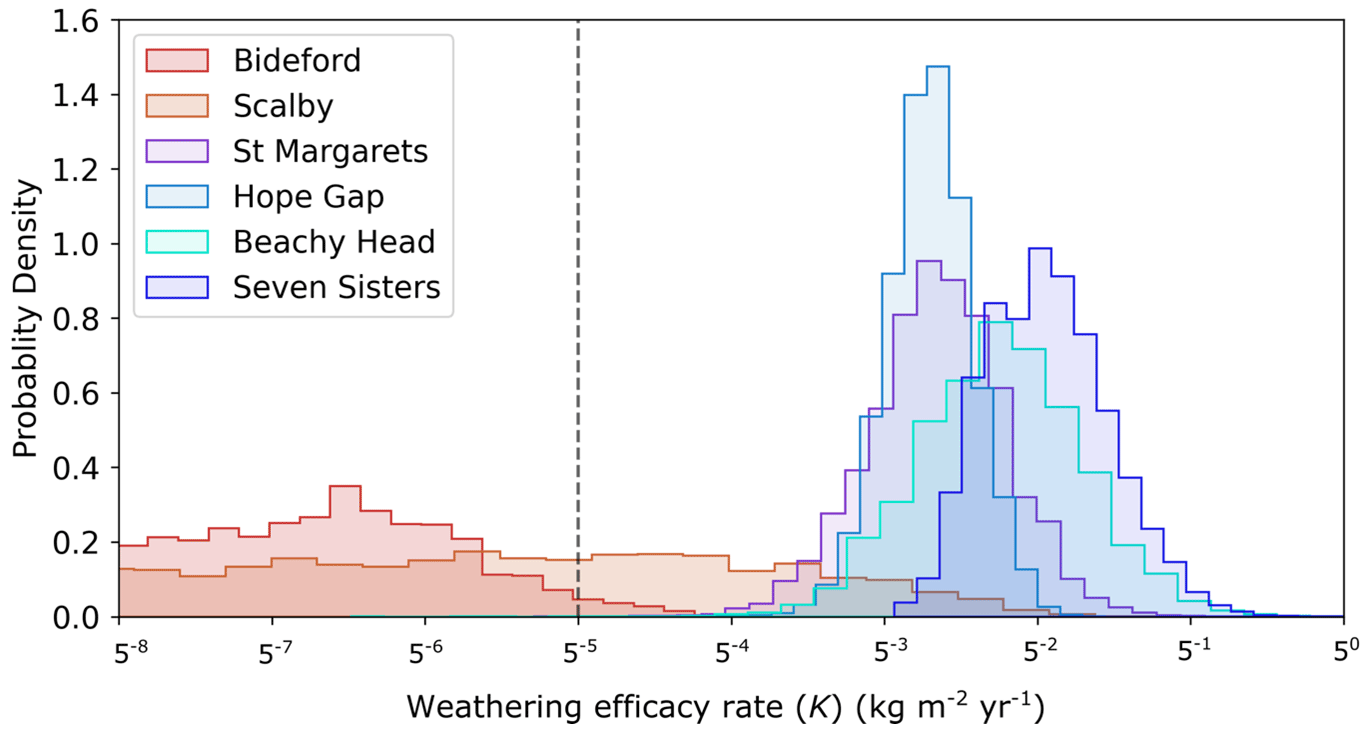
Figure 8Posterior histograms of likelihood-weighted, accepted MCMC weathering efficacy rate (K) samples. Here weathering rate is calculated as FR×K. Red and orange histograms show the results for the two sandstone sites: Bideford and Scalby. Blue, purple and green histograms show the results for the four chalk sites: St. Margaret's, Hope Gap, Beachy Head and Seven Sisters. Above the dashed line (where ) is when weathering is active across the shore platform. Below the dashed line (where ) is when weathering processes are negligible.
Greater weathering rates at chalk rock coasts compared to sandstone rock coast is supported by field measurements of platform downwear using MEMs, laser scanning and structure from motion (SfM). Although not as commonly studied as shore platform downwear rates at chalk lithology coasts, downwear rates of harder lithologies tend to have lower rates compared to softer chalk: for example, downwear rates of 0.25 mm yr−1 were recorded for a sandstone platform (Yuan et al., 2020); 0.242 mm yr−1 for a mudstone and siltstone platform (Porter et al., 2010b); 0.528 mm yr−1 for a mudstone, sandstone and shale platform; and 0.625 mm yr−1 for a greenschist platform (Mottershead, 1989). This is in contrast to overall higher rates of platform downwear measured at chalk sites, for example, average chalk platform erosion rates of 0.791–7.202 mm yr−1 measured across 18 sites (Moses and Robinson, 2011). However, these rates of downwear measured in the field do not exclusively relate to intertidal weathering. In the dynamic coastal evolution model used here, vertical downwear is accounted for by (1) the vertical component of wave assailing force (Stephenson and Kirk, 2000; Trenhaile, 2000; Matsumoto et al., 2016) and (2) intertidal weathering defined by a weathering efficacy function (Porter et al., 2010a; Matsumoto et al., 2016). The down-wearing component of wave erosion follows Stephenson and Kirk (2000) and Trenhaile (2000) and is proportional to the back-wearing force at the still water level, with intensity declining exponentially with water depth (Matsumoto et al., 2016). The weathering efficacy function (Porter et al., 2010a) dictates that maximum weathering occurs at the mean elevation of the lowest high tide and efficacy decreased above and below this elevation (Matsumoto et al., 2016). The implications of the model's representation of subaerial weathering are further discussed in Sect. 5.5.1.
Furthermore, the best-fit results for material resistance for the new chalk sites show wide distributions (Table 5). This wide distribution of best-fit material resistance was also the case for the previous sandstone sites (Shadrick et al., 2021) and is caused by correlation between the free parameters, especially between material resistance and wave height decay rate (Shadrick et al., 2021). Due to the dynamic model's abstract representation of physical rock qualities and erosion processes, these results show that material resistance alone is not sufficient to make distinctions between different lithologies at rock coast sites. Clear distinctions for the weathering rate shown here between the sandstone and chalk sites show that weatherability of the shore platform at the rock coast site is a more significant indicator than the material resistance when assessing long-term platform downwear.
5.5 The representation of near-shore processes
The best-fit results derived from the dynamic model for the chalk sites, particularly seen at sites Hope Gap, Beachy Head and Seven Sisters, have been unable to simultaneously match both the topographic and 10Be datasets. This is in contrast to highly comparable modelled and measured results for the previously studied sandstone sites (Shadrick et al., 2021). These results suggest that additional processes not yet implemented within the model are important in the long-term evolution of chalk rock coasts, which play a comparatively minor role at the sandstone rock sites previously studied. At the Beachy Head site, we suggest that the misfit between observed and modelled 10Be concentrations close to the cliff base is caused by an acceleration in recent cliff retreat rates that could not be captured by the dynamic model (see Sect. 5.3). Similarly, at Seven Sisters, because the dynamic model could also not match the low 10Be concentrations closest to the cliff (Fig. 5), this mismatch could also suggest there was a recent increase in cliff retreat rates at the Seven Sisters site as well. This explanation, however, may not exclusively account for the over-predicted nearshore 10Be concentrations calculated by the model and also may not explain the mismatch in nearshore topography (Fig. 5). Below, we discuss the representation of nearshore processes used in the model, as well as processes overlooked by the model, that may explain the discrepancies between the modelled results and measured data at the chalk sites.
5.5.1 Intertidal weathering and other contributions to platform erosion
Intertidal weathering can be an important precursor for erosion by weakening the substrate so that less energy is required to mobilise rock mass. Tides control the duration and frequency over which different elevations of the shore platform are immersed and exposed by water. Tidally controlled variations in water level mean that the efficacy of weathering in the form of wetting and drying, as well as salt and frost weathering, i.e. processes controlled by cycles of water exposure, varies with elevation across the shore platform (Stephenson and Kirk, 2000; Trenhaile, 2018). Weathering of the shore platform is exclusively considered by the model as tidally controlled weathering processes, which are represented as a weathering efficacy shape function that dictates maximum weathering occurs at the lowest high tide level and decreases above and below this elevation (Porter et al., 2010a; Matsumoto et al., 2016, 2018). This weathering function is based on results from laboratory experiments of wetting and drying and salt weathering (Porter et al., 2010a). However, field results do not match this spatial pattern of weathering efficacy; for example, corresponding MEM field measurements (Porter et al., 2010a) and further comparisons of field-measured downwear rates across various studies (Trenhaile, 2003, 2018) found no significant relationship between platform downwear and elevation in relation to tides. In the field, platform downwear is also influenced by frost, abrasion, bioerosion and rock surface swelling, which all have variable efficacies in relation to elevation that may explain differences found between the laboratory and field results (Trenhaile, 2018; Porter et al., 2010a). Studies on the south coast of the UK all found greatest downwear on chalk platforms to be at the top of the platform in the zone of beach-supplied abrasion (Ellis, 1986; Andrews, 2001; Foote et al., 2006). The influence of beach material on shore platform erosion is discussed in the following section (see Sect. 5.5.2).
It is suggested that intertidal weathering mainly dictates platform downwear where abrasive material and bioerosion are absent (Trenhaile, 2018). This cannot be said for the chalk shore platforms studied here because there is evidence of abrasive beach material and biological activity. Both abrasion and bioerosion are not included in the coastal evolution model used here. Abrasion of the shore platform surface is especially efficient when beach material is harder than the bedrock it is eroding (Costa et al., 2006; Robinson, 2020). Because this relative hardness is the case between flint gravel beaches and chalk shore platforms at our south coast sites, abrasion from beach material is likely to contribute to considerable platform downwear and is discussed in the following section (see Sect. 5.5.2). Offshore from the abrasion zone, it is thought that bioerosion, e.g. changing pool chemistry, weakening fractures in rocks, and boring into the platform surface (Naylor et al., 2012; Trenhaile, 2018), may even dominate shore platform erosion (Foote et al., 2006; Henaff et al., 2006; Robinson, 2020). Because bioerosion is so spatially varied, however, the overall contribution to platform downwear remains uncertain, especially in non-tropical environments and in the subtidal/submarine zone (Trenhaile, 2018). Future research into the distribution of species in the intertidal zone on chalk platforms may help to shed light on bioerosion-controlled downwear at these sites.
Our modelling results and relevant literature suggest that our dynamic model's representation of platform downwear, which is controlled principally by a single function describing intertidal weathering in the model, may not be the most appropriate mechanism of platform downwear for these chalk coast sites. Nevertheless, clear differences between best-fit modelled weathering rates at chalk and sandstone sites (Fig. 8) reveal that long-term platform downwear occurred at much faster rates at the chalk sites. More work is needed to establish which specific processes are more dominant at the chalk sites in order to result in greater platform downwear.
5.5.2 Beach material and cliff debris
Beach material and cliff debris have the potential to both enhance and limit erosion of the shore platform and cliff base (Sunamura, 1982; Limber and Murray, 2011). Evidence of beaches that enhance erosion includes field studies that have measured downwear with MEMs on chalk platforms; these field studies have consistently found greatest downwear to occur at top of the platform where abrasion from beach material occurs (Ellis, 1986; Andrews, 2001; Foote et al., 2006; Moses and Robinson, 2011). Furthermore, a regional assessment of cliff retreat in California found that cliffs fronted by beaches retreated nearly 50 % further than cliffs without beaches (Young, 2018). In contrast, beaches and fallen cliff debris can also act to dissipate wave energy that reduces platform downwear and wave impact at the cliff base, which slows cliff retreat (Sunamura, 1992; Walkden and Hall, 2005). These contrasting impacts on erosion as a result of beach material make it difficult to understand their role in long-term rock coast development.
The coastal evolution model used here (Matsumoto et al., 2016) does not consider the impact of beach material on cliff retreat rates. The combination of across-shore and along-shore processes involved with transport of beach material and limited data on long-term beach evolution has meant that the role of beaches in the long-term evolution of rock coasts remains uncertain and understudied (Naylor et al., 2014; Hurst et al., 2016). As a result, only a select number of modelling studies have investigated interactions between rock coast evolution and beach dynamics. A beach profile was incorporated into the Soft Cliff And Platform Erosion (SCAPE) model as exclusively a protective feature (Walkden and Hall, 2005). Beach protection of the upper intertidal platform, and resultant decreased cliff retreat, is countered with the presence of beach material steepening the rock shore platform, which makes the shore platform and cliff more vulnerable to erosion (Walkden and Hall, 2005). Both the abrasive and protective roles of beaches were incorporated into the Limber and Murray (2011) model, in which cliff retreat increases with active abrasion and cliff retreat decreases with either limited beach sediment that prevents abrasion or too much sediment that prevents wave erosion.
At our chalk sites, there is evidence of beach thinning across the Holocene (Dornbusch et al., 2006a, 2008). It has also been suggested that beach thinning has contributed to the recent accelerations in cliff retreat rates due to diminished protection and abrasive material (Dornbusch et al., 2008; Hurst et al., 2016). Thicker and wider beaches in the past are likely to have played a protective role and dampened wave erosion and slowed cliff retreat rates at these south coast chalk sites. Although widely variable spatially and temporally, Dornbusch et al. (2008) suggested that past average beach widths of ∼37 m were unable to protect the cliff from erosion and that average beach widths need to exceed ∼70 m to entirely prevent wave erosion, including from storm waves, at the cliff. With observed beach widths <37 and >70 m at local scale, protection and abrasion must be varied spatially across the south coast chalk cliffs. Due to our limited current knowledge, we are unable to quantify at what time, on average, flint beaches along south coast chalk cliffs crossed the threshold from a protective feature to an abrasive one. Our work highlights the importance of beach material at rock coast sites and that we need to better understand feedbacks between beach dynamics, wave erosion and cliff failure.
Although not modelled here, incorporation of beach material into the rock coast system will consistently lower the modelled 10Be concentrations. The presence of beach material lowers 10Be concentrations by (1) shielding the platform from cosmic rays, which prevents production in the shore platform (Regard et al., 2012; Hurst et al., 2017) and (2) abrading and removing the surficial layers of rock with the highest 10Be concentrations to expose rock with lower concentrations beneath. Hurst et al. (2017) found that beach widths must be >50 m to lower concentrations significantly (by >15 %). Because beach cover has not been incorporated within our dynamic model simulations, our model results may be overestimating long-term cliff retreat rates because we model low concentrations to indicate fast cliff retreat rates without the influence of beaches (Regard et al., 2012; Hurst et al., 2016, 2017). However, accounting for the influence of beaches would make long-term cliff retreat rates slower than our estimations and, in turn, the recent acceleration seen in historical cliff retreat rates even greater (Hurst et al., 2016).
Furthermore, because beach presence lowers CRN concentrations, the low 10Be concentrations measured nearest the beach at Beachy Head and Seven Sisters could be caused by beach cover, recent cliff retreat accelerations, or a combination of the two. At Beachy Head, the nearshore concentrations are ∼39 %–74 % lower than the best-fit model predictions (Fig. 4). Similarly, at Seven Sisters, nearshore concentrations are ∼57 %–84 % lower than the best-fit model predictions. According to Hurst et al. (2017), the beach width would need to exceed ∼100 m for at least the past 600 years for model predictions to align with the measured data at Beachy Head and Seven Sisters. Observed beach widths are 15–73 m at these four south coast sites; therefore, even with thicker and wider beaches in the past (Dornbusch et al., 2006a, 2008), it is unlikely for overestimations in nearshore concentrations to be exclusively as a result of shielding from beach material or cliff debris. Furthermore, even the most massive cliff falls (>10 0003) can transport material away in a number of decades (Mortimore et al., 2004a; Moses and Robinson, 2011). Observed beach widths and transportation time of fallen cliff debris further support the scenario of a recent acceleration in cliff retreat rates, which may be responsible for the low 10Be concentrations that the dynamic model outputs are unable to fit at Seven Sisters and Beachy Head. Nevertheless, beach thinning and resultant increased abrasion has the potential to enhance cliff retreat rate and contribute to such an acceleration that would account for the low 10Be concentrations (Limber and Murray, 2011).
5.5.3 Shore platform stepped topography
At Hope Gap (see Fig. 5), there is a notable step in the topography at a distance of ∼180 m from the modern cliff. The next samples offshore from this location (200–250 m from the cliff) were sampled from lower elevations and have a lower concentration. These steps found at the south coast chalk platforms are caused by heterogeneous beds of chalk and flint that vary in thickness and material strength (Moses and Robinson, 2011). However, the model's implementation of lithology assumes homogenous material resistance across the shore platform and cliff with no consideration of stratigraphic layers (Matsumoto et al., 2016). Unlike at the previously studied sandstone sites (Shadrick et al., 2021), observed local variations in lithology have greater control on the shore platform meso-morphology at these chalk coasts sites, and this variation has not yet been incorporated into our dynamic model optimisation. Such developments might also help to better match the relatively high concentrations at St. Margaret's and Beachy Head, which might reflect limited surface lowering locally. Future work should aim to include heterogeneous material resistance into the model to better replicate the topographic steps and associated processes, such as step backwearing, at these chalk sites.
In this study, we have quantified transient, long-term cliff retreat rates across the Late Holocene for four chalk rock coast sites in the south of England. We have achieved this through multi-objective optimisation of a process-based coastal evolution model to measured topographic and 10Be CRN concentration data. An improved understanding of how cliff retreat rates responded to past changes in RSL helps to inform models that forecast cliff retreat rate response to climate-change-driven accelerations in RSL rise.
We have compared millennial-scale cliff retreat rates quantified by a previous steady-state equilibrium coastal evolution model (Hurst et al., 2016) to rates derived from our new transient, process-based coastal evolution model (Matsumoto et al., 2016) for two sites on the Sussex coastline at Hope Gap and Beachy Head. Our results provide further support for previous findings of a significant recent acceleration in cliff retreat rates compared to the long-term rates quantified for the Late Holocene at the Sussex coastline (Hurst et al., 2016). Measured historical rates of cliff retreat during the past ∼130 years range from 22–40 cm yr−1 for the three Sussex coast sites (Dornbusch et al., 2008). However, our model results optimised to 10Be concentration and topographic data suggest cliff retreat rates during the past ∼2000 years were 6–18 cm yr−1 across these three Sussex coast sites. This is consistent with another recent study that has suggested recent acceleration in cliff retreat rates based on 10Be concentrations measured on chalk shore platforms (including sub-tidal measurements) on the French coast of the English Channel at Mesnil-Val (Duguet et al., 2021). Long-term cliff retreat rates for these sites also track the rate of RSL across the Holocene, which is similar to results found for two previously studied sandstone sites in the UK (Shadrick et al., 2022). However, the recent acceleration in cliff retreat rates evidenced by historical observations suggests that the rate of RSL rise is not necessarily the greatest control on cliff retreat rates at our chalk rock coast sites. Optimised results from the process-based model suggest the observed cliff retreat rates quantified for the past ∼150 years at the south coast chalk sites (Dornbusch et al., 2008) were last experienced between 5300 and 6800 years ago when the rate of relative sea-level rise was 5–8.7 times greater than the rate of RSL experienced during the observational record. Model results suggest that cliff retreat rates were as much as 110 cm yr−1 when the rate of RSL rise was 2.6 mm yr−1 at the Seven Sisters site 7000 years BP. For other chalk sites that we studied, including Hope Gap, Beachy Head and St Margaret's, when the rate of RSL was 2.6 mm yr−1 7000 years BP, cliff retreat rates ranged from 15 to 55 cm yr−1.
It is important to understand the long-term processes acting at shore platforms because these landforms play a critical role in mediating cliff erosion. The application of a process-based model used here has identified contrasting results for relative intertidal weathering rates across shore platforms between relatively strong sandstone and relatively weak chalk rock types. The optimised model results suggest that the rate of intertidal weathering was ∼2–3 orders of magnitude greater at the chalk sites compared to the sandstone rock coast sites. However, at sandstone sites, optimised results suggest that negligible subaerial weathering had to occur to match the measured data, whereas, at all chalk sites that we studied, active subaerial weathering was required to match the measured topography and 10Be concentrations. Furthermore, our results found no significant differences between best-fit material resistances for the sandstone and chalk sites. This indicates that it is not only the material strength of the lithology but also how weatherable the material is that is important in the long-term evolution of rock coast sites.
Comparisons between modelled results and measured data also suggest heterogeneous lithologic resistance and beach presence play an important role in the control of shore platform morphology, resultant 10Be concentrations and, as a result, the long-term evolution of chalk rock coasts. These results particularly illustrate the importance for future work to consider the role of beaches to ensure long-term cliff retreat rates are not overestimated from 10Be concentrations.
Nevertheless, results provided here have advanced the understanding of the long-term drivers of rock coasts in different lithological settings, particularly intertidal weathering and beach material. Using a process-based coastal evolution model to interpret 10Be concentrations has allowed us to not only quantify long-term transient cliff retreat rates, but also to help inform the “wave versus weathering” debate across millennial timescales. This is one of the first applications of a process-based model used to interpret 10Be CRN concentrations, which has, in turn, identified contrasts in prevailing long-term erosional mechanisms at coasts with different lithologies. Our findings highlight strong potential in our methodology to quantify long-term drivers of rock coast erosion at a variety of real-world sites. Quantifying cliff retreat rates and key erosion mechanisms across millennial timescales is especially important for rock coasts vulnerable to climate change, such as the UK chalk south coast.
Input datasets can be found in the Supplement. Input data files, plotting scripts, code and documentation can be found at https://doi.org/10.5281/zenodo.5645478 (Hurst et al., 2021).
The supplement related to this article is available online at: https://doi.org/10.5194/esurf-11-429-2023-supplement.
JRS, MDH, MDP and DHR designed the research and analysed the data; JRS, DHR, MDH and KMW collected measured datasets; DHR, JRS and AJS prepared samples in the laboratory; JRS developed the optimisation routine with support from MDH and MDP; KMW performed AMS measurements; JRS, MDH, DHR and MDP wrote the paper.
The contact author has declared that none of the authors has any competing interests.
Publisher's note: Copernicus Publications remains neutral with regard to jurisdictional claims in published maps and institutional affiliations.
We thank Michael Ellis for general and ongoing support with the project and editorial assistance. We also thank Sarah Bradley for providing RSL history data, which is an essential component to this project. We would like to thank Emily Gusterson and Jay Ward for support with field data collection. Finally, we would like to thank the reviewers, whose comments have greatly strengthened this paper.
This work was supported by a studentship from the Natural Environment Research Council (NERC) Science and Solutions for a Changing Planet Doctoral Training Partnership (DTP), with additional funding by the British Geological Survey (BGS) to Jennifer R. Shadrick. Dylan H. Rood received support of ANSTO Research Portal (grant no. 10955).
This paper was edited by Veerle Vanacker and reviewed by Nathan Vandermaelen and Anne Duperret.
Adams, B. M., Eldred, M. S., Geraci, G., Hooper, R. W., Jakeman, J. D., Maupin, K. A., Monschke, J. A., Rushdi, A. A., Stephens, J. A., Swiler, L. P., Wildey, T. M., Bohnhoff, W. J., Dalbey, K. R., and Ebeida, M. S.: Dakota, A Multilevel Parallel Object-Oriented Framework for Design Optimization, Parameter Estimation, Uncertainty Quantification, and Sensitivity Analysis: Version 6.10 User's Manual, Sandia National Laboratories [software], SAND2014-4633, https://dakota.sandia.gov/content/manuals (last access: 23 April 2023), 2019.
Andrews, C. E.: The measurement of the erosion of the chalk shore platform of East Sussex, the effect of coastal defence structures and the efficacy of macro scale bioerosive agents, PhD thesis, University of Sussex, https://ethos.bl.uk/OrderDetails.do?uin=uk.bl.ethos.340824 (last access: 23 April 2023), 2001.
Barlow, J., Gilham, J., and Ibarra Cofrã, I.: Kinematic analysis of sea cliff stability using UAV photogrammetry, Int. J. Remote Sens., 38, 2464–2479, https://doi.org/10.1080/01431161.2016.1275061, 2017.
Bradley, S. L., Milne, G. A., Shennan, I., and Edwards, R.: An improved glacial isostatic adjustment model for the British Isles, J. Quaternary Sci., 26, 541–552, https://doi.org/10.1002/jqs.1481, 2011.
Braucher, R., Bourlès, D., Merchel, S., Vidal Romani, J., Fernadez-Mosquera, D., Marti, K., Léanni, L., Chauvet, F., Arnold, M., Aumaître, G., and Keddadouche, K.: Determination of muon attenuation lengths in depth profiles from in situ produced cosmogenic nuclides, Nucl. Instrum. Meth. Phys. Res. B, 294, 484–490, https://doi.org/10.1016/j.nimb.2012.05.023, 2013.
Buchanan, D. H., Naylor, L. A., Hurst, M. D., and Stephenson, W. J.: Erosion of rocky shore platforms by block detachment from layered stratigraphy, Earth Surf. Proc. Land., 45, 1028–1037, https://doi.org/10.1002/esp.4797, 2020.
Channel Coastal Observatory: https://coastalmonitoring.org/cco/, last access: 1 December 2021.
Choi, K. H., Seong, Y. B., Jung, P. M., and Lee, S. Y.: Using Cosmogenic 10Be Dating to Unravel the Antiquity of a Rocky Shore Platform on the West Coast of Korea, J. Coastal Res., 28, 641–657, https://doi.org/10.2112/JCOASTRES-D-11-00087.1, 2012.
Corbett, L. B., Bierman, P. R., and Rood, D. H.: An approach for optimizing in situ cosmogenic 10Be sample preparation, Quat. Geochronol., 33, 24–34, https://doi.org/10.1016/j.quageo.2016.02.001, 2016.
Costa, S., Lageat, Y., and Hénaff, A.: The gravel beaches of north-west France and their contribution to the dynamic of the coastal cliff-shore platform system, Ann. Geomorphol. 144, 199–214, 2006.
Dickson, M. E.: Shore platform development around Lord Howe Island, southwest Pacific, Geomorphology, 76, 295–315, https://doi.org/10.1016/j.geomorph.2005.11.009, 2006.
Digimap: https://digimap.edina.ac.uk/, last access: 1 December 2021.
Dornbusch, U. and Robinson, D. A.: Block removal and step backwearing as erosion processes on rock shore platforms: a preliminary case study of the chalk shore platforms of south-east England, Earth Surf. Proc. Land., 36, 661–671, https://doi.org/10.1002/esp.2086, 2011.
Dornbusch, U., Robinson, D. A., Moses, C. M., and Williams, R. B. G.: Chalk coast erosion and its contribution to the shingle budget in East Sussex, Zeitschrift fur Geomorphologie, Supplementband, 144, 215–230, 2006a.
Dornbusch, U., Robinson, D. A., Moses, C., Williams, R., and Costa, S.: Retreat of Chalk cliffs in the eastern English Channel during the last century, J. Maps, 2, 71–78, https://doi.org/10.4113/jom.2006.46, 2006b.
Dornbusch, U., Robinson, D. A., Moses, C. A., and Williams, R. B. G.: Temporal and spatial variations of chalk cliff retreat in East Sussex, 1873 to 2001, Mar. Geol., 249, 271–282, https://doi.org/10.1016/j.margeo.2007.12.005, 2008.
Duguet, T., Duperret, A., Costa, S., Regard, V., and Maillet, G.: Coastal chalk cliff retreat rates during the Holocene, inferred from submarine platform morphology and cosmogenic exposure along the Normandy coast (NW France), Mar. Geol., 433, 106405, https://doi.org/10.1016/j.margeo.2020.106405, 2021.
Duperret, A., Genter, A., Martinez, A., and Mortimore, R. N.: Coastal chalk cliff instability in NW France: role of lithology, fracture pattern and rainfall, Geol. Soc. Lond. Eng. Geol. Spec. Publ., 20, 33–55, https://doi.org/10.1144/GSL.ENG.2004.020.01.03, 2004.
Duperret, A., Taibi, S., Mortimore, R. N., and Daigneault, M.: Effect of groundwater and sea weathering cycles on the strength of chalk rock from unstable coastal cliffs of NW France, Eng. Geol., 78, 321–343, https://doi.org/10.1016/j.enggeo.2005.01.004, 2005.
Earlie, C., Masselink, G., and Russell, P.: The role of beach morphology on coastal cliff erosion under extreme waves, Earth Surf. Proc. Land., 43, 1213–1228, https://doi.org/10.1002/esp.4308, 2018.
Ellis, N.: Morphology, process and rates of denudation on the chalk shore platform of East Sussex, PhD thesis, Brighton Polytechnic, https://ethos.bl.uk/OrderDetails.do?uin=uk.bl.ethos.372983 (last access: 23 April 2023), 1986.
Estacio-Hiroms, K. C., Prudencio, E. E., Malaya, N. P., Vohra, M., and McDougall, D.: The QUESO Library, User's Manual, arXiv [preprint], https://doi.org/10.48550/arXiv.1611.07521, 2016.
Foote, Y., Plessis, E., Robinson, D., Hénaff, A., and Costa, S.: Rates and patterns of downwearing of chalk shore platforms of the Channel: comparisons between France and England, Ann. Geomorphol., 144, 93–115, 2006.
Gelman, A., Gilks, W. R., and Roberts, G. O.: Weak convergence and optimal scaling of random walk Metropolis algorithms, Ann. Appl. Probab., 7, 110–120, https://doi.org/10.1214/aoap/1034625254, 1997.
Gilham, J., Barlow, J., and Moore, R.: Detection and analysis of mass wasting events in chalk sea cliffs using UAV photogrammetry, Eng. Geol., 250, 101–112, https://doi.org/10.1016/j.enggeo.2019.01.013, 2019.
Gosse, J. C. and Phillips, F. M.: Terrestrial in situ cosmogenic nuclides: theory and application, Quaternary Sci. Rev., 20, 1475–1560, https://doi.org/10.1016/S0277-3791(00)00171-2, 2001.
Henaff, A., Lageat, Y., and Costa, S.: Geomorphology and shaping of Chalk shore platforms of the Channel coasts, Z. Geomorphol., 61, 144–146, 2006.
Himmelstoss, E. A., Henderson, R. E., Kratzmann, M. G., and Farris, A. S.: Digital Shoreline Analysis System (DSAS) version 5.0 user guide, U. S. Geological Survey, Reston, VA, https://doi.org/10.3133/ofr20181179, 2018.
Hoek, E. and Brown, E. T.: Practical estimates of rock mass strength, Int. J. Rock Mech. Min., 34, 1165–1186, https://doi.org/10.1016/S1365-1609(97)80069-X, 1997.
Hurst, M., Matsumoto, H., Shadrick, J. R., Rood, D. H., and Dickson, M. E.: mdhurst1/Rocky-Profile-Model: RPM-CRN with Dakota Implementation v1.0, Zenodo [code], https://doi.org/10.5281/zenodo.5645478, 2021.
Hurst, M. D., Rood, D. H., Ellis, M. A., Anderson, R. S., and Dornbusch, U.: Recent acceleration in coastal cliff retreat rates on the south coast of Great Britain, P. Natl. Acad. Sci. USA, 113, 13336–13341, https://doi.org/10.1073/pnas.1613044113, 2016.
Hurst, M. D., Rood, D. H., and Ellis, M. A.: Controls on the distribution of cosmogenic 10Be across shore platforms, Earth Surf. Dynam., 5, 67–84, https://doi.org/10.5194/esurf-5-67-2017, 2017.
Jonah, F. E., Boateng, I., Osman, A., Shimba, M. J., Mensah, E. A., Adu-Boahen, K., Chuku, E. O., and Effah, E.: Shoreline change analysis using end point rate and net shoreline movement statistics: An application to Elmina, Cape Coast and Moree section of Ghana's coast, Reg. Stud. Mar. Sci., 7, 19–31, https://doi.org/10.1016/j.rsma.2016.05.003, 2016.
Kennedy, D. M., Paulik, R., and Dickson, M. E.: Subaerial weathering versus wave processes in shore platform development: reappraising the Old Hat Island evidence, Earth Surf. Proc. Land., 36, 686–694, https://doi.org/10.1002/esp.2092, 2011.
Kennedy, D. M., Stephenson, W. J., and Naylor, L. A.: Chapter 1 Introduction to the rock coasts of the world, Geol. Soc. Lond. Mem., 40, 1–5, https://doi.org/10.1144/M40.1, 2014.
Kohl, C. P. and Nishiizumi, K.: Chemical isolation of quartz for measurement of in-situ-produced cosmogenic nuclides, Geochim. Cosmochim. Ac., 56, 3583–3587, https://doi.org/10.1016/0016-7037(92)90401-4, 1992.
Limber, P. W. and Murray, A. B.: Beach and sea-cliff dynamics as a driver of long-term rocky coastline evolution and stability, Geology, 39, 1147–1150, https://doi.org/10.1130/G32315.1, 2011.
Matsumoto, H., Dickson, M. E., and Kench, P. S.: An exploratory numerical model of rocky shore profile evolution, Geomorphology, 268, 98–109, https://doi.org/10.1016/j.geomorph.2016.05.017, 2016.
Matsumoto, H., Dickson, M. E., and Kench, P. S.: Modelling the relative dominance of wave erosion and weathering processes in shore platform development in micro- to mega-tidal settings, Earth Surf. Proc. Land., 43, 2642–2653, https://doi.org/10.1002/esp.4422, 2018.
Mellett, C. L. and Plater, A. J.: Drowned Barriers as Archives of Coastal-Response to Sea-Level Rise, in: Barrier Dynamics and Response to Changing Climate, edited by: Moore, L. J. and Murray, A. B., Springer International Publishing, Cham, 57–89, https://doi.org/10.1007/978-3-319-68086-6_2, 2018.
Metropolis, N., Rosenbluth, A. W., Rosenbluth, M. N., Teller, A. H., and Teller, E.: Equation of State Calculations by Fast Computing Machines, J. Chem. Phys., 21, 1087–1092, https://doi.org/10.1063/1.1699114, 1953.
Mortimore, R. N.: Upper Cretaceous Chalk in the North and South Downs, England: a correlation, P. Geologist. Assoc., 98, 77–86, https://doi.org/10.1016/S0016-7878(87)80022-6, 1987.
Mortimore, R. N., Wood, C. J., and Gallois, R. W.: British Upper Cretaceous stratigraphy, JNCC – Joint Nature Conservation Committee, UK, 23, 2001.
Mortimore, R. N., Lawrence, J., Pope, D., Duperret, A., and Genter, A.: Coastal cliff geohazards in weak rock: the UK Chalk cliffs of Sussex, Geol. Soc. Lond. Eng. Geol. Spec. Publ., 20, 3–31, https://doi.org/10.1144/GSL.ENG.2004.020.01.02, 2004a.
Mortimore, R. N., Stone, K. J., Lawrence, J., and Duperret, A.: Chalk physical properties and cliff instability, Geol. Soc. Lond. Eng. Geol. Spec. Publ., 20, 75–88, https://doi.org/10.1144/GSL.ENG.2004.020.01.05, 2004b.
Moses, C. and Robinson, D.: Chalk coast dynamics: Implications for understanding rock coast evolution, Earth-Sci. Rev., 109, 63–73, https://doi.org/10.1016/j.earscirev.2011.08.003, 2011.
Mottershead, D. N.: Rates and patterns of bedrock denudation by coastal salt spray weathering: A seven-year record, Earth Surf. Proc. Land., 14, 383–398, https://doi.org/10.1002/esp.3290140504, 1989.
National Tidal and Sea Level Facility: https://www.ntslf.org/, last access: 22 March 2021.
Naylor, L. A., Coombes, M. A., and Viles, H. A.: Reconceptualising the role of organisms in the erosion of rock coasts: A new model, Geomorphology, 157–158, 17–30, https://doi.org/10.1016/j.geomorph.2011.07.015, 2012.
Naylor, L. A., Kennedy, D. M., and Stephenson, W. J.: Chapter 17 Synthesis and conclusion to the rock coast geomorphology of the world, Geol. Soc. Lond. Mem., 40, 283–286, https://doi.org/10.1144/M40.17, 2014.
Nishiizumi, K., Imamura, M., Caffee, M. W., Southon, J. R., Finkel, R. C., and McAninch, J.: Absolute calibration of 10Be AMS standards, Nucl. Instrum. Meth. B, 258, 403–413, https://doi.org/10.1016/j.nimb.2007.01.297, 2007.
Ogawa, H., Dickson, M. E., and Kench, P. S.: Wave transformation on a sub-horizontal shore platform, Tatapouri, North Island, New Zealand, Cont. Shelf Res., 31, 1409–1419, https://doi.org/10.1016/j.csr.2011.05.006, 2011.
Oppenheimer, M., Glavovic, B. C., Hinkel, J., van de Wal, R., Magnan, A. K., Abd-Elgawad, A., Cai, R., Cifuentes-Jara, M., Rica, C., DeConto, R. M., Ghosh, T., Hay, J., Islands, C., Isla, F., Marzeion, B., Meyssignac, B., Sebesvari, Z., Biesbroek, R., Buchanan, M. K., de Campos, R. S., Cozannet, G. L., Domingues, C., Dangendorf, S., Döll, P., Duvat, V. K. E., Edwards, T., Ekaykin, A., Frederikse, T., Gattuso, J.-P., Kopp, R., Lambert, E., Lawrence, J., Narayan, S., Nicholls, R. J., Renaud, F., Simm, J., Smit, A., Woodruff, J., Wong, P. P., Xian, S., Abe-Ouchi, A., Gupta, K., and Pereira, J.: Sea Level Rise and Implications for Low-Lying Islands, Coasts and Communities, in: IPCC Special Report on the Ocean and Cryosphere in a Changing Climate, 4, 321–445, https://doi.org/10.1017/9781009157964.006, 2019.
Payo, A., Hall, J. W., Dickson, M. E., and Walkden, M. J. A.: Feedback structure of cliff and shore platform morphodynamics, J. Coast. Conserv., 19, 847–859, https://doi.org/10.1007/s11852-014-0342-z, 2015.
Porter, N. J., Trenhaile, A. S., Prestanski, K., and Kanyaya, J. I.: Patterns of surface downwearing on shore platforms in eastern Canada, Earth Surf. Proc. Land., 35, 1793–1810, https://doi.org/10.1002/esp.2018, 2010a.
Porter, N. J., Trenhaile, A. S., Prestanski, K. J., and Kanyaya, J. I.: Shore platform downwearing in eastern Canada: Micro-tidal Gaspé, Québec, Geomorphology, 118, 1–12, https://doi.org/10.1016/j.geomorph.2009.10.010, 2010b.
Prémaillon, M., Regard, V., Dewez, T. J. B., and Auda, Y.: GlobR2C2 (Global Recession Rates of Coastal Cliffs): a global relational database to investigate coastal rocky cliff erosion rate variations, Earth Surf. Dynam., 6, 651–668, https://doi.org/10.5194/esurf-6-651-2018, 2018.
Regard, V., Dewez, T., Bourlès, D. L., Anderson, R. S., Duperret, A., Costa, S., Leanni, L., Lasseur, E., Pedoja, K., and Maillet, G. M.: Late Holocene seacliff retreat recorded by 10Be profiles across a coastal platform: Theory and example from the English Channel, Quat. Geochronol., 11, 87–97, https://doi.org/10.1016/j.quageo.2012.02.027, 2012.
Retallack, G. and Roering, J.: Wave-cut or water-table platforms of rocky coasts and rivers?, GSA Today, 22, 6, https://doi.org/10.1130/GSATG144A.1, 2012.
Robinson, D. A.: The Chalk Coast of Sussex, in: Landscapes and Landforms of England and Wales, edited by: Goudie, A. and Migoń, P., Springer International Publishing, Cham, 119–143, https://doi.org/10.1007/978-3-030-38957-4_7, 2020.
Rogers, H. E., Swanson, T. W., and Stone, J. O.: Long-term shoreline retreat rates on Whidbey Island, Washington, USA, Quaternary Res., 78, 315–322, https://doi.org/10.1016/j.yqres.2012.06.001, 2012.
Rood, D. H., Hall, S., Guilderson, T. P., Finkel, R. C., and Brown, T. A.: Challenges and opportunities in high-precision Be-10 measurements at CAMS, Nucl. Instrum. Meth. B, 268, 730–732, https://doi.org/10.1016/j.nimb.2009.10.016, 2010.
Rosser, N. J., Brain, M. J., Petley, D. N., Lim, M., and Norman, E. C.: Coastline retreat via progressive failure of rocky coastal cliffs, Geology, 41, 939–942, https://doi.org/10.1130/G34371.1, 2013.
Shadrick, J. R., Hurst, M. D., Piggott, M. D., Hebditch, B. G., Seal, A. J., Wilcken, K. M., and Rood, D. H.: Multi-objective optimisation of a rock coast evolution model with cosmogenic 10Be analysis for the quantification of long-term cliff retreat rates, Earth Surf. Dynam., 9, 1505–1529, https://doi.org/10.5194/esurf-9-1505-2021, 2021.
Shadrick, J. R., Rood, D. H., Hurst, M. D., Piggott, M. D., Hebditch, B. G., Seal, A. J., and Wilcken, K. M.: Sea-level rise will likely accelerate rock coast cliff retreat rates, Nat. Commun., 13, 7005, https://doi.org/10.1038/s41467-022-34386-3, 2022.
Stavrou, A., Lawrence, J. A., Mortimore, R. N., and Murphy, W.: A geotechnical and GIS based method for evaluating risk exposition along coastal cliff environments: a case study of the chalk cliffs of southern England, Nat. Hazards Earth Syst. Sci., 11, 2997–3011, https://doi.org/10.5194/nhess-11-2997-2011, 2011.
Stephenson, W. J. and Kirk, R. M.: Rates and patterns of erosion on inter-tidal shore platforms, Kaikoura Peninsula, South Island, New Zealand, Earth Surf. Proc. Land., 23, 1071–1085, https://doi.org/10.1002/(SICI)1096-9837(199812)23:12<1071::AID-ESP922>3.0.CO;2-U, 1998.
Stephenson, W. J. and Kirk, R. M.: Development of shore platforms on Kaikoura Peninsula, South Island, New Zealand, Part One: The role of waves, Geomorphology, 32, 21–41, https://doi.org/10.1016/S0169-555X(99)00061-6, 2000.
Sunamura, T.: A wave tank experiment on the erosional mechanism at a cliff base, Earth Surf. Proc. Land., 7, 333–343, https://doi.org/10.1002/esp.3290070405, 1982.
Sunamura, T.: Geomorphology of rocky coasts, John Wiley & Son Ltd, ISBN 0471917753, 1992.
Sunamura, T.: Rocky coast processes: with special reference to the recession of soft rock cliffs, P. Jpn. Acad. B-Phys., 91, 481–500, https://doi.org/10.2183/pjab.91.481, 2015.
Swirad, Z. M., Rosser, N. J., Brain, M. J., Rood, D. H., Hurst, M. D., Wilcken, K. M., and Barlow, J.: Cosmogenic exposure dating reveals limited long-term variability in erosion of a rocky coastline, Nat. Commun., 11, 3804, https://doi.org/10.1038/s41467-020-17611-9, 2020.
Trenhaile, A.: Rocky coasts – their role as depositional environments, Earth-Sci. Rev., 159, 1–13, https://doi.org/10.1016/j.earscirev.2016.05.001, 2016.
Trenhaile, A. S.: Modeling the development of wave-cut shore platforms, Mar. Geol., 166, 163–178, https://doi.org/10.1016/S0025-3227(00)00013-X, 2000.
Trenhaile, A. S.: Chapter 14 Modeling shore platforms: present status and future developments, in: Elsevier Oceanography Series, vol. 67, edited by: Lakhan, V. C., Elsevier, 393–409, https://doi.org/10.1016/S0422-9894(03)80131-9, 2003.
Trenhaile, A. S.: Modeling the role of weathering in shore platform development, Geomorphology, 94, 24–39, https://doi.org/10.1016/j.geomorph.2007.04.002, 2008.
Trenhaile, A. S.: Predicting the response of hard and soft rock coasts to changes in sea level and wave height, Climatic Change, 109, 599–615, https://doi.org/10.1007/s10584-011-0035-7, 2011.
Trenhaile, A. S.: Shore platform erosion and evolution: Implications for cosmogenic nuclide analysis, Mar. Geol., 403, 80–92, https://doi.org/10.1016/j.margeo.2018.05.005, 2018.
Trenhaile, A. S. and Kanyaya, J. I.: The Role of Wave Erosion on Sloping and Horizontal Shore Platforms in Macro- and Mesotidal Environments, J. Coastal Res., 23, 298–309, https://doi.org/10.2112/04-0282.1, 2007.
Trenhaile, A. S. and Porter, N. J.: Can shore platforms be produced solely by weathering processes?, Mar. Geol., 241, 79–92, https://doi.org/10.1016/j.margeo.2007.03.005, 2007.
Walkden, M. J. A. and Hall, J. W.: A predictive Mesoscale model of the erosion and profile development of soft rock shores, Coast. Eng., 52, 535–563, https://doi.org/10.1016/j.coastaleng.2005.02.005, 2005.
Wilcken, K. M., Fink, D., Hotchkis, M. A. C., Garton, D., Button, D., Mann, M., Kitchen, R., Hauser, T., and O'Connor, A.: Accelerator Mass Spectrometry on SIRIUS: New 6 MV spectrometer at ANSTO, Nucl. Instrum. Meth. B, 406, 278–282, https://doi.org/10.1016/j.nimb.2017.01.003, 2017.
Williams, R. B. G., Robinson, D. A., Dornbusch, U., Foote, Y. L. M., Moses, C. A., and Saddleton, P. R.: A Sturzstrom-like cliff fall on the Chalk coast of Sussex, UK, Geol. Soc. Lond. Eng. Geol. Spec. Publ., 20, 89–97, https://doi.org/10.1144/GSL.ENG.2004.020.01.06, 2004.
Young, A. P.: Decadal-scale coastal cliff retreat in southern and central California, Geomorphology, 300, 164–175, https://doi.org/10.1016/j.geomorph.2017.10.010, 2018.
Yuan, R., Kennedy, D. M., Stephenson, W. J., and Finlayson, B. L.: The multidecadal spatial pattern of erosion on sandstone shore platforms in south-eastern Australia, Geomorphology, 371, 107437, https://doi.org/10.1016/j.geomorph.2020.107437, 2020.