the Creative Commons Attribution 4.0 License.
the Creative Commons Attribution 4.0 License.
 | 11 May 2023
Short communication: Potential of Sentinel-1 interferometric synthetic aperture radar (InSAR) and offset tracking in monitoring post-cyclonic landslide activities on Réunion
Marcello de Michele
Daniel Raucoules
Claire Rault
Bertrand Aunay
Michael Foumelis
This study examines the results of an interferometric synthetic aperture radar (InSAR) and SAR offset tracking (OT) study in Cirque de Salazie (CdS), Réunion Island, France, within the context of the RENOVRISK project, a multidisciplinary programme to study the cyclonic risks in the south-western Indian Ocean. Despite numerous landslides in this territory, CdS is one of the more densely populated areas on Réunion Island. One of the aims of the project is to assess whether Sentinel-1 SAR methods can be used to measure landslide motion and/or accelerations due to post-cyclonic activity in CdS. We concentrate on the post-2017 cyclonic activity. We use the Copernicus Sentinel-1 data, acquired between 30 October 2017 and 6 November 2018. Sentinel-1 is a C-band SAR, and its signal can be severely affected by the presence of changing vegetation between two SAR acquisitions, particularly in CdS, where the vegetation canopy is well developed. This is why C-band radars such as the ones on board RADARSAT or Envisat, characterized by low acquisition frequency (24 and 36 d, respectively), could not be routinely used in CdS to measure landslide motion with InSAR in the past. In this study, we use InSAR and OT techniques applied to Sentinel-1 SAR. We find that C-band SAR on board Sentinel-1 can be used to monitor landslide motion in densely vegetated areas, thanks to its high acquisition frequency (12 d). OT stacking reveals a useful complement to InSAR, especially in mapping fast moving areas. In particular, we can highlight ground motion in the Hell-Bourg, Ilet à Vidot, Grand-Ilet, Camp Pierrot, and Le Bélier landslides.
- Article
(6277 KB) - Full-text XML
- BibTeX
- EndNote


Landslide and erosion processes are causes of major concern to population and infrastructures on Réunion Island. These processes are led by the tropical climate of the island. The hydrological regime of the rivers is distinct owing to the coexistence of several major parameters that predispose it to extreme vulnerability. Holding almost all the world records for rainfall between 12 h (1170 mm) and 15 d (6083 mm), the island has a marked relief with a peak at 3069 m, with exceptional cliffs that reach 1500 m in height.
Cirque de Salazie (CdS) is the rainiest of the large erosional depressions on Réunion Island (Pohl et al., 2016), with an average annual cumulative rainfall of approximately 3100 mm since 1963; a minimum of 698 mm was recorded in 1990, and a maximum of 5893 mm was recorded in 1980.
This depression is surrounded by steep rock cliffs and filled with epiclastic material. Intense river erosion incises deep valleys and has produced several isolated plateaus across the cirque.
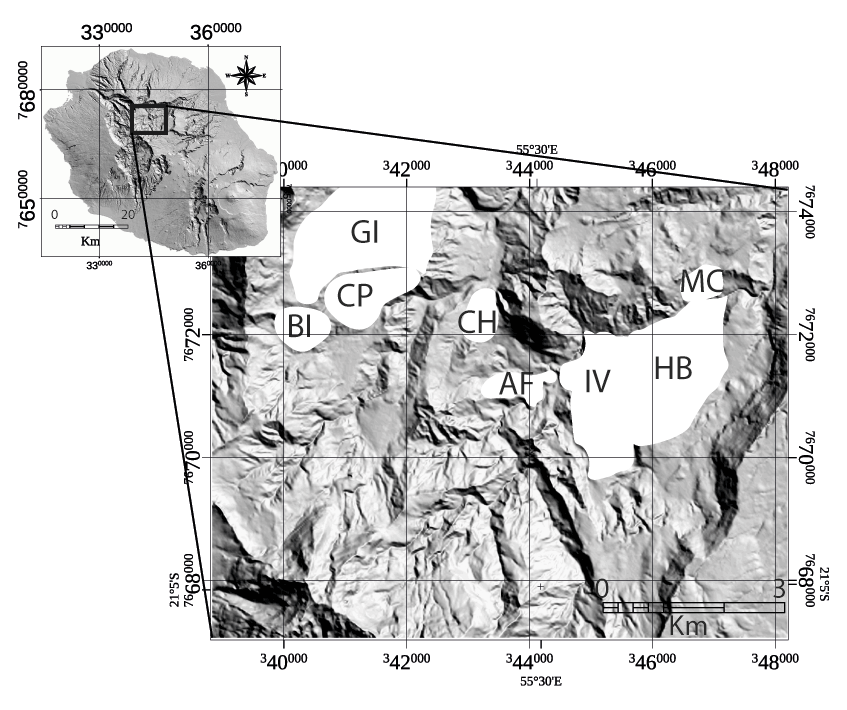
Figure 1Map of the study area. Slow-moving landslides in the area, from existing catalogues, are highlighted in white. MC: Mare à Citrons; HB: Hell-Bourg; IV: Ilet à Vidot; AF: L'Affouche; CH: Chemin Henry; Bl: Le Bélier; CP: Camp Pierrot; and GI: Grand-Ilet. Modified form Rault et al. (2022). Topography is from the Shuttle Radar Topography Mission (SRTM) (Farr et al., 2004) digital elevation model.
The morphology, geology, and climate make CdS prone to erosion and ground movements. At least 19 % of its slope is affected by landslides (Rault et al., 2022). The active landslides range from a large, slow-moving landslide of 1×10⁸ m3 to rapid and catastrophic slope failure with a volume exceeding 1×10⁶ m3.
Eleven slow-moving landslides are identified in CdS (Fig. 1). Their displacement rates range from a few centimetres per year to 1.15 m yr−1 and can accelerate after intense rainfall events, particularly because of cyclonic activity (e.g. Belle et al., 2014). These landslides are commonly observed on plateaus. They cover areas that vary from tens of thousands of square metres to several square kilometres. Hell-Bourg (HB) and Grand-Ilet (GI) are the largest inhabited slow-moving landslides in the cirque, with volumes of 225×106 and 215×106 m3, respectively (e.g. Rault et al., 2022).
Slow-moving landslides can trigger secondary landslides along their steep scarps that eventually border rivers, leading to increased solid loads. Therefore, slow-moving landslides are not only responsible for significant damage to houses and infrastructure but are also involved in the formation of torrential flows and river dams (Liébault et al., 2010; Tulet et al., 2021). Thus, understanding their kinematics/dynamics is essential for hazard and risk mitigation at the scale of Réunion Island.
Synthetic aperture radar (SAR) methods have already proven useful in highlighting landslide kinematics from space (e.g. Aslan et al., 2020, and references therein). While C-band SAR can be used to comprehensively measure ground displacement, our study area is particularly challenging for C-band SAR since it is densely vegetated. In this study, we test whether interferometric synthetic aperture radar (InSAR) and SAR offset tracking (OT) techniques can be used to measure landslide kinematics in densely vegetated areas. Both techniques require temporal signal coherence and therefore are usually not adapted for densely vegetated areas. Particularly, a C-band SAR signal can be severely affected by the presence of changing vegetation between two SAR acquisitions, particularly in CdS, where the vegetation canopy is well developed. This is why C-band radars such as the ones on board RADARSAT or Envisat, characterized by low acquisition frequency (24 and 36 d, respectively), could not be routinely used in CdS to measure landslide motion with InSAR in the past. This limitation can be palliated under certain circumstances, for instance improving repetition frequency between two or more satellite acquisitions. In this study, we exploit the improved repetition frequency of Sentinel-1 SAR to test InSAR and OT techniques in CdS after a cyclonic event in 2018. If successful, this study can serve as a demonstrator.
1.1 Past studies regarding ground motion from space in CdS
Few studies have used spaceborne remote sensing techniques to report on ground instabilities in CdS. Delacourt et al. (2009) used a combination of optical (SPOT 5 and aerial imagery) and synthetic aperture radar (SAR) data (JERS-1 and RADARSAT data) to measure ground motion on the Hell-Bourg landslide. They applied the two techniques to assess their performance and quantify ground motion associated with this landslide. They found an average displacement of approximately 0.5 m yr−1 from 1997–2002. Le Bivic et al. (2017) used two pairs of ortho-rectified SPOT 5 images at 2.5 m resolution on the Hell-Bourg landslide. The first pair of images spanned the period between 2002 and 2005. The second pair of images spanned the period 2006–2008. They reported that during 2002–2005, the OT method yielded ground motion within the signal noise; they deduced that landslide activity was low. From 2006–2008, they measured a maximum displacement of 8.5±2 m (possibly due to Cyclone Gamede).
Raucoules et al. (2016) used high-resolution X-band SAR data from the TerraSAR-X satellite from 2010–2011. They combined ascending and descending OT maps to extract the three-dimensional displacement field of the HB and GI landslides. They reported that ground displacement reached 1±0.25 m yr−1 vertically and 0.65±0.25 m yr−1 horizontally. They also used InSAR combined with X-band data from the COSMO-SkyMed satellite to measure centimetric displacements on the borders of the HB and GI landslides. The X-band InSAR signal was incoherent elsewhere.
Raucoules et al. (2018a, b, 2020) used spaceborne high-resolution L-band SAR (ALOS-2/PALSAR-2 data in stripmap SM1 mode) both with InSAR and OT. They derived two components of the displacement field for the HB landslide. The displacement reached approximately 1 m yr−1 from 2014–2016. They reported that L-band SAR performed significantly better than the C-band SAR available at the time of the study.
1.2 Aim of this study
Landslides displacement rates in CdS can accelerate after intense rainfall events, particularly during cyclonic activity. Their kinematics might change during such extreme events; new landslides might appear. The global navigation satellite system (GNSS) in the study area yields precise time series at the measurement stations. SAR methods are potentially able to spatialize the ground motion information and might reveal ground motion in unexpected areas. The aim of this study is to assess whether Sentinel-1 SAR methods – both InSAR and OT – could be used to measure landslide motion and accelerations caused by post-cyclonic activity in a densely vegetated area such as CdS. This study complements the one by Raucoules et al. (2018a, b, 2020), who used L-band InSAR and OT to measure ground motion in CdS. The measurement of ground motion with C-band SAR in densely vegetated areas is challenging because the radar waves interact with the vegetation canopy and may yield an incoherent InSAR signal if temporal changes occur between the two SAR scenes. Therefore, InSAR signal coherence largely depends on the revisit time of the satellite. The shorter the revisit time is, the higher the InSAR signal coherence and the faster the ground motion have to be in order to be measured by InSAR. The history of C-band SAR data over Réunion is non-linear. The European Space Agency (ESA) Earth Remote Sensing Satellite (ERS-1 and ERS-2) SAR platforms did not cover Réunion owing to orbit incompatibilities. The Canadian Space Agency RADARSAT-1 and RADARSAT-2 have flown over Réunion, but they acquired data every 24 d (Delacourt et al., 2009), which makes the InSAR signal incoherent in densely vegetated areas such as the CdS. Similarly, the ESA Advance SAR (ASAR) sensor on board the ENVISAT satellite acquired data every 35 d. Therefore, the SAR interferometric signal was incoherent for this C-band radar with a quasi-monthly repeat cycle. The Copernicus Sentinel-1 satellite can resolve these problems. Sentinel-1 hosts a C-band SAR (wavelength = 5.5 cm) whose interferometric signal is usually incoherent over densely vegetated areas; however, the high repetition frequency of Sentinel-1 (12 d in Réunion, 6 d in mainland Europe until 2021) makes the InSAR signal potentially suitable for measuring land displacements in densely vegetated areas (e.g. Aslan et al., 2020). It could be complementary or alternative to L-band SAR interferometry (Delacourt et al., 2009; Raucoules et al., 2020) and in situ techniques in Réunion.
1.3 InSAR and offset tracking techniques
In this study, we design the experiment as follows. We apply two SAR methods, InSAR and OT. These two methods could be complementary because InSAR can measure slow-moving landslides, typically a small fraction of the employed wavelength, while OT can measure large ground motions, higher than the pixel size of the SAR scene. In contrast, OT may be limited in the measurement of small ground motions, depending on the pixel size, because the nominal lower bound precision is th of the pixel size of the image employed on a single correlogram.
InSAR methods rely on the measurement of the changes in SAR phases among multiple SAR scenes using interferometric processing (e.g. Massonnet and Feigl, 1998). It is a widely used methodology to measure ground displacements from space, in many disciplines related to tectonics (e.g. Elliott et al., 2020), volcanology (e.g. Doubre et al., 2017), and gravitational failures (e.g. Aslan et al., 2020). Here, we used the stacking procedure implemented in the GAMMA processing chain (GAMMA, 2015). The stacking procedure combines multiple SAR scenes and yields ground displacement rate in the form of a ground velocity map. It is used to estimate the linear rate of differential phases starting from a set of unwrapped differential interferograms. The individual interferogram phases are weighted by the time interval in estimating the phase rate. The underlying assumption is that atmospheric statistics are stationary for the set of interferograms. Stacking can be applied to unwrapped interferometric phases as well as to a set of OT correlograms.
OT is a sub-pixel image correlation technique. This technique matches two or more images at each point on a grid, analysing the degrees of local correlation at each step. Differences in the local instantaneous frequency of the images result in sub-pixel spatial differences in ground patterns. Measurements must be performed with sub-pixel accuracy because the amplitude of the ground displacement is often lower than the resolution of the images, depending on the sensor used.
A sub-pixel image correlation technique for measuring ground surface displacements can be applied to optical (e.g. Michel et al., 1999; de Michele and Briole, 2007) and SAR amplitude images (e.g. Michel and Rignot, 1999; de Michele et al., 2010a, b). The main differences between optical and SAR images are caused by the oblique SAR acquisition geometry. Therefore, instead of having east–west and north–south offsets as in optical OT, SAR OT yields slant range and azimuth offsets. Slant range is the line-of-sight (LOS) direction or look angle of the satellite. The azimuth is the flying direction of the satellite (nominally 98∘ for Sentinel-1, nearly north–south). Moreover, azimuth offsets are “topography-free”, and slant range offsets are calculated in the LOS and, therefore, contain a contribution from vertical offsets, depending on the viewing angle. Thus, OT yields two components of the deformation field for one SAR scene. For details on this methodology, please refer to Michel and Rignot (1999) and Michel et al. (1999), who used it with shuttle imaging radar (SIR-C) and ERS radar amplitude images, and Raucoules et al. (2013), who applied the OT method to multi-temporal SAR images at the La Valette landslide. The OT technique provides a measurement of the ground displacement from the analysis of the geometrical deformation between the two SAR amplitude images. Usually SAR images with a small baseline are chosen to reduce the stereoscopic effect and geometric decorrelation. For Sentinel-1, the orbit tubes are steered within 100 m maximum. Therefore, the topographic contribution to the OT in the LOS direction is negligible. In this study, we estimate the range and azimuth offset fields using cross-correlation optimization of the input intensity images. This algorithm is implemented in the GAMMA software with the name of “offsets tracking” (e.g. Strozzi et al., 2002). GAMMA is a standard SAR processing software, whose results have been validated among other available SAR processing chains (e.g. Raucoules et al., 2009).
At the time of this study's experimental design, the Sentinel-1 mission comprised a constellation of two polar-orbiting satellites, operating day and night and hosting a C-band synthetic aperture radar, enabling them to acquire imagery regardless of the weather. We used 26 Sentinel-1 data points in descending stripmap mode, acquired every 12 d from 30 October 2017 to 6 November 2018. Sentinel-1 data are provided by the European Space Agency, within the Copernicus Programme of the European Union. Technically, we downloaded them as single look complex (SLC) data from the Copernicus Scientific Data Hub (https://scihub.copernicus.eu, last access: 2 April 2023). We did not use the ascending mode, as it is less sensitive to ground motion in CdS given the SAR shadow and the unfavourable relative geometry between the SAR orbit and ground motion (e.g. Raucoules et al., 2020).
First, we co-registered the SAR data. Then, we created differential interferograms with data pairs spanning 12 d intervals. The topographic contribution to the interferometric phase was modelled using a DEM from the Shuttle Radar Topography Mission (SRTM) (Farr et al., 2004). We unwrapped the differential interferograms with the minimum cost flow algorithm (Constantini, 1998). Depending on the water vapour content in the air, there may be an interferometric-phase delay due to the SAR signal crossing multiple tropospheric layers. To a first approximation, this delay is proportional to the topographic slope. Therefore, we corrected the tropospheric contribution to the interferometric phase by linear regression with the DEM. At this point, we performed the stacking procedure, producing a velocity map. The stacking procedure starts from a set of unwrapped interferometric phases along with the time interval in days of the SLC-2 relative to the reference SLC-1. The individual unwrapped interferograms are weighted by the time interval in estimating the rate. The underlying assumption is that atmospheric statistics are stationary for the set of N interferograms. The formula for the estimated phase rate, in radians per year, is given by (Le Mouélic et al., 2005; GAMMA, 2015)
where N is the number of interferograms, φj is one given interferogram, and t is the time interval inherent with each interferogram (SLC-2 relative to the reference SLC-1). If the matching is not found (low signal coherence) that particular interferogram value is not used in the stacking procedure so that the same scatterers are identified on many images, but not all the images are used. It follows that the more images there are, the more the stacking redundancy there is the more the precision the results have. The phase rates are converted into velocity values, in metres per year. Afterwards, we ortho-rectified the velocity map. The results are shown in Fig. 2.
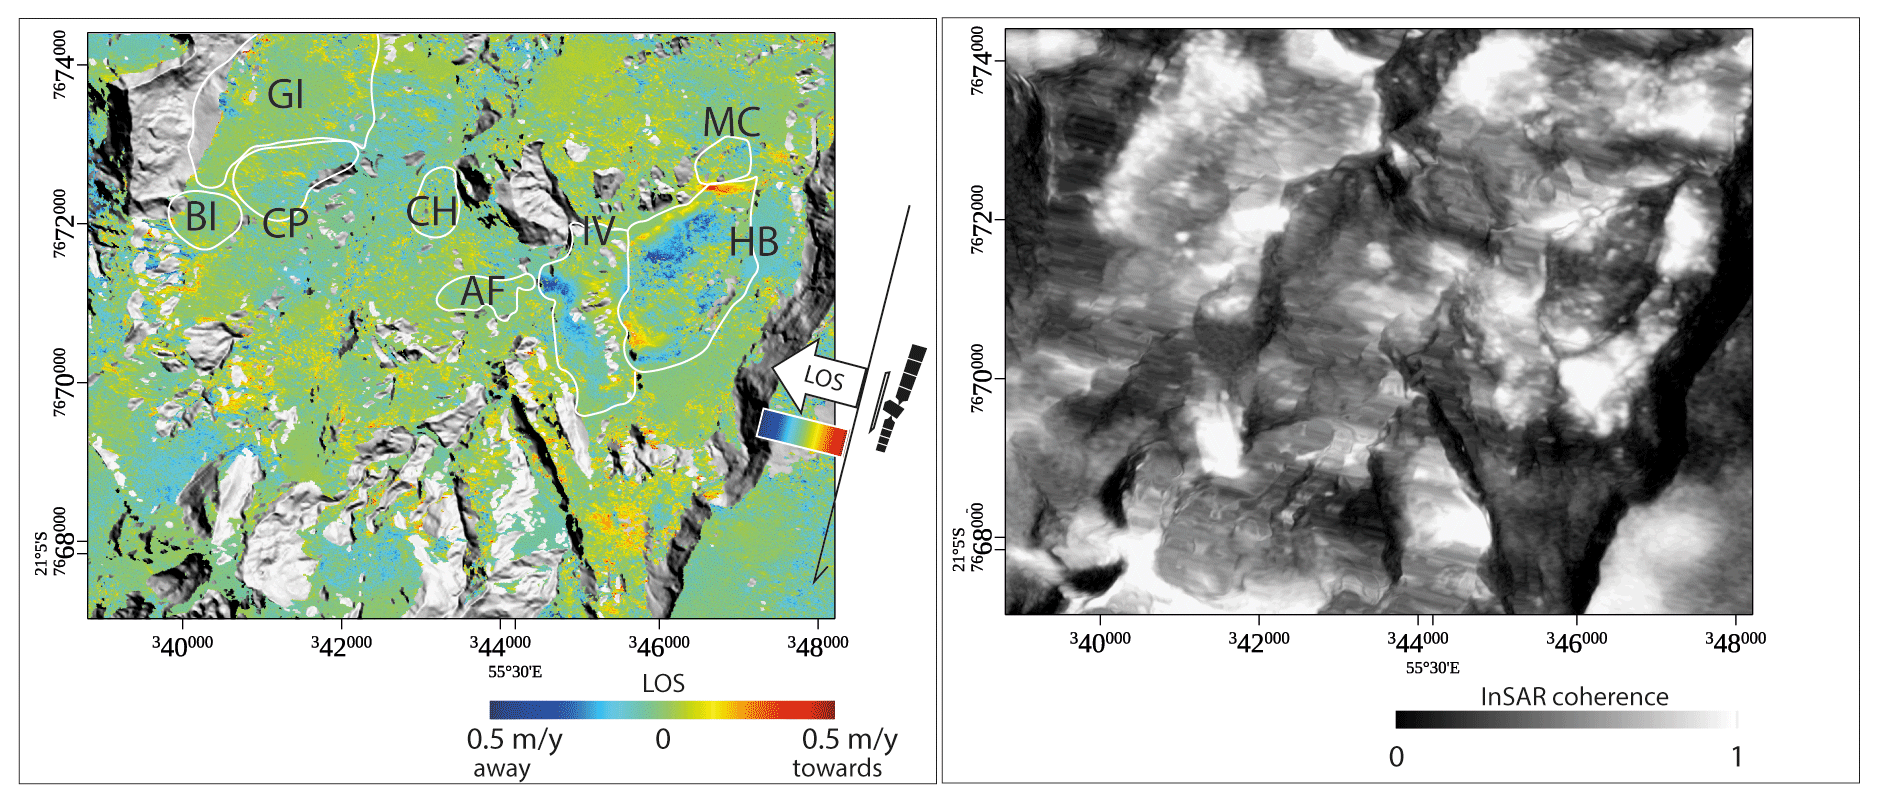
Figure 2Left: InSAR velocity map in the LOS of the satellite, using the descending mode. A ground displacement pattern is clearly visible in the Hell-Bourg area. Right: InSAR signal coherence. Coherence values lower than 0.3 are masked in the left panel. Topography is from the Shuttle Radar Topography Mission (SRTM) (Farr et al., 2004) digital elevation model.
For the OT procedure, we began from the co-registered SAR data. Instead of the phases, we used the amplitude of the SAR signal and extracted multi-look complex images (MLIs) for each acquisition date. multi-look processing degrades the image resolution but reduces the image speckle. Because OT sensitivity to ground motion depends on the pixel resolution, we required a tradeoff between image noise and multi-looking. For this study, our choice was multi-looking with a factor of 3 in azimuth and 2 in the range directions. This led to pixel sizes of 8.2 m in the azimuth direction and 7.9 m in the range directions. We used a correlation window of 128×128 pixels and searched for 1024 measurements in range and azimuth, respectively. The OT technique is nominally less affected by temporal signal decorrelation than the InSAR technique. Therefore, we used all possible image couples, leading to the creation of 351 correlograms in both the range and azimuth directions. Then, we applied the stacking procedure described above to create one velocity map in the range direction and one in the azimuth direction. Instead of the unwrapped InSAR phases in Eq. (1), we used the pixel offset values found in the OT correlograms (in metres). As for the InSAR phases, if the matching is not found, that particular correlogram value is not used in the stacking procedure so that the same ground patterns are identified in many images, but not all the images are used. Finally, we ortho-rectified the results. The ortho-rectification implies spatial resampling via interpolation in order to keep the regular sampling on the final map.
We recognized and mapped three landslide areas in Salazie, active during the study period: Hell-Bourg, Ilet à Vidot, and an area that was considered stabilized or dormant, possibly corresponding to Crête des Salazes.
Hell-Bourg and Ilet à Vidot are two highly inhabited compound landslides of Salazie. These landslides move continuously and typically accelerate following heavy rainfall. They occupy approximately 10 % of the CdS surface area. They all stand on volcanoclastic material interpreted as volcanic debris–avalanche deposits or as debris-flow/mudflow deposits by Rault et al. (2022). Hell-Bourg is a compound landslide covering a surface of approximately 2.8 km2. Ilet à Vidot is an active plateau located north-west of Hell-Bourg and covers an area of 2.3 km2.
In the next paragraph we describe both InSAR and OT results in more detail.
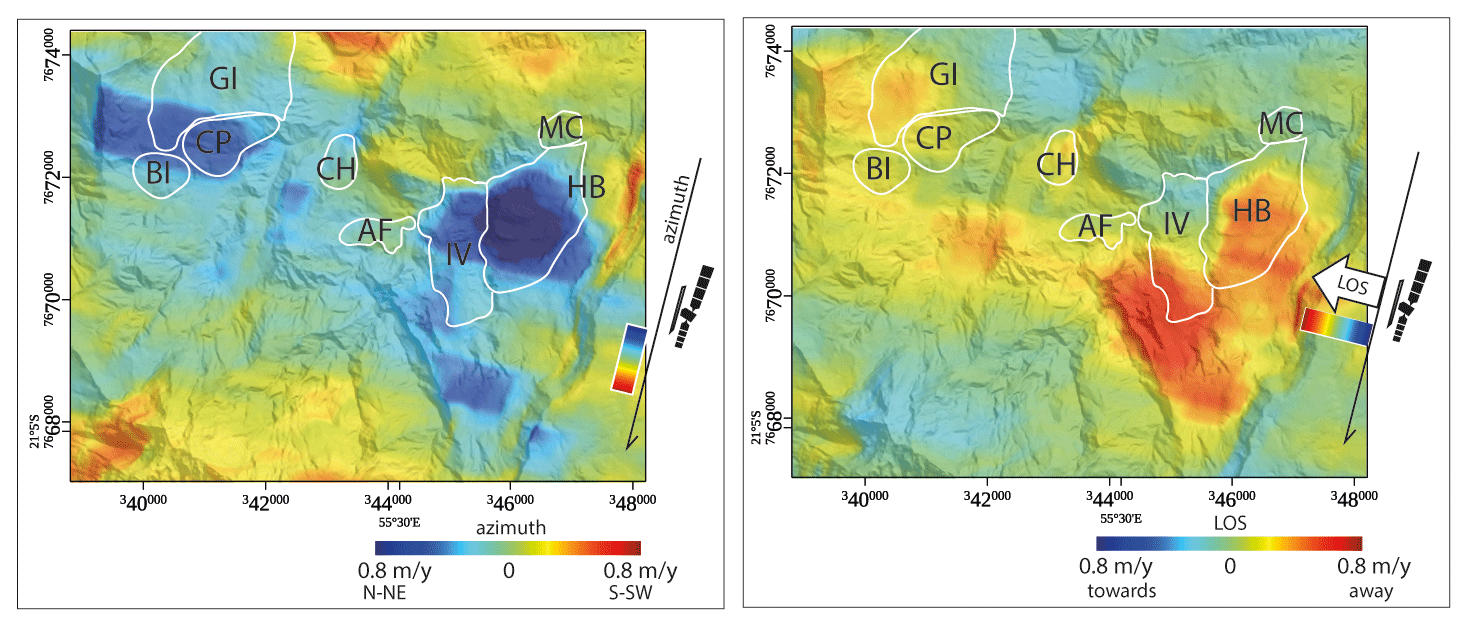
Figure 3Azimuth (left) and LOS (right) OT velocity maps. Topography is from the Shuttle Radar Topography Mission (SRTM) (Farr et al., 2004) digital elevation model.
3.1 InSAR
The stacking InSAR results are shown in Fig. 2. They are presented as a mean velocity map, where ground motion is measured in the LOS of the satellite. InSAR is only sensitive to ground motion occurring in the LOS direction. Motion away from the satellite is represented in blue. Motion towards the satellite is represented in red. Complex combinations of those two directions of motion may lead to zero apparent motion on the InSAR velocity map. From Fig. 2, we observe manifold improvements with respect to velocity maps produced from former C-band InSAR missions (Delacourt et al., 2009). First, we noticed that the InSAR signal is coherent over the study area, which was not expected given the densely vegetated tropical area (Fig. 2, right). Second, we can see a clear pattern of ground motion in the Hell-Bourg area, approximately in the interval of values ±0.5 m yr−1 and spatially consistent with ground observations. Figure 2 also shows ground motion on the Ilet à Vidot (IV) landslide. The InSAR signal direction on both HB and IV landslides is quite complex. This suggests the existence of complex internal landslide kinematics such as stretching of the main landslide body in HB and dismantling of the IV plateau on both sides by landslides moving either eastward or westward, as expected for a compound slide and identified in the field by Rault et al. (2022). It also suggests a rotational component of ground motion. In this study, the InSAR signal is surprisingly coherent, with a certain level of noise. We calculated the noise as ±2 cm yr−1 on the InSAR velocity map. To minimize coherence loss, we used interferograms with 12 d time spans only, excluding larger-time-span interferograms. Owing to these limitations, we were unable to capture very slow ground motions (<2 cm yr−1).
3.2 Offset tracking azimuth and range
We show the OT results in Fig. 3. Because OT is a sub-pixel correlation technique, its precision depends on the image pixel size. Nominally, the correlator implemented into the GAMMA processing chain is as precise as th of the pixel size (e.g. Raucoules et al., 2019). Therefore, because the MLI pixel size is 8.2 m in the azimuth direction and 7.9 m in the range directions, we can expect precisions of the order of 0.8 m in a single correlogram. Thus, we cannot use OT to measure ground motions smaller than 0.8 m on a single correlogram. The precision increases by applying the stacking procedure. Moreover, the stacking procedure can compensate the component of the pixel offsets that may be caused by non-zero baselines between Sentinel-1 orbits, which is proportional to topography. Furthermore, OT does not have higher limits for ground motion detection. This latter characteristic is particularly helpful in CdS, where metric ground motion is expected, particularly within the HB area.
The first observation from Fig. 3 is that the OT stacking procedure applied to Sentinel-1 MLIs provides meaningful results, in both the azimuth and slant range directions. From Fig. 3, we find that the fastest ground motion in the azimuth direction is localized on the Hell-Bourg landslide, the N-NW section of the IV landslide, and the Camp Pierrot (CP) landslide. Ground motion in Hell-Bourg can reach 1 m yr−1 in the azimuth direction. The OT signal in the azimuth direction is also visible on a central section of the CP and IV landslides, as fast as 0.7 m yr−1. In the slant range direction, the OT ground motion signal is localized in the HB landslide, reaching 0.8 m yr−1, away from the satellite. Figure 3 highlights motion on the S-SE sections of the GI and IV landslides. We also observe an unexpected pattern of ground motion south-south-east of HB and south of IV that was consistent with the geomorphology of the area but situated in a non-instrumented, uninhabited area on the ground. This signal is intriguing and must be validated against in situ observations.
To further investigate this latter signal, we considered the horizontal component of LOS motion only, combined with the azimuth velocities, to extract OT horizontal ground velocities regardless of the motion direction. The hypothesis holds in CdS because the horizontal motion (in HB for instance) is almost 7 times larger than the vertical velocity. Therefore, we applied
to extract the horizontal velocity map, |vh|, where i is the satellite viewing angle (37∘ in this case study), OTaz is the azimuth OT, and OTlos is the range OT (Fig. 4). Figure 4 shows that the OT detectable ground motion is concentrated in the HB and IV landslides and south of the IV landslide. There is also a weaker but noticeable ground motion signal at the GI and CP landslides. Moreover, there is a marked signal south-south-east of IV.
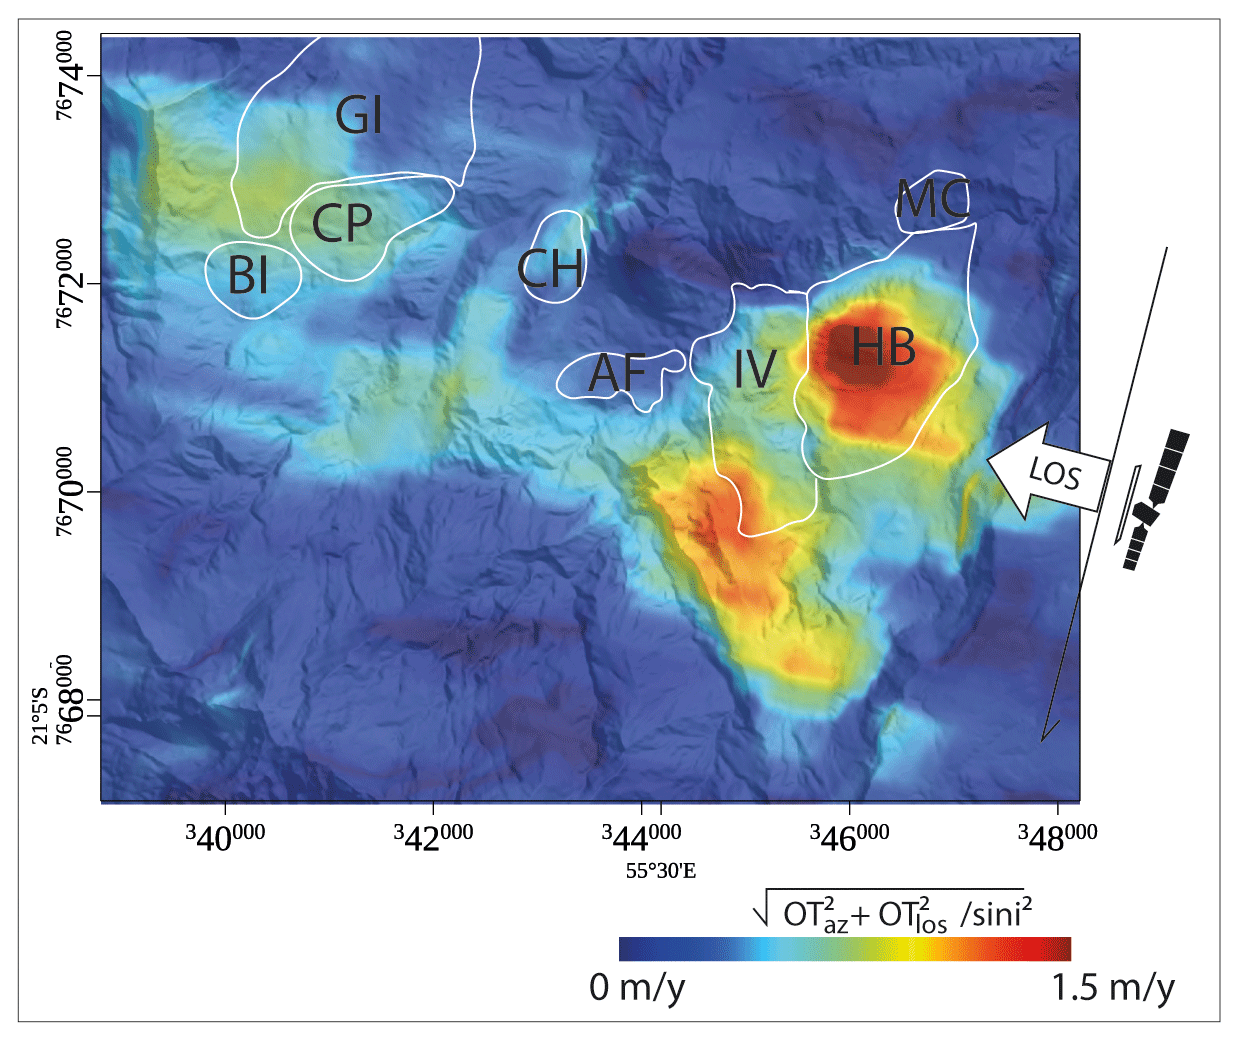
Figure 4Amplitude of the OT horizontal ground velocities independent of direction. We consider only the horizontal component of LOS: ; i is the LOS viewing angle (37∘). The hypothesis is that the horizontal motion in CdS (in HB for instance) is almost 7 times larger than the vertical velocity. Topography is from the Shuttle Radar Topography Mission (SRTM) (Farr et al., 2004) digital elevation model.
To gain some insight into the accuracy of SAR velocities maps, we performed a cross-comparison with GNSS campaigns available in CdS. In this exercise, we compared SAR velocities with GNSS velocities acquired over the time span May 2018–February 2020. The GNSS velocities were calculated using 93 geodetic markers across the cirque (Fig. 5). They were obtained from the position of the markers measured with a differential GNSS during two measurement campaigns: May 2018 and January 2020.
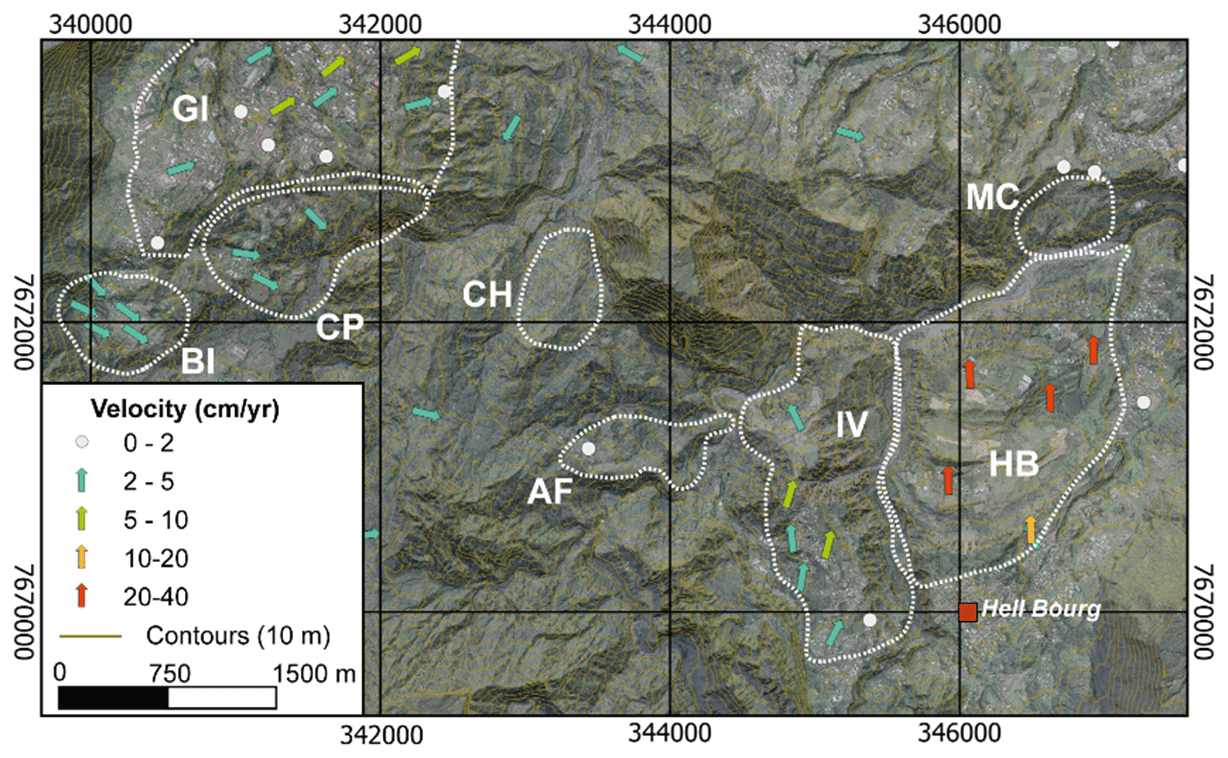
Figure 5Locations and horizontal velocities of GNSS campaigns. Velocities refer to campaigns in May 2008 and January 2020. Modified after Rault et al. (2022)
GNSS measurement accuracy varies from one site to another depending on environmental factors (e.g. vegetation, proximity to buildings, cirque cliffs, and steep ramparts). For each measurement campaign, the position of a benchmark was measured four successive times. The final position of the benchmark is the average of these four measurements. Measurements with deviations of more than 5 cm in altimetry and 3 cm in planimetry were removed from the dataset. The positioning accuracies are of the order of 2 cm in planimetry and less than 5 cm in altimetry (Mazué et al., 2013).
To compare GNSS and SAR velocities (both InSAR and OT), we must project the GNSS x, y, and z values into the LOS (OT range) and OT azimuth direction by considering that Sentinel-1 has a heading of −167.66∘ S with a look angle of 36.93∘. We then obtained GNSSsar values in the LOS, range, and azimuth direction. Then, we discretized the GNSSsar values into a number of intervals of 0.03 m width. For each interval, we calculated the median and identified the geographic location of each point in the interval. At those points, we extracted median GNSSsar and SAR values. Then, we plotted GNSSsar vs. SAR for each interval. The results are scatterplots showing GNSS (LOS) vs. InSAR (Fig. 6) and GNSS (range, azimuth) vs. SAR OT (range, azimuth) in Fig. 7.
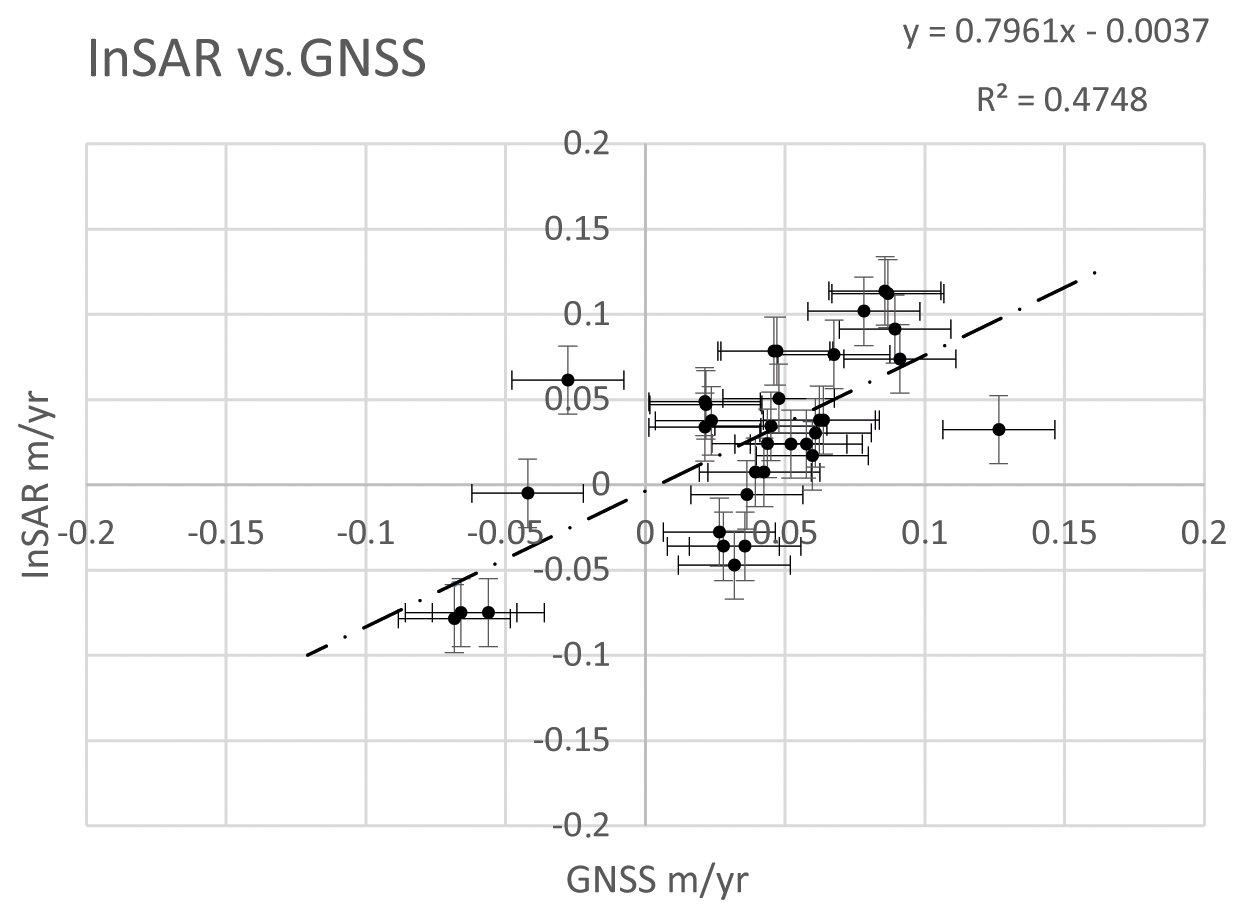
Figure 6InSAR vs. GNSS (LOS) data (m yr−1). InSAR is not sensitive to velocities higher than 2 cm yr−1. Therefore, we mask all values that are related to GNSS values higher than cm yr−1.
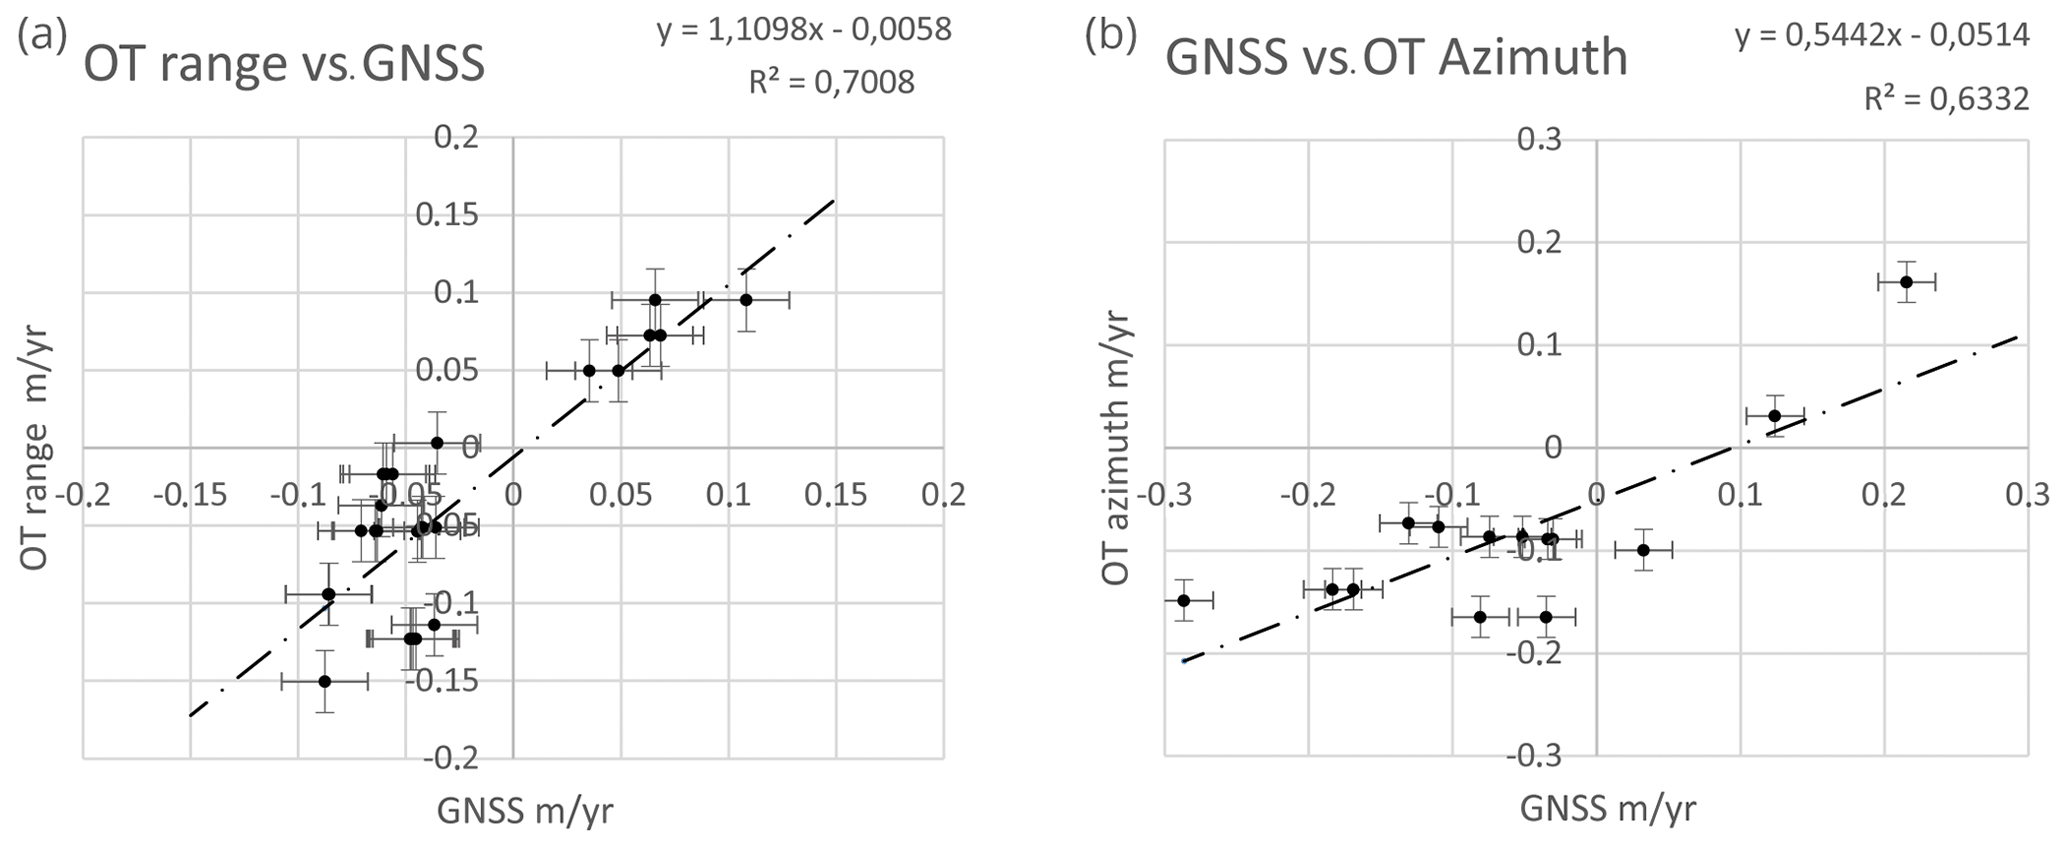
Figure 7Left: GNSSsar vs. OT in the range direction (m yr−1). Right: GNSSsar vs. OT in the azimuth direction (m yr−1). Masked GNSS values between ±3 cm yr−1.
From Fig. 6, we see that the comparison between InSAR velocities and GNSSsar velocities is satisfactory. However, there was a general underestimation of motion for the InSAR technique (i.e. InSAR = 0.8 × GNSS). This may be due to an uncompensated residual ramp in the InSAR velocity map.
In Fig. 7, we show the comparison between GNSSsar and OT velocities in the range and azimuth directions. We see that the comparison between SAR and GNSSsar velocities is good. There is a general underestimation of motion by the OT technique in the azimuth direction (i.e. OT azimuth = 0.5 × GNSSsar). This may be due to an uncompensated residual ramp in the OT velocity maps.
In this study, we applied Sentinel-1 SAR analysis, both InSAR and OT, to the measurement of ground motion in Cirque de Salazie, Réunion Island, France. Thanks to the high repetition frequency of Sentinel-1, the C-band InSAR signal is coherent in this region, in contrast with past C-band studies on the study area. This result allows us to produce interpretable velocity maps, both with InSAR and OT techniques. The InSAR velocity map provided spatially detailed ground velocities in the LOS of the satellite, with precision reaching a fraction of the SAR wavelength. The comparison between InSAR and GNSS velocities is satisfactory. The Sentinel-1 MLI OT technique provided useful measurements. Nevertheless, the comparison between OT and GNSS velocities highlighted several biases that require a more detailed investigation. The biases may be due to a residual orbital ramp in the OT velocities but also the fact that OT precision is a function of the MLI pixel size. Because the InSAR and OT techniques provide “relative” measurements, the biases with respect to GNSS suggested that absolute calibration of SAR maps is needed to compare SAR and GNSS results.
Within the InSAR and OT detection limits and the period of SAR measurements (October 2017–November 2018) this study shows the ground motion and internal kinematics on the HB landslide, the N-NW section of the IV landslide, and the CP landslide. Moreover, we point out an unexpected pattern of ground motion south-south-east of HB and south of IV, consistent with the geomorphology of the area but situated in a non-instrumented, uninhabited area on the ground. We suggest that it might correspond to an area that was considered stabilized or dormant, called Crête des Salazes. Motion in this area might have been reactivated as a consequence of heavy rainfall and thus represents a post-cyclonic burst of ground motion.
Three GNSS sites on the south-western part of IV landslide indicate ground motion in this sector of CdS. Therefore, this noticeable signal requires further consideration and investigation.
We need precise time series of this ground motion, localized in those three specific areas, to discriminate whether we can highlight rheological changes due to the post-cyclonic activity.
There is room for methodological improvement.
Even though the Sentinel-1 ascending mode is less adapted in CdS due to shadow and layover effects depending on the look angle, it may be possible to exploit the few coherent pixels to extract the vertical and east–west components of ground displacement by a combination of Sentinel-1 InSAR in ascending and descending modes. The exploitation of both InSAR and OT from Sentinel-1 and other SAR missions (e.g. ALOS 2, TerraSAR X) would improve data coverage, spatially and temporally. OT with Sentinel-1 data proved valuable to measure large ground motion in CdS. In this study, we calculated OT on MLIs 3-2; we could run an experiment to determine whether OT from MLIs 2-1 or even MLIs 1-1 could lead to more accurate results.
In conclusion, Sentinel-1 InSAR and OT present high potential for routine monitoring in CdS as a complement to in situ techniques (i.e. Rault et al., 2022). This study presents a solid premise for the future exploitation of the European Ground Motion Service (EGMS) of the European Union Copernicus Programme, based on Sentinel-1 InSAR, in CdS.
We used a commercial software package called GAMMA (https://www.gamma-rs.ch/software; GAMMA Remote Sensing, 2023). It is a standard in our field of research. The code is only accessible if one buys it.
Sentinel-1 data can be accessed via the ESA Scihub open-access portal at https://scihub.copernicus.eu/ (Copernicus, 2023).
MdM: conceptualization, formal analysis, methodology, visualization, writing (original draft preparation), writing (review and editing). DR: conceptualization, formal analysis, methodology, writing (original draft preparation). CR: investigation, methodology, writing (original draft preparation), writing (review and editing). BA: conceptualization, supervision, investigation, writing (review and editing). MF: formal analysis, methodology, writing (original draft preparation).
The contact author has declared that none of the authors has any competing interests.
Publisher's note: Copernicus Publications remains neutral with regard to jurisdictional claims in published maps and institutional affiliations.
This study is part of the RenovRisk-Erosion project. This project is funded by Réunion Island's Regional Council, the European Union (FEDER), the French Government, and BRGM. We are thankful to the EU Copernicus programme for providing access to Sentinel-1 data, free of charge.
This paper was edited by Richard Gloaguen and reviewed by two anonymous referees.
Aslan, G., Foumelis, M., Raucoules, D., De Michele, M., Bernardie, S., and Cakir, Z.: Landslide Mapping and Monitoring Using Persistent Scatterer Interferometry (PSI) Technique in the French Alps, Remote Sens., 12, 1305, https://doi.org/10.3390/rs12081305, 2020.
Belle, P., Aunay B., Bernardie, S., Grandjean, G., Ladouche, B., Mazué, R., and Join, J.-L.: The application of an innovative inverse model for understanding and predicting landslide movements (Salazie cirque landslides, Reunion Island), Landslides, 11, 343–355, 2014.
Copernicus: Welcome to the Copernicus Open Access Hub, https://scihub.copernicus.eu/ (last access: 28 March 2023), 2023.
Costantini, M.: A novel phase unwrapping method based on network programming, IEEE T. Geosci. Remote, 36, 813–821, 1998.
Delacourt, C., Raucoules, D., Le Mouélic, S., Carnec, C., Feurer, D., Allemand, P., and Cruchet, M.: Observation of a Large Landslide on La Reunion Island Using Differential Sar Interferometry (JERS and Radarsat) and Correlation of Optical (Spot5 and Aerial) Images, Sensors, 9, 616–630, 2009.
de Michele, M. and Briole, P.: Deformation between 1989 and 1997 at Piton de la Fournaise volcano retrieved from correlation of panchromatic airborne images, Geophys. J. Int., 169, 357–364, https://doi.org/10.1111/j.1365-246X.2006.03307.x, 2007.
de Michele, M., Raucoules, D., Lasserre, C., Pathier, E., Klinger, Y., Van Der Woerd, J., de Sigoyer, J., and Xu, X.: The Mw 7.9, 12 May 2008 Sichuan earthquake rupture measured by sub-pixel correlation of ALOS PALSAR amplitude images, Earth Planet Space, 62, 875–879, https://doi.org/10.5047/eps.2009.05.002, 2010a.
de Michele, M., Raucoules, D., de Sigoyer, J., Pubellier, M., and Chamot-Rooke, N.: Three-dimensional surface displacement of the 2008 May 12 Sichuan earthquake (China) derived from Synthetic Aperture Radar: evidence for rupture on a blind thrust, Geophys. J. Int., 183, 1097–1103, https://doi.org/10.1111/j.1365-246X.2010.04807.x, 2010b.
Doubre, C., Déprez, A., Masson, F., Socquet, A., Lewi, E., Grandin, R. Nercessian, A., Ulrich, U., De Chabalier, J.-B., Saad, I., Abayazid, A., Peltzer, G., Delorme, A., Calais, E., and Wright, T.: Current deformation in Central Afar and triple junction kinematics deduced from GPS and InSAR measurements, Geophys. J. Int., 208, 936–953, https://doi.org/10.1093/gji/ggw434, 2017.
Elliott, J. R., de Michele, M., and Gupta, H. K.: Earth Observation for Crustal Tectonics and Earthquake Hazards, Surv. Geophys., 41, 1355–1389, https://doi.org/10.1007/s10712-020-09608-2, 2020.
Farr, T. G., Caro, E., Crippen, R., Duren, R., Hensley, S., Kobrick, M., Paller, M., Rodriguez, E., Rosen, P., Roth, L., Seal, D., Shaffer, S., Shimada, J., Umland, J., Werner, M., Oskin, M., Burbank, D., and Alsdorf, D.: The shuttle radar topography mission, Rev. Geophys., 45, RG2004, https://doi.org/10.1029/2005RG000183, 2004.
GAMMA: Differential Interferometry and Geocoding Software – user manual, GAMMA Remote Sensing AG, Gumligen, Switzerland, 54 pp., https://gamma-rs.ch/uploads/media/GAMMA_Software_information.pdf (last access: 28 April 2023), 2015.
GAMMA Remote Sensing: The GAMMA software, https://www.gamma-rs.ch/software (last access: 10 May 2023), 2023.
Le Bivic, R., Allemand, P., Quiquerez, A., and Delacourt, C.: Potential and Limitation of SPOT-5 Ortho-Image Correlation to Investigate the Cinematics of Landslides: The Example of “Mare à Poule d'Eau” (Réunion, France), Remote Sens., 9, 106, https://doi.org/10.3390/rs9020106, 2017.
Le Mouélic, S., Raucoules, D., Carnec, C., and King, C.: A Least-squares adjustment of multi-temporal InSAR data – Application to the ground deformation of Paris, Photogram. Eng. Remote Sens., 71, 197–204, 2005.
Liébault, F., Peteuil, C., and Remaître, A.: Approches géomorphologiques de la production sédimentaire des torrents, Sciences Eaux & Territoires, 2, 128–35. https://doi.org/10.14758/SET-REVUE.2010.2.15, 2010.
Massonnet, D. and Feigl, K.: Radar interferometry and its application to changes in the Earth's surface, Rev. Geophys., 36, 441–500, https://doi.org/10.1029/97RG03139, 1998.
Mazué, R., Aunay, B., and Belle, P.: Suivi des réseaux géodésiques dans les cirques de La Réunion, Rapport BRGM No. RP-61994-FR, p. 66, BRGM, http://infoterre.brgm.fr/rapports/RP-61994-FR.pdf (last access: 28 April 2023), 2013.
Michel, R. and Rignot, E.: Flow of Glaciar Moreno, Argentina, from repeat-pass Shuttle Imaging Radar images: a comparison of the phase correlation method with radar interferometry, J. Glaciol., 45, 93–100, 1999.
Michel, R., Avouac, J. P., and Taboury, J.: Measuring ground displacements from SAR amplitude images: Application to the Landers earthquake, Geophys. Res. Lett., 26, 875–878, 1999.
Pohl, B., Morel, B., Barthe, C., and Bousquet, O.: Regionalizing rainfall at very high resolution over La Réunion Island: A case study for tropical Cyclone Ando, Mon. Weather Rev., 144, 4081–4099, https://doi.org/10.1175/MWR-D-15-0404.1, 2016.
Raucoules, D., Bourgine, B., de Michele, M., Le Cozannet, G., Closset, L., Bremmer, C., Veldkamp, H., Tragheim, D., Bateson, L., Crosetto, M., Agudo, M., and Engdahl, M.: Validation and intercomparison of Persistent Scatterers interferometry: PSIC4 project results, J. Appl. Geophys., 68, 335–347, 2009.
Raucoules, D., de Michele, M., Malet, J.-P., and Ulrich, P.: Time-variable 3D ground displacements from high-resolution synthetic aperture radar (SAR). Application to La Valette landslide (South French Alps), Remote Sens. Environ., 139, 198–204, 2013.
Raucoules, D., de Michele, M., Mazué, R., and Aunay, B.: MvTerre-2: Observation de mouvements de terrain sur le cirque de Salazie à partir de mesures de télédétection radar satellitaire, Rapport BRGMP RP-61187-FR, p. 51, BRGM, http://infoterre.brgm.fr/rapports/RP-61187-FR.pdf (last access: 28 April 2023), 2016.
Raucoules, D., Tomaro, F., Foumelis, M., Negulescu, C., de Michele, M., and Aunay, B.: Landslide Observation from ALOS-2/PALSAR-2 Data (Image Correlation Techniques and Sar Interferometry). Application to Salazie Circle Landslides (La Reunion Island), in: IGARSS 2018 – 2018 IEEE International Geoscience and Remote Sensing Symposium, July 2018, Valencia, France, 506–509, hal-02734613, https://doi.org/10.1109/IGARSS.2018.8517998, 2018a.
Raucoules, D., Le Cozannet, G., de Michele, M., and Capo, S.: Observing water-level variations from space-borne high-resolution Synthetic Aperture Radar (SAR) image correlation, Geocarto Int., 33, 977–987, 2018b.
Raucoules D., de Michele, M., and Aunay, B.: Landslide displacement mapping based on ALOS-2/PALSAR-2 data using image correlation techniques and SAR interferometry: Application to Salazie Circle landslides (La Réunion Island), Geocarto Int., 35, 113–127, 2020.
Rault, C., Thiery, Y., Chaput, M., Reninger, P. A., Dewez, T. J. B., Michon, L., and Aunay, B.: Landslide Processes Involved in Volcano Dismantling From Past to Present: The Remarkable Open-Air Laboratory of the Cirque de Salazie (Reunion Island), J. Geophys. Res.-Earth, 127, e2021JF006257, https://doi.org/10.1029/2021JF006257, 2022.
Strozzi, T., Luckman, A., Murray, T., Wegmuller, U., and Werner, C. L.: Glacier motion estimation using SAR offset-tracking procedures, IEEE T. Geosci. Remote, 40, 11, 2384–2391, 2002.
Tulet, P., Aunay, B., Barruol, G., Barthe, C., Belon, R., Bielli, S., and Vérèmes, H.: ReNovRisk: a multidisciplinary programme to study the cyclonic risks in the South-West Indian Ocean, Nat. Hazards, 107, 1191–1223, 2021.
- Abstract
- Introduction and study area
- Data and processing steps
- Results
- Comparison with global navigation satellite system (GNSS) data
- Discussion, conclusions, and perspectives
- Code availability
- Data availability
- Author contributions
- Competing interests
- Disclaimer
- Acknowledgements
- Review statement
- References