the Creative Commons Attribution 4.0 License.
the Creative Commons Attribution 4.0 License.
 | 24 May 2023
Mobile evaporite enhances the cycle of physical–chemical erosion in badlands
Pei-Hao Chen
Erica D. Erlanger
Jens M. Turowski
Tse-Yang Teng
Jiun-Chuan Lin
Jr-Chuang Huang
Chemical weathering driven by physical erosion is a natural process that strongly affects chemical and solid matter budgets at the Earth's surface. However, the influence of extreme climatic erosion on chemical weathering dynamics is poorly understood. Badland landscapes formed in highly erodible substrates have the potential to respond to individual events on scales that are rapid enough for direct observation. Here, we assess the geochemical and grain-size composition of suspended sediment and riverine chemistry measurements collected from two catchments during the 2017 Nesat and Haitang typhoons in southwestern (SW) Taiwan. During the typhoons, the Na+ concentration covaried with suspended sediment concentration (SSC), which we attributed to sodium-induced deflocculation. Evaporite weathering at peak rainfall is succeeded by peak silicate weathering at maximum discharge. Overall, our observations suggest that initial weathering of near-surface evaporite enhances the physical erosion of silicate rock during extreme rainfall events.
- Article
(4116 KB) - Full-text XML
-
Supplement
(1727 KB) - BibTeX
- EndNote


Chemical weathering induced by physical erosion controls nutrient supply to ecosystems (Milligan and Morel, 2002), reflects dynamic surface processes (e.g. Calmels et al., 2011; Clift et al., 2014; Emberson et al., 2016; Meyer et al., 2017; Lyons et al., 2005), and regulates the global carbon cycle and evolution of the Earth's long-term climate (Berner et al., 1983; Carey et al., 2005; Raymo and Ruddiman, 1992; Gaillardet et al., 1999; Moon et al., 2007). In most landscapes, physical erosion and chemical weathering operate on geological timescales that may be difficult to observe on human timescales (e.g. Maher et al., 2014). However, in many landscapes, erosion dominantly occurs during stochastic events, such as storms (e.g. Hartshorn et al., 2002; Lee et al., 2020; Wang et al., 2021). In particular, typhoons are able to transport large volumes of water and dissolved solids within hours to days, allowing us to observe the interactions between physical erosion and chemical weathering in landscapes impacted by them. Nevertheless, observations of the interaction between extreme physical erosion and chemical weathering dynamics are limited (Meyer et al., 2017). Furthermore, the lack of high-frequency stream water sampling leads to a fundamental difficulty in constraining the dynamic behaviour between physical erosion and chemical weathering during a high-discharge period (e.g. a typhoon), which could have key implications for our ability to quantify topographic responses to these events.
Badlands are landscapes characterised by highly erodible and weathered substrates that are largely devoid of vegetation. The high erodibility of these landscapes provides a unique opportunity to investigate and quantify denudation processes that operate at short timescales (Cheng et al., 2019; Yang et al., 2019, 2021a, b). Badlands are typically dominated by mudstones and clays, and soils that contain clays saturated in sodium ions are particularly vulnerable to erosion by water. Sodium ions alter the layer charge of double-layered clay minerals (i.e. smectite) and cause the clays to deflocculate, which refers to the process of breaking up the clay (and ultimately the soil) into finer particles that are more easily washed away by water (e.g. Faulkner et al., 2004; Mitchell et al., 1993; Rengasamy and Olsson, 1991; Rengasamy et al., 1984; Sherard et al., 1976; Kašanin-Grubin et al., 2018). Additionally, mineral assemblage affects the stability of soil aggregates; for example, small amounts of smectite in kaolinitic materials cause it to be more dispersive and unstable (Levy et al., 1993).
Previous studies in the badlands of southwestern (SW) Taiwan have revealed that halite and gypsum dissolve at depth, and they migrate to the hillslope surface and deposit in desiccation cracks during the dry season (Higuchi et al., 2013, 2015; Nakata and Chigira, 2009). Others have observed that pore waters found in the near-surface mudstone have Na+ concentrations of 1–3×10⁶ µmol L−1 at 1–2 cm depth (Nakata and Chigira, 2009). Mud cracks lead to the properties of the mudstone, e.g. rock density, water permeability, and ion concentration between the surface (a few centimetres to 10 cm depth) and bedrock being different (Fig. S1). For example, the bedrock hardly participates in physical erosion during a rainfall event due to low permeability. We hypothesise that the dissolved halite and gypsum re-crystallise in the near surface and are deposited in the mudstone cracks through capillary action during the dry season. Subsequent precipitation dissolves the evaporite, and the dissolved Na+ enhances erosion by clay dispersity and exposes more weatherable materials, forming a positive feedback cycle. Assuming a mudstone substrate that is primarily comprised of silicate minerals, we expect that concentration of evaporite ions should be consistent with changes in the sediment concentration and the concentration of silicate ions.
To investigate this potential feedback between evaporite dissolution and erosion, we use suspended sediment concentrations (SSCs) and stream chemistry data from two catchments in the badlands of SW Taiwan (Fig. 1), collected at a temporal resolution of 3 h over 3 d. We interpret our observations in the badlands to reflect how the excess sodium that re-precipitates at the surface in the dry season enhances physical erosion and chemical weathering in the following typhoon event.
In Taiwan's badlands, the annual precipitation is about 2 m, and 90 % of the rainfall is concentrated in the rainy season. The rainy season lasts from May to October and reaches its peak in August, with over 400 mm of precipitation within a single month. In contrast, less than 40 mm of average monthly rainfall is measured from November to April. We collected river water samples from two sites downstream of the studied badland areas. The first site, Nanxiong Bridge (NX), is located at the midstream of the Erren River and has a drainage area of 175 km2. This area includes badlands covering an area of 4.37 km2, which accounts for 2.49 % of the total catchment area (Fig. 1). The Erren River catchment is predominantly underlain by Plio–Pleistocene mudstones, which are several kilometres thick and mainly feature illite (30.54 %) and chlorite (28.70 %) minerals (Tsai, 1984). During the dry seasons, the pore water chemistry in the near-surface mudstones is mainly composed of Na+, Cl−, Ca2+and SO (Nakata and Chigira, 2009).
The gauging station at Nanxiong Bridge (NX) provides hourly discharge data for calculating sediment and solute fluxes. The annual average discharge of the NX station is 10.2 m3 s−1, and the typhoon season accounts for 84 % of the total discharge. The meteorological station at Gutingkeng (GTK) is located 5.5 km from Nanxiong Bridge and provides hourly precipitation data. Our second sampling site is Guting Bridge (GT), with an upstream drainage area of 79 km2 and a badlands area of 1.87 km2, corresponding to 2.37 % of the total area. Guting Bridge is located adjacent to a badlands conservation area, so the riverine water chemistry reflects the weathering products derived from the adjacent hillslopes. Due to a lack of stream discharge observations at Guting Bridge, we use hourly precipitation data at GTK, which is less than 1 km from the sampling site, to quantify the impact of the typhoon events.

Figure 1Location of sampling sites and geology of the study area. (a) The geological map of the study area (source: Central Geological Survey, 2013). The green squares are sampling sites; hourly stream discharge data were obtained from the Nanxiong Bridge (NX) hydrometric station (Water Resources Agency). The blue square is the meteorological station, which provides hourly precipitation data (Central Weather Bureau, https://dbar.pccu.edu.tw/, last access: 15 May 2023).
3.1 Water sampling
We collected 42 stream samples from the two sampling sites for the typhoon period of July 2017. During sample collection, two 1000 mL PE bottles were dropped 1–2 m below the water surface of the river simultaneously. Suspended sediment concentration (SSC) was subsequently calculated from the water collected in one of the PE bottles, and riverine chemistry was determined from water collected in the other bottle. Samples were filtered in situ, and the filtrate was preserved in the refrigerator for laboratory analysis. Additionally, 31 samples were collected from September 2014 to December 2016 in the second half of every month at Nanxiong Bridge for non-typhoon periods, using the same sampling procedure.
3.2 Dissolved load and sediment chemistry analysis
For the riverine dissolved load, we measured major dissolved anions (Cl−, SO, NO2−, NO3−, F−) on an ion chromatograph (IC; Metrohm Basic-883 plus), and we measured major dissolved cations (Na+, K+, Mg2+, Sr2+, Ba2+, Si4+) on an inductively coupled plasma optical emission spectrometer (ICP-OES; PerkinElmer, Optima 2100DV). We measured bulk sediment chemistry from two samples of suspended sediment collected from Guting Bridge at low flow before the typhoon event (2.26 m3 s−1) and at the peak of runoff (724.32 m3 s−1). About 0.7 g of dried sediment sample was combusted in the muffle furnace at 650∘ for 2 h and then weighed to obtain the loss on ignition (LOI). Afterward, an aliquot of ∼100 mg from the residue was digested with a mixture of concentrated HF and aqua regia. After digestion and drying, the sample was dissolved in 0.3 N HNO3 for elemental determination. Major elemental concentrations of sediment samples were obtained by ICP-OES (Varian 720-ES) at the GFZ German Research Centre for Geosciences.
3.3 Grain size of suspended load
Before measuring grain size, we removed the non-clastic deposition, i.e. sea salt, organic matter and carbonate. To remove sea salt, ∼1 g of dried sediment sample was added to 15 mL of distilled water, placed in a shaker and shaken at a speed of 4000 rpm for 5 min. The centrifuged supernatant was then poured out, and these steps were repeated three times. To remove organic matter, 10 mL of a 15 % H2O2 solution was added to the sediment and placed in an ultrasonic oscillator for 24 h. After adding a second 10 mL of H2O2 (15 %) to confirm the completion of the reaction, the mixture was centrifuged, and the supernatant containing the organic matter was removed. The sediment was then washed by adding 30 mL of distilled water, and the supernatant was again removed after centrifugation. This washing step was repeated three times to remove residual H2O2 in the centrifuge tube. To remove the carbonates, we added 10 mL of 10 % HCl solution to the centrifuge tube and allowed the acid to react with the sediments for 24 h. An additional 10 mL of HCl was then added to confirm the completeness of the reaction. The sample was then centrifuged, and the supernatant was decanted to remove the carbonates. The sample was then rinsed with 30 mL of distilled water, centrifuged and decanted. This step was performed three times to remove any residual HCl.
To disperse sediment agglomeration, we added 10 mL of 1 % Na(PO3)6 solution to the sediment and let the sample react for more than half a day. The grain size of the sediment samples was obtained by the laser diffraction particle size analyser LA950 at the GFZ German Research Centre for Geosciences. By using LA950, we measured grains in the size range of between 100 nm and about 3 cm.
3.4 Calculation of the enriched ratio and sodium adsorption ratio (SAR)
In order to classify the supply of different ion sources during the typhoon event, we used the enriched ratio of concentration as a reference. The enriched ratio is the ion concentration at a certain time divided by the ion concentration at the first observation. A value greater than 1 represents a point in time when the sample is more concentrated relative to the first observation, whereas a value smaller than 1 represents a point in time when the sample is more diluted relative to the first observation. The first observation was sampled 6 h before the typhoon, which represents the background value of river water chemistry in this study.
Dissolved calcium and magnesium can stabilise soil aggregates and therefore enhance water permeability (Nadler et al., 1996). By contrast, excess sodium can disperse soil particles through deflocculation, thereby reducing water permeability (Hanson et al., 1999). The potential for material dispersion in badlands is generally determined by measuring the presence and behaviour of sodium and is quantified by the sodium adsorption ratio (SAR) (Eq. 1):
Here, the cation measurements are expressed in milliequivalents per litre (mEq L−1). For pore water, when SAR is greater than 13, the excess sodium causes soil particles to repel each other, preventing the formation of soil aggregates (Seelig, 2000; Horneck et al., 2007). Given the influence of soil structure, the SAR value for irrigation water smaller than 3 is low, from 3 to 9 is medium and above 9 is high (Ayers and Westcot, 1985).
3.5 Calculation of TDS and chemical weathering rate
Riverine total dissolved solids (TDS) is widely used to estimate chemical weathering rates of river catchments (e.g. Gaillardet et al., 1999). In this study, riverine TDS (in units of µmol L−1) is expressed as follows:
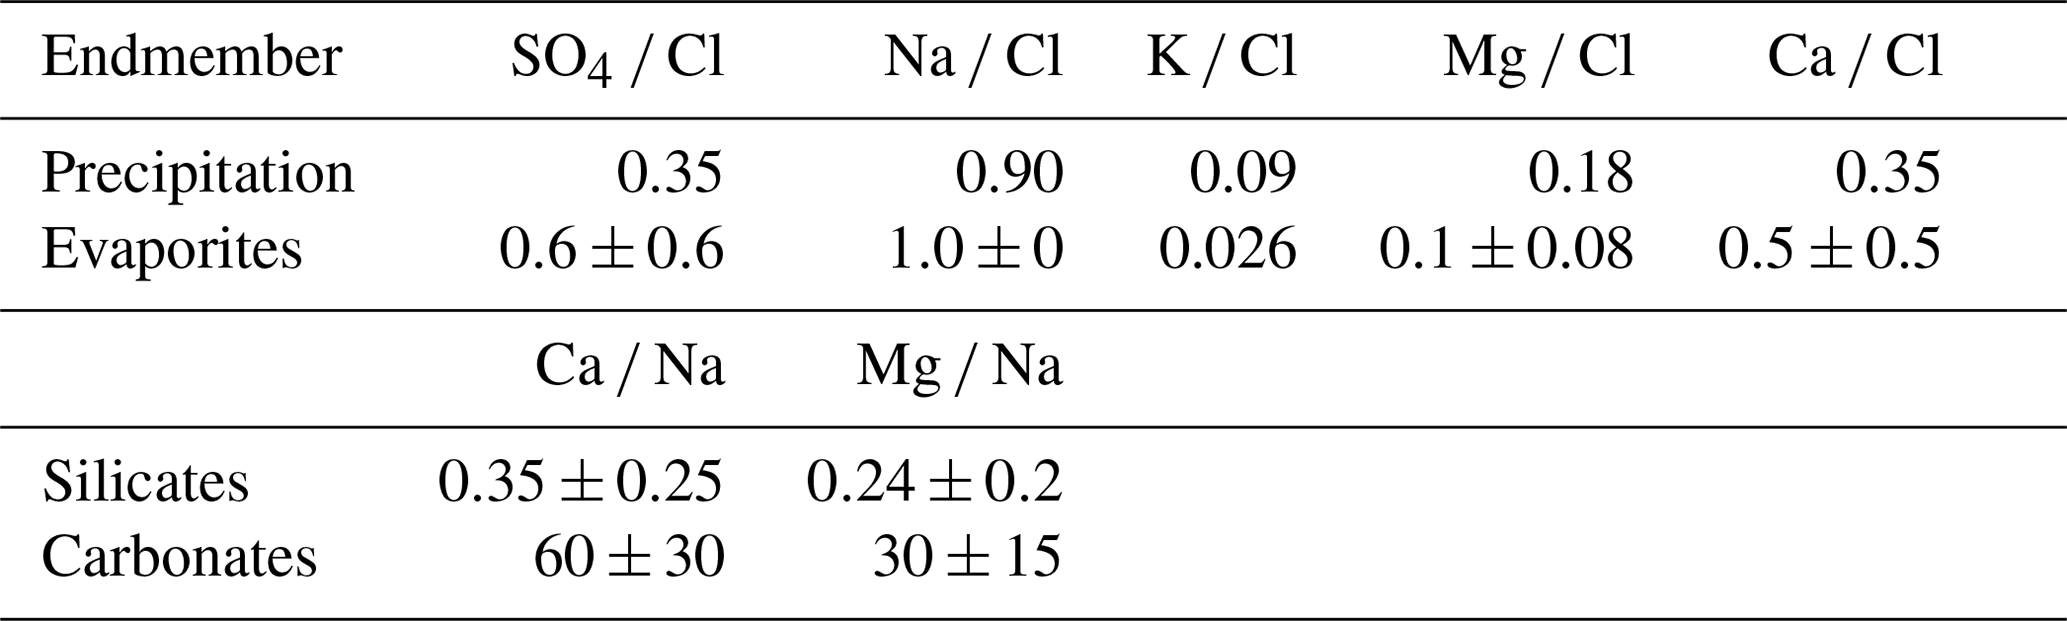
where the contributions from precipitation (TDSrain), evaporite (TDSevaporite), silicate weathering (TDSsil) and carbonate weathering (TDScarb) are considered. We calculated the proportions of ion contributions from rainwater, evaporite, silicate and carbonate for Ca, Mg, Na, Cl and SO4 with the MEANDIR inversion model (Kemeny and Torres, 2021), a MATLAB script for inverting fractional contributions of endmembers, and the Monte Carlo propagation of uncertainty for constraining the chemical compositions of those endmembers. To exclude the input of precipitation (TDSrain) from riverine TDS, we used local rainwater Cl− concentrations with an average value of 68 µmol L−1 (Lu, 2014) as well as the ratios of SO4 Cl, Na Cl, K Cl, Mg Cl and Ca Cl in rainfall based on the rainfall chemistry from 2007 to 2013 reported by Lu and Lin (2014) (Table 1):
where [X]norain reflects the remaining concentration of ion X after the removal of atmospheric inputs, [X]river is the concentration of ion X in river water, and [X]rain is the concentration of ion X from atmospheric deposition. In the second step, we corrected for evaporite inputs (TDSevaporite) using the following equation:
where [X]NSS is the concentration of ion X after the removal of ions attributed to evaporites, [X]evap, and [X Cl]evap is the ratio of ion X and Cl by using the endmember molar ratios of evaporite reported by Burke et al. (2018), of which K Cl is referred to Chao et al. (2011) (Table 1). Then, after the correction for evaporite, the chemical weathering budget can be divided into contributions by silicate (TDSsil) and carbonate weathering (TDScarb), expressed as
where [Na]sil and [K]sil are riverine [Na]NSS and [K]NSS concentrations, respectively. We used endmember values for silicate- and carbonate-dominated rocks reported by Gaillardet et al. (1999) (Table 1). We agree that the use of global endmembers leads to a larger range of estimations but is still appropriate in discussing trends in weathering rates.
Considering the hydrological response, we use the flow-weighted method to calculate the flux of solute (Huang et al., 2012), expressed as
where m is the conversion factor for a specific unit (t km−2 yr−1), Qi is the hourly discharge corresponding to sampling time, and Qt is the total discharge during the year or during the typhoon.
3.6 Calculation of total loss of mobile elements
The non-dimensional mass transfer coefficient (τj, i) is used to quantify the loss or accumulation of a mobile element (Anderson et al., 2002). Notably, we use the suspended sediment before the typhoon event as the reference, instead of parent materials.
Here, the concentration of an immobile element, Ti (Ci), or of a mobile element (Cj) in suspended sediment is denoted for the time before peak discharge (Ci,b) or at peak discharge (Ci,p). When the τ values approach −100, it indicates depletion, while values close to 100 indicate accumulation.
4.1 Geochemistry of river water and suspended sediment
In 2017, the Nesat and Haitang typhoons brought 579 mm of rainfall over 3 d, with a maximum intensity of 74 mm h−1. The discharge at Nanxiong Bridge demonstrated that the climatic co-response has two pulses (Fig. 2). Since the time interval between the two typhoons was less than 6 h, we define the two typhoons as one typhoon event and distinguish between a first and second discharge pulse. We quantify time relative to the onset of the typhoon (0 h). The first pulse occurred from 8.5 to 32.5 h, with a mean water discharge of 66.2 m3 s−1. The second pulse that occurred from 32.5 to 62.5 h had a mean discharge that was 5.5 times higher of 369.2 m3 s−1. The maximum discharge (753.2 m3 s−1) was observed during the second pulse at 44.5 h (31 July 2017, at 06:00 UTC+8) (Fig. 2).
At Nanxiong Bridge, the SSC has a statistically significant positive correlation with the SAR (ρ=0.51, p<0.05). The SSC has two peaks, one during each pulse, but the SAR only shows a peak during the first pulse. During the first pulse, the SSC ranged from 10 to 33757 mg L−1, and the SAR increased from 1.44 to 3.14. During the second pulse, the SSC increased from 5445 to 16 900 mg L−1, and the SAR remained about 1.44.
The median grain size (D50) ranged from 3.9 to 8.2 µm, with an average value of 5.6 µm during the second pulse and exhibited a positive correlation with discharge (ρ=0.40). At Guting Bridge, the SSC has a statistically significant positive correlation with the SAR (ρ=0.69, p<0.05) during the survey. The SSC ranged from 164 to 19 538 mg L−1 before the first pulse and ranged from 2857 to 35 920 mg L−1 during the second pulse, while the SAR showed a mean of 1.46 and two peaks with a value over 4 during both pulses. The D50 ranged from 3.6 to 8.8 µm, with an average value of 5.3 µm during the second pulse, (Fig. 2). In terms of sediment chemistry at Guting Bridge, major elements of the two selected sediment samples show that calcium and sodium accounted for about 10 % of the mass loss between the typhoon event (5.5 h of duration) and the peak of discharge (41.5 h of duration) (Table S4).
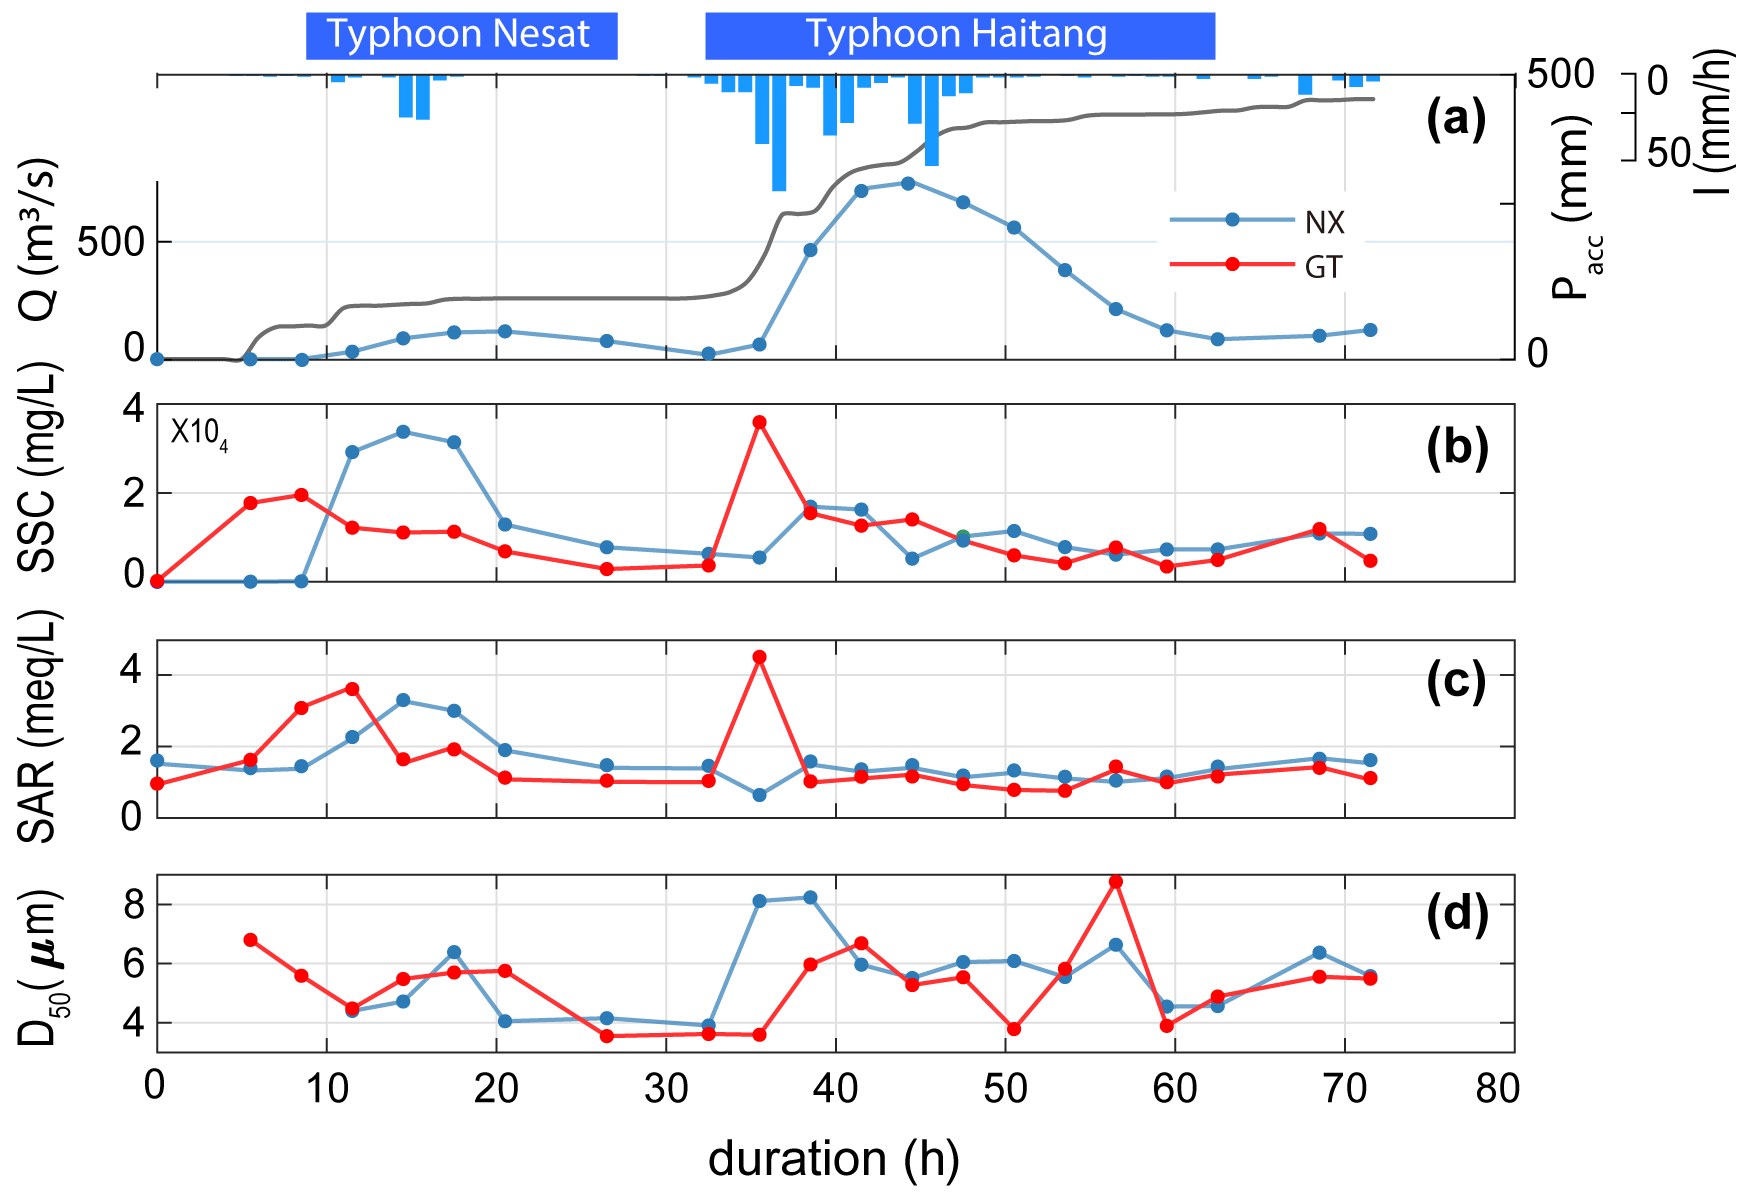
Figure 2Time series of SSC, SAR and median grain size of suspended sediment (D50) at two sampling sites. The blue line denotes hourly discharge (Q) at Nanxiong Bridge, and the blue bar denotes hourly precipitation (I) at Gutingkeng station. The grey line denotes precipitation accumulation (Pacc), the blue line denotes the Nanxiong Bridge (NX) dataset and the red line denotes the Guting Bridge (GT) dataset.
The fractional proportions of TDS at Nanxiong Bridge during baseflow show that precipitation, evaporites, silicates and carbonates contribute 3.0±1.1 % (uncertainty gives the standard error of the mean), 28.7±14.6 %, 26.9±6.5 % and 41.4±13.2 %, respectively (Fig. 3a). During the typhoon event, the proportion of TDS at Nanxiong Bridge attributed to TDSrain is 6.3±2.4 %; TDSevaporite contributes 32.4±13.6 % and increases from 27.4 % to 61.1 % at the incipient first pulse. The proportion of TDSsil contributes 39.5±15.2 %, which is 12.6 % higher than the non-typhoon period; TDScarb contributes 21.8±11.5 % (Fig. 3b), which is 19.6 % lower than the non-typhoon period. The fractional proportions of TDS at the Guting Bridge show that 6.5±2.1 % of TDS is contributed by TDSrain; TDSevaporite contributes 24.8±16.2 % and increases from 13.6 % to 61.6 % at the incipient second pulse, when the SSC and SAR peak simultaneously. The proportions of TDSsil and TDScarb contribute 39.5±15.2 % and 27.5±16.7 %, respectively (Fig. 3c).
Enriched ratios of less than 1 indicate dilution, and values greater than 1 indicate concentration. Since we set the ion concentration of rainfall to be constant during the typhoon event, the enriched ratio of precipitation is constant throughout the observation period. At Nanxiong Bridge, the enriched ratio of the evaporites increases from 0.4 to 1.7 between the two pulses and decreases to 0.1 at the discharge peak. The enriched ratio of the silicates increases from 1 to 1.5 before the first pulse and decreases to 0.1 at the peak of discharge, then returns to 1 before the observation ends. The concentration attributed to carbonates is always diluted. The enriched ratios of evaporites and carbonates have a statistically significant negative correlation with discharge (evaporites: , carbonates: −0.60, p<0.05), and the enriched ratio of silicate has a negative correlation with discharge (), indicating dilution by typhoon rainfall (Fig. 3d). At Guting Bridge, the enriched ratio of evaporites has two peaks during the two pulses with a value of 5.2 at the first peak and a value of 4.7 at the second peak. After the event, the value returns to about 1.2. Notably, the enriched ratios of the evaporites during both pulses are similar, but the peak discharge of the second pulse is 5.5 times higher than that of the first pulse. The enriched ratio of silicate has an analogous pattern with the enriched ratio of evaporites, but the enriched ratio is smaller. Similar to Nanxiong Bridge, the enriched ratio of carbonates is always diluted at Guting Bridge (Fig. 3e). The enriched ratio of evaporite and silicate shows a statistically significant positive correlation (ρ=0.96, p<0.05), and the enriched ratios of evaporite and silicate have a statistically significant positive correlation with the SAR (ρ=0.86, ρ=0.84, p<0.05). We also use the concentration–discharge (cQ) relationship of each ion (Knapp et al., 2020) at the rising and recession limb, as well as baseflow at Nanxiong Bridge to assess the state of dilution behaviour (Fig. S2). Overall, our results show that all ions are in a dilution, and the dilution in the recession limb is stronger than that in the rising limb, except for SO4 during baseflow (θ=0.07). The concentration of Na, Cl and K during baseflow have a higher variability than the values during the event. Additionally, Na, Cl and SO4 increase the concentration with increasing flow at a certain period of the rising limb.
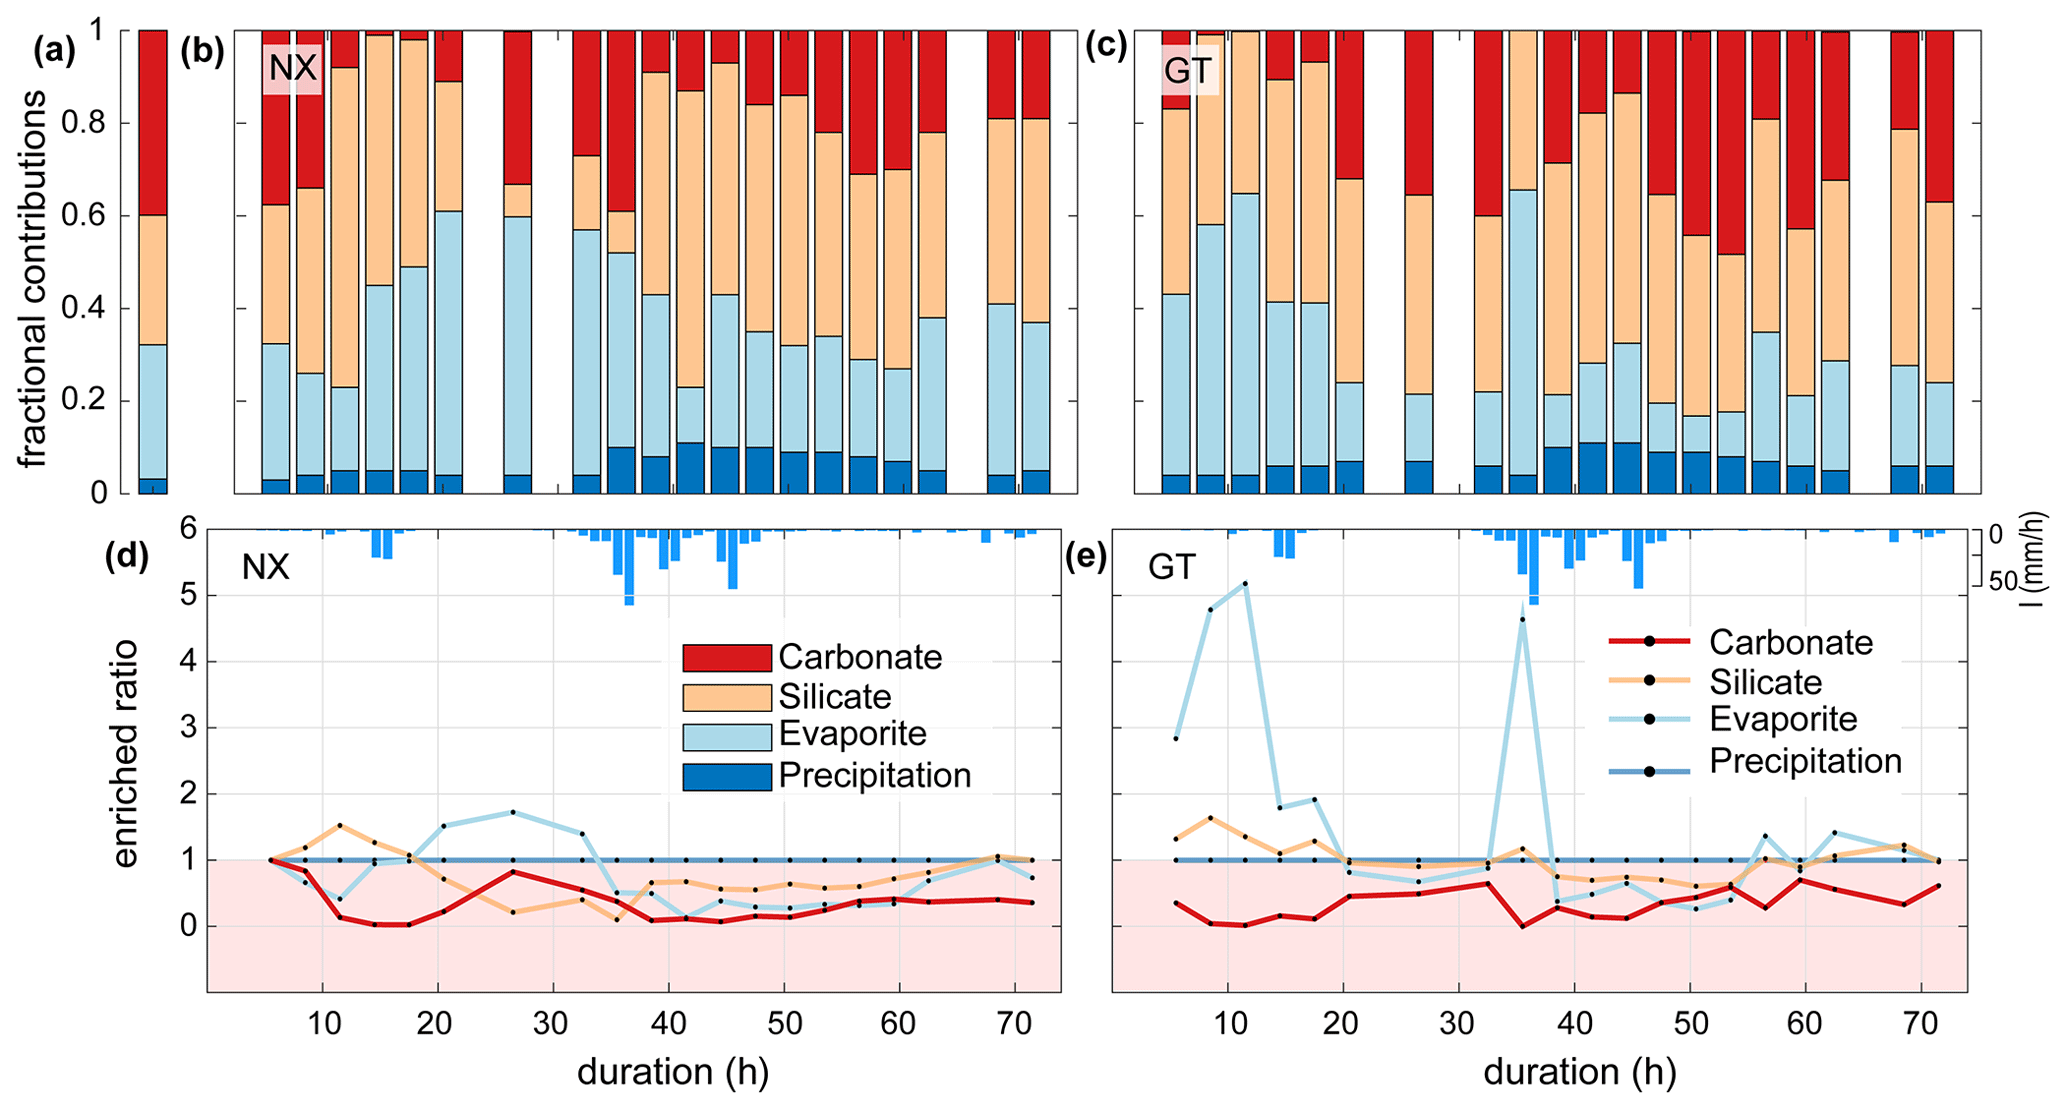
Figure 3Time series illustrating TDS sources during the typhoon event at the two sampling sites. Panel (a) shows the average proportion of TDS for the non-typhoon period from September 2014 to December 2016 at Nanxiong Bridge. Panels (b) and (c) denote the endmember contributions to TDS at the Nanxiong Bridge dataset and Guting Bridge dataset from the typhoon period; the red bar denotes TDScarb (Eq. 8); orange denotes TDSsil (Eq. 7); the azure bar denotes TDSevaporite (Eq. 6); the blue bar denotes TDSrain (Eq. 4). Panels (d) and (e) denote the enriched ratio of ion concentrations by TDS sources from the Nanxiong Bridge dataset and Guting Bridge dataset during the typhoon period; the red line denotes TDScarb; the orange line denotes TDSsil; the azure line denotes TDSevaporite; the blue line denotes the TDSrain; the blue bar denotes hourly precipitation (I) at the GTK station.
4.2 Evaporite, silicate and carbonate dissolution over time
We calculated the enriched ratios of ions (i.e. Na+, Cl−, Ca2+ and SO that are sourced from evaporites (i.e. halite (NaCl) and gypsum (CaSO4)). The variability in the concentrations of each of these ions reflects the overall trends in TDS (Figs. 3d, e, 4).
At Nanxiong Bridge, all evaporite and carbonate ions have a statistically significant negative correlation with discharge. The enriched ratios of evaporite Na+, Cl− and SO have the same trend (Fig. 4), which show an initial decrease during the first pulse, followed by an increase to 2 between the two pulses and a final decrease during the second pulse. Evaporite Ca2+ shows a similar trend with evaporite Na+, Cl− and SO, but the values are below 1. The enriched ratios of silicate Na+ and Ca2+ show an increase during the first pulse and a decrease to less than 1 before the rainfall peak, followed by an increase from about 0.06 to 1.11 at the end of observation. At Guting Bridge, all evaporite ions have a statistically significant positive correlation with the corresponding silicate ions (Na+, ρ=0.98; Ca+, ρ=0.81, p<0.05). Evaporite Na+, Cl− and SO each have two peaks that occur prior to the maximum rainfall and reflect a factor of 5 increase in the enriched ratio. Compared with Nanxiong Bridge (downstream), the enriched ratio of evaporite Ca2+ at Guting Bridge concentrates at the onset of the first pulse and after peak discharge. Additionally, the enriched ratios of carbonate at Guting Bridge are similar to Nanxiong Bridge and are always below 1.
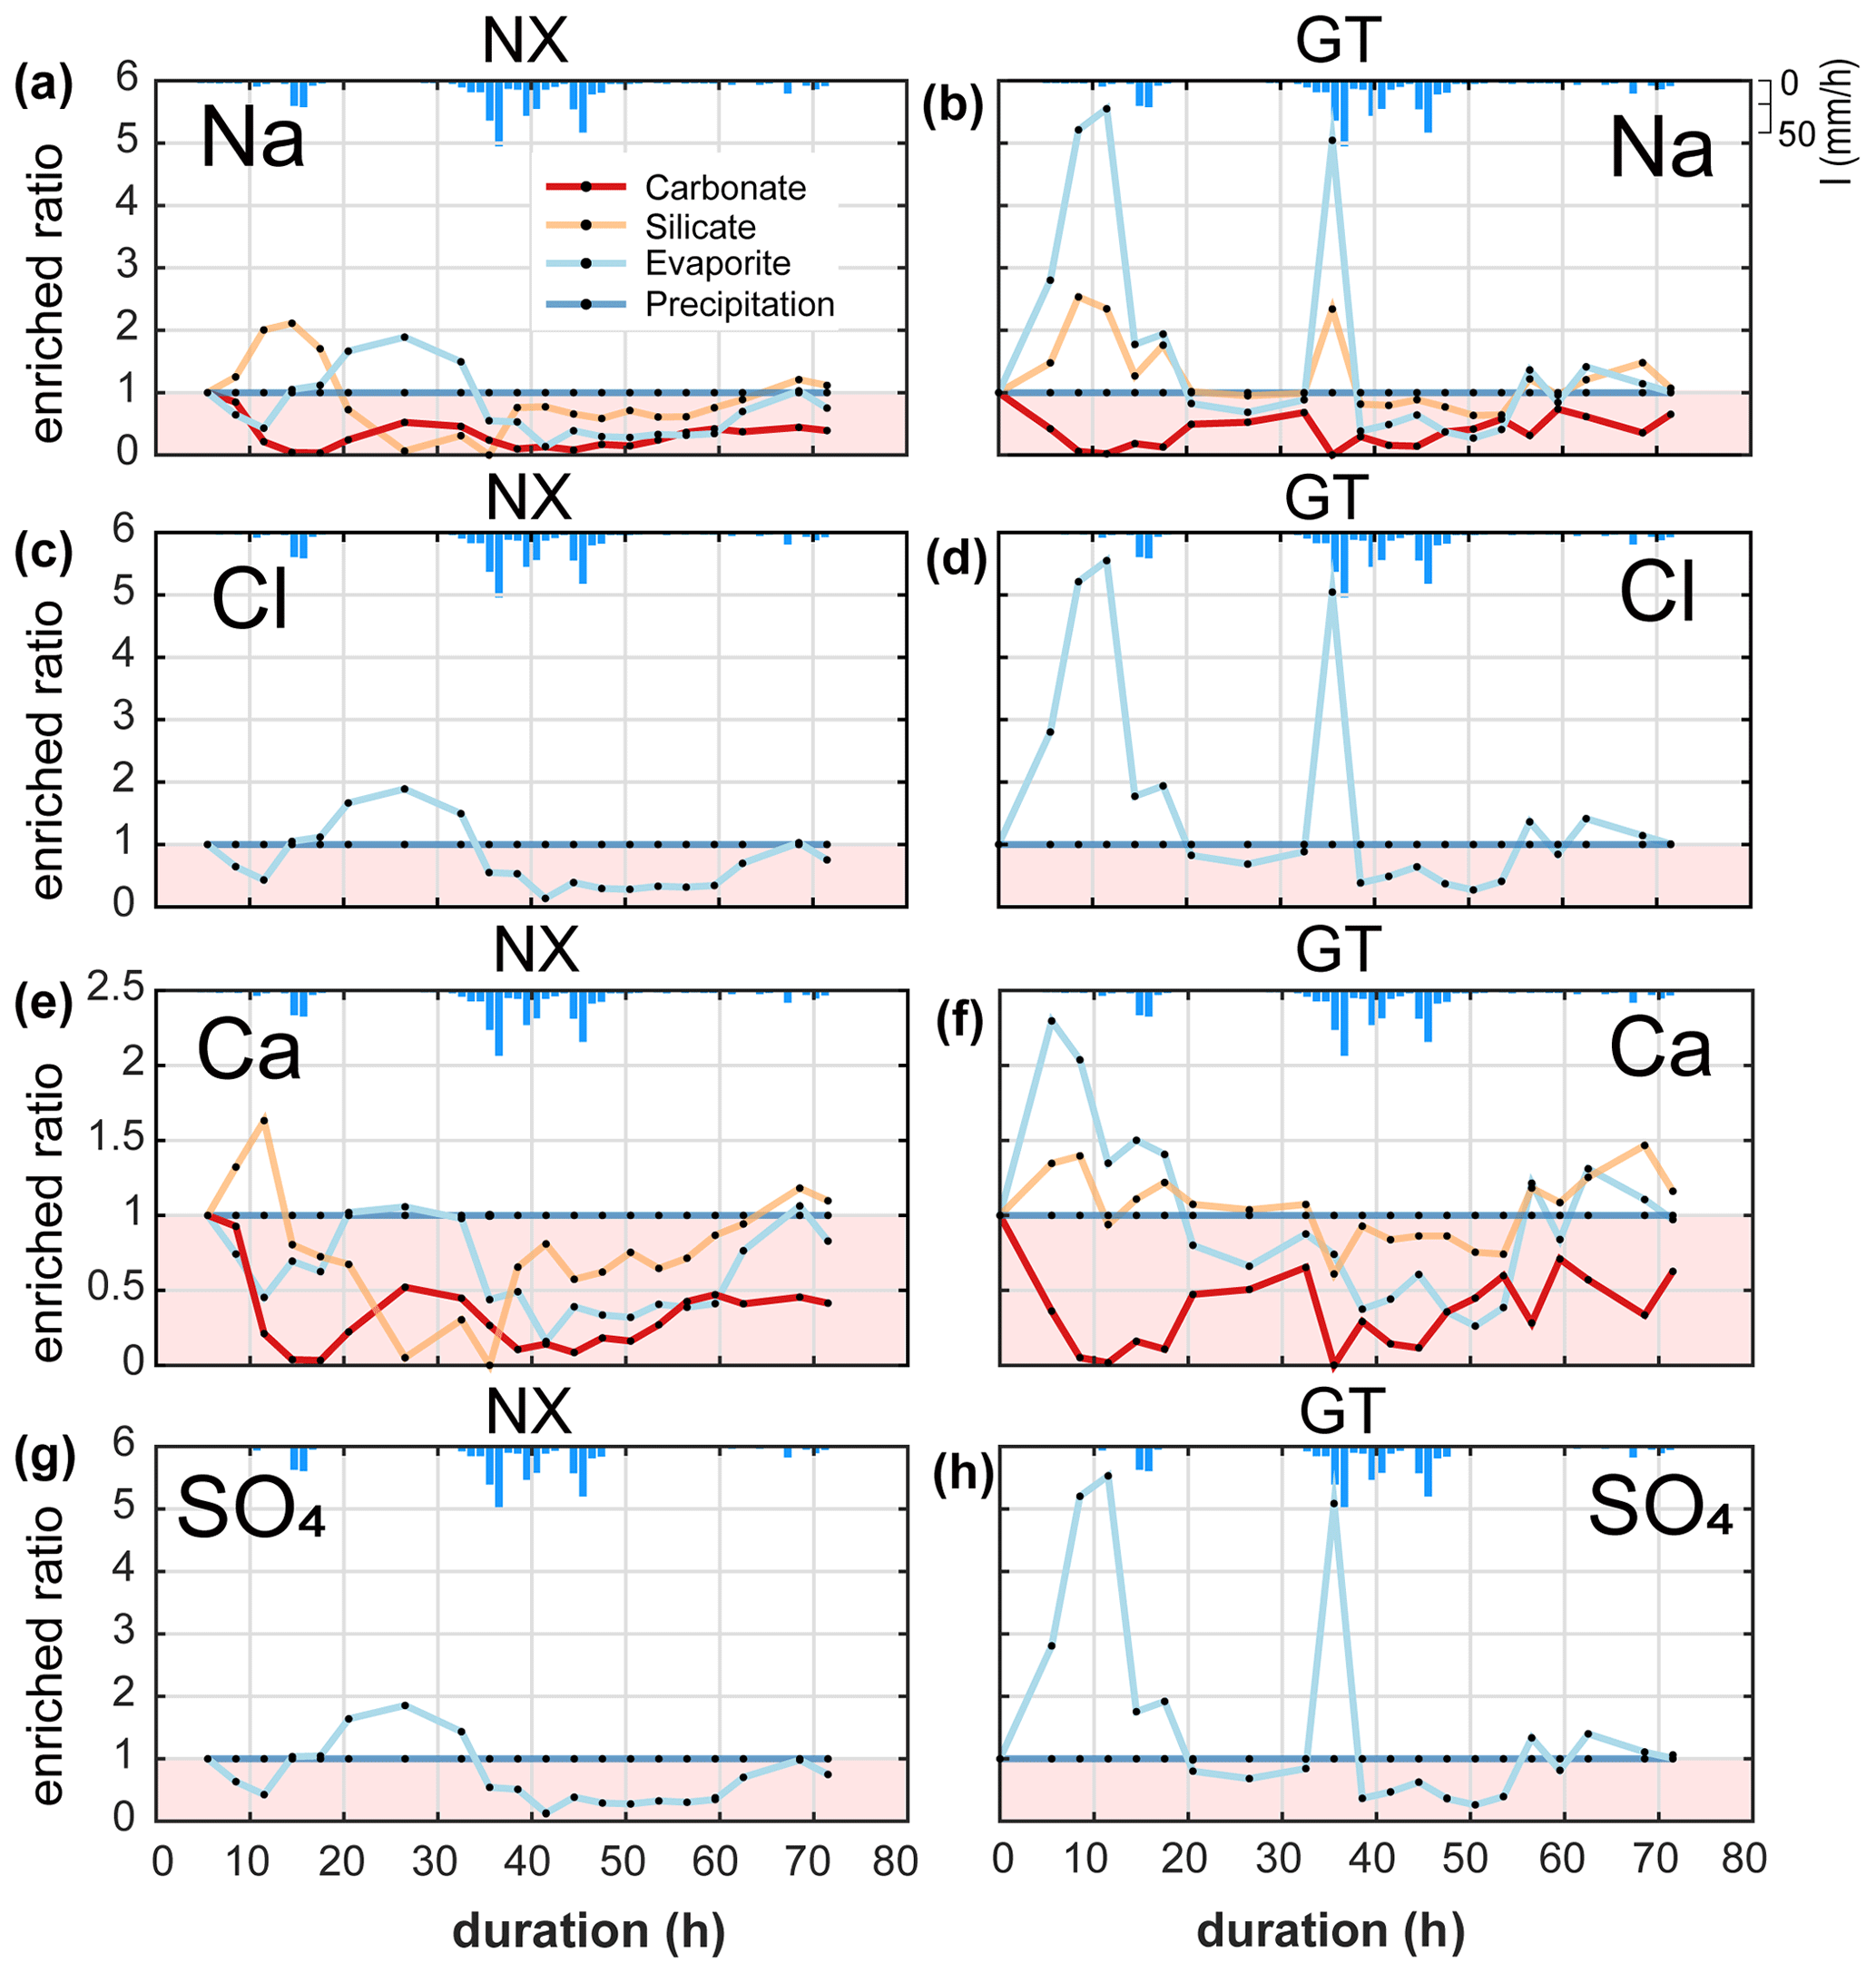
Figure 4Time-series patterns in enriched ratio at two sampling sites. NX denotes the Nanxiong Bridge dataset, and GT denotes the Guting Bridge dataset. The pink area indicates enriched values below 1. The blue bar denotes hourly precipitation (I) at Gutingkeng station.
Gaillardet et al. (1999) documented that dissolved ion ratios of Ca Sr and Na Sr are distinct for carbonates (low Na Sr, high Ca Na) versus silicates or evaporites (high Na Sr, low Ca Na). We use these ratios to elucidate potential mixing between carbonates, silicates and evaporite endmembers (Fig. 5). At Nanxiong Bridge, non-typhoon ratios of Na (1000 ⋅ Sr) and Ca (1000 ⋅ Sr) are 0.23–0.68 and 0.19–0.35, respectively (Table S4). These values increase markedly during the typhoon events, with enriched ratios of Na+ exceeding 5 at T=11.5 and 35.5 h. The high concentrations of Na+, Cl− and SO (as illustrated in the enriched ratio) indicate that there is an enhanced dissolution of evaporites at the onset of the typhoon event, especially at Guting Bridge. Subsequently, the concentration of Na+ decreased with sustained rainfall. Then, the ratios approach the silicate or carbonate weathering (high Na Sr, high Ca Sr ratios) after the peak discharge.
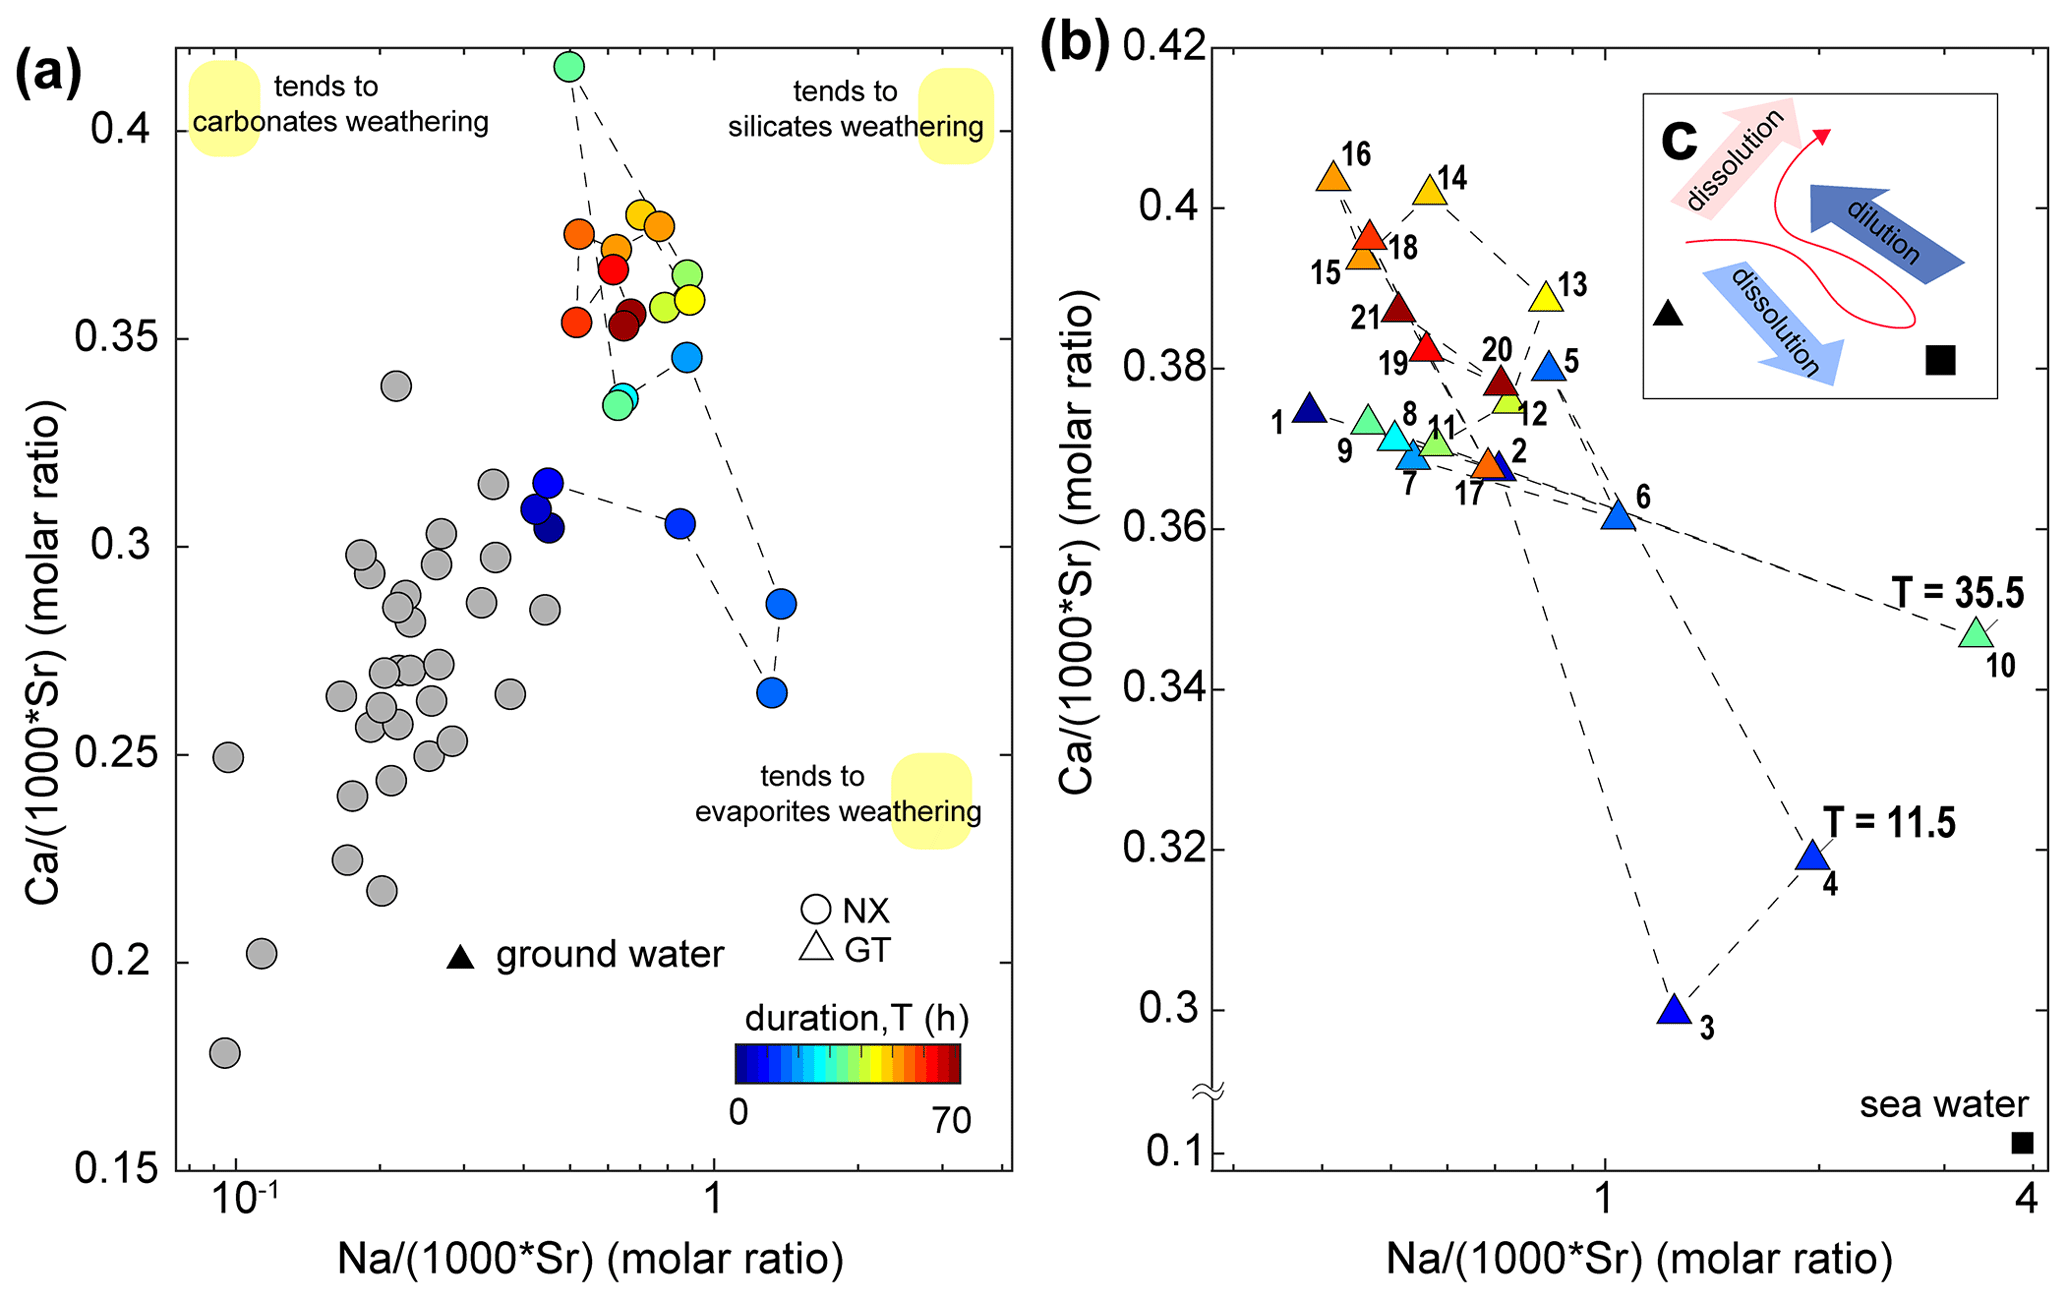
Figure 5Molar ratio mixing diagrams of Erren River waters for (a, b) Na (1000 ⋅ Sr) versus Ca (1000 ⋅ Sr); circles denote the dataset at Nanxiong Bridge, and triangles denote the dataset at Guting Bridge. The colour bar denotes survey duration. Grey circles denote the dataset at Nanxiong Bridge during baseflow conditions from 2014 to 2016. The black triangle illustrates the groundwater endmember (Chao et al., 2011); the black square illustrates the seawater endmember. Numbers in the triangle represent the time sequence: 1 represents the start point, and 21 represents the endpoint. Yellow areas indicate trends in weathering types rather than the locations of the endmember. Illustration of dynamic weathering: the red line indicates the direction of change with time, the light-blue arrow denotes dissolution of evaporite, the dark-blue arrow denotes dilution from rainfall, and the red arrow denotes dissolution of suspended sediment.
5.1 Relationships between dissolved evaporite and river water chemistry
Before the survey, the monthly rainfall of the study area was 72.5 mm, which is only 18 % of the average monthly rainfall, implying that it provides a relatively dry environment for accumulating evaporites on the slope surface. Under maximum rainfall intensity, Na+, Cl− and SO at Guting Bridge show markedly increased concentrations at the onset of the typhoon, peaks in enriched ratios that exceed 5 (Fig. 4), and the greatest contribution of dissolved ions from evaporites (Fig. 3). Calculated with pore water chemistry during the dry season from the same study site, the sodium adsorption ratio (SAR) is 240.8 and exceeds the threshold value of 13. During the typhoon event, the river water SAR has a maximum value of 4.41 at Guting Bridge (3.14 at Nanxiong Bridge), suggesting soil deflocculation within the river is weaker than on the hillslopes. However, the SAR has a statistically significant positive correlation with TDSevaporite (ρ=0.86, p<0.05) at Guting Bridge (upstream). This pattern indicates that excess sodium is effective at inducing material dispersion at hillslopes, and, thus contributing to a higher suspended sediment load. The trend of the river water SAR is able to reflect the extent of dissolved Na+ from the hillslope (Fig. 2).
These observations and results suggest that rainwater in the typhoon event rapidly dissolves the evaporites on the slope surface, which produces high measured concentrations of Na+, Cl− and SO during the time of peak precipitation (30–40 h of duration). Furthermore, the dissolution of the near-surface evaporite deposits should be most heavily influenced by runoff from the hillslopes, so we expect that excess sodium and enhanced erosion will be most significant on the hillslopes.
At Nanxiong Bridge, we observe a 10 h delay in the peak enriched ratio relative to the SAR (Fig. 3d) and overall lower enriched ratios relative to Guting Bridge (Fig. 3d, e). We suggest that dilution and the transport distance from the badlands are responsible for this. The two catchments have a similar areal extent of badlands within the total catchment area, which is about 2.49 % at Nanxiong Bridge catchment and 2.37 % in Guting Bridge catchment. Badlands contribute considerable evaporite solutes (Chou, 2008), but the higher downstream drainage area will result in dilution of the solutes without additional inputs. Additionally, Nakata and Chigira (2009) have observed that salt dissolution induces an increase in electrical conductivity during intermittent rainfall events and decreases gradually after rainfall events when evaporation and salt precipitate. Therefore, re-crystallisation during the transportation is to be expected.
5.2 From evaporite dissolution to silicate weathering
Our results show that the typhoon is responsible for mobilising 16.8 t km−2 yr−1 of dissolved solutes derived from silicate weathering during the course of the event, and this flux corresponds to 16.6 % of the annual silicate weathering flux (Table S3). Additionally, we observed a change in the dominant chemical weathering mechanism during the typhoon event. We rule out significant contributions from baseflow and deep seawater after peak discharge, since ratios shift to higher Na Sr and Ca Sr ratios relative to the non-typhoon ratio (Fig. 5a, b), and the Ca Sr ratio of mud volcanoes in the study site is 1 order of magnitude less than river water (Chao et al., 2011). Carbonate weathering is the primary contributor of Ca2+ for most of the world's large rivers (Gaillardet et al., 1999), but the increased Na+ and consistently enriched ratio of carbonate Ca2+ does not make this a likely main contributor to the Erren River during the typhoon. We thus suggest that the principal source of dissolved solutes is likely to be silicate weathering. This interpretation is supported by the temporal evolution of the enriched ratio of silicate Ca2+, which gradually increases after the discharge peak, to approach a value of about 1 at the end of the survey (Fig. 4e, f). Therefore, we suggest that the ratios shift to higher Na Sr and Ca Sr ratios due to enhanced silicate weathering during the typhoon. We also observe a 10 %–18 % loss in the individual concentrations of Ca, Na, Al and Sr in the suspended sediment during the course of the typhoon event, whereas concentrations of Fe, K, Mg and Mn increase by 3 %–10 % (Table S6). The dissolution kinetics of silicate weathering are multiple orders of magnitude slower than carbonate or evaporite weathering (Meybeck, 1987), suggesting that significant weathering of fresh silicate minerals over the course of a single typhoon event is unlikely. Thus, the observed changes in ion concentrations during the event are likely to arise from heterogeneities in the bedrock composition or the input of previously weathered silicate minerals from a deeper groundwater reservoir (Calmels et al., 2011), which is different from the groundwater source of baseflow during non-typhoon periods. However, quantifying the role of a deeper groundwater inputs is difficult in the absence of isotope data.
Given that the sediment transported in the channel is supplied by physical erosion, we suggest that physical erosion in our study site enhances silicate chemical weathering, which is consistent with previous studies (Chung, 2002; Chou, 2008). Moreover, we associate the change in weathering regime during the course of the typhoon with abrasive erosion of silicate sediments in the channel. Mechano-chemical dissolution of weakly bound ions, e.g. F− from the fresh muscovite surfaces, is driven by abrasion under high-energy sediment transport with reorganisation of the river bed (Andermann et al., 2022). Mudstones are mainly composed of silicate minerals (e.g. illite and chlorite minerals) (Tsai, 1984) and a few swelling clay minerals (e.g. montmorillonite), which provide an abundant silicate pool. We suggest that high suspended sediment concentrations, combined with high-energy flow during the typhoon, caused increased silicate input from the weathered silicates in the suspended sediment, which has also been observed in typhoon-driven silicate chemical weathering from silicate minerals at the surface (Meyer et al., 2017). Importantly, the global annual silicate weathering flux of rivers is 15.7 t km−2 yr−1 (Gaillardet et al. 1999), relative to our value of 16.8 t km−2 yr−1, suggesting that individual stochastic events may have global relevance.
5.3 Typhoon-controlled cycles of physical and chemical erosion
Evaporites, including halite (NaCl) and gypsum (CaSO4), are found in few sedimentary environments, and they are often excluded from the estimation of CO2 consumption (Gaillardet et al., 1999). Compared to silicate rocks, the relation between evaporite weathering and physical erosion has rarely been discussed. Through the interactions among riverine chemistry, suspended sediment properties and previous soil water chemistry studies, we suggest a positive feedback cycle of physical–chemical erosion driven by mobile dissolved evaporite (Fig. 5). The feedback cycle includes three steps.
-
The first step includes precipitation and deposition of evaporite during the dry season in near-surface mudstone desiccation cracks through capillary transport (Higuchi et al., 2013, 2015; Nakata and Chigira, 2009). In the dry season, exposed bedrock with low water content develops desiccation cracks (Allen, 1982; Goehring et al., 2010; Kindle, 1917; Seghir and Arscott, 2015; Xiaa and Hutchinson, 2000), providing space for the reprecipitation of evaporite minerals. Using evidence from core samples in mudstone bedrock at the study site, the crack depth of about 20 cm can be regarded as the thickness of the weathering layer. Higuchi et al. (2013) suggested that the weathering layer in the top 10 cm of mudstone can easily be eroded by intense rainfall. Erosion exposes fresh bedrock, which would dry in the following dry season and further produce weatherable material.
-
Rainfall dissolves the evaporites, producing sodic water that increases physical erosion during typhoon events. The resulting dissolved sodium causes higher hillslope erosion by deflocculation, leading to increased suspended sediment in the channels. In the study site, the hillslope erosion rate is about 9–30 cm yr−1 (Higuchi et al., 2013; Yang et al., 2021a). At Nanxiong Bridge, the denudation rate approaches about 142 857 t km−2 yr−1, measured from the river suspended load (Dadson et al., 2003), and the chemical weathering flux is 124–237 t km−2 yr−1 (Chou, 2008; this study). The high hillslope erosion rate ensures a steady supply of freshly exposed bedrock, allowing for high chemical weathering rates.
-
Physical erosion enhances silicate weathering and bedrock exposure on hillslopes. Clay minerals in mudstone deposits are abraded from the abundantly available sediment and provide material for silicate weathering in streams. Ultimately, with frequent typhoon events and high temperatures in the study area, this dynamic cycle could repeat several times a year.

Figure 6Cycle of feedback between physical erosion rate (PER) and solute flux in badland catchments. Red blocks represent dry season conditions. The blue region represents typhoon conditions. The brown region represents the bedrock and indicates the type and proportion of minerals of mudstone (Tsai, 1984).
We presented major element compositions of stream water from two sites in the Erren River catchment at 3 h intervals during a 3 d typhoon event in 2017. At Guting Bridge (upstream), TDSevaporite is covariant with TDSsil, the sodium adsorption ratio and the suspended sediment concentration, which can be assigned to dissolved evaporite (e.g. halite and gypsum). The excess sodium in the evaporite deposits causes material dispersion through deflocculation, which enhances the suspended sediment flux. Our observations show that the water chemistry of the typhoon event is mainly contributed by silicate weathering at 16.8 t km−2 yr−1 and evaporite weathering at 10.9 t km−2 yr−1, in contrast with baseflow (non-typhoon) conditions that are mainly contributed by carbonate weathering. Moreover, during the course of the typhoon, we observed a shift from predominantly evaporite weathering during peak precipitation to silicate weathering at peak discharge.
Combining the observation of riverine chemistry, suspended sediment properties and previous soil water chemistry studies, we propose a feedback cycle between physical erosion and chemical weathering in badlands topography, illustrating that precipitation of evaporites during the dry season produces sodic water during typhoon events and preferentially triggers higher local erosion. The enhanced hillslope erosion and abrasive effects of clay in a high-discharge stream enhance bedrock exposure on hillslopes and silicate weathering, respectively. Newly exposed bedrock then produces more weathered material. Although measurements of the bedrock mineral chemistry and Sr isotope are still needed for confirming sources of excess sodium and calcium (Fig. 5), we suggest that the conceptual model could provide an insight into landscape change of badlands. The results from our study suggest that high erosion rates in mudstone badlands of the Erren River catchment are due to both weakened lithology and the interaction between evaporites and hillslope erosion.
Relevant data supporting the findings of the study are available in the Supplement or from the corresponding author upon request. Source data are provided with this paper.
The supplement related to this article is available online at: https://doi.org/10.5194/esurf-11-475-2023-supplement.
CJY designed the study and conducted field surveys, data analysis and modelling. PHC conducted data analysis. SX conducted modelling. TYT provided the verified data. JCL and JCH contributed to the scientific discussion and interpretation. CJY, EDE and JMT wrote the paper with the input of all authors.
At least one of the (co-)authors is a member of the editorial board of Earth Surface Dynamics. The peer-review process was guided by an independent editor, and the authors also have no other competing interests to declare.
Publisher’s note: Copernicus Publications remains neutral with regard to jurisdictional claims in published maps and institutional affiliations.
We express our gratitude to Kai Deng, Chao-Yuan Lin and Niels Hovius for fruitful discussions that greatly improved this work. Special thanks are also given to Sheng-Wei Guo and Meng-Chang Lu for field work, Kai Deng for sediment chemistry analysis, and David Puhl for assistance of grain-size analysis. This study was supported by grants from the National Science and Technology Council, Taiwan, to Ci-Jian Yang (MOST 110-2917-I-564-009-).
The article-processing charges for this open-access publication were covered by the Helmholtz Centre Potsdam – GFZ German Research Centre for Geosciences.
This paper was edited by Robert Hilton and reviewed by two anonymous referees.
Allen, J. R. L.: Sedimentary structures: Their Character and Physical Basis, Developments in sedimentology, 30B, II, Elsevier, Amsterdam, ISBN 9780444419354, 1982.
Andermann, C., Galy, A., Hennig, S., Zimmermann, B., Tipper, E. T., Erlanger, E., Cook, K. L., Schleicher, A., Benning, L., and Hovius, N.: Erosion and weathering forensics of a catastrophic glacial lake outburst flood in Nepal, EGU General Assembly 2022, Vienna, Austria, 23–27 May 2022, EGU22-10417, https://doi.org/10.5194/egusphere-egu22-10417, 2022.
Anderson, S. P., Dietrich, W. E., and Brimhall, G. H.: Weathering profiles, mass-balance analysis, and rates of solute loss: linkages between weathering and ero-sion in a small, steep catchment, Bull. Geol. Soc. Am., 114, 1143–1158, https://doi.org/10.1130/0016-7606(2002)114<1143:WPMBAA>2.0.CO;2, 2002.
Ayers, R. and Westcot, D.: Water quality for agriculture, FAO Irrigation and drainage paper NO. 29, 1–174, ISBN 10 92-5-102263-1, 1985.
Berner, R. A., Lasaga, A. C., and Garrels, R. M.: The carbonate–silicate geochemical cycle and its effect on atmospheric carbon-dioxide over the past 100 million years, Am. J. Sci., 283, 641–683, https://doi.org/10.2475/ajs.283.7.641, 1983.
Burke, A., Present, T., Paris, G. R., Emily, C. M., Sandilands, B., Gaillarde, J., Peucker-Ehrenbrink, B., Fischer, W. W., McClelland, J. W., Spencer, R. G. M., Voss, B. M., and Adkins, J. F.: Sulfur isotopes in rivers: Insights into global weathering budgets, pyrite oxidation, and the modern sulfur cycle, Earth Planet. Sc. Lett., 496, 168–177, https://doi.org/10.1016/j.epsl.2018.05.022, 2018.
Calmels, D., Galy, A., Hovius, N., Bickle, M. J., West, A. J., Chen, M.-C., and Chapman, H.: Contribution of deep groundwater to the weathering budget in a rapidly eroding mountain belt, Taiwan, Earth Planet. Sc. Lett., 303, 48–58, https://doi.org/10.1016/j.epsl.2010.12.032, 2011.
Carey, A. E., Gardner, C. B., Goldsmith, S. T., Lyons, W. B., and Hicks, D. M.: Organic carbon yields from small, mountainous rivers, New Zealand, Geophys. Res. Lett., 32, 15404, https://doi.org/10.1029/2005GL023159, 2005.
Chao, H.-C., You, C.-F., Wang, B.-S., Chung, C.-H., and Huang, K.-F.: Boron isotopic composition of mud volcano fluids: Implications for fluid migration in shallow subduction zones, Earth Planet. Sc. Lett., 305, 32–44, https://doi.org/10.1016/j.epsl.2011.02.033, 2011.
Cheng, Y.-C., Yang, C.-J., and Lin, J.-C.: Application for Terrestrial LiDAR on Mudstone Erosion Caused by Typhoons, Remote Sens.-Basel, 11, 2425, https://doi.org/10.3390/rs11202425, 2019.
Chou, C.-L.: Sediment Weathering and River Water Chemistry in the Erren Drainage Basin, Southern Taiwan, Master thesis of Department of Earth Sciences, National Cheng Kung University, 1–103, https://thesis.lib.ncku.edu.tw/thesis/detail/ade6a639147633355be218fc9dd3faa9/ (last access: 17 May 2023), 2008.
Chung, S.-L.: Preliminary Geochemical and Isotopes study of the Erren river water, Master thesis of Department of Earth Sciences, National Cheng Kung University, 1–95, https://hdl.handle.net/11296/686h7q (last access: 17 May 2023), 2002.
Clift, P. D., Wan, S., and Blusztajn, J.: Reconstructing chemical weathering, physical erosion and monsoon intensity since 25 Ma in the northern South China Sea: A review of competing proxies, Earth-Sci. Rev., 130, 86–102, https://doi.org/10.1016/j.earscirev.2014.01.002, 2014.
Dadson, S. J., Hovius, N., Chen, H., Dade, W. B., Hsieh, M.-L., Willett, S. D., Hu, J.-C., Horng, M.-J., Chen, M.-C., Stark, C. P., Lague, D., and Lin, J.-C.: Links between erosion, runoff variability and seismicity in the Taiwan orogen, Nature, 426, 648–651, https://doi.org/10.1038/nature02150, 2003.
Emberson, R., Hovius, N., Galy, A., and Marc, O.: Chemical weathering in active mountain belts controlled by stochastic bedrock landsliding, Nat. Geosci., 9, 42–47, https://doi.org/10.1038/ngeo2600, 2016.
Faulkner, H., Alexander, R., Teeuw, R., and Zukowskyj, P.: Variations in soil dispersivity across a gully head displaying shallow sub-surface pipes, and the role of shallow pipes in rill initiation, Earth Surf. Proc. Land., 29, 1143–1160, https://doi.org/10.1002/esp.1109, 2004.
Gaillardet, J., Dupre, B., Louvat, P., and Allegre, C. J.: Global silicate weathering and CO2 consumption rates deduced from the chemistry of large rivers, Chem. Geol., 159, 3–30, https://doi.org/10.1016/S0009-2541(99)00031-5, 1999.
Goehring, L., Conroy, R., Akhter, A., Cleggb, W. J., and Routh, A. F.: Evolution of mud-crack patterns during repeated drying cycles, Soft Matter, 6, 3562–3567, https://doi.org/10.1039/B922206E, 2010.
Hanson, B., Grattan, S. R., and Fulton, A.: Agricultural salinity and drainage, University of California Irrigation Program, Davis, ISBN 160107946X, 9781601079466, 1999.
Hartshorn, K., Hovius, N., Dade, W. B., and Slingerland, R. L.: Climate-Driven Bedrock Incision in an Active Mountain Belt, Science, 297, 2036–2038, https://10.1126/science.1075078, 2002.
Higuchi, K., Chigira, M., and Lee, D.-H.: High rates of erosion and rapid weathering in a Plio-Pleistocene mudstone badland, Taiwan, Catena, 106, 68–82, https://doi.org/10.1016/j.catena.2012.11.005, 2013.
Higuchi, K., Chigira, M., Lee, D.-H., and Wu, J.-H.: Rapid weathering and erosion of mudstone induced by saltwater migration near a slope surface, J. Hydrol. Eng., 20, C6014004, https://doi.org/10.1061/(ASCE)HE.1943-5584.0001105, 2015.
Horneck, D. S., Ellsworth, J. W., Hopkins, B. G., Sullivan, D. M., and Stevens, R. G.: Managing Salt-Affected Soils for Crop Production, PNW 601-E, Oregon State University, University of Idaho, Washington State University, https://catalog.extension.oregonstate.edu/pnw601 (last access: 15 May 2023), 2007.
Huang, J.-C., Lee, T.-Y., Kao, S.-J., Hsu, S.-C., Lin, H.-J., and Peng, T.-R.: Land use effect and hydrological control on nitrate yield in subtropical mountainous watersheds, Hydrol. Earth Syst. Sci., 16, 699–714, https://doi.org/10.5194/hess-16-699-2012, 2012.
Kašanin-Grubin, M., Vergari, F., Troiani, F., and Seta, M. D.: The role of lithology: parent material controls on badland development, in: Badlands dynamics in a context of global change, chap. 3, edited by: Nadal-Romero, E., Martínez-Murillo, J. F., and Kuhn, N. J., Elsevier, 61–109, ISBN 9780128130544, https://doi.org/10.1016/B978-0-12-813054-4.00003-4, 2018.
Kemeny, P. C. and Torres, M. A.: Presentation and applications of mixing elements and dissolved isotopes in rivers (MEANDIR), a customizable MATLAB model for Monte Carlo inversion of dissolved river chemistry, Am. J. Sci., 321, 579–642, https://doi.org/10.2475/05.2021.03, 2021.
Kindle, E. M.: Some factors affecting the development of mud-cracks, J. Geol., 25, 135–144, https://doi.org/10.1086/622446, 1917.
Knapp, J. L. A., von Freyberg, J., Studer, B., Kiewiet, L., and Kirchner, J. W.: Concentration–discharge relationships vary among hydrological events, reflecting differences in event characteristics, Hydrol. Earth Syst. Sci., 24, 2561–2576, https://doi.org/10.5194/hess-24-2561-2020, 2020.
Lee, Y.-J., Chen, P.-H., Lee, T.-Y., Shih, Y.-T., and Huang, J.-C.: Temporal variation of chemical weathering rate, source shifting and relationship with physical erosion in small mountainous rivers, Taiwan, Catena, 190, 104516, https://doi.org/10.1016/j.catena.2020.104516, 2020.
Levy, G. J., Eisenberg, H., and Shainberg, I.: Clay dispersion as related to soil properties and water permeability, Soil Sci., 155, 15–22, https://doi.org/10.1097/00010694-199301000-00003, 1993.
Lu, S.-C. and Lin, N.-H.: Monitoring and component analysis of acid rain research project, Environmental Protection Agency, Taiwan, https://data.epa.gov.tw/dataset/detail/ACIDR_P_04?fbclid= IwAR1F4dLJSkS8VyU9HbWFCsFy-i6y1CGjSD7Tsoe3lJCXjgl0ycuBUcuby20 (last access: 17 May 2023), 2014.
Lyons, W. B., Carey, A. E., Hicks, D. M., and Nezat, C. A.: Chemical weathering in high-sediment-yielding watersheds, New Zealand, J. Geophys. Res.-Earth, 110, 11, https://doi.org/10.1029/2003JF000088, 2005.
Maher, K. and Chamberiain, C. P.: Hydrological Regulation of Chemical Weathering and the Geologic Carbon Cycle, Science, 343, 1502–1504, https://doi.org/10.1126/science.1250770, 2014.
Meybeck, M.: Global chemical weathering of surficial rocks estimated from river dissolved, Am. J. Sci., 287, 401–428, https://doi.org/10.2475/ajs.287.5.401, 1987.
Meyer, K. J., Carey, A. E., and You, C.-F.: Typhoon impacts on chemical weathering source provenance of a High Standing Island watershed, Taiwan, Geochim. Cosmochim. Ac., 215, 404–420, https://doi.org/10.1016/j.gca.2017.07.015, 2017.
Milligan, A. J. and Morel, F. M. M.: A proton buffering role for silica in diatoms, Science, 297, 1848–1850, https://doi.org/10.1126/science.1074958, 2002.
Mitchell, J. K.: Volume change behavior, in: Fundamentals of Soil Behavior, edited by: Mitchell, J. K. and Soga, K., Wiley, 293–333, ISBN 0471856401, 9780471856405, 1993.
Moon, S., Huh, Y., Qin, J. H., and van Pho, N.: Chemical weathering in the Hong (Red) River basin: Rates of silicate weathering and their controlling factors, Geochim. Cosmochim. Ac., 71, 1411–1430, https://doi.org/10.1016/j.gca.2006.12.004, 2007.
Nadler, A., Levy, G. J., Keren, R., and Eisenberg, H.: Sodic Calcareous Soil Reclamation as Affected by Water Chemical Composition and Flow Rate, Soil Sci. Soc. Am. J., 60, 252, https://doi.org/10.2136/sssaj1996.03615995006000010038x, 1996.
Nakata, E. and Chigira, M.: Geochemistry of erosion processes on badland slopes. A case study of the Gutingkeng formation where mud volcanoes are distributed in southern Taiwan, J. Geogr., 118, 511–532, 2009.
Raymo, M. and Ruddiman, W.: Tectonic forcing of late Cenozoic climate, Nature, 359, 117–122, https://doi.org/10.1038/359117a0, 1992.
Rengasamy, P. and Olsson, K. A.: Sodicity and soil structure, Aust. J. Soil Res., 29, 935–952, https://doi.org/10.1071/SR9910935, 1991.
Rengasamy, P., Greene, R. S. B., Ford, G. W., and Mehanni, A. H.: Identification of dispersive behavior and the management of red-brown earths, Aust. J. Soil Res., 22, 413–443, https://doi.org/10.1071/SR9840413, 1984.
Seelig, B. D.: Salinity and Sodicity in North Dakota Soils, EB-57, North Dakota State University, Fargo, ND, http://hdl.handle.net/10365/5412 (last access: 17 May 2023), 2000.
Seghir, R. and Arscott, S.: Controlled mud-crack patterning and self-organized cracking of polydimeth, Sci. Rep., 5, 14787, https://doi.org/10.1038/srep14787, 2015.
Sherard, J. L., Dunnigan, L. P., Decker, R. S., and Steele, E. F.: Identification and nature of dispersive soils, J. Geotech. Eng., 102, 287–301, 1976.
Tsai, J.-L.: The study on mineral compositions of southwestern mudstone formation in Taiwan, Investigation Project Report of National Science Council, NSC 73-0414-P006-011, 1984.
Wang, C.-H., Liou, Y.-S., Chen, P.-H., and Huang, J.-C.: Tropical cyclones likely enhance chemical weathering but suppress atmospheric CO2 consumption in landslide-dominated catchments, Biogeochemistry, 154, 537–554, https://doi.org/10.1007/s10533-021-00805-8, 2021.
Xia, Z. C. and Hutchinson, J. W.: Crack patterns in thin flims, J. Mech. Phys. Solids., 48, 1107–1131, https://doi.org/10.1016/S0022-5096(99)00081-2, 2000.
Yang, C.-J., Yeh, L.-W., Cheng, Y.-C., Jen, C.-H., and Lin, J.-C.: Badland Erosion and Its Morphometric Features in the Tropical Monsoon Area, Remote Sens.-Basel, 11, 3051, https://doi.org/10.3390/rs11243051, 2019.
Yang, C.-J., Turowski, J. M., Hovius, N., Lin, J.-C., and Chang, K.-J.: Badland landscape response to individual geomorphic events, Nat. Commun., 12, 4631, https://doi.org/10.1038/s41467-021-24903-1, 2021a.
Yang, C.-J., Jen, C.-H., Cheng, Y.-C., and Lin, J.-C.: Quantification of mudcracks-driven erosion using terrestrial laser scanning in laboratory runoff experiment, Geomorphology, 375, 107527, https://doi.org/10.1016/j.geomorph.2020.107527, 2021b.