the Creative Commons Attribution 4.0 License.
the Creative Commons Attribution 4.0 License.
 | 09 Aug 2023
Earthquake contributions to coastal cliff retreat
Colin K. Bloom
Corinne Singeisen
Timothy Stahl
Andrew Howell
Chris Massey
Modeling suggests that steep coastal regions will experience increasingly rapid erosion related to climate-change-induced sea level rise. Earthquakes can also cause intense episodes of coastal cliff retreat, but coseismic failures are rarely captured in the historical record used to calibrate most cliff retreat forecast models. Here, we disaggregate cliff-top retreat related to strong ground motion and non-seismic sources, providing a unique window into earthquake contributions to multidecadal coastal cliff retreat. Widespread landsliding and up to ca. 19 m of coastal cliff-top retreat occurred in the area of Conway Flat during the 2016 Kaikōura (New Zealand) earthquake despite relatively low (ca. 0.2 g) peak ground accelerations. While coastal cliff-top retreat has been spatially and temporally variable over the historical record, aerial imagery suggests that large earthquake-induced landslide-triggering events disproportionately contribute to an average 0.25 m yr−1 retreat at Conway Flat. The 2016 Kaikōura earthquake represents ca. 24 % of the total cliff-top retreat over 72 years and ca. 39 % of cliff-top retreat over 56 years. Additionally, we infer that significant retreat between 1950 and 1966 is the result of local seismicity. Together these two events account for ca. 57 % of cliff-top retreat over 72 years. Earthquake-related debris piles at the base of the cliffs have been rapidly eroded since the 2016 Kaikōura earthquake (more than 25 % loss of debris volume in 5 years), and there will likely be little evidence of the earthquake within the next decade. In regions with similar lithologic and coastal conditions, evidence of past widespread single-event cliff-top retreat may be limited or non-existent. The results demonstrate that cliff-top retreat projections using historical records may significantly underestimate true retreat rates in seismically active regions.
- Article
(21001 KB) - Full-text XML
-
Supplement
(301 KB) - BibTeX
- EndNote


Regional coastal modeling suggests an increasing rate of coastal cliff retreat as sea level rises from climate change (e.g., FitzGerald et al., 2008; Limber et al., 2018). This increasing retreat rate will pose a significant hazard to people and property around the globe, particularly in regions that face a high risk due to population exposure (e.g., He and Beighley, 2008). The response of individual coastal cliffs to sea level rise is complicated by a range of feedbacks and site-specific conditions, for example changing beach volume, the transport of failed material from more erosive sections of coastline, and cliff material strength (e.g., Dickson et al., 2007; Ashton et al., 2011), as well as by the temporal variability of cliff retreat (e.g., Hall et al., 2002; Hapke and Plant, 2010). Many decadal to multidecadal models of coastal cliff retreat rely heavily on historical records and legacy aerial imagery (typically less than 50–100 years) for calibration, in part to capture some of this spatial and temporal variability (e.g., Dickson et al., 2007; Young et al., 2014; Limber et al., 2018; Young, 2018). Unfortunately, direct evidence of past coastal failures is rarely preserved in the active coastal environment (Francioni et al., 2018), making it difficult to confirm that the historical record is representative of all possible preconditioning and triggering mechanisms for coastal cliff collapse. This is particularly important when considering that the cliff face may erode at different relative rates over decadal to multidecadal timescales. For example, rainfall-induced landslides may erode the cliff top faster than coastal erosion from wave action at the base of the cliff, the latter of which ultimately dictates the longer-term pace and spatial pattern of cliff instability.
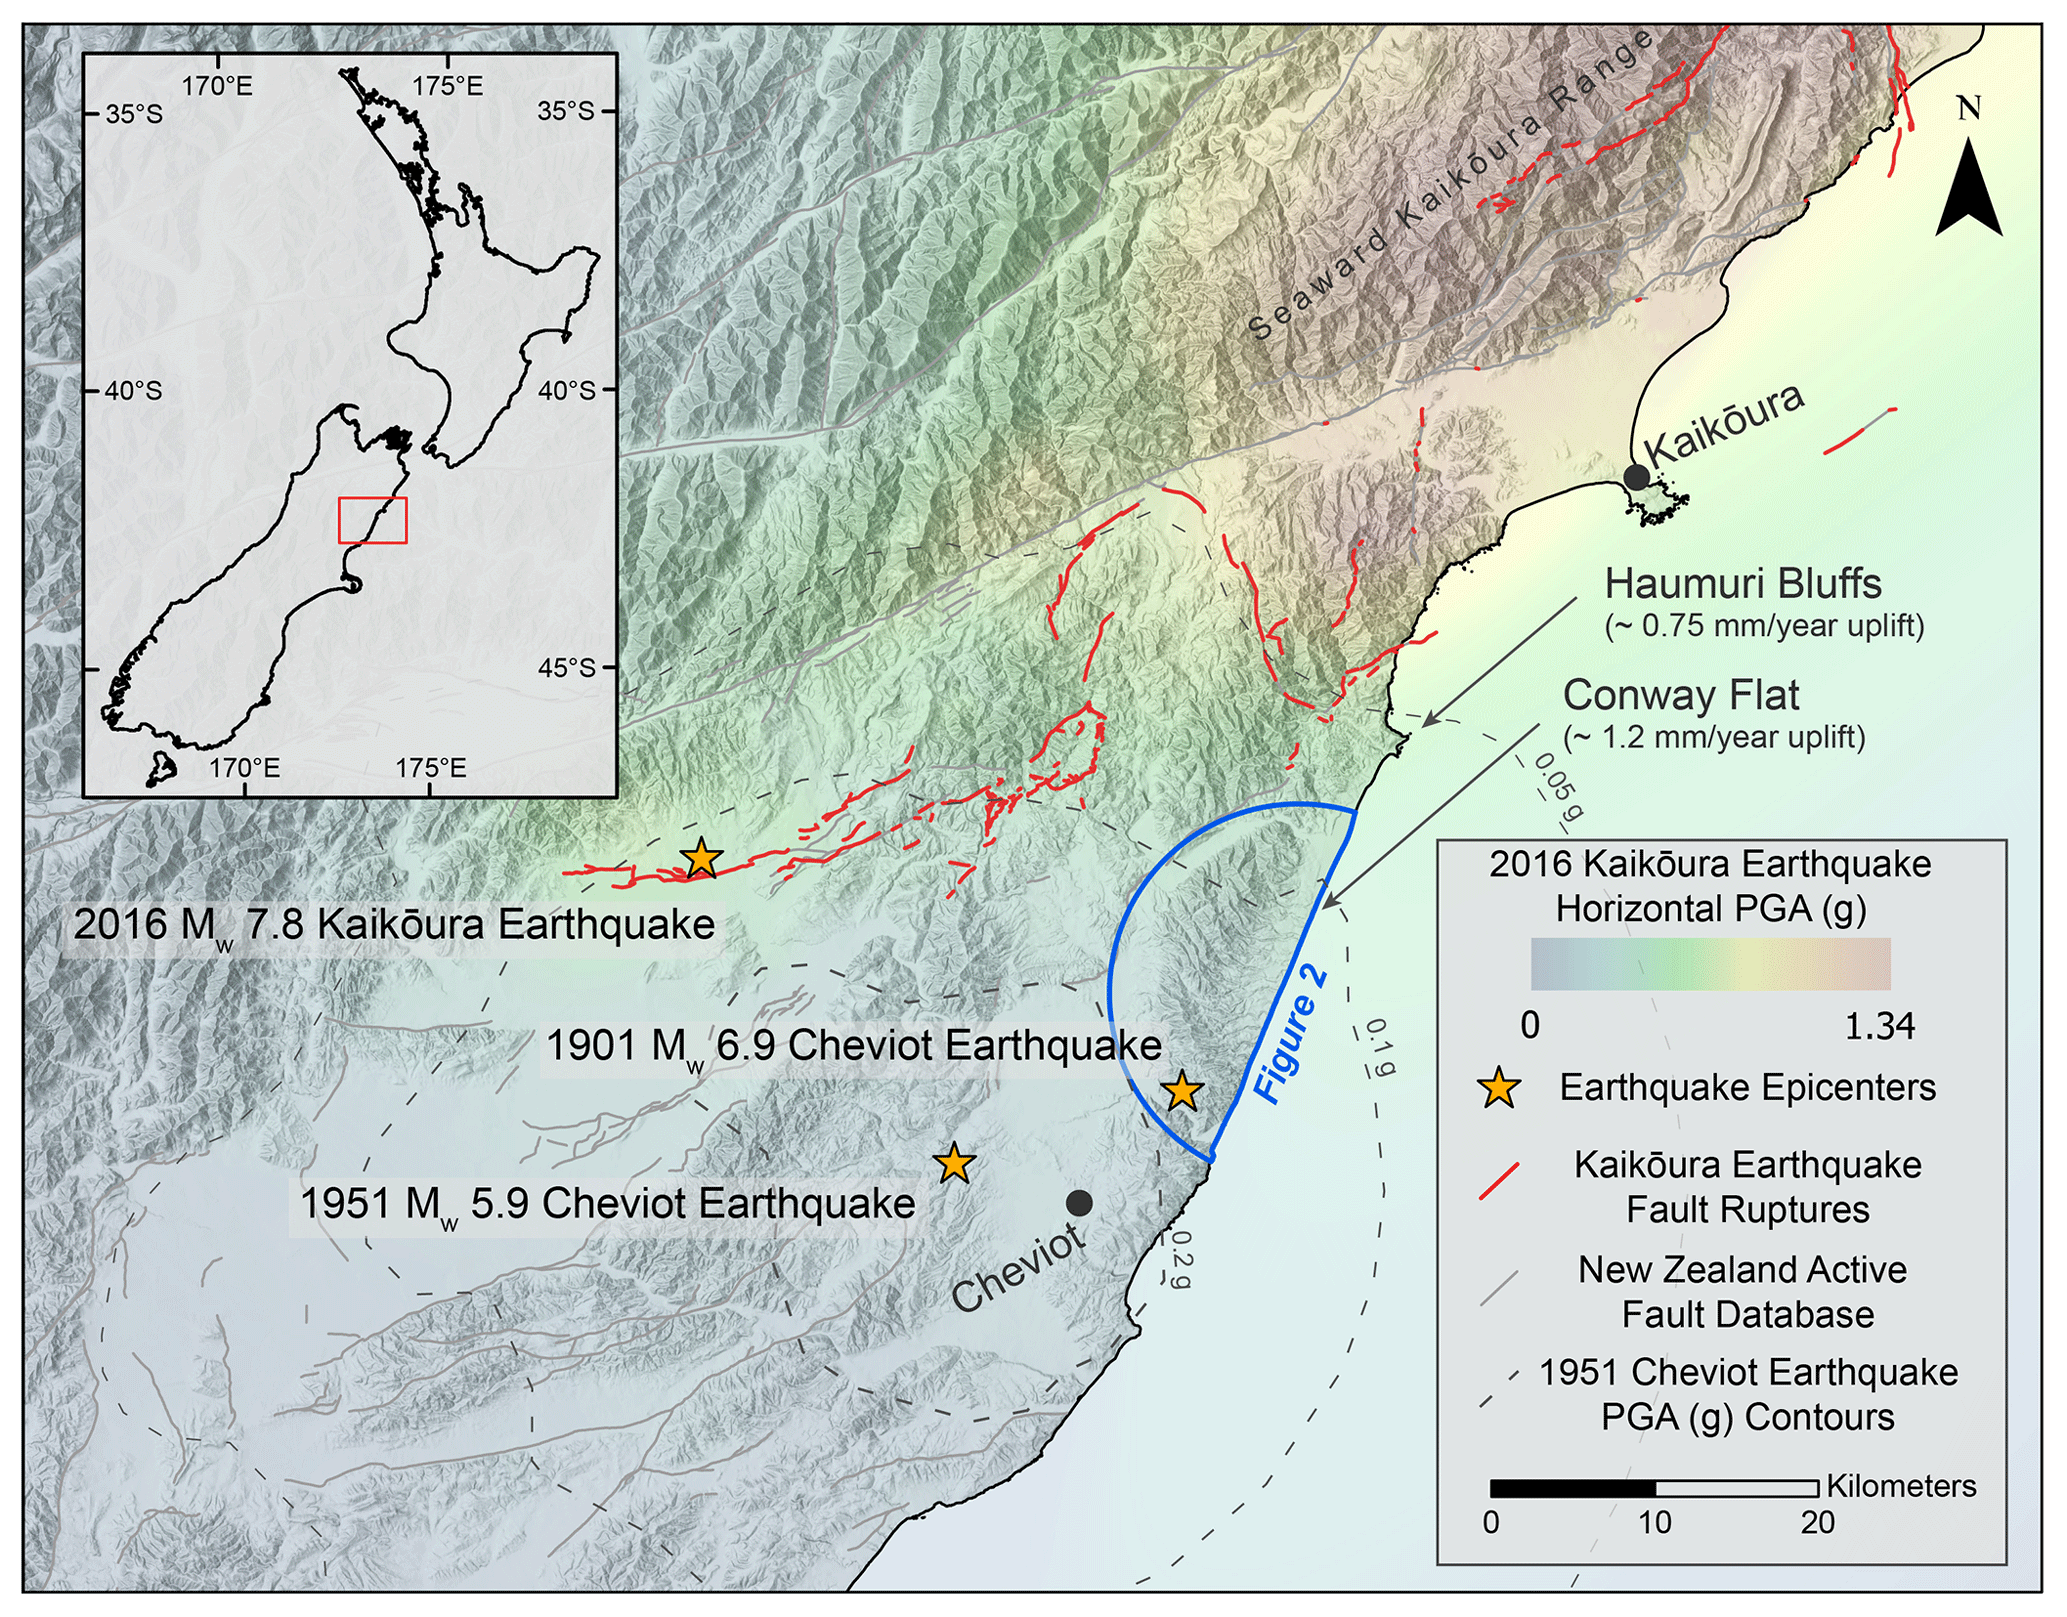
Figure 1Overview of the Kaikōura coast. Horizontal peak ground acceleration (PGA) from the 2016 Mw 7.8 Kaikōura earthquake (Bradley et al., 2017) is shown as a color ramp over a multidirectional hillshade derived from an 8 m DEM (LINZ, 2022). PGA from the 1951 Mw 5.9 Cheviot earthquake (ShakeMapNZ; Horspool et al., 2015) is shown as dashed grey contours radiating away from the earthquake epicenter. Faults in the New Zealand Active Fault Database (Langridge et al., 2016) are shown as solid grey lines, while faults that ruptured to the surface during the 2016 Kaikōura earthquake (Litchfield et al., 2018) are shown as solid red lines. Late Pleistocene uplift rates are reported at Haumuri Bluffs and Conway Flat (Barrell et al., 2023). The location of Fig. 2 is shown as a solid semi-circular blue outline.
In tectonically active regions, earthquakes can cause widespread coastal cliff collapse (Griggs and Plant, 1998; Hancox et al., 2002), but their contribution to coastal cliff retreat has yet to be considered in most decadal to multidecadal forecasts (Hapke and Richmond, 2002). Beyond the logistical challenge of incorporating infrequent and spatially variable strong ground motion as an input in coastal cliff retreat models, the extent to which earthquakes influence multidecadal coastal cliff retreat remains unclear at most sites.
The 2016 Mw 7.8 Kaikōura earthquake on the South Island of New Zealand (Fig. 1) triggered hundreds of landslides along coastal slopes, including areas of coastal cliff-top collapse under relatively low ground motion conditions (<0.2 g PGA – peak ground acceleration) (Massey et al., 2018). We use pre- and post-event aerial imagery at Conway Flat, a ca. 8 km stretch of the Kaikōura coast where widespread failure from the 2016 Kaikōura earthquake was observed in coastal cliffs, to quantify the influence of earthquake-related cliff-top retreat and disaggregate strong ground-motion-related retreat from non-seismic-related retreat. Additionally, the volume of failed debris removed from the beach at Conway Flat by coastal erosion following the 2016 Kaikōura earthquake is calculated to demonstrate how quickly evidence of a large single-event cliff retreat is lost in the active coastal setting. While the conditions described here may not apply to all coastal cliffs, the results provide a template for further investigation of coastal cliffs in tectonically active regions.
2.1 2016 Mw 7.8 Kaikōura earthquake
The 2016 Mw 7.8 Kaikōura earthquake initiated on the Humps Fault ca. 40 km inland from the coast in the northeastern South Island of New Zealand. Over approximately 2 min, fault rupture propagated onto more than 20 onshore and offshore faults, primarily to the northeast of the epicenter (Fig. 1; Litchfield et al., 2018). The earthquake generated more than 30 000 landslides which were primarily concentrated within the steep slopes of the Seaward Kaikōura Range, around surface fault ruptures, and in steep sections of coastline including the coastal cliffs at Conway Flat (Fig. 1; Massey et al., 2018, 2020a; Bloom et al., 2021). Conway Flat lies ca. 30 km south along the coast from the township of Kaikōura and, during the 2016 earthquake, experienced PGAs of ca. 0.2 g (Fig. 1; Bradley et al., 2017) with widespread cliff collapse.
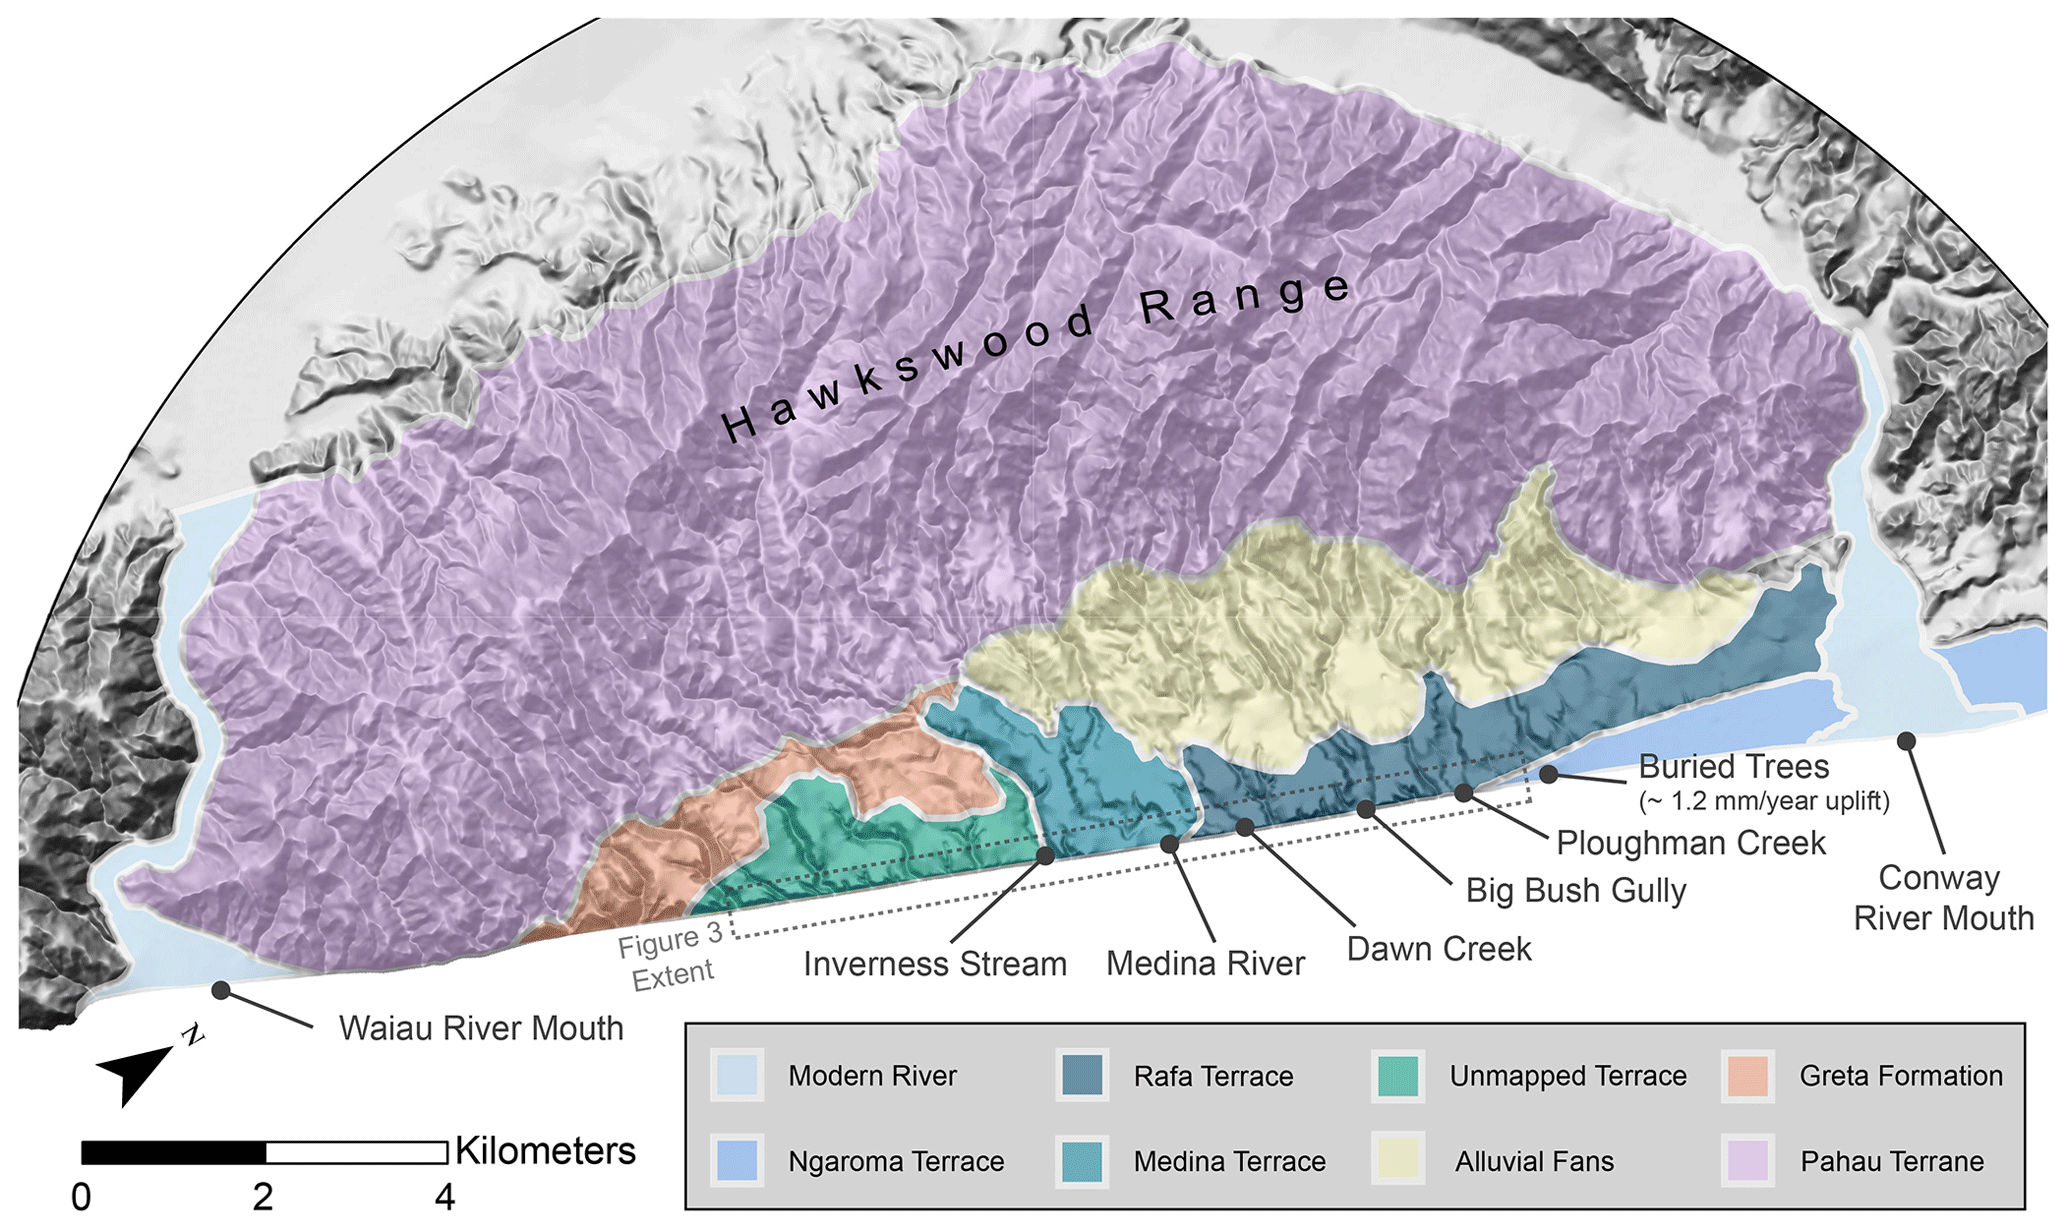
Figure 2Overview of the Conway Flat coast between the Conway and Waiau river mouths. Simplified surface geology including mapped (McConnico, 2012) and unmapped terraces is shown over a multidirectional hillshade derived from an 8 m DEM (LINZ, 2022). Major named streams within the study area that drain the adjacent Hawkswood Range are labeled alongside the location of buried trees used for radiocarbon dating by Ota et al. (1996) and Barrell et al. (2023). The approximate uplift rate determined by Barrell et al. (2023) from the buried trees is included in the label. The location of the study area and Fig. 3 is included as a dashed grey box.
2.2 Conway Flat study area
Except for a relatively small alluvial plain that surrounds the township of Kaikōura, the northeastern coast of New Zealand's South Island is generally steep and rocky. Hillslopes are primarily composed of heavily jointed Lower Cretaceous basement rocks of the Pahau Terrane and younger Upper Cretaceous to Neogene sedimentary units that are, in places, overlain by less consolidated Pleistocene alluvial and fluvial gravels (Fig. 2). At Conway Flat, situated between the Conway and Waiau river mouths (Fig. 2), weak Neogene Greta Formation mudstone (Uniaxial Compressive Strength < 2 MPa) with massive nearly horizontal bedding (Rattenbury et al., 2006; Massey et al., 2018) is overlain by Pleistocene–Holocene Gilbert-style fan delta deposits that form steep coastal cliffs ca. 50 to 70 m in height (McConnico and Bassett, 2007). The coastal cliffs are regularly bisected by fluvial gullies which drain the terraces at Conway Flat and portions of the nearby Hawkswood Range (Fig. 2).
McConnico (2012) mapped several major fan delta sequences which form terrace surfaces (Fig. 2) and are present within the cliff faces at Conway Flat. The Medina fan delta forms the oldest of these mapped terraces (ca. 92 to 95 ka, McConnico, 2012) and makes up much of the coastal cliff face between Inverness Stream to the south and Dawn Creek to the north (Fig. 2). The younger Rafa terrace (ca. 52 to 79 ka) extends north to Ploughman Creek (Fig. 2, McConnico, 2012) and comprises two fan delta sequences: the Dawn and Big Bush Gully fan deltas. Between Big Bush Gully and Dawn Creek, the Dawn Creek fan delta unconformably overlies the Greta Formation within the coastal cliff face; between Big Bush Gully and Ploughman Creek the cliff face consists entirely of marine and overlying beach and/or fluvial facies of the Big Bush Gully fan delta. The youngest terrace surface (ca. 8 ka) is formed by the Ngaroma terrace, which consists of estuarine facies formed laterally to the Big Bush Gully fan delta as well as overlying fluvial and debris flow deposits (McConnico and Bassett, 2007; McConnico, 2012). The coastal intersection of the Ngaroma and Rafa terraces just north of Ploughman Creek forms the northern extent of our study area (Fig. 2). The extent of an unmapped terrace consisting of unconsolidated sediment overlying the Greta Formation to the south of Inverness Stream (Fig. 2) forms the southern boundary of our study area.
While most coastal slopes in the Kaikōura region are both anthropogenically modified and buffered from direct wave action by low shore platforms and uplifted marine terraces (Mason et al., 2017; Stringer et al., 2021), the terraces and coastal cliffs at Conway Flat have had limited to no anthropogenic modification and are subject to direct wave action at high tide. A coarse sand and gravel beach stretches away from the cliffs at low tide. To our knowledge no previous work has been published on multidecadal coastal cliff retreat at Conway Flat.
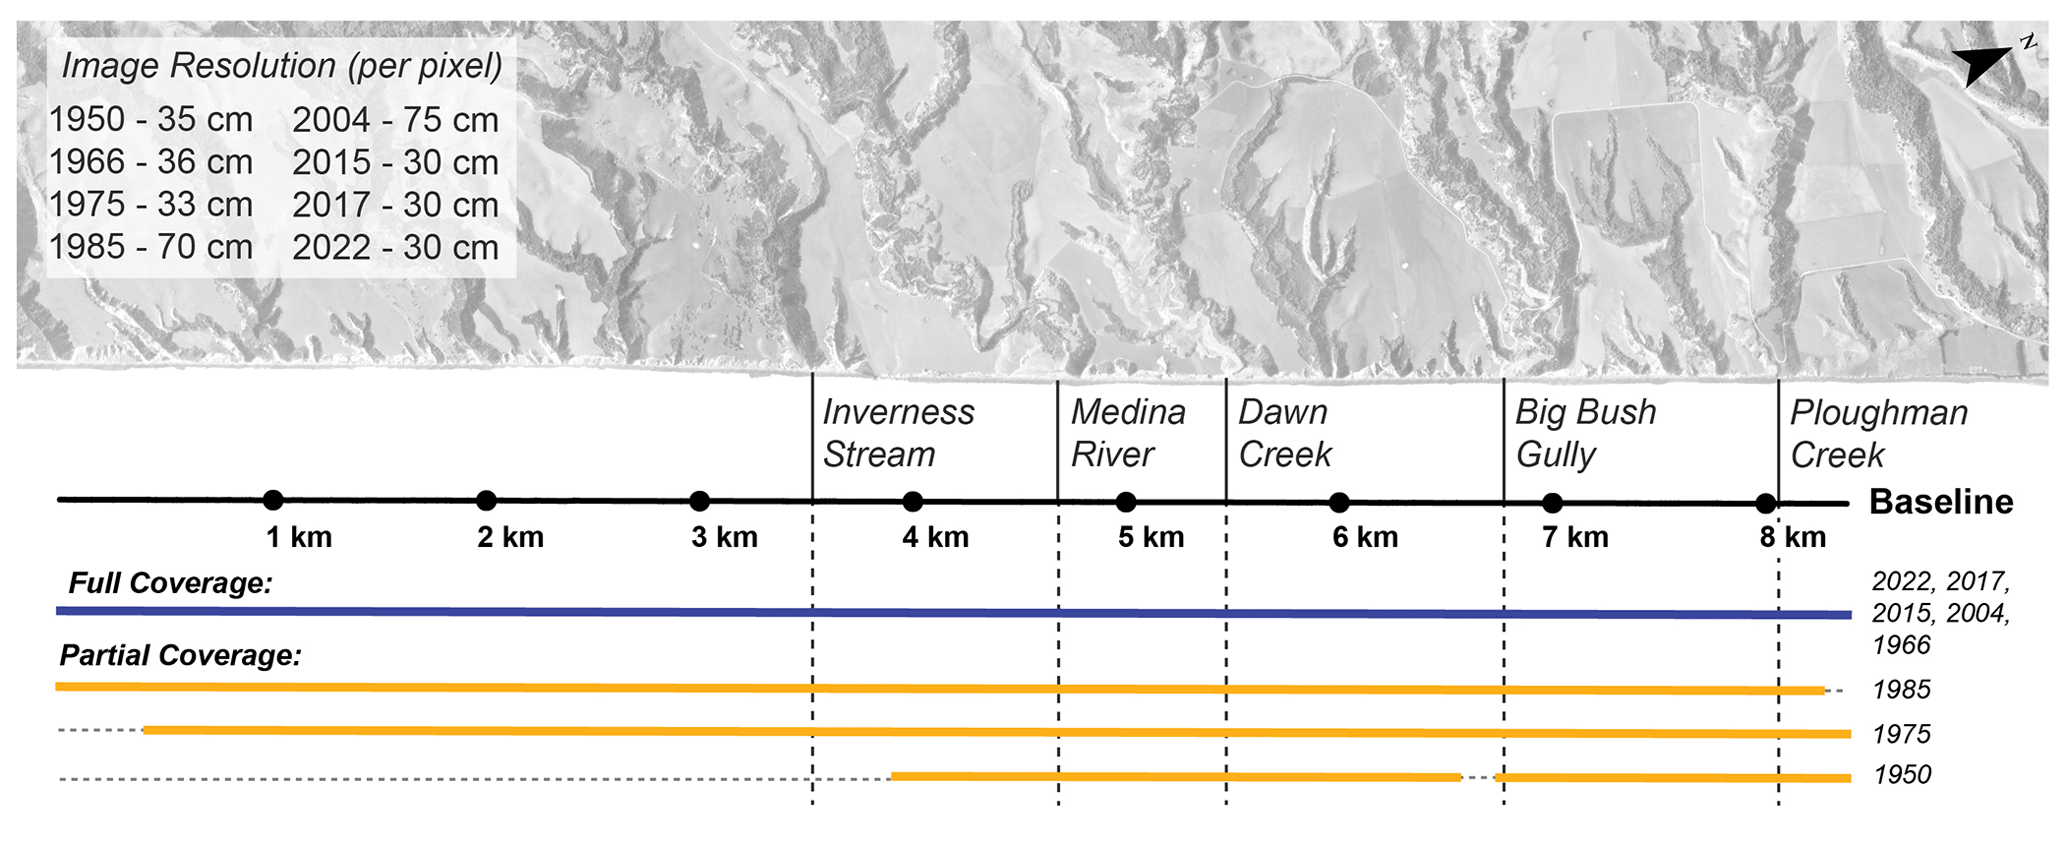
Figure 3Extent of historical aerial imagery at Conway Flat and image resolution. Imagery with full and partial coverage of the study area at Conway Flat is shown by solid lines beneath an example of an orthorectified aerial image from 1966 (LINZ, 2021). Horizontal dashed lines correspond to gaps in the aerial imagery. Vertical dashed and solid lines indicate the approximate location of major named streams within the study area.
Like much of New Zealand's tectonically active South Island, Conway Flat experiences occasional strong earthquake shaking as well as periodic heavy rain and storm surge from a combination of ex-tropical cyclones and other large storm events. Average rainfall at Conway Flat from 1949 to 2010 was 797.45 mm yr−1, with more rainfall occurring during the winter months from June to October (NIWA, 2022). Other than during the 2016 Kaikōura earthquake, the strongest historical shaking at Conway Flat likely occurred during the 1901 Mw 6.9 Cheviot earthquake (epicenter ca. 5 km from Conway Flat), the 1951 Mw 5.9 Cheviot earthquake (epicenter ca. 20 km from Conway Flat), and associated aftershocks from these two events (Fig. 1; GeoNet, 2022; Downes and Dowrick, 2014; Eiby, 1968). Other strong earthquakes have occurred locally in the historical record, for example the 1965 Mw 6.1 Chatham Rise earthquake (epicenter ca. 60 km from Conway Flat) and the 1987 Mw 5.2 Pegasus Bay earthquake (epicenter ca. 50 km from Conway Flat); however, it does not appear that these events resulted in significant shaking intensity at Conway Flat (GeoNet, 2022; Downes and Dowrick, 2014; Eiby, 1968). Probabilistic seismic hazard modeling (Stirling et al., 2012) suggests a ca. 50-year return period for 0.2 g PGA shaking at Kaikōura (ca. 35 km to the NE). Given the proximity of Kaikōura to large seismic sources from the Hope and Kekerengu faults (Langridge et al., 2016), we would expect a slightly longer 0.2 g PGA return period for Conway Flat. Ota et al. (1996) suggested ca. 2 to 3 mm yr−1 of Holocene uplift along the Conway coast based on marine terrace heights and radiocarbon ages collected from buried trees within the Ngaroma terrace north of Ploughman Creek (Fig. 2). Recent recalibration of these radiocarbon dates by Barrell et al. (2023) suggests that regional tectonic uplift is closer to 1.2 mm yr−1. While these rates of tectonic uplift are loosely constrained, they generally agree with estimates of tectonic uplift (ca. 0.9 to 1.2 mm yr−1) in marine terraces further north on the Kaikōura peninsula (Nicol et al., 2022). Site-specific uplift rate estimates are currently poorly constrained south of the Ngaroma terrace and Ploughman Creek.
3.1 2016 Kaikōura earthquake retreat and historical cliff retreat at Conway Flat
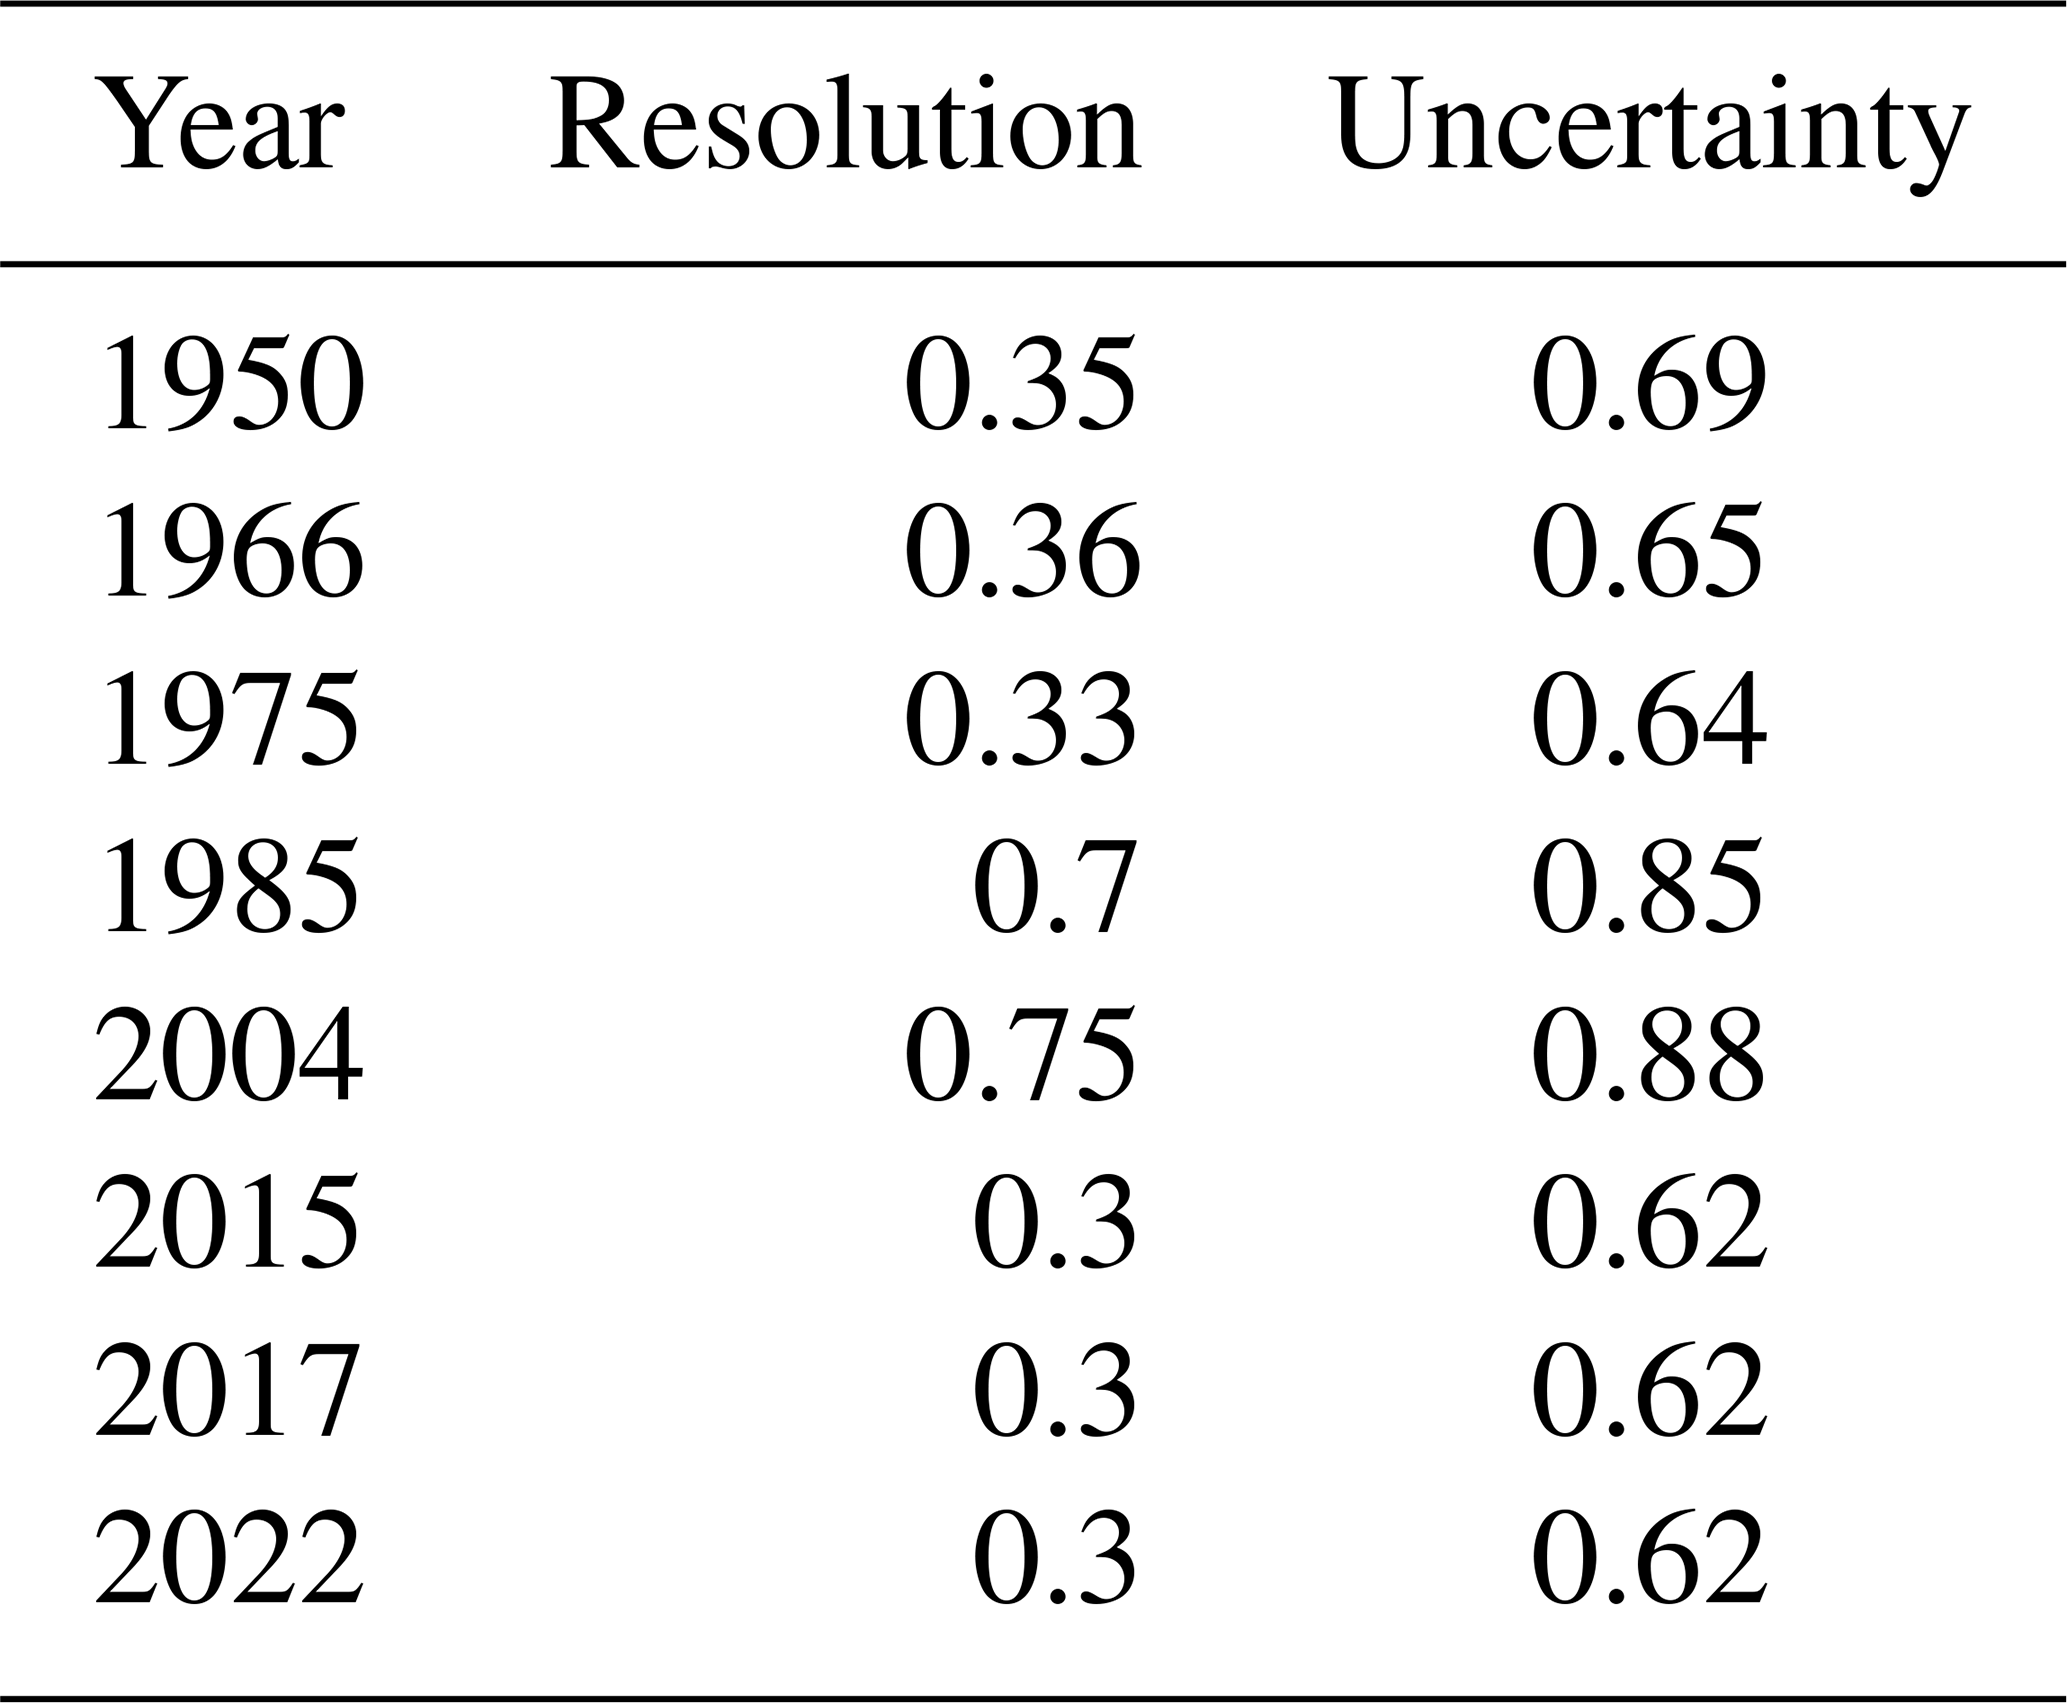
To evaluate historical coastal cliff retreat within the study area, we produced or acquired orthoimagery from eight epochs of variable-resolution aerial imagery (Fig. 3). Images from 1950 to 1985 were retrieved from the Land Information New Zealand (LINZ) Crown Aerial Film Archive (LINZ, 2021) and were processed using Agisoft Metashape (additional information in Appendix A). Two additional orthorectified images from 2004 and 2015 were retrieved from the LINZ data service (LINZ, 2022). An orthorectified image from 2017 was sourced from Massey et al. (2020b), and, finally, in January 2022 high-resolution helicopter-based aerial imagery and lidar data were collected. The available data consist of both full- and partial-coverage imagery of the study area (Fig. 3).
Displacement modeling of the 2016 Kaikōura earthquake (Hamling et al., 2017; Zinke et al., 2019) suggests minimal coseismic and post-seismic strain at Conway Flat. As such, we use well-distributed ground control points, primarily based on the corners of farm structures, stock ponds, and roads, to horizontally register all images to a 2017 orthorectified base image. Vertical registration was relative to a digital surface model generated from the same 2017 imagery by Massey et al. (2020b). Additional well-spaced control points were excluded from the production of the orthoimages and were used to evaluate georeferencing uncertainty and image distortion in each epoch of imagery. The uncertainty between these control points was interpolated to produce an estimate of 1σ image georeferencing uncertainty for each image set (Fig. 4, additional information in Appendix A).
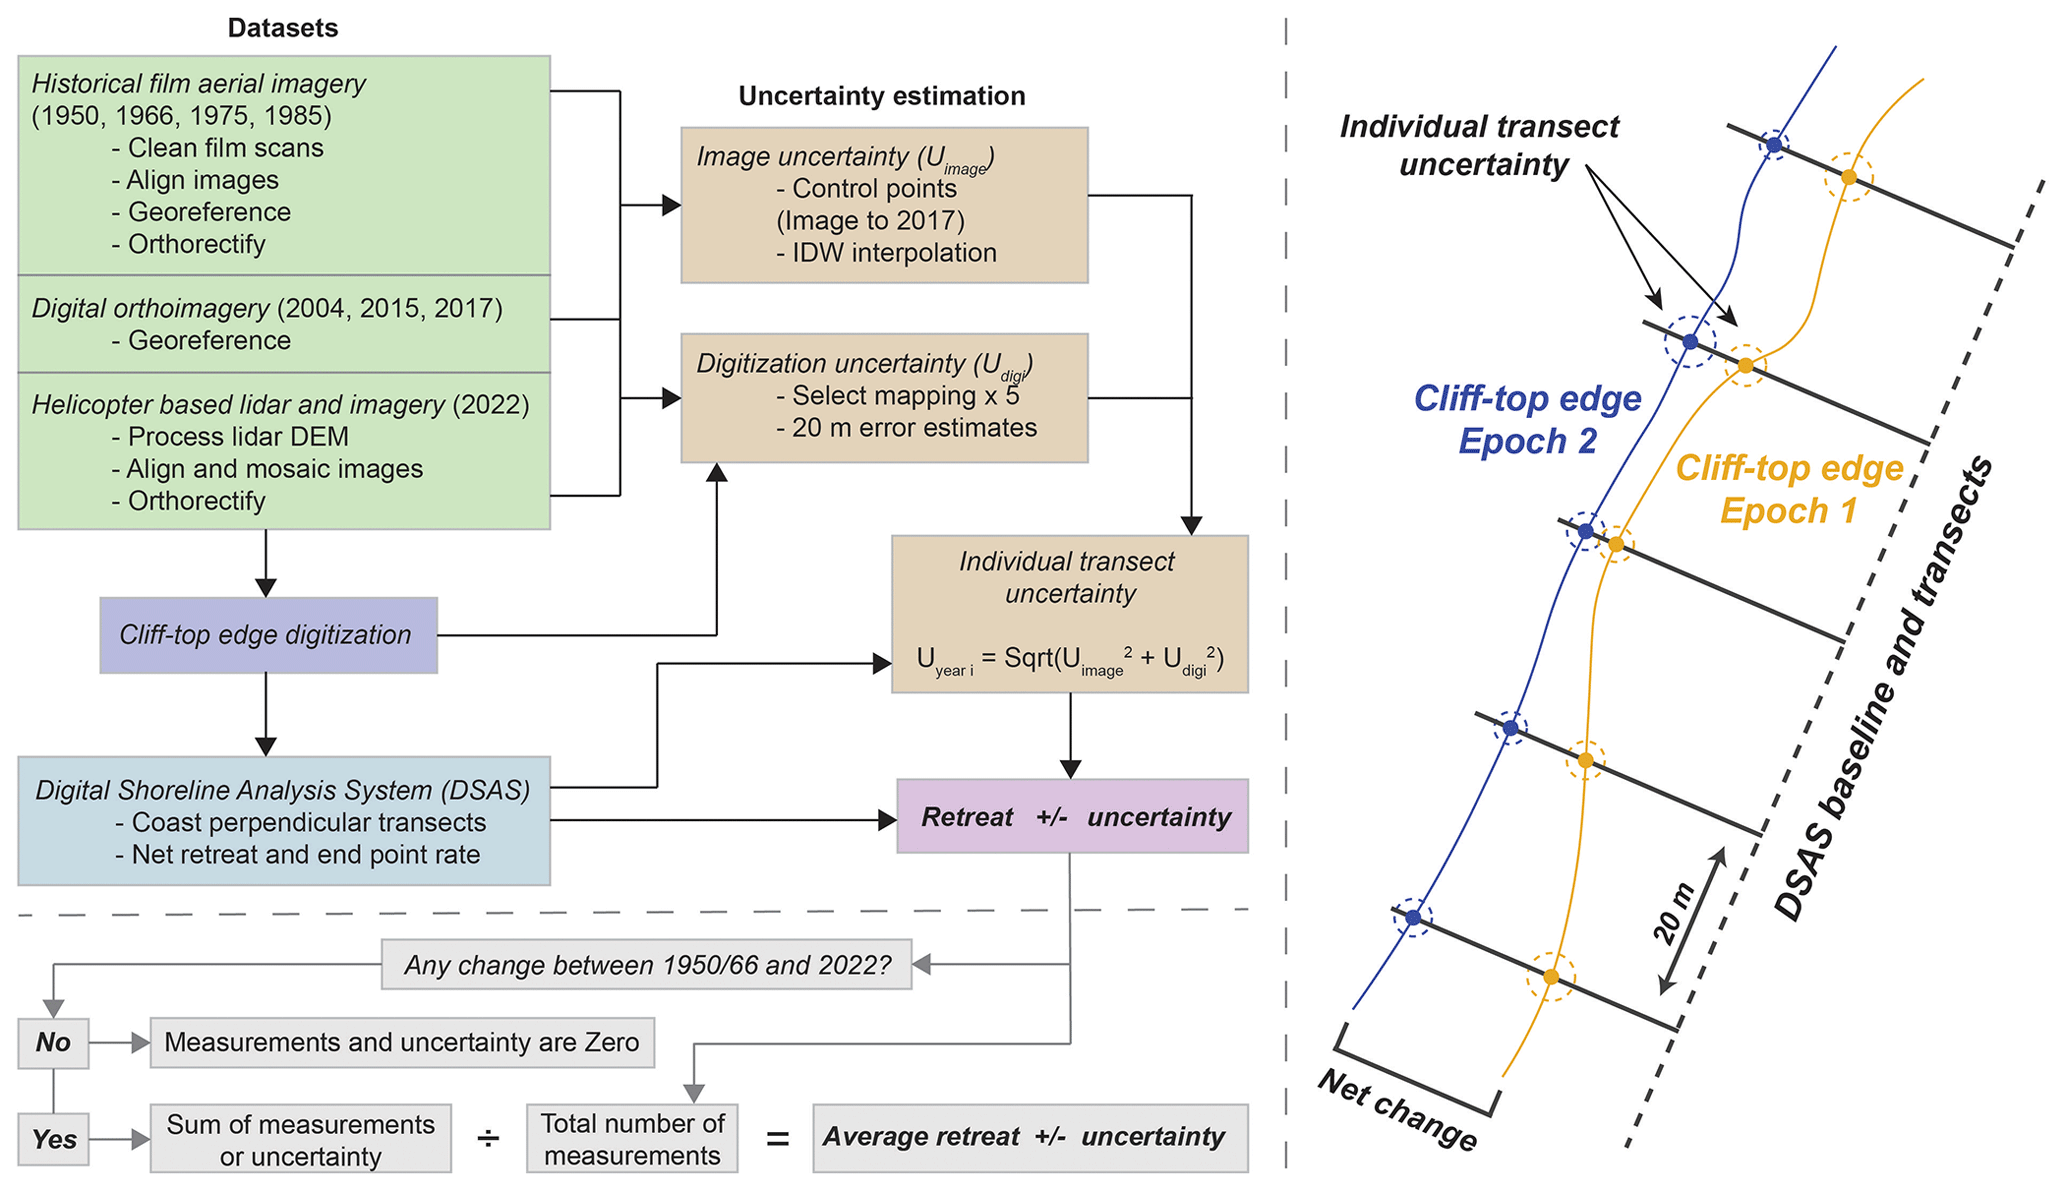
Figure 4Cliff-top measurement workflow and schematic. Uncertainty was estimated and cliff-top edges were manually digitized using processed aerial image orthomosaics. Retreat and retreat rates were estimated over image time windows using the USGS Digital Shoreline Assessment System (DSAS; Himmelstoss et al., 2021), and an estimated uncertainty was assigned to each transect. Estimates of average retreat and retreat rate include all measured transects and all unmeasured transects where no change was observed over the study time window from the first available image (1950 or 1966 depending on location) to the most recent image from 2022.
The upper edge of the coastal cliffs was manually mapped in each epoch of imagery, and the USGS Digital Shoreline Analysis System (DSAS; Himmelstoss et al., 2021) was used to produce approximately perpendicular transects at 20 m intervals along the coastline (Fig. 4). Using these transects as sampling locations, we estimate both image-to-image and overall cliff retreat rates between 1950 and 2022 (Fig. 4). Values of net retreat and retreat rate are reported alongside an uncertainty which compounds image georeferencing uncertainty of the two datasets and the estimated uncertainty in our digitization of the cliff edge. We treat this combined value as a conservative estimate of 1σ uncertainty (Fig. 4, additional information in Appendix A). In some cases, poor image quality or gaps in the aerial image collection made it difficult or impossible to identify a cliff edge, and, in these cases, measurements were excluded. Furthermore, in transects where dense vegetation was present across all epochs of imagery and we were confident that no significant cliff retreat had occurred, we manually assigned the transect a retreat rate of 0 m yr−1 with an uncertainty of 0 m (Fig. 4). Transects within erosional gullies were excluded from our analysis as they likely represent a different erosional regime from the majority of coastal cliff retreat at Conway Flat (Table B1).
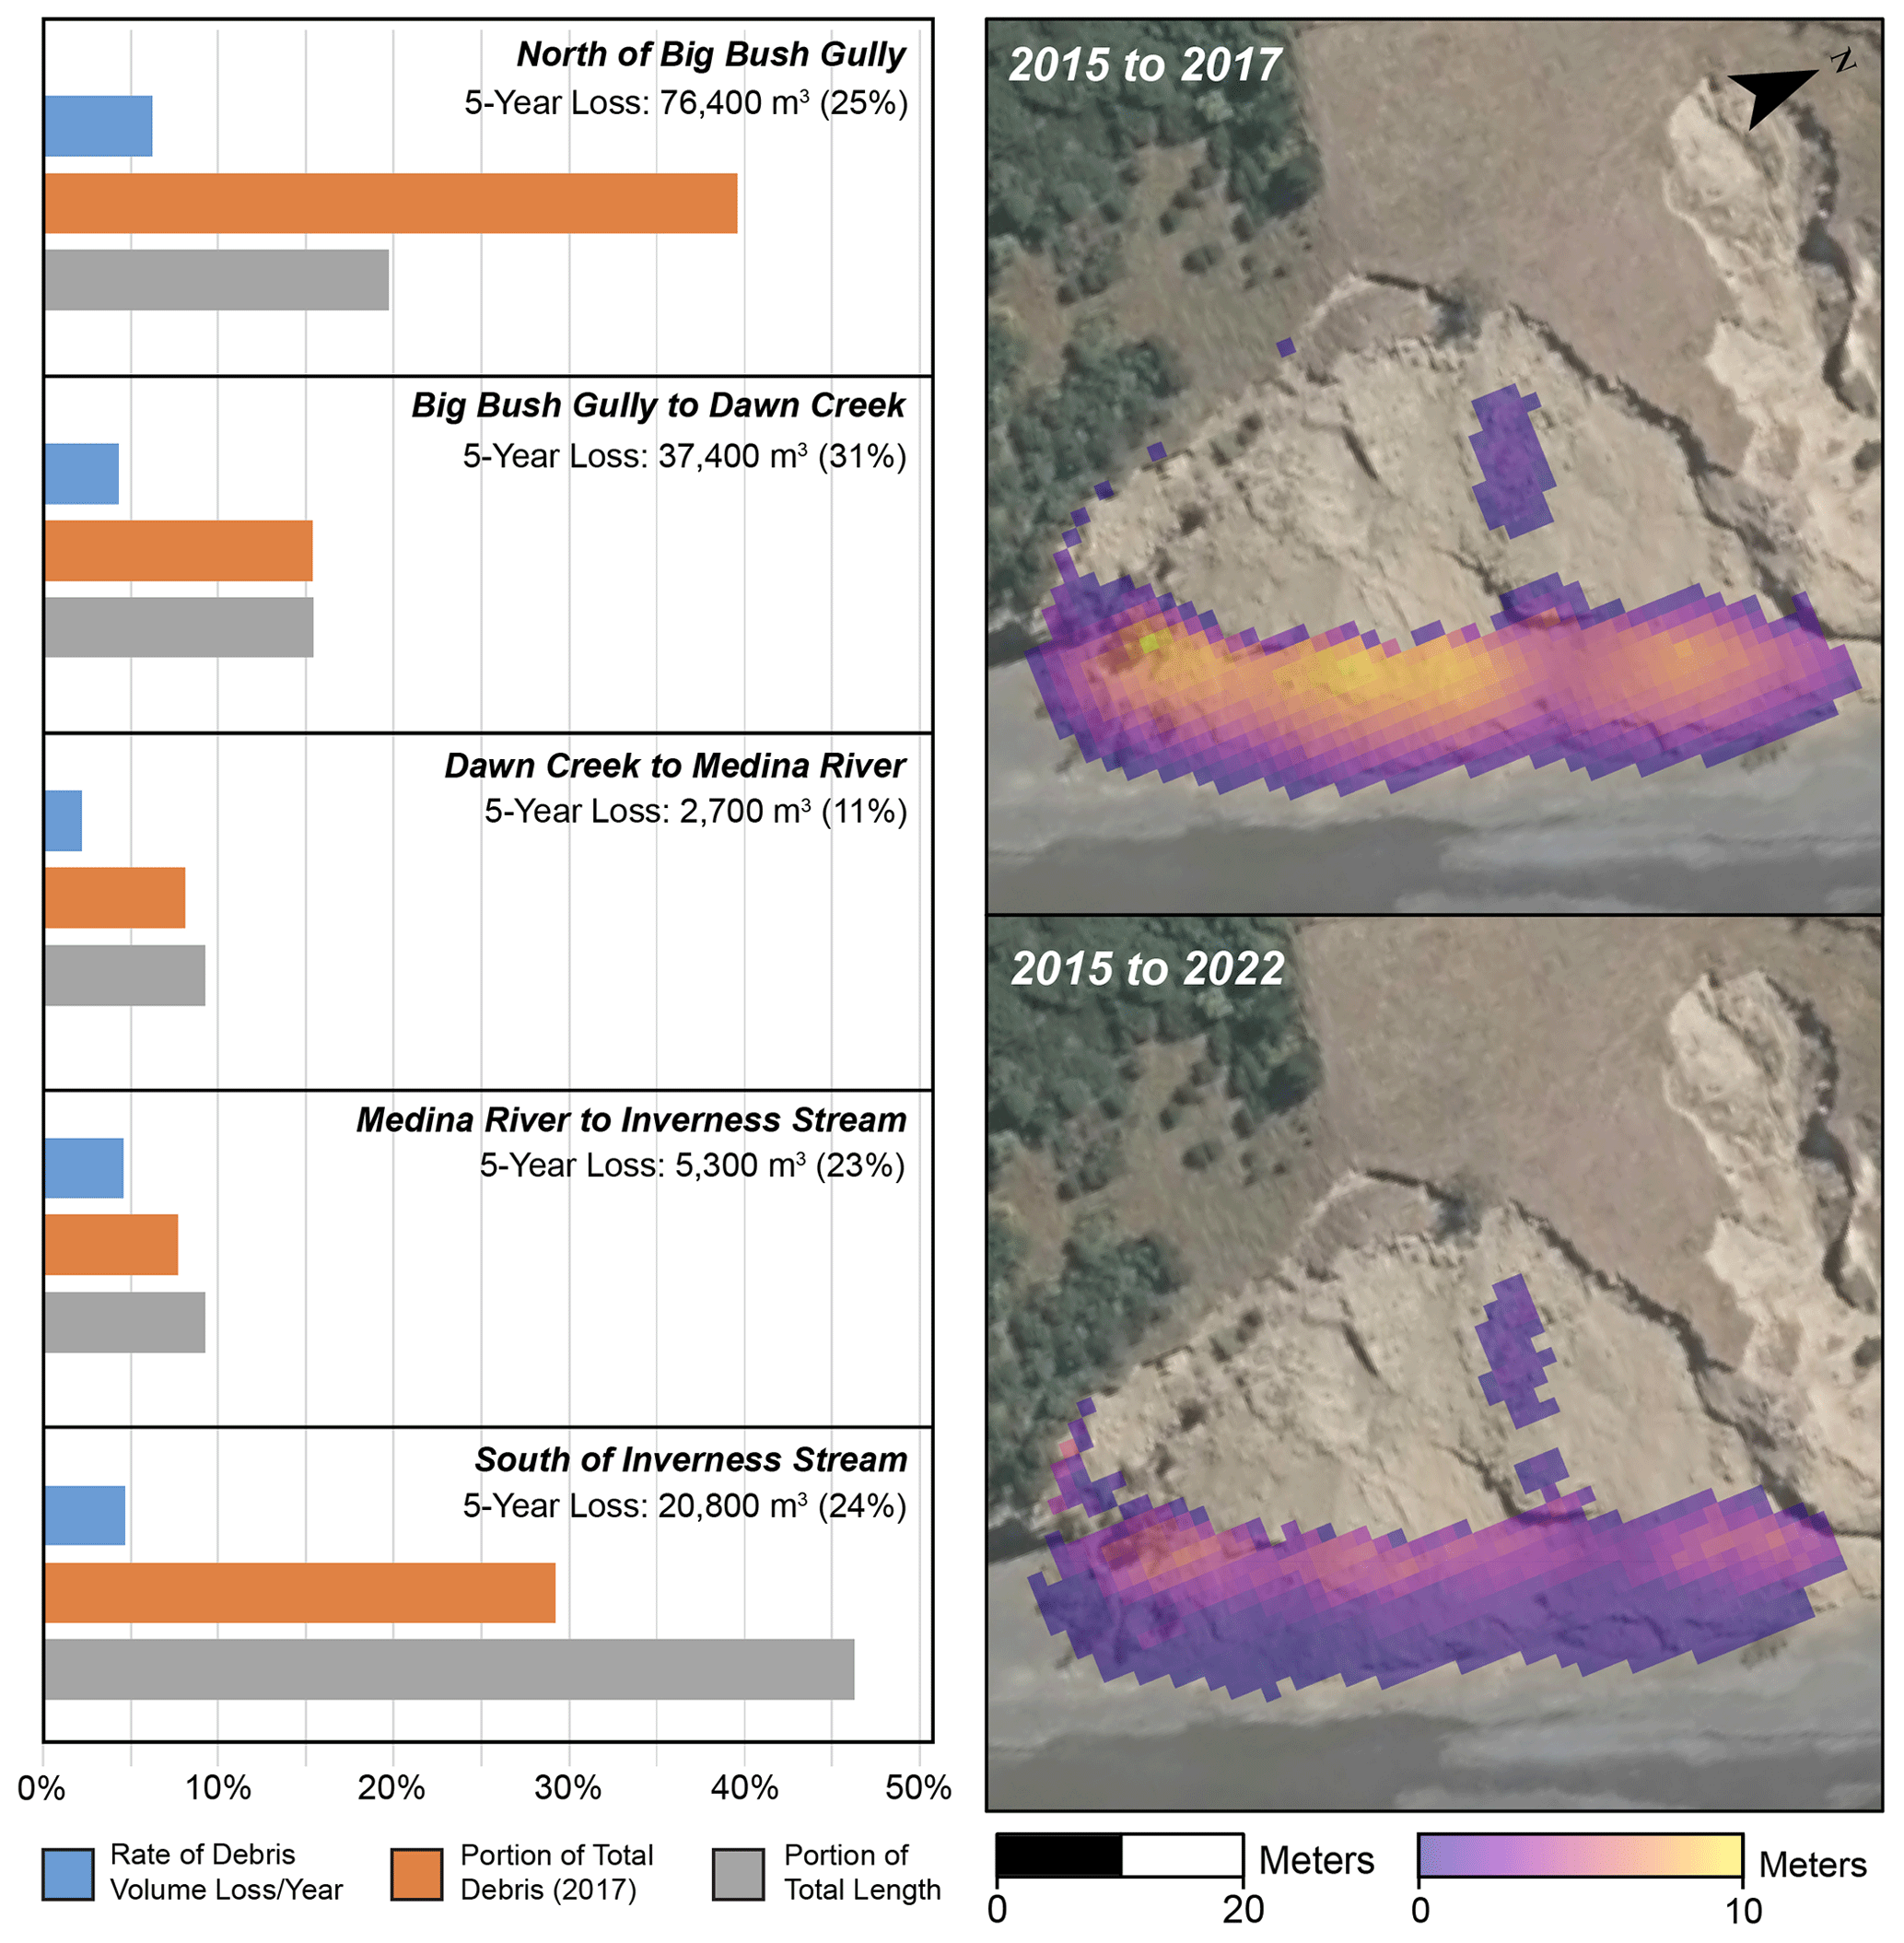
Figure 5Statistics on earthquake-related debris volume in 2017 and 2022 and an example of measured debris volume change. For each section of the coastline, the rate of debris removal per year is plotted in blue (average: 5 % yr−1), the portion of total earthquake-related debris as seen in 2017 is plotted in orange, and the percent of the study area coastline length is plotted in grey. Assuming an even distribution of debris within the study area, the portion of total debris and the portion of study area length should be roughly equivalent within each section; however, there is proportionally more debris north of Big Bush Gully and less debris south of Inverness Stream. The total amount and percentage of debris removed between 2017 and 2022 are reported for each section of the coastline. In the panels on the right, a 2017 orthomosaic (Massey et al., 2020b) is overlain by an example of digital surface model differencing for 2015 and 2017 as well as 2015 and 2022. The difference in height of debris between the two time windows suggests post-earthquake debris removal from the beach.
3.2 2016 earthquake debris volume and post-earthquake debris removal
Digital surface models (DSMs) were differenced (Fig. 5) to estimate the volume of failed and evacuated material between 2015 and 2022. We co-registered and differenced DSMs developed by Massey et al. (2020b) using 2015 and 2017 aerial imagery to estimate the volume of material that failed during the 2016 Kaikōura earthquake. During the 2016 Kaikōura earthquake, most cliff failures at Conway Flat occurred as toppling or translational block slides that transitioned into debris avalanches at the base of the relatively geometrically simple cliff face. As such, we assume that increases in elevation between 2015 and 2017 that fall within the mapped extent of cliff failures from the 2016 Kaikōura earthquake (Massey et al., 2020a) represent an accumulation of landslide debris. For each mapped failure we multiply the sum of the gained elevation values by the area of each pixel (4 m2) to estimate an overall volume. Further, to estimate the volume loss of failed cliff material due to coastal erosion following the 2016 Kaikōura earthquake, we co-register the 2015 DSM with a DSM developed from high-resolution aerial lidar data collected in January 2022. Following the same method for volume calculation as the 2015 to 2017 DSMs we estimate a remaining volume of failed material in 2022. While we do observe some minor secondary cliff failure in the 2022 imagery, we assume that any negative difference in the volume of debris between the 2015–2017 and 2015–2022 datasets represents erosion of failed landslide debris following the 2016 earthquake. Our estimate therefore represents a minimum rate of debris removal. To make a conservative estimate of 1σ uncertainty for our volume measurements, we assume a systematic vertical offset in our DSMs based on DSM differencing outside the mapped landslide extents (additional information in Appendix A).
4.1 Cliff retreat from the 2016 Kaikōura earthquake
The influence of the 2016 Kaikōura earthquake at Conway Flat is constrained by aerial imagery collected in January 2017 and January 2015 (Fig. 6). Between these two image sets, we observed a maximum of ca. 19.1±1.3 m (± combined uncertainty, 1σ, Fig. 4) of retreat with an average retreat of ca. 3.4±1.0 m across the study area. Of the 20 m transects that were measured between 2015 and 2017, ca. 61 % exhibited retreat greater than 1 m and ca. 42 % retreat greater than 3 m.
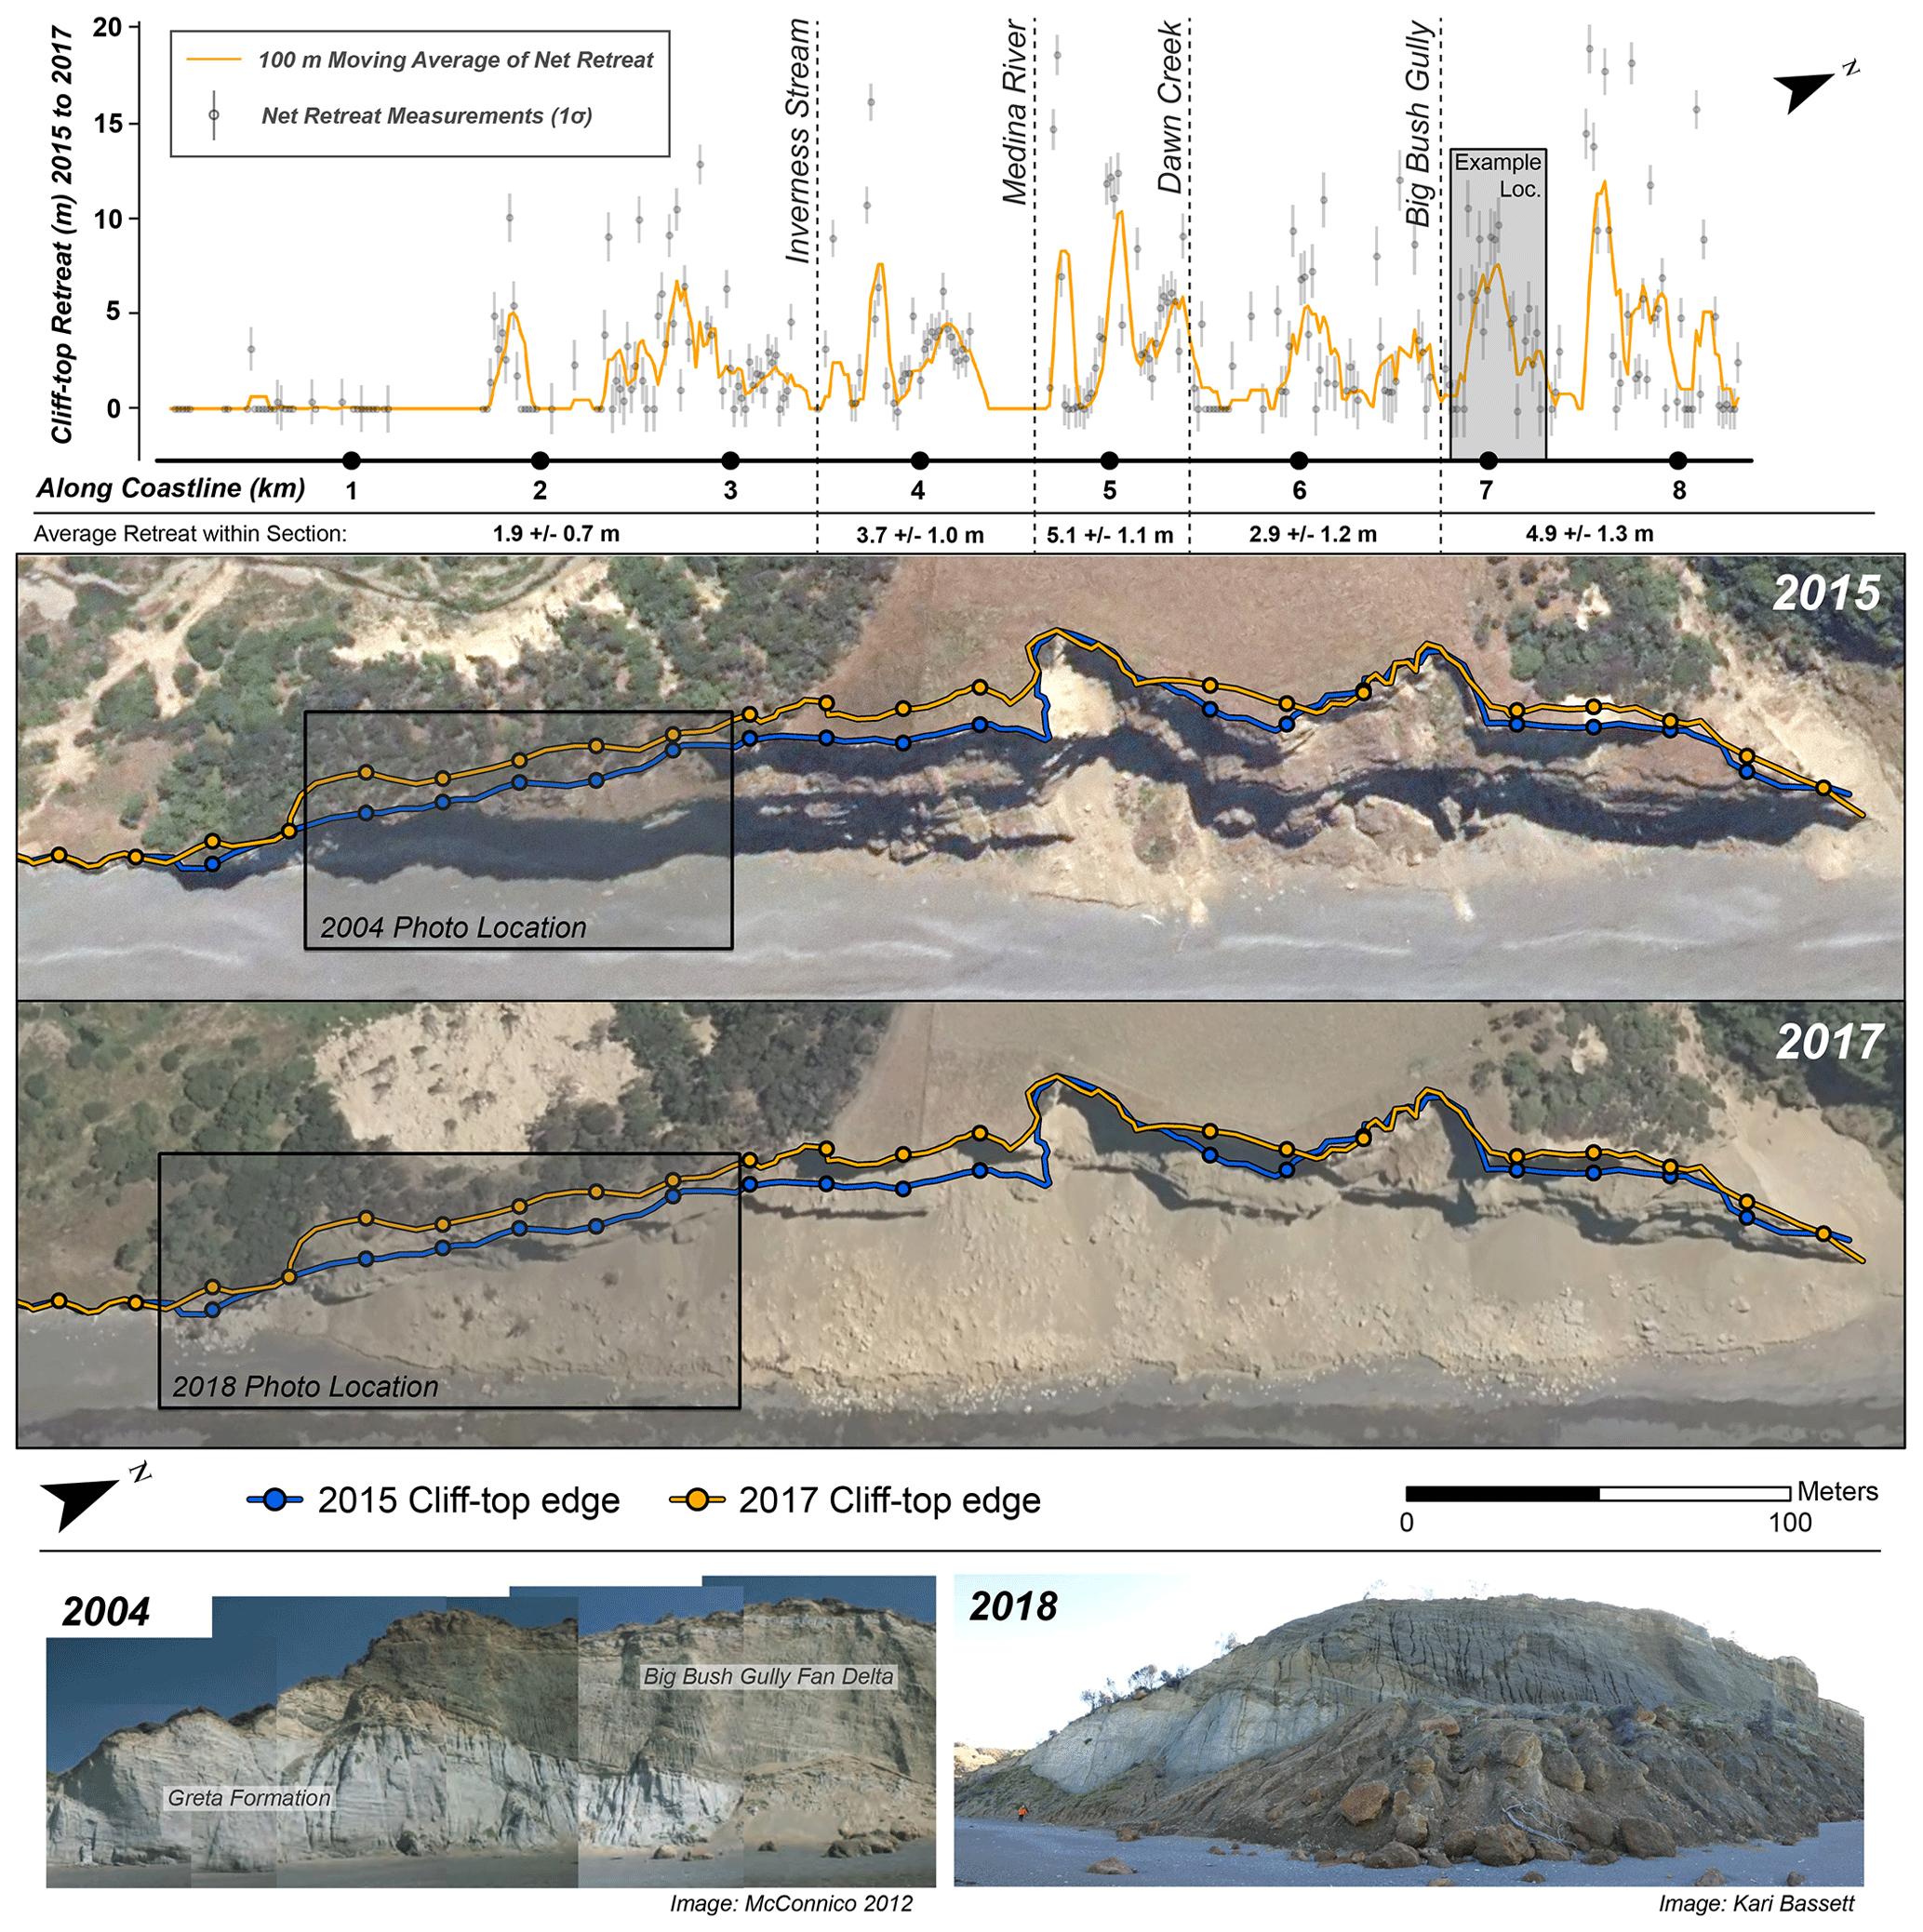
Figure 6Measured cliff retreat between 2015 and 2017 and examples of coastal cliff failure. In the first panel, cliff-top retreat is plotted against distance along the study area baseline (Fig. 3). Individual measurements are shown as grey points with error bars representing estimated uncertainty for the given measurement. A 100 m moving average of the data, which assumes that measurement gaps are zero, is plotted as an orange line. The grey inset north of Big Bush Gully identifies the location of the aerial images from 2015 (LINZ, 2022) and 2017 (Massey et al., 2020b) in the next panel. In the aerial image panel, blue lines and associated measurement points represent the 2015 cliff edge, while orange lines and points represent the 2017 cliff edge. The locations of representative photos in the next panel are identified by black boxes in the 2015 and 2017 aerial images. Photos in the final panel show an example of the coastal cliffs at Conway Flat before and after the 2016 Kaikōura earthquake.
Retreat between 2015 and 2017 was spatially variable across the study area (Fig. 6). North of Big Bush Gully, we observed, on average, ca. 4.9±1.3 m of cliff retreat. The coastal cliffs in this section of the study area consist almost entirely of stratified, unconsolidated to weakly consolidated, gravelly Gilbert-style fan delta deposits of the Big Bush Gully fan delta (McConnico and Bassett, 2007; McConnico, 2012). Following the 2016 Kaikōura earthquake, we primarily observed large debris avalanche deposits at the base of the cliffs, which appear to originate from the upper cliff edge. In several cases we also observed evidence of larger translational block slides within the debris avalanche deposits. At the southern end of this section, just north of Big Bush Gully, there is an angular unconformity visible within the cliff face where fan delta deposits overlie Neogene age mudstone of the Greta Formation (Fig. 6). During the 2016 earthquake, the Greta Formation in this lower portion of the cliff remained largely intact, while the overlying unconsolidated sediment of the Big Bush Gully fan delta appears to have failed as a debris avalanche (Fig. 6).
To the south of Big Bush Gully, between Big Bush Gully and Dawn Creek, we observed on average ca. 2.9±1.2 m of cliff retreat (Fig. 6). In most of this section of coastline, Dawn fan delta deposits unconformably overlie weakly lithified mudstone of the Greta Formation. During the 2016 earthquake, many failures occurred as debris avalanches sourced from the overlying fan delta material. In most cases, it appears that the Greta Formation did not fail beneath the terrace material. We do observe several isolated instances where potentially pre-existing rotational and translational failures occur within the underlying Greta Formation, and these may have facilitated additional back-wasting of the upper cliff face and cliff-top edge. Further site-specific investigation beyond the scope of this work would be required to further elucidate the relative contribution of the Greta Formation to historical failures at Conway Flat.
Moving south from Dawn Creek to the Medina River, we observed an average retreat of ca. 5.1±1.1 m, the highest average cliff retreat within the 2015 to 2017 time window (Fig. 6). The cliff face in this section of coastline is entirely made up of Dawn Creek fan delta deposits. We observed a small terrace within the upper third of the slope where slightly less indurated sediment, similar to the material observed further north, overlies more indurated fan delta deposits. During the 2016 Kaikōura earthquake most failures in this section of the study area occurred as debris avalanches from the upper cliff face above this terrace.
From the Medina River to Inverness Stream, we observed, on average, ca. 3.7±1.0 m of cliff retreat. The cliff in this section of coastline is primarily composed of older and more consolidated Medina fan delta deposit which has experienced significantly less retreat over the past 72 years. We observed several large rockfalls and some smaller debris avalanches from the upper cliff resulting from the 2016 earthquake; however, these failures were more isolated than the widespread failures to the north.
Finally, south of Inverness Stream and the mapped extent of the Medina terrace (Fig. 2), we observed, on average, ca. 1.9±0.7 m of retreat (Fig. 6). Here, Greta Formation mudstone forms a terraced cliff face that likely buffers the overlying variably thick package of unmapped unconsolidated sediment (and the upper cliff edge) from wave-driven erosion. During the 2016 earthquake, we observed significant debris avalanching from the overlying unconsolidated sediment in this section of coastline but little change in the position of the lower cliff face.
Following the 2016 earthquake, between 2017 and 2022, we did observe some local cliff retreat and additional rockfall that may be related to earthquake aftershocks; however, on average, retreat was relatively low (ca. 0.4 m) and fell within the uncertainty of our measurements (ca. ±1.5 m).
4.2 Debris volume and post-earthquake debris removal
Between 2015 and 2017, we estimate that ca. 302 100±86 600 m3 (±1σ) of material failed along the 8 km of the Conway Flat coastal cliffs (Fig. 5). As of January 2022, the total volume of failed material remaining on the beach from these same failures was ca. 225 700±93 300 m3, a net loss of ca. 25 % of earthquake-related failed material within 5 years. This estimate includes ca. 22 700±6200 m3 of debris that was added between 2017 and 2022. North of Big Bush Gully, we observe a higher rate of debris removal where ca. 31 % of earthquake-related debris was evacuated between 2017 and 2022 (Fig. 5).
4.3 Historical cliff retreat at Conway Flat
The study area was first captured by full aerial imagery in 1966 (Fig. 3), and the average retreat rate over the entire area was ca. 0.16±0.04 m yr−1 from 1966 to 2022 (Fig. 7). The study area north of Inverness Stream, captured in earlier aerial imagery from 1950 (Figs. 3 and 7), had an average retreat rate of ca. 0.25±0.03 m yr−1 (1950 and 2022) with a maximum retreat of ca. 61.5±2.2 m. Prior to the 2016 Kaikōura earthquake, the average overall retreat rate for the entire study area was ca. 0.11±0.04 m yr−1 (1966 to 2015), and the retreat rate north of Inverness Stream was ca. 0.14±0.04 m yr−1 (1966 to 2015) or ca. 0.2±0.03 m yr−1 (1950 to 2015).
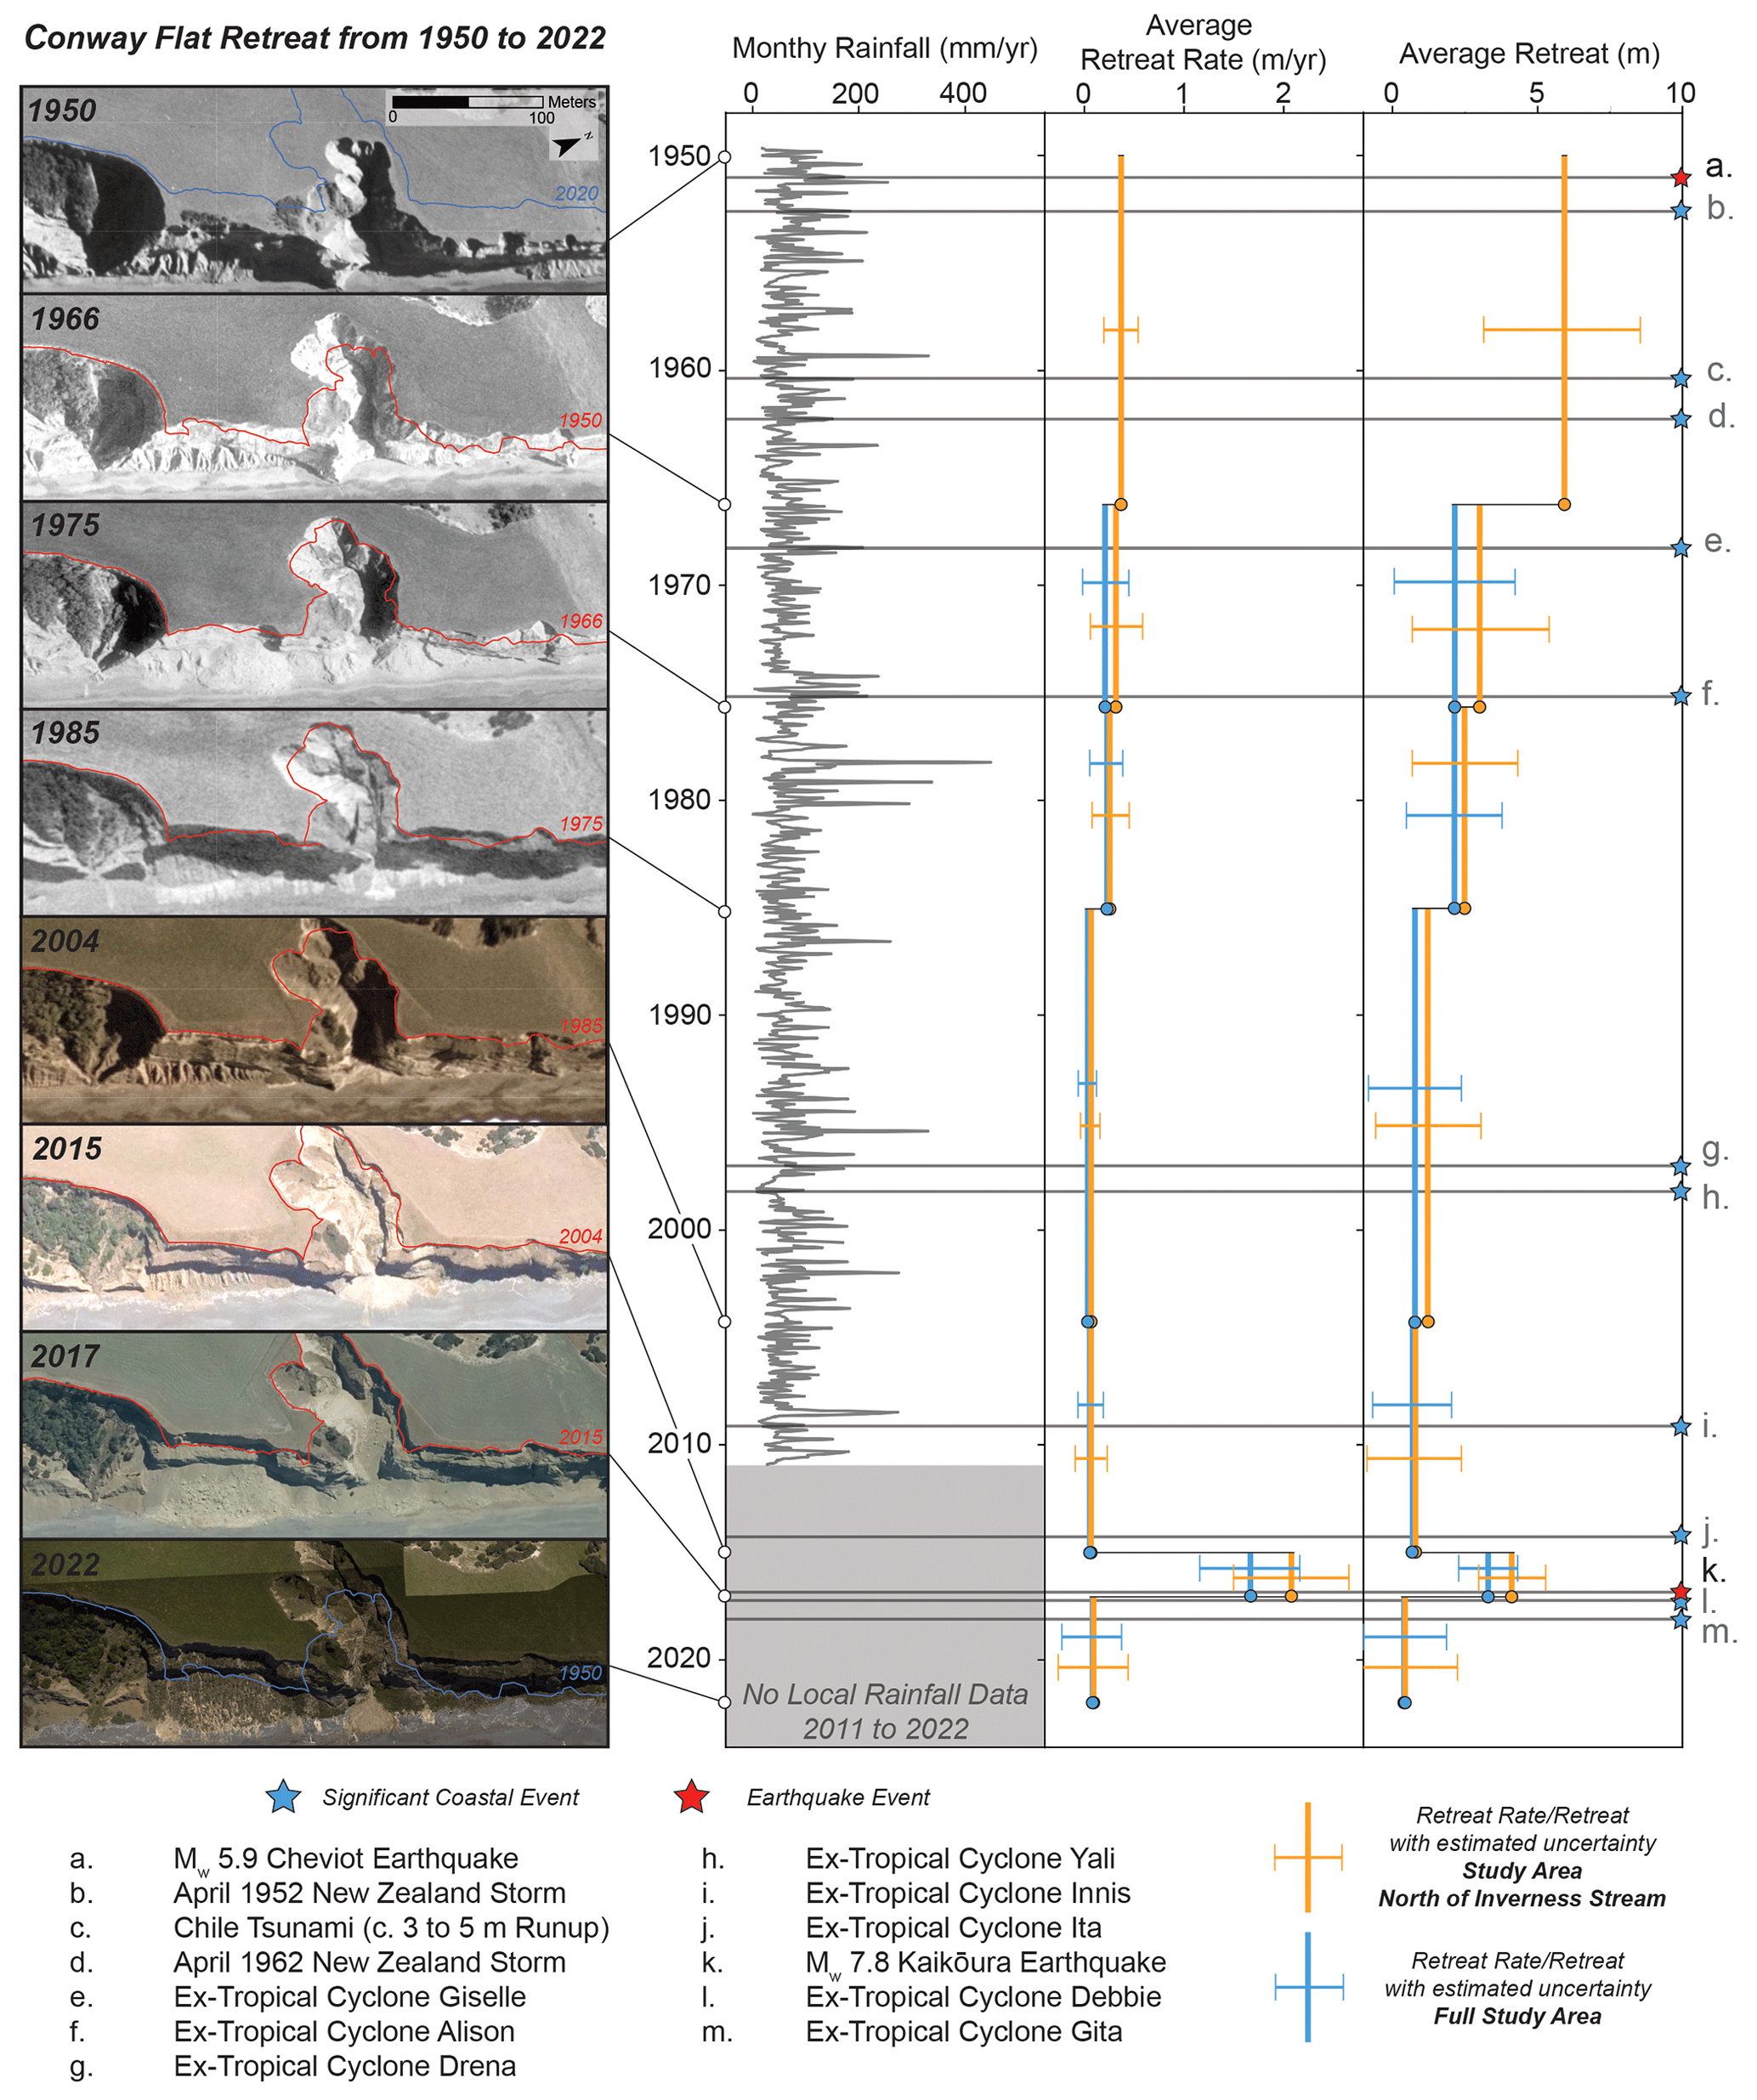
Figure 7Examples of cliff retreat at Conway Flat, monthly rainfall in study area, retreat rate, retreat, and significant events from 1950 to 2022. Within each example image (LINZ, 2021, 2022), the cliff edge from the previous image is shown by a red line. Blue lines in the first and last example image represent the total retreat between 1950 and 2022. White points and black lines connect the respective images to the timeline on the right. Monthly rainfall totals from a rain gauge measured daily at Conway Flat between 1949 and 2010 (NIWA, 2022) are included as a grey line plot to the right of the example images and timeline. The average retreat rate (to the right of the rainfall data) and average retreat between time windows (on the far right) are presented as vertical lines alongside estimated uncertainty indicated by horizontal error bars. Orange lines represent the study area north of Inverness Stream (1950 to 2022), and blue lines represent the entire study area (1966 to 2022). Significant coastal events (blue stars) and earthquakes (red stars) at Conway Flat between 1950 and 2022 are plotted along the far-right edge and are connected to the timeline by grey lines.
4.3.1 Temporal variability of historical cliff retreat
The historical cliff retreat rate at Conway Flat was variable between time windows (Fig. 7). On average, we observed widespread cliff retreat between 1950 and 1966 (ca. 0.38±0.17 m yr−1) and between 2015 and 2017. We observed more localized cliff retreat between 1966 and 1975 (ca. 0.23±0.23 m yr−1) and from 1975 to 1985 (ca. 0.24±0.16 m yr−1). Average retreat between 1985 and 2004 (ca. 0.04±0.08 m yr−1), 2004 and 2015 (0.07±0.12 m yr−1), and 2017 and 2022 (0.09±0.3 m yr−1) fell within the estimated uncertainty of their respective image sets. Some changes in local cliff position were evidenced by failure scars and debris piles within each of these time windows, but we do not observe widespread change in cliff-top position.
4.3.2 Spatial variability of historical cliff retreat
Across individual coastline transects, retreat rates at Conway Flat ranged from 0 to 0.86±0.03 m yr−1 over the full time window (Fig. B1). We observed the highest overall retreat rates (on average ca. 0.29±0.05 m yr−1 from 1966 to 2022) in the northernmost portion of the study area north of Big Bush Creek, Fig. B1), with retreat rates decreasing toward the south. The lowest average retreat was observed south of Inverness Stream (ca. 0.09 m ± 0.03 m yr−1 from 1966 to 2022). These observations south of Inverness Stream correlated well with an increasing density of vegetation on the cliff face that may be indicative of longer-term coastline stability.
5.1 Cliff retreat and lithology
Underlying geology appears to largely govern the spatial variability of coastal cliff retreat at Conway Flat over the historical record. Where the cliff face consisted entirely of unconsolidated fan delta deposits, for example in the Big Bush Gully fan delta north of Big Bush Gully, we observed more substantial historical retreat. Where Greta Formation mudstone or more indurated fan delta deposits like those of the Medina fan delta were present in the lower cliff face, in general, we observed lower retreat rates. In the Kaikōura region and across New Zealand, failures in tertiary sediment including the Greta Formation mudstone tend to occur as large planar slides often failing along preferentially oriented bedding planes (Pettinga, 1987; Mountjoy and Pettinga, 2006; Singeisen et al., 2022) or as shallow debris avalanches in more weathered sections of the rock mass (Massey et al., 2018). We do not observe evidence of planar sliding at Conway Flat over the historical record, and most retreat of the underlying Greta Formation appears to result from a combination of shallow debris avalanching, observed in some aerial imagery, and more gradual erosion due to wave action. Determining the extent to which failure mechanisms within different facies of the fan deltas and Greta Formation govern historical cliff-top retreat at Conway Flat is largely beyond the scope of this study; however, it does appear that more indurated material (with assumed higher shear strength) in the lower cliff face may buffer the upper cliff face from wave action, effectively reducing the non-seismic rate of cliff-top retreat (Emery and Kuhn, 1982). For our purposes here, we define the non-seismic rate of cliff-top retreat as retreat from any non-seismic source. This may include, but is not limited to, failure of the cliff top during rainfall events, failure from undercutting of the cliff face, and/or weathering and background gravitational failure.
Most failures from the 2016 Kaikōura earthquake occurred as debris avalanches from the upper cliff face with very little retreat of the lower cliff face. While the long-term position of the coastal cliffs at Conway Flat may be governed by wave processes undercutting the lower cliff face, earthquakes may disproportionately influence cliff-top retreat over multiple decades through topographic amplification of strong ground motion in the upper cliff face (e.g., Ashford et al., 1997; Massey et al., 2022).
In addition to lithology, several other factors may further influence the rate of local cliff retreat at Conway Flat over the historical record, but these are more challenging to quantify. For example, the rate of tectonic uplift and sediment transport may influence beach height in relation to the base of the cliffs at Conway Flat (e.g., Horton et al., 2022), but it is not possible to quantify these changes across our historical image datasets. Likewise, local aspects of the cliff face in relation to variable incoming wave direction may influence the rate of cliff retreat, but information on changes in wave direction through time is unavailable.
5.2 Post-earthquake sediment loss
The efficient evacuation of failed material at Conway Flat makes it difficult to identify the historical source of failures. Assuming a steady ca. 15 300 m3 yr−1 (ca. 5 %) annual rate of debris removal from the base of the cliffs at Conway Flat, as we observed in the 5 years following the 2016 Kaikōura earthquake, we expect that nearly all earthquake-related debris will be removed within ca. 20 years of the earthquake. Rates of volume loss appear to vary slightly based on the composition of debris with higher-than-average rates of debris removal north of Big Bush Gully where debris consists of largely unconsolidated fan delta deposits and much lower-than-average rates of debris removal between Dawn Creek and the Medina River where deposits consist of more intact blocks, which we infer are from higher-shear-strength facies of the fan delta deposit (Fig. 5). The extent to which storm surge from events like ex-tropical cyclone Gita (Fig. 7) and variability in longshore sediment transport (Larson and Kraus, 1994; Dickson et al., 2007; Karunarathna et al., 2014) influence the removal of failed debris at Conway Flat remains largely unclear due to our limited number of image epochs, but it is possible that such events modulate the rate of debris removal over time.
Interestingly, in imagery from 1966, we observed almost no material at the base of the coastal cliffs despite an average cliff-top retreat of ca. 5.9 m between 1950 and 1966 (Fig. 7). Applying the same rate of debris removal in the 5 years following the 2016 Kaikōura earthquake to the 1950 to 1966 time window does not fully explain the lack of debris in 1966. Assuming failures occurred early in the time window, a number of large storm events alongside a ca. 3 m run-up tsunami associated with the 1960 Chile earthquake (Fig. 7) may have increased the rate of debris removal.
5.3 Cliff retreat and earthquake shaking
Over long timescales (i.e., longer than the historical record), the rate of coastal erosion at the base of the Conway Flat cliffs may limit the extent of cliff-top retreat and, in turn, the long-term influence of subaerial triggers like earthquakes or rainfall. This is because some oversteepening of the cliff face is likely a prerequisite for cliff-top failure (Wolters and Müller, 2008). Prior to 2016, most of the cliff face at Conway Flat was nearly vertical in many places (Fig. 6), an indication of dominant marine erosion (Emery and Kuhn, 1982). However, over multidecadal timescales, the rate of cliff-top and base retreat may vary substantially due to the greater temporal variability of subaerial triggers.
We observe this variability in the historical record of cliff retreat at Conway over the past 72 years. Direct observational evidence suggests that ca. 24 % of 72-year retreat (in the 2015 to 2017 time window) resulted from the 2016 Kaikōura earthquake. We hypothesize that over multiple decades, large subaerial landslide-triggering events, for example earthquakes or storms, contribute disproportionately to cliff-top retreat at Conway Flat, while coastal erosion dominates retreat at the base of the cliffs, in turn creating a steeper cliff face more susceptible to subaerial triggers. The historical analysis here excluded areas with clear evidence of fluvial incision, for example rills and gullies, and, as a result, there is likely a limited influence of surface run-off. Furthermore, Conway Flat has seen little anthropogenic or other biologic change over the study period that could significantly influence the rate of cliff retreat. Observations of cliff face hydrology are limited with the exception of vegetation and some minor seeps.
Large rainfall events and storms could explain the temporal variability in cliff-top retreat at Conway Flat, but the historical record of these events has little correlation with the observed retreat rate (Fig. 7). On the other hand, the nearby 1951 Mw 5.9 Cheviot earthquake with its six Mw 5.0+ aftershocks provides a plausible explanation for significant retreat observed between 1950 and 1966. Although there is no direct evidence of coastal cliff failures at Conway Flat from the 1951 Cheviot earthquakes, two lines of evidence lend credibility to their contribution. First, regional documentation of shaking and damage from the 1951 Cheviot earthquake main shock suggests a modified Mercalli (MM) intensity of VI to VII at Conway Flat (Downes and Dowrick, 2014), similar to shaking intensity from the 2016 Kaikōura earthquake. An implementation of the ShakeMapNZ model (Horspool et al., 2015) using historical observed ground motion data as well as the damage and felt reports from Downes and Dowrick (2014) suggests that the 1951 Cheviot earthquake produced ground motion with a PGA between ca. 0.1 and 0.2 g at Conway Flat (Fig. 1), very similar to the modeled PGA from the 2016 Kaikōura earthquake (Bradley et al., 2017; Fig. 1). Second, as discussed previously, applying the rate of debris removal following the Kaikōura earthquake to the 1950 to 1966 time window does not fully explain a lack of debris in 1966. Assuming little change in the rate of beach erosion between time windows, this suggests that failures likely occurred early in the 1950 to 1966 time window, exposing debris to a number of intense storm surges and tsunami inundation in 1960 that may have enhanced debris removal (Fig. 7).
Together, the 1951 and 2016 earthquakes account for a significant portion of the overall retreat at Conway Flat in the past 72 years. Excluding both earthquakes from the historical estimate of cliff retreat at Conway Flat north of Inverness Stream reduces the retreat rate to ca. 0.14 m yr−1 or ca. 56 % of the total (0.25 m yr−1) retreat over the past 72 years. This being said, given the relatively short return interval of sufficient shaking to induce cliff retreat at Conway Flat over the historical record (ca. 58 years considering the last three earthquakes from 1901, 1951, and 2016), including both the Kaikōura and Cheviot earthquakes could overestimate the multidecadal cliff-top retreat rate.
Excluding either the 2015 to 2017 time window including the 2016 Kaikōura earthquake or the 1950 to 1966 time window including the 1951 Cheviot earthquakes from our estimates results in ca. 0.16 to 0.20 m yr−1 of cliff-top retreat at Conway Flat. These values represent a best estimate of the multidecadal cliff-top retreat rate at Conway Flat over the historical record and are, on average, ca. 45 % greater than the estimated non-seismic retreat rate. Following the 2016 earthquake we observed a steep upper cliff face, likely still susceptible to failure, across much of Conway Flat (Fig. 6). Given relatively low ground motion at Conway Flat during both the 2016 Kaikōura earthquake and the 1951 Cheviot earthquake, it remains possible that stronger ground motion could result in greater single-event retreat. In this case, strong ground motion could have an even larger influence on multidecadal cliff-top retreat.
5.4 Implications for multidecadal cliff retreat estimates in tectonically active regions
In tectonically active regions that have not experienced a sufficiently large earthquake in the historical record, excluding earthquake contributions will result in underestimates of multidecadal coastal cliff retreat over multiple earthquakes. While in the case of Conway Flat this underestimation is likely around 30 %, the degree to which the historical record underestimates multidecadal cliff-top retreat at any given site will be heavily modulated by several factors. These factors include site characteristics like cliff height, lithology, and slope that influence cliff susceptibility to earthquake-induced failure (Massey et al., 2022), the overall rate of cliff-top retreat compared with retreat during a single earthquake event, and the expected return intervals, magnitudes, durations, and frequency content of earthquake shaking. Simplified, these factors fall into three primary categories: (a) magnitude of single-event cliff-top retreat related to ground motion, (b) non-seismic cliff-top retreat rate, and (c) return interval of sufficient ground motion to result in single-event retreat.
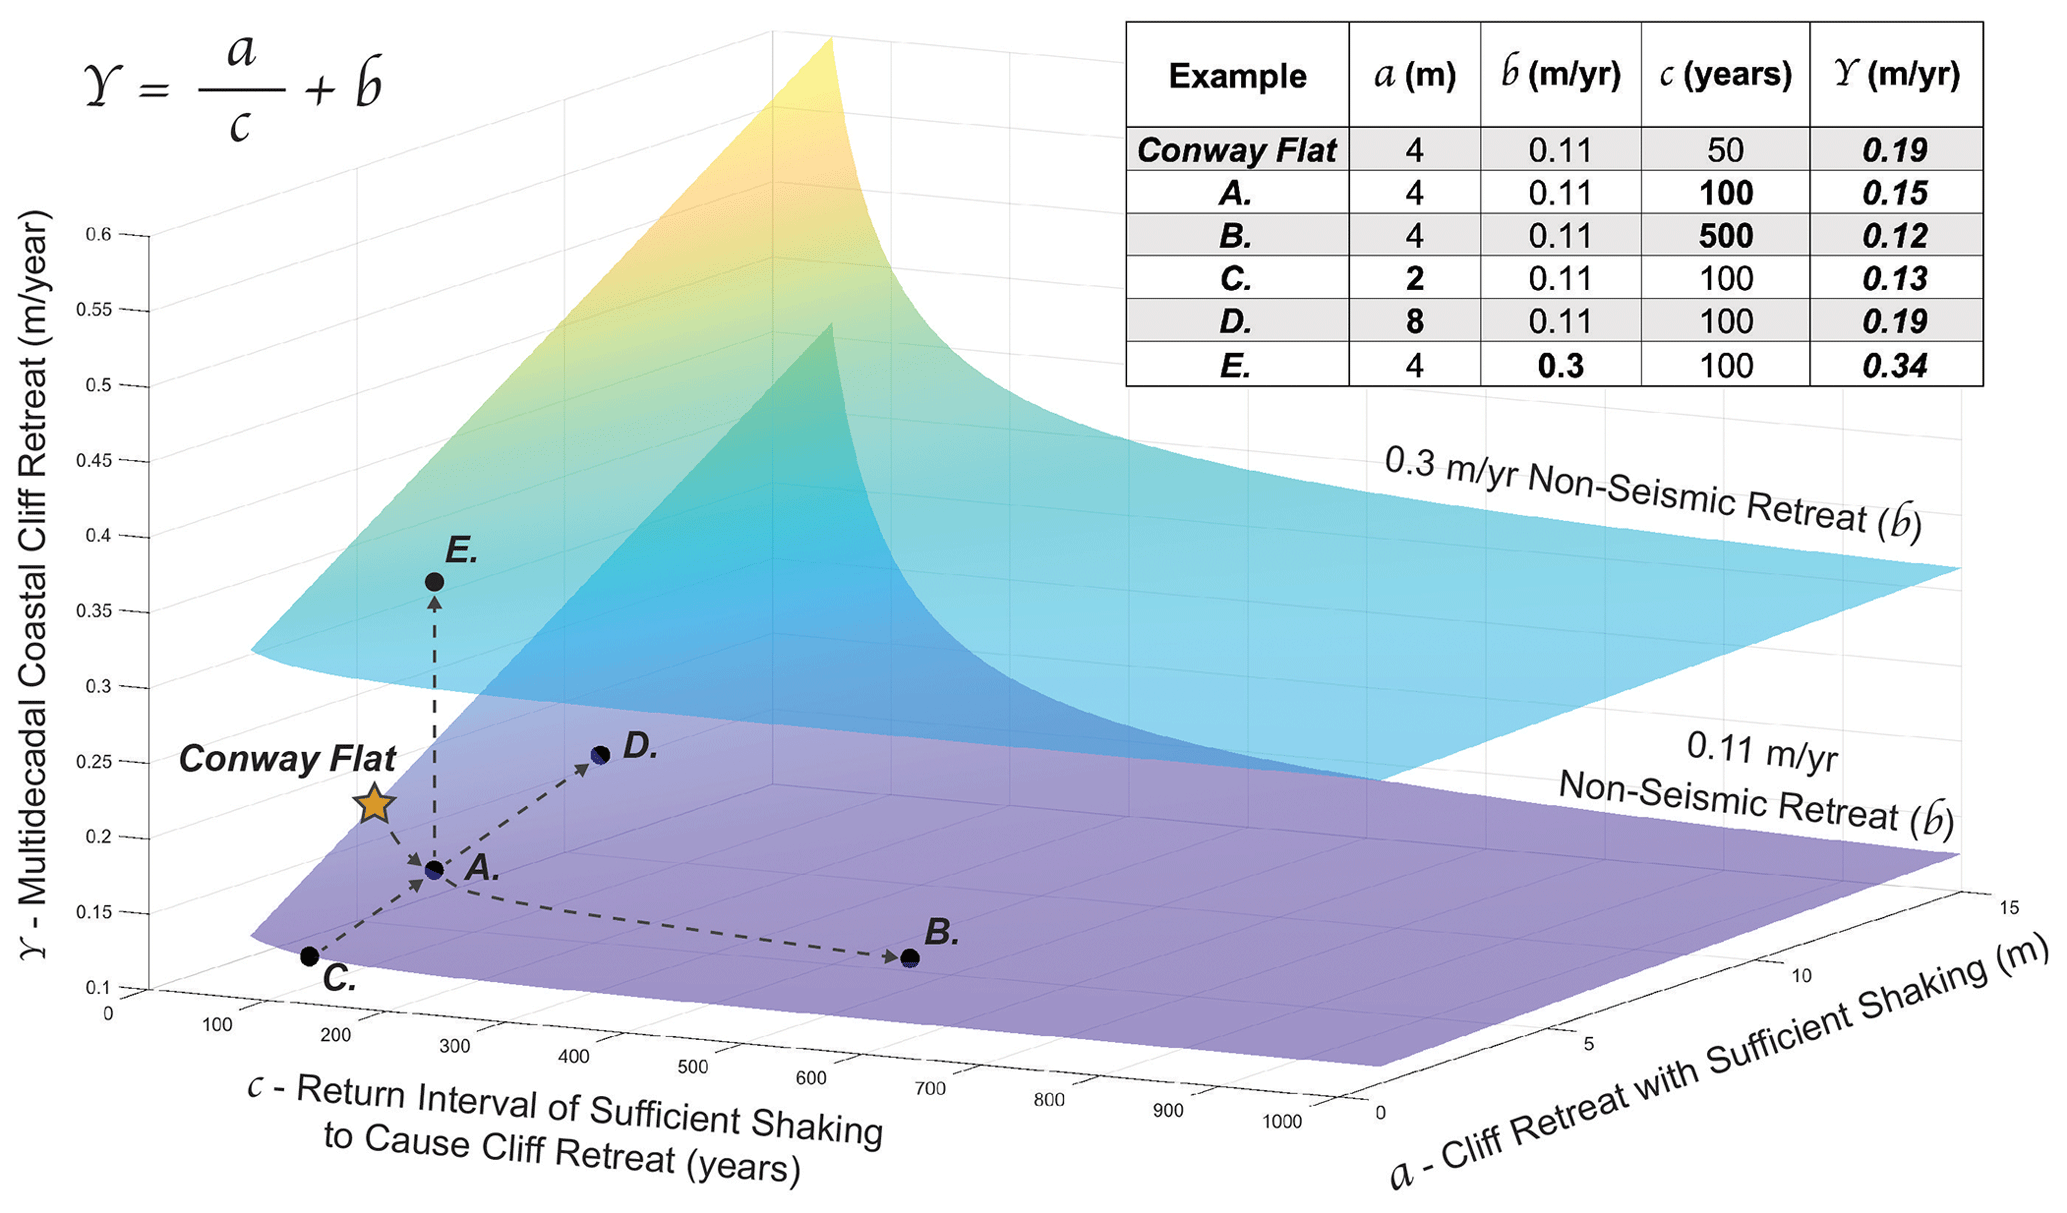
Figure 8Plot showing the three primary factors controlling earthquake influence on multidecadal coastal cliff retreat: amount of cliff retreat from sufficient earthquake shaking (a), the rate of non-seismic cliff retreat (b), and the return interval of sufficient earthquake shaking to cause cliff retreat (c). An increasing return interval results in a hyperbolic decay of the multidecadal coastal cliff retreat rate (A to B), while multidecadal coastal cliff retreat varies linearly with shaking-related cliff retreat (C to D) and non-seismic retreat (A to E).
Using these three inputs and assuming a cliff top susceptible to failure, a simple equation can be defined to determine the influence of earthquakes on the multidecadal rate of coastal cliff-top retreat (Y) as follows in Eq. (1):
Effectively, the multidecadal coastal cliff-top retreat rate equals the sum of earthquake-related cliff-top retreat and the total retreat from other non-seismic processes over the return period of sufficient shaking.
Based on our observations of the 2016 Kaikōura earthquake, we estimate that strong ground motion around PGA > 0.1 g is sufficient to produce cliff-top retreat at Conway Flat, though it is possible that even stronger ground motion could result in greater retreat. The historical record of earthquakes at Conway Flat suggests that sufficient ground motion to induce cliff-top retreat occurs approximately every 50 years. While seismic hazard is lower (and thus return period is longer) at Conway Flat, the historical record is consistent with seismic hazard curves for Kaikōura, which suggest a 50-year return period for PGAs of 0.2 g (Stirling et al., 2012). If we assume that the ca. 0.11 m yr−1 retreat rate we measured for the entire study area at Conway Flat from 1966 to 2015 represents the non-seismic coastal cliff-top retreat rate and that the coastal cliff top retreats an average of 4 m each time there is sufficiently strong ground motion (ca. every 50 years), we can apply the equation above to estimate a multidecadal coastal cliff retreat rate of ca. 0.19 m yr−1 (Fig. 8). This value is similar to our historical estimate of multidecadal cliff retreat at Conway Flat (see Sect. 5.3).
By varying the inputs involved in Eq. (1), we can further explore how sufficiently strong ground motion may influence the multidecadal rate of cliff retreat at other sites (Fig. 8). The recurrence of sufficient ground motion for cliff retreat (c) forms a hyperbola where longer return intervals result in a significantly lower single-event influence on multidecadal retreat (Fig. 8). Using the same example from Conway Flat above, increasing the return interval to 100 years results in a multidecadal cliff retreat rate of 0.15 m yr−1 (0.04 m yr−1 higher than non-seismic retreat alone, Fig. 8A), while increasing the return interval to 500 years results in a multidecadal cliff retreat rate of ca. 0.12 m yr−1 (0.01 m yr−1 higher than non-seismic retreat, Fig. 8B). Varying the amount of cliff retreat from earthquake shaking (c) or the non-seismic retreat rate (b) linearly scales the influence of ground motion (Fig. 8C–E). The relative influence of earthquake-related retreat at any given site is directly proportional to the non-seismic retreat rate. For example, at a site with a high non-seismic retreat rate but a relatively low single-event earthquake retreat (Fig. 8E), shaking is unlikely to have a strong influence on the multidecadal retreat rate over multiple sufficiently large earthquakes. Alternatively, at a site with a relatively low non-seismic retreat rate and a relatively high single-event earthquake retreat (Fig. 8D), earthquakes could have a substantial influence on the multidecadal retreat rate at short return intervals of sufficient shaking.
North of the study area at Conway Flat, the low-lying coastal cliffs of the Ngaroma terrace (Fig. 2) experienced very little coseismic failure in 2016 despite similar material and rate of non-seismic coastal erosion (ca. 0.2 m yr−1 between 1950 and 2017). This may be a result of varying site response to ground motion and underlines the challenge in making generalities across coastal cliffs, especially in regions with different lithologic and topographic site conditions. That being said, Conway Flat experienced widespread cliff retreat from relatively moderate ground motion and should serve as an important demonstration of the potential for historical rates of coastal cliff retreat to significantly underestimate multidecadal retreat over multiple earthquakes. In regions like coastal California where high population exposure to steep coastal cliffs coincides with frequent earthquake shaking (e.g., Griggs and Plant, 1998), understanding how earthquakes influence the multidecadal retreat of coastal cliffs could be important for calibrating effective forecast models. Geomorphic evidence of past earthquake events may not be preserved, even over historical timescales, so investigations may need to integrate seismic hazard analysis, geotechnical site characterization, physics-based modeling of coastal cliff response to earthquake shaking, and regional earthquake-induced landslide susceptibility analysis.
With the rate of coastal cliff retreat set to increase due to climate-change-induced sea level rise, accurately modeling and forecasting future cliff retreat are extremely important, particularly in areas with high population exposure to coastal hazards. The 2016 Mw 7.8 Kaikōura earthquake on the South Island of New Zealand resulted in significant coastal cliff retreat in the area of Conway Flat where modeled ground motion was around 0.2 g PGA. We used Conway Flat as a natural laboratory to examine how earthquake shaking influences the historical record of cliff retreat. Retreat was spatially and temporally variable over the past 72 years, and large earthquake-induced landslide-triggering events appear to disproportionately contribute to an average 0.25 m yr−1 retreat at Conway Flat. The 2016 Kaikōura earthquake alone represents ca. 24 % of the total retreat over the past 72 years. Together with observations of significant retreat between 1950 and 1966, which likely resulted from the 1951 Mw 5.9 Cheviot earthquake, we estimate that earthquakes increase the multidecadal cliff retreat rate at Conway Flat by ca. 45 % over estimates that exclude earthquakes. Evidence of widespread failure, including failed debris, has been quickly removed by coastal erosion since the 2016 Kaikōura earthquake with an estimated ca. 15 300 m3 or 5 % of landslide debris removed each year in the 5 years following the earthquake. In tectonically active regions that have not experienced recent earthquake-related cliff retreat, the extent to which the historical record underestimates multidecadal retreat rate is highly dependent on the magnitude of coseismic and non-seismic cliff-top retreat as well as the return interval of sufficient ground motion to induce failure. Seismic hazard models and dynamic physical models of coastal cliffs may thus serve as useful tools for estimating the potential multidecadal influence of earthquakes on coastal cliff retreat rates.
A1 Orthomosaic processing from scanned images
The aerial image orthomosaics discussed in the paper from 1950, 1966, 1975, and 1985 were processed from original digital scans in the LINZ Crown Aerial Film Archive (LINZ, 2021) using Agisoft Metashape 1.8.2. The fringe of the original image scans includes fiducial marks and information on the camera lens that were matched with camera calibration certificates provided by the Crown Aerial Film Archive. In Metashape, we define the fiducial marks for each scan before masking the image fringe.
We followed the typical Agisoft Metashape workflow as outlined in the program documentation for producing orthomosaics. Images were aligned at low quality, and well-distributed ground control points, sourced from a 2017 orthomosaic and derived digital surface model (DSM; Massey et al., 2020b), were assigned manually to each image. Images were then realigned and optimized. We built a high-quality dense point cloud with moderate depth filtering and a height field mesh using the dense point cloud and a high face count. A geographic orthomosaic was produced from the mesh and exported to .tif format.
A2 Uncertainty estimation
A2.1 Georeferencing uncertainty
Georeferencing error and distortion result in variable uncertainty across the orthomosaics we produced from scanned aerial imagery (LINZ, 2021), those that we obtained from the LINZ data service (LINZ, 2022), and those that we produced from lidar. As we are directly comparing these datasets, it is important that we characterize this uncertainty. For each orthomosaic, we identified distributed control points along the coastline (our main area of interest) and matched these control points with our base 2017 orthomosaic. We estimate a Euclidean distance between the matched control points and assign this distance as the uncertainty at each point. Because there is not a consistent uncertainty across our images, we applied inverse distance-weighted interpolation in ArcGIS to interpolate our uncertainty as a 25 m per pixel continuous grid across the study area (Fig. A1).
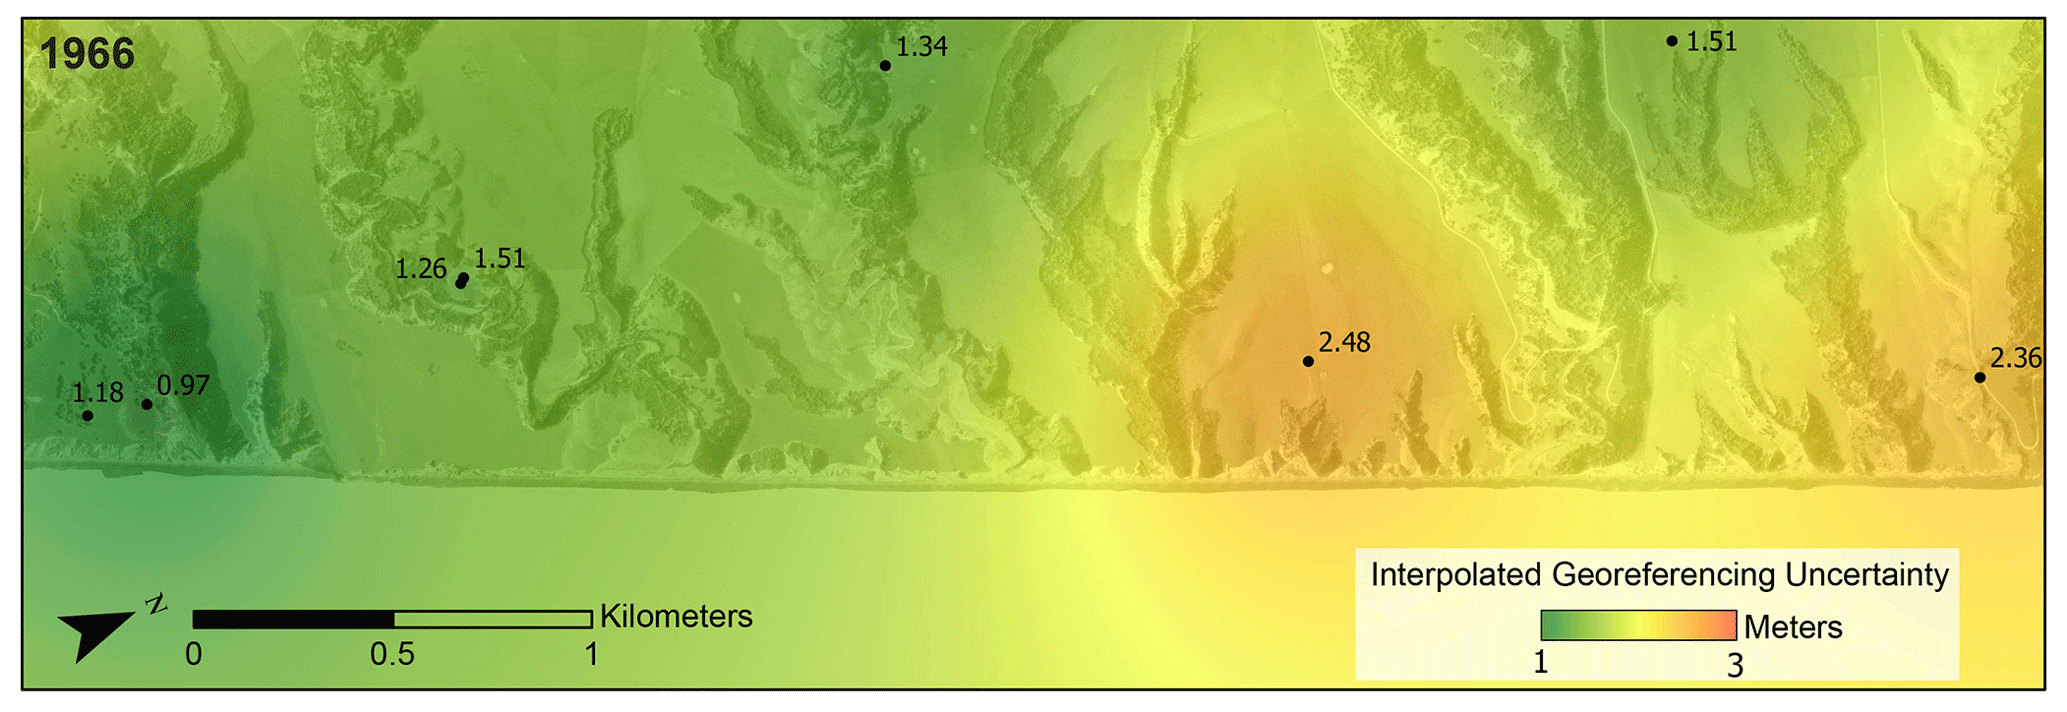
Figure A1Example of interpolated georeferencing uncertainty in the 1966 orthomosaic (LINZ, 2021). Black points with labels represent the distance between a control point and the base 2017 orthomosaic (Massey et al., 2020b). Inverse distance-weighted interpolation (IDW) interpolation is used to create a 25 m per pixel continuous grid of uncertainty across the image.
We extract the estimated georeferencing uncertainty from the interpolation at each point where a transect crosses the digitized shoreline in that image. In our case, each transect has two points where it crosses, one associated with the older image and one associated with the younger image. Georeferencing uncertainty is compounded between the two points to provide a total georeferencing uncertainty for each transect using the following equation, Eq. (A1):
where Uimage1 is the georeferencing uncertainty for the older cliff edge and Uimage2 is the georeferencing uncertainty for the younger cliff edge. As shown in Fig. 4, this georeferencing uncertainty is combined with digitization uncertainty to define an overall measurement uncertainty.
A2.2 Digitization uncertainty
Using the same equation as we use for georeferencing uncertainty, we compound a digitization uncertainty for each transect. Unlike the georeferencing uncertainty, however, we assume that digitization uncertainty is consistent across the image set. We conducted a blind resampling of our digitization on a representative section of coastline (the example in Fig. 7) to determine the digitization uncertainty. The same person who digitized the cliff top across the image retraced the section of cliff edge five times and estimated the maximum coast-perpendicular distance between all possible pairs of cliff-edge traces in regular 20 m intervals along the coast. The digitization error for the image is defined as the average of these maximum distances (Table A1). This value may be greater than 1σ uncertainty, but we treat it as a conservative estimate of 1σ.
Table A1Digitization uncertainty for each orthomosaic (LINZ, 2021, 2022).
A2.3 Debris volume uncertainty
To estimate uncertainty for our volume estimates, we assume that the mean difference between the measured DSMs, outside the extent of mapped landslides, represents a systematic vertical offset between the two datasets. We add this estimated vertical offset (0.72 m 2015 to 2017 and 0.92 m 2015 to 2022) to the elevation difference within the extent of mapped landslides and estimate a +1σ debris volume. Similarly, by subtracting the estimated vertical offset, we estimate a −1σ debris volume. Subtracting the +1σ debris volume from the measured debris volume results in a conservative estimate of 1σ uncertainty. In reality, 1σ may be smaller as much of the area within mapped landslides was unvegetated before and after the earthquake, while much of the area outside mapped landslides was vegetated.
A2.4 Transect locations at Conway Flat
Transects at Conway Flat were grouped into five sections based on lithologic domains described in the paper. Transects are located every 20 m along a baseline which extends from south to north (lat–long −42.723591, 173.408607 to −42.654044, 173.446673). Transects from 0 to 3340 m along the baseline are considered to be south of Inverness Stream. Transects from 3360 to 4680 m along the baseline fall between Inverness Stream and the Medina River. Transects between 4700 and 5440 m along the baseline fall between the Medina River and Dawn Creek. Transects between 5460 and 6760 m along the baseline fall between Dawn Creek and Big Bush Gully. Finally, transects from 6780 to 8320 m along the baseline are considered to be north of Big Bush Gully.
B1 Gullies
As discussed in the paper, we removed gullies from our estimates of average retreat and retreat rate at Conway Flat as they likely represent different erosional mechanisms from the majority of the coastal cliff face. Here we present the average retreat rate within the gullies as they compare to the cliff retreat reported within the paper (Table B1).
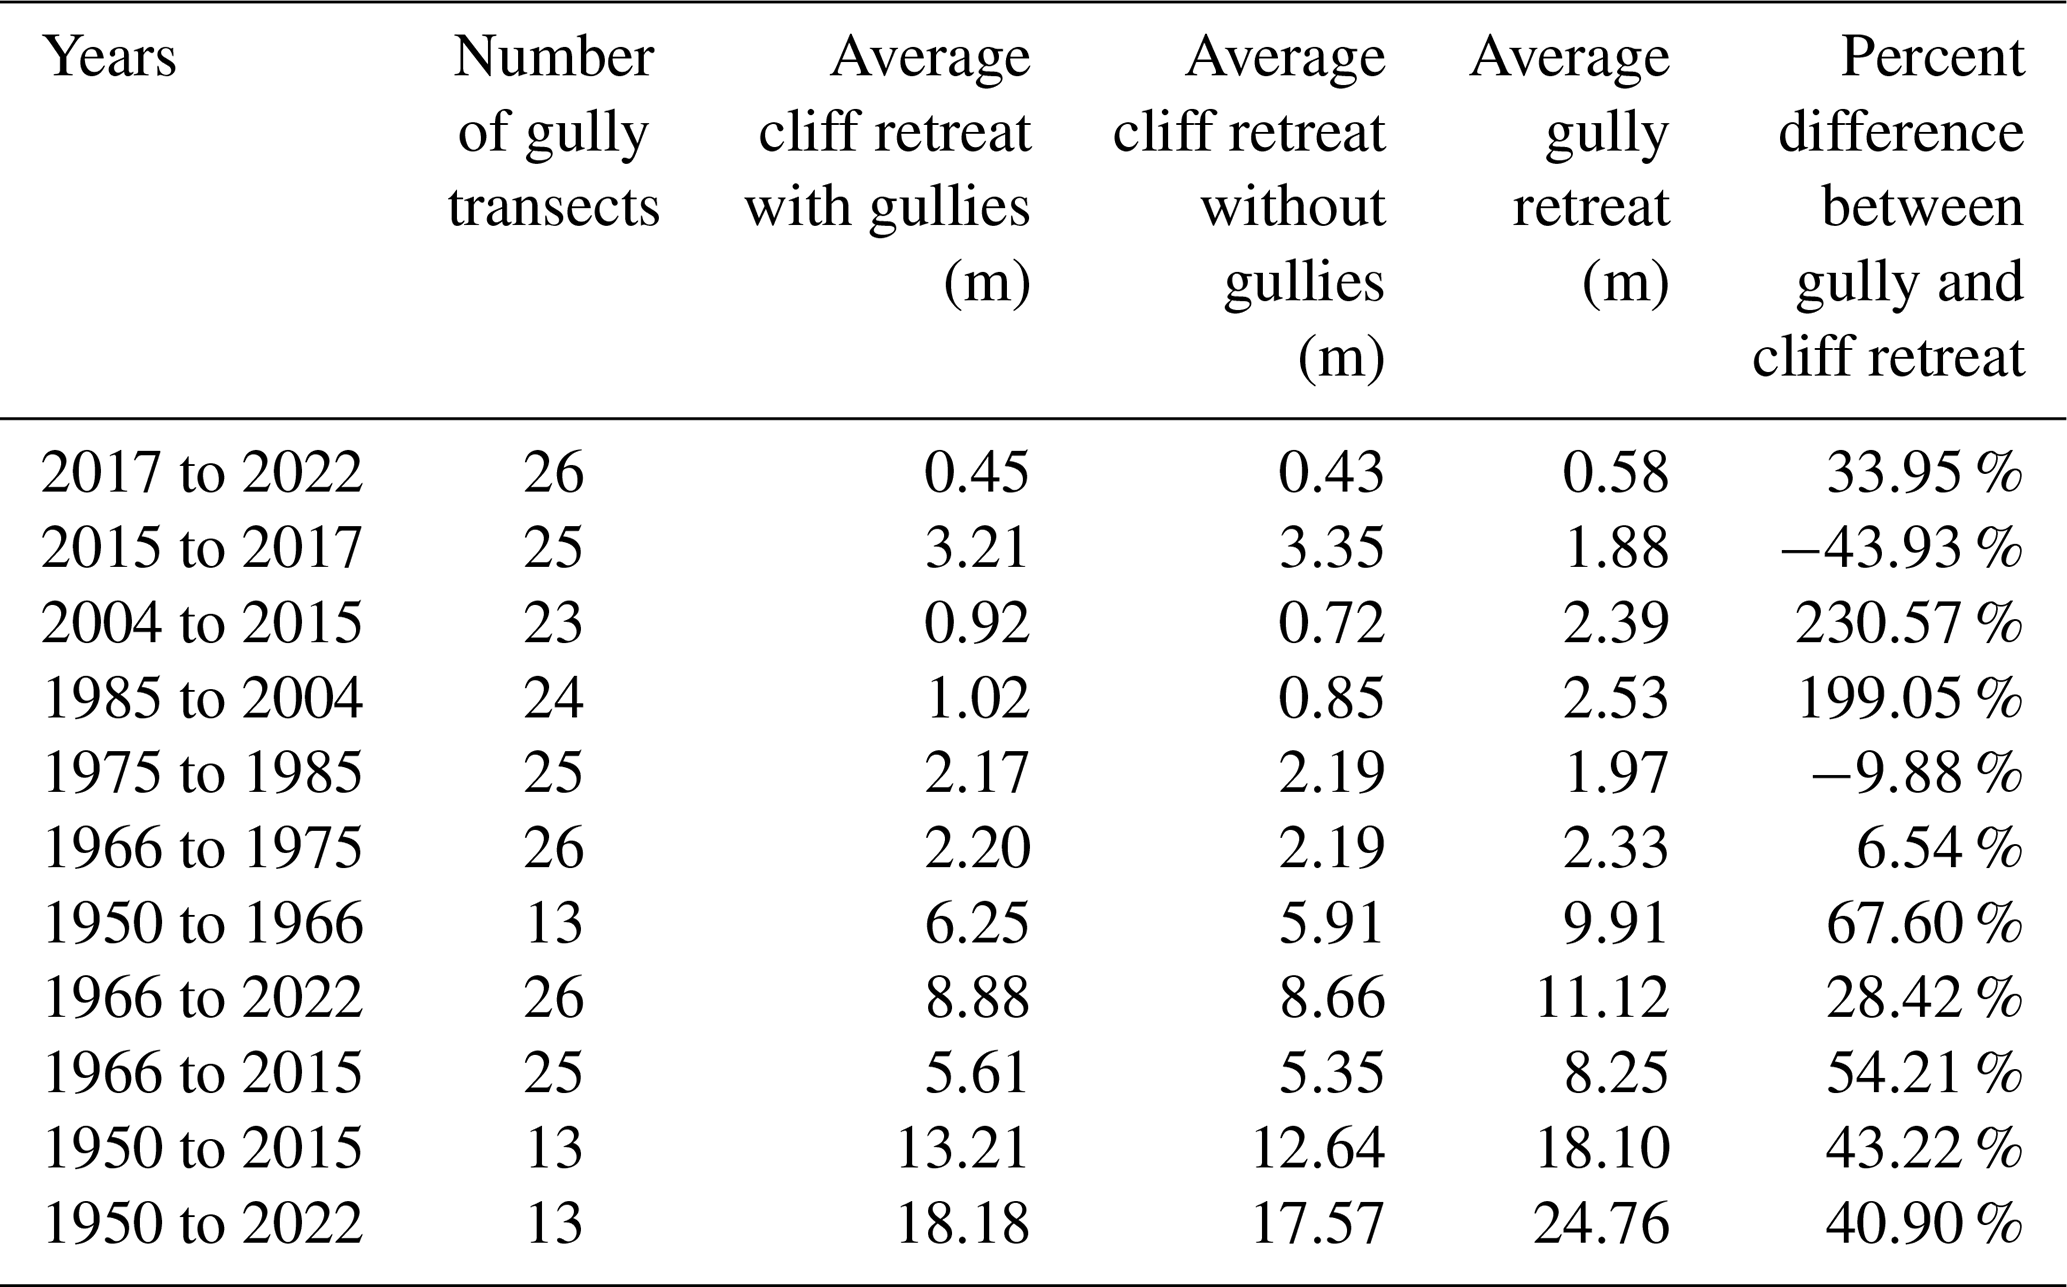
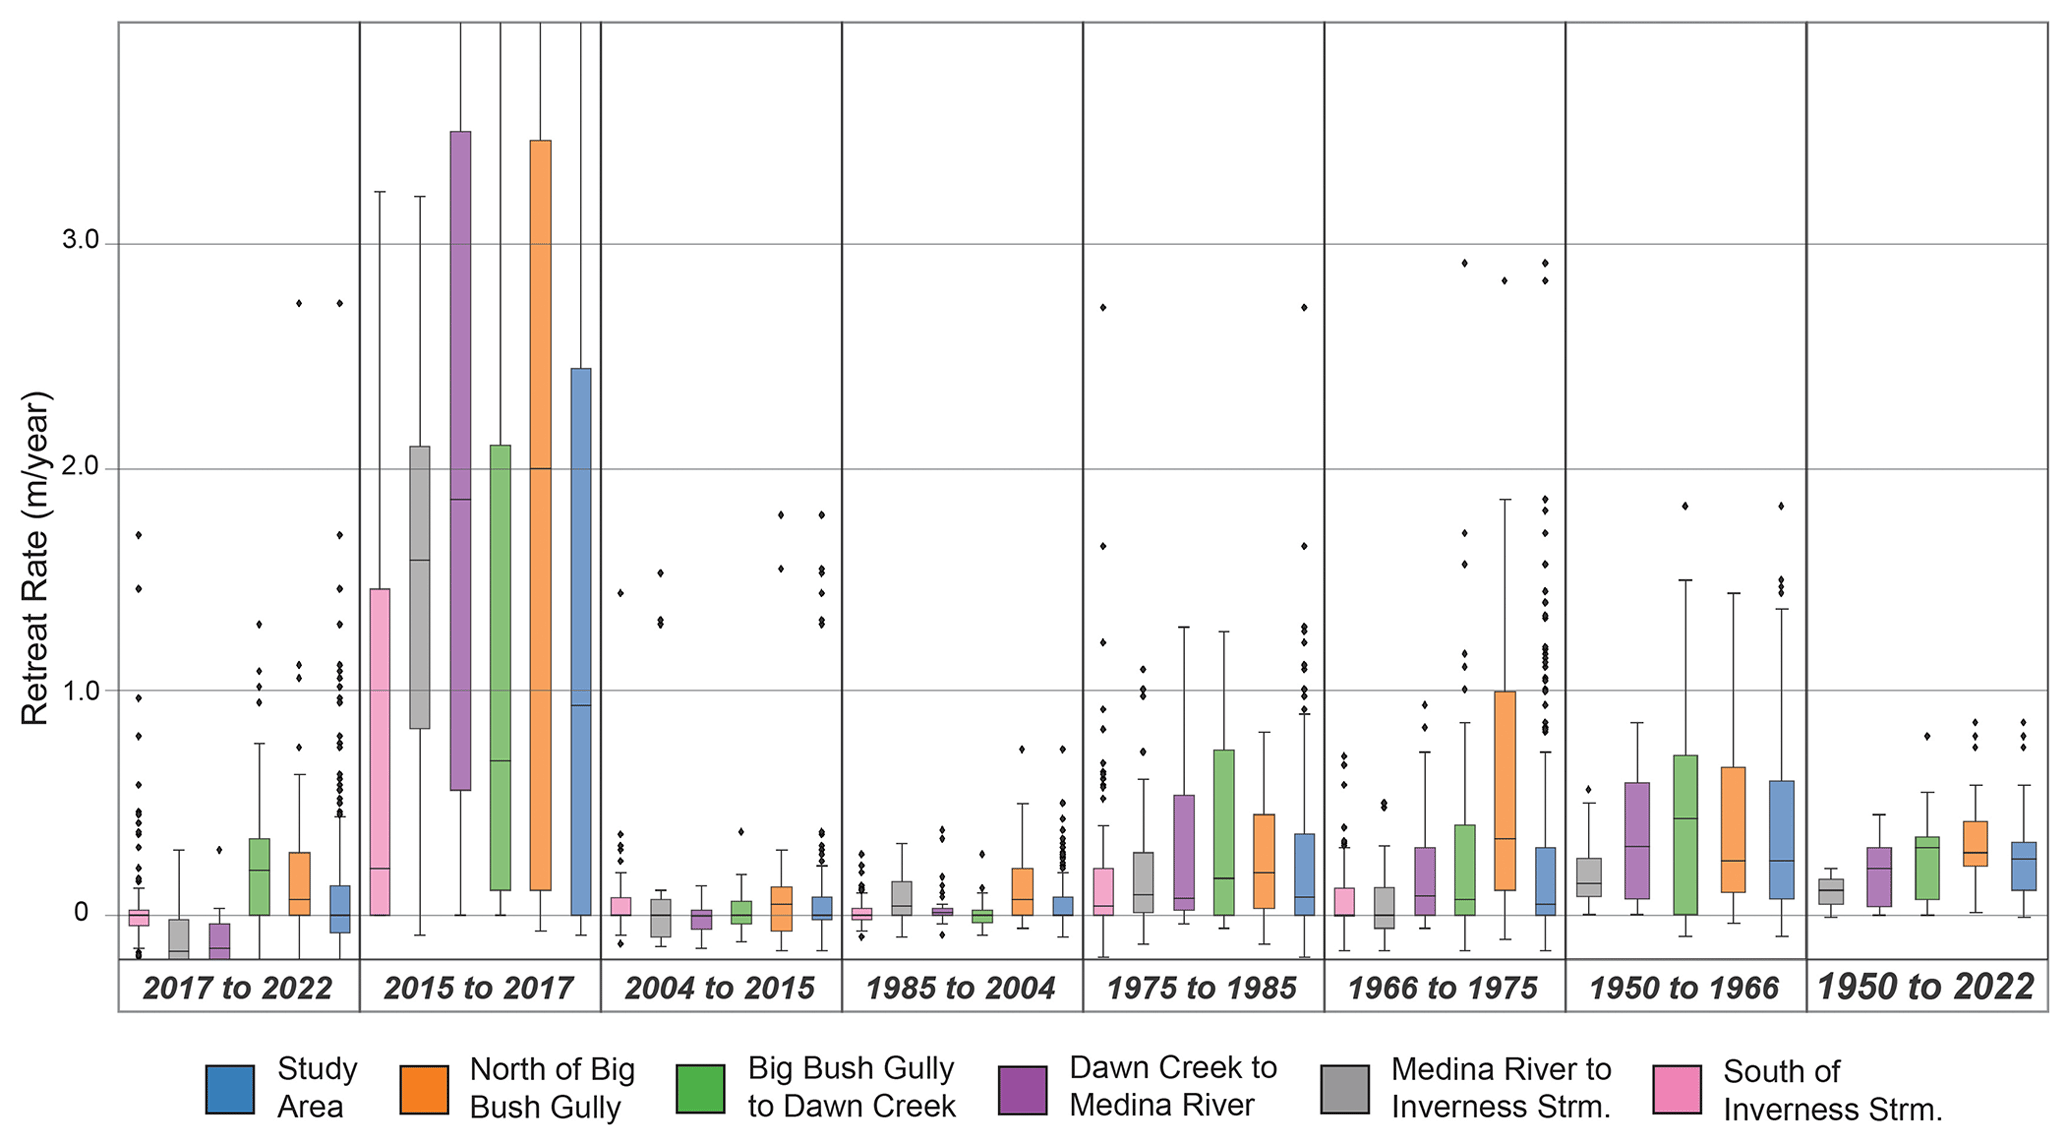
Figure B1Box plots showing the spread of retreat rates within each section of coastline at Conway Flat.
In general, gullies exhibited greater retreat than the overall cliff face. This was particularly pronounced in the 2004 to 2015 and the 1985 to 2004 time windows where gully retreat was ca. 2 times as great as general cliff retreat. While it is possible that higher gully retreat, particularly in these two time windows, is related to the greater susceptibility of gullies to fluvial incision, the extremely limited number of gully transects (13 to 26) casts doubt on the reliability of a direct comparison with the general cliff transects.
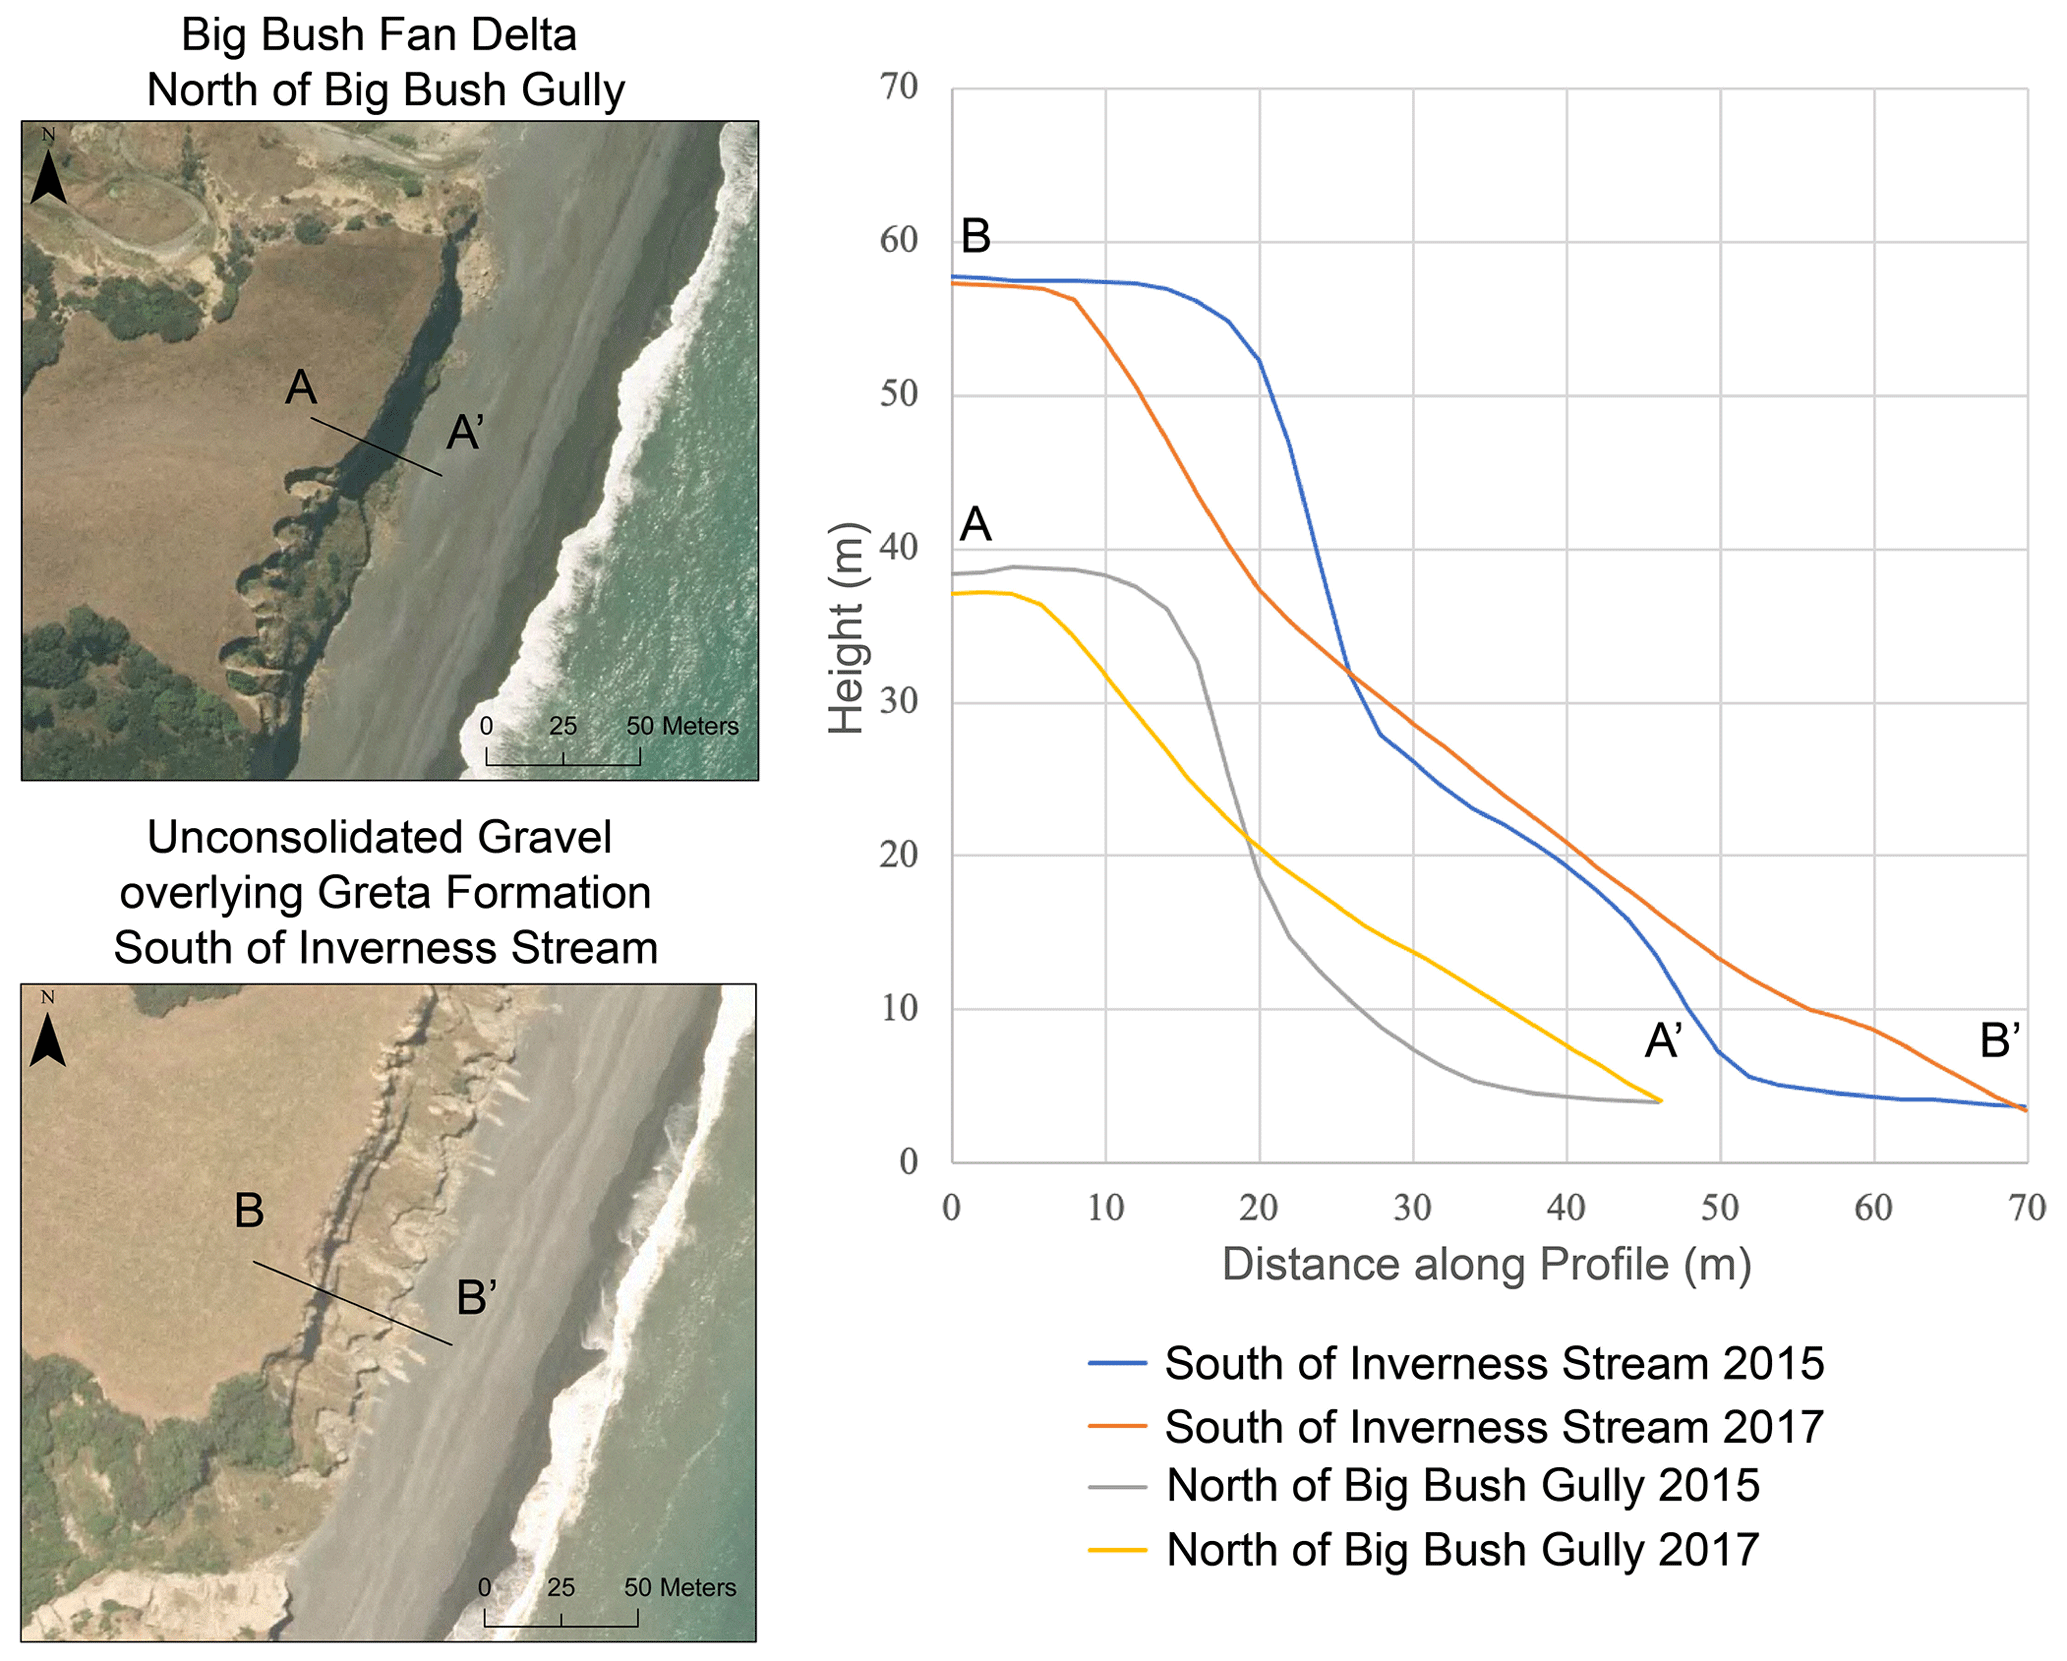
Figure B2Comparative cliff profiles. Profile A is taken from a cliff face that consists entirely of fan delta deposits. Profile B is taken from a cliff face that consists of Greta Formation overlain by unconsolidated gravels. The contact between underlying Greta and overlying unconsolidated sediment occurs at approximately 30 m height in Profile B. The location of profiles is noted on the 2015 orthoimages to the left (LINZ, 2022).
B2 Spatial variability in historical retreat at Conway Flat
As discussed in the paper and demonstrated by Fig. B1 there is significant spatial variability in historical retreat at Conway Flat. In general, retreat decreases north to south with the highest retreat north of Big Bush Gully and the lowest retreat south of Inverness Stream. In some sections of the Conway Flat coast, for example south of Inverness stream, lower historical cliff-top retreat could be a result of more resistant geology at the toe of the cliff that prevents undercutting of the upper cliff by wave action. Over multidecadal timescales this may result in subaerial triggers like earthquakes playing a more important role in cliff-top retreat than wave action. When cliff-top retreat outpaces retreat at the toe of the cliff, the steepness of the cliff top can be reduced, effectively slowing cliff-top retreat, but this is not always the case at Conway Flat. Figure B2 provides comparative profiles demonstrating this. In profile A to A′ in Fig. B2 the cliff top is influenced by both wave action at the toe of the slope (pre-2016) and subaerial triggers at the top of the slope. Alternatively, in profile B to B′, terracing occurs, with the Greta Formation buffering cliff-top retreat from undercutting by wave action prior to the 2016 earthquake. Despite this, the upper cliff face remained susceptible to subaerial triggers and failed during the 2016 Kaikōura earthquake. While additional site-specific investigation into geologic controls on cliff retreat at Conway Flat would be required to make more robust claims, lithology and cliff geometry likely play a role in the spatial variability of retreat at Conway Flat.
In addition to aerial images collected from the Crown Aerial Film Archive (LINZ, 2021), we acquired several oblique photos of the Conway Flat cliffs prior to the 2016 Kaikōura earthquake from unpublished investigations (Figs. C1 and C2) and collected photos of the coast following the earthquake in 2022 (Fig. C3). In general, the photos support our interpretation of the pre- and post-Kaikōura earthquake cliff morphology and provide a useful visual reference. The earliest oblique photos, presented in Fig. C2, were taken to document remnant native forests along the North Canterbury coast by the former New Zealand Department of Scientific and Industrial Research (DSIR). High-resolution prints of the images were provided by Miles Giller of QEII Trust. Despite several attempts, we were unable to locate the photo negatives or the exact date of image collection. Based on comparison with other aerial imagery the photos appear to have been taken between 1966 and 1985.
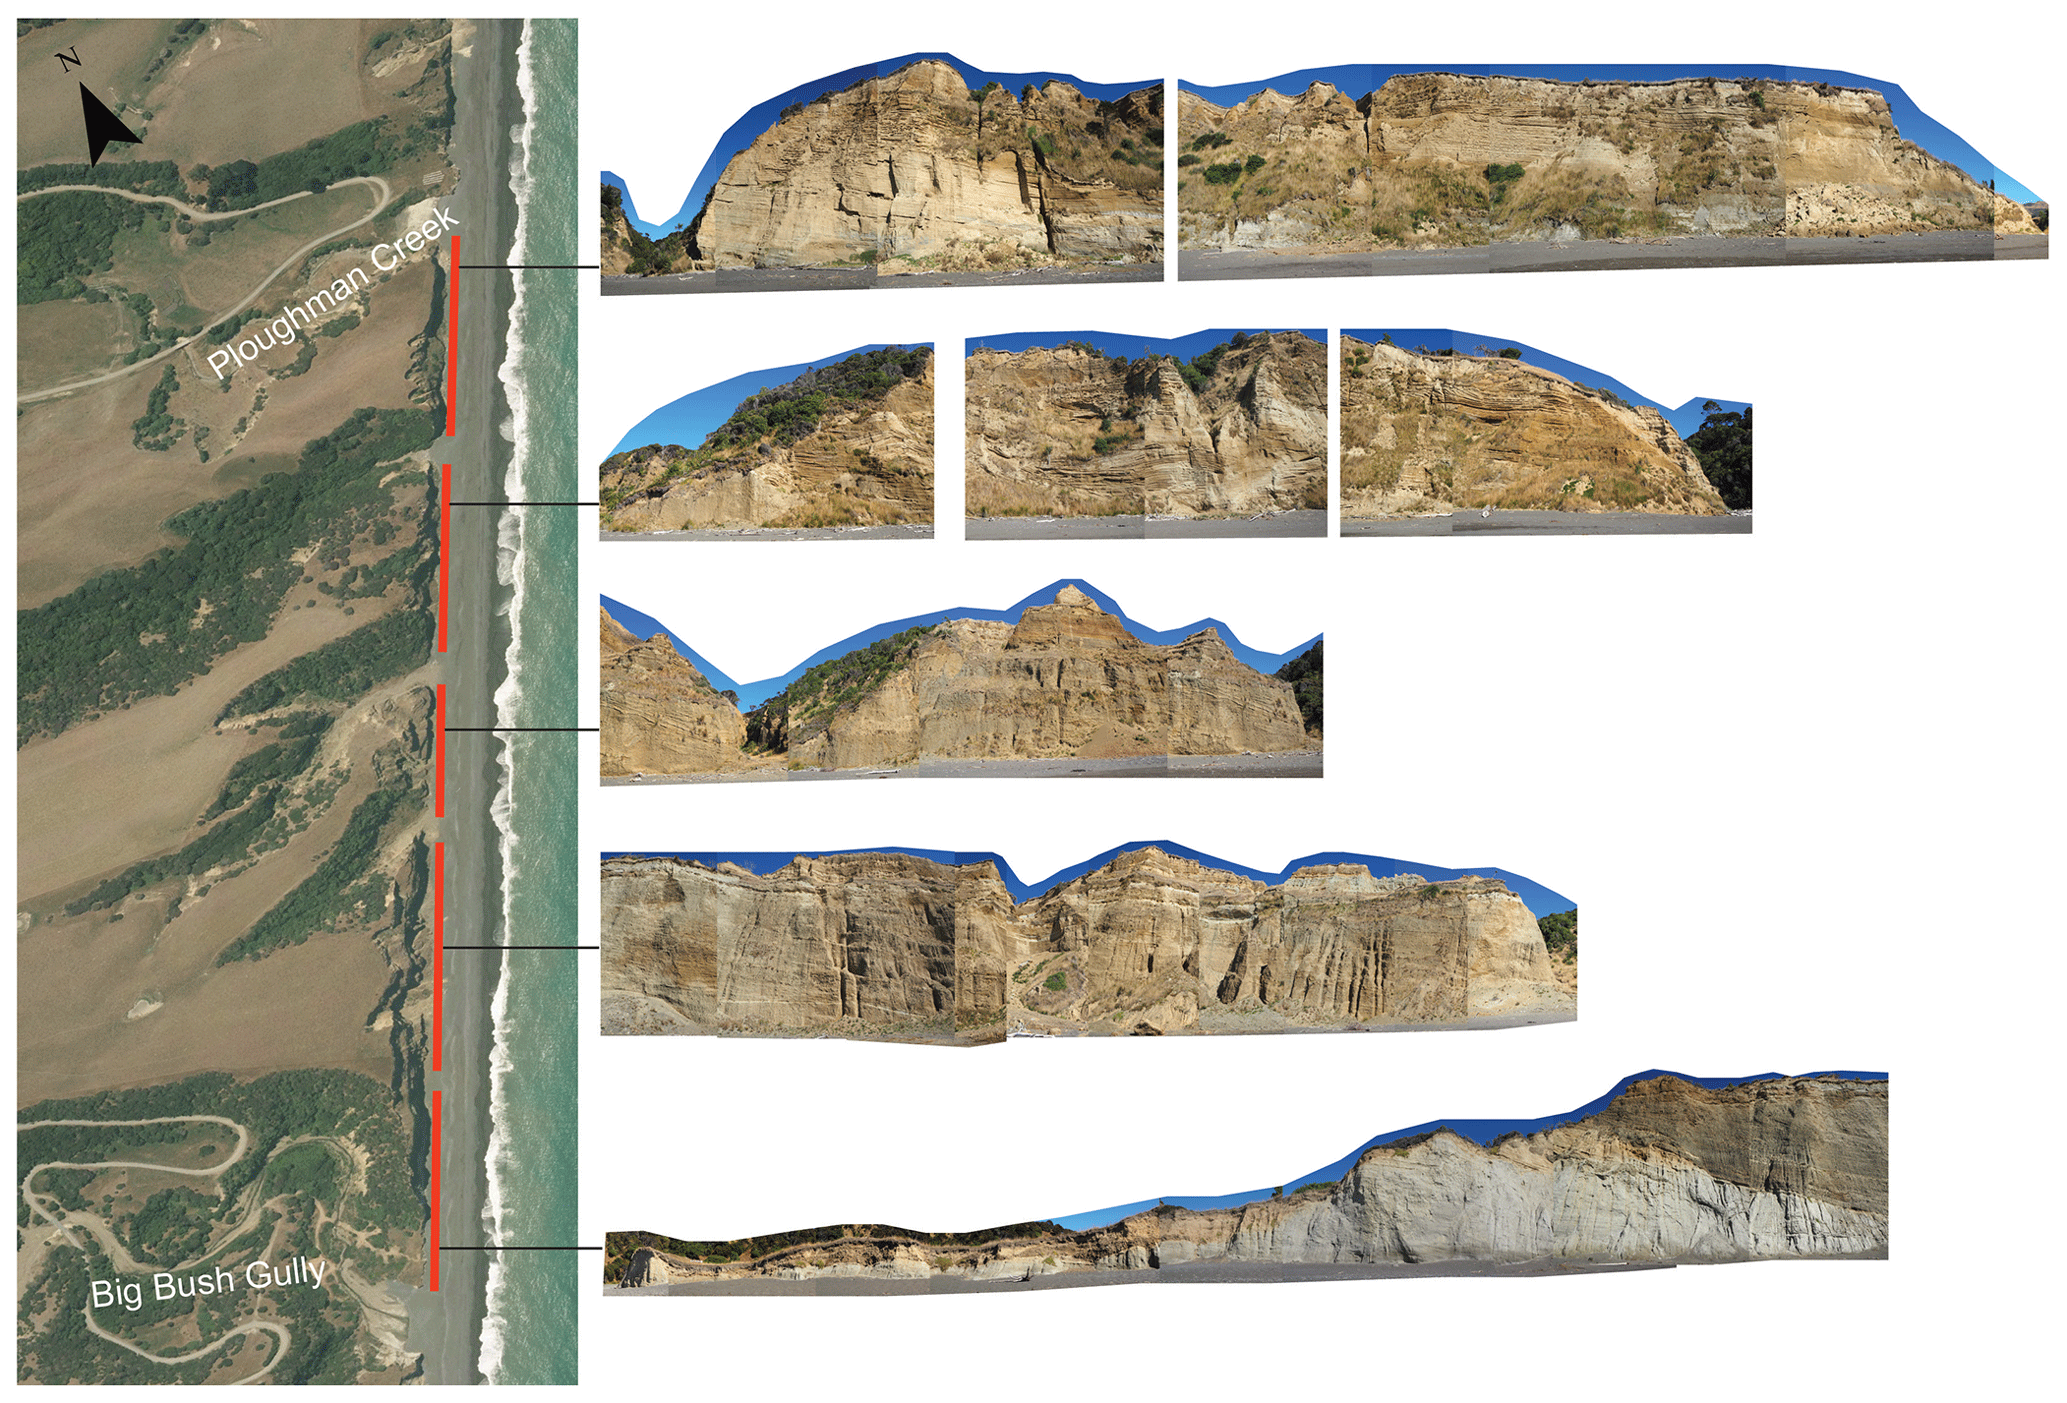
Figure C1Oblique photos manually stitched into mosaics of the cliffs at Conway Flat between Big Bush Gully and Ploughman Creek. Photos taken on 17 February 2015 by Kari Bassett. A 2015 orthomosaic is provided for reference on the left (LINZ, 2022).
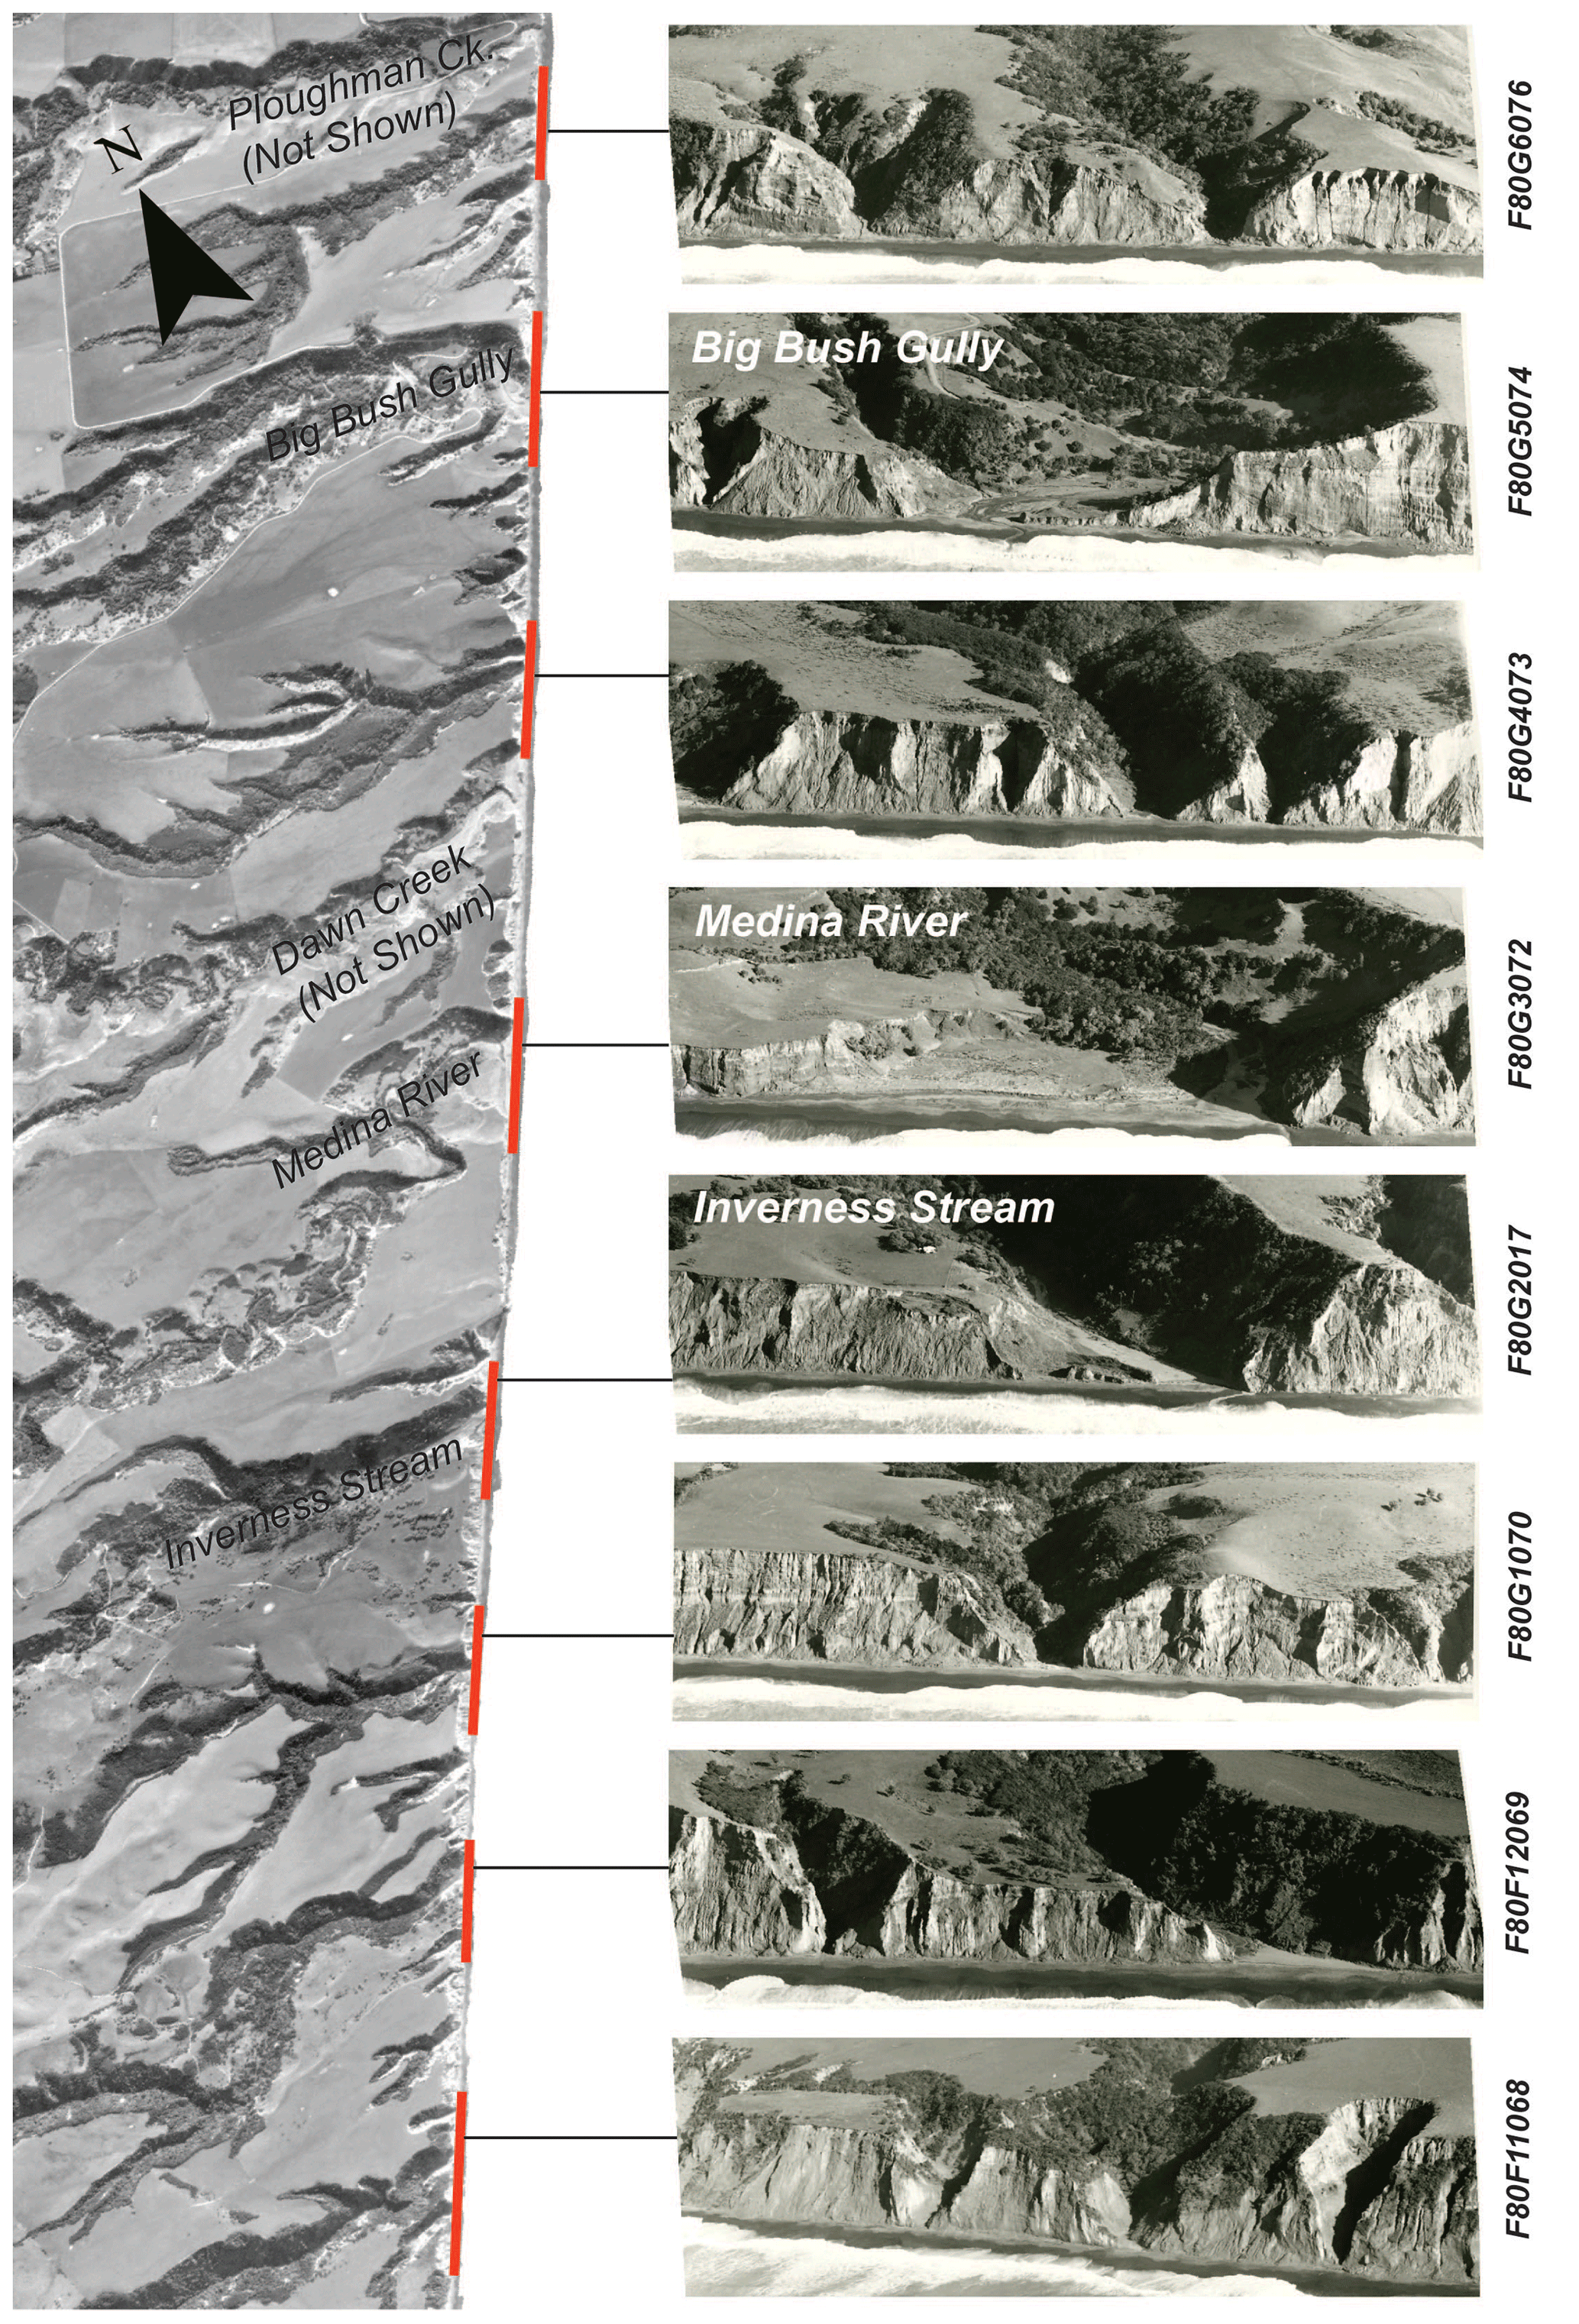
Figure C2Oblique photos of the cliffs at Conway Flat. Date unknown but ca. 1970s based on comparison with dated aerial image sets. Photos provided by Miles Giller (QEII Trust). A 1966 orthomosaic is provided for reference on the left (LINZ, 2021).
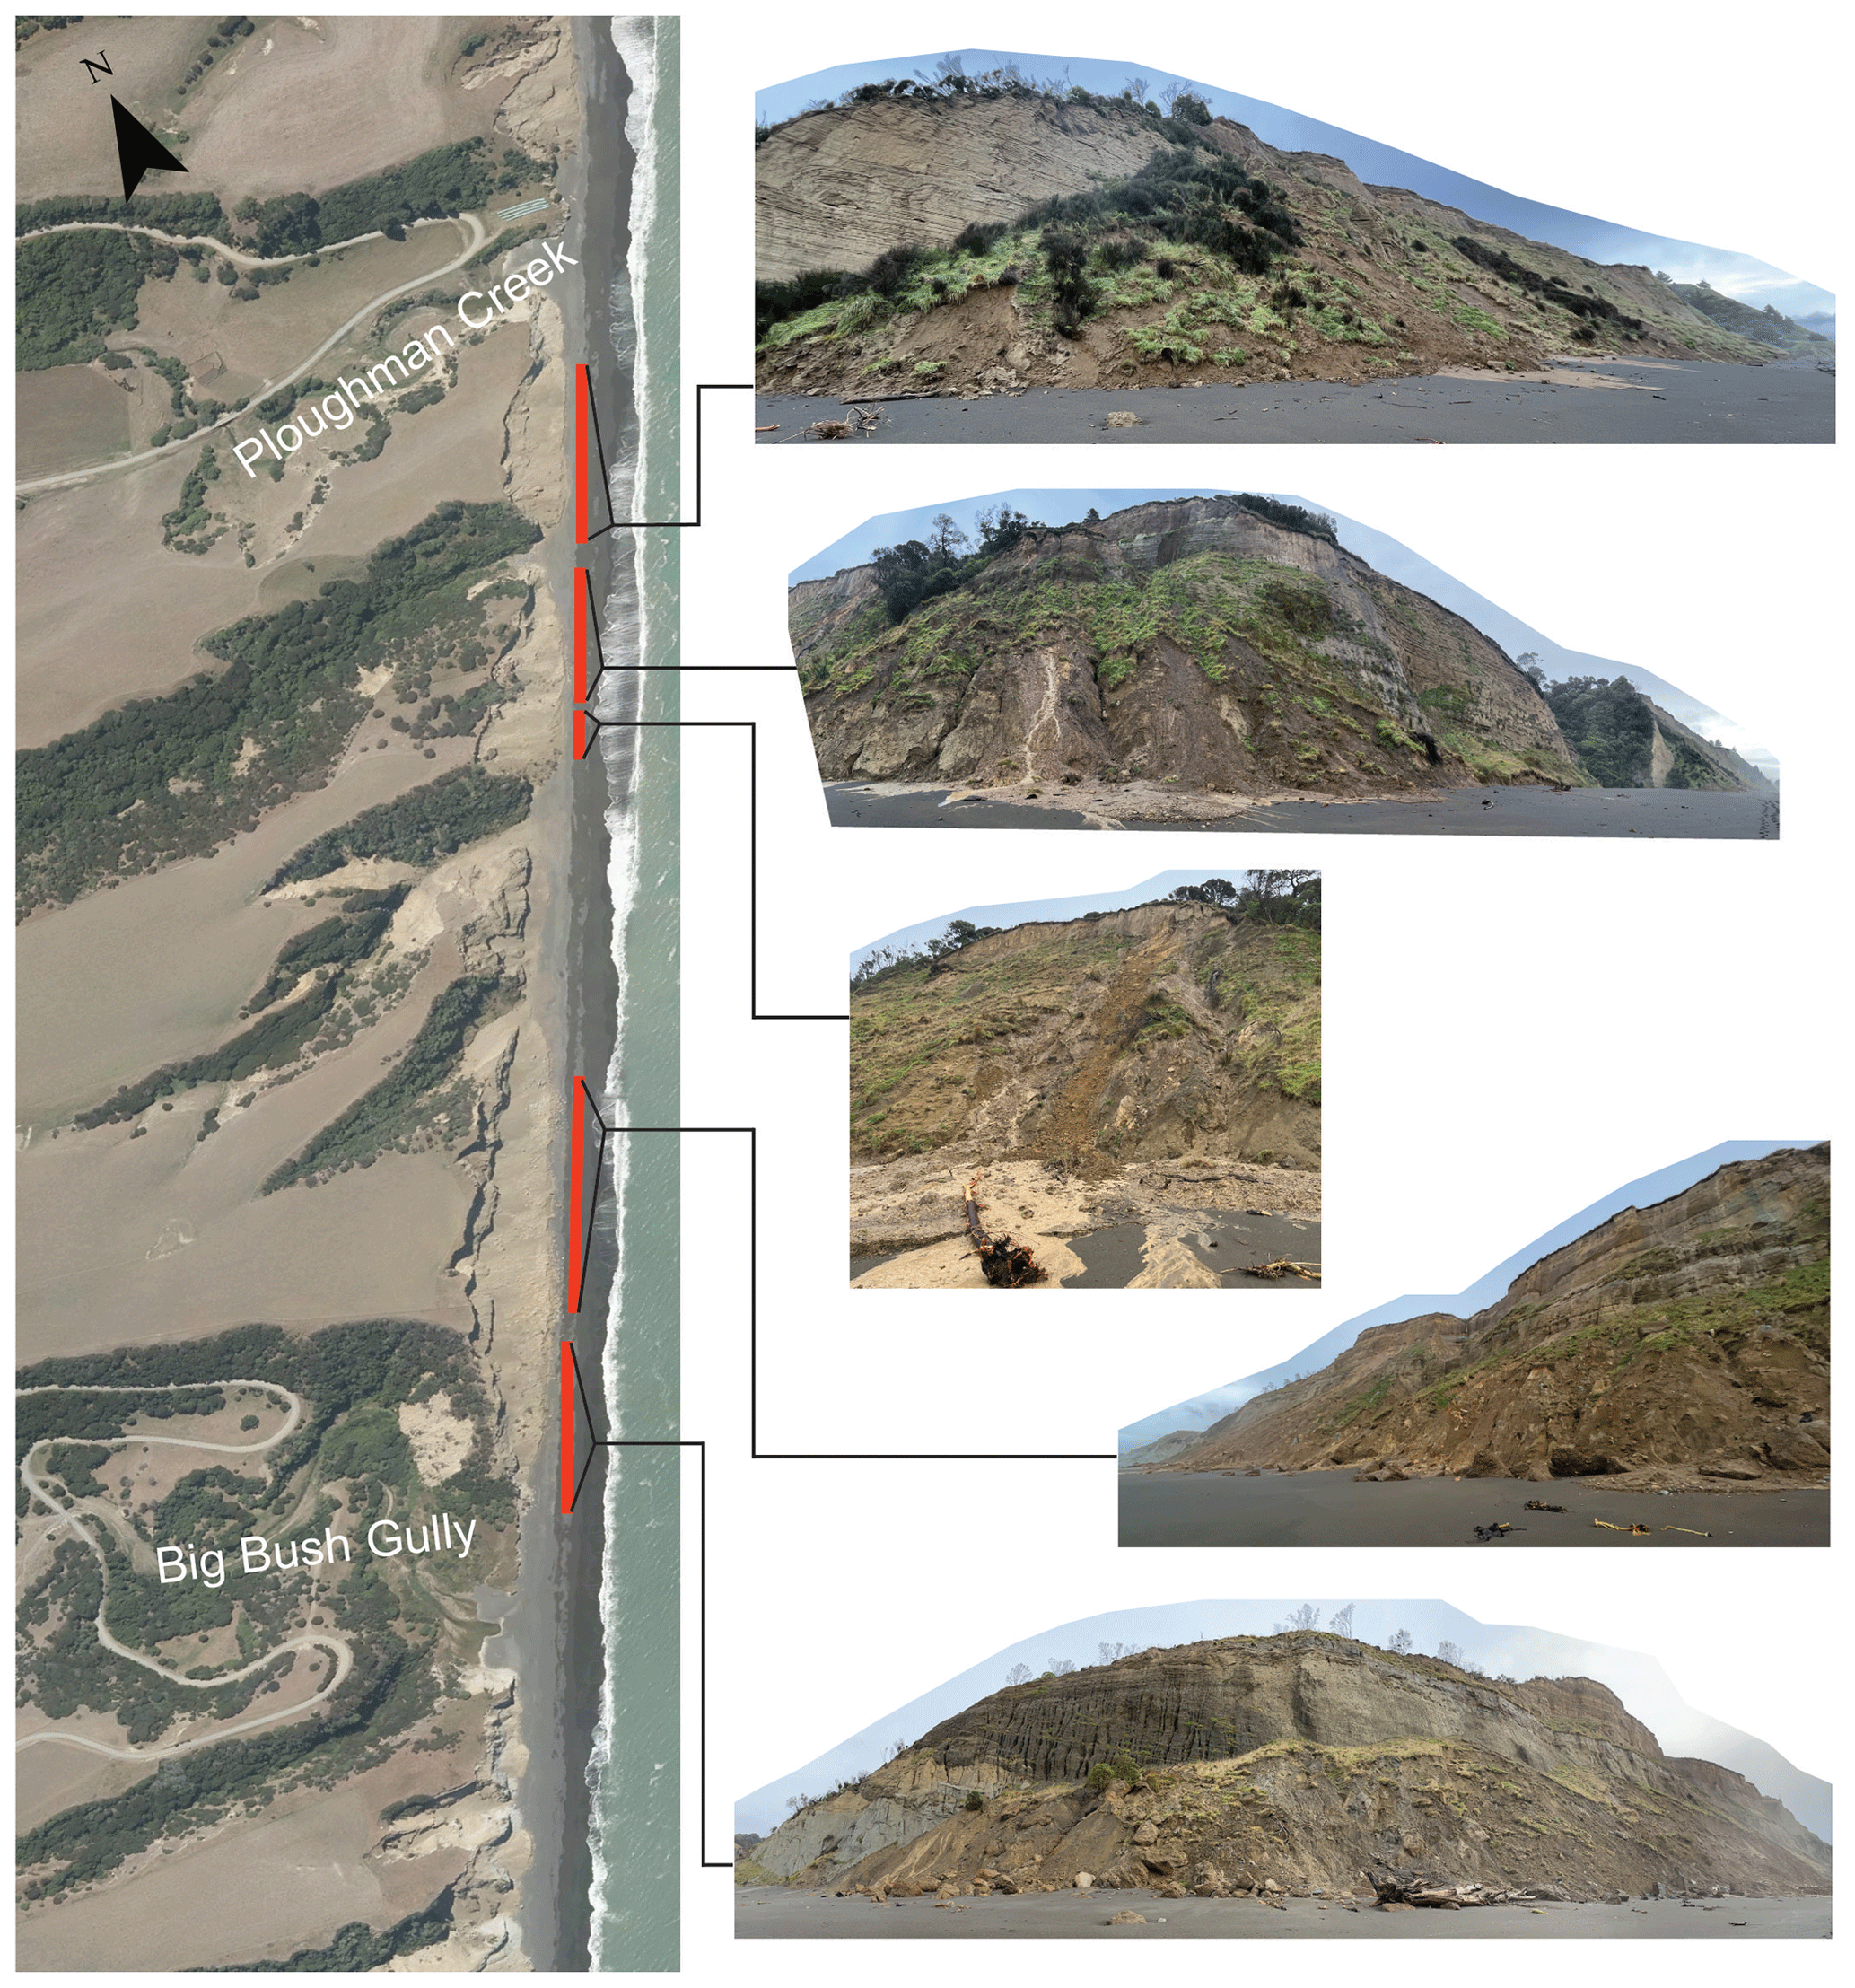
Figure C3Oblique photos of the cliffs at Conway Flat between Big Bush Gully and Ploughman Creek showing the state of post-2016 Kaikōura earthquake debris piles on 28 July 2022. A 2017 orthomosaic is provided for reference on the left (Massey et al., 2020b).
A .csv file with raw cliff-top retreat data from Conway Flat is included as a Supplement to this paper.
The supplement related to this article is available online at: https://doi.org/10.5194/esurf-11-757-2023-supplement.
CB: conceptualization, methodology, formal analysis, investigation, visualization, writing – original draft. CS: methodology, investigation, visualization, writing – review and editing. TS: supervision, funding acquisition, conceptualization, methodology, writing – review and editing. AH: supervision, methodology, writing – review and editing. CM: supervision, funding acquisition, writing – review and editing.
The contact author has declared that none of the authors has any competing interests.
Publisher's note: Copernicus Publications remains neutral with regard to jurisdictional claims in published maps and institutional affiliations.
The authors would like to extend a large thank you to the landowners and residents of Conway Flat for their assistance and support in this research. Additional thanks to Kari Bassett at the University of Canterbury and Miles Giller at QEII Trust for sharing their oblique photo datasets from Conway Flat. Thanks to Jamie Gurney, who provided a summary of news articles related to the two historical earthquakes near Cheviot. Finally, thanks to reviewers Mark Dickson and Colin Murray-Wallace for their constructive comments, which greatly improved the paper.
This research has been supported by the New Zealand Ministry of Business, Innovation and Employment Endeavour-funded “Earthquake Induced Landslide Dynamics” project, Te Hiranga Rū QuakeCoRE – New Zealand Centre for Earthquake Resilience, and Toka Tū Ake EQC University Research Programme “Resilience to Earthquake and Landslide Multihazards”.
This paper was edited by Greg Hancock and reviewed by Mark Dickson and Colin V. Murray-Wallace.
Ashford, S. A., Sitar, N., Lysmer, J., and Deng, N.: Topographic effects on the seismic response of steep slopes, Bull. Seismol. Soc. Am., 87, 701–709, 1997.
Ashton, A. D., Walkden, M. J. A., and Dickson, M. E.: Equilibrium responses of cliffed coasts to changes in the rate of sea level rise, Mar. Geol., 284, 217–229, https://doi.org/10.1016/j.margeo.2011.01.007, 2011.
Barrell, D. J. A., S+rling, M. W., Williams, J. N., Sauer, K. M., and van den Berg, E. J.: Hundalee Fault, North Canterbury, New Zealand: late Quaternary ac+vity and regional tectonics, New Zeal. J. Geol. Geophys., 66, 293–316, https://doi.org/10.1080/00288306.2022.2153877, 2023.
Bloom, C., Howell, A., Stahl, T., Massey, C., and Singeisen, C.: The influence of off-fault deformation zones on the near-fault distribution of coseismic landslides, Geology, 50, 272–277, https://doi.org/10.1130/G49429.1, 2021.
Bradley, B. A., Razafindrakoto, H. N. T., and Polak, V.: Ground-motion observations from the 14 November 2016 Mw 7.8 Kaikoura, New Zealand, earthquake and insights from broadband simulations, Seismol. Res. Lett., 88, 740–756, https://doi.org/10.1785/0220160225, 2017.
Dickson, M. E., Walkden, M. J. A., and Hall, J. W.: Systemic impacts of climate change on an eroding coastal region over the twenty-first century, Climatic Change, 84, 141–166, https://doi.org/10.1007/s10584-006-9200-9, 2007.
Downes, G. L. and Dowrick, D. J.: Atlas of Isoseismal Maps of New Zealand Earthquakes – 1843–2003, GNS Sci. Monogr., ISBN 978-0-478-196634, 2014.
Eiby, G. A.: An annotated list of New Zealand earthquakes, 1460–1965, New Zeal. J. Geol. Geophys., 11, 630–647, https://doi.org/10.1080/00288306.1968.10420275, 1968.
Emery, K. O. and Kuhn, G. G.: Sea cliffs: their processes, profiles, and classification, Geol. Soc. Am. Bull., 93, 644–654, https://doi.org/10.1130/0016-7606(1982)93<644:SCTPPA>2.0.CO;2, 1982.
FitzGerald, D. M., Fenster, M. S., Argow, B. A., and Buynevich, I. V.: Coastal impacts due to sea-level rise, Annu. Rev. Earth Planet. Sci., 36, 601–647, https://doi.org/10.1146/annurev.earth.35.031306.140139, 2008.
Francioni, M., Coggan, J., Eyre, M., and Stead, D.: A combined field/remote sensing approach for characterizing landslide risk in coastal areas, Int. J. Appl. Earth Obs. Geoinf., 67, 79–95, https://doi.org/10.1016/j.jag.2017.12.016, 2018.
GeoNet: GeoNet Quake Search, https://quakesearch.geonet.org.nz/ (last access: 1 May 2022), 2022.
Griggs, G. and Plant, N.: Coastal-bluff failures in northern Monterey Bay induced by the earthquake, in: The Loma Prieta, California, Earthqukae of October 17, 1989 – Landslides, vol. 1551-C, US Geological Survey Professional Paper, US Geological Survey, 51–70, https://pubs.usgs.gov/pp/1551c/report.pdf (last access: 1 May 2022), 1998.
Hall, J. W., Meadowcroft, I. C., Lee, E. M., and Van Gelder, P. H. A. J. M.: Stochastic simulation of episodic soft coastal cliff recession, Coast. Eng., 46, 159–174, https://doi.org/10.1016/S0378-3839(02)00089-3, 2002.
Hamling, I. J., Hreinsdóttir, S., Clark, K., Elliott, J., Liang, C., Fielding, E., Litchfield, N., Villamor, P., Wallace, L., Wright, T. J., D'Anastasio, E., Bannister, S., Burbidge, D., Denys, P., Gentle, P., Howarth, J., Mueller, C., Palmer, N., Pearson, C., Power, W., Barnes, P., Barrell, D. J. A., Van Dissen, R., Langridge, R., Little, T., Nicol, A., Pettinga, J., Rowland, J., and Stirling, M.: Complex multifault rupture during the 2016 Mw 7.8 Kaikōura earthquake, New Zealand, Science, 356, eaam7194, https://doi.org/10.1126/science.aam7194, 2017.
Hancox, G. T., Perrin, N. D., and Dellow, G. D.: Recent studies of historical earthquake-induced landsliding, ground damage, and MM intensity in New Zealand, Bull. New Zeal. Soc. Earthq. Eng., 35, 59–95, https://doi.org/10.5459/bnzsee.35.2.59-95, 2002.
Hapke, C. and Plant, N.: Predicting coastal cliff erosion using a Bayesian probabilistic model, Mar. Geol., 278, 140–149, https://doi.org/10.1016/j.margeo.2010.10.001, 2010.
Hapke, C. J. and Richmond, B.: The impact of climatic and seismic events on the short-term evolution of seacliffs based on 3-D mapping: northern Monterey Bay, California, Mar. Geol., 187, 259–278, 2002.
He, Y. and Beighley, E. R.: GIS-based regional landslide susceptibility mapping: a case study in southern California, Earth Surf. Process. Land., 33, 380–393, https://doi.org/10.1002/esp.1562, 2008.
Himmelstoss, E. A., Henderson, R. E., Kratzmann, M. G., and Farris, A. S.: Digital Shoreline Analysis System (DSAS) Version 5.1 User Guide, US Geological Survey Open-File Report 2021-1091, US Geol. Surv., 104 pp., https://doi.org/10.3133/ofr20211091, 2021.
Horspool, N. A., Chadwick, M., Ristau, J., Salichon, J., and Gerstenberger, M. C.: ShakeMapNZ: Informing post-event decision making, in: NZSEE Conf., 10–12 April 2015, Rotorua, New Zealand, 369–376, 2015.
Horton, S. L., Dickson, M. E., and Stephenson, W. J.: The consequences of uplift on wave transformation across a shore platform, Kaikōura, New Zealand, Mar. Geol., 451, 106888, https://doi.org/10.1016/j.margeo.2022.106888, 2022.
Karunarathna, H., Pender, D., Ranasinghe, R., Short, A. D., and Reeve, D. E.: The effects of storm clustering on beach profile variability, Mar. Geol., 348, 103–112, https://doi.org/10.1016/j.margeo.2013.12.007, 2014.
Langridge, R. M., Ries, W. F., Litchfield, N. J., Villamor, P., Van Dissen, R. J., Barrell, D. J. A., Rattenbury, M. S., Heron, D. W., Haubrock, S., Townsend, D. B., Lee, J. M., Berryman, K. R., Nicol, A., Cox, S. C., and Stirling, M. W.: The New Zealand Active Faults Database, New Zeal. J. Geol. Geophys., 59, 86–96, https://doi.org/10.1080/00288306.2015.1112818, 2016.
Larson, M. and Kraus, N. C.: Temporal and spatial scales of beach profile change, Duck, North Carolina, Mar. Geol., 117, 75–94, https://doi.org/10.1016/0025-3227(94)90007-8, 1994.
Limber, P. W., Barnard, P. L., Vitousek, S., and Erikson, L. H.: A Model Ensemble for Projecting Multidecadal Coastal Cliff Retreat During the 21st Century, J. Geophys. Res.-Earth, 123, 1566–1589, https://doi.org/10.1029/2017JF004401, 2018.
LINZ: The Crown Aerial Film Archive historical imagery scanning project, https://www.linz.govt.nz/about-us/what-were-doing/projects/crown-aerial-film-archive-historical-imagery-scanning-project (last access: 1 November 2021), 2021.
LINZ: LINZ Data Service, https://data.linz.govt.nz/ (last access: 1 May 2022), 2022.
Litchfield, N. J., Villamor, P., van Dissen, R. J., Nicol, A., Barnes, P. M., Barrell, D. J. A., Pettinga, J. R., Langridge, R. M., Little, T. A., Mountjoy, J. J., Ries, W. F., Rowland, J., Fenton, C., Stirling, M. W., Kearse, J., Berryman, K. R., Cochran, U. A., Clark, K. J., Hemphill-Haley, M., Khajavi, N., Jones, K. E., Archibald, G., Upton, P., Asher, C., Benson, A., Cox, S. C., Gasston, C., Hale, D., Hall, B., Hatem, A. E., Heron, D. W., Howarth, J., Kane, T. J., Lamarche, G., Lawson, S., Lukovic, B., McColl, S. T., Madugo, C., Manousakis, J., Noble, D., Pedley, K., Sauer, K., Stahl, T., Strong, D. T., Townsend, D. B., Toy, V., Williams, J., Woelz, S., and Zinke, R.: Surface rupture of multiple crustal faults in the 2016 Mw 7.8 Kaikōura, New Zealand, earthquake, Bull. Seismol. Soc. Am., 108, 1496–1520, https://doi.org/10.1785/0120170300, 2018.
Mason, D., Brabhaharan, P., and Saul, G.: Performance of road networks in the 2016 Kaikōura earthquake: observations on ground damage and outage effects, in: Proc. 20th NZGS Geotech. Symp., November 2017, Napier, New Zealand, p. 8, 2017.
Massey, C., Townsend, D., Rathje, E., Allstadt, K. E., Lukovic, B., Kaneko, Y., Bradley, B., Wartman, J., Jibson, R. W., Petley, D. N., Horspool, N., Hamling, I., Carey, J., Cox, S., Davidson, J., Dellow, S., Godt, J. W., Holden, C., Jones, K., Kaiser, A., Little, M., Lyndsell, B., McColl, S., Morgenstern, R., Rengers, F. K., Rhoades, D., Rosser, B., Strong, D., Singeisen, C., and Villeneuve, M.: Landslides triggered by the 14 November 2016 Mw 7.8 Kaikōura earthquake, New Zealand, Bull. Seismol. Soc. Am., 108, 1630–1648, https://doi.org/10.1785/0120170305, 2018.
Massey, C. I., Townsend, D. T., Lukovic, B., Morgenstern, R., Jones, K., Rosser, B., and de Vilder, S.: Landslides triggered by the MW 7.8 14 November 2016 Kaikōura earthquake: an update, Landslides, 17, 2401–2408, https://doi.org/10.1007/s10346-020-01439-x, 2020a.
Massey, C. I., Townsend, D., Jones, K., Lukovic, B., Rhoades, D., Morgenstern, R., Rosser, B., Ries, W., Howarth, J., Hamling, I., Petley, D., Clark, M., Wartman, J., Litchfield, N., and Olsen, M.: Volume characteristics of landslides triggered by the MW 7.8 2016 Kaikōura Earthquake, New Zealand, derived from digital surface difference modeling, J. Geophys. Res.-Earth, 125, e2019JF005163, https://doi.org/10.1029/2019JF005163, 2020b.
Massey, C. I., Olsen, M. J., Wartman, J., Senogles, A., Lukovic, B., Leshchinsky, B. A., Archibald, G., Litchfield, N., Van Dissen, R., de Vilder, S., and Holden, C.: Rockfall Activity Rates Before, During and After the 2010/2011 Canterbury Earthquake Sequence, J. Geophys. Res.-Earth, 127, e2021JF006400, https://doi.org/10.1029/2021JF006400, 2022.
McConnico, T. S.: The Terraces of the Conway Coast, North Canterbury: Geomorphology, Sedimentary Facies, and Sequence Stratigraphy, University of Canterbury, Canterbury, https://doi.org/10.26021/8042, 2012.
McConnico, T. S. and Bassett, K. N.: Gravelly Gilbert-type fan delta on the Conway Coast, New Zealand: Foreset depositional processes and clast imbrications, Sediment. Geol., 198, 147–166, https://doi.org/10.1016/j.sedgeo.2006.05.026, 2007.
Mountjoy, J. and Pettinga, J. R.: Controls on Large Deep-seated Landslides in Soft Rock Terrain: Rock Mass Defects and Seismic Triggering, in: Earthquakes and Urban Development: New Zealand Geotechnical Society 2006 Symposium, Nelson, February 2006, Wellington, NZ, 385–394, https://doi.org/10.3316/informit.209951615561284, 2006.
Nicol, A., Begg, J., Saltogianni, V., Mouslopoulou, V., Oncken, O., and Howell, A.: Uplift and fault slip during the 2016 Kaikōura Earthquake and Late Quaternary, Kaikōura Peninsula, New Zealand, New Zeal. J. Geol. Geophys., 66, 263–278, https://doi.org/10.1080/00288306.2021.2021955, 2022.
NIWA: CliFlo: NIWA's National Climate Database on the Web, https://cliflo.niwa.co.nz/ (last access: 1 May 2022), 2022.
Ota, Y., Pillans, B., Berryman, K., Beu, A., Fujimori, T., Miyauchi, T., Berger, G., Beu, A. G., and Climo, F. M.: Pleistocene coastal terraces of Kaikoura Peninsula and the Marlborough coast, South Island, New Zealand, New Zeal. J. Geol. Geophys., 39, 51–73, https://doi.org/10.1080/00288306.1996.9514694, 1996.
Pettinga, J. R.: Waipoapoa landslide: A deep-seated complex block slide in tertiary weak-rock flysch, Southern Hawke's Bay, New Zealand, New Zeal. J. Geol. Geophys., 30, 401–414, https://doi.org/10.1080/00288306.1987.10427544, 1987.
Rattenbury, M. S., Townsend, D. B., and Johnston, M. R.: Geology of the Kaikoura area, GNS Science, 1 pp., https://shop.gns.cri.nz/qkaikoura-zip/ (last access: 1 May 2022), 2006.
Singeisen, C., Massey, C., Wolter, A., Kelles, R., Bloom, C., Stahl, T., Gasston, C., and Jones, K.: Mechanisms of rock slope failures triggered by the 2016 Mw 7.8 Kaikōura earthquake and implications for landslide susceptibility, Geomorphology, 415, 108386, https://doi.org/10.1016/j.geomorph.2022.108386, 2022.
Stirling, M., McVerry, G., Gerstenberger, M., Litchfield, N., Van Dissen, R., Berryman, K., Barnes, P., Wallace, L., Villamor, P., Langridge, R., Lamarche, G., Nodder, S., Reyners, M., Bradley, B., Rhoades, D., Smith, W., Nicol, A., Peenga, J., Clark, K., and Jacobs, K.: National seismic hazard model for New Zealand: 2010 update, Bull. Seismol. Soc. Am., 102, 1514–1542, https://doi.org/10.1785/0120110170, 2012.
Stringer, J., Brook, M. S., and Justice, R.: Post-earthquake monitoring of landslides along the Southern Kaikōura Transport Corridor, New Zealand, Landslides, 18, 409–423, https://doi.org/10.1007/s10346-020-01543-y, 2021.
Wolters, G. and Müller, G.: Effect of cliff shape on internal stresses and rock slope stability, J. Coast. Res., 24, 43–50, https://doi.org/10.2112/05-0569.1, 2008.
Young, A. P.: Decadal-scale coastal cliff retreat in southern and central California, Geomorphology, 300, 164–175, https://doi.org/10.1016/j.geomorph.2017.10.010, 2018.
Young, A. P., Flick, R. E., O'Reilly, W. C., Chadwick, D. B., Crampton, W. C., and Helly, J. J.: Estimating cliff retreat in southern California considering sea level rise using a sand balance approach, Mar. Geol., 348, 15–26, https://doi.org/10.1016/j.margeo.2013.11.007, 2014.
Zinke, R., Hollingsworth, J., Dolan, J. F., and Van Dissen, R.: Three-Dimensional Surface Deformation in the 2016 MW 7.8 Kaikōura, New Zealand, Earthquake From Optical Image Correlation: Implications for Strain Localization and Long-Term Evolution of the Pacific-Australian Plate Boundary, Geochem. Geophy. Geosy., 20, 1609–1628, https://doi.org/10.1029/2018GC007951, 2019.
- Abstract
- Introduction
- Background
- Methods
- Results
- Discussion
- Conclusions
- Appendix A: Additional methods and data
- Appendix B: Additional results
- Appendix C: Supporting oblique photos
- Data availability
- Author contributions
- Competing interests
- Disclaimer
- Acknowledgements
- Financial support
- Review statement
- References
- Supplement