the Creative Commons Attribution 4.0 License.
the Creative Commons Attribution 4.0 License.
 | 14 Aug 2023
Shape still matters: rockfall interactions with trees and deadwood in a mountain forest uncover a new facet of rock shape dependency
Adrian Ringenbach
Peter Bebi
Perry Bartelt
Andreas Rigling
Marc Christen
Yves Bühler
Andreas Stoffel
Andrin Caviezel
Mountain forests have a substantial protective function in preventing natural hazards, in part due to the presence of dead wood on the forest floor. Rates of deadwood accumulation have increased within the Alps and are predicted to rise further, due to natural disturbances. In particular, higher windthrow event frequencies are expected, primarily due to large-scale even-aged forest stands in many alpine regions combined with climate change. We quantified the rockfall protection effect of mountain forests with and without deadwood, in unprecedented detail, in experiments using two rock shapes with important hazard potential and masses of 200–3200 kg. Based on a multi-camera setup, pre- and post-experimentally retrieved high-resolution lidar data, and rock data measured in situ, we precisely reconstructed 63 trajectories. The principal parameters of interest describing the rockfall kinematics were retrieved for each trajectory. A total of 164 tree impacts and 55 deadwood impacts were observed, and the currently applied energy absorption curves – partially only derived theoretically – could consequently be corroborated or even expanded to a greater absorption performance of certain species than hitherto assumed. Standing trees, in general, and deadwood, in particular, were found to strongly impede the notorious lateral spreading of platy rocks. Platy rocks featured a shorter mean runout distance than their compact counterparts of similar weight, even in the absence of deadwood. These results indicate that the higher hazard potential of platy rocks compared with more compact rocks, previously postulated for open-field terrain, applies less to forested areas. Last, reproducing the experimental setting showcases how complex forest states can be treated within rockfall simulations. Overall, the results of this study highlight the importance of incorporating horizontal forest structures accurately in simulations in order to obtain realistic deposition patterns.
- Article
(14995 KB) - Full-text XML
- BibTeX
- EndNote


Forests with a protective function serve as cost-effective (Moos et al., 2017; Getzner et al., 2017; Olschewski et al., 2012) and widespread (Dupire et al., 2020; Brändli et al., 2020) nature-based protection infrastructure within alpine regions. The amount of deadwood in Swiss mountain forests has increased during the last few decades (Abegg et al., 2021). Additionally, natural disturbances in forests are expected to increase under future climate conditions (Seidl et al., 2017), leading to higher deadwood accumulation rates. Therefore, it is of social and macroeconomic relevance to assess the influence of deadwood on the dynamics of natural hazards.
The important role of mountain forests as ecological infrastructure providing protection against rockfalls is widely recognized. In Aotearoa / New Zealand, for instance, researchers showed that deforestation resulting from human activities caused Anthropocene rockfalls to have longer runout distances than prehistoric events (Borella et al., 2016). In several European studies, the maximum energy absorbed by living Norway spruce (Lundström et al., 2009; Kalberer et al., 2007) and silver fir (Dorren and Berger, 2005) has been described and used to derive three-dimensional rockfall models that include single trees absorbing the kinetic energy of consecutive impacts (Rammer et al., 2010; Dorren, 2012; Toe et al., 2017; Lu et al., 2020). Such models make it possible to simulate the protective effect of mountain forests on different scales – from a single slope to an entire region (Stoffel et al., 2006; Woltjer et al., 2008; Moos et al., 2017; Dupire et al., 2016; Lanfranconi et al., 2020). The influence of natural disturbances, such as windthrow, bark beetle calamities, and forest fires, on the protective function of forests, has long been neglected in rockfall models. Their absence in numerical tools has often been due to both an insufficient capacity to handle such three-dimensional structures from an input perspective and insufficient knowledge about their protective performance and effect. More recently, rockfall models have explicitly considered the influence of deadwood resulting from natural disturbances (Fuhr et al., 2015; Costa et al., 2021; Ringenbach et al., 2022a, c), resulting in shorter mean runout distances. In contrast to the integration of standing trees into rockfall models, however, incorporating lying deadwood has a limited experimental basis (Ringenbach et al., 2022c; Bourrier et al., 2012). The experimental rockfall data set presented here follows a systematic approach that is unprecedented for forests containing deadwood and, thus, contributes to closing the remaining research gap. The approach allows rockfall calibrations at different scales and is a vital link to real-world events.
Our experiment has been designed not only to elucidate the effect of deadwood on rockfall runout but also to consider other factors that may influence this metric. They include rock size and shape and the moisture saturation of the slope materials along the runout path. Recent numerical work that focused on single rock–tree impacts reported an energy transfer from translational kinetic energy Ekin,trans to the rotational kinetic energy Ekin,rot for eccentric rocks but highlighted the need for experimental confirmation (Lu et al., 2020). Additionally, no systematic deposition pattern analysis with respect to rock size has been presented for forested slopes so far. Recently, the importance of such analyses was demonstrated by Caviezel et al. (2021a), who found that the downslope pathways of platy rocks have a larger lateral spread in open land compared to their mass-equivalent, cubic-shaped counterparts. Combined with a comparable mean runout distance and a similar release probability, this means that platy rocks pose an increased hazard potential in unobstructed terrain. Other rockfall experiments conducted within a quarry indicated that the berms acted as pronounced topographic features and were responsible for most of the deposition pattern. However, the shape of the rocks was the only attribute that could qualitatively influence the runout distance (Bourrier et al., 2021). Thus, scrutinizing the effect of rock shape on forested slopes and the compliance or deviation from the previously examined behavior in open land is another compelling motivation for conducting this experimental campaign.
The significance of the rock–substrate interaction has been recognized for open land in various rockfall simulations (Lu et al., 2019; Noël et al., 2021). A potentially important parameter, soil moisture, has received less attention so far. A study in Aotearoa / New Zealand compared the experimentally derived rockfall runout distances under known soil moisture conditions with those reported during a nearby earthquake. The thereof-calibrated rockfall simulations imply that rockfalls under dry soil conditions achieve greater runout distances than rockfalls on the same soil when wet (Vick et al., 2019). This topic could become increasingly important under future climatic conditions with reduced precipitation if rockfall runout distances are altered because of changing rock–soil interactions. In this paper, a first attempt is made to directly link rockfall kinematics with the different soil moisture measured on site. The newly acquired, detailed insights provide a valuable context for the results obtained this far.
In summary, we investigate the spatially explicit rockfall kinematics that depend on the state of the forest, including either lying deadwood or exclusively standing trees. Based on three mass classes, we resolve the rock shape effect within forests. Finally, the soil moisture is compared to the in situ measured accelerations and the reconstructed rock velocities.
2.1 Experimental site Schraubachtobel
Here, we present a systematic experimental rockfall campaign on a forested slope for scenarios with lying deadwood (DW) and after the windthrow area was cleared (CLR). The experimental site of Schraubachtobel (46.58248∘ N, 9.42303∘ E) is located roughly 20 km northeast of Chur, within the municipality of Schiers, Switzerland (Fig. 1a). The release point area is located at 860 m a.s.l. (above sea level), with the 245 m long and roughly 40–60 m wide experimental slope dropping over 164 m of elevation down to the riverbed of the Schraubach at 706 m a.s.l. The slope comprises steep terrain, with an overall inclination along the central fall path of α=39∘ and single slope sections of α1=48∘, α2=39∘, α3=33∘, α4=38∘, and α5=43∘ (see their locations in Fig. 1b). The slope is covered by regolith with varying local thicknesses underlain by the Bündner schist of the Grava and Tomül nappes (swisstopo, 2005). The terrain features complex topography with a curved central fall path ending abruptly at the nearly horizontal but inter-experimentally changing riverbed, which also features fluvial terraces. The forest exhibits 593 mapped trees and consists mainly of European beech (Fagus sylvatica L.) and Norway spruce (Picea abies (L.) H. Karst.). Some European ash (Fraxinus excelsior L.), sycamore maple (Acer pseudoplatanus L.), and Scots elm (Ulmus glabra Huds.) trees and one European yew (Taxus baccata) tree, all with a diameter at breast height (DBH) ≤ 8 cm, were present in the acceleration zone (α1 in Fig. 1b). Mainly spruce trees were affected by Storm Burglind in the year 2018, leaving two distinct lying deadwood clusters behind, including broken and overturned trees comprising root plates (see the shaded areas in Fig. 1a). The upper cluster is located at 815 m a.s.l., slightly to the orographic right of the central dropping path, and it comprises nine deadwood piled logs, with a basal diameter d0≥20 cm. The lower, main deadwood cluster spans almost the entire width of the experimental slope and comprises 20 logs (d0≥20 cm). Most of the logs were sap-bearing fresh wood (class 1, according to Lachat et al., 2013), but there were also a few sapless hardwood logs (class 2). Experimental logistics required the identification of relevant stems that could be re-installed for large mass experiments. Three high-resolution, UAV-based lidar missions were carried out to fully map the forest structure. During the first mission with a RIEGL VUX-1UAV, we achieved a mean pulse density of 2256 m−2 (Fig. 1c). The second mission was conducted with a RIEGL miniVUX-2UAV, with a mean pulse density of 1973 m−2 (Fig. 2a). The last mission was carried out with a DJI Zenmuse L1 sensor, resulting in 443 m−2 pulses on average.
2.2 Experimental design and instrumentation
We released a total of 106 artificial, sensor-equipped rocks into two different states of the mountain forest to directly compare the protective effect of lying deadwood. There were 53 experimental runs into the original state, including naturally windblown deadwood (DW), and 53 experimental runs into the cleared forest (CLR; Table 1). The rocks were all released from the same starting area of 4 m2, which is marked with a black cross in Fig. 1a. Due to the rather channelized topography within the first few meters of descent, the starting point was regarded as identical for all reported trajectories. Two symmetric rock geometries, according to the European Organisation for Technical Assessment (EOTA; ETAG 027, 2013), were cast from steel-reinforced concrete (density ρ=2650 kg m), along with three mass classes. While the cubic EOTA111 rock features equal axis lengths (Fig. 1d, f, and h), the two longest, orthogonal axes are twice as long as the shortest axis for the platy-shaped rocks of EOTA221 (Fig. 1e). The mass classes – which include minor mass differences between the rock shapes – were approx. 200 kg (∼0.08 m3), 800 kg (∼0.30 m3), and ≥2600 kg, which comprised blocks with 2600 kg (∼0.96 m3) and 3200 kg (∼1.23 m3). The released rock masses were increased with the consecutive days of experimentation, starting with the smallest mass class and the deadwood (DW) configuration. It was expected that the ≥2600 kg rock mass class would cause significant destruction during the deadwood experiments – not only to the lying deadwood logs, which would have been acceptable, as they were removed for the following experimental runs in the cleared (CLR) forest, but also to the standing forest. Major damage to the forest could have compromised the subsequent comparison experiments under CLR conditions. To prevent this, the natural deadwood was removed after the DW 800 kg runs. After the CLR experiments for 200, 800, and ≥2600 kg rocks, the most relevant logs were re-installed for the DW campaign involving the largest rock mass class. The Global Navigation Satellite Systems (GNSS) position of each deposition point was recorded with STONEX S400 and S800 devices, using the Swiss coordinate system CH1903+/LV95, with decimeter accuracy.
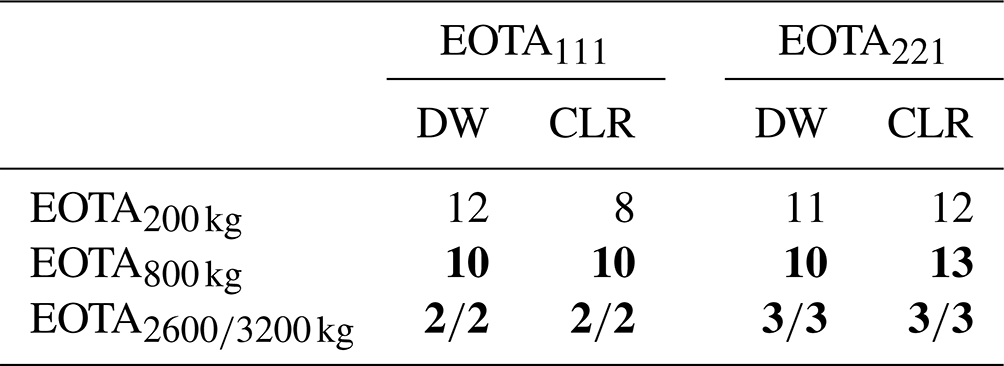
Table 1Overview of the released rocks, subdivided by rock shape (cubic EOTA111 and platy EOTA221), rock mass (200–3200 kg), and state of the section of the forest (DW for deadwood; CLR for cleared deadwood). Due to the small number of experimental runs, EOTA2600 kg and EOTA3200 kg rocks are hereafter listed together as a single mass class of EOTA≥2600 kg rocks. Bold font indicates the reconstructed experimental runs, which are included in Fig. 4.
Evolving versions of in situ StoneNode sensors (Niklaus et al., 2017; Caviezel et al., 2018, 2021b) were deployed over the course of 9 experimental days carried out over 2.5 years. While previous versions already enabled measurements of up to 4000∘ s−1 rotational velocity and 400 g per axis, with a temporal resolution of 1 kHz, the latest version included the most stable hardware and compiler setting (Mayer et al., 2023). The aluminum sensor cases were made waterproof through silicon sealing and/or O-ring enhancement (Fig. 1h). Previous experimental campaigns have stressed the importance of including continuous visual tracking, which is realized via a high-resolution single camera setup (Caviezel et al., 2021a) covering the entire slope or a panning setup (Noël et al., 2022). Both options are unfeasible in a forested environment, due to the obstructed line of sight by the trees. Hence, 14 GoPro HERO7 Black cameras, recording 59.94 frames per second in a 4K setting (3840 × 2160 pixels), were mounted anew along the fall path for each experimental day. Large storage (SD cards with 256 GB) and external battery packs (RAVPower RP-PB043) ensured runtimes of up to 8 h, granting some temporal flexibility for dealing with any disruptions or challenges, such as late helicopter crew arrival or difficulties in rebuilding the deadwood section.
During the first 4 experiment days, the focus was on establishing a reliable trajectory reconstruction method. For this purpose, rock masses of up to 200 kg were used. Transportation logistics were handled via a four-wheel-drive crane truck, releasing the rocks from its overhead pneumatic arm and then picking them up at the riverbed – if the rocks traveled that far. Rocks that did not reach the riverbed had to be remobilized and rolled down by hand. As manual remobilization was not possible for larger rocks, transportation was achieved via a helicopter with the appropriate loading capacity. We used an Airbus H125 for the 800 kg blocks and an Airbus AS332 for the heaviest rocks and for the installation of the deadwood logs.
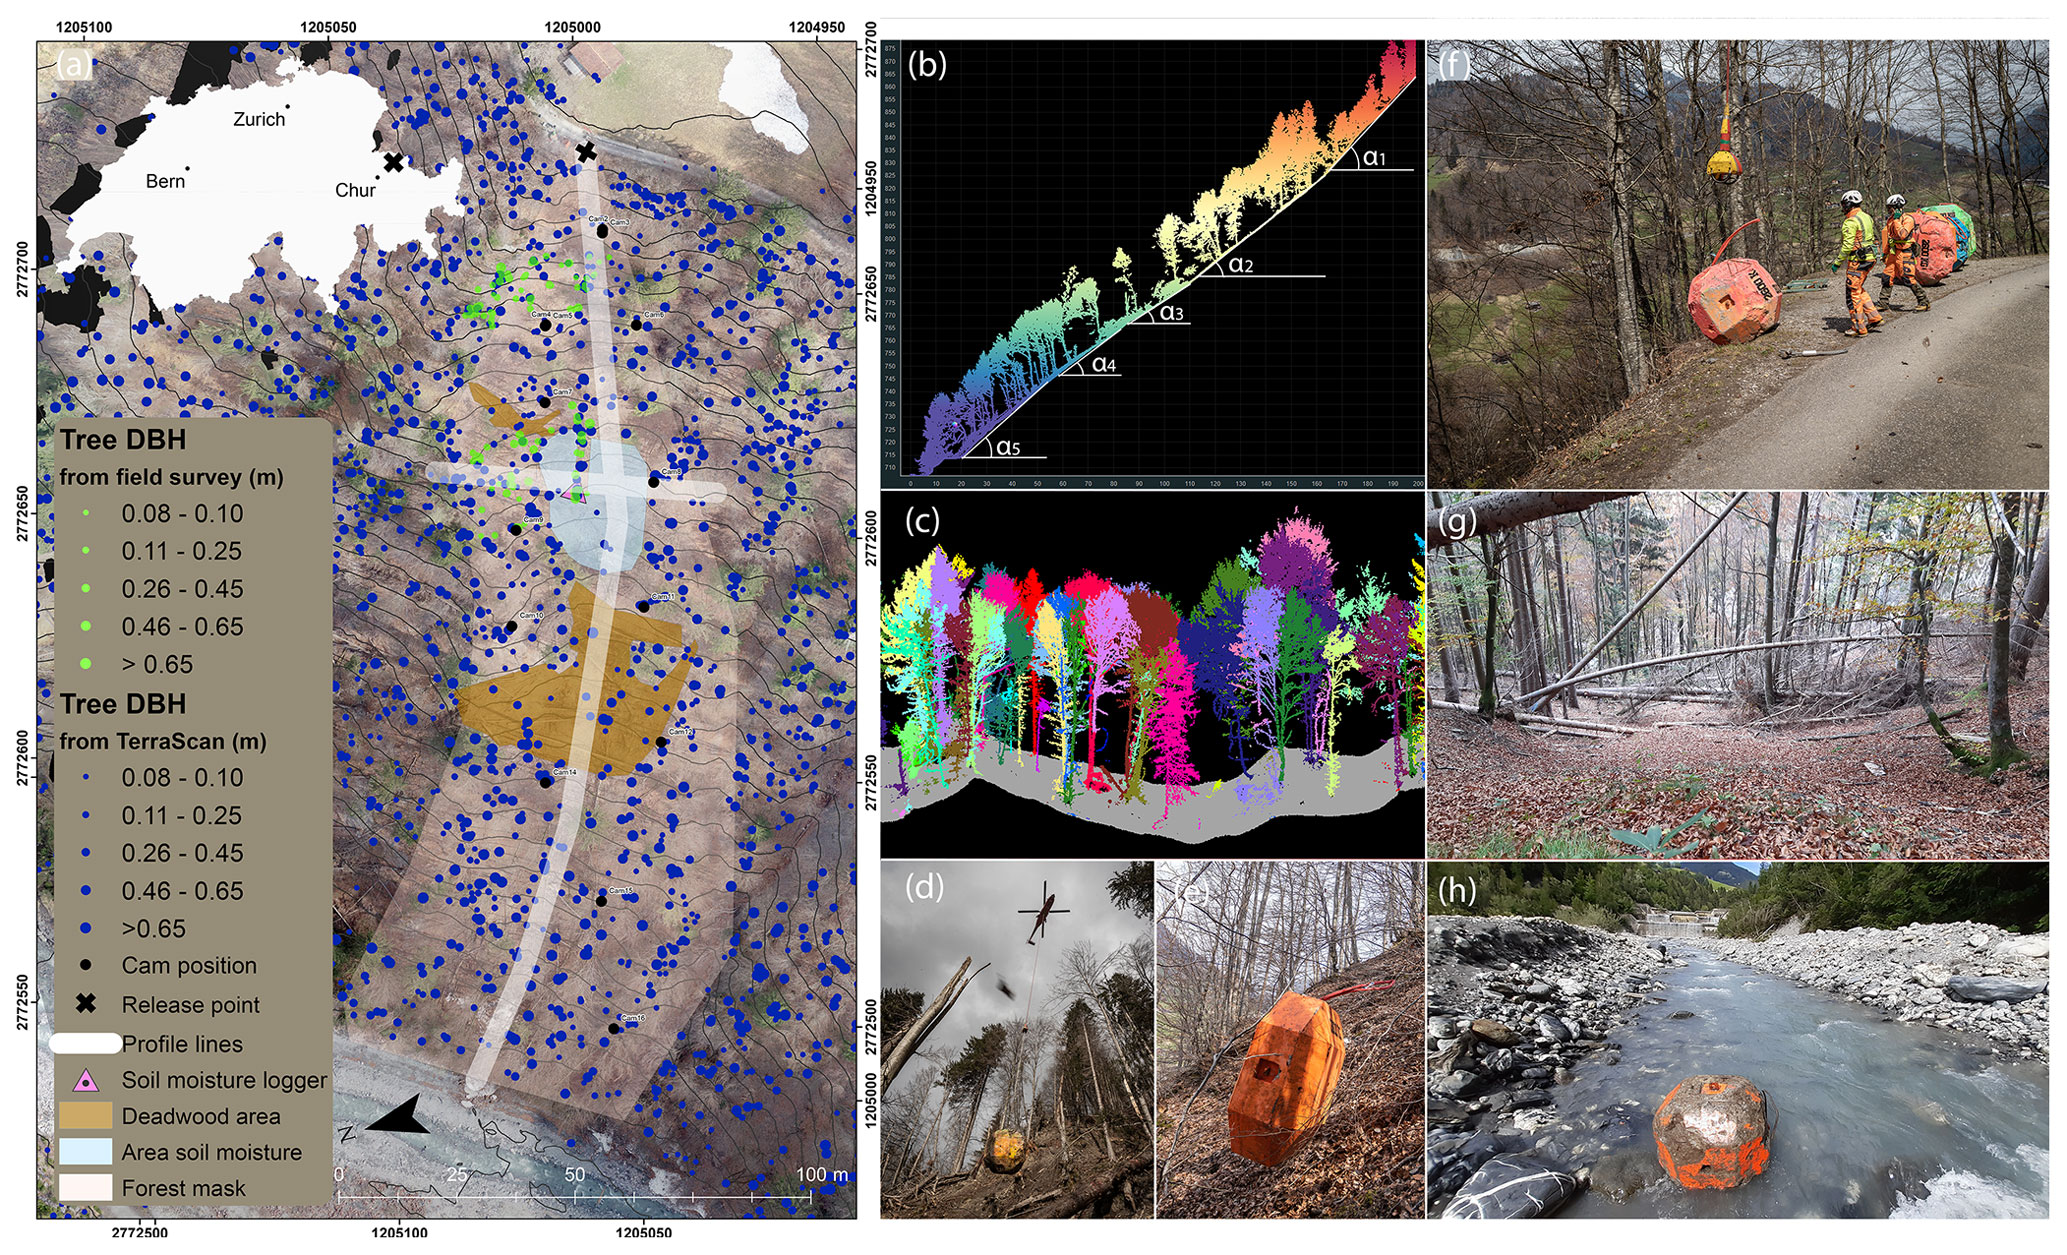
Figure 1Overview of the test site at Schraubach. (a) The release point area is marked with a black cross, the SE–NW-oriented longitudinal white line marks the central fall path on the slope, and the horizontal line marks a representative cross-sectional profile. The locations of single trees according to a detection algorithm (blue) and field survey (green) are depicted, along with the two deadwood clusters shaded in brown. Additionally, the camera positions and soil moisture comparison areas are indicated. (b) Forest visualization along the longitudinal profile, obtained from the pre-experimental lidar point cloud, visualizing the stem-free area above the deadwood section and the slope angles of , , , , and . (c) Equivalent visualization but for the representative cross-sectional profile marked in panel (a) and with unique colors per detected single tree. (d) Helicopter-assisted underload sling transportation of a cubic-shaped test rock. (e) Acceleration phase of a platy-shaped rock. (f) Moment of the release of a 2600 kg rock at the release area, with the electronic hook being remotely triggered by the pilot. (g) Downslope view of the stem-free area above the lower main deadwood section. (h) The longest runout distances resulted in the rocks reaching the river Schraubach, highlighting the need for a waterproof in situ sensor. Photos in panels (d), (e), and (f) are by Matthias Paintner, SLF.
Two Decagon GS1 soil moisture sensors at depths of 10 and 30 cm were placed between the two deadwood clusters (Fig. 1a), measuring the volumetric water content with a sampling interval of 1.5 h for continuous long-term soil moisture classification. Acceleration sensors (MSR165) were installed on deadwood logs, according to their availability. The trade-off between the storage capacity and the highest possible write rate (ultimately 200 kHz) was mitigated by adjusting the triggering thresholds after installation on the logs in the field, based on the resultant acceleration from the factual resting position of each log.
2.3 Trajectory reconstruction
The observation and reconstruction of rockfall trajectories in forests is a demanding task (Bourrier et al., 2012). In a previous open-land study (Caviezel et al., 2019), two different trajectory reconstruction methods were described, namely the labor-intense a posteriori impact mapping (AIM) method and the (semi-)automatic dense cloud reconstruction (DCR) method. For the latter, synchronous stereo video image pairs were photogrammetrically analyzed. The determination of the rock position was achieved through color classifications, but robustness difficulties emerged over the course of an experiment due to deteriorating contrast. A possible solution might have been the use of a differential point cloud analysis, with the M3C2 algorithm (Lague et al., 2013) as an option. No semi-automatic videogrammetry approaches were implemented in this study for the following three reasons:
-
The tested pairwise installation of GoPro cameras did not provide the desired results regarding three-dimensional reconstruction capabilities of fast-moving objects with a sufficient depth of field. This is mainly because the built-in wide-angle lenses are not capable of identifying small fast-moving objects.
-
The subsequently used Blackmagic Pocket Cinema Camera pairs (4K and 6K editions) resulted in better reconstruction capabilities. These cameras had to be operated by people, however, and not enough safe camera positions were available, and those fulfilling the safety criteria did not have the ideal field of view.
-
The desired depth of field of these cameras demanded a larger distance between each pair of cameras. As a consequence, more trees were present between the camera and the rock path, hiding the rock in either one or the other image. This tree shielding resulted in too few reconstructible points for the moving rock.
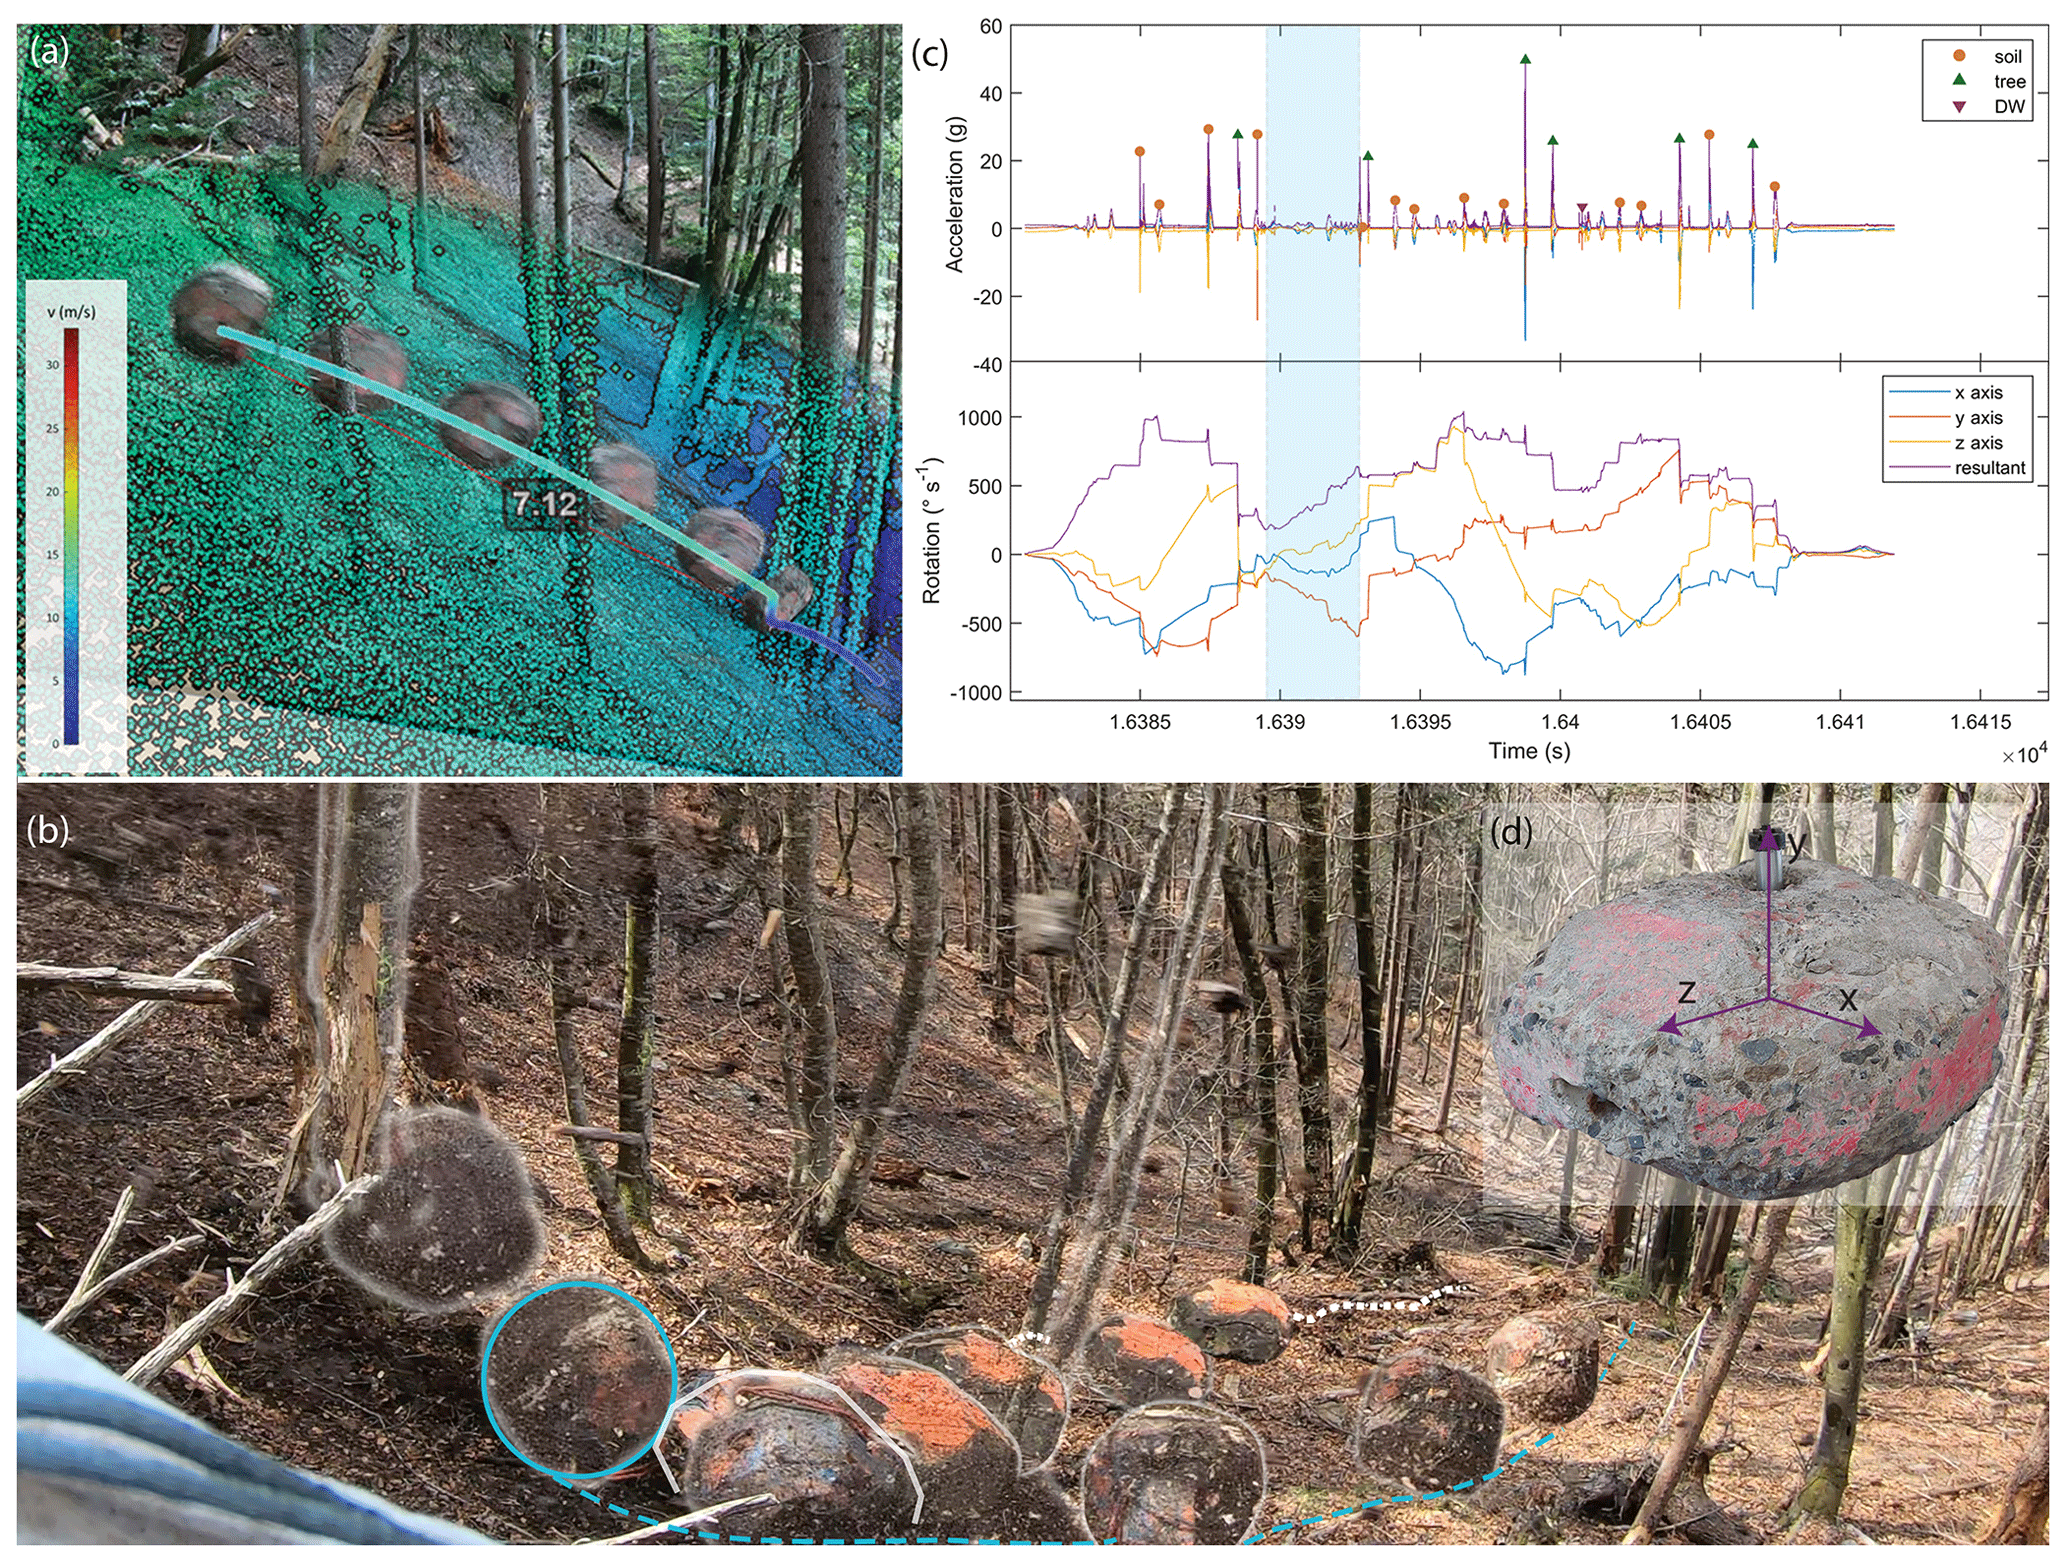
Figure 2(a) Visualization of a reconstructed jump/tree–impact/jump succession in an image fusion of a video still and a lidar point cloud representation. The rock jumps 7.12 m from liftoff to the tree impact, with a velocity change from roughly 12 to 2 m s−1. Single jumps were reconstructed by combining video footage of the experimental runs, the manually determined liftoff, and impact positions thereof inside the lidar point cloud, as well as the flight time measured in situ. (b) Workflow visualization for rolling and sliding trajectory segments. The blue circle marks the assumed rock circumference, and the dashed line represents the manually determined rolling path. The dotted white line is the equivalent determination of a sliding path section. (c) StoneNode data for an example run visualizing the acceleration data used to identify jump times and rotational data, providing hints as to the state of kinematic regimes. Airborne phases are marked by free flight, i.e., zero acceleration besides Earth gravity and flat rotational velocity curves, while rolling phases normally feature a linear increase in the resultant rotational velocity combined with low but non-zero acceleration signatures (marked with the shaded blue area). The individual impacts are labeled according to their substrate classification. (d) StoneNode housing and the orientation of its axes within the borehole.
Another promising method for retrieving rockfall trajectories with fewer manual inputs was described in Volkwein and Klette (2014), where a local positioning system (LPS) was established to track rock motions. The authors reported only the determination of two-dimensional coordinates in open-field experiments. While an extension to a fully three-dimensional position location might be feasible, a robust setup would require the installation of a transceiver inside the rock, but the signal strength diminishes drastically due to the steel reinforcement of EOTA rocks. Similar problems have been documented with ultra-wideband (UWB) technology (Mayer et al., 2019). These limitations prevented successful implementation within the scope of these experiments.
Due to these reasons, and due to missing a (semi-)automatic alternative, we applied an adapted AIM method for the reconstruction of the parabolic jump trajectories, which is fused with the recently proposed computer-assisted videogrammetric 3D trajectory reconstruction (CAVR) method (Noël et al., 2022). If StoneNode data were available, the timing of the jumps was based on these in situ measurements. The geographic locations of the liftoff and impact were determined based on the footage and the georeferenced lidar point cloud displayed within the free, open-source WebGL-based point cloud renderer potree (Schütz et al., 2020; Schütz, 2021). Figure 2a shows the fused image of a video still, a potree lidar representation, and a reconstructed trajectory of a single tree impact. This is similar to the approach described by Noël et al. (2022). In contrast to the studies cited above, we reconstructed not only jumps but also rolling and sliding movements. The StoneNode data obtained in situ were additionally dissected for their content rather than just serving as a timer for the flight phases. Rolling phases usually show a linear increase within the resulting rotational velocity vector (blue area in Fig. 2c), as opposed to rotationally invariant flying phases. The StoneNode data (Fig. 2c) and the footage overlay (Fig. 2b) served as inputs for identifying and reconstructing the rolling trajectory segments.
In addition to the reconstruction, every liftoff and impact position was classified according to the substrate present. The distinction between soft and hard forest soil impacts was defined, based on the visibility of rock dust in the footage that arose from the weathered Bündner schists. The main impact categories and their subcategories are listed below.
-
Forest soil (soft, hard, and loose rocks)
-
Tree impacts (breakage, frontal impacts, lateral impacts, scratch, multi-stemmed, and ramping)
-
Impacts on lying deadwood (breakage, frontal impacts, scratch, and root plate)
-
Impacts on standing deadwood, so-called snags (breakage, frontal impacts, and scratch)
-
Scrub and small woody debris (standing and lying)
-
Snow
-
Gravel (riverbed and dam).
The workflow for deriving the rolling velocity is visualized in Fig. 2b. The rolling velocity was reconstructed using the maximum radius of the corresponding EOTA block, under the assumption of a slip-free rolling motion corresponding to the rotational data. The x, y, and z coordinates of the trajectory were calculated along the hand-edited path observed from the footage. The comparison of the rolled distance to the edited path and the liftoff velocity of the subsequent jump served as a quality check. To match these two constraints, an enhancing factor, usually between 10 % and 20 %, had to be included in the retrieved velocities. Sliding velocities of flat-angled but still moving EOTA221 blocks were obtained by integrating the x and z acceleration data. The y components were neglected, as they faced along the borehole (see the mounting of a sensor within an EOTA221 rock in Fig. 2d) and were irrelevant for the direction of motion. The coordinates were draped along a hand-edited line, integrating the obtained velocity for a second time to retrieve the real sliding distance. Figure 2c showcases an example run with the described impact classification for every impact. This information was assigned to every reconstructed trajectory alongside the complete set of temporally resolved parameters of interest for single rockfall trajectories, such as position coordinates, translational and rotational velocities, jump heights and lengths, and their respective energies.
Due to the complex topography with a curved slope, the abrupt transition at the nearly horizontal base of the slope, the changing riverbed within the experimental period, and the presence of fluvial terraces, the mean deposition altitudes (MDAs) were analyzed instead of the mean runout distance. Besides enabling the evaluation of deposition patterns, the reconstructed trajectories facilitated the comparison of all further parameters of interest between the two states of the forest and between the two rock shapes. We not only conducted such comparisons on the slope scale but also within 10 evaluation screens. The latter are small-scale analysis areas, with an altitude difference of 5 m. The trajectory reconstruction was accomplished for rock masses ≥800 kg.
2.4 Impact analysis
Our analysis of the effects of rock impacts on forest elements involved both standing trees and fallen deadwood. To quantify these effects, we focused on the incoming rock energies associated with classified frontal impacts (FIs) and assumed a linear relationship between this energy and the cross-sectional area (CSA) of the wood. To ensure that our analysis was accurate and comprehensive, we set the y intercept to zero. This approach allowed us to introduce different absorption coefficients a for the observed species and wood condition within the energy absorption relationship.
2.5 Rockfall simulations
Nowadays, three-dimensional rockfall simulations are the common tools used in practice to produce rockfall hazard maps and to dimension protective measures against rockfall. Such models need the calibration and validation of the model parameters, either based on past rockfall events or rockfall experiments, in order to deliver realistic results. Due to the larger data depth and the existing knowledge of the variability between single rockfall runs, the calibration of experimental data is the gold standard.
In this study, we used the RAMMS::Rockfall simulation program (Leine et al., 2014, 2021; Lu et al., 2019), which allows input capabilities for single trees in the forest representation (Lu et al., 2020) and has recently been enlarged and tested for deadwood configurations as rigid three-dimensional truncated cones (Ringenbach et al., 2022c). The building of the base scenario for the RAMMS::Rockfall simulations contrasted a more time- and cost-intensive method with a more generic, automatized generation of input. The resulting scenarios are subsequently labeled as close-to-reality forest (CRF) and generic (GEN) scenarios. For the CRF, the commercial TerraScan software (Soininen, 2021) was used to extract the DBH and height of single trees from the pre-experimental lidar point cloud. Although some limitations for split trunks and multi-stemmed trees were registered, overall, the derived spatial distribution of the trees agreed well within the two observation plots (Fig. 1a). GEN comprised a randomly generated generic forest composed according to the forest stand quantification and required estimates of the number of trees per hectare, the mean DBH, and the DBH standard deviation for the specified tree area as input parameters. Generated tree positions were randomly distributed across the specified shapefile. The deadwood representation was treated equivalently, using manually measured and digitized deadwood representations for CRF and deadwood configurations originating from the automatic deadwood generator (ADG, as presented in Ringenbach et al., 2022a) for GEN.
For the CRF simulation scenario with deadwood, 31 logs with a mean base diameter cm were included; i.e., they were all above the consideration threshold of D0≥20.0 cm. This threshold was derived from observations, as smaller logs were often rolled over or broken. Their energy absorption capacity was calculated according to Eq. (1) and aDW, as stated in Sect. 3.4. While the deadwood was removed from the simulation, most of the associated root plates were left in place. As some of these disks – made out of the soil and ground material formed by the root system – had an observed influence on the rockfall trajectories, we included the five most important root plates into the simulations (see the white obstacles in Fig. 9b). They were extracted from the pre-experimental point cloud and assigned an ad hoc absorption energy of 1500 kJ.
In this way, a forest mask comprising the area of the main trajectory paths was defined in which the necessary metrics for the forest generation within RAMMS were assessed. This process resulted in 580 trees per hectare, with a mean DBH=30.0 cm ± 23.3 cm. The x and y coordinates of the stem base, D0, and the tree height, h, served as input for the ADG. The tree height was estimated using the locally adapted ratio of . Additional input parameters were the mean wind direction, with its standard deviation (225±45∘), and the same root plate ratio as in the observed forest (16.1 %).
Based on the deposition pattern, the reconstructed translational velocities, and the distribution from the 13 reconstructed EOTA rock trajectories, the mechanical soil strength parameter ME and the soil drag value Cd were manually calibrated within RAMMS::Rockfall. The aim was to reproduce a maximum runout distance over the river, several deposition points in the adjacent terrain unit, and maximum velocities of ≳30 ms−1. The in-depth calibrated parameters from another rockfall experiment in forests (Ringenbach et al., 2022c; ME=2.0 and Cd=2.9) were incrementally adjusted, resulting in overall forest soil parameter values of ME=5.5 and Cd=1.2. These same soil parameters were used for the simulations of all rock shape and mass classes and all four forest configurations, including CRF and GEN. A 2 m line consisting of 10 starting points acted as simulation release input to represent the observed variations in the experimental starting point.
3.1 Deposition pattern and the influence of deadwood
The complete deposition patterns for all 106 test blocks, distributed across the two shape classes and all the weight classes, are shown in Fig. 3 for the forest state with lying deadwood (DW) and for the cleared-forest state (CLR), along with their mean geographic center. Deadwood reduced the mean deposition altitude (MDA) for five of the six shape–mass classes in the DW state compared with the CLR experiments (Fig. 3). The MDA reduction order was as follows:
with the EOTA rock shape–mass class being the sole exception, with an insignificant and minuscule difference between the two forest states of .
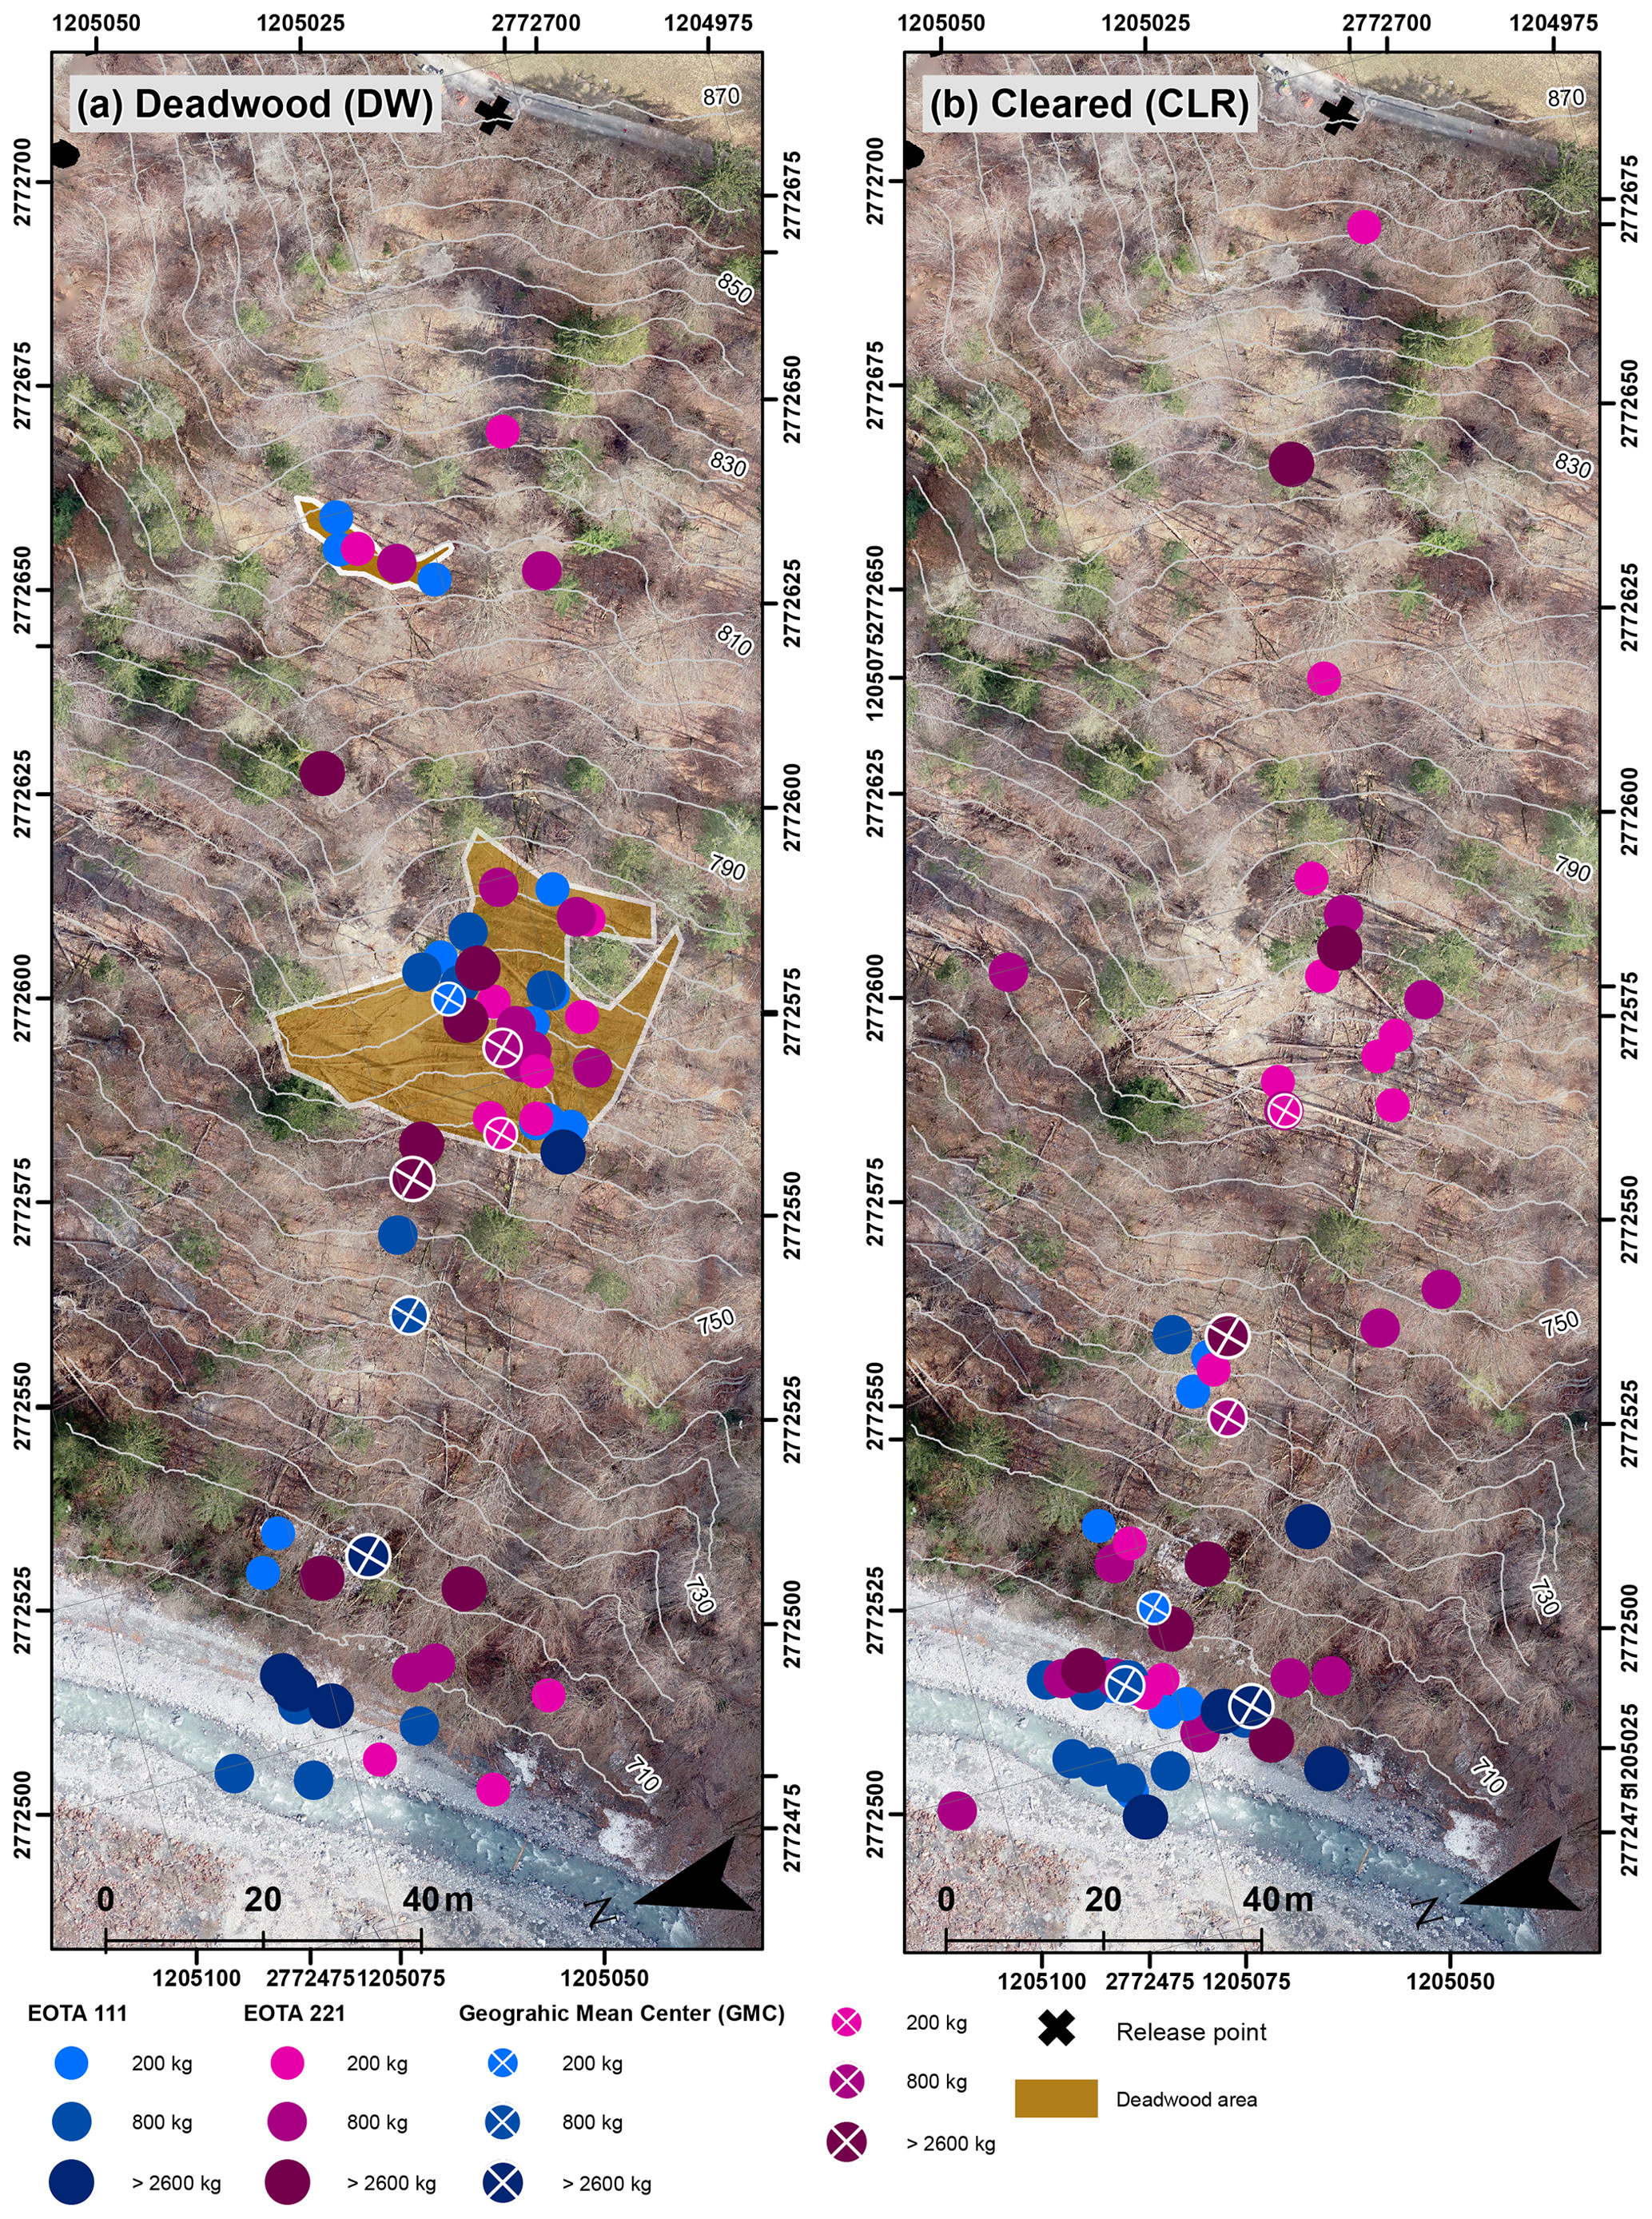
Figure 3Deposition locations of all 106 rocks for the two different forest states, (a) with lying deadwood logs and (b) after clearing of the deadwood logs. Blue markers represent the deposition points of cubic EOTA111 rocks, varying from 200 kg (light blue) to >2600 kg (dark blue). Magenta markers represent the deposition points of platy EOTA221 rocks, varying from 200 kg (light magenta) to >2600 kg (dark magenta). The respective geographic mean centers for each rock category are indicated with a circle in the same color but marked with a cross. The deposition pattern of the EOTA221 rocks stretches along the whole slope, which is compared to those of the EOTA111 rocks.
Another trend is visible in the deposition patterns and jump heights, namely that platy-shaped rocks feature a shorter runout distance in five out of six cases than their cubic-shaped counterparts of equal mass, irrespective of the forest state. This finding was corroborated by a greater MDA. Again, the EOTA rock class was an exception to this trend, with a slightly longer runout (ΔMDA=5.0 m) than for the EOTA rock. The complete distribution of the MDA is further compared to the simulations in Sect. 3.6.
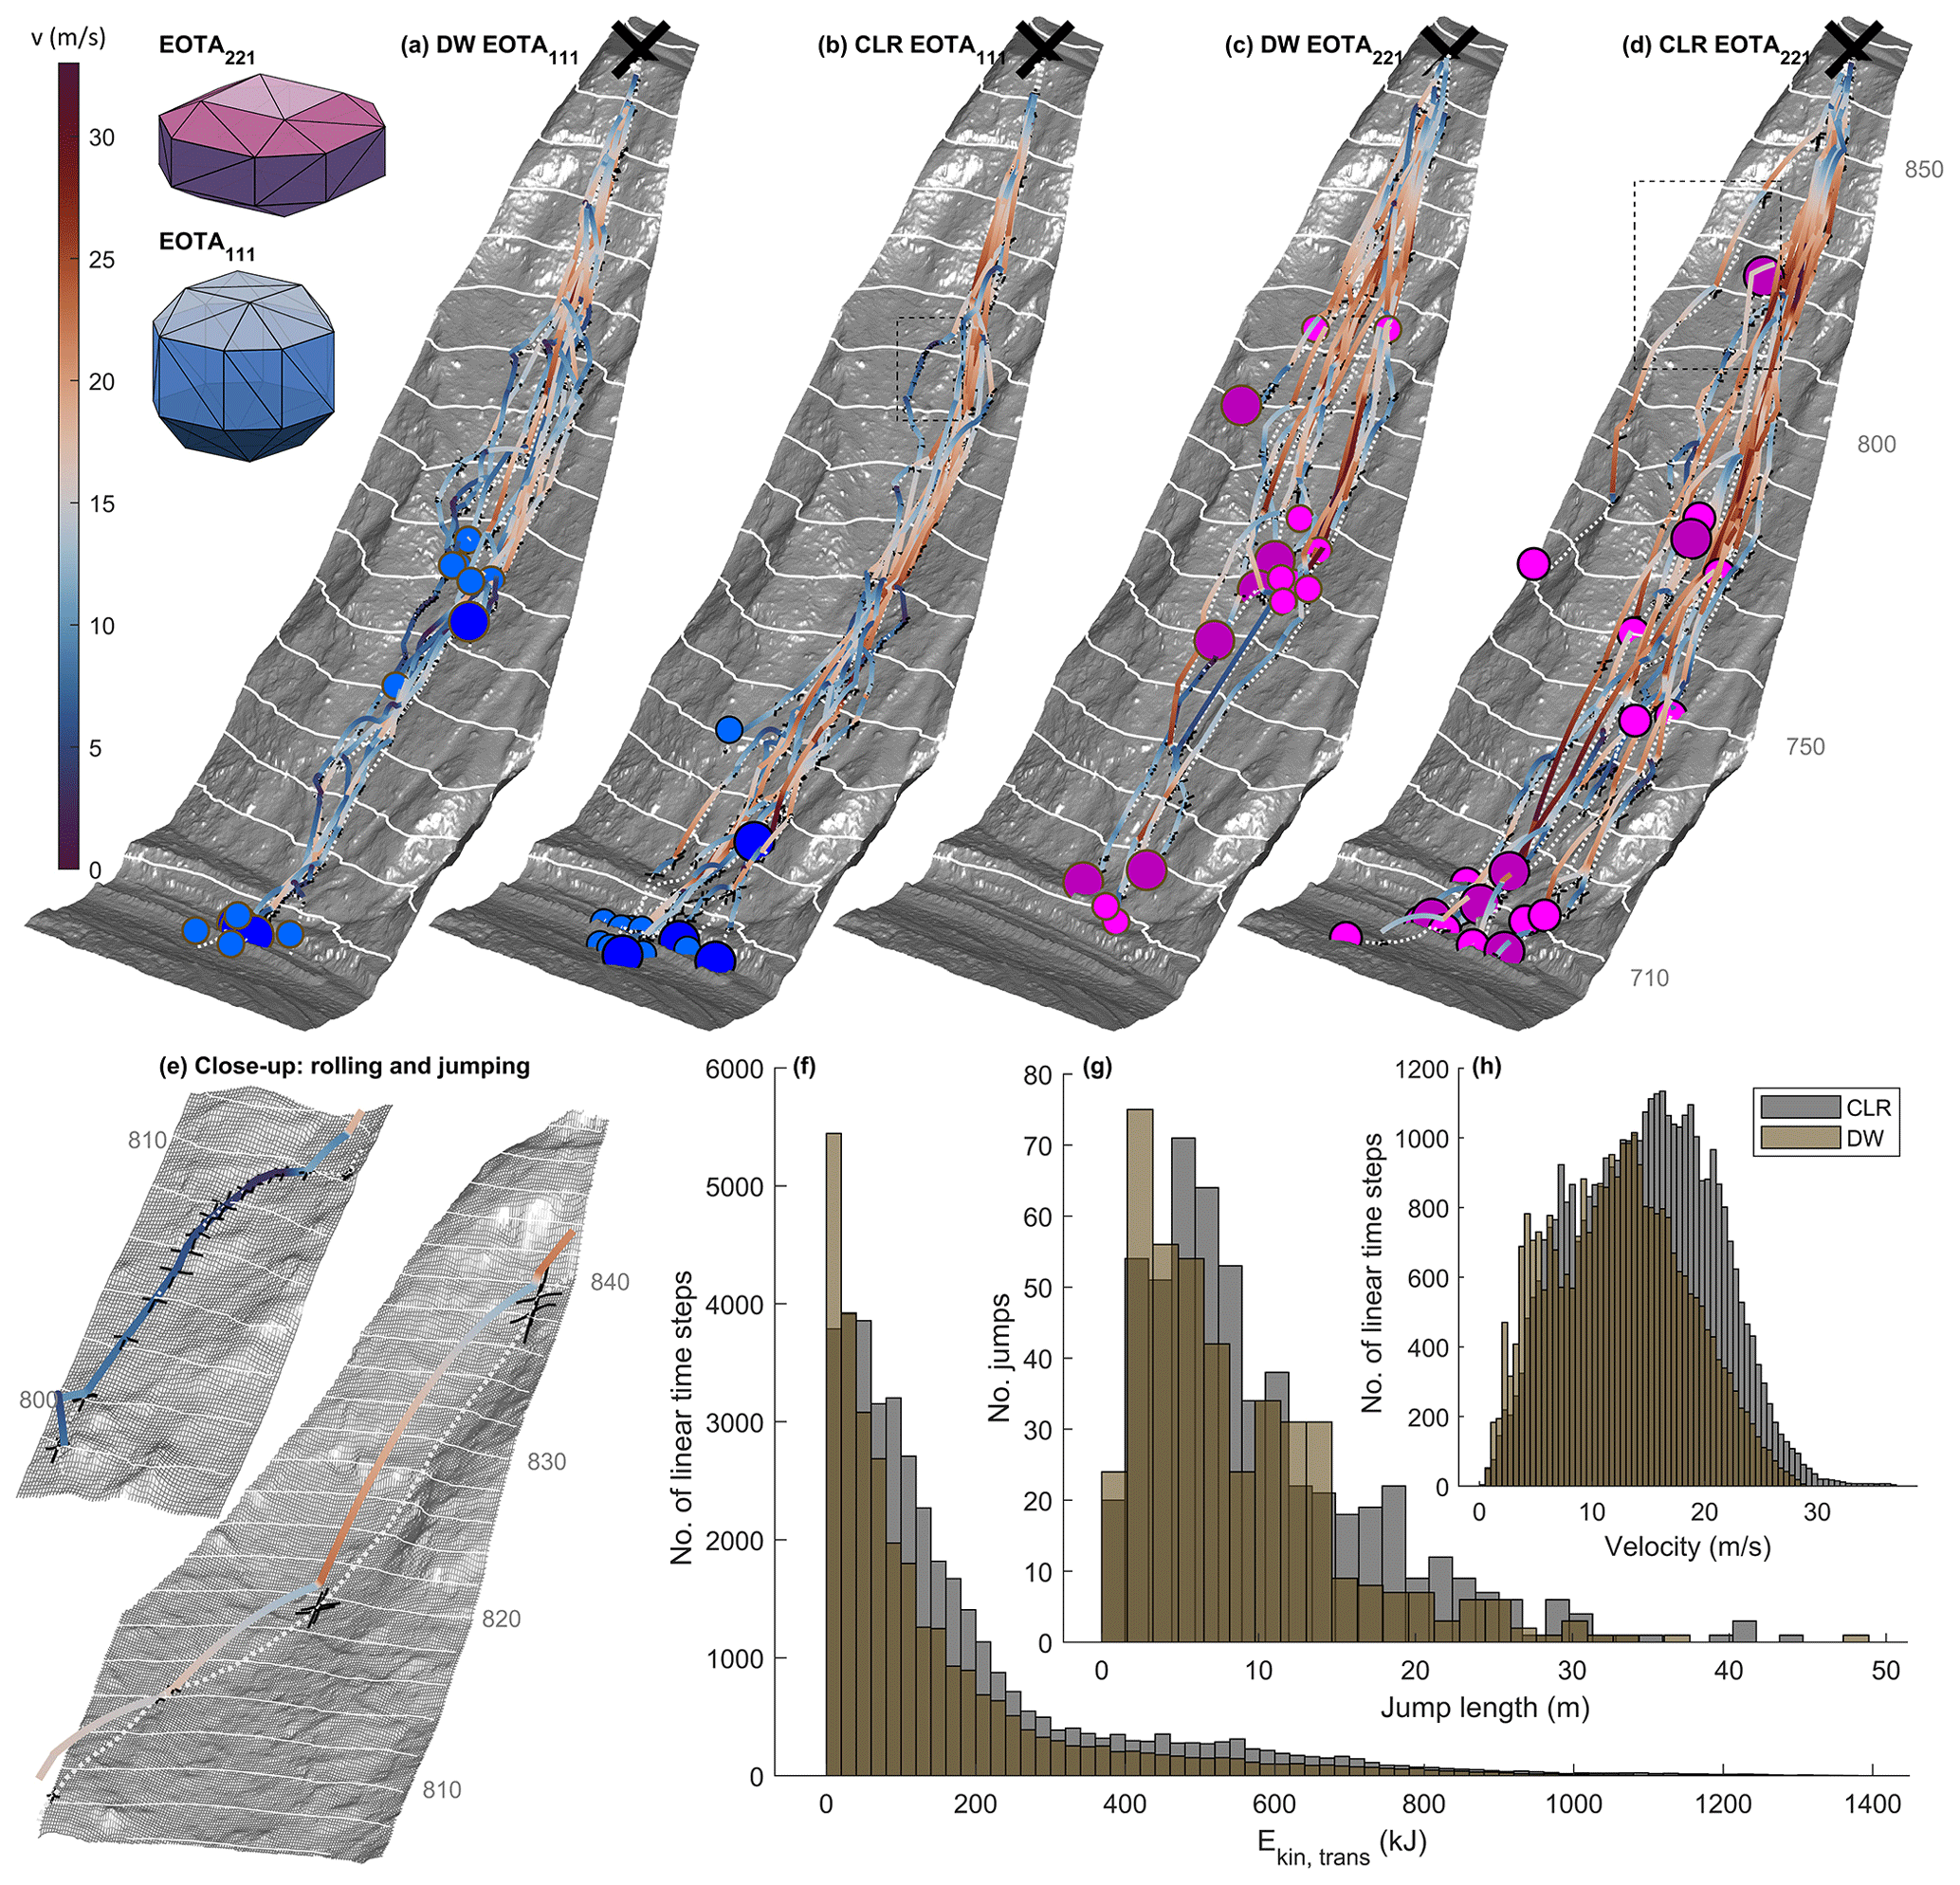
Figure 4Velocities and deposition patterns of the 63 reconstructed rockfall trajectories for the cubic EOTA111 rocks in (a) the forest state with deadwood (DW; n=14) and (b) the cleared-forest state (CLR; n=14) and for platy EOTA221 rocks under (c) DW (n=16) and (d) CLR (n=19) site conditions. While the trajectories are color-coded according to the translational velocity, the same color-coding as in Fig. 3 is used for the deposition points. The close-up views in panel (e) show the framed areas in panels (b) and (d). These enlarged displays feature a rolling trajectory (top) and a jumping trajectory (bottom). The rolling trajectory section visualizes the rock behavior after a tree impact. The succession of oblique jumps highlights the energy dissipation upon each rock–ground interaction with the subsequent accelerated airborne phase. The black crosses in panel (e) illustrate the identified contact points, and their extent represents the uncertainty ranges for the impact locations. The uncertainties play a reduced role on the slope scale (a–d), as the crosses at every contact point are hardly noticeable any longer. The histograms highlight differences regarding (f) translational kinetic energy, (g) jump length, (h) and translational velocity for the two forest states.
3.2 Four-dimensional trajectory reconstruction in a forest environment
In total, 63 rock trajectories were reconstructed in a four-dimensional space (visualized in Fig. 4). This exhaustive reconstruction complemented the static information content from the deposition patterns with kinematic information across the entire slope. Table 2 highlights the median gyroscopic data, categorized according to the rock masses, shape, and the state of the forest. Figure 4a and b contrast the DW versus the CLR state for the cubic EOTA111 blocks featuring blue markers, while the equivalent information for the platy EOTA221 blocks is visualized in Fig. 4c and d with magenta markers. Figure 4e magnifies into the rolling and jumping motion of two example trajectories. The rolling trajectory section is the same as that plotted in Fig. 2a, which is the rolling part after a tree impact. The black crosses represent the identified contact points with assigned time stamps, as described in the reconstruction workflow. The extents of the crosses represent the uncertainty ranges for each impact location, corresponding to the spatial accuracy accumulated in the presented workflow. The succession of oblique jumps highlights the energy dissipation upon rock–ground interaction with its subsequent accelerated airborne phase.
Table 2Median rotational velocities showing gyroscope data streams from measurements made in situ for each mass class and EOTA rock shape, for the deadwood (DW), and for the cleared-forest (CLR) states. The corresponding data from Caviezel et al. (2021a, hereafter Cav2021) serve as a comparison.
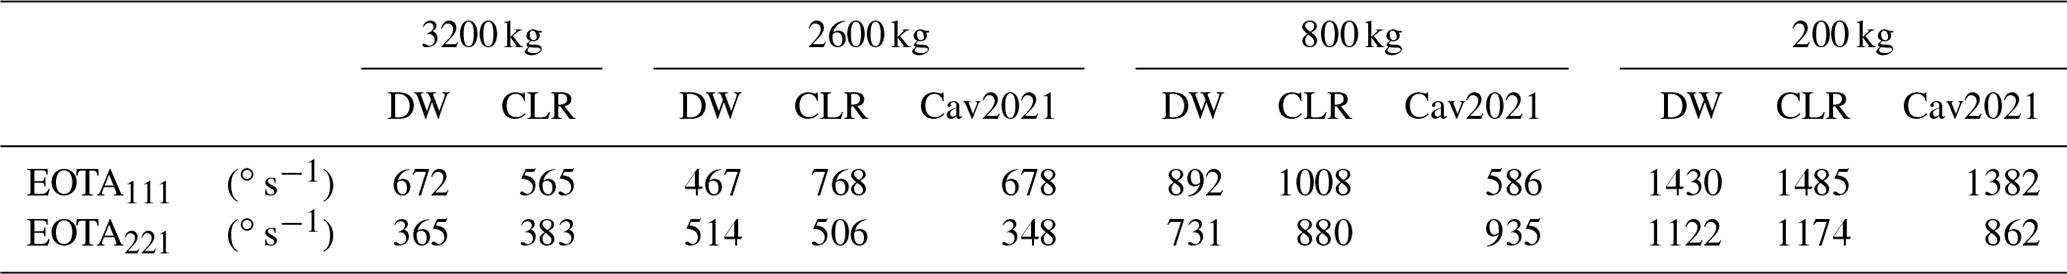
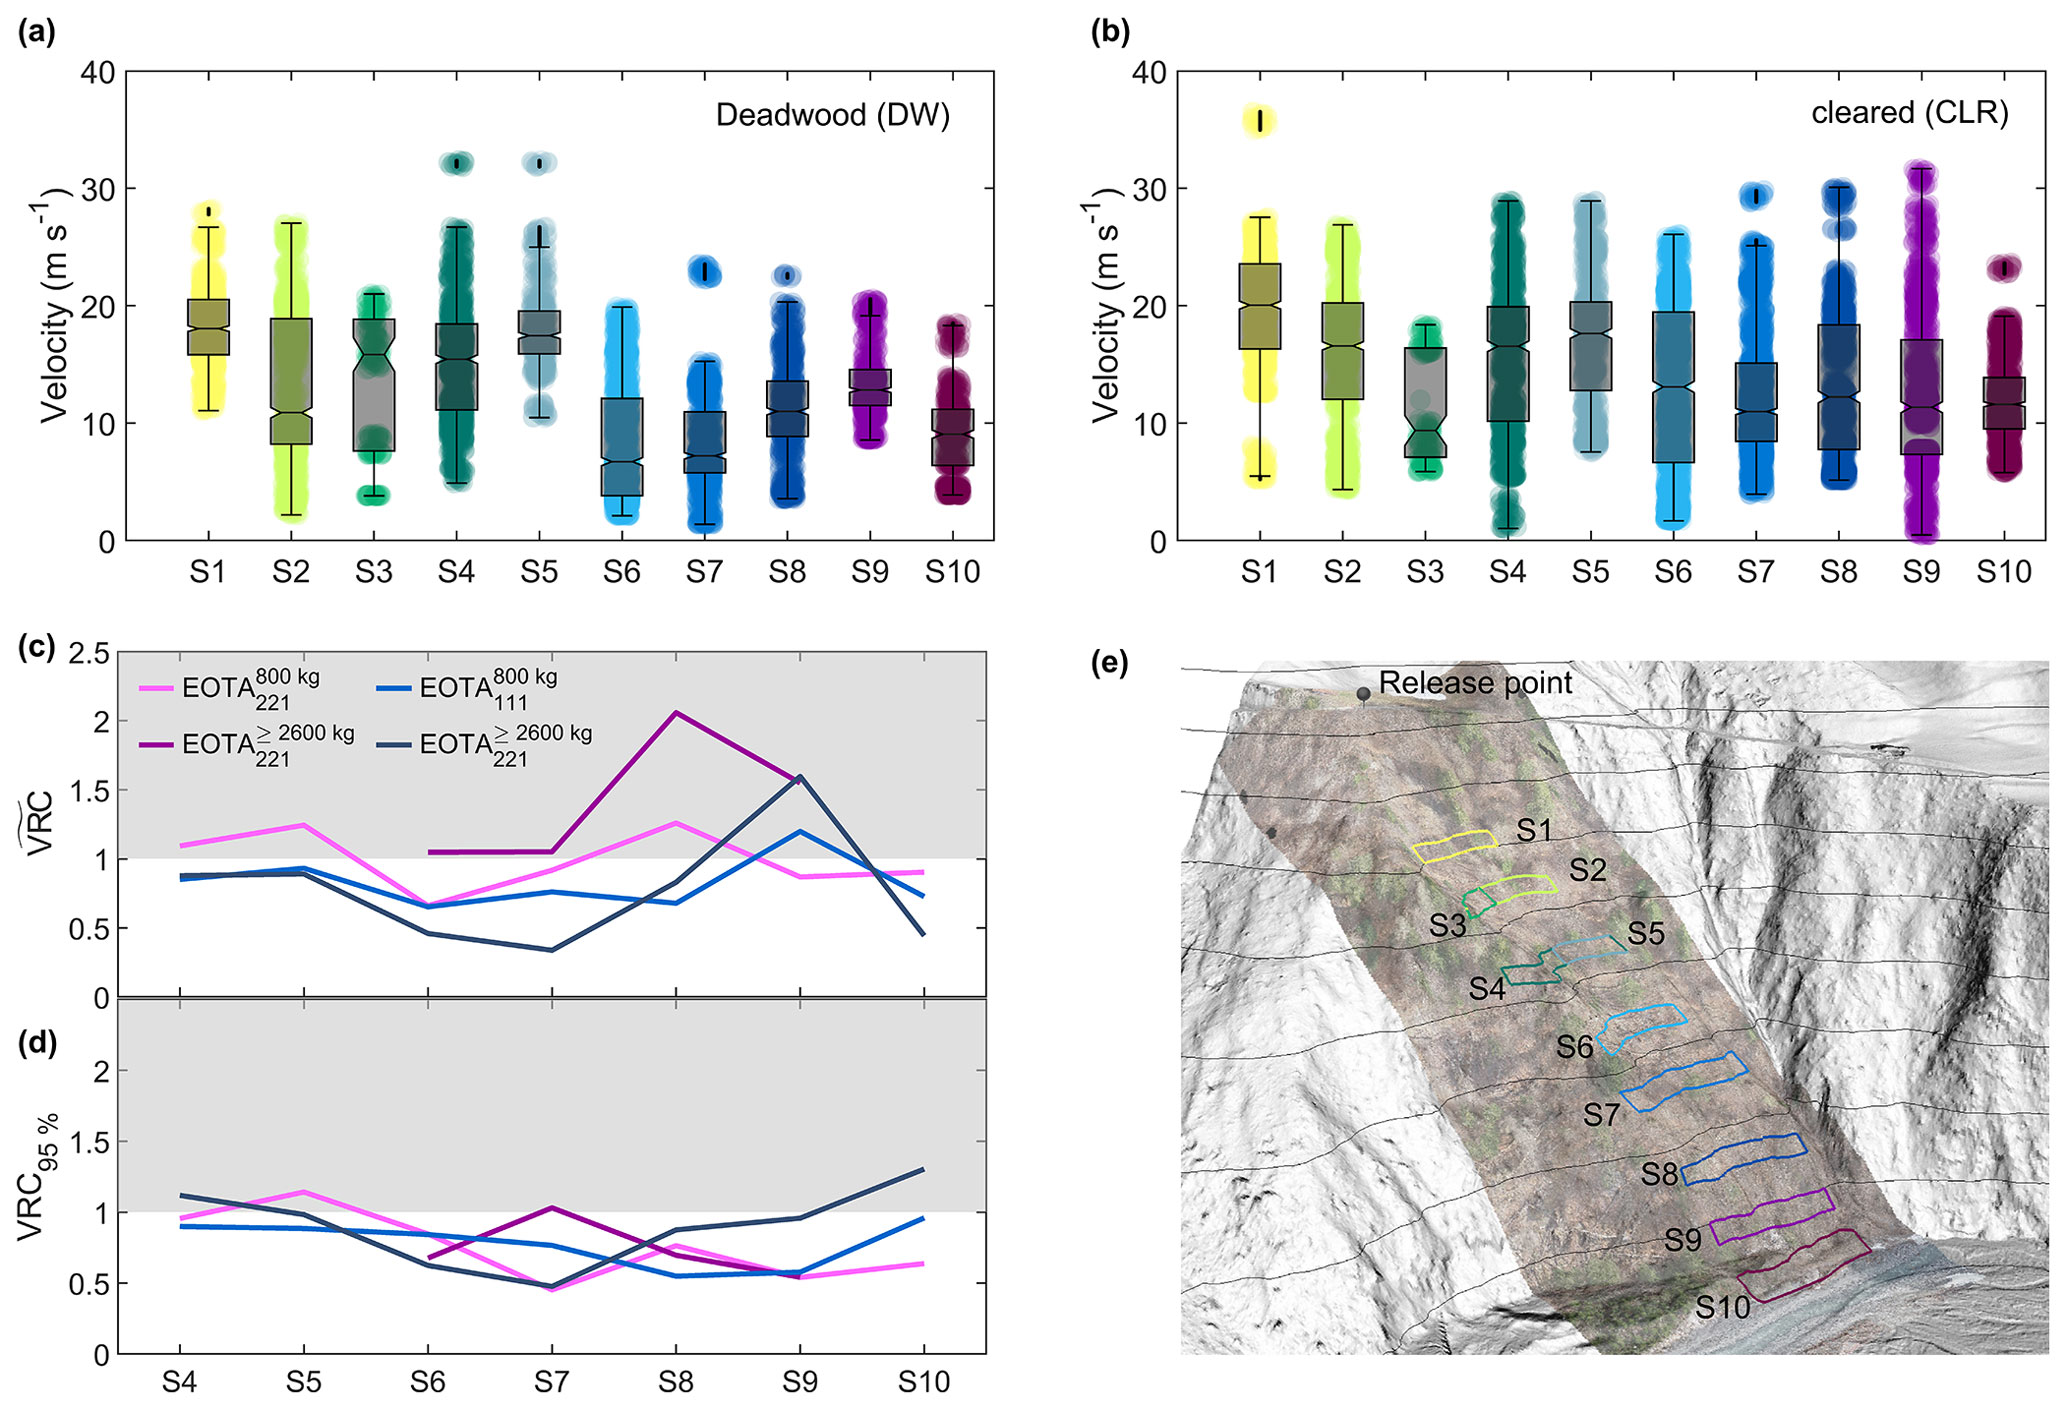
Figure 5In-depth velocity comparison between the rock velocities derived from the experiments featuring forest states with deadwood (DW) present and with a cleared-windthrow area (CLR). Box plots of estimated boulder velocities for (a) DW and (b) CLR for the 10 evaluation screens are as shown in panel (e). All of these screens comprise a height difference of 5 m. Except for S3 and S5, which serve as control screens to evaluate the effect of the upper deadwood cluster, all screens span the whole slope. Panel (c) shows the median velocity reduction coefficient, , which is calculated as the median velocity per screen, rock shape, and mass class for the DW forest state divided by its counterpart for the CLR forest state. (d) Comparison of the ratio of the 95th velocity reduction coefficient (VRC) percentiles, which are labeled as VRC95 %. In panels (c) and (d), 2600 and 3200 kg rocks are aggregated into one class (≥2600 kg).
Only after reconstruction did the parameters of interest (POI), and their change due to the removal of deadwood, become tangible. The trajectories are color-coded according to the translational velocities to make the data set visually comprehensible. Velocities range up to 36.8 m s−1, where velocities ≥31.6 m s−1 are considered to be outliers under the assumption of a normal distribution (Fig. 4h). By removing the deadwood, the mean velocity increased significantly (t test; significance level α=0.01) by 17 %, from 12.5±6.0 to 16.6±6.1 m s−1, while its standard deviation remained almost constant. Consequently, the translational kinetic energy values Ekin,trans increased significantly (t test; α=0.01) due to the change in the horizontal forest structure (Fig. 4f). Also the mean translational kinetic energy increased significantly by 19.3 %, from 143 to 171 kJ (t test; α=0.01). The percentage increase was even greater for the median translational kinetic energy (+38.5 %), although the absolute values were slightly lower (77 to 106 kJ). The median of the reconstructed jump lengths (DW, with n=424; CLR, with n=547) increased by 11.8 %, from 6.9 to 7.7 m, with deadwood removal (Fig. 4g). The increase in the 75th percentile of the jump lengths was even more remarkable, as it rose by 18.8 % from 11.7 to 13.9 m.
Among the evaluation screens S1 to S10, the main difference in velocity between the DW and CLR states of the forest was observed in screens S6 through S10 (Fig. 5a, b). These screens comprise the main deadwood cluster (S6), the slope section below it (S7–S9), and the reach down to the river (S10). Within all these screens, the 75th percentile velocities, shown as the upper-box boundaries, were lower for DW than for CLR. The velocity reduction coefficient (VRC), defined as the ratio between the median values and the 95th percentiles observed in screens S4–S10 is compared in Fig. 5c and d and split according to rock mass and shape. While both sets of curves confirmed approximately equal entry velocities at the top of the lower deadwood section (S4 and S5), the median value was more volatile than VRC95 %. The latter primarily remained < 1, with only the EOTA rock in S10 diverging, meaning that the highest velocities were achieved during the CLR experiments.
3.3 Impacts on standing trees
A total of 164 observed impacts on standing trees led to 44 tree breakages, while no uprooting was observed. The remaining 120 impacts were mainly frontal (n=47). Lateral (28) and scratch (21) impacts were observed more often than impacts ramping over the stem base (13) and impacts on multi-stemmed beech trees (11). However, these numbers would be reduced by 30 %–40 % if only the impacts with a minimum preceding airborne flight phase of 0.25 s were considered. This restriction ensured that only well-defined rock–tree interactions were analyzed when the change in kinetic energy ΔEkin was calculated.
Estimating the maximum absorbed energy of living beech and spruce trees was a two-way process. On the one hand, the incoming rock energies of classified frontal impacts (FIs) on surviving trees were plotted against the wooden cross-sectional area (CSA). The highest survived impact energies were fitted based on Eq. (1) and a 95 % confidence interval (Fig. 6a, b). On the other hand, the observed beech (Fig. 6c) and spruce (Fig. 6d) stem breaks were compared with the incoming kinetic rock energy. The lowest observed impact energies leading to breakages were fitted based on Eq. (1) and plotted with the 95 % confidence interval. These two functions per tree species, representing the boundaries of the colored areas in Fig. 6e (beech; FS) and 6g (spruce; PA) transformed into the DBH domain, differed only in the absorption coefficient a within the energy absorption relationship (Eq. 1). The factors used for survival and for breakage for the two tree species were , , and ([a] = kJ m−2), with DBH measured in centimeters, resulting in absorption energies Eabs in kilojoules. A direct comparison of the curves of the two tree species shows that beech had a higher absorption capacity. An image sequence based on video stills of the highest-energy impact a tree withstood without breaking during this experimental series is shown in Fig. 6f. The EOTA block, traveling at a velocity of 29.2 m s−1, exhibited a translational kinetic energy of 1372 ± 72 kJ. This translational energy was supplemented by a rotational velocity ω=1127∘ s−1, resulting in 154 kJ of rotational energy and a total kinetic energy of kJ. The impact lasted 0.320 s and had a maximum measured acceleration of 47.5 g. The resulting impact force of 1492 kN was accompanied by a highly visible trunk deformation of ∼36 cm or ∼73.5 % of the DBH (Fig. 6f). Both the outgoing translational velocity, vout=7.8 m s−1, and the rotational velocity, ωout=292∘ s−1, represented a reduction of 74 % with respect to pre-impact values. The total kinetic energy of the moving block was even reduced by 93 %, or 1436 kJ, due to the nonlinear influence of these main drivers, which led to the stopping of the rock after a short sliding phase. Although the tree sustained visible structural damage, it also withstood the immediately following EOTA rock (also shown in Fig. 2b), which remobilized the earlier deposited EOTA rock in a Boccia effect. This second impact on the tree with kJ did not result in stem breakage but rather in an additional energy absorption of 433 kJ by the tree.
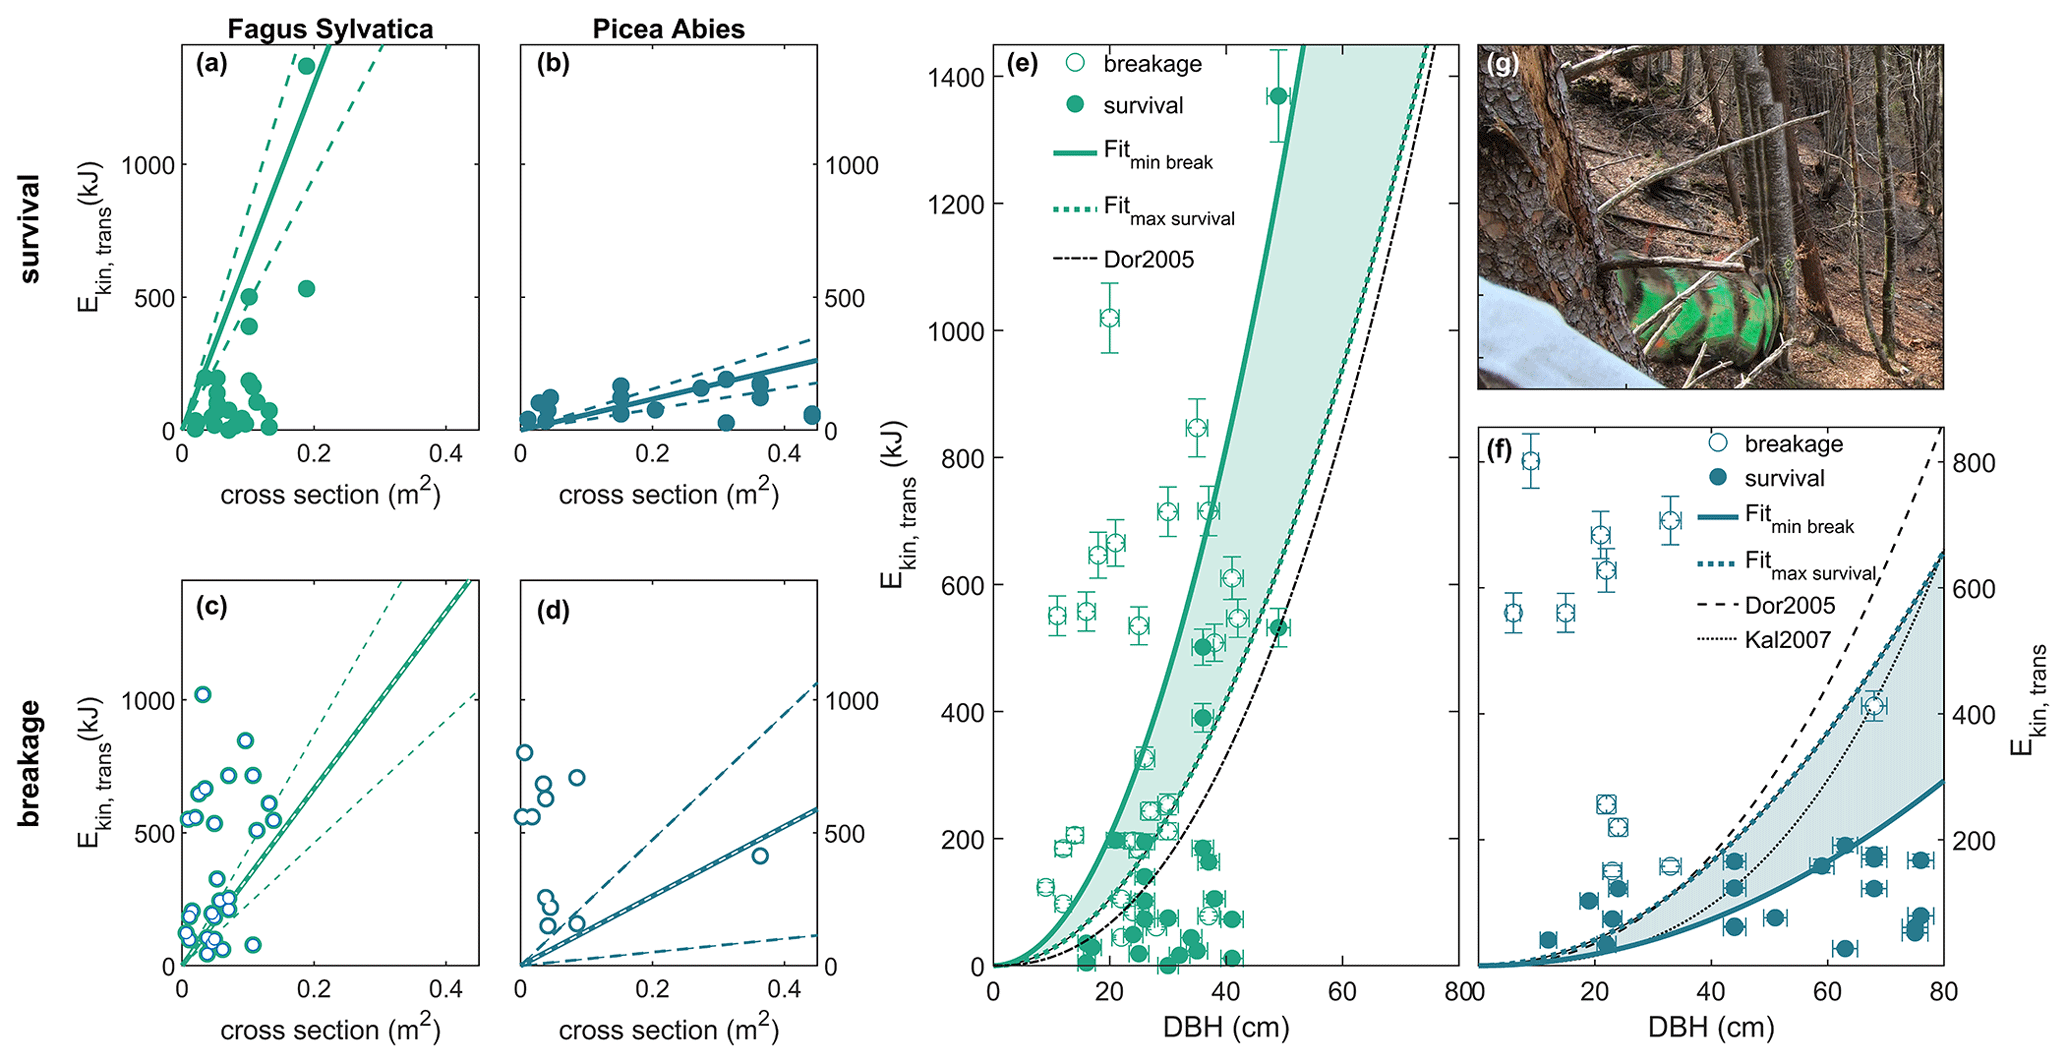
Figure 6Relationships between Ekin,trans, DBH, and the observed breakage of standing beeches (green) and Norway spruces (turquoise). (a, b) Tree survival is shown, with incoming rock energies of the classified frontal impacts on surviving trees versus the wood cross-sectional area. The fit is considered to be the upper boundary for survival. (c, d) Tree breakage is shown, with incoming rock energies of classified frontal impacts leading to tree breakage versus the wood cross-sectional area. The fit is considered to be the lower boundary for breakage. (e, f) Tree diameter at breast height (DBH) versus incoming kinetic translational energy is shown, with tree breakage and survival indicated by open and filled symbols, respectively. The lower and upper boundaries per tree are the linear fits from panels (a) and (b) transformed into the DBH domain. The existing correlations from Dorren and Berger (2005) and Kalberer et al. (2007) are shown for comparison as dashed black lines. (g) Video still sequence of the highest-energy impact a tree withstood without breaking during this experimental series.
3.4 Impacts on deadwood
We observed a total of 55 deadwood impacts. Only direct frontal impacts were analyzed further, as impact kinematics for more complex impact configurations become too difficult to resolve. For example, six breakages and two surviving logs were registered after an impacting rock first hit the soft soil immediately before the deadwood hit. This soil contact without a clear airborne flight phase before the deadwood impact made an accurate estimation of the incoming energy impossible. Hence, a total of 27 traceable frontal deadwood impacts were analyzed, with deadwood breakages resulting from the impact on 17 occasions (Fig. 7).
The relationship presented in Fig. 7 between the incoming rock energy and the maximum breakage energy was derived using functions similar to those used for standing tree breakage in Fig. 6c and d. When adapted for deadwood, the absorption coefficient in Eq. (1) was reduced to aDW=415.7. Most surviving deadwood logs had a diameter >49 cm. An example of a two-jump sequence of the impact onto a deadwood log without breakage is depicted in Fig. 7c. First, the EOTA rock broke a beech tree with a DBH of 38 cm with its incoming kinetic energy ( kJ), as pictured in the top right corner of Fig. 7c. The uprooting caused a loss of 75.7 % of the rock's kinetic energy. The subsequent flight phase led to an energy gain to 369 kJ. After the rock–ground interaction shown in the center of Fig. 7c, the rock was left with only 71 kJ at the liftoff and arrived with a mere 82 kJ at the deadwood log. This low-energy rock was stopped by the 52 cm thick trunk. Thanks to the MSR acceleration sensor, directly mounted on the opposite side of the log, additional data on this impact were available (Fig. 7b). The data stream showed excellent agreement with the maximum rock accelerations ( g( and deadwood log A acceleration ( g).
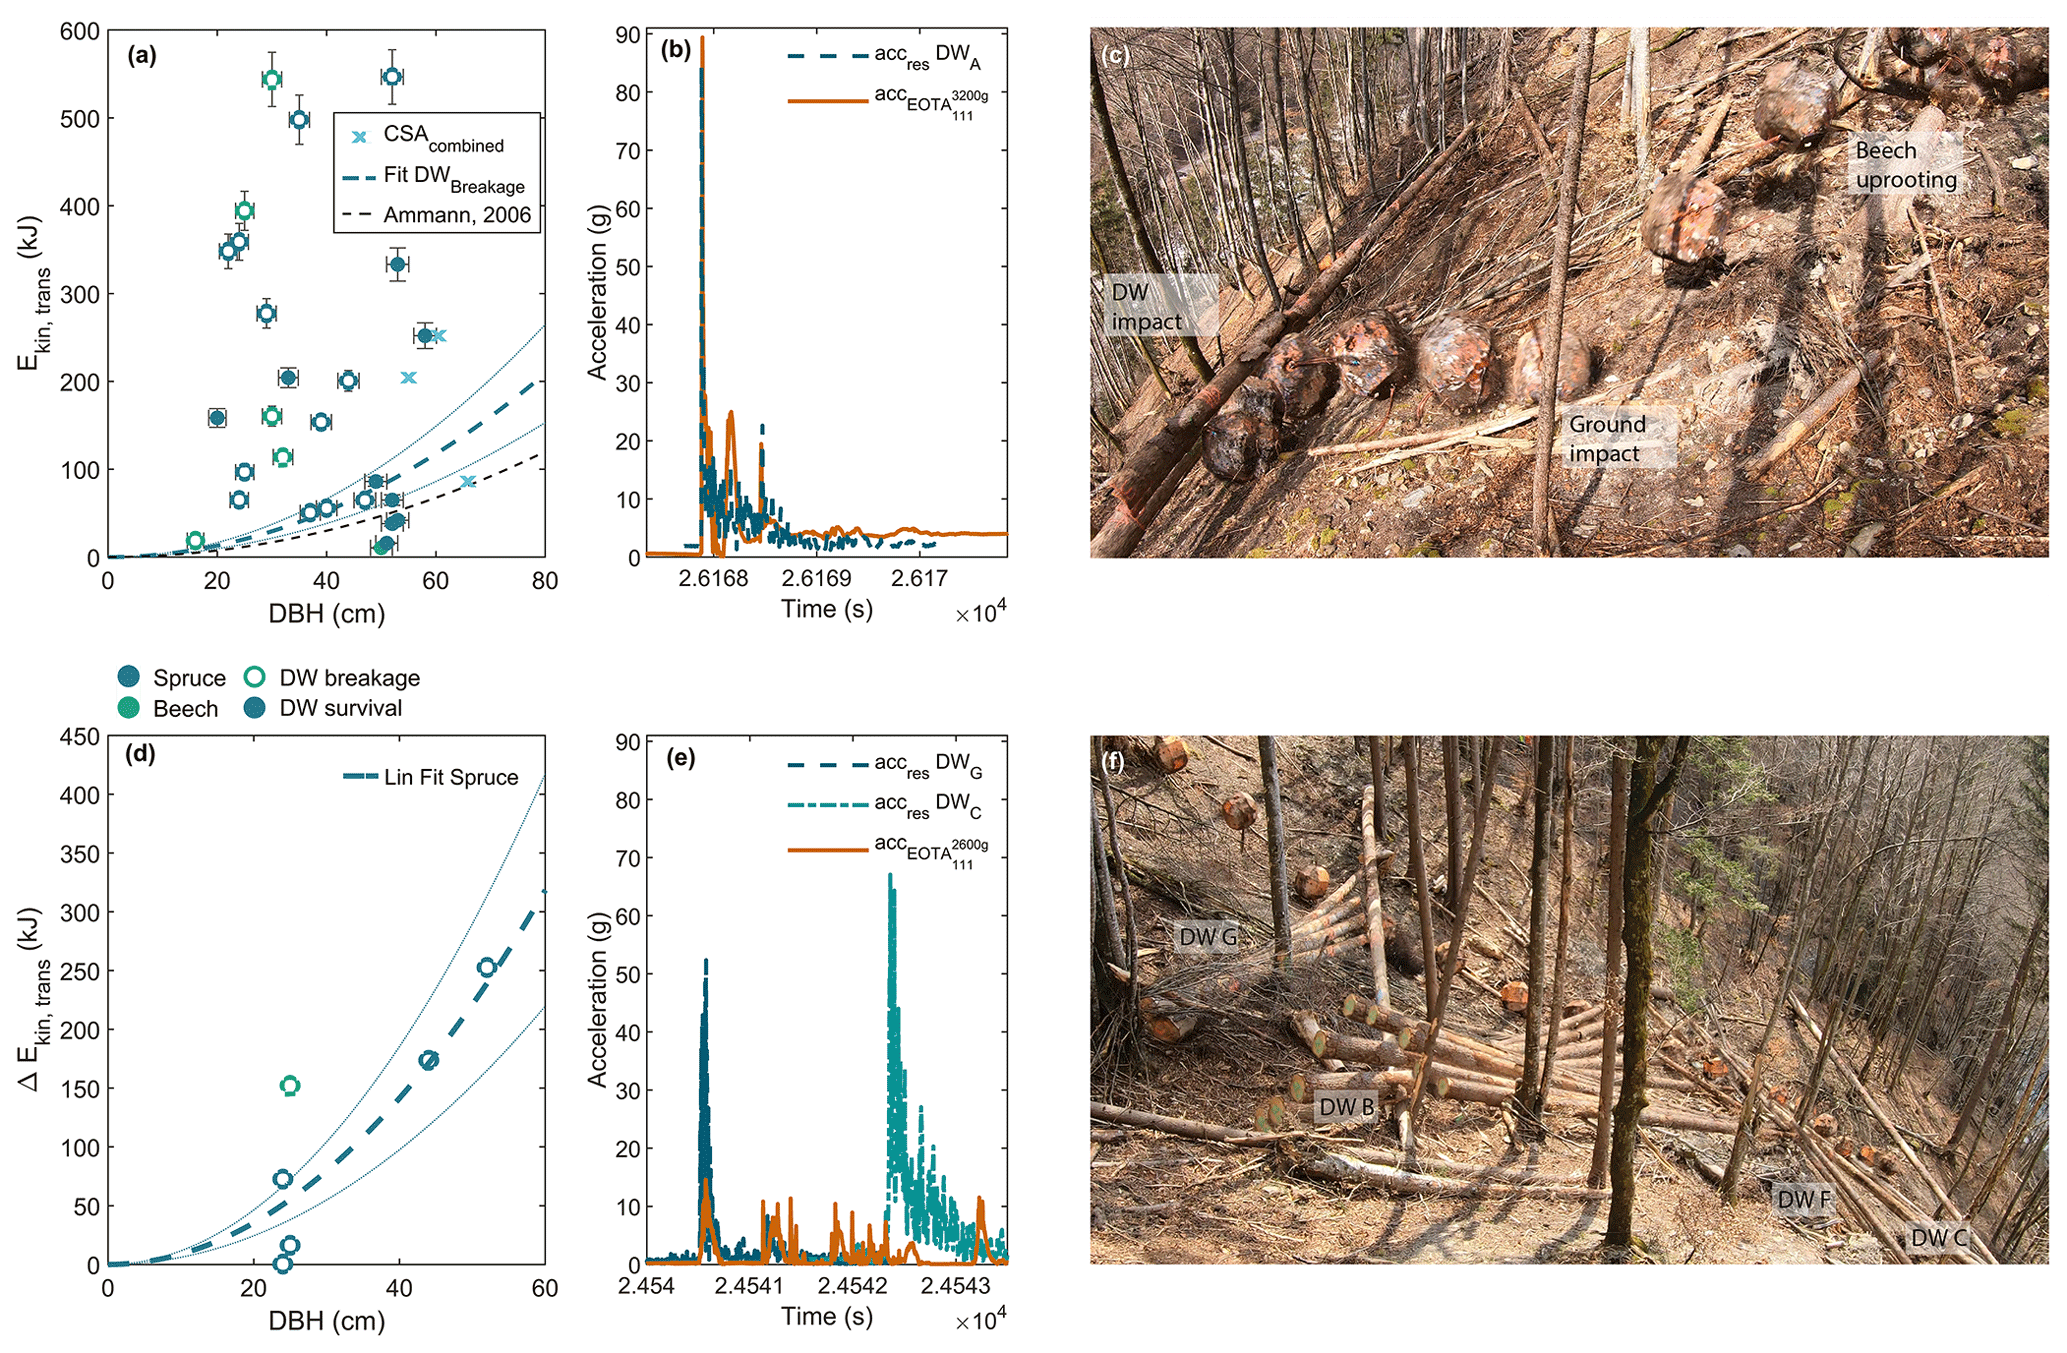
Figure 7Relationships between Ekin,trans, DBH, and the observed breakage of deadwood. (a) All 27 traceable deadwood impacts, with open symbols representing breakage and filled symbols indicating survival. The lower boundary of the breakage and its 95th percentile are compared with the results of large-scale laboratory experiments (Ammann, 2006). (b) The congruent in situ acceleration stream of the EOTA rock and its opposing deadwood log DWA. (c) Multi-frame image series of the EOTA rock, visualizing a two-jump sequence leading to the final impact onto the deadwood log, corresponding to the sensor data shown in panel (b). (d) Estimate of the energy reduction ΔEkin for clean deadwood punctures. (e) Sensor streams of an exemplary EOTA rock run, causing several deadwood breakages and showing significantly lower acceleration than the hit deadwood logs. (f) Corresponding trajectory section of the EOTA rock run for the acceleration window depicted in panel (e).
The most impressive deadwood breakage happened during the first EOTA rock run after the reinstallation of the major deadwood logs. This single run obliterated no fewer than four logs (visible in Fig. 7f). The presented multi-frame image visualizes, from left to right, the breaking of the logs DWG, DWB, DWF, and DWC. Reliable deadwood accelerometer data were available for two of these impacts (Fig. 7e). The deadwood experienced significantly higher accelerations than the rock, i.e., g versus g, and showed a highly divergent behavior, with g versus g. An estimate of the energy reduction ΔEkin for clean deadwood punctures, where the trajectory of the rocks was not significantly altered by the deadwood impact, is presented in Fig. 7d. In this study, clean punctures were defined as having contact durations ≤0.5 s with a single log, without any preceding or subsequent soil contacts. Only six impacts complied with these criteria, that is, five with spruce logs and one with a beech log.
3.5 Soil moisture
Experiments were exclusively held during dry weather conditions. Therefore, no abrupt changes in the volumetric water content (VWC) of the soil were recorded within the time range of a given experiment. The soil moisture observation phase lasted almost 21 months, starting in mid-August 2019. The driest conditions were observed on 29 August 2020, with a VWC of 0.053 m3 m−3 at a depth of 10 cm depth and with a VWC of 0.177 m3 m−3 at 30 cm depth. The highest VWC was measured on 21 August 2019, with a VWC of 0.340 m3 m−3 at a depth of 10 cm, and on 16 May 2020, with a VWC of 0.433 m3 m−3 at 30 cm depth. The measured VWC30 cm and VWC10 cm during the 5 experimental days with video coverage (vertical lines in Fig. 8a) are summarized in Table 3.
Table 3Measured volumetric water contents (VWC) at depths of 10 and 30 cm during the 5 experimental days, with video coverage used for the trajectory reconstruction in Fig. 4.
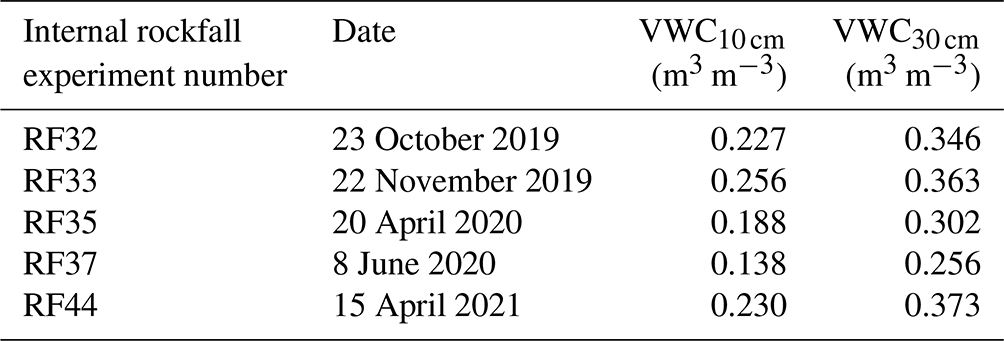
While the three experiments in 2019 and 2021 were carried out under rather moist soil conditions, the experimental days in 2020 featured rather dry soil conditions. For further analysis, one VWC value per experimental day was considered and paired with the available rockfall dynamics data from the impacts fully classified as soft-soil impacts located close to the soil sensor location, within the blue area shaded in Fig. 1a. The contacts needed to feature durations of <0.5 s. Robust accelerometer data were available for the 2020/2021 experimental days, and the identified accelerations (n=49) are plotted in Fig. 8b. The mean accelerations followed a trend towards lower acceleration under wetter soil conditions, although this pattern was not statistically significant (ANOVA). Slightly more data points were available for velocity changes Δv (n=78; Fig. 8c). The exponential relationship between VWC30 cm and Δv is statistically not significant.
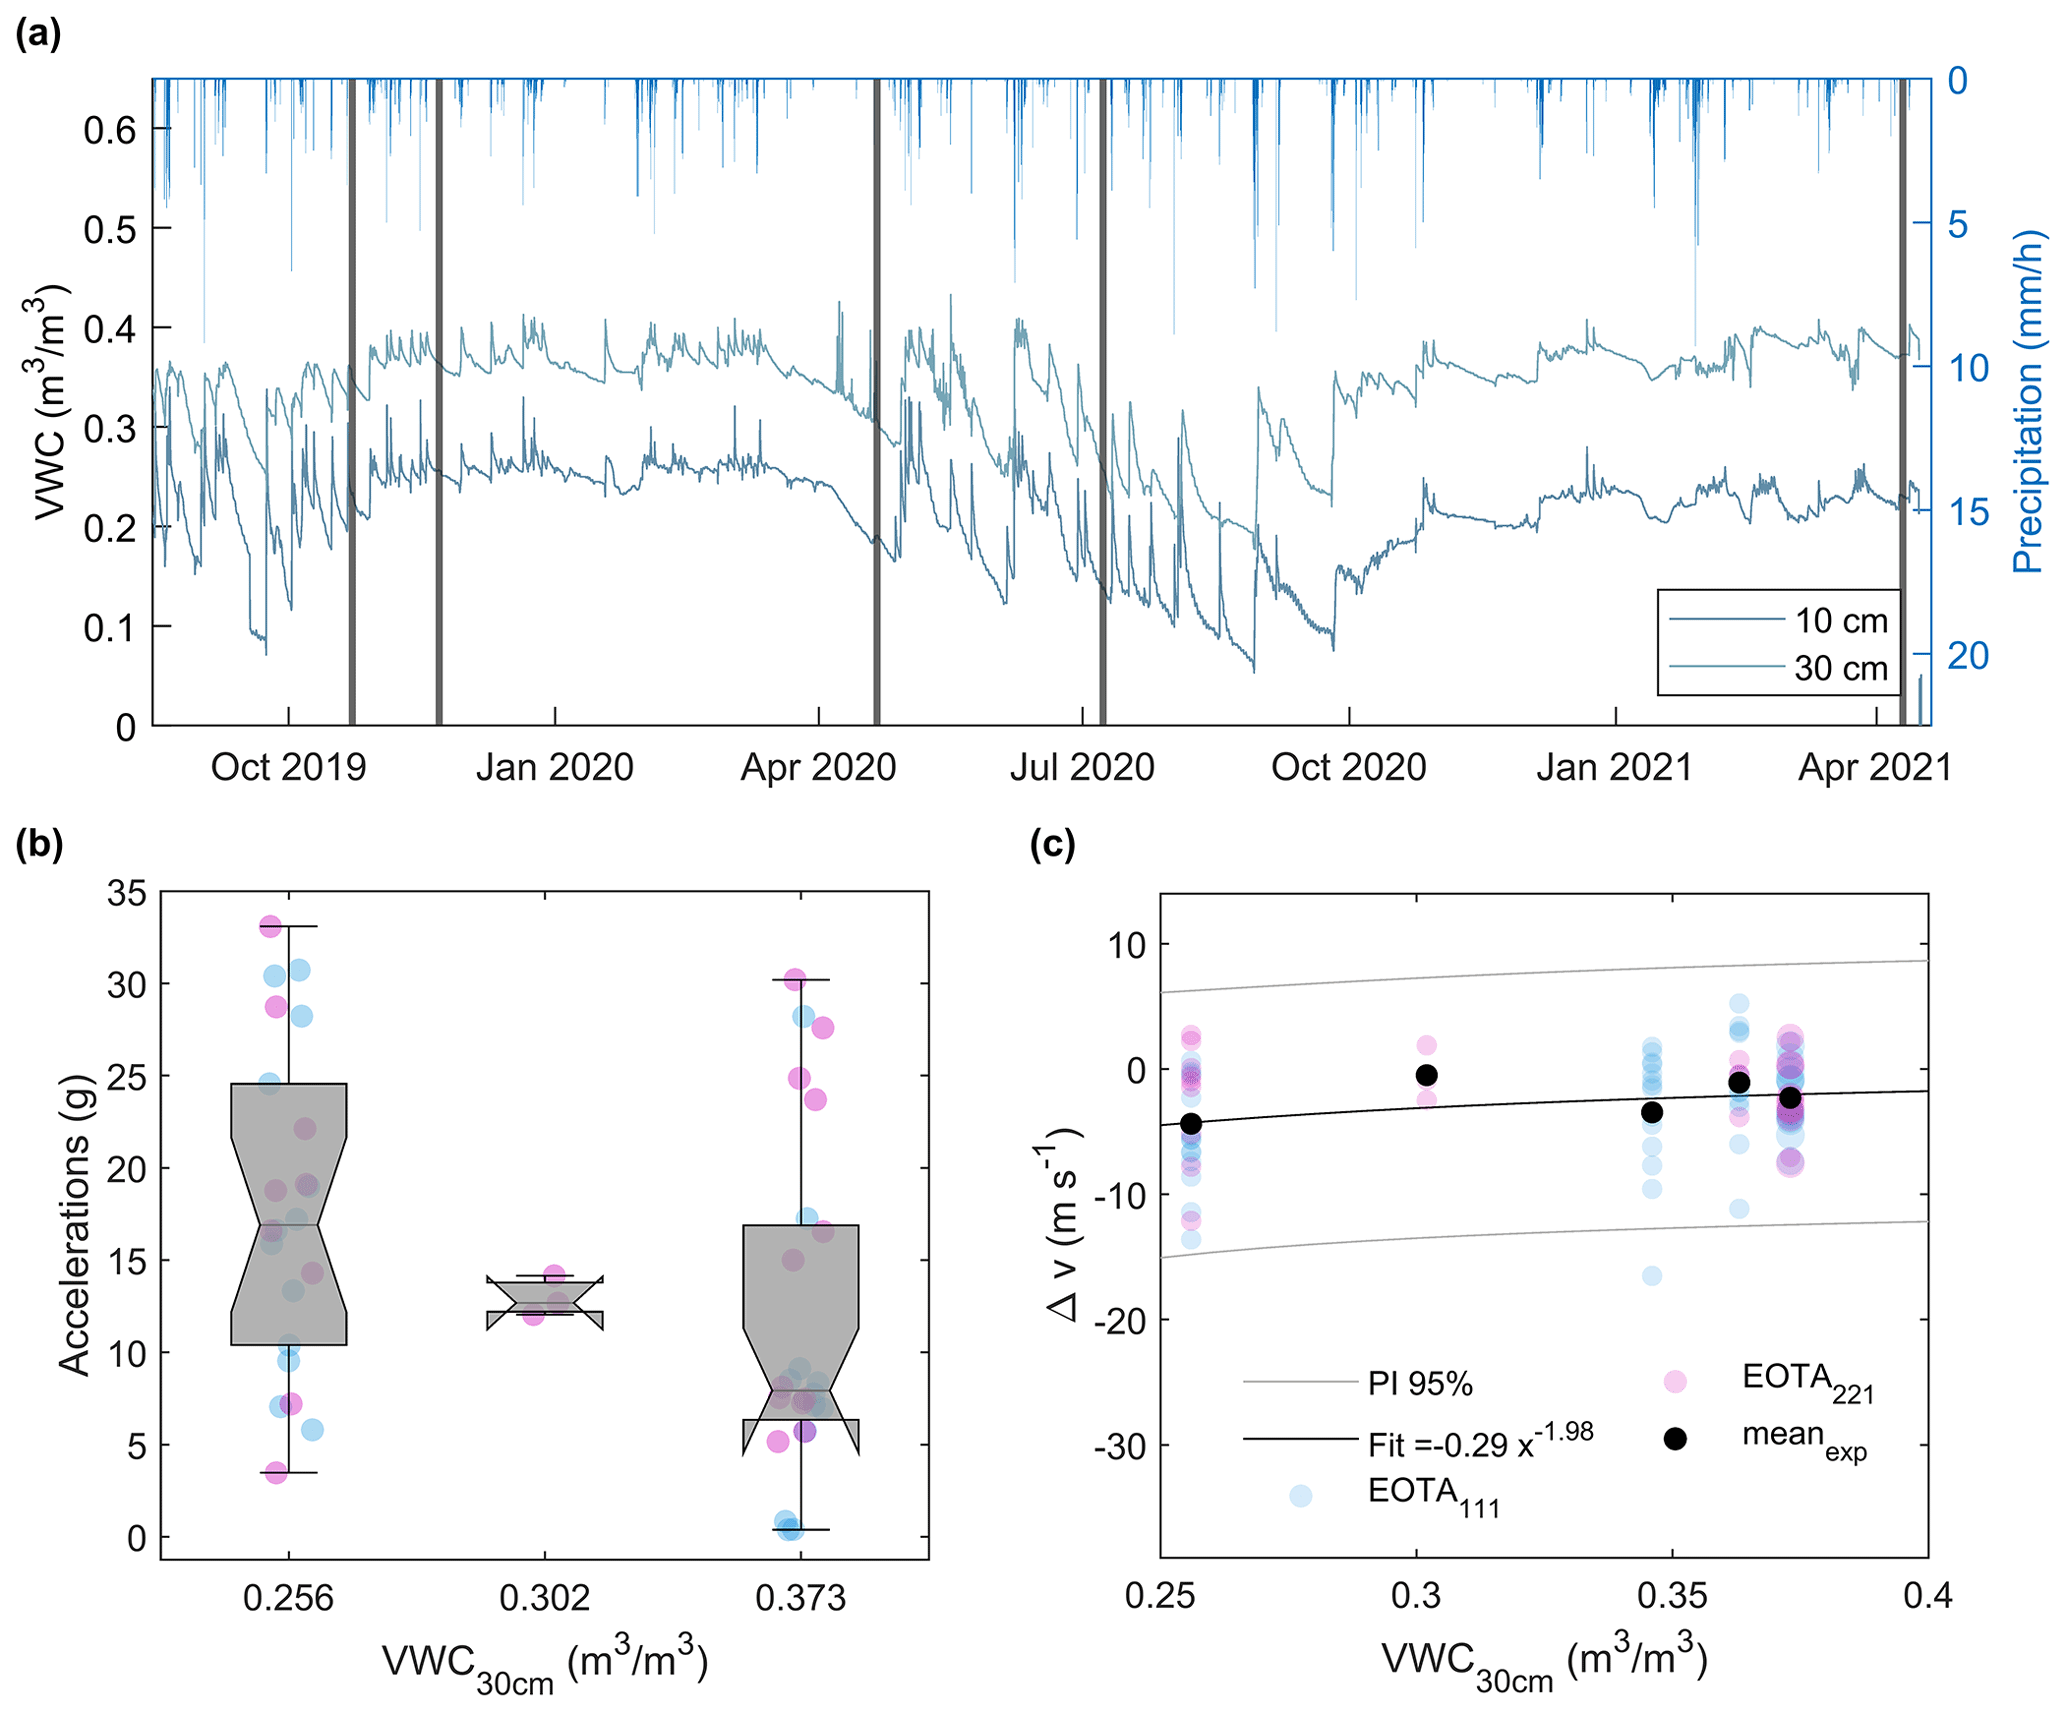
Figure 8Soil moisture and its implications for rockfall impacts. (a) Volumetric water content (VWC) was measured at depths of 10 and 30 cm over time and compared with the precipitation measured at the closest MeteoSwiss weather station (4 km away; Federal Office of Meteorology and Climatology MeteoSwiss, 2018). The vertical lines highlight the 5 experimental days, with video coverage used for the trajectory reconstruction in Fig. 4. (b) Accelerometer data versus VWC for soft-soil impacts (n=49). The median values of the measured rock accelerations of all representative impacts within the region of the soil moisture sensors show a weak negative correlation with the measured VWC. The partially overlapping notches of the three boxes indicate a lack of strong evidence for a significant difference between their medians at a 95 % confidence level. (c) Velocity changes Δv related to the observed VWC, with rock mass represented by symbol size (n=78). The prediction interval (PI) is ±10.6 m s−1.
3.6 Simulations
Figure 9a and b visualize the RAMMS::Rockfall simulations performed for the EOTA rock for the close-to-reality forest states (CRF) with lying deadwood (DW), SIM, and after clearing (CLR), SIM. The experimentally derived energy absorption factors for beech trees () were used to determine the energy breakage limits for each tree. The equivalent images for the generic forest states (GEN), SIM and SIM, are given in Fig. 9c and d. The SIM scenario served as a calibration scenario. Calibration was based on the agreement regarding runout lengths and translational velocities and, in particular, on the successful replication of the trajectory paths veering towards the next natural terrain unit on the orographic right. The parameters of interest for the other scenarios were then compared with the reconstructed trajectories from Fig. 4. Veering-off trajectories were experimentally observed under CLR conditions only but occurred in the DW simulations as well. Scenario SIM showed a narrowing of trajectory paths below the main deadwood section from Fig. 9b to a, showing a feature that is absent in the GEN simulations.
Figure 10 compares the deposition altitudes from the experiments with the two simulation setups for DW and CLR forest states. The box plots feature the 75th percentile as end of the box originating from its median and are again colored according to their weight and shape classes. The two shaded gray altitude bands indicate the locations of the two deadwood sections, with the lower main deadwood section spanning from 785 to 760 m a.s.l. The distributions of deposition altitudes differed strongly between the experiments and the simulations, but all medians were located within the main deadwood cluster (marked in gray in Fig. 10). The altitude dispersion in SIMGEN was more prominent than in SIMCRF and in the experiments. Deposition points for platy stones were distributed along the whole slope in the simulations without deadwood. However, the effect of the forest was overestimated, especially for large rocks, resulting in median deposition altitudes that were too large, especially for platy rocks.
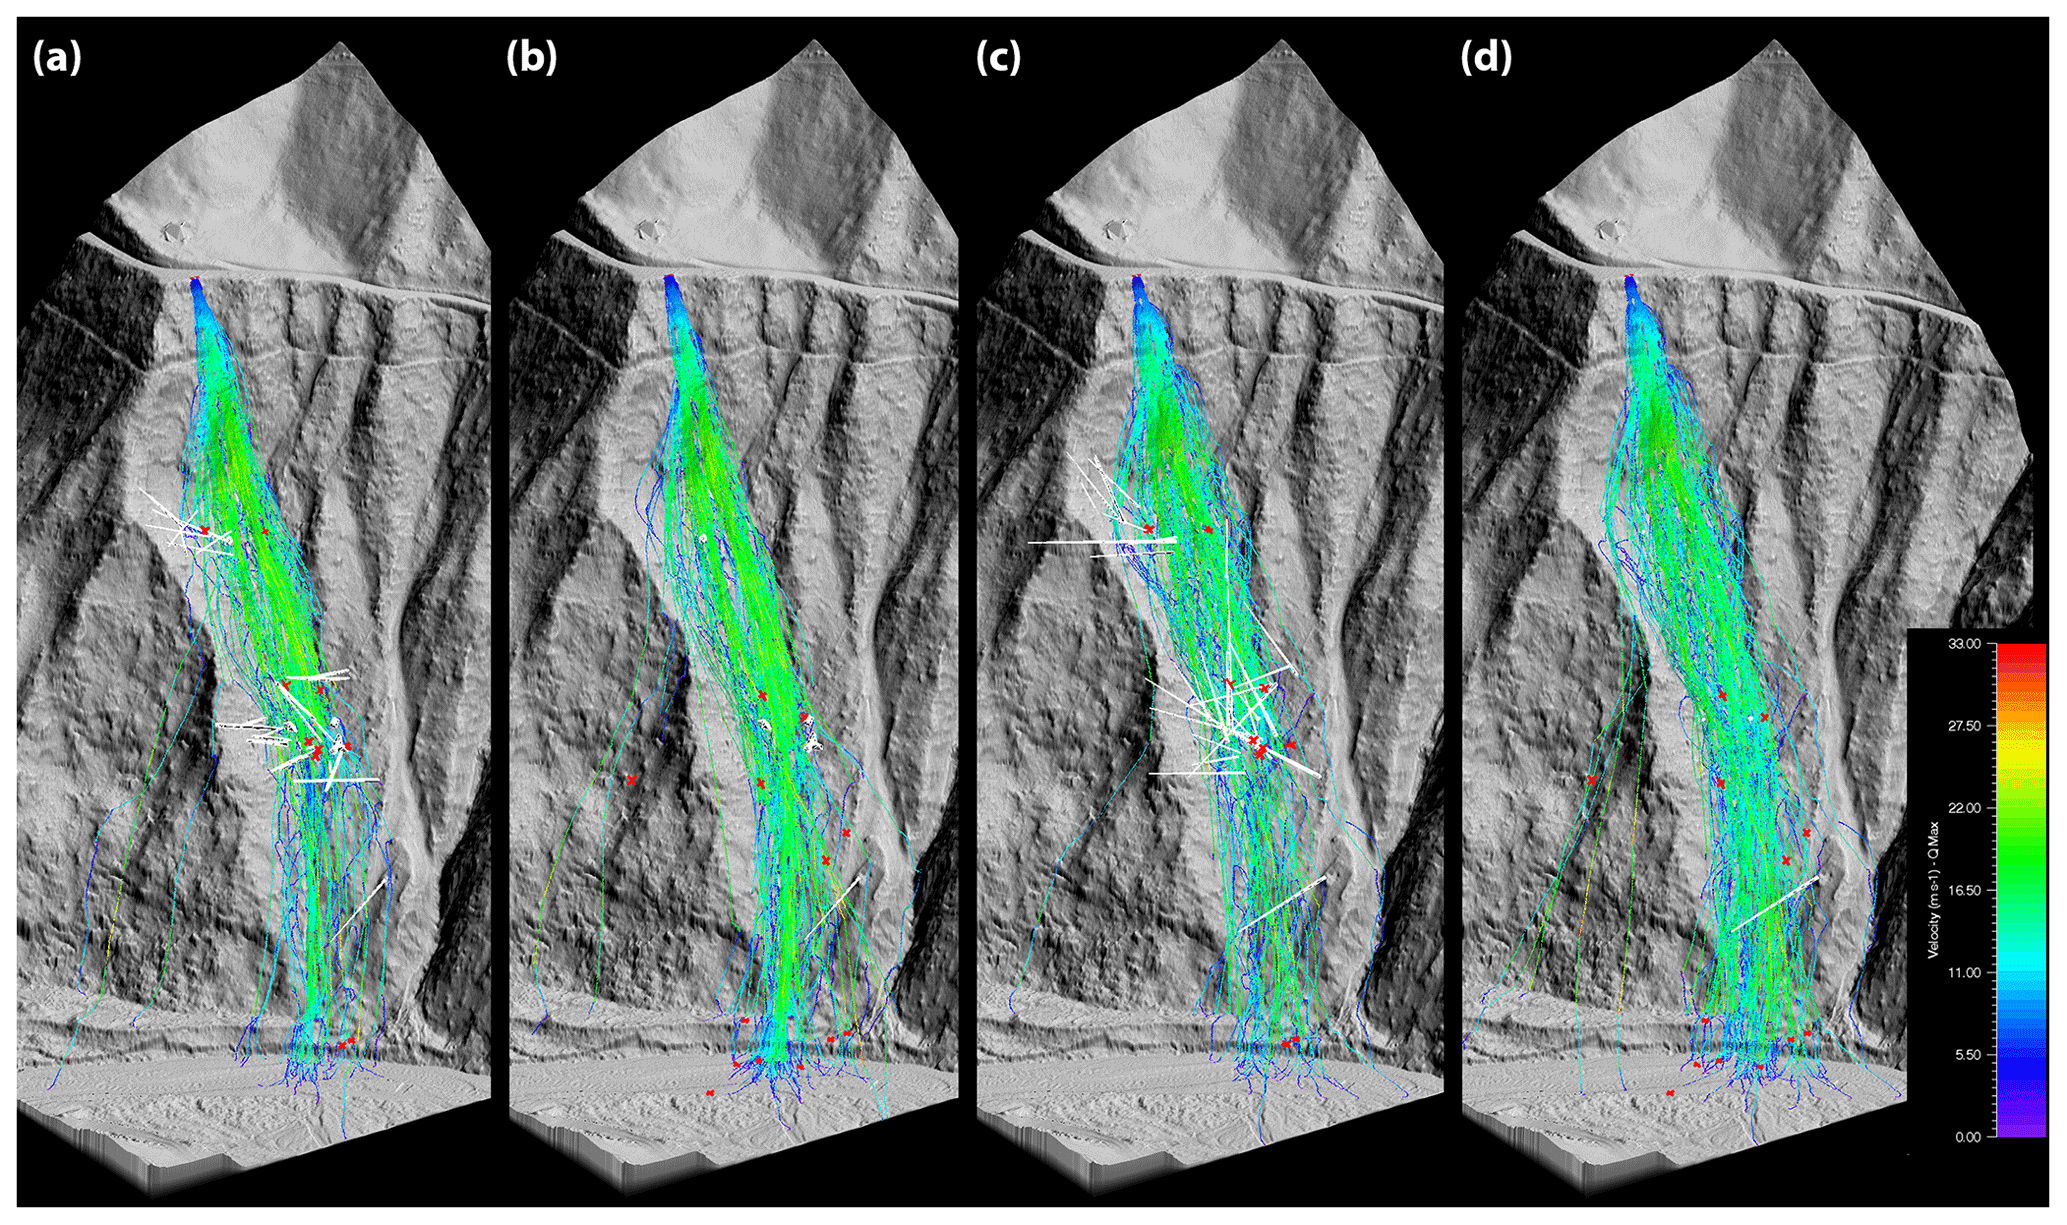
Figure 9Visualization of the RAMMS::Rockfall simulations for the EOTA rock and their corresponding experimental deposition points (red crosses). (a, b) Close-to-reality (CRF) setup, with forest information extracted via commercial TerraScan software from a high-resolution lidar point cloud complemented with on-site, manually measured, and digitized deadwood (white lines) for (a) the deadwood (DW) scenario and (b) the cleared-forest (CLR) scenario, which served as a calibration scenario. (c, d) Generic scenario, with standing trees randomly generated within RAMMS::Rockfall, based on estimates of the number of trees per hectare, the mean DBH, and its standard deviation for (c) the DW scenario and (d) the CLR scenario. The deadwood in panel (c) originates from the automatic deadwood generator (Ringenbach et al., 2022a).
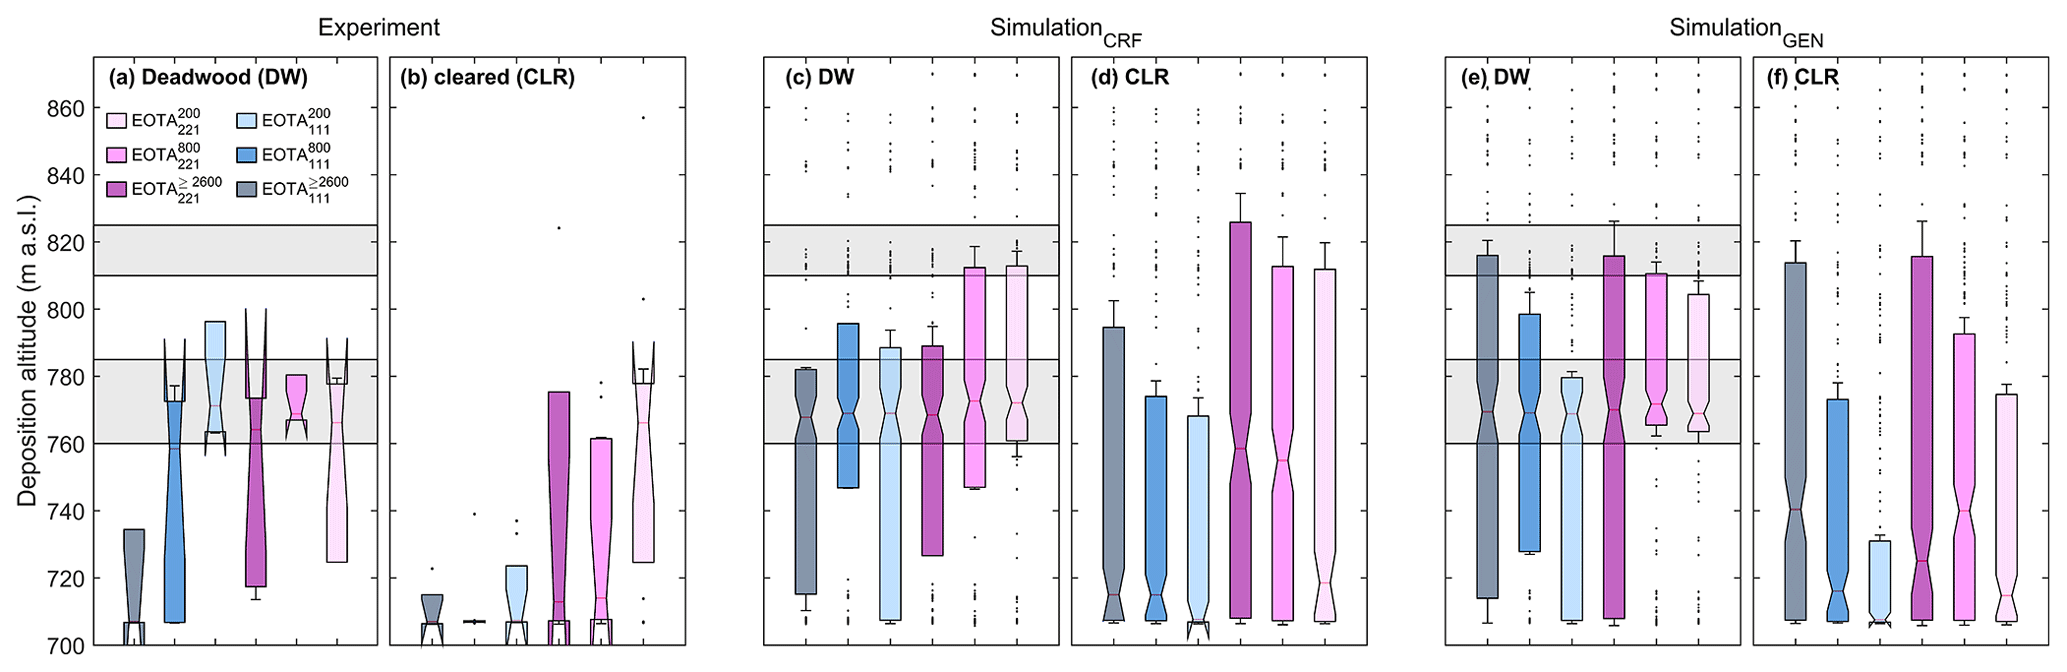
Figure 10Summary box plots of the block deposition altitudes for deadwood (DW) and cleared-forest (CLR) states, expressed as elevation (in m a.s.l.). (a) Experiment DW, (b) experiment CLR, (c) close-to-reality (CRF) simulation DW, (d) CRF simulation CLR, (e) simulation with generic forest setup and DW, and (f) GEN simulation CLR. The shaded areas depict the elevations of the two deadwood clusters, with the lower main deadwood cluster spanning 785–760 m a.s.l. The box plots feature the median values, with standard box sizes of one interquartile range (IQR) comprising 50 % of all values. The boxes are colored according to their weight and shape classifications. The whisker length is compared with standard box plots reduced to 0.1 ⋅ IQR.
Figure 11 depicts the mean rotational values for the experiments and for the two simulation setups, again for DW and CLR scenarios. The results show strong congruence for all weight and shape classes under investigation, independent of the level of detail of the input forest. A decrease in rotational speed with increasing moment of inertia is clearly visible.
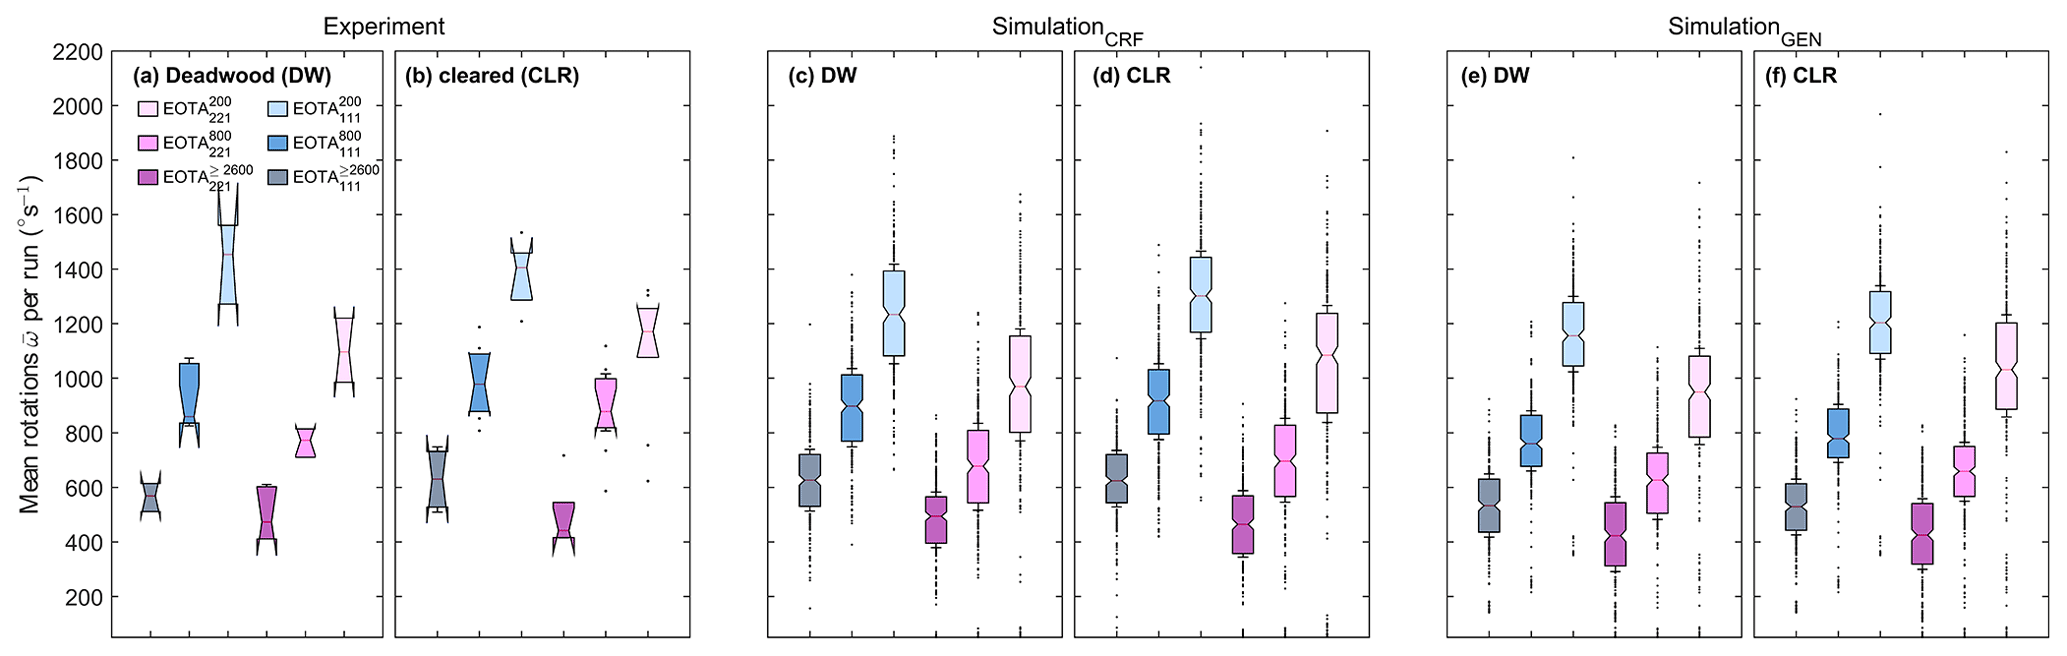
Figure 11Summary box plots of the rotational block velocities for deadwood (DW) and cleared-forest (CLR) states. (a) Experiment DW, (b) experiment CLR, (c) close-to-reality (CRF) simulation with DW, (d) CRF CLR, (e) generic forest setup (GEN) DW, and (f) GEN CLR. The box plots feature the median values, with standard box sizes of one interquartile range (IQR). The boxes are colored according to their weight and shape class classifications and whisker length = 0.1 ⋅ IQR.
Rockfall hazard assessments rely on the proper treatment of the interaction of the rock with any given opposing object. While the airborne phase is a mere oblique throw with gravity as the lone acting force, the highly nontrivial impact mechanics render rockfall problems into an erratic, almost – at least for the layperson – unpredictable process. Rock–ground interactions have received substantial attention in the civil engineering community, while research into the interaction with wood, particularly trees, has lagged behind for a long time. Recently, interest in this interaction was renewed from an experimental (Olmedo et al., 2015) and numerical point of view (Toe et al., 2017). However, the experimentally examined scales were done more from the perspective of theoretical interest. Advances in dendrogeomorphological studies enabled the spatiotemporal analysis of past rockfall events based on tree damage (Trappmann et al., 2013). A wide range of studies in this area has contributed to an improved understanding of rockfall–forest interactions, better validation of rockfall trajectory models, and thus more accurate hazard assessments (Stoffel and Perret, 2006; Trappmann et al., 2014; Corona et al., 2017). However, these previous studies did not provide insight into the core of the temporally resolved rock–impact problem. Here, we presented a multi-year experimental campaign focusing on full-scale, single-block rockfall experiments in a forest with deadwood clusters. This setup made it possible to examine the intricate interplay of rock–ground–forest interactions and their implications for kinematics by quantifying energy dissipation during these impacts. Full-scale experiments are inherently costly and complex, and rockfall experiments are no exception. The main advantage with respect to dendrogeomorphological studies is the wealth of data originating from such an experimental campaign and the comprehensive, detailed reconstruction of rockfall trajectories, justifying the large resource allocation. For 63 trajectories, we reported an exhaustive data inventory comprising the complete set of kinematic parameters combined with detailed information about every impact with soil and tree hit configurations.
4.1 A new facet of rock shape relevance
The experimental campaign, planned as a continuation of experiments in unobstructed terrain and hence featuring a strong focus on deadwood effects, yielded surprising new insights about a facet of rock shape relevance for rockfall propagation. In unobstructed terrain, platy-shaped rocks tend to exhibit a significantly higher lateral spread than more compact cubic rocks, leading to an increased hazard potential. This shape-dependent hazard potential is reversed in forested areas. When platy-shaped rocks descend forested slopes, they feature generally shorter runout distances than their mass-equivalent cubic counterparts. Over open land, their upright, wheel-like descending motion rotating around the shortest axis, featuring the highest moment of inertia, leads to wide, straight trajectories, often deviating from the line of steepest descent. In a forested environment, the chances are high that this configuration is disturbed at every single tree impact, often resulting in a sliding phase on the rock's flat side. Due to higher friction, platy-shaped rocks are then prone to stopping completely. In contrast, the behavior of cubic rocks differs, as the rock geometry features a symmetrical axis without a preferred configuration of travel. After a tree impact, the rock starts to spin around another axis and is easily remobilized downslope if the slope gradient is sufficiently high around the trees. While there is a lower probability of a tree hit for a platy-shaped rock than for a cubic rock due to the smaller cross section, the stopping effect of a single tree impact is higher for platy-shaped rocks. This shape effect is corroborated by comparing the rate at which rocks of the two shape classes passed the deadwood section. Under cleared conditions without deadwood, all rocks of the three cubic-shaped mass classes surpassed the former deadwood section, while a total of nine platy-shaped rocks were stopped in this section. This difference can be mainly attributed to the interplay of the larger frictional cross section while sliding after a tree hit, with the slightly lower slope inclination (α3=33∘), and the increased soil roughness within the former deadwood section left by the clearing work. Although the inclination and roughness also affected EOTA111 rocks, the sliding platy-shaped EOTA221 rocks were particularly impacted due to their lower center of mass.
4.2 Insights into rock–tree interactions
The exhaustive analysis of rock–tree interactions, for both deadwood and living trees, makes it possible to determine the minimum breaking energies for trees and deadwood of a given description, contributing valuable new data on this topic. For deadwood, for example, the comparison with values from large-scale laboratory experiments (Ammann, 2006) showed 1.7 times higher values for energy absorption capabilities in our real-world experiments. There are several reasons for the better performance of deadwood under realistic conditions. The entire natural impact configuration is dynamic, depending on the deadwood cluster, the exact geometrical impact direction and angle, and the freedom of logs to deflect and move skyward in contexts where they had room and are not as likely to be trapped and clamped. Thus, the energy is dissipated over a greater distance and against gravity, and both of these aspects seem to increase the energy capacity of the trunk. Venturing away from the reproducibility of lab setups, the main drawback of real-world experiments is the large variability in boundary conditions. The manifold observed breakage mechanisms play a role in the observed variability in breakage energy because a log absorbs more kinetic energy while bending until the shear forces in the log cause it to break. However, this bending process, as with the initial impact, is strongly influenced by geometric conditions, such as jamming behind trees or the specific impact location of the rock with respect to the deadwood log's clamping points. Furthermore, organic decay makes a log more brittle, which reduces the shear force capacity over time. As we observed rather fresh stems at the test site, the latter can be neglected in this case, although incorporating deadwood decay is an important issue in long-term forest management (Ringenbach et al., 2022a).
The data from our experiments can be used to further evaluate the energy absorption of living spruce and beech trees. Unlike in previous studies, we refrained from plotting a single relationship, and hence a lower limit, between survival and breakage. Instead, we presented an area between the lower limit of breakage and the upper limit of survival, where the increased breakage probability starts. We attribute the reported bandwidth of energy absorption capacities to different tree properties, stem rot, root size, tree vitality, or soil depth (e.g., Toe et al., 2017). This range is also slightly higher than previously reported values from large-scale experiments (Dorren and Berger, 2005). The referenced value from Dorren and Berger (2005) is based on silver fir trees in a similar experimental setup, where impacts led to the breakage of nine trees. To estimate absorption energies for other tree species, conversion factors were proposed at that time based on small-scale experiments. This rescaling can now be verified with the results of the present study. The comparison line in Fig. 6e shows that the present study expects absorption energies that are slightly higher for beech.
For the derived breakage criterion for spruce, there are two comparison possibilities, namely the values of Dorren and Berger (2005) – downscaled from silver fir to Norway spruce – and the results of the field campaigns of Lundström et al. (2009) and Kalberer et al. (2007), which involved impacting trees with a wedge-shaped trolley along wire ropes, mimicking rockfall. Here the literature values tend to be at the upper edge of or even above our proposed area of increased breakage probability (Fig. 6f). The shift towards lower energies for spruce is probably due to the absence of high-energy impacts on thick spruce trees in our study. There was only one impact >400 kJ on spruce with DBH >40 cm. This particular tree had already survived three hits of 122, 170, and 176 kJ without complete breakage, but the trunk most probably suffered structural damage. Therefore, we attribute the lower-energy absorption capacity to this sole supporting point of the fitted curve at higher energies, leading to lower confidence for high-energy behavior. Thus, the higher literature values are justifiable. In addition to the visible damage caused by impact, the root systems of trees that remain standing may also be affected by mechanical damage. Our observations suggest that some impacts caused a substantial displacement of the trunk, resulting in deformation and shifting of the entire root ball. This displacement may have an effect on the structural integrity of the tree and its ability to withstand future disturbances, even if the tree did not break during the initial loading. Although the majority of the estimated displacements were less than 20 cm, one particularly large displacement is displayed in Fig. 6f, which was roughly equivalent to the diameter of the tree trunk (49 cm). As a result, future studies should consider whether such trees may be more vulnerable to rockfall or windthrow damage as a result of the impact-induced root damage.
4.3 From field observations to numerical use
The integration of living and dead trees into numerical models is critical to fully represent realistic and relevant boundary conditions of rockfall simulations in mountainous regions. The simulations performed here demonstrate the importance of incorporating capabilities to represent realistic forest configurations. They also confirm the trade-off between universally applicable generic solutions versus more sophisticated, field-based input assessments. While the extensive input data of the close-to-reality forest (CRF) simulations performed better when directly compared with the experiment, generic solutions (GEN) can still serve as a powerful and rather inexpensive tool to expand those simulation capabilities to the regional scale. Nonetheless, the details of deadwood integration into numerical models have to be followed closely. A single, DBH-related energy threshold per standing tree might be enough, as most impacts happen in the lower, uniform section of a trunk, and its diameter at the impact location is usually reasonably close to its DBH. The situation is different for deadwood because the energy absorption capabilities differ greatly, depending on whether an impact happens at the deadwood base or close to the former tree top, where the diameter is small (in the low tens of centimeters). Future numerical implementations might need to accommodate this fact, either by detecting the diameter at the point of impact and adapting the energy threshold or by splitting the deadwood logs into several sections, each of equal diameter.
The forest rockfall retention capabilities were overestimated in our simulations, with the median deposition for large rocks located too far upslope. The accurate detection of tree diameter at impact locations, for both standing trees and deadwood, might rectify this shortcoming. Another explanation for the overestimation is the abovementioned deficiency in the single-tree detection of multi-stemmed beech with the applied detection algorithm. Figure 1c suggests that most trees were detected correctly. However, when small branches fill the gaps between the individual stems of multi-stemmed beech trees between 1 and 1.5 m above ground, it becomes almost impossible for the detection algorithms to depict reality. The consequences are greater for larger rocks than for smaller ones. Assuming a single beech is detected with a DBH =70 cm, instead of three trees with DBH =30 cm each, the kinetic energy required for its potential breakage is ≥1250 kJ, equaling an impacting velocity of v>28 m s−1 for a 3200 kg rock. The necessary breakage energy for a single beech with DBH =30 cm is roughly 235 kJ, meaning an impact velocity of 13 m s−1 for a 3200 kg rock, which was often exceeded. For smaller rock masses (m=200 kg), the algorithm detection problems are not significant. Realistically, the 235 kJ required to break a single multi-stemmed beech is unlikely to occur, as an impact speed ≥48 m s−1 would be necessary.
Small rock masses (m=200 kg), on the other hand, were not sufficiently retained by the simulated deadwood. The simulated rocks reached the base of the slope too often. A possible explanation could be that the minimal effective deadwood diameter of 20 cm was too large for the smaller rock masses. Another reason could be that the branches of the deadwood, which were not included in the simulations, affected the rocks during the experiments. Despite this discrepancy, the simulations still give an outlook for the protective capacity of the deadwood in a few years, after the branches have decayed. Finally, to fully represent a deadwood cluster, the possibility needs to be considered that loosely placed deadwood logs with a smaller moment of inertia than the rock move freely upon impact or are pushed away without breakage, as observed in the experiments. In contrast, in the model, the simulated deadwood logs acted as rigid bodies sticking to the ground and each other, leading to simulated breakage if the logs were thin. However, in some cases, the simulated trajectory ended due to an overestimated simulated friction between the stem and the ground.
4.4 Rockfall kinematics in forests
In agreement with the findings from previous experiments, the rock kinematics did not differ across shape and weight classes in unobstructed terrain. The steep acceleration section with almost no thick trees enabled a uniform acceleration phase for all the test rocks. This manifests in velocity values that hardly diverged in the observation screens S1–S5. This is an important prerequisite for valid comparison concerning the deadwood effect. The median velocity changes between the deadwood (DW) and cleared (CLR) scenarios showed variances larger than the 95th percentile. Owing to the quasi-binary nature of rock–tree interactions, i.e., hit or no-hit, the effect on a single trajectory is highly divergent. A standing forest, and also deadwood clusters, influence the rockfall trajectory in a stochastic manner. Current hazard assessments often rely on the 90–95th percentile as a cutoff criterion of rockfall simulations. The velocity decrease observed in the deadwood scenarios was more pronounced in this study (Fig. 5d). The sound incorporation of the impact physics and their effects on rockfall trajectories within the numerical models is an anteceding key requirement. This might become more important if the ongoing trend of hazard risk consideration continues. Such risk considerations incorporate the generally higher release probability of smaller rocks, which are in turn better retained by deadwood and other nature-based protection solutions.
The velocity reduction in lower-lying observation screens is clearly visible in the VRC95 % for the cubic-shaped rocks. This is yet another manifestation of the easier remobilization of cubic-shaped rocks in forests, as the EOTA rocks steadily increased their speed from screen S7 and the EOTA rocks from screen S8. A similar retrieval of kinetic energy was not observed for platy-shaped rocks, as the standing forest has a greater capacity to slow down and retain rocks of this shape. This demonstrates that the protective effect of deadwood rapidly decreased for cubic-shaped rocks with increasing distance below the deadwood cluster. The distance from S6 to S8 was 50 m, and the distance from S6 to S9 was 75 m. Most of the observed trajectories reaching the river level during the DW experiments followed a small, barely tree-stocked couloir. Therefore, a comparison with the maximum gap length for silvicultural measures (Frehner et al., 2005) is given. The proposed gap length of 40 m is slightly shorter than the observed distances, making this reserve meaningful, since the tree hit probability increased with the additional 10–25 m.
The presented in situ StoneNode data were an important aspect of the reconstruction methodology, and the values – although possibly site-specific – offer an easily accessible, high-precision quality check for any given rockfall simulation. The rotational data, in particular, represent highly accurate data streams, and the congruence between experiments and simulations increases the model plausibility. Engineering practice often relies on the qualitative reproduction of key features of the scenario under investigation but lacks the tools or the input data to proceed with more elaborate methods. Future calibration methods might include a fusion of machine learning algorithms with feedback loops on input parameters, such that the query for optimal model parameters could be additionally refined, thereby creating a pathway in which the presented data set could be foundational. The site dependence of rotational data can be assessed by comparing it with the corresponding data of Caviezel et al. (2021a, Table 2). The two data sets feature a similar reciprocal dependence with the mass or, more specifically, with the moment of inertia. Considering the damping effect due to the tree hits, the generally higher values reported here compared with those from the open slope might be surprising. The greater overall slope inclination (measured along a 145 m planar distance) at the Schraubach site (39.6∘) compared with that at the Chant Sura site (36.3∘) might explain this finding. For future estimates, the inclination should be considered in addition to the moment of inertia.
4.5 Are rockfall dynamics related to soil moisture?
Despite the presence of a forest stand on the test site, roughly two-thirds of the classified impacts were rock–soil interactions. This ratio might be site- and forest-density-specific to a certain extent, but it equally reveals the importance of understanding rock–soil interactions within forests. The decreasing maximum acceleration per impact with increasing soil moisture can be considered intuitive because the wetter the soil, the softer its surface, and the lower the resistance experienced by the rock during soil penetration. This supports the observation of deeper scarring depths in wetter soils by Vick et al. (2019). The lower Δv in wetter soils observed in our experiments is more surprising but is not a robust result. A reason for the non-robust results might be that only one soil moisture measurement was taken or that the already performed spatial crop of impacts to the area with presumed similar conditions was too wide. Altered soil parameters, due to changing climatic boundary conditions, might affect the loading cycles, according to Gerber (2019), and the runout distances (Vick et al., 2019). We argue that the change in the intra-soil parameter range is negligible compared with the importance of overall correct soil attribution and accurate representation of rock kinematics within rockfall models. However, a single correct ground parameter setting is – owing to the natural variability in the different soils and ground types – difficult to achieve. This is reflected by the slightly adapted parameters used to depict the observed forest soils in this study and those from Ringenbach et al. (2022c). The derived necessity of future sensitivity analysis or even Monte Carlo approaches would include the uncertainties raised by changing soil moisture.
In this work, we present a comprehensive experimental rockfall campaign comprising two rock shapes, three mass classes up to 3200 kg, and two states of the forest – with and without deadwood. The first key message relates to the unforeseen inverse rock shape effect compared with that in undisturbed open land; platy-shaped rocks are more affected by tree impacts, leading to a tilting away from their preferred wheel-like descending motion towards their flat side. This sliding leads to higher friction and shorter mean runout distances than observed with cubic-shaped rocks. The incorporation of rock shape into rockfall hazard assessments remains inevitable, though with an altered premise for forested slopes. The treatment of platy-shaped rocks moving through densely forested slopes now becomes questionable. Nonetheless, in this experiment, the highest observed velocity, the longest jump, and the greatest runout distance resulted from a platy-shaped rock that did not impact any trees. Forests suppress the lateral spreading of platy-shaped rocks only under the assumption of effective tree impacts. If no trees are hit or the rock is so large that the standing forest hardly influences its kinematics, then a lateral spread emerges again. A precise rockfall hazard assessment in forests requires, above all, a meticulous evaluation that considers not only tree density but also the locations of individual trees.
The second key message is that the observed protective effect of natural deadwood clusters is up to 1.7 times greater than the mean breakage work reported under laboratory conditions. This means that it is reasonable to adopt the previously reported hazard reduction potential for larger rock masses. However, as the absorption coefficient of 415 kJ m−2 indicates, for prevailing DBH distributions of mountain forests, the protection capacity of single logs becomes unessential when dealing with highly energetic rocks. Additionally, the presented data corroborate values from the existing literature for the energy absorption of living spruce and beech trees, and it expands the scarce data set on rock–tree impacts.
Finally, the presented data set is currently the most comprehensive data archive available for single-block rockfall in forests and can serve the geohazard community as a calibration benchmark for various processes relating to rockfall kinematics in forests. A large number of reported impacts and the extremely detailed trajectory information make it possible to test existing or newly developed impact models and to further scrutinize rock–obstacle impact behavior.
In conclusion, rock shape still matters, with platy- and cubic-shaped rocks behaving differently on unobstructed and forested slopes. Accurate rockfall hazard assessments demand the incorporation of horizontal and vertical forest structures as accurately as possible in order to obtain realistic deposition patterns. Further interdisciplinary research is needed to enlarge the energy ranges, deal with the temporal evolution of the protective deadwood capacity, and increase the detail and input capacities of standard numerical models.
The complete data set (deposition points, video footage, parameters of interest from every reconstructed trajectory, and lidar point clouds) is publicly available in the EnviDat repository (https://doi.org/10.16904/envidat.359; Ringenbach et al., 2022b).
AR and AC conceived the experiments. After forest inventories (AR) and optical UAV missions (planned and deployed by YB, AS, and AR), the experiments were carried out by all authors of the corresponding data repository (Ringenbach et al., 2022b). The second and third lidar UAV flights were conducted by AS and YB. AR edited the complete footage and reconstructed the rockfall trajectories. Based on the rockfall simulation (AR) and the data analysis (AR and AC), AR and AC wrote the paper, which was discussed and improved by all authors.
The contact author has declared that none of the authors has any competing interests.
Publisher’s note: Copernicus Publications remains neutral with regard to jurisdictional claims in published maps and institutional affiliations.
We acknowledge partial funding by the National Research Program “Sustainable Economy: resource-friendly, future-oriented, innovative” (NRP 73) from the Swiss National Science Foundation (grant no. 407340_172415). Many thanks are extended to the municipality of Schiers for allowing us to use the forest and to the Office for Forests and Natural Hazards (AWN), Region 1, for accompanying us. We also thank all the helping hands during fieldwork (who are also acknowledged as authors of the data repository), namely Guillaume Meyrat, Miguel Sanchez, Gregor Ortner, Alex Bast, Mario Guetg, Gregor Schmucki, Julian Bleiker, Natalie Brožová, Thomas Planzer, Michi Kuenz, Jessica Munch, and Sophia Völk. We thank Matthias Paintner, SacaleVision, for the unique photo documentation; Philip Mayer, ETH Zürich, for the latest StoneNode hardware and firmware updates; and Marco Collet, Silvio Burger, and Michael Hohl for enabling a waterproof StoneNode to be affixed and for the remounting of their batteries. We are grateful to Geobrugg AG, for the additional acceleration sensors; Hansueli Rhyner, for the rope safety devices and the always accident-free camera assembly, and LogBau AG for the crane truck transport, the considerable help with the large wheel loaders, and the precision with which the work carried out with them was done. We extend our gratitude to HeliAir, for the rock transportation and deadwood installations; ROTEX Helicopter AG, for the removal of the logs; Christian Ginzler, for organizing the first Aeroscout lidar flights and for, thankfully, reacting to our calls for assistance despite having very short notice; and Mauro Marty, for the help with the point cloud processing. Finally, we are grateful to Melissa Dawes for proofreading this work.
This research has been supported by the Schweizerischer Nationalfonds zur Förderung der Wissenschaftlichen Forschung (grant no. 407340_172415).
This paper was edited by Niels Hovius and reviewed by Christine Moos and Louise M. Vick.
Abegg, M., Allgaier Leuch, B., Düggelin, C., and Brändli, U.-B.: Die Waldbiodiversität entwickelt sich weiterhin positiv, Wald und Holz, 102, 27–31, 2021. a
Ammann, M.: Schutzwirkung abgestorbener Bäume gegen Naturgefahren, Eidg. Forschungsanstalt für Wald Schnee und Landschaft WSL, Birmensdorf, ISBN 3-905621-34-7, 2006. a, b
Borella, J. W., Quigley, M., and Vick, L.: Anthropocene rockfalls travel farther than prehistoric predecessors, Sci. Adv., 2, e1600969, https://doi.org/10.1126/sciadv.1600969, 2016. a
Bourrier, F., Dorren, L. K. A., and Berger, F.: Full scale field tests on rockfall impacting trees felled transverse to the slope, in: Conference proceedings/12th Congress Interpraevent, edited by: Koboltschnig, G. and Huebl, J., 643–650, International Research Society INTERPRAEVENT, Klagenfurt, http://www.interpraevent.at/palm-cms/upload_files/Publikationen/Tagungsbeitraege/2012_2_643.pdf (last access: 4 August 2023), 2012. a, b
Bourrier, F., Toe, D., Garcia, B., Baroth, J., and Lambert, S.: Experimental investigations on complex block propagation for the assessment of propagation models quality, Landslides, 18, 639–654, https://doi.org/10.1007/s10346-020-01469-5, 2021. a
Brändli, U.-B., Abegg, M., and Leuch, B.: Schweizerisches Landesforstinventar: Ergebnisse der vierten Erhebung 2009–2017, Eidg. Forschungsanstalt WSL and BAFU, Birmensdorf and Bern, https://doi.org/10.16904/envidat.146, 2020. a
Caviezel, A., Schaffner, M., Cavigelli, L., Niklaus, P., Buhler, Y., Bartelt, P., Magno, M., and Benini, L.: Design and Evaluation of a Low-Power Sensor Device for Induced Rockfall Experiments, IEEE T. Instrum. Meas., 67, 767–779, https://doi.org/10.1109/TIM.2017.2770799, 2018. a
Caviezel, A., Lu, G., Demmel, S. E., Ringenbach, A., Bühler, Y., Christen, M., and Bartelt, P.: RAMMS::ROCKFALL – a modern 3-dimensional simulation tool calibrated on real world data, in: 53rd US rock mechanics/geomechanics symposium, edited by: American Rock Mechanics Association, 19–223, https://www.dora.lib4ri.ch/wsl/islandora/object/wsl:22147 (last access: 4 August 2023), 2019. a
Caviezel, A., Ringenbach, A., Demmel, S. E., Dinneen, C. E., Krebs, N., Bühler, Y., Christen, M., Meyrat, G., Stoffel, A., Hafner, E., Eberhard, L. A., von Rickenbach, D., Simmler, K., Mayer, P., Niklaus, P. S., Birchler, T., Aebi, T., Cavigelli, L., Schaffner, M., Rickli, S., Schnetzler, C., Magno, M., Benini, L., and Bartelt, P.: The relevance of rock shape over mass – implications for rockfall hazard assessments, Nat. Commun., 12, 15, https://doi.org/10.1038/s41467-021-25794-y, 2021a. a, b, c, d
Caviezel, A., Ringenbach, A., Sanchez, M., Christen, M., Mayer, P., Michele, M., Benini, L., and Bartelt, P.: In-situ kinematic tracking via rugged multi-sensor MEMS units, in: 25th International Congress of Theoretical and Applied Mechanics, edited by: Corigliano, A., 2634–2635, Milano, ISBN 978-83-65550-31-6, 2021b. a
Corona, C., Lopez-Saez, J., Favillier, A., Mainieri, R., Eckert, N., Trappmann, D., Stoffel, M., Bourrier, F., and Berger, F.: Modeling rockfall frequency and bounce height from three-dimensional simulation process models and growth disturbances in submontane broadleaved trees, Geomorphology, 281, 66–77, https://doi.org/10.1016/j.geomorph.2016.12.019, 2017. a
Costa, M., Marchi, N., Bettella, F., Bolzon, P., Berger, F., and Lingua, E.: Biological Legacies and Rockfall: The Protective Effect of a Windthrown Forest, Forests, 12, 1141, https://doi.org/10.3390/f12091141, 2021. a
Dorren, L. K.: Rockyfor3D: Description of the complete 3D rockfall model, https://www.ecorisq.org/publications/tools-manuals/rockyfor3d-user-manual/3-english/file (last access: 4 August 2023), 2012. a
Dorren, L. K. A. and Berger, F.: Stem breakage of trees and energy dissipation during rockfall impacts, Tree Physiol., 26, 63–71, https://doi.org/10.1093/treephys/26.1.63, 2005. a, b, c, d, e
Dupire, S., Bourrier, F., Monnet, J.-M., Bigot, S., Borgniet, L., Berger, F., and Curt, T.: Novel quantitative indicators to characterize the protective effect of mountain forests against rockfall, Ecol. Indic., 67, 98–107, https://doi.org/10.1016/j.ecolind.2016.02.023, 2016. a
Dupire, S., Toe, D., Barré, J.-B., Bourrier, F., and Berger, F.: Harmonized mapping of forests with a protection function against rockfalls over European Alpine countries, Appl. Geogr., 120, 102221, https://doi.org/10.1016/j.apgeog.2020.102221, 2020. a
ETAG 027: Guidline for European Technical Approval of Falling Rock Protection Kits, https://www.eota.eu/en-GB/content/etags-used-as-ead/26/ (last access: 27 February 2018), 2013. a
Federal Office of Meteorology and Climatology MeteoSwiss: SwissMetNet: Das Referenzmessnetz der MeteoSchweiz, https://www.meteoschweiz.admin.ch/dam/jcr:f84ad388-7367-47c6-b6cd-d12da56e4539/SwissMetNetDasReferenzmessnetzDerMeteoSchweiz.pdf (last access: 4 August 2023), 2018. a
Frehner, M., Wasser, B., Schwitter, R., and Schweiz. Bundesamt für Umwelt, Wald und Landschaft: Nachhaltigkeit und Erfolgskontrolle im Schutzwald: Wegleitung für Pflegemassnahmen in Wäldern mit Schutzfunktion, Vollzug Umwelt, BUWAL, Bern, https://www.bafu.admin.ch/dam/bafu/de/dokumente/wald-holz/uv-umwelt-vollzug/nachhaltigkeit_underfolgskontrolleimschutzwald2005.pdf.download.pdf/nachhaltigkeit_underfolgskontrolleimschutzwald2005.pdf (last access: 4 August 2023), 2005. a
Fuhr, M., Bourrier, F., and Cordonnier, T.: Protection against rockfall along a maturity gradient in mountain forests, Forest Ecol. Manag., 354, 224–231, https://doi.org/10.1016/j.foreco.2015.06.012, 2015. a
Gerber, W.: Naturgefahr Steinschlag – Erfahrungen und Erkenntnisse, vol. 74, Eidg. Forschungsanstalt für Wald Schnee und Landschaft WSL, Birmensdorf, https://www.dora.lib4ri.ch/wsl/islandora/object/wsl:19475/datastream/PDF/Gerber-2019-Naturgefahr_Steinschlag_-_Erfahrungen_und_Erkenntnisse-(published_version).pdf (last access: 4 August 2023), 2019. a
Getzner, M., Gutheil-Knopp-Kirchwald, G., Kreimer, E., Kirchmeir, H., and Huber, M.: Gravitational natural hazards: Valuing the protective function of Alpine forests, Forest Policy Econ., 80, 150–159, https://doi.org/10.1016/j.forpol.2017.03.015, 2017. a
Kalberer, M., Ammann, M., and Jonsson, M.: Mechanische Eigenschaften der Fichte: Experimente zur Analyse von Naturgefahren | Mechanical properties of Norway spruce: Experiments for the analysis of natural hazards, Schweizerische Zeitschrift fur Forstwesen, 158, 166–175, https://doi.org/10.3188/szf.2007.0166, 2007. a, b, c
Lachat, T., Bouget, C., Bütler, R., and Müller, J.: Deadwood: quantitative and qualitative requirements for the conservation of saproxylic biodiversity, in: Integrative approaches as an opportunity for the conservation of forest biodiversity, edited by: Kraus, D. and Krumm, F., 92–103, ISBN 978-952-5980-07-3, 2013. a
Lague, D., Brodu, N., and Leroux, J.: Accurate 3D comparison of complex topography with terrestrial laser scanner: Application to the Rangitikei canyon (N-Z), ISPRS J. Photogramm., 82, 10–26, https://doi.org/10.1016/j.isprsjprs.2013.04.009, 2013. a
Lanfranconi, C., Sala, G., Frattini, P., Crosta, G. B., and Valagussa, A.: Assessing the rockfall protection efficiency of forests at the regional scale, Landslides, 17, 2703–2721, https://doi.org/10.1007/s10346-020-01458-8, 2020. a
Leine, R. I., Schweizer, A., Christen, M., Glover, J., Bartelt, P., and Gerber, W.: Simulation of rockfall trajectories with consideration of rock shape, Multibody Syst. Dyn., 32, 241–271, https://doi.org/10.1007/s11044-013-9393-4, 2014. a
Leine, R. I., Capobianco, G., Bartelt, P., Christen, M., and Caviezel, A.: Stability of rigid body motion through an extended intermediate axis theorem: application to rockfall simulation, Multibody Syst. Dyn., 79, 444, https://doi.org/10.1007/s11044-021-09792-y, 2021. a
Lu, G., Caviezel, A., Christen, M., Demmel, S. E., Ringenbach, A., Bühler, Y., Dinneen, C. E., Gerber, W., and Bartelt, P.: Modelling rockfall impact with scarring in compactable soils, Landslides, 64, 41, https://doi.org/10.1007/s10346-019-01238-z, 2019. a, b
Lu, G., Ringenbach, A., Caviezel, A., Sanchez, M., Christen, M., and Bartelt, P.: Mitigation effects of trees on rockfall hazards: does rock shape matter?, Landslides, 50, 1689, https://doi.org/10.1007/s10346-020-01418-2, 2020. a, b, c
Lundström, T., Jonsson, M. J., Volkwein, A., and Stoffel, M.: Reactions and energy absorption of trees subject to rockfall: a detailed assessment using a new experimental method, Tree Physiol., 29, 345–359, https://doi.org/10.1093/treephys/tpn030, 2009. a, b
Mayer, P., Magno, M., Schnetzler, C., and Benini, L.: EmbedUWB: Low Power Embedded High-Precision and Low Latency UWB Localization, in: 2019 IEEE 5th World Forum on Internet of Things (WF-IoT), edited by: IEEE, 519–523, https://doi.org/10.1109/WF-IoT.2019.8767241, 2019. a
Mayer, P., Rogge, R., Caviezel, A., Munch, J., Ringenbach, A., Magno, M., and Benini, L.: Design and Evaluation of a LoRa Controlled Rugged Multisensor Unit for Induced Rockfall Experiments, in: Proceedings of the 2023 9th IEEE International Workshop on Advances in Sensors and Interfaces (IWASI), https://doi.org/10.1109/IWASI58316.2023.10164375, 2023. a
Moos, C., Dorren, L., and Stoffel, M.: Quantifying the effect of forests on frequency and intensity of rockfalls, Nat. Hazards Earth Syst. Sci., 17, 291–304, https://doi.org/10.5194/nhess-17-291-2017, 2017. a, b
Niklaus, P., Birchler, T., Aebi, T., Schaffner, M., Cavigelli, L., Caviezel, A., Magno, M., and Benini, L.: StoneNode: A low-power sensor device for induced rockfall experiments, in: 2017 IEEE Sensors Applications Symposium (SAS), 1–6, IEEE, https://doi.org/10.1109/SAS.2017.7894081, 2017. a
Noël, F., Cloutier, C., Jaboyedoff, M., and Locat, J.: Impact-Detection Algorithm That Uses Point Clouds as Topographic Inputs for 3D Rockfall Simulations, Geosciences, 11, 188, https://doi.org/10.3390/geosciences11050188, 2021. a
Noël, F., Jaboyedoff, M., Caviezel, A., Hibert, C., Bourrier, F., and Malet, J.-P.: Rockfall trajectory reconstruction: a flexible method utilizing video footage and high-resolution terrain models, Earth Surf. Dynam., 10, 1141–1164, https://doi.org/10.5194/esurf-10-1141-2022, 2022. a, b, c
Olmedo, I., Bourrier, F., Bertrand, D., Toe, D., Berger, F., and Limam, A.: Experimental analysis of the response of fresh wood stems subjected to localized impact loading, Wood Sci. Technol., 49, 623–646, https://doi.org/10.1007/s00226-015-0713-0, 2015. a
Olschewski, R., Bebi, P., Teich, M., Wissen Hayek, U., and Grêt-Regamey, A.: Avalanche protection by forests – A choice experiment in the Swiss Alps, Forest Policy Econ., 15, 108–113, https://doi.org/10.1016/j.forpol.2011.10.002, 2012. a
Rammer, W., Brauner, M., Dorren, L. K. A., Berger, F., and Lexer, M. J.: Evaluation of a 3-D rockfall module within a forest patch model, Nat. Hazards Earth Syst. Sci., 10, 699–711, https://doi.org/10.5194/nhess-10-699-2010, 2010. a
Ringenbach, A., Bebi, P., Bartelt, P., Rigling, A., Christen, M., Bühler, Y., Stoffel, A., and Caviezel, A.: Modeling deadwood for rockfall mitigation assessments in windthrow areas, Earth Surf. Dynam., 10, 1303–1319, https://doi.org/10.5194/esurf-10-1303-2022, 2022a. a, b, c, d
Ringenbach, A., Schmucki, G. R., Meyrat, G., Bebi, P., Ortner, G., Brožová, N., Munch, J., Völk, S., Stihl, E., Bast, A., Simeon, C., Bleiker, J., Guetg, M., Moreno, M. A. S., Mayer, P., and Caviezel, A.: Shape still matters – experimental quantification of deadwood effects on rockfall dynamics, [data set], https://doi.org/10.16904/envidat.359, 2022b. a, b
Ringenbach, A., Stihl, E., Bühler, Y., Bebi, P., Bartelt, P., Rigling, A., Christen, M., Lu, G., Stoffel, A., Kistler, M., Degonda, S., Simmler, K., Mader, D., and Caviezel, A.: Full-scale experiments to examine the role of deadwood in rockfall dynamics in forests, Nat. Hazards Earth Syst. Sci., 22, 2433–2443, https://doi.org/10.5194/nhess-22-2433-2022, 2022c. a, b, c, d, e
Schütz, M.: potree, GitHub [code], https://github.com/potree/potree (last access: 4 August 2023), 2021. a
Schütz, M., Ohrhallinger, S., and Wimmer, M.: Fast Out-of-Core Octree Generation for Massive Point Clouds, Comput. Graph. Forum, 39, 1–13, https://doi.org/10.1111/cgf.14134, 2020. a
Seidl, R., Thom, D., Kautz, M., Martin-Benito, D., Peltoniemi, M., Vacchiano, G., Wild, J., Ascoli, D., Petr, M., Honkaniemi, J., Lexer, M. J., Trotsiuk, V., Mairota, P., Svoboda, M., Fabrika, M., Nagel, T. A., and Reyer, C. P. O.: Forest disturbances under climate change, Nat. Clim. Change, 7, 395–402, https://doi.org/10.1038/nclimate3303, 2017. a
Soininen, A.: TerraScan, https://terrasolid.com/guides/user-guides/#terrascan (last access: 4 August 2023), 2021. a
Stoffel, M. and Perret, S.: Reconstructing past rockfall activity with tree rings: Some methodological considerations, Dendrochronologia, 24, 1–15, https://doi.org/10.1016/j.dendro.2006.04.001, 2006. a
Stoffel, M., Wehrli, A., Kühne, R., Dorren, L. K. A., Perret, S., and Kienholz, H.: Assessing the protective effect of mountain forests against rockfall using a 3D simulation model, Forest Ecol. Manag., 225, 113–122, https://doi.org/10.1016/j.foreco.2005.12.030, 2006. a
swisstopo: Geological Map of Switzerland 1:500 000, https://www.swisstopo.admin.ch/en/maps-data-online/maps-geodata-online/geological-data-online.html (last access: 3 July 2023), 2005. a
Toe, D., Bourrier, F., Olmedo, I., Monnet, J.-M., and Berger, F.: Analysis of the effect of trees on block propagation using a DEM model: implications for rockfall modelling, Landslides, 14, 1603–1614, https://doi.org/10.1007/s10346-017-0799-6, 2017. a, b, c
Trappmann, D., Corona, C., and Stoffel, M.: Rolling stones and tree rings, Progress in Physical Geography: Earth and Environment, 37, 701–716, https://doi.org/10.1177/0309133313506451, 2013. a
Trappmann, D., Stoffel, M., and Corona, C.: Achieving a more realistic assessment of rockfall hazards by coupling three-dimensional process models and field-based tree-ring data, Earth Surf. Proc. Land., 39, 1866–1875, https://doi.org/10.1002/esp.3580, 2014. a
Vick, L. M., Zimmer, V., White, C., Massey, C., and Davies, T.: Significance of substrate soil moisture content for rockfall hazard assessment, Nat. Hazards Earth Syst. Sci., 19, 1105–1117, https://doi.org/10.5194/nhess-19-1105-2019, 2019. a, b, c
Volkwein, A. and Klette, J.: Semi-automatic determination of rockfall trajectories, Sensors-Basel, 14, 18187–18210, https://doi.org/10.3390/s141018187, 2014. a
Woltjer, M., Rammer, W., Brauner, M., Seidl, R., Mohren, G. M. J., and Lexer, M. J.: Coupling a 3D patch model and a rockfall module to assess rockfall protection in mountain forests, J. Environ. Manage., 87, 373–388, https://doi.org/10.1016/j.jenvman.2007.01.031, 2008. a