the Creative Commons Attribution 4.0 License.
the Creative Commons Attribution 4.0 License.
 | 17 Aug 2023
Ice-buttressing-controlled rock slope failure on a cirque headwall, Lake District, UK
John D. Jansen
Teng Su
Jane Lund Andersen
Mads Faurschou Knudsen
Rock slope failures in the Lake District, UK, have been associated with deglacial processes after the Last Glacial Maximum, but the controls and timing of the failures remain poorly known. A cirque headwall failure was investigated to determine failure mechanisms and timing. The translated wedge of rock is thin and lies on a steep failure plane, yet the friable strata were not disrupted by downslope movement. Fault lines and a failure surface, defining the wedge, were used as input to a numerical model of rock wedge stability. Various failure scenarios indicated that the slope was unstable and would have failed catastrophically if not supported by glacial ice in the base of the cirque. The amount of ice required to buttress the slope is insubstantial, indicating likely failure during the thinning of the cirque glacier. We propose that, as the ice thinned, the wedge was lowered slowly down the cirque headwall, gradually exposing the failure plane. A cosmogenic 10Be surface exposure age of 18.0±1.2 ka from the outer surface of the wedge indicates Late Devensian de-icing of the backwall of the cirque, with a second exposure age from the upper portion of the failure plane yielding 12.0±0.8 ka. The 18.0±1.2 ka date is consistent with a small buttressing ice mass being present in the cirque at the time of regional deglaciation. The exposure age of 12.0±0.8 ka represents a minimum age, as the highly fractured surface of the failure plane has experienced post-failure mass-wasting. Considering the chronology, it appears unlikely that the cirque was reoccupied by a substantial ice mass during the Younger Dryas stadial.
- Article
(5523 KB) - Full-text XML
-
Supplement
(1053 KB) - BibTeX
- EndNote


There are at least 84 known or suspected rock slope failures (RSFs) in the Lake District of NW England that have been associated with the Late Devensian glaciation (Marine Isotope Stage 2; Wilson et al., 2004; Jarman and Wilson, 2015a; Wilson and Jarman, 2022). Such RSFs often are termed “paraglacial”, as they “are part of, or influenced by, the transition from glacial conditions to non-glacial conditions” (Ballantyne, 2002; McColl, 2012). However, the relationship between glaciation, deglaciation, and the occurrence of RSFs remains far from resolved. This paper provides a contribution to further understanding of the topic. While a few highly modified landforms have been identified tentatively as RSFs and related to time periods before the Last Glacial Maximum (LGM; circa 26.5 to 19 ka; Clark et al., 2009; Jarman and Wilson, 2015b), the majority of Lake District RSFs have been associated with the end of the Dimlington Stadial (see Sect. 2) and the final downwasting of the Late Devensian ice sheet within NW England. At that time, potential RSFs could have been fully supported or partially supported by residual ice masses in topographic lows. Alternatively, some RSFs could have occurred (Wilson, 2005) following the Scottish Readvance (circa 19.3–18.2 ka; Chiverrell et al., 2018) and the Younger Dryas stadial (12.9–11.2 ka; Rasmussen et al., 2006). However, only one disintegrated RSF has been dated. In contrast, those that represent steep-slope deformation, or arrested slides, are of unknown age (Jarman and Wilson, 2015b). An arrested hillslope failure occurs when the slipped mass is not evacuated from the source area (Jarman, 2005) but is retained on the slope of the footwall. The role of glacial ice in buttressing rock slopes, and thereby preventing failure (Whalley et al., 1983; Holm et al., 2004; Cossart et al., 2008; Le Roux et al., 2009; Allen et al., 2010; Hilger et al., 2018), is largely speculative (Ballantyne, 2002; Jarman and Wilson, 2015b; Cody et al., 2018; Hartmeyer et al., 2020) and controversial (McColl et al., 2010), as are the mechanics of slope failure in situations where ice support progressively diminishes (McColl and Davies, 2013; Klimeŝ et al., 2021; Cave and Ballantyne, 2016). The latter two generic issues are the primary focus of this paper.
Glacial erosion can steepen cirque headwalls to the extent that faulted- and/or fractured-rock slopes become unstable (Sass, 2005; Moore et al., 2009) if not ice-supported. In addition, the way slopes fail can provide insight to whether ice was present during the slope failure. If ice-buttressed failures can be dated, then RSFs provide a source of information on the timing of the final ice retreat. Here, an arrested (sensu Jarman, 2005) translational RSF is described and dated, and the likely controls on the failure are defined and modelled. We test the hypothesis that “a steep, faulted, and unstable rock slope has experienced buttressing by glacial ice”. Our study area, which has not been previously identified as a RSF site, is within Great Coum (54.3923∘ N, 2.6057∘ W), a small cirque within the southern Shap Fells to the west of the Lune gorge (Fig. 1). A neighbouring cirque is named Little Coum. The Lune gorge (south of Tebay; Fig. 2) separates the southerly extension of the Shap Fells to the west from the Howgill Fells to the east. The site details and glacial context are described below.
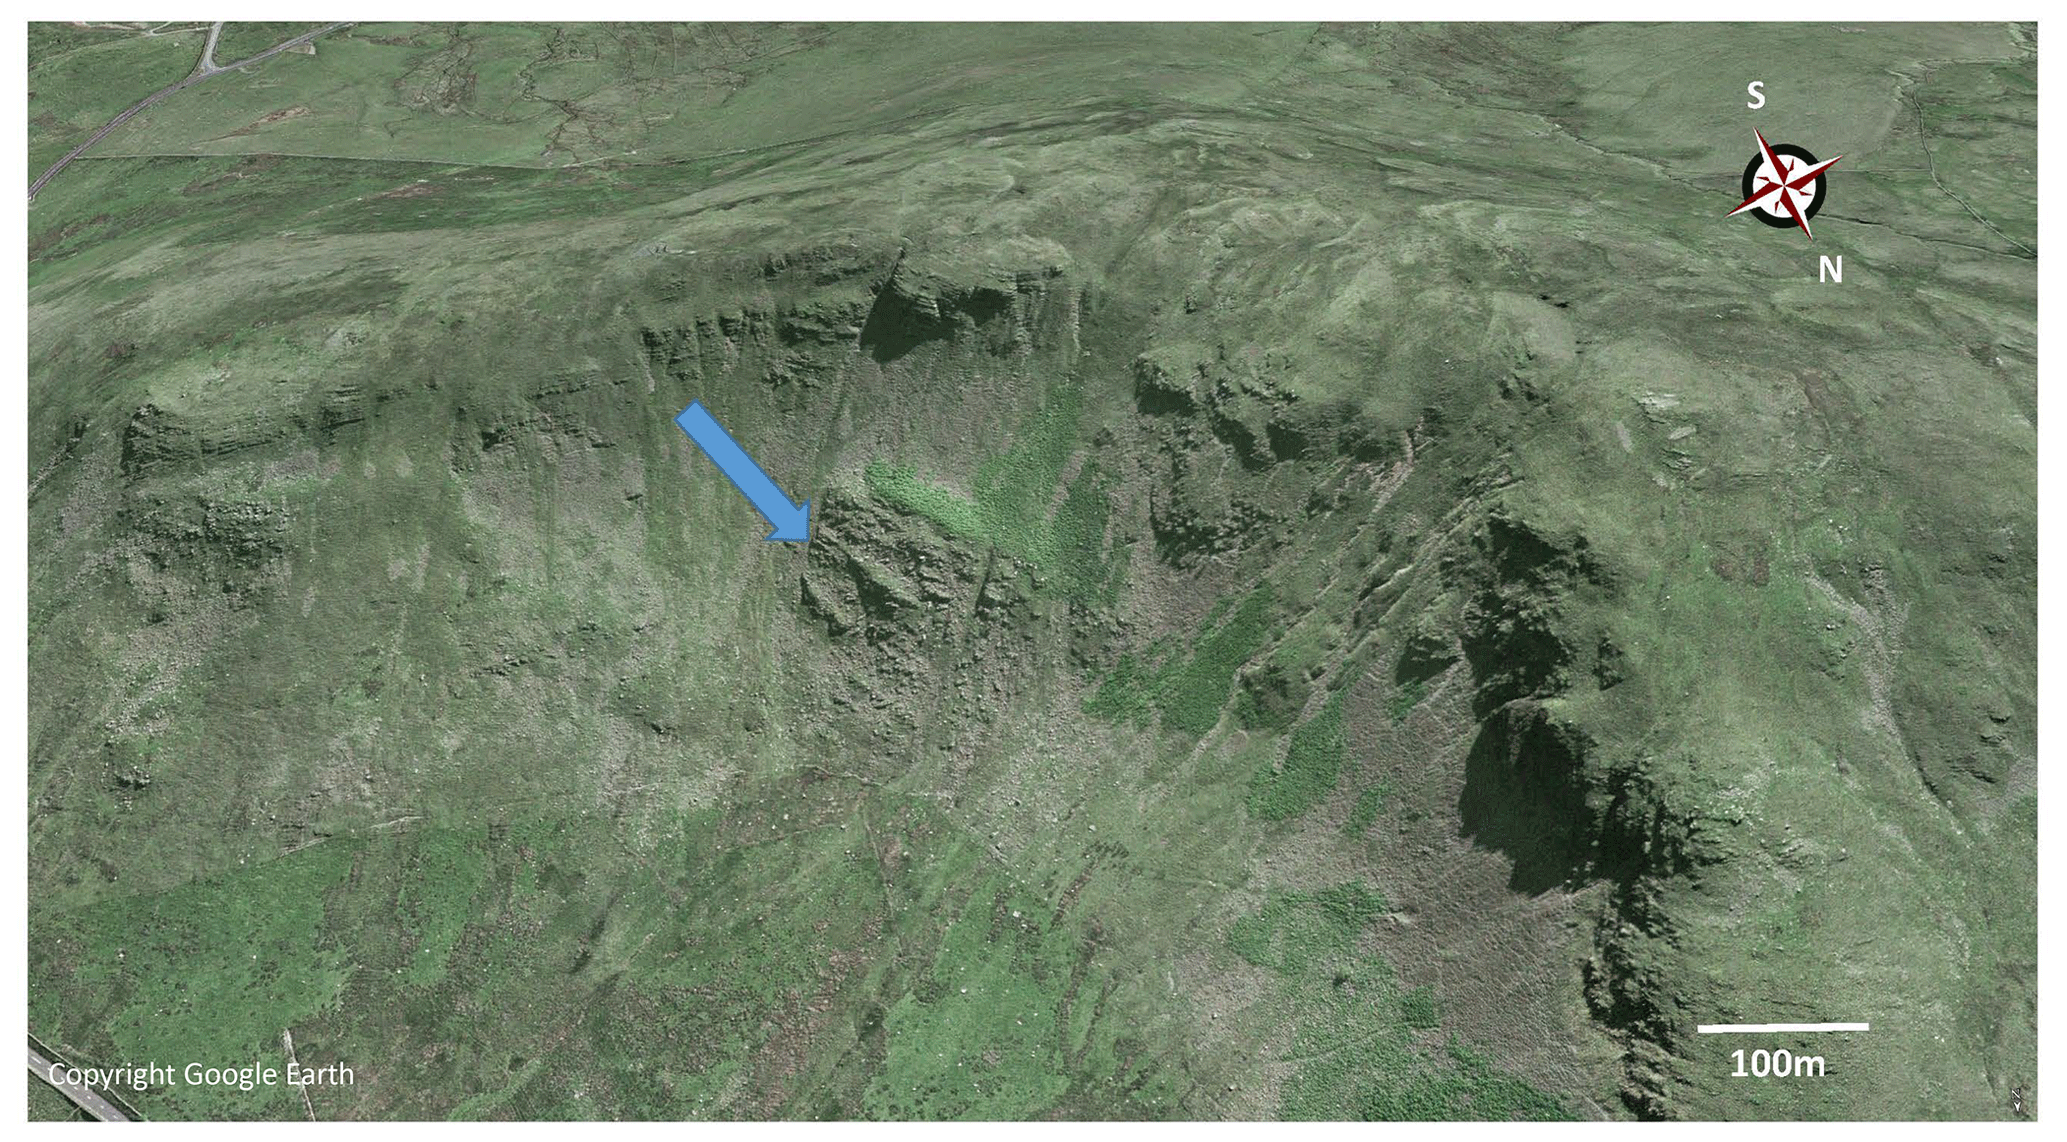
Figure 1Oblique aerial view, looking southwestward, into Great Coum. The RSF is indicated by the arrow. The green grassy tread of the RSF (just above the arrow) is in the sunlight below the cliffed headwall (in the shadow). The breadth of the RSF is between 125 and 180 m. Little Coum is just out of view to the right. The base image is from © Google Earth 2014. The scale bar applies to the middle distance.
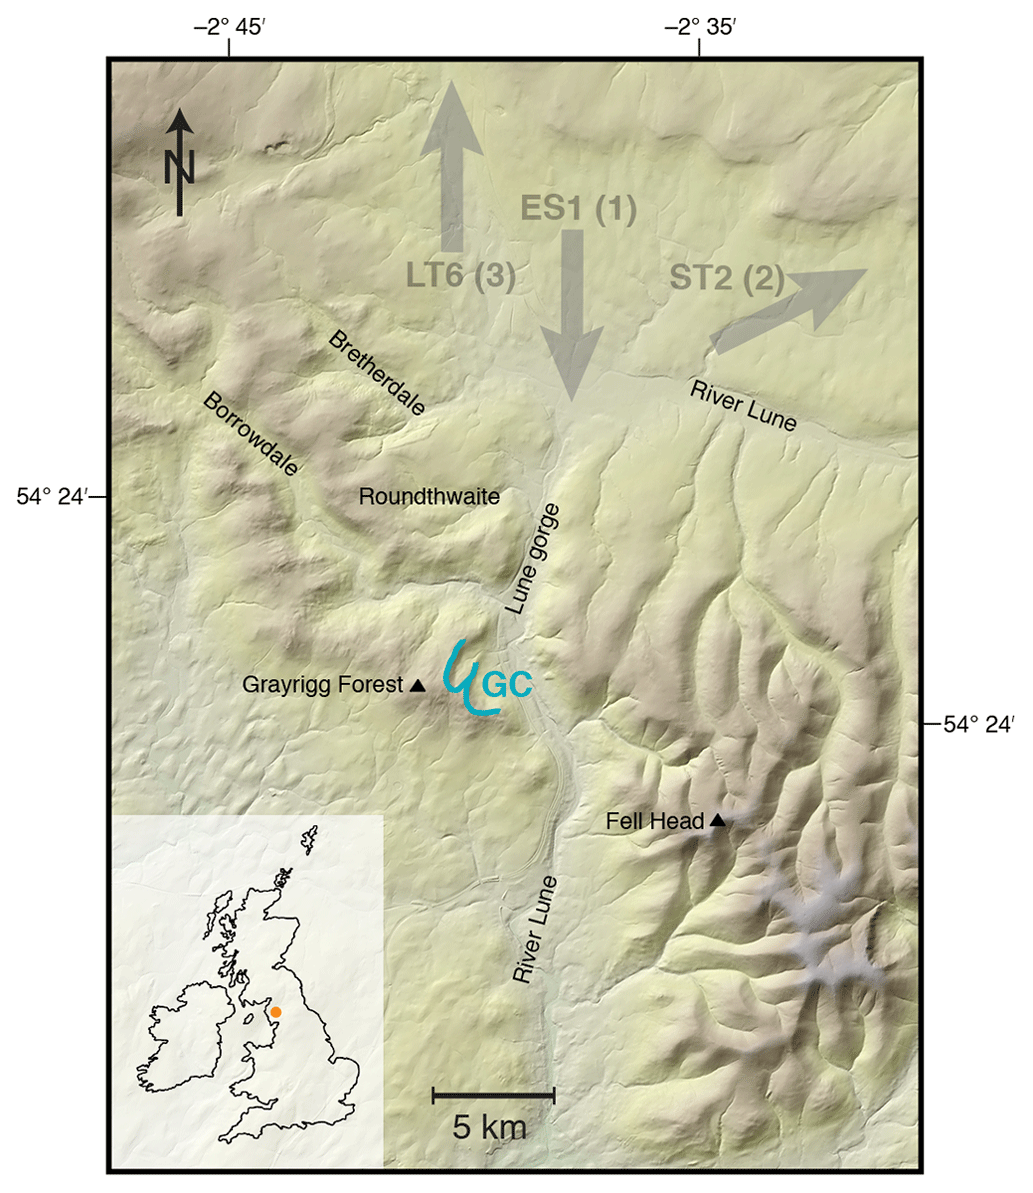
Figure 2Regional map showing the location of Great Coum (GC) and Little Coum with respect to generalized Dimlington (ES1), (ST2), and (LT6) ice movements (after Livingstone et al., 2010, 2012). Labels (1), (2), and (3) indicate the temporal sequence of the ice movements. Locations referred to in the main text are also shown. The inset shows the location of the study area in the context of the British Isles. The base NEXTMap digital elevation topography has a 5 m resolution.
The last period of extensive glaciation in northern Britain occurred during the Dimlington Stadial of the Late Devensian substage of the Pleistocene (∼28–15 ka; Rose, 1985; Scourse et al., 2009; Chiverrell and Thomas, 2010; Davies et al., 2019), equivalent to stadials 3 and 2 of the North Greenland Ice Core Project (NGRIP) chronology (Lowe et al., 2008) and the Marine Isotope Stage 2 (Ehlers and Gibbard, 2013). During the LGM, the Lune gorge and surrounds were covered by several hundreds of metres of ice. The Lune gorge is ice-sculpted, having a parabolic bedrock cross section with truncated valley-side spurs along both the west and the east margins. Great Coum and Little Coum, on the western side of the gorge, are the only recognized cirques in the Lune gorge. These two Lunedale cirques should not be confused with two cirques with the same names in Dentdale (Barr et al., 2017). The two conjoined embayments were considered by Marr and Fearnsides (1909) to be a single cirque but recently have been recorded as separate cirques (Barr et al., 2017; Clark et al., 2018). Devensian till banks and moraine (entrenched by the River Lune) fill much of the Lune gorge floor, and till also occurs in most tributary valleys (Aveline et al., 1888; Marr and Fearnsides, 1909; BGS, 2008a, b, 2022).
Complexity of Devensian glaciation around Great Coum
The context in which the RSF occurred is relevant to the interpretation of the importance of potential ice buttressing and is referred to within the Sect. 6. Here we provide the setting. Little is known of the glacial history of the Lune gorge area (Carling et al., 2023). Nevertheless, prior findings, on the whole, have been incorporated in the BRITICE maps of the area (Clark et al., 2018). A complex interplay occurred in the vicinity of the Lune gorge between several upland ice dispersal centres, primarily the Scottish, Lake District, and Howgill ice masses, during the period of maximum ice cover ∼26–22 ka. All three ice masses interacted in the north, while the latter two ice masses dominated to the south. After the LGM, as the ice sheets downwasted, and ice flows became increasingly valley-confined, so ice emanating from the two cirques would have flowed northwards (Carling et al., 2023).
The complexity of regional ice flow was simplified by Livingstone et al. (2010, 2012) by using codes to refer to different ice streams (Fig. 2) that occurred in various locations and at differing times; the relevant codes are as follows. In the ES1 phase, early LGM, northern ice penetrated a short distance into the Lune gorge (Harkness, 1870; Goodchild, 1875, 1889; Marr and Fearnside, 1909; Hollingworth, 1931; Moulson, 1966; Letzer, 1978) as far as Carlingill and Great Coum (Fig. 2) but no further. However, Davies et al. (2019) demonstrated that close to the LGM (ST2 phase; sensu Livingstone et al., 2010) and during the LT6 phase (Chiverrell et al., 2018), ice flowed northwards from the Lune gorge (Fig. 2). On the northern flank of the Howgill Fells, any ST2 or LT6 ice flow would have been to the east and north from the Howgill ice dome (Fig. 2), such that the higher summits of the Howgill Fells were not overrun by ice from further north (Stone et al., 2010). Rather, the Howgill Fells hosted its own local ice dispersal centre. Prior work failed to determine whether northern ice entered the two Lunedale cirques. Consistent northerly downwasting ice flow was established (Hollinsworth, 1931; Rose and Letzer, 1977) from 19 ka (Davies et al., 2019), with surrounding areas north and south of the Lune gorge being ice-free by ∼19.2 to 16.6 ka (see Carling et al., 2023, for a review of regional dates). These dates are broadly consistent with other dates for the deglaciation of the central Lake District (Wilson and Lord, 2014) and are indicative of a general ∼2–3 kyr window for the timing of final Dimlington ice downwasting within the Lune gorge when the backwall of the Great Coum cirque could have become ice-free. We return to this point in Sects. 3 and 6.2.
Given that ice may have reoccupied upland terrain in the Lake District during the Younger Dryas (Brown et al., 2013; Bickerdike et al., 2018), in principle, an ice mass may also have occurred in the general vicinity of the Lunedale cirques at this time. However, no evidence for Younger Dryas ice in the Lune gorge has been reported.
The bedrock in the cirques comprises the marine Silurian Coniston Group (Soper, 1999, 2006), which here consists of fine-grained, blue–grey, sandy siltstone (greywacke) and sandstones in beds from <1 to ∼3 m thick. Most of the thicker beds crop out within the headwalls of the cirques. The thicker sandstone beds are more competent with fewer fractures, while thinner fissile siltstone beds exhibit cleavage and are heavily fractured. Vertical joints are frequent, with spacings of a few metres, together with evidence of small-scale bedding deformation and small-scale faulting. Moseley (1968, 1972) considered the considerable complexity of the regional structure and noted folding, steep discontinuous local faulting, joint patterns, and the presence of slickenside surfaces in the southern Shap Fells. In Sects. 4 and 5, this complexity is not considered, as the detail is not pertinent to our study. Nonetheless, reference is made to local steep faults, slickenside surfaces, and friability where these are relevant, as the rock structure in the vicinity of the RSF is critical in the assessment of slope stability (Bonilla-Sierra et al., 2015; Stead and Wolter, 2015). The apparent dips of the local beds range from 0 to 30∘, i.e. SW into the headwall of Great Coum. However, the apparent 8∘ plunge of the stratal sequence is towards the NW, such that the true dip is to the WSW with a NW strike (BGS, 2008a and b). Infrequent but distinctive 10–40 mm thick pale bands of siltstone occur (e.g. Taylor et al., 1971, p. 26) in some of the thicker beds, which extend discontinuously over distances of several decametres parallel to the primary bedding. These siltstone bands are significant in that examples (here termed marker horizons) occur in the headwall strata which correlate with similar siltstone bands in the strata of the RSF.
Great Coum is orientated NE, and Little Coum is orientated NNE. The orientations of the cirques are influenced by the strike of local paired anticlines (Marr and Fearnside, 1909; BGS, 2008a), and the low-insolation aspects of both sites would have encouraged Devensian snow and ice accumulation and preservation. Great Coum exhibits no distinct lip (i.e. no overdeepening), and the ground falls steadily from around 237 m (height above mean sea level, m a.s.l.) to the River Lune below (Fig. 3a). Above 300 m, the ground rises more steeply to rocky head walls locally near 80∘ at 360–440 m, giving a height range of around 225 m. Little Coum exhibits a slight lip at around 262 m altitude. Above 400 m, the ground rises more steeply to near 80∘ rocky head walls at 400–440 m, and the ridge crest at 480 m gives a height range of around 220 m (Fig. 3b). First- to second-order minor streamlets occupy the lower parts of Great Coum, and Little Coum is drained by the third-order stream, Burnes Gill.
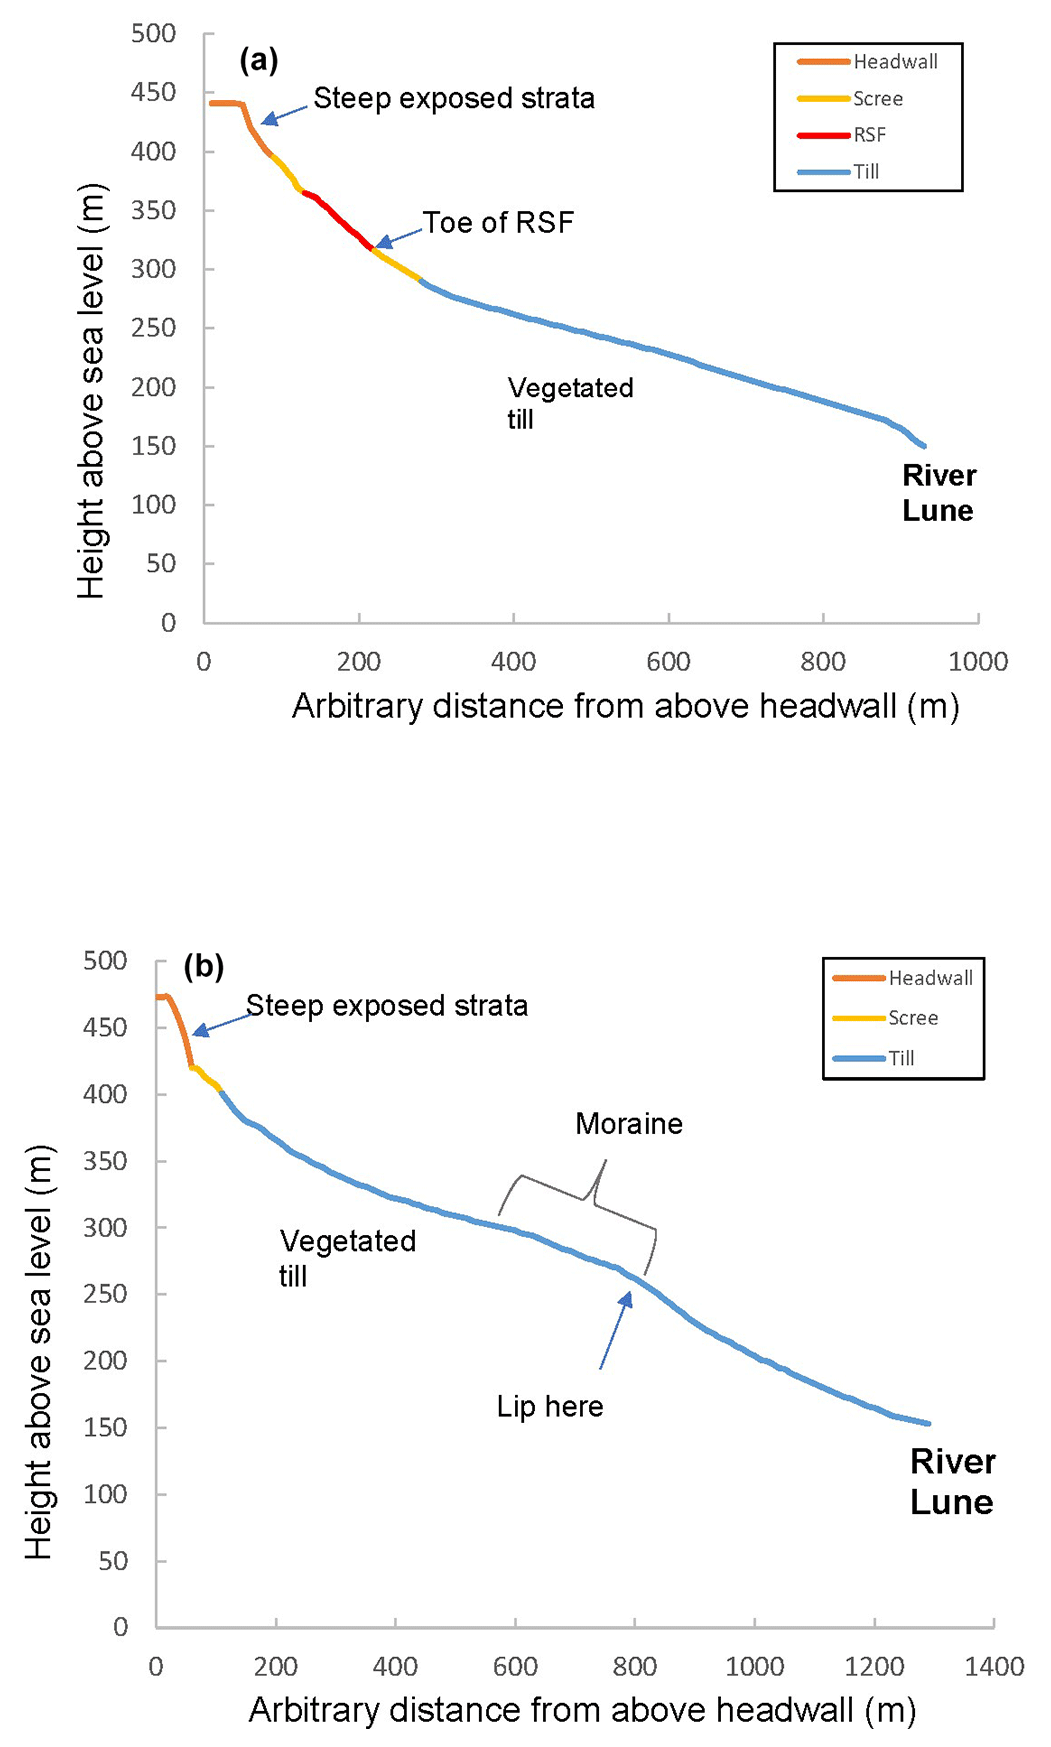
Figure 3Long profiles along centre of cirque. (a) Great Coum, with a transect from 54.389978∘ N, 2.606625∘ W to 54.396675∘ N, 2.598278∘ W. (b) Little Coum, with a transect from 54.393789∘ N, 2.615992∘ W to 54.400117∘ N, 2.602208∘ W. Exposed bedrock is indicated in the headwall and in the RSF. Data are extracted from © Google Earth.
The British Geological Survey (BGS, 2008b) map identifies till on the lower slopes of Great Coum, and the BGS borehole database contains the records of 24 shallow boreholes that are ranged along the axis of the Lune gorge over 1.25 km immediately below Great Coum. These borehole logs show that the slopes just below the cirque consist of a thin soil above a 2.5 m thickness of Devensian diamicton, overlying the Silurian Coniston Grit. In Little Coum, hummocky till infills the cirque below 400 m (BGS, 2008b); at lower altitudes, a flatter thin diamicton drapes much of the basin, including a poorly defined curvilinear moraine that terminates at the lip (Fig. 3b). It is not possible to calculate an equilibrium line altitude (ELA) with any certainty, based on the upper limit to the highest lateral limits of the curvilinear moraine (Porter, 2001), but 300 m a.s.l. is a reasonable estimate. Bedrock exposures along Burnes Gill and augering during the current project indicate that this moraine is no more than 6 m thick. The curvilinear moraine has a distinctive, sharp outer margin along the rocky rounded ridge that separates the two cirques. Within Little Coum, three faint diamicton-covered (possibly ice-recessional) benches occur on the northern slope of the cirque. Thus, although Great Coum lacks any preserved indication of ice retreat, such indicators may exist within Little Coum.
All the deposits described above are significant. In the first instance, substantial till in the Lune gorge below Great Coum has been related to northern ice penetrating the gorge around the LGM (Carling et al., 2023). At that time, the whole region was covered by a thick ice sheet (Merritt et al., 2019). However, as downwasting led to increasing topographic control and valley glaciers predominated, there was likely to be ice flow out of the cirques prior to the near-complete ice retreat that left the diamicton-covered benches. We envisage that around the LGM, thick overriding ice in the vicinity of Great Coum was dictated by regional ice gradients largely independent of the local topography (Carling et al., 2023). Post-LGM, ice discharge from the cirque initially would have remained high, but any buttressing effect on the headwall would decline as the ice thinned.
The RSF occurred in Great Coum. The most southerly backwall section of the cirque consists of a steep rocky headwall facing N, while to the west a further steep rocky headwall faces NE; a steep grassy slope occurs between these two outcrops. The RSF caused headwall retreat in the vicinity of the present grassy slope, leaving the intact steep rocky sections of the backwall to either side, but the failure also extends below the north-facing headwall (Fig. 1). Indistinct, small RSFs also occur to the east and west, which are not considered further. Little Coum also contains a steep rocky headwall but with no evidence of slope failures. The mass of the RSF in Great Coum appears to have descended as a translational near-intact block. Although a near-vertical fracture occurs within the right-hand side of the slipped mass (Fig. 4), in other respects the undisturbed strata within the block readily correlate with strata in the headwall above.
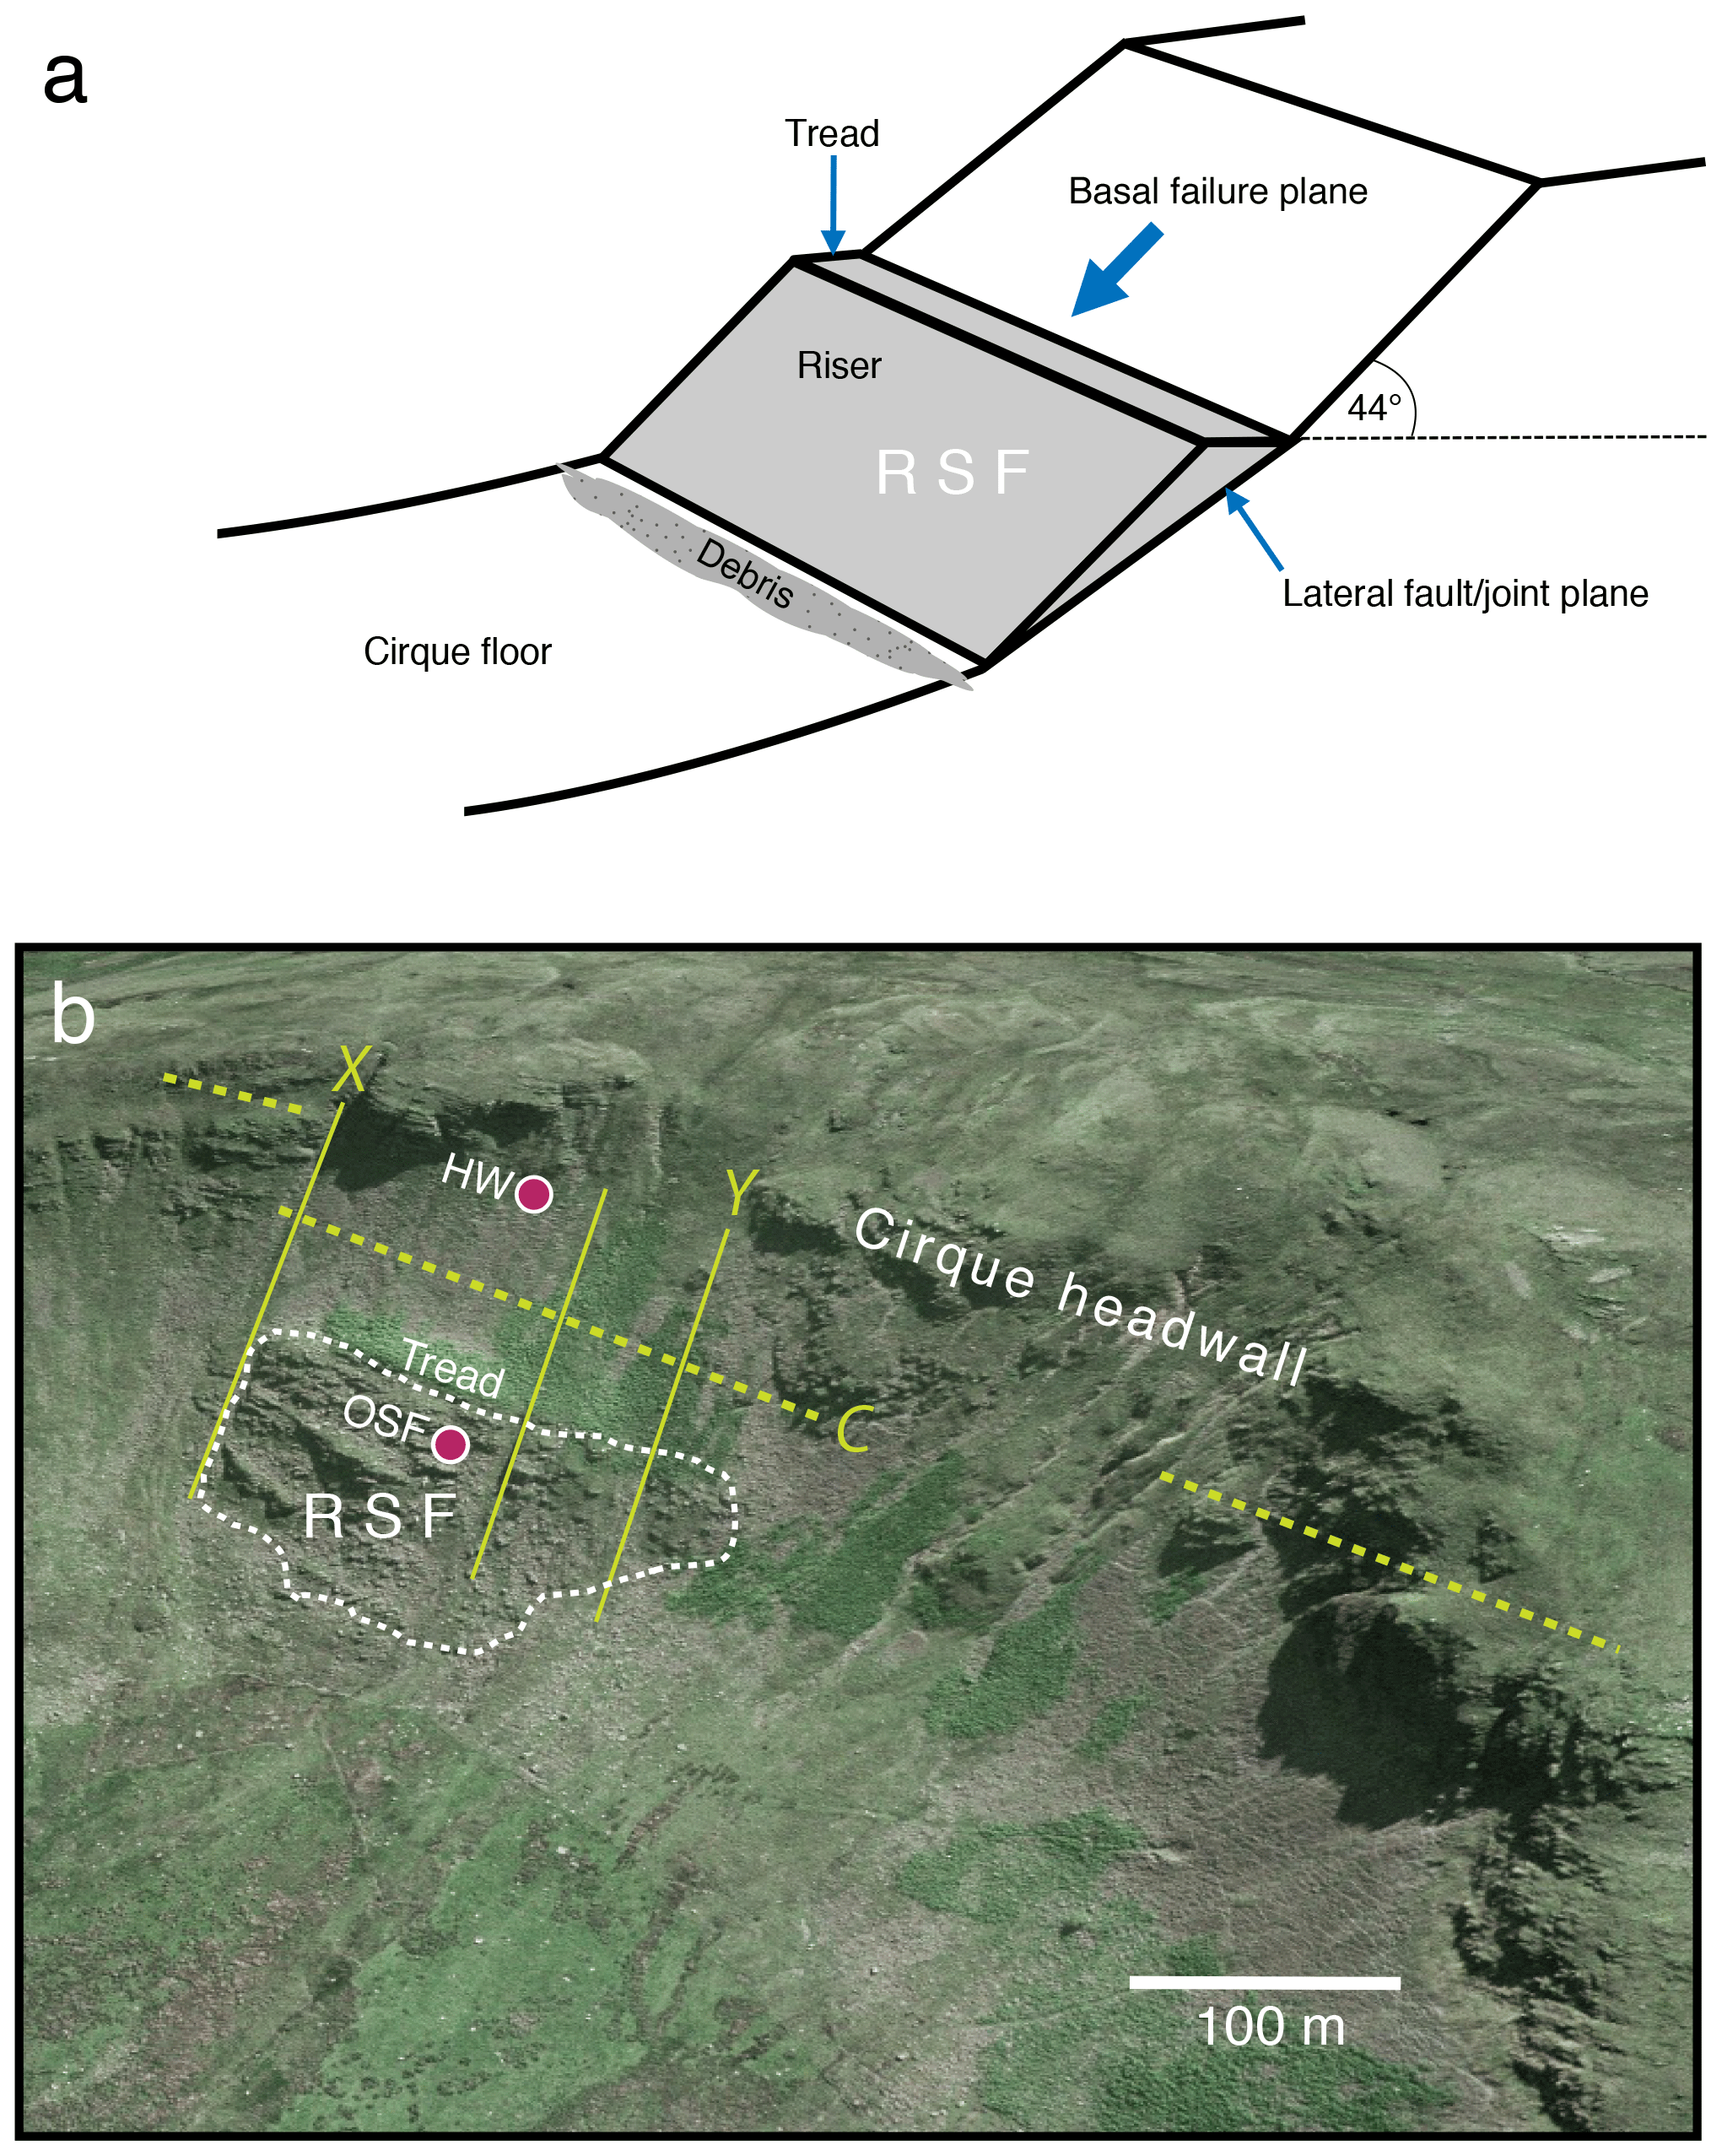
Figure 4(a) Schematic image of a simple wedge failure to indicate the terminology used within the main text. (b) Annotated view of Great Coum (compare Fig. 1). The fault-aligned rock slope failure plane (C), above and behind the RSF, is intersected by three major steep fault lines, the outer two of which (X, Y) define the RSF model. The locations of samples (HW and OSF) collected for exposure dating are shown by circled symbols. Base image © Google Earth 2014. The scale bar applies to the middle distance.
4.1 Mapping landscape features
The British Geological Survey (BGS, 2008a) records several lineaments in the vicinity of Great Coum that represent small faults or large block joints. Google Earth satellite images (2004, 2009, 2011 and 2014) were used to visually identify these linear landscape features and others of relevance (not recorded by the BGS). Lineaments trace topographic discontinuities, stratigraphic offsets, vegetation differences, and slickensides, and these forms were checked in the field. Smaller-scale linear features consist of the silt banding marker beds and numerous minor joints (the latter not mapped). The various points of interest were recorded as single-point data in the field using a handheld Garmin global positioning system (GPS). The strikes of bedding and the direction of faults were recorded as compass bearings, while the dips of bedding and faults were recorded relative to a horizontal plane using a digital clinometer.
Single-point data are precise in plan view, whereas linear features, between two or more well-determined points, provide the general trend of features such as gullies and faults. GPS coordinates were also used to map the extent of the slumped block. Due to the inaccuracy of handheld-GPS-derived altitudes, the plan view GPS coordinates were used to determine the altitude of each point from Google Earth, and these were taken as definitive coordinates (error < 4 %) after cross-checking with Ordnance Survey 1:50 000 maps (Harley, 1975). Selected topographic profiles were also developed from Google Earth imagery by reading x, y, and z coordinates at 10 m horizontal spacings along selected plan view lines running from the top of the headwall of each cirque, across the free face, to the slope below. Finally, a systematic search was made within both cirques for Shap granite or limestone erratics to check whether northern ice had entered the cirques. Outcrops of both these lithologies occur 10 km to the north.
We refer the reader to Fig. 4a for an explanation of the RSF terminology used here, although the failure planes bounding the wedge are omitted for clarity. The modern headwall of the cirque locally constitutes the main exposed scarp of the failure plane behind the translational wedge of the RSF. The outer face of the wedge is termed the “riser”, and the near-horizontal head of the wedge is termed the “tread”.
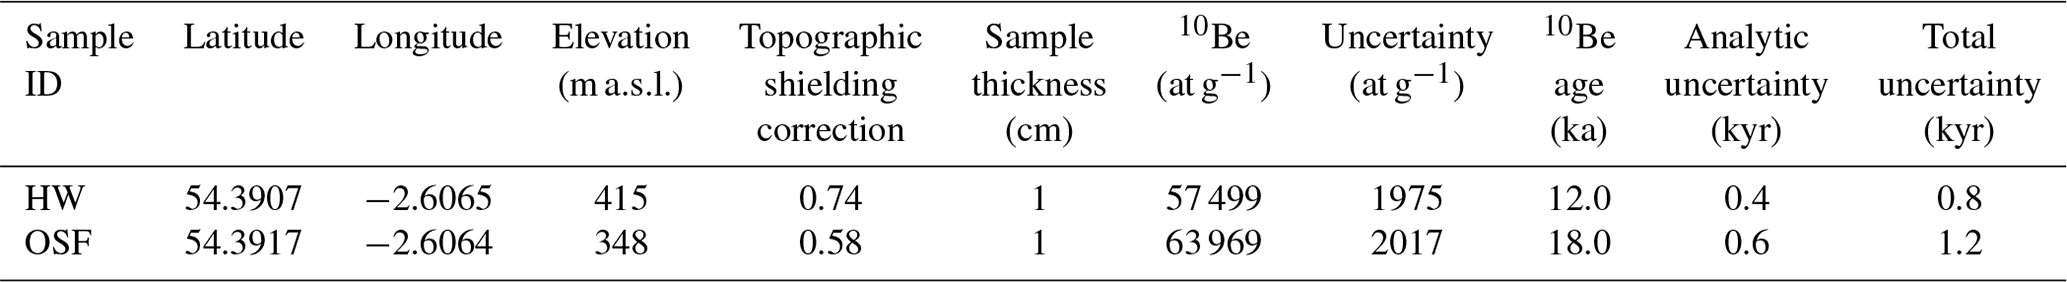
Table 1Summary of the cosmogenic nuclide analyses. 10Be concentrations in quartz are normalized to the 07KNSTD standardization by Nishiizumi et al. (2007), and exposure ages are calculated using LSDn scaling (Lifton et al., 2014) and the global calibration data set (Borchers et al., 2016) via http://hess.ess.washington.edu v3.0.2 (last access: 3 January 2023). The analytical uncertainty includes accelerator mass spectrometry (AMS) error in the measured ratios, including the standard uncertainty of 1.1 %, Be carrier concentration, and processing blank propagation (<1.2 %). The total uncertainty also includes production scaling and calibration uncertainties. Rock density was assumed to be 2.7 g cm3.
4.2 Rock sampling for surface exposure dating
Terrestrial cosmogenic radionuclides, such as 10Be, are produced and accumulate in minerals within a few metres of Earth's surface, due to their exposure to secondary cosmic rays, and are lost via erosion and radionuclide decay (Lal, 1991). In our case, two free rock surfaces are recognized (Fig. 4), namely the riser, which is the outer surface of the RSF, and the tread, which forms the top surface of the slipped mass. We set out to determine when the RSF riser was first exposed to cosmic rays as ice receded from the cirque. For reasons of economy, we collected one sample from the riser to compare the exposure age with the timing of regional deglaciation. A ∼15 kg intact block of bedrock (sample OSF) was collected from the outer 10 cm thick surface of the riser (Fig. 4b), a prominent thick undisrupted stratum close to the top of the RSF mass, which was ice-smoothed (Fig. S3). Our sampling strategy was restricted by the ease of access and by the nature of the bedrock surfaces. The smooth bedrock surface of the riser we sampled suggests minimal loss of rock mass due to surface fragmentation or spalling since the RSF occurred. A second 15 kg bedrock block (sample HW) was collected from the failure plane of the transverse fault line (Fig. S3) just below the cirque headwall (Fig. 4b), with the aim being to determine the timing of the failure. The sampled bedrock failure plane was observed to be densely fractured, suggesting some loss of material from the surface since its exposure. Surface erosion affects the abundance of cosmogenic nuclides and the estimated exposure age, which is an issue we address in Sect. 6 (and the Supplement). Samples were cut from in situ bedrock surfaces using a powered rock saw; their altitude, bearing, tilt, and topographic shielding were recorded. Topographic shielding is significant for both samples, and details are given in Fig. S1 (in the Supplement).
Our approach entails three important assumptions about the last glaciation. First, we assume that the cirque headwall experienced at least 2 m of bedrock glacial erosion, which removed the nuclide inventory produced during preceding ice-free periods. Second, we assume that ice burial depth at the position of the OSF sample was at least 20 m and therefore sufficient to effectively halt nuclide production. Third, we assume that this cover persisted until failure. These assumptions mean that sample OSF began accumulating 10Be only from the time that the downwasting ice exposed the surface to cosmic rays. In contrast, sample HW remained deeply shielded (>5 m) within the cirque headwall until the RSF exposed the failure plane to cosmic rays.
4.3 Cosmogenic nuclide analysis
The two bedrock samples were prepared for cosmogenic 10Be analysis at the Aarhus University Cosmogenic Nuclide Laboratory, Aarhus, Denmark, following standard laboratory procedures as described in Andersen et al. (2020). The ratios were analysed at the accelerator mass spectrometer at AARAMS, Aarhus, Denmark. A summary of the cosmogenic nuclide analyses is given in Table 1, and further details are found within the Supplement.
4.4 Rock slope failure modelling
The RSF was modelled using SWedge version 6.0 (2018), a specialized rock slope stability software package, which can analyse a five-sided block (pentahedron) as a translational wedge failure, whereby a rock mass slides along a persistent basal plane of failure bounded on each side by a fault or joint plane (Hoek and Bray, 1981; Rocscience Ltd, 2018). Either, or both, laterally bounding faults can act as additional slide planes, depending on the geometry of the problem (Fig. 4a). In our case, two surfaces are not confined by neighbouring bedrock, namely the outer surface of the RSF, which is the riser, and the top surface of the slipped mass, which is the tread (Fig. 4). As well as varying the geometry of the failure and the roughness of the failure planes, SWedge has options to consider the influence of (i) a tension crack at the back of the failure (not shown in Fig. 4a); (ii) water in the failure planes; and (iii) the effect of any restraining normal stress that may counter the propensity to slide. In engineering applications, restraining normal stress is conventionally realized using steel rock bolts or stone and concrete structures applied to the face of the riser, especially near the toe. In contrast, here the issue is whether an ice mass in the cirque can buttress a slope that is otherwise unstable, as is explored below. In glaciated mountain environments, permafrost (and ice segregation) can penetrate bedrock to a depth of several metres (Andersen et al., 2015). Ice-filled fissures tend to be stable at temperatures below −2 ∘C, which gives rise to the concept of “ice-cemented” fractures (Ballantyne, 2018). Consequently, the possibility that permafrost stabilized the RSF failure planes is considered in Sect. 5.3.
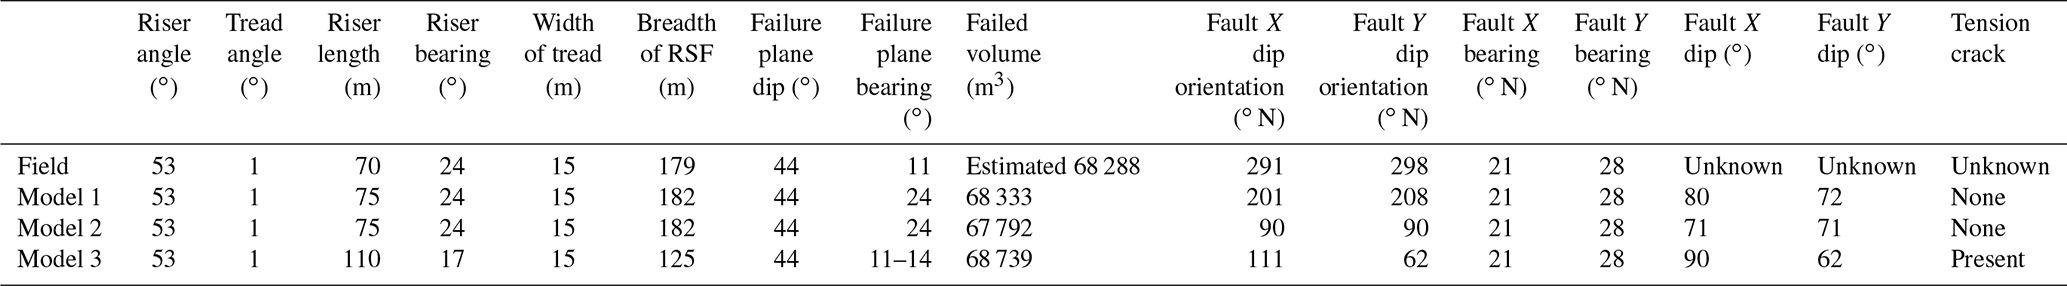
Table 2Parameter values for RSF as determined in the field and as explored within the three model scenarios.
SWedge was implemented adopting the Mohr–Coulomb failure criterion (e.g. Jaeger and Cook, 1979) pertaining to the limit equilibrium stability of a three-dimensional rock mass using field data (Table 2). Further details are provided in the Supplement and within Sect. 5. Stability is defined in terms of a factor of safety (F), where F>1 indicates a stable slope and F<1 a failed slope. F=1 represents a critical state. In general terms, the factor of safety is defined as the ratio of the forces resisting motion to the driving forces. Driving forces include the mass of the wedge accelerated through gravity and water pressure; the latter applied normal (i.e., at 90∘) to each wetted plane. Resisting forces arise from the shear strength of the wedge sliding planes. Any ice load on the wedge is considered to be only a weight force contribution to the normal stress. Thus, active support due to the load of any glacial ice (or firn) on the riser is included in the analysis, as in Eq. (1), where Tn is the normal component, and Ts is the shear component of the force applied to the riser. Active support is assumed to act in a such manner that it decreases the driving force in the factor of safety calculation, as follows:
Unless parameter values are known exactly, a single deterministic RSF model cannot be resolved using Eq. (1). In view of the uncertainty in our field case, related to the exact relationship between fault plane alignments and dips, a variety of potential failure scenarios must be considered. To narrow the number of models, we used preliminary trials of our field-derived parameter values as input, varying both the strength and slope and geometry parameters. Then, the consideration of a range of fault plane dips allowed us to exclude geometrically impossible configurations and those geometries that did not resemble the geometry of the RSF. In this manner, we devised three model scenarios that represent the RSF in terms of shape and mass. More than 10 000 simulations were performed for each scenario, with the parameter values systematically being varied (typically ±10 %) to isolate the most probable model for each case. The uncertainty and probability analyses were conducted using the dedicated approaches built into the SWedge platform, and normal distributions were selected to describe the possible range of parameter values (for example, ±10∘ of dips measured in the field). Finally, the buttressing effect of any glacial ice against the potential RSF is considered by applying an external load evenly across the area of the riser to counter any propensity for failure.
5.1 The rock slope failure
The positions of the pale silt marker beds, located in the headwall and within the RSF, indicate that the RSF has moved downslope by about 110 m (H) vertically and up to 192 m (L) horizontally. The width of the tread is about 15 m; the breadth of the slide is between 125 and 180 m, and the vertical extent of the main slipped intact mass along the outer face (the riser) is about 70 m. Assuming the displaced block is a triangular wedge thinning towards the toe (Fig. 4), the volume of the intact slip is ∼68 288 m3. Below the main slip, there is an area of disintegrated rubble which could increase the length of the riser, potentially adding ∼3 % (∼2300 m3) to our volume estimate (Table S1 in the Supplement). The value of is sometimes considered a mobility ratio, whereby large values of L for relatively small vertical displacement (H) can indicate unimpeded rapid descent and a long runout. Given the volume of the RSF, values of , as seen here, indicate no excessive runout (Whittall et al., 2017; Table S1).
The slope of the riser of the RSF mass is currently ∼30∘; that is, it is similar to the static angle of repose. This angle may suggest slow downslope movement rather than rapid failure, which tends to produce slope angles much less than the angle of repose. In addition, there was no evidence of hard-rock end-point control at the toe of the slumping block to impede its descent, although the toe has rotated outwards (Fig. 4a). The slope of the riser today is less than the slope of the failure plane (44∘), which suggests that a portion of the intact wedge may be lying above debris derived by overrunning some of the disintegrated thin toe of the wedge (Fig. 4a). It is significant that the stratigraphic layers within the main RSF wedge remain intact, with no evident downslope dilation and little deformation or fracture across the face of the slipped mass. The apparent plunge of the strata (8 to 10∘ towards the north), i.e. across the face of the RSF, indicates that the western margin of the slip may have descended slightly further downslope than the eastern margin, as the headwall strata plunge 6 to 8∘ in the same direction. The outer face (Fig. 4b) of the RSF has undergone no evident modification.
As shown in Fig. 4b, a distinct fault (BGS, 2008b) normal to the cliff face occurs to the east of the RSF at location X, with undisturbed stratigraphy in the headwall on either side. Slickenside structures occur along the basal failure plane (C), the fault plane continues across the cliff to the northwest. The fault X is aligned with the southeastern margin of the RSF (as seen in Fig. 4b), while a further fault is evident as a distinct fissure in the RSF, with another fault to the northwest (Y). The easterly dip of these three faults could not be determined accurately although they are steep, consistent with the findings of Moseley (1968, 1972) for the Coniston Group in the region (see Sect. 5.3). The basal failure plane defined the back of the RSF, while the lateral limits to the RSF model were defined by the two marginal fault lines (X and Y).
5.2 Estimation of original angle of the outer slope of the rock surface before failure
To apply the SWedge model, it is necessary to know the angle of the outer slope of the rock face before failure. From the geometry of the residual RSF mass, with respect to the observed failure plane (Fig. 4b), the RSF can be considered to be a translational plane failure of a pentahedron wedge. Taking a side view, the geometry is triangular (Fig. 4b), so it is possible to calculate the minimum slope of the outer rock face prior to slope failure by repositioning the failed block further up the failure plane. The angle of the failure plane is taken as being equal to that of the minimum angle of the slickenside surfaces (44∘), with a bearing of between 6 and 11∘. The riser (outer face) of the RSF is 70 m in length, and the tread width is 15 m; both lengths could have been slightly larger before fracturing occurred along the basal failure plane and at the toe of the RSF (Fig. 4a). Given the small degree of uncertainty with regard to the configuration of the slope before failure, the length of the failure plane (necessarily longer than the riser of the RSF) was varied systematically at the same time as varying the length of the riser between the measured length of 70 and 90 m; the latter value includes the small area of the disintegrated toe (Fig. 4a). The tread width is also varied between the measured breadth of 15 m and a limit of 20 m to allow for potential disintegration along the failure plane at the back of the tread. By repositioning the RSF upslope in this manner, the slope of the outer face could have been no lower than 53∘, and if the angle of the failure plane is increased beyond ∼54∘, then the resulting lengths of the failure plane and outer face become incompatible with field observations.
5.3 The SWedge model of the rock slope failure without ice buttressing
Initial application of the SWedge model used the field data shown in Table 2. We did not model the stability of the wedge in its present position because the basal friction properties are unknown, i.e. it is unknown whether the toe of the RSF rests on rubble derived from the failure plane, or on a bedrock surface. Given that the present angle of the riser is 30∘ and that the basal failure plane is at an angle of 44∘, it is assumed that the wedge is now stable (F≫1).
The slope of the riser utilized is that which is applicable to the rock mass before failure, as determined in the preceding section. The width of the tread and the lateral extent (breadth) of the failed mass are determined from the field data. The summit of the cirque is fairly flat, so an outward slope of 1∘ below the horizontal level is used for the tread; the model is not sensitive to this parameter. The angle of the failure plane is the minimum value for the slickensides to the southeast of the RSF (which were not disturbed by the slope failure). The model allows for the definition of the additional effective roughness angle (r) on the failure planes by applying a waviness parameter (w) that was determined from the range of recorded slickenside values, following Miller (1988). Other parameters were defined from the field data. It was noted above that the dip of the two lateral delimiting faults could not be determined in the field. However, as local faults tend to be steep (Moseley, 1968, 1972), the model was implemented with the values shown in Table 2 and then varied systematically, as reported below. Given the geometry of the problem, only the following three modelling scenarios are necessary to explore the uncertainty in a controlled setting:
-
Model 1: the RSF slides over the basal plane and against fault Y. The model aligns the compass orientation of the basal failure plane with the orientation of the riser outer face, which assumes a simple downslope slide. The orientation of faults X and Y with respect to north are as determined from field data. The X and Y fault dips are steep, and both dip to the west. Dips and riser length were varied slightly to optimize the failed volume of the RSF to match the field estimate. In this manner, the model is not consistent with the progression of the eastern side of the slip being less far down the failure surface than the western side. The factor of safety is 0.83.
-
Model 2: the RSF slides along the basal plane and against fault X. The model aligns the bearing of the failure plane with the bearing of the slickensides to the east of the RSF, as these define the bearing of the basal failure plane that differs from the bearing of the riser face by 13∘. The bearings of faults X and Y are as determined from field data. The fault dips are steep, and both dip to the east. Dips and riser length were varied slightly to optimize the failed volume of the RSF and to match the field estimate. In this manner, the model is consistent with the progression of the eastern side of the slip being less far down the failure surface than the western side. The factor of safety is 0.86.
-
Model 3: exploration of the addition of a tension crack to the back of the RSF. It is not known if a tension crack developed in the actual rock mass before failure, and the properties of the tension crack are determined by the other model attribute values. Including a tension crack, the western side of the RSF extends further downslope than the eastern side, with the lower edge of the model block having a plunge of ∼10∘, which is equal to the plunge of the RSF strata in the field. The bearing of the basal failure plane is varied between 6 and 14∘. Fault dips are steep at 90 and 62∘ to the east. Dips and riser length were varied slightly to optimize the failed volume of the RSF to match the field estimate. Given this scenario, the RSF slides over the basal plane and against fault Y. The factor of safety is 0.52 to 0.83, depending on the basal plane bearing.
Given that there is unavoidable parameter uncertainty, none of the above models is an exact representation of the RSF, although model 3 is the closest match (Fig. 5). Yet, it is evident that when preserving the dip of the basal plane and solving to retain the mass of the failure, any reasonable combination of data leads to a model of the failed block that resembles that seen in nature, and in each case, the factor of safety is less than unity. A sensitivity analysis showed that, for reasonable ranges of parameter values (typically ±10∘; excluding those values listed in Table 2), usually the geometry of the potential failure did not match that observed and so could be dismissed. Specifically, in the 10 000 simulations of each model, model parameters could be varied (e.g. by ±5∘ in the case of angles), thus retaining a probability of slope failure of 96 %. In most cases, the factor of safety was between 0.74 and 0.94, and higher factors of safety could not be produced without significant distortion the geometry of the RSF. In a very few cases of parameter combinations (4 %), a marginal factor of safety of between 1.07 and 1.22 is achieved. In the latter cases, wetting between 20 % and 30 % of the fault planes surface areas, due to percolation of meltwater affecting the water pressure, caused the slope to fail.
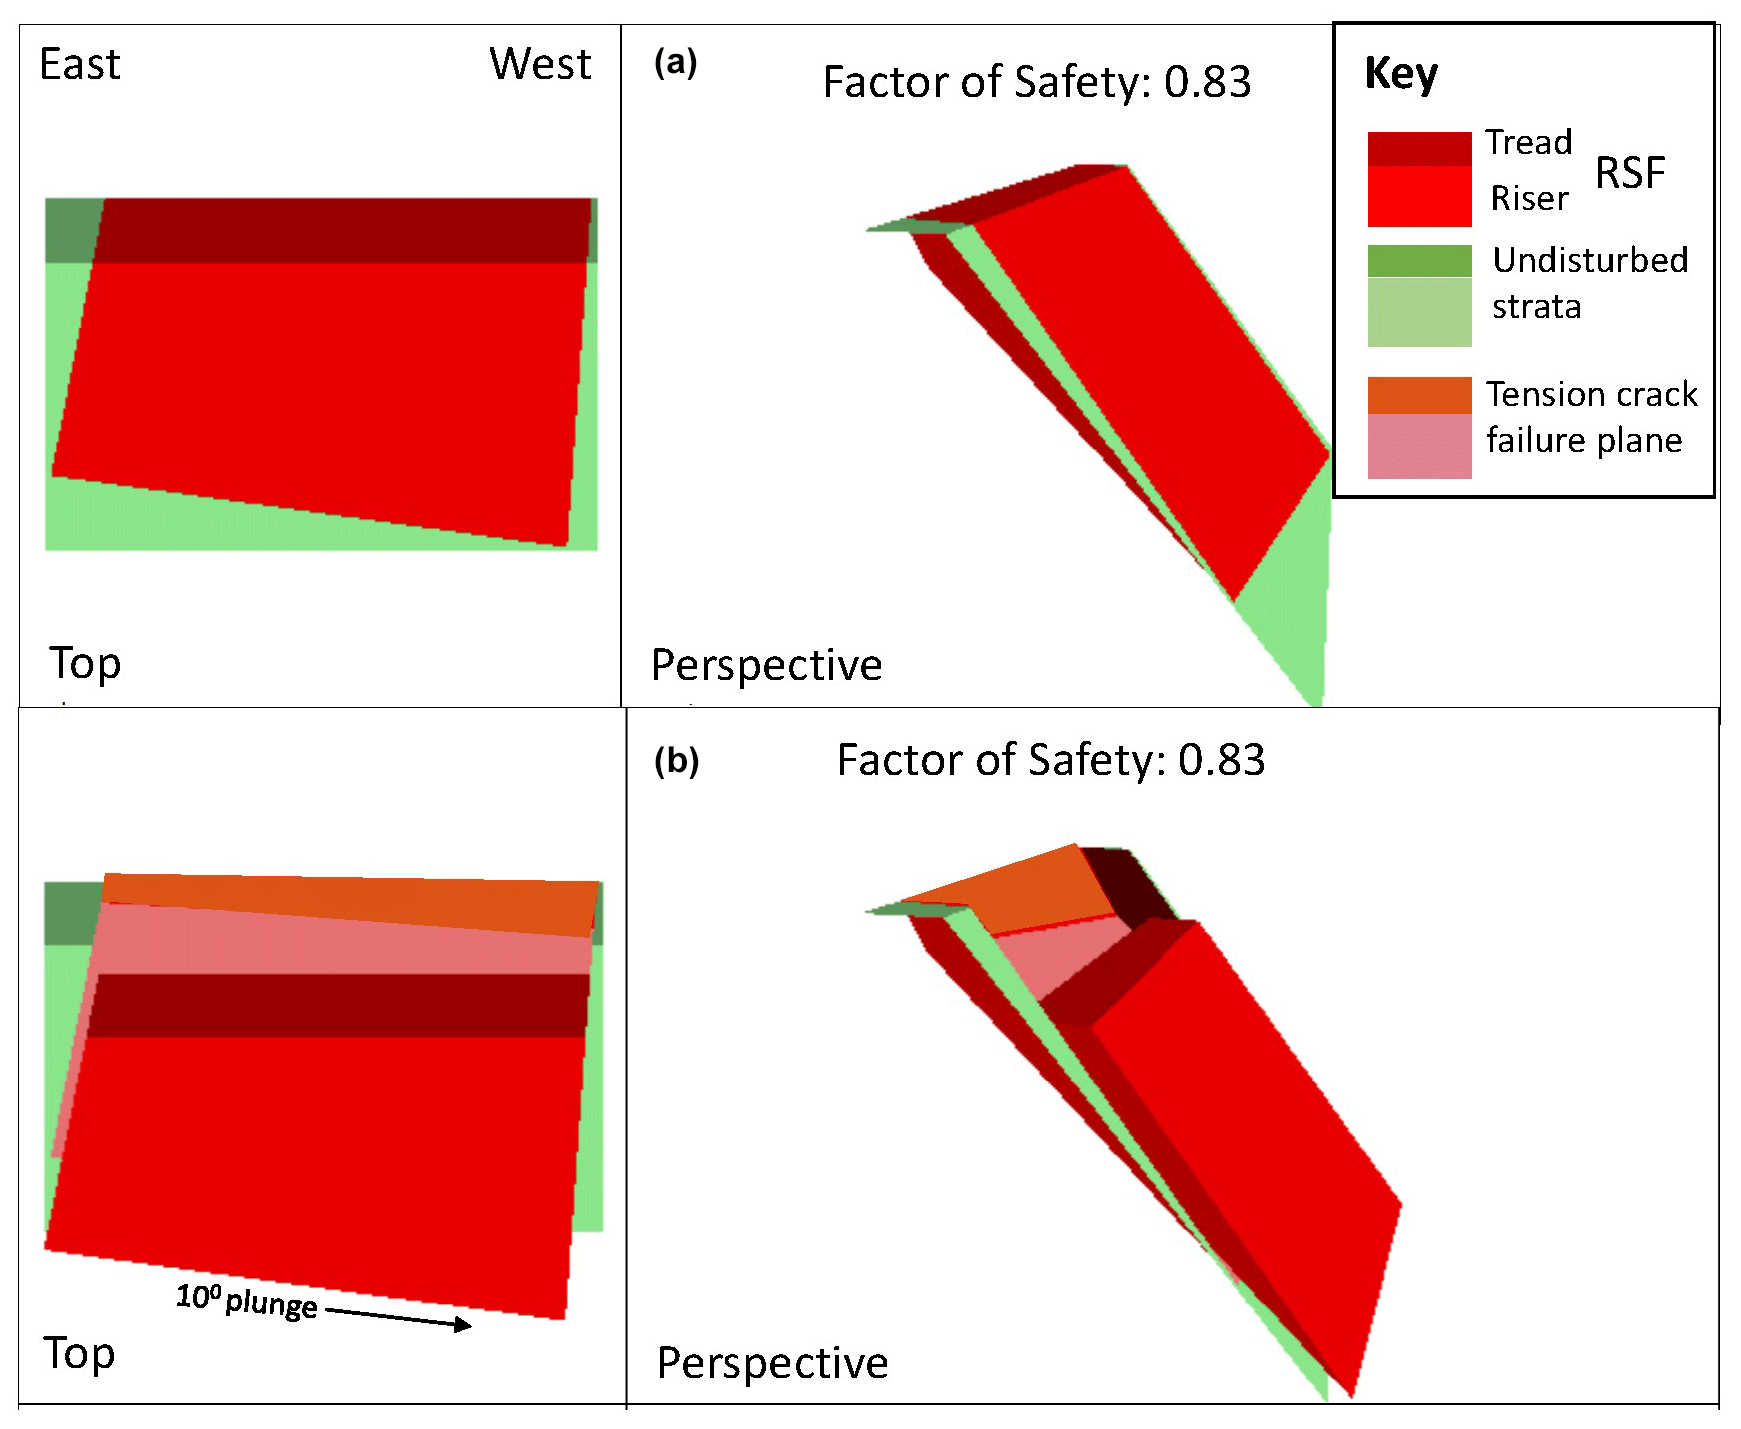
Figure 5Illustration of SWedge version 6.0 model 3 (a) before failure and (b) during failure. The basal failure plane orientation is 14∘, such that the base of the RSF is plunging 10∘ to the north.
As a final consideration, it should be noted that in deglaciating mountain regions, RSFs have been related to permafrost degradation and the consequent destabilization of ice-filled fractures within the rock mass (Gruber et al., 2004; Gruber and Haeberli, 2007). In the RSF failure model described above, freezing of the failure planes can be considered by simply increasing the friction factors, which can result in the block remaining intact, despite the absence of glacial ice buttressing. However, we expect that frozen failure planes did not persist long after glacial downwasting. Hydrostatic pressure in the failure planes would have been high, and percolation more generally lubricates failure planes (Hasler et al., 2011). In addition, permafrost support for the RSF does not explain the intact stratification of the RSF, as permafrost degradation would have resulted in a rapid RSF. Consequently, permafrost was not considered in any quantitative sense.
5.4 The SWedge model of the rock slope failure with ice buttressing
For the range of simulations reported in the previous section, F<1 in all 94 % of the physically plausible cases and wetting failure planes resulted in a 100 % failure in all 30 000 cases. Hence, the role of ice buttressing of the riser must be considered, as this is the most likely explanation for slope stabilization. There is no information on the dynamic behaviour of ice within the cirque. Consequently, selecting model 3 above, three contrasting scenarios can be envisaged that might stabilize the slope: (a) ice can be a static load variably distributed around the centroid (Fig. 6a) of the riser; (b) ice can be dynamic, moving towards the riser, such that the stress is variably distributed around the centroid of the riser (Fig. 6b); and (c) ice can be dynamic, moving away from the riser, such that a bergschrund opens between the ice and the slope and the stress is distributed below the centroid of the riser. Broadly consistent results also are found when considering models 1 and 2 (not reported herein).
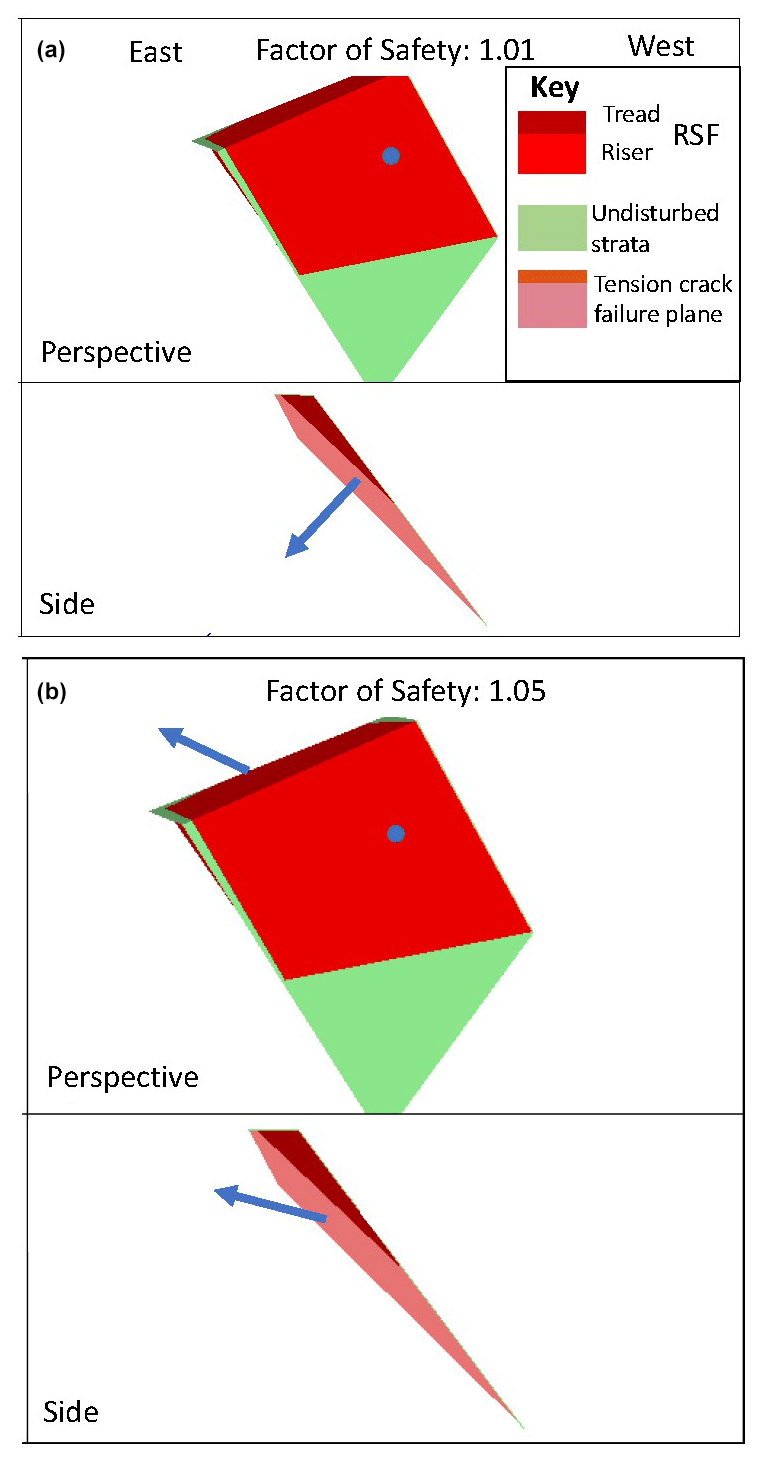
Figure 6Illustration of the force application required to stabilize the potential RSF (a) with the force (point and arrow) applied 90∘ to the slope. The ice mass required to stabilize the slope (i.e. F=1.0055) is 40 357 t; (b) Illustration of the force application required to stabilize the potential RSF with the force (point and arrow) applied at the optimum angle (13∘ above horizontal). The ice mass required to stabilize the slope (i.e. F=1.0485) is 24 325 t.
First, considering scenario (a), the weight of an ice load is calculated, and the stress is applied evenly across the area of the riser normal (i.e. 90∘) to the slope until it is stabilized (for which condition F=1.0055; Fig. 6a). Subsequently, considering scenario (b), the analysis is repeated to ascertain the optimal direction to apply force that minimizes the ice load. In scenario (b), the ice load can be reduced from that in (a) if the force is directed into the slope and slightly upwards by 13∘ above the horizontal, such that F=1.0485 (Fig. 6b). In scenario (a), the application of 49 357 t of ice is required for a stable slope, which is equivalent to 40 967 m3, based on a debris-free, low ice density of 830 kg m−3 (Colgan and Arenson, 2013). In scenario (b), the application of 24 325 t of ice (29 307 m3) is required for a stable slope. For scenario (c), with a tension crack, the slope will remain stable, as long as the total stress applied to the slope is the same as for scenarios (a) or (b). In this study, we do not explore in detail how the ice mass and force direction might be distributed across the riser to maintain slope stability, as there are multiple permutations. Nonetheless, if the cirque had been filled with ice to the top of the riser, then around 166 000 m3 of ice would be required to fill the volume immediately adjacent to the potential RSF (Fig. 7), which is not compatible with the small ice masses in scenarios (a) and (b) that are required to maintain slope stability. Considering Fig. 7, it is important to recognize that in any permutation of potential RSF geometry (Table 2), the ice cover required to maintain slope stability is typically less than 29 % (and possible as low as 17 %) of the volume to the top of the riser. This result indicates that the slope would have remained stable as long as there was a sufficiently small degree of ice buttressing due to ice in the cirque contributing a stress normal to the face of the riser – which further implies that failure occurred during final deglaciation of the cirque. Note that although the presence of sufficient ice on the riser alone maintains rock mass stability, it is unlikely that this condition would apply without the presence of ice immediately adjacent to the rock wedge. So, Fig. 7 shows cirque ice beyond the unstable slope but only conceptually.
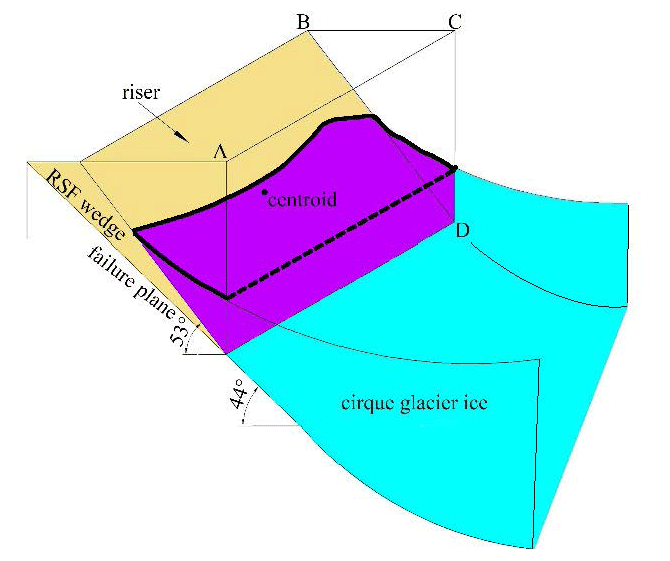
Figure 7Depiction of the concept of ice buttressing of the potential RSF. The RSF wedge defines the unstable portion of the slope before the rock slope failure. Points A–D define a potential pentahedral volume that, if filled by ice, would cover the complete face of the riser. A smaller pentahedral volume (purple), with the upper ice surface outlined by a thick black line, shows that only a small percentage of the potential pentahedral ice volume is required to be ice-filled to provide buttressing sufficient to prevent slope failure. The inner edge of this pentahedral is show as irregular (wavy) to indicate potential variable ice loading across the riser. Additional ice (light blue) might be present in the cirque outside of the defined volume, but this ice does not contribute to the stabilizing load directly applied to the riser.
5.5 Exposure ages from the rock slope failure
In both cirques, tills are composed of local lithologies exclusively, and a search for northern-derived erratics confirmed their absence. The absence of erratic lithologies indicates that the cirques were probably finally eroded by locally generated ice masses after the LGM. At the time of the LGM, it is thought that the locations of the cirques were overridden by an ice sheet from the north moving into the northern end of the Lune gorge (Carling et al., 2023). Under such thick ice conditions, the backwall of the cirque would have been stable, as the volume of ice was much greater than that required for slope stability (shown by ice loading model 3 scenarios (a) or (b)). After the LGM, the ice volume in the cirque would decrease, such that ice loading also decreased until the RSF slowly descended as the loading fell below a critical F value to sustain the slope. It is this lowering of the RSF that we have attempted to date with cosmogenic nuclides.
The surface exposure age of 18.0±1.2 ka (sample OSF) postdates the timing of the maximum ice cover and is consistent with the timing of deglaciation within the broader region (Carling et al., 2023), as is considered in Sect. 6. As noted in Sect. 4.2, the outer face of the RSF (the riser) constitutes a smooth surface of intact, undeformed strata, so concordance of the surface exposure age and regional dates is to be expected. Exposure of the RSF riser (sample OSF) significantly predates the exposure age of 12.0±0.8 ka (sample HW) calculated for the RSF basal plane, suggesting a relationship between debuttressing of the riser face and the gradual downward slip of the RSF. The younger age for sample HW is expected, due to the basal failure plane being progressively exposed after the upper portion of the RSF (where sample OSF occurs) was clear of ice cover and the RSF began to move downslope. Also of significance is the fact than the basal failure plane was disrupted by the failure and is friable, as noted in Sect. 4.2. The loss of only one or two small blocks from the location sampled on the failure plane at any time after failure should result in an age younger than that of the outer face of the RSF (see the Supplement). Results of the cosmogenic nuclide analyses are summarized in Table 1.
6.1 Modelling the RSF dynamics
The SWedge model was applied to the RSF, assuming that the original slope of the rock face was 53∘, with a slide plane angle of 44∘ and no ice buttressing. The steeper slickenside surfaces observed in the field directly above the RSF could indicate a steeper failure plane than that used in the model, but these values were not used, as they may represent strata disturbed by the RSF. In any case, an increase in the failure plane angle or the initial angle of the rock face will increase the propensity for failure. The waviness number calculated from field data and applied in the model is low, which increases the propensity for failure. Preliminary trials showed that stabilizing unstable model slopes would require the use of unrealistically large waviness numbers (Miller, 1988), and so the waviness number was not varied in the sensitivity analyses. Thus, our results obtained with the SWedge model are conservative but show that the rock face was consistently unstable before the failure. The sensitivity analyses accounted for parameter uncertainty and demonstrated that, in most cases, failure would have occurred due to gravity alone. In those few cases where the slope was modelled as marginally stable, moderate water lubrication of the failure surfaces (typically 30 % of surfaces) induced slope failure, but the addition of a modest amount of buttressing ice ensured that the slope remained stable. As there is no rock obstacle at the toe of the RSF to impede descent, it is reasonable to assume that the slip occurred slowly as the ice decayed. The need for buttressing of the slope to prevent rapid failure indicates that ice support was important (Hilger et al., 2018). Thus, our hypothesis that “a steep, faulted, and unstable rock slope has experienced buttressing by glacial ice”, as proposed in the Introduction, is corroborated here.
As the amount of model 3 scenario (a) ice (static load normal to the face) in the cirque decreases, the level of the ice against the riser will fall towards the toe. Thus, the focal point of the force applied to the slope by the ice cover migrates down the riser. As long as the stabilizing load and the direction of the applied force remain sufficient as ice retreats, the detached block will remain stable. However, the load within the cirque is unlikely to be maintained as the ice elevation falls. The applied force is also variable through time and across the riser, as ice primarily deforms by internal flow (Hutter, 1983), such that if any additional pressure were exerted by residual ice adjacent within the Lune gorge, then the ice mass within the cirque would respond accordingly. In particular, the uniaxial compressive strength of ice is low and decreases as ice temperature increases, as will be the case during deglaciation. Although we do not consider the shear stresses associated with the ice in a quantitative sense in our model, brittle fracturing of the thin buttressing ice mass might ultimately occur owing to the constant pressure associated with the mass of the RSF (Bovis, 1982; McColl and Davies, 2013). The presence of a tension crack will redistribute ice load and induce ice segregation (frost cracking) in the rock (Sanders et al., 2012) close to the toe of the rock mass, further reducing the competency. So as the factor of safety falls to close to F=1, the detached block will slowly move downwards. In the final stages of deglaciation, low-density firn (∼400–830 kg m−3) may replace glacier ice (∼830–917 kg m−3), thereby offering less support to the RSF.
The RSF failure was probably controlled by distinct, intersecting small-scale faults, as modelled herein. Within the general area of Great Coum, there appears to be two sets of frequent lineaments, namely one trending to N to NW and the other NE, that intersect to define bedrock blocks. Despite this propensity, the other steep headwalls in these two cirques show no evidence of large-scale instability, although the basal fault plane of the RSF extends (Fig. 4) behind the more western steep buttress in Great Coum, indicating that this slope is also potentially unstable. One fault (BGS, 2008b) and several other lineaments occur roughly normal to this alignment, which in conjunction might delimit a potential wedge failure on this western buttress. In the specific case modelled, slope failure is highly site-specific and depends, primarily, on fault alignments. Steepening of the cirque headwall via glacial erosion may have altered the disposition of the rock mass load, increasing tensile stresses along the fault planes, and promoting the RSF (Ballantyne, 2002). In this respect, the failed slope was preconditioned (sensu McColl and Davies, 2013) to fail. However, the modelling suggests that unloading likely played a role in controlling the timing of the failure and the rate of landslide displacement once initiated. Unloading may simply allow the unsupported preconditioned block to fail, but the stress release accompanying unloading usually is propagated along the fault network, thus resulting in a reduction in the internal locking stresses (i.e. the waviness number; Wyrwoll, 1977; Ballantyne, 2002). Other preparatory factors also come into play as the ice load was removed, such as lubrication of the failure planes by meltwater and weathering of the fault planes in general, thus moving the block closer to F=1.
6.2 Timing of the RSF
Although there is only one terrestrial cosmogenic date for the riser of the RSF, the surface exposure dating of 18 ka (sample OSF) is compatible with the RSF movement during final deglaciation at around 19.2 to 16.6 ka (see Carling et al., 2023, for a review of regional dates). We interpret the much younger exposure age (∼12 ka) on the fault plane (sample HW) as being the result of postglacial weathering and erosion of the fractured failure plane. In contrast, much of the surface of the riser is relatively intact. Exposure dating necessarily only yields a minimum limiting age of exposure, except in cases where primary structures (e.g. glacial striations or slickensides) testify to negligible surface erosion. We observed some slickensides locally preserved on the fault plane, but some degree of surface erosion is also indicated by a scattering of talus and a shattered basal failure plane. We provide an estimate of the magnitude of surface erosion, assuming a range of plausible erosion rates, in Fig. S2, wherein the limitations of having only two cosmogenic samples are addressed.
We note that the locally derived till and absence of northern-derived erratics in the cirques suggests that northern ES1 ice did not enter the cirques, despite the presence of abundant (northern) Shap granite erratics in Borrowdale, Roundthwaite valley, and Bretherdale just to the north (Carling et al., 2023). Thus, buttressing of the slope by ice moving into the cirque from the north can be ruled out. We suggest that the two cirques probably fed valley glaciers associated with diminishing plateau ice fields after the LGM (Carling et al., 2023), and their final form evolved during deglaciation. The Devensian termination is thought to be a 4–5 kyr period of ice decay just prior to the Last Glacial–Interglacial Transition at ∼14.7–11.5 ka (Stone et al., 2010). During deglaciation, there was unlikely to be sufficient ice in the adjacent Lune gorge to bolster the cirque ice mass.
Regarding slope failures in cirques, Cave and Ballantyne (2016) and Klimeŝ et al. (2021) noted that the role of glacial ice support in cirque backwall stability is conditioned by the associated timescales considered. For example, Klimeŝ et al. (2021) reported high factors of safety (>1.95) for potential RSFs beneath glacial ice during the LGM, which is assumed to be the case during full glacial conditions. Ballantyne et al. (2014) demonstrated that, following the LGM, the timing of several dated RSFs is not consistent with the probable timing of glacial debuttressing, reporting ages that correspond to deglaciation and well after. In contrast, at Great Coum, the surface exposure age of 18.0±1.2 ka is consistent with regional estimates of the timing of deglaciation (see Carling et al., 2023), as noted above. However, the apparent delay in final exposure of the fault plane, some time before 12.0±0.8 ka, indicates that a range of exposure ages might be associated with arrested RSFs; indeed, some post-glacial dates may be associated with isostatic controls on slope failure (Ballantyne et al., 2014).
6.3 An ice advance during the Younger Dryas?
An important remaining issue is whether Great Coum could have supported a glacier during the Younger Dryas stadial. Although the Lake District was essentially ice-free by ∼14.7 ka, Younger Dryas cooling led to a subset of cirques in northern Britain refilling briefly (Evans, 1997). Sissons (1980) argued that many central Lake District cirques were reoccupied by ice during the Younger Dryas, and subsequent studies (reviewed by Brown et al., 2011) indicate the presence of cirque glaciers in the central Lake District. However, the lowest Lake District cirque floors are around 305–320 m a.s.l. (Temple, 1965; Evans and Cox, 1995), whereas the basal lip of Little Coum lies at 262 m a.s.l. In this context, Manley (1961) argued that cirques in the Howgill Fells lack evidence for reoccupation during the Younger Dryas because they are too low. Norris and Evans (2017) suggested that the ELA in the western Pennines was 580 m a.s.l. during the Younger Dryas, with the lowest estimate placing the altitude at 445 m a.s.l. (Wilson and Clark, 1995). Similarly, in the eastern Lake District, immediately to the northwest of Great Coum, the ELA has been estimated at 400–600 m, with 400 m being regarded as distinctly marginal (Wilson and Clark, 1998). Glacial ice only descended to altitudes below 400 m a.s.l., where small outlet glaciers were fed from plateau ice fields (McDougall, 2013), the extents of which remain controversial (Bickerdike et al., 2018). In this respect, Harvey (1997) noted that there was no evidence of ice readvance in the west-facing Carlingill, which neighbours Great Coum.
As the top of the headwall of Great Coum is at 468 m a.s.l., with no extensive plateau above, it seems unlikely that the snow supply was sufficient to maintain a Younger Dryas cirque glacier. Others have also noted that Howgill cirques are too low to support Younger Dryas ice but have suggested that the “fresh” appearance of moraines in some Howgill and western Pennine cirques indicate that Younger Dryas ice was maintained locally by extensive snow blow (Gunson and Mitchell, 1991; Mitchell, 1996). If correct, then this would reduce the ELA locally to as low as 311 m a.s.l. (Mitchell, 1996). Mitchell's estimate of the ELA is similar to the best estimate for Little Coum (300 m a.s.l.), and it is noted by several authorities (Manley, 1961; Temple, 1965; Mitchell, 1996) that the dominant wind direction during the Younger Dryas was from the W and SW, associated with cyclonic disturbances. Nevertheless, we are not convinced by this argument. The extensive SW-facing slopes of Grayrigg Forest and Grayrigg Pike are below the Younger Dryas ELA, so it is unlikely that sufficient blown snow could have been supplied to support glacial ice within the Great Coum and Little Coum. Our exposure age of 18.0±1.2 ka (sample OSF), denoting ice-free conditions on the outer face of the RSF, suggests the cessation of glacial erosion at Great Coum.
We have demonstrated that a RSF in the headwall of a cirque in the Lune gorge occurred as a slow downslope movement of an intact rock mass due to the presence of a supporting glacial ice mass buttressing the failed slope. The estimated RSF timing corresponds with regional deglaciation occurring by at least 18.0±1.2 ka.
Although the case study reported herein supports the role of ice buttressing as a process which may explain arrested RSFs, the vagaries of rock structure from one location to another, coupled with the spatially variable role of isostatic uplift and local meltwater climate (Cave and Ballantyne, 2016), provide strong site-specific controls on the nature and timing of RSFs. Further modelling of RSFs should elucidate the range of conditions associated with incipient failure, while additional exposure ages for rock surfaces should assist in constraining the timing during which processes such as glacial debuttressing applied.
SWedge is available from Rocscience Ltd. (https://www.rocscience.com/; Rocscience, 2018), for purchase or as a licensed educational package upon application.
The data required as input to SWedge version 6.0 (2018) are listed in Table 2. Use of SWedge version 6.0 was licensed under an educational agreement with Rocscience Ltd., 2018 (https://www.rocscience.com/, Rocscience, 2018). The 10Be concentrations and underlying AMS data associated with the 10Be exposure ages are published on Zenodo (https://doi.org/10.5281/zenodo.8245908, Cosmogenic nuclide data, 2023).
The supplement related to this article is available online at: https://doi.org/10.5194/esurf-11-817-2023-supplement.
PAC devised the project and conducted the fieldwork and the SWedge 6.0 simulations. TS assisted with the fieldwork. PAC and JDJ wrote the paper. JLA and MFK conducted the cosmogenic nuclide analysis. All authors contributed to the final presentation.
The contact author has declared that none of the authors has any competing interests.
Publisher's note: Copernicus Publications remains neutral with regard to jurisdictional claims in published maps and institutional affiliations.
Teng Su has been supported by the State Scholarship Fund of the China Scholarship Council, including a study visit hosted by the Lancaster Environment Centre, Lancaster University. Rocscience Inc., Toronto, Canada, is thanked for supplying SWedge 6.0 as an educational package. Mike Cavanagh and the Horned Beef Company are thanked for access permission for the collection of rock samples in the cirque. Sam McColl is thanked for commentary on an early version of the paper, which contributed to the final presentation. The reviewers, David Jarman and Tim Davies, are thanked for their detailed comments on the submission.
This research has been supported, in part, by an award to Teng Su from the State Scholarship Fund of the China Scholarship Council.
This paper was edited by Susan Conway and reviewed by Tim Davies and David Jarman.
Allen, S. K., Cox, S. C., and Owens, I. F.: Rock avalanches and other landslides in the central Southern Alps of New Zealand: a regional study considering possible climate change impacts, Landslides, 8, 33–48, https://doi.org/10.1007/s10346-010-0222-z, 2010.
Andersen, J. L., Egholm, D. L., Knudsen, M. F., Jansen, J. D., and Nielsen, S. B.: The periglacial engine of mountain erosion – Part 1: Rates of frost cracking and frost creep, Earth Surf. Dynam., 3, 447–462, https://doi.org/10.5194/esurf-3-447-2015, 2015.
Andersen, J. L., Egholm, D. L., Olsen, J., Larsen, N. K., and Knudsen, M. F.: Topographical evolution and glaciation history of South Greenland constrained by paired 26Al/10Be nuclides, Earth Planet. Sc. Lett., 542, 116300, https://doi.org/10.1016/j.epsl.2020.116300, 2020.
Aveline, W. T., Hughes, T. M., and Strahan, A.: The Geology of the Country around Kendal, Sedbergh, Bowness and Tebay, Memoirs of the Geological Survey, England and Wales, HMSO, London, 94 pp. plus 3 Plates, https://webapps.bgs.ac.uk/data/publications/pubs.cfc?method=viewRecord&publnId=19865206 (last access: 3 January 2023), 1888.
Ballantyne, C. K.: Paraglacial geomorphology, Quaternary Sci. Rev., 21, 1935–2017, 2002.
Ballantyne, C. K.: Periglacial Geomorphology, Wiley, 472 pp., ISBN 978-1-405-10006-9, 2018.
Ballantyne, C. K., Wilson, P., Gheorghiu, D., and Rodés, À.: Enhanced rock-slope failure following ice-sheet deglaciation: timing and causes, Earth Surf. Proc. Land., 39, 900–913, 2014.
Barr, I. D., Ely, J. C., Spagnolo, M., Clark, C. D., Evans, I. S., Pellicer, X. M., Pellitero, R., and Rea, B. R.: Climate patterns during former periods of mountain glaciation in Britain and Ireland: Inferences from the cirque record, Palaeogeogr. Palaeocl. Palaeoecol., 485, 466–475, 2017.
BGS – British Geological Survey: Geological Survey of England and Wales geological map series, New Series Sheet 39, Bedrock, Kendal, Ordnance Survey, https://webapps.bgs.ac.uk/data/maps/maps.cfc?method=viewRecord&mapId=9103 (last access: 3 January 2023), 2008a.
BGS – British Geological Survey: Geological Survey of England and Wales geological map series, New Series Sheet 39, Bedrock and Superficial Deposits, Kendal, Ordnance Survey, https://webapps.bgs.ac.uk/data/maps/maps.cfc?method=viewRecord&mapId=9103, (last access: 3 January 2023) 2008b.
BGS – British Geological Survey: Borehole records, http://www.bgs.ac.uk/data/boreholescans/home.html (last access: 4 March 2022), 2022.
Bickerdike, H. L., Ó Cofaigh, C., Evan, D. J. A., and Stokes, C. R.: Glacial land systems, retreat dynamics and controls on Loch Lomond Stadial (Younger Dryas) glaciation in Britain, Boreas, 47, 202–224, 2018.
Bonilla-Sierra, V., Scholtès, L., Donzé, F.-V., and Elmouttie, M.: DEM analysis of rock bridges and the contribution to rock slope stability in the case of translational sliding failures, Int. J. Rock Mech. Min. Sci., 80, 67–78, 2015.
Borchers, B., Marrero, S., Balco, G., Caffee, M., Goehring, B., Lifton, N., Nishiizumi, K., Phillips, F., Schaefer, J., and Stone, J.: Geological calibration of spallation production rates in the CRONUS-Earth project, Quatern. Geochronol., 31, 188–198, 2016.
Bovis, M. J.: Uphill-facing (antislope) scarps in the Coast Mountains, southwest British Columbia, Geol. Soc. Am. Bull., 93, 804–812, 1982.
Brown, V. H., Evans, D. J. A., and Evans, I. S.: The glacial geomorphology and surficial geology of the south-west English Lake, District, J. Maps, 7, 221–243, 2011.
Brown, V. H., Evans, D. J. A., Vieli, A. and Evans, I. S.: The Younger Dryas in the English Lake District: reconciling geomorphological evidence with numerical model outputs, Boreas, 42, 1022–1042, 2013.
Carling, P. A., Su, T., and Meshkova, L.: Distribution of Devensian glacial erratics and related evidence elucidate complex ice flow changes across a former ice divide: Northern England, Proc. Geol. Assoc., 134, 139–165, 2023.
Cave, J. A. S. and Ballantyne, C. K.: Catastrophic rock-slope failures in NW Scotland: quantitative analysis and implications, Scott. Geogr. J., 132, 185–209, 2016.
Chiverrell, R. C. and Thomas, G. S. P.: Extent and timing of the last glacial maximum (LGM) in Britain and Ireland: a review, J. Quaternary Sci., 25, 535–549, 2010.
Chiverrell, R. C., Smedley, R. K., Small, D., Ballantyne, C. K., Burke, M. J., Callard, S. L., Clark, C. D., Duller, G. A. T., Evans, D. J. A., Fabel, D., Van Landeghem, K., Livingstone, S., O Cofaigh, C., Thomas, G. S. P., Roberts, D. H., Saher, M., Scourse, J. D., and Wilson, P.: Ice margin oscillations during deglaciation of the northern Irish Sea Basin, J. Quaternary Sci., 33, 739–762, 2018.
Clark, C. D., Ely, J. C., Greenwood, S. L., Hughes, A. L. C., Meehan, R., Barr, I. D., Bateman, M. D., Bradwell, T., Doole, J., Evans, D. J. A., Jordan, C. J., Monteys, X., Pellicer, X. M., and Sheehy, M.: BRITICE Glacial Map, version 2: a map and GIS database of glacial landforms of the last British–Irish Ice Sheet, Boreas, 47, 11–27, 2018.
Clark, P. U., Dyke, A. S., Shakun, J. D., Carlson, A. E., Clark, J., Wohlfarth, B., Mitrovica, J. X., Hostetler, S. W., and McCabe, M.: The last glacial maximum, Science, 325, 710–714, 2009.
Cody, E., McColl, S., Draebing, D., and Cook, S.: Structural control and development of the ice buttressed Mueller rockslide, New Zealand, in: Geophysical Research Abstract 30, EGU General Assembly, 8–13 April 2018, Vienna, EGU2018-10748, https://www.geophysical-research-abstracts.net/egu2018.html (last access: 14 August 2023), 2018.
Colgan, W. and Arenson, L. U.: Open-pit glacier ice excavation: brief review, J. Cold Reg. Eng., 27, 223–243, 2013.
Cosmogenic nuclide data: CosmoAarhus/LakeDistrict_CosmoData: LakeDistrict_CosmoData (v1.0.0), Zenodo [data set], https://doi.org/10.5281/zenodo.8245908, 2023.
Cossart, E., Braucher, R., Fort, M., Bourlès, D. L., and Carcaillet, J.: Slope instability in relation to glacial debuttressing in alpine areas (Upper Durance catchment, southeastern France): Evidence from field data and 10Be cosmic ray exposure ages, Geomorphology, 95, 3–26, 2008.
Davies, B. J., Livingstone, S. J., Roberts, D. H., Evans, D. J. A., Gheorghiu, D. M., and Ó Cofaigh, C.: Dynamic ice stream retreat in the central sector of the last British-Irish Ice Sheet, Quaternary Sci. Rev., 225, 105989, https://doi.org/10.1016/j.quascirev.2019.105989, 2019.
Ehlers, J. and Gibbard, P. L.: Overview, in: Encyclopedia of Quaternary Science, vol. 2., edited by: Elias, S. A., Elsevier, Amsterdam, 143–150, ISBN 978-0-444-52747-9, 2013.
Evans, I. S.: Cirques and moraines of the Helvellyn Range, Cumbria: Grisdale and Ullswater, in: Geomorphology of the Lake District: A Field Guide, edited by: Boardman, J., BGRG Spring Field Meeting, 16–18 May 1997, Blencathra Field Centre, Published by Environmental Change Unit, University of Oxford, 63–87, 1997.
Evans, I. S. and Cox, N. J.: The form of glacial cirques in the English Lake District, Cumbria, Z. Geomorphol., 39, 175–202, 1995.
Goodchild, J. G.: The glacial phenomena of the Eden valley and the western part of the Yorkshire Dales District, Q. J. Geol. Soc., 31, 55–99, 1875.
Goodchild, J. G.: An outline of the geological history of the Eden valley or Edenside, Proc. Geol. Assoc., 2, 258–284, 1889.
Gruber, S. and Haeberli, W.: Permafrost in steep bedrock slopes and its temperature-related destabilization following climate change, J. Geophys. Res., 112, F02S18, https://doi.org/10.1029/2004GL020051, 2007.
Gruber, S., Hoezle, M., and Haeberli, W.: Permafrost thaw and destabilization of Alpine rockwalls in the hot summer of 2003, Geophys. Res. Lett., 31, L13504, https://doi.org/10.1029/2006JF000547, 2004.
Gunson, A. R. and Mitchell, W. A.: Combe Scar, in: Western Pennines: Field Guide, edited by: Mitchell, W. A., Quaternary Research Association, London, 104–110, https://www.qra.org.uk/ (last access: 3 January 2023), 1991.
Harkness, R.: On the distribution of Wastdale-Crag blocks, “Shap-granite boulders” in Westmorland, Q. J. Geol. Soc., 26, 517–528, 1870.
Harley, J. B.: Chapter 11 The accuracy of Ordnance Survey maps, in: Ordnance Survey Maps a descriptive manual, HMSO, London, ISBN 10:0319000001, 1975.
Hartmeyer, I., Delleske, R., Keuschnig, M., Krautblatter, M., Lang, A., Schrott, L., and Otto, J.-C.: Current glacier recession causes significant rockfall increase: the immediate paraglacial response of deglaciating cirque walls, Earth Surf. Dynam., 8, 729–751, https://doi.org/10.5194/esurf-8-729-2020, 2020.
Harvey, A. M.: Fluvial geomorphology of north-west England, in: Fluvial Geomorphology of Great Britain, The Geological Conservation Review Series, edited by: Gregory, K. J., Springer, Dordrecht, 173–200, ISBN 978-0-412-78930-4, 1997.
Hasler, A., Gruber, S., Font, M., and Dubois, A.: Advective heat transport in frozen rock clefts: conceptual model, laboratory experiments and numerical simulation, Permafrost Periglac. Process., 22, 378–389, 2011.
Hilger, P., Hermanns, R. L., Gosse, J. C., Jacobs, B., Etzelmüller, B., and Krautblatter, M.: Multiple rock-slope failures from Mannen in Romsdal Valley, western Norway, revealed from Quaternary geological mapping and 10Be exposure dating, Holocene, 28, 1841–1854, 2018.
Hoek, E. T. and Bray, J. W.: Rock Slope Engineering, in: 3rd Edn., Institute of Mining and Metallurgy, London, https://doi.org/10.1201/9781482267099, 1981.
Hollingsworth, S. E.: Glaciation of western Edenside and the adjoining areas and the drumlins of Edenside and the Solway plain, Q. J. Geol. Soc., 87, 281–357, 1931.
Holm, K., Bovis, M., and Jakob, M.: The landslide response of alpine basins to post-Little Ice Age glacial 520 thinning and retreat in southwestern British Columbia, Geomorphology, 57, 201–216, 2004.
Hutter, K.: Theoretical Glaciology: Material Science of Ice and the Mechanics of Glaciers and Ice Sheets, Springer, ISBN 978-0-946417-98-8, 1983.
Jaeger, J. C. and Cook, N. G. W.: Fundamentals of Rock Mechanics, in: 3rd Edn., Chapman and Hall, London, ISBN 0412220105, 1979.
Jarman, D.: Large rock slope failures in the Highlands of Scotland: Characterisation, causes and spatial distribution, Eng. Geol., 83, 161–182, 2005.
Jarman, D. and Wilson, P.: Clough Head – Threlkeld Knotts: A perplexing RSF complex, in: The Quaternary of the Lake District – Field Guide, edited by: McDougall, D. A. and Evans, D. J. A., Quaternary Research Association, London, 153–173, https://eprints.worc.ac.uk/5112/ (last access: 3 January 2023), 2015a.
Jarman, D. and Wilson, P.: Anomalous terrain at Dove Crags “cirqueform” and Gasgale Gill asymmetric valley, English Lake District, attributed to large-scale rock slope failure of pre-LGM origins, Proc. Yorkshire Geol. Soc., 60, 243–257, 2015b.
Klimeŝ, J., Novotný, J., Rapre, A. C., Balek, J., Pavel Zahradníĉek, J. C., Strozzi, T., Sana, H., Frey, H., René, M., Štěpánek, P., Meitner, J., and Junghardt, J.: Paraglacial rock slope stability under changing environmental conditions, Safuna Lakes, Cordillera Blanca Peru, Front. Earth Sci., 9, 607277, https://doi.org/10.3389/feart.2021.607277, 2021.
Lal, D.: Cosmic-ray labeling of erosion surfaces: in situ nuclide production rates and erosion models, Earth Planet. Sc. Lett., 104, 424–439, 1991.
Le Roux, O., Schwartz, S., Gamond, J. F., Jongmans, D., Bourles, D., Braucher, R., Mahaney, W., Carcaillet, J., and Leanni, L.: CRE dating on the head scarp of a major landslide (Séchilienne, French Alps), age constraints on Holocene kinematics, Earth Planet. Sc. Lett., 280, 236–245, 2009.
Letzer, J. M.: The glacial geomorphology of the region bounded by Shap Fells, Stainmore and the Howgill Fells in east Cumbria, Unpublished M. Phil. thesis, University of London, London, 340 pp., https://ethos.bl.uk/OrderDetails.do?uin=uk.bl.ethos.738150 (last access: 3 January 2023), 1978.
Lifton, N., Sato, T., and Dunai, T. J.: Scaling in situ cosmogenic nuclide production rates using analytical approximations to atmospheric cosmic-ray fluxes, Earth Planet. Sc. Lett., 386, 149–160, 2014.
Livingstone, S. J., Evans, D. J. A., and Ó Cofaigh, C.: Re-advance of Scottish ice into the Solway Lowlands (Cumbria, UK) during the Main Late Devensian deglaciation, Quaternary Sci. Rev., 29, 2544–2570, 2010.
Livingstone, S. J., Evans, D. J. A., Cofaigh, C. Ó, Davies, B. J., Merritt, J. W., Huddart, D., Mitchell, W. A., Roberts, D. H., and Yorke, L.: Glaciodynamics of the central sector of the last British-Irish Ice Sheet in Northern England, Earth-Sci. Rev., 111, 25–55, 2012.
Lowe, J. J., Rasmussen, S. O., Björck, S., Hoek, W. Z., Steffensen, J. P., Walker, M. J. C., Yu, Z. C., and the INTIMATE group.: Synchronisation of palaeoenvironmental events in the North Atlantic region during the Last Termination: a revised protocol recommended by the INTIMATE group, Quaternary Sci. Rev., 27, 6–17, 2008.
Manley, G.: The Late-glacial climate of North-West England, Geol. J., 2, 188–215, 1961.
Marr, J. E. and Fearnsides, W. G.: The Howgill Fells and their topography, Q. J. Geol. Soc., 65, 587–610 plus plates, 1909.
McColl, S. T.: Paraglacial rock-slope stability, Geomorphology, 153–154, 1–16, 2012.
McColl, S. T. and Davies, T. R. H.: Large ice-contact slope movements: glacial buttressing, deformation and erosion, Earth Surf. Proc. Land., 38, 1102–1115, 2013.
McColl, S. T., Davies, T. R. H., and McSaveney, M. J.: Glacier retreat and rock-slope stability: debunking debuttressing, Delegate Papers, Geologically Active, in: 11th Congress of the International Association for Engineering Geology and the Environment, Auckland, 5–10 September 2010, Aotearoa, Auckland, New Zealand, 467–474, ISBN 9780415600347, 2010.
McDougall, D.: Glaciation style and the geomorphological record: evidence for Younger Dryas glaciers in the eastern Lake District, northwest England, Quaternary Sci. Rev., 73, 48–58, 2013.
Merritt, J. W., Hall, A. M., Gordon, J. E., and Connell, E. R.: Late Pleistocene sediments, landforms and events in Scotland: a review of the terrestrial stratigraphic record, Earth Environ. Sci. Trans. Roy. Soc. Edinburgh, 110, 39–91, 2019.
Miller, S. M.: Modelling shear strength at low normal stresses for enhanced rock slope engineering, in: Proceedings of the 39th Highway Geology Symposium, 17–19 August 1988, Park City, Utah, 346–356, https://www.highwaygeologysymposium.org/past-proceedings/ (last access: 3 January 2023), 1988.
Mitchell, W. A.: Significance of snowblow in the generation of Loch Lomond Stadial (Younger Dryas) glaciers in the western Pennines, northern England, J. Quaternary Sci., 11, 233–248, 1996.
Moore, J. R., Sanders, J. W., Dietrich, W. E., and Glaser, S. D.: Influence of rock mass strength on the erosion rate of alpine cliffs, Earth Surf. Proc. Land., 34, 1339–1352, 2009.
Moseley, F.: Joints and other structures in the Silurian rocks of the southern Shap Fells, Westmorland, Geol. J., 6, 79–96, 1968.
Moseley, F.: A tectonic history of N.W. England, Q. J. Geol. Soc. Lond., 128, 561–598, 1972.
Moulson, J. R.: Some Aspects of the Geomorphology of the Lune Basin, Unpublished MA thesis, UoM Library Catalogue MMS ID 991560524401631, University of Manchester, Manchester, 1966.
Nishiizumi, K., Imamura, M., Caffee, M. W., Southon, J. R., Finkel, R. C., and McAninch, J.: Absolute calibration of 10Be AMS standards, Nucl. Instrum. Meth. Phys. Res. Sect. B, 258, 403–413, 2007.
Norris, S. L. and Evans, D. J. A.: High Cup Plain – a Younger Dryas palaeoglacier, in: The Quaternary Landscape History of Teesdale and the North Pennines – Field Guide, edited by: Evans, D. J. A., Quaternary Research Association, London, 231–236, ISBN 0907780253, 2017.
Porter, S. C.: Snowline depression in the tropics during the Last Glaciation, Quaternary Sci. Rev., 20, 1067–1091, 2001.
Rasmussen, S. O., Andersen, K. K., Svensson, A. M., Steffensen, J. P., Vinther, B. M., Clausen, H. B., Siggaard-Andersen, M.-L., Johnsen, S. J., Larsen, L. B., Dahl-Jensen, D., and Bigler, M.: A new Greenland ice core chronology for the last glacial termination, J. Geophys. Res., 111, D06102, https://doi.org/10.1029/2005JD006079, 2006.
Rocscience Ltd.: SWEDGE-Probabilistic analysis of the geometry and stability of surface wedges, Toronto, Canada, https://www.rocscience.com/ (last access: 3 January 2023), 2018.
Rose, J.: The Dimlington Stadial/Dimlington Chronozone: a proposal for naming the main glacial episode of the Late Devensian in Britain, Boreas, 14, 225–230, 1985.
Rose, J. and Letzer, J. M.: Superimposed drumlins, J. Glaciol., 18, 471–480, 1977.
Sanders, J. W., Cuffey, K. M., Moore, J. R., MacGregor, K. R., and Kavanaugh, J. L.: Periglacial weathering and headwall erosion in cirque glacier bergschrunds, Geology, 40, 779–782, 2012.
Sass, O.: Spatial patterns of rockfall intensity in the northern Alps, Z. Geomorphol., 138, 51–65, 2005.
Scourse, J. D., Haapaniemi, A. I., Colmenero-Hidalgo, E., Peck, V. L., Hall, I. R., Austin, W. E. N., Knutz, P. C., and Zahn, R.: Growth, dynamics and deglaciation of the last British-Irish ice sheet: the deep-sea ice-rafted detritus record, Quaternary Sci. Rev., 28, 3066–3084, 2009.
Sissons, J. B.: The Loch Lomond Advance in the Lake District, northern England, Trans. R. Soc. Edinburgh: Earth Sci., 71, 13–27, 1980.
Soper, N. J.: The Windermere Supergroup of sheets NY50 and NY60. Southern Shap Fells and Northern Howgill Fells, Cumbria, British Geological Survey Technical Report WA/99/35, British Geological Survey, 18 pp. plus 8 figures, https://core.ac.uk/display/60683 (last access: 3 January 2023), 1999.
Soper, N. J.: Notes on the Windermere supergroup of the country between Kendal and the River Lune (1:25 000-scale sheets SD59 and SD69 west), British Geological Survey Internal Report IR/06/081, British Geological Survey, 15 pp., https://core.ac.uk/display/60683 (last access: 3 January 2023), 2006.
Stead, D. and Wolter, A.: A critical review of rock slope failure mechanisms: the importance of structural geology, J. Struct. Geol., 74, 1–23, 2015.
Stone, P., Millward, D., Young, B., Merritt, J. W., Clarke, S. M., McCormac, M., and Lawrence, D. J. D.: Main Late Devensian glaciation of north-west England, in: British Regional Geology: Northern England, 5th Edn., unpaginated, British Geological Survey, Keyworth, Nottingham, Northern England, https://earthwise.bgs.ac.uk/index.php/Main_Late_Devensian_glaciation_of_north-west_England (last access: 3 January 2023), 2010.
Taylor, B. J., Burgess, I. C., Land, D. H., Mills, D. A. C., Smith, D. B., and Warren, P. T.: Northern England: British Regional Geology, in 4th Edn., HMSO, London, 125 pp., https://earthwise.bgs.ac.uk/index.php/British_regional_geology:_Northern_England (last access: 3 January 2023), 1971.
Temple, P. H.: Some aspects of cirque distribution in the west-central Lake District, northern England, Geogr. Ann. A, 47, 185–193, 1965.
Whalley, W. B., Douglas, G. R., and Jonnson, A.: The magnitude and frequency of large rockslides in Iceland in the postglacial, Geogr. Ann. A, 65, 99–110, 1983.
Whittall, J., Eberhardt, E., and McDougall, S.: Runout analysis and mobility observations for large open pit slope failures, Can. Geotech. J., 54, 373–291, 2017.
Wilson, P.: Paraglacial rock-slope failures in Wasdale, western Lake District, England: morphology, styles and significance, Proc. Geol. Assoc., 116, 349–361, 2005.
Wilson, P. and Clark, R.: Landforms associated with a Loch Lomond Stadial glacier at Cronkley Scar, Teesdale, northern Pennines, Proc. Yorkshire Geol. Soc., 50, 277–283, 1995.
Wilson, P. and Clark, R.: Characteristics and implications of some Loch Lomond Stadial moraine ridges and later landforms, eastern Lake District, northern England, Geol. J., 33, 73–87, 1998.
Wilson, P. and Jarman, D.: Rock slope failure in the Lake District, NW England: an overview, Geogr. Ann. A, 104, 201–225, 2022.
Wilson, P. and Lord, T.: Towards a robust deglacial chronology for the northwest England sector of the last British-Irish Ice Sheet, North West Geogr., 14, 1–11, 2014.
Wilson, P., Clark, R., and Smith, A.: Rock-slope failures in the Lake District: A preliminary report, Proc. Cumberland Geol. Soc., 7, 13–36, 2004.
Wyrwoll, K.-H.: Causes of rock-slope failure in a cold area: Labrador-Ungava, Geol. Soc. Am. Rev. Eng. Geol., 3, 59–67, 1977.