the Creative Commons Attribution 4.0 License.
the Creative Commons Attribution 4.0 License.
 | 08 Oct 2024
Storm frequency, magnitude, and cumulative storm beach impact along the US east coast
Rachele Dominguez
Michael S. Fenster
John W. McManus
This study extracted historical water level data from 12 National Oceanographic and Atmospheric Administration tide gauge stations, spanning the period from the early 20th century to 2022 from central Maine to southern Florida, in order to determine if temporal and spatial trends existed in the frequency and magnitude of storms along the US Atlantic Ocean coast. We used the Storm Erosion Potential Index (SEPI) to identify and quantify storms. We then use the timing and magnitude of those storms to determine the cumulative effect of storm clustering and large-magnitude storms on sandy beaches using the cumulative storm impact index (CSII) empirical model. The results from this study showed (1) no appreciable increase in storm frequency at any of the stations (except for sheltered stations susceptible to storm tide augmentation), (2) statistically significant but modest increases in storm magnitudes over time for 8 of the 12 tidal stations, (3) regional differences in storm magnitudes (SEPI) and cumulative storm impacts (CSII) characteristic of more frequent extratropical storms (temporal clustering) in the north and less frequent tropical storms in the south, and (4) a 4- to 10-year recovery period for regional beach recovery.
- Article
(6055 KB) - Full-text XML
-
Supplement
(744 KB) - BibTeX
- EndNote


Questions about storm frequency and strength that impact our world's coasts loom large in light of climate-induced storm impacts on physical, ecological, and human socioeconomic coastal systems. Answers to these questions have come from synoptic studies that model oceanographic and meteorologic dynamics and/or studies that seek to quantify the oceanic and coastal responses to meteorologically induced disturbances along coasts using various metrics (e.g., Zhang et al., 2001; Komar and Allan, 2008; Harley, 2017). Regional and global climate models analyze storms using equations that describe the physical laws that govern the interactions among the atmosphere, oceans, land, and ice to simulate future projected outcomes (e.g., Leckebusch and Ulbrich, 2004; Leckebusch et al., 2006; Martin et al., 2006; Muis et al., 2023). Empirical studies use measurable historical proxies or metrics to provide insight into the formation, evolution, frequency, intensity, and duration of storms (e.g., Bengtsson et al., 2007; Knutson et al., 2007, 2008; Gualdi et al., 2008; Zhao et al., 2009; Bender et al., 2010). Thus, empirical studies tend to focus on quantifying storminess using parameters such as wave height, wave power (or energy), water level (storm tide, storm surge), and/or storm tracks (e.g., Bigelow and Moore, 1897; Hosler and Gamage, 1956; Klein, 1951, 1958, 1965; Hayden, 1975, 1981, 1999; Lozano and Swail, 2002; Meyer and Gaslikova, 2024).
Because of complexities in modeling the thermodynamic responses of storms to global warming and model domain and resolution limitations (Vecchi et al., 2008; Shaw et al., 2016; Knutson et al., 2020; Sobel et al., 2021), extreme storm simulations offer inconsistent conclusions about storm frequency projections but tend to agree more on storm magnitude forecasts. Several studies and reviews, including the review provided by the Intergovernmental Panel on Climate Change's Sixth Assessment Report, indicate that the total global frequency of tropical storms will decrease or remain constant (Tory et al., 2013; Knutson et al., 2020; Seneviratne et al., 2021). In fact, Knutson et al. (2020) indicated that 22 of 27 modeling studies at the time of their publication projected decreasing global tropical cyclone frequency. Others suggest that no clear trends or explainable variation exist in tropical storm frequency (Sobel et al., 2021). However, some models predict an increase in storm frequency (Camargo, 2013; Emanuel, 2013; Murakami et al., 2014; Wehner et al., 2015; Bhatia et al., 2018; Sobel et al., 2021), especially the more intense category 4 and 5 tropical cyclones (Bender et al., 2010; Emanuel, 2013; Knutson et al., 2020).
More consensus exists in the modeling results that project an increase in mean tropical cyclone peak intensity and significant global increases in the proportion of major tropical cyclone intensities driven by warmer sea surface temperatures, especially as shown by finer-resolution models (Knutson et al., 2010, 2015, 2019, 2020; Murakami et al., 2015; Walsh et al., 2015, 2016; Wehner et al., 2015; Zarzycki and Ullrich, 2017; Roberts et al., 2020; Seneviratne et al., 2021). Based on a synopsis of 11 studies, Knutson et al. (2020) showed that projected changes in tropical cyclone maximum intensities will increase in the North Atlantic basin by about 3 % compared to a median increase for all global basins of approximately 5 % and that globally, category 4 and 5 tropical cyclones will increase by about 13 %. With respect to extratropical storms, Seneviratne et al. (2021) suggest that current climate models lack the resolution to provide a high degree of projection confidence and therefore underestimate extratropical storm intensity. However, Colle et al. (2013) found that the best (highest-resolution) Coupled Model Intercomparison Project (CMIP5) models projected a 5 %–10 % increase in cyclones and 5 %–40 % increase in deeper cyclones (<980 hPa) by the late 21st century inland along the US east coast, but a 15 %–20 % decrease in cyclones and little increase in strong cyclones over the east coast water domain. Zappa et al. (2013), Chang (2014, 2018), and Seiler and Zwiers (2016) found similar decreases in extratropical cyclone frequency in various locations within the Pacific and Atlantic basins.
Models have projected that additional climate-induced changes to storms will likely include an increase in tropical and extratropical storm rain rates and wind speeds, poleward shifting of storm tracks in both hemispheres, a slowing of cyclone translation speed, and an increase in storm surges, all of which will increase coastal vulnerability (e.g., Kossin, 2018; Yamaguchi et al., 2020; Seneviratne et al., 2021; Muis et al., 2023). Global projections of storm surges based on a high-resolution (2.5 km grids) coupled tide–surge model and a climate hydrodynamic model suggest that median storm surges may increase up to 20 % in the future epoch (2021–2050) compared to the historical epoch (1951–1980) although nonuniformly in space (Muis et al., 2023).
Empirical studies use metrics such as best-track position, geographic distributions of cyclones (e.g., mean latitude where cyclones reach their peak intensity), numbers (counts), some measure of magnitude or intensity, translation speed, length in days (track duration), accumulated cyclone energy, power dissipation index, rainfall rates, and rainfall area to assess the frequency and intensity of tropical and extratropical cyclones. The heterogeneous nature of historical instrumental data (“best-track” data) and temporal data limitations have made detecting long-term (decadal to centennial) trends in tropical cyclone frequency or intensity difficult (Schreck et al., 2014; Seneviratne et al., 2021). This finding does not preclude the possibility of the existence of historical trends but speaks more to data reliability. In fact, later studies which have sought to homogenize best-track tropical cyclone data and utilize more recent satellite data are consistent with model projections, i.e., a decreasing number of tropical storms and tropical storm days, increasing intensities with stronger hurricanes (categories 3–5) increasing at a greater rate, and a poleward migration of locations where tropical storms reach their peak intensities (Emanuel, 2005; Webster et al., 2005; Kang and Elsner, 2012; Kishtawal et al., 2012; Kossin et al., 2013, 2020; Holland and Bruyère, 2014; Mei and Xie, 2016; Zhao et al., 2018; Tauvale and Tsuboki, 2019; Seneviratne et al., 2021). While five of the six global ocean basins displayed increasing tropical cyclone intensity between 1979–2017, the North Atlantic basin had the greatest changes with exceedance probabilities of major hurricanes increasing by 49 % per decade at the 99 % confidence level (Kossin et al., 2020). A review of previous studies using proxy data and climate model data to assess storminess in the North Atlantic showed that storm activity trend analyses strongly depend on the time period used in the analysis and that storm numbers have increased for the most recent decades but show interdecadal variation over centennial timescales (Feser et al., 2014).
Empirical, statistical (probabilistic), and modeling studies designed to couple storm impacts (drivers and forcings) to beach responses have advanced our understanding of coastal system dynamics and hazards, although inferences can differ depending on the specific storm metric(s) used and the coastal impact spatial scale examined. In some cases, these coupled dynamical studies have led to the development of hazard or storm erosion predictive indices (e.g., Thieler and Hammar-Klose, 1999; Stockdon et al., 2007; Mclaughlin and Cooper, 2010; Torresan et al., 2012; Birchler et al., 2015; Leaman et al., 2021; Ahmed et al., 2022, among many). Hamid et al. (2019) provide a review of these indices in three categories: (1) socioeconomic, (2) coastal characteristics, and (3) coastal forcing variables. While some studies have evaluated the direct effects of storms on coasts using observable and measurable geological (i.e., geomorphological and sedimentological) and/or ecological changes (e.g., Burvingt et al., 2017; Harley et al., 2022), other studies have produced methods to quantify beach erosion potential, which indirectly evaluates the effects of storms on coastal systems (e.g., Zhang et al., 2001; Miller and Dean, 2006; Miller and Livermont, 2008). With respect to potential erosion, in general, larger-magnitude storms or storms clustered in time have a larger beach erosion potential (Karunarathna et al., 2014; Fenster and Dominguez, 2022). Finally, it should be noted that storm impact studies have investigated storm-driven process–response relationships over a variety of 1D, 2D, and 3D spatial scales including the shoreline, beach face, dune, island, shoreface, littoral zone, and larger reaches, as well as combinations of these scale features (e.g., Morgan and Stone, 1985; Sallenger, 2000; Zhang et al., 2001; Stockdon et al., 2007; Birchler et al., 2015).
At the spatial scale of the US east coast and centennial temporal scale, natural and potential anthropogenic forcings (e.g., sea level rise and storms) threaten increasing populations and coastal development and ecosystems, especially given the geographic position of the US coastline relative to extratropical and tropical storm tracks (e.g., Dolan and Davis, 1994; Friedman et al., 2002; Dinan, 2017; Little et al., 2015; Doran et al., 2021). While much is known about the rates, spatial distribution, and acceleration of sea level rise along the US east coast during the 20th and 21st centuries (e.g., Sallenger et al., 2012; Ezer, 2013; Ezer et al., 2013; Yin and Goddard, 2013; Harvey et al., 2021; Chi et al., 2023; Yin, 2023) and changes to the wave climate over decadal timescales (e.g., Davis et al., 1993; Bromirski and Kossin, 2008; and Komar and Allan, 2007), less is known about changes to the storminess (frequency and changes in strength) over longer coastal reaches and timescales – especially using empirical data. Zhang et al. (2000) investigated water level data from 10 tide gauges from Florida to Maine and found no discernible long-term trend in the number and intensity of moderate and severe coastal storms during the 20th century.
This study updates the Zhang et al. (2000, 2001) Storm Erosion Potential Index (SEPI) assessment of storminess along the US east coast and uses a newly developed cumulative storm impact index (CSII) to account for the effects of storm clustering and the strength of previous storms on potential beach erosion along the US east coast (Fenster and Dominguez, 2022). Like Zhang et al. (2000, 2001), we use water level data (storm tide and storm surge) to identify storms (rationale provided in Sect. 2.1, “Storm identification”). In particular, we assess the frequency and magnitude of storms along the eastern US coast using historical water level data from 12 tidal gauge stations located from Portland, Maine, to Key West, Florida, and compare these results to known storm climatology of tropical and extratropical cyclones (e.g., Mather et al., 1964; Zishka and Smith, 1980; Davis et al., 1993; Hirsch et al., 2001; Kossin et al., 2017; Knutson et al., 2020). This study seeks to answer the following questions:
-
What is the annual storm frequency at these locations, how does storm frequency compare geographically, and has annual storm frequency changed significantly over the time period of record?
-
What is the total annual magnitude of storms at these locations, how does this quantity compare geographically, and has the annual storm magnitude changed significantly over the time period of record?
-
What is the cumulative effect of individual storm magnitudes and frequency (clustering in time) on sandy beaches near these locations?
For this study, we assume, as did Zhang et al. (2001), that the process data obtained from a tide gauge station allow us to make regional-scale (i.e., kilometers) inferences about beach erosion potential along the US east coast. The database and the index used to quantify beach erosion potential (SEPI) for this study avoid problems associated with heterogenous historical instrumentation data, relying on hindcast data and data that only permit frequency analyses and afford analyses over a wide geographic area and long time periods (centennial scale). In addition, this study addresses questions and concerns about the risk of storm surges increasing in concert with sea level rise (Ghanavati et al., 2023) – especially along the US eastern seaboard, which is especially vulnerable to extratropical storms given the orientation of its beaches relative to extratropical cyclone paths (Davis et al., 1993). A primary advantage of using this method is that sea level change (i.e., rise) is removed to isolate the impact of storms on beach erosion potential, and therefore a rise in sea level will exacerbate identified beach erosion potential stemming from storm tides and storm surges.
Below, we present our criteria for identifying storms and quantifying storm magnitude using the Storm Erosion Potential Index (SEPI) and a cumulative storm impact index (CSII) (Zhang et al., 2000, 2001; Fenster and Dominguez, 2022). We then describe the data retrieval process used to acquire water level data from the National Oceanic and Atmospheric Administration (NOAA) Tides and Currents Database (NOAA, 2024) and finally the methods used to analyze these data.
2.1 Storm identification
Following Zhang (1998) and Zhang et al. (2000, 2001), we adopt the Storm Erosion Potential Index (SEPI), defined below, to identify storms and quantify storm magnitude using water level data from tide gauges. These studies have advocated for the use of storm surge (i.e., non-tidal residuals) as a proxy for storm waves, highlighting storm tide and storm duration as the primary factors contributing to beach erosion (Dean, 1991; Zhang, 1998; Zhang et al., 2000, 2001).
Recent studies have shown that wave runup (swash and setup processes) can contribute to extreme water levels and can induce spatially varying erosion impacts along coastlines due to varying continental shelf widths (Stockdon et al., 2007, 2023; Parker et al., 2023). However, Cohn et al. (2019) used new field datasets and a numerical model to show that anomalously high still water levels (caused by storm surge or spring tides) have a greater potential to produce dune erosion than the largest wave energy. Additionally, the effect of storm surge is purported to be larger (and the wave-driven component smaller) on the US east coast than the west coast because the narrower continental shelves on the west coast limit storm surge (and enhance wave energy) more than the wider east coast shelves (Cohn et al., 2019). Serafin et al. (2017) found that slight increases in wave runup and a doubling of storm surge contribute to increases in extreme total water level events and make the case that the storm surge (high-frequency residuals) can have a 10-fold greater effect on beach erosion on the east coast than the west coast during large storms. While SEPI and water level data do not account for potential wave runup (Stockdon et al., 2007, 2023), Zhang et al. (2001) found a linear relationship between extreme storm surges and storm waves (wave heights > 2 m), indicating that storm surges make excellent surrogates for storm waves in representing the strength of large storms. The use of storm surge data over wave data is further motivated by the reliability and long-term availability of water level, storm tide, and storm surge data.
In order to contribute to the SEPI, water level data must exceed two thresholds.
-
The verified water level V (the storm tide) must exceed the average mean high water, (Fig. 1).
-
The storm surge (the height of the storm tide V above the predicted tide P) must exceed 2 standard deviations above its average of zero (Fig. 2).
The second criterion is a statistical barrier that only selects the most extreme storm surges during the period of record (Zhang et al., 2000, 2001). The threshold of storm surges in excess of 2 standard deviations is consistent with previous research (e.g., Zhang et al., 2000, 2001) finding that a linear relationship exists between 2 standard deviations of the storm surge and large waves (Hs>2 m). Additionally, using 2 standard deviations provides reasonable results by not identifying too many storms or too few storms relative to named storms (see the Results section and Tables S1 and S2 in the Supplement). Given the effect of the water level on storm wave attenuation, these criteria determine the inland extent of storm impact and where on the beach profiles storm waves will erode or deposit sediment (e.g., Dean, 1991; Edelman, 1972; Steetzel, 1993; Balsillie, 1999; McInnes et al., 2014; Harley, 2017).
The SEPI magnitude for a single storm is defined in terms of these two thresholds:
where HMHW(t) is the water level (storm tide) above the mean high water () (Fig. 1),
S2 SD is the storm surge above the threshold of 2 standard deviations of storm surge, σS (Fig. 2),
of a semi-diurnal tide (12 h; Zhang, 1998). Terms in the sum of Eq. (1) will be zero unless both thresholds are met. Data that exceed both thresholds are grouped together as a single storm (and comprise the terms of the sum in Eq. 1) when they are clustered within 12 h of each other. In other words, distinct storms must be separated by 12 h or more. The duration of the storm is the time difference between the first and last terms of the sum in Eq. (1), and there is no minimum duration required for a storm.
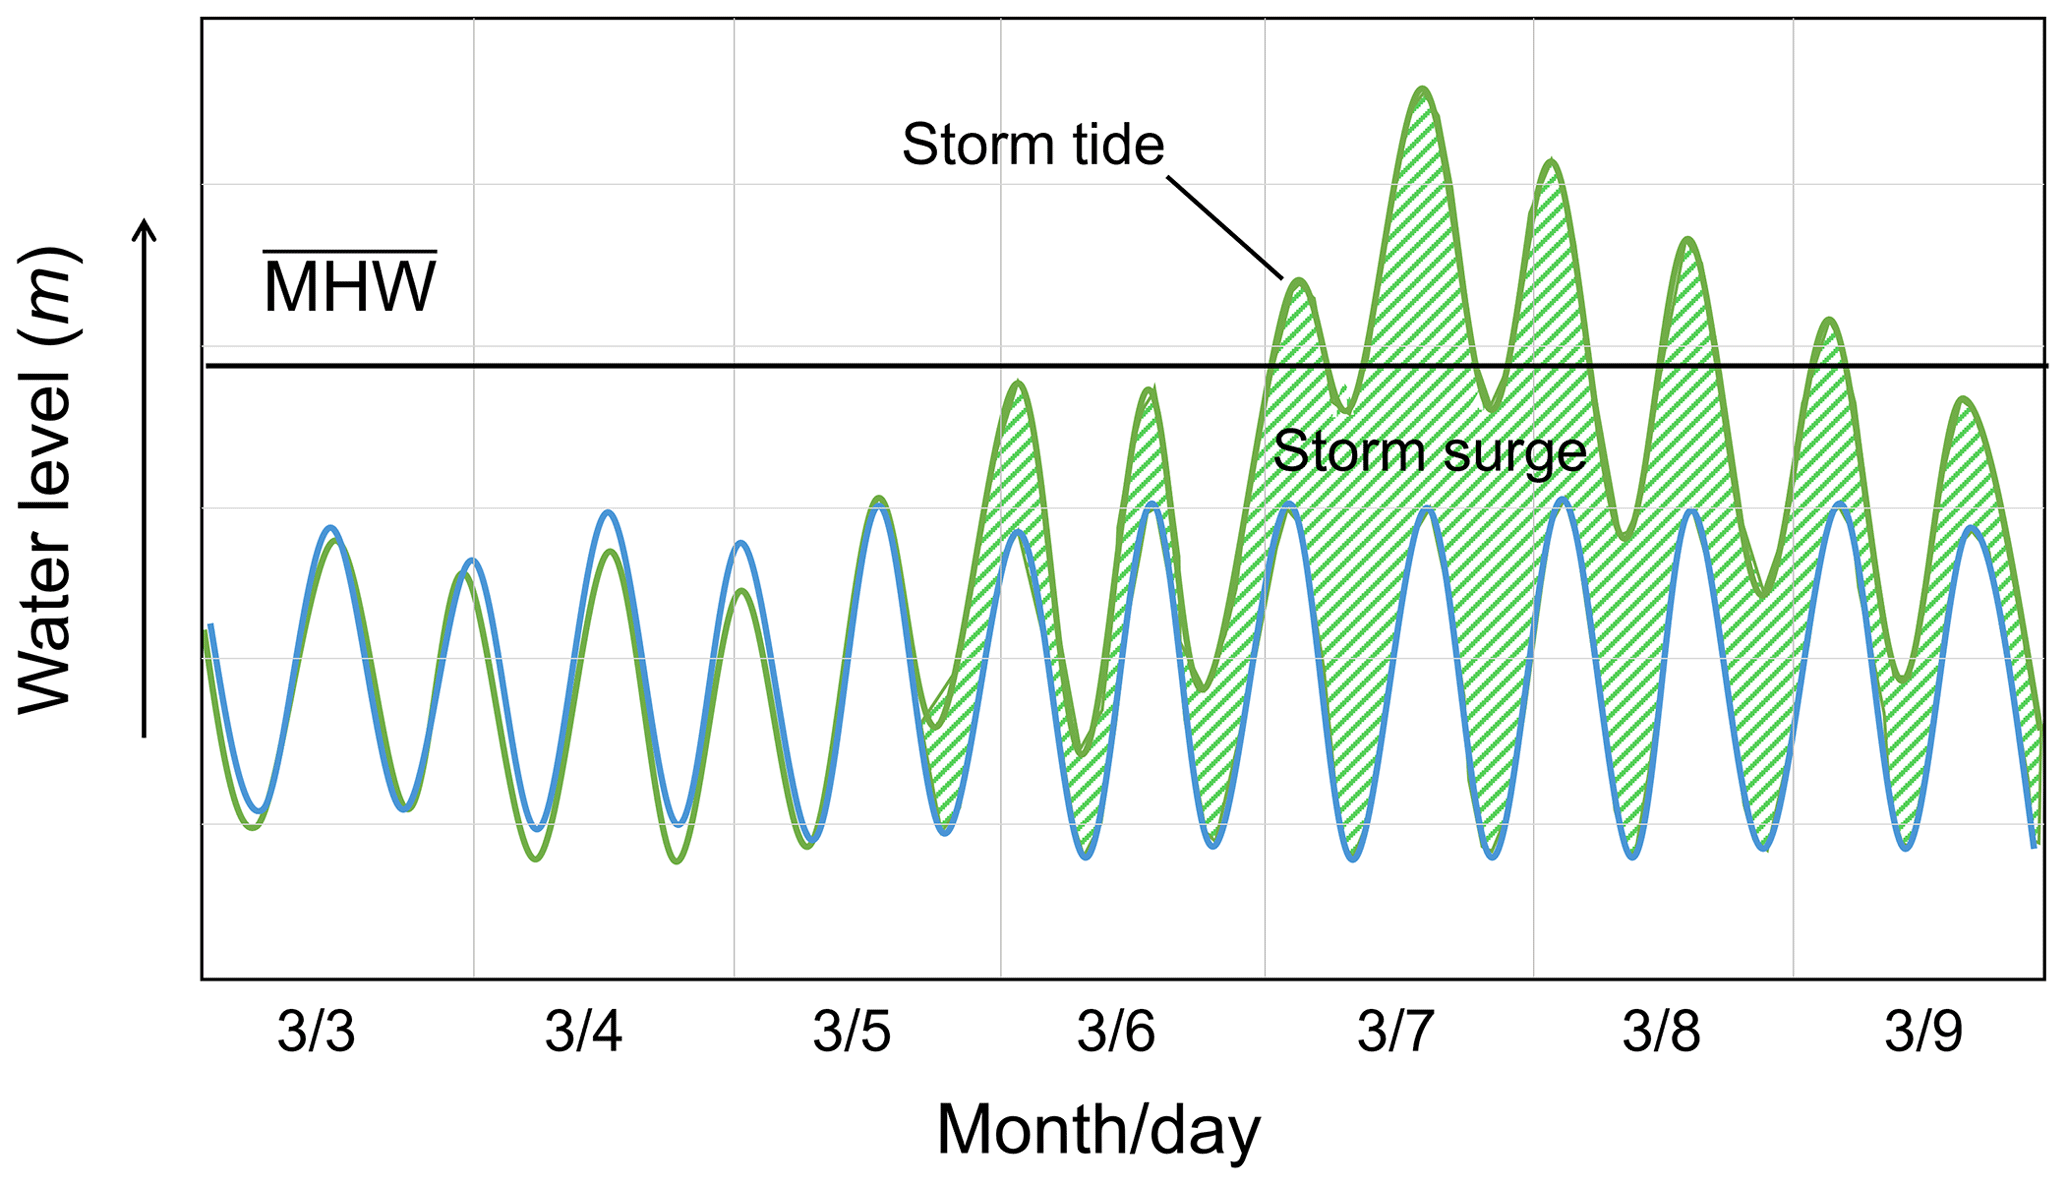
Figure 1The verified water level (green) and the predicted tide (blue) for a sample storm. The storm surge (shaded green) is the height of the water level (storm tide) above the predicted tide.

Figure 2Fictitious storm surge (height of the storm tide above the predicted tide) plotted with the storm surge threshold (2σs, orange), which is 2 standard deviations above the average surge.
2.2 Cumulative storm impact determination
To characterize the cumulative impact of successive storms on sandy beaches, we use the cumulative storm impact index (CSII) proposed by Fenster and Dominguez (2022). This index accounts for the timing and strengths of previous storms, which make beaches more vulnerable to continued erosion (Fenster and Dominguez, 2022). The CSII for the ith storm, Ii, is equal to the sum of the SEPI of the ith storm, as defined above, and a weighted factor of the previous storm's CSII:
where tp is the time between the ith and the ith − 1 storm. Assuming that the recovery rate is proportional to the amount of erosion, we use an exponentially decaying weighting factor for Wi (Fenster and Dominguez, 2022), where
f is a constant scaling factor indicating the rate of beach recovery, and tc is a characteristic time associated with the timescale of beach reset. More compactly, we write the weighting factor in terms of a rescaled time and scaling parameter :
where δ<1. Note that the CSII has the same units as the SEPI.
While an appropriate value of the characteristic time, tc, is crucial to understanding the meaning of the weighting function, mathematically the two parameters tc and δ may be combined into one parameter to achieve the appropriate behavior of CSII (see Fenster and Dominguez, 2022, for additional details). A reasonable choice of parameters will show accumulation due to storms clustered in time and will show beach recovery (CSII decreasing towards 0) when storms are temporally distant. In practice, there are a range of parameter values that satisfy these conditions and show robust cumulative behavior, though the absolute values of CSII will fluctuate with specific parameter choices. In this comparative study, we choose a value of tc=1 year, corresponding to the winter–summer beach profile cycle for beach systems on the US east coast, and δ=0.3 for consistency across all tidal gauges studied.
The CSII is an impact parameter that also includes the effect of previous storms. For this study, if missing data prevented the analysis from capturing a storm, that storm will not contribute to the CSII of the current storm. Therefore, the CSII is a conservative quantity, which may be higher if more storms were detected.
We retrieved water level data from the NOAA Tides and Currents Database at 12 tide stations from Portland, Maine, to Key West, Florida (https://tidesandcurrents.noaa.gov/, last access: 15 February 2024; Table 1, Fig. 3). The stations were chosen to obtain the greatest spatial coverage with relatively equal spacings between stations in order to capture variation associated with storm tracks. Additionally, we sought to acquire data from stations that had the most complete long-term records. Two of the 12 stations are located in areas relatively sheltered from storm conditions and subject to tidal wave amplification. The station at Wilmington, NC (station 8658120), is located on the Cape Fear River approximately 41 km upstream from its connection to the Atlantic Ocean at the Cape Fear River entrance (inlet). Similarly, the station at the Battery, NY (station 8518750), is located on the Hudson River, approximately 15.5 km upstream of its mouth at Lower Bay, New York Harbor. It should be noted that these two stations are most likely subject to tidal wave transformation caused by interactions with complex channel geometries of shallow estuaries and/or fluvial processes not prone to occur at stations located along the open-ocean coast (e.g., Aubrey and Speer, 1985; Speer and Aubrey, 1985; van Rijn, 2011; Hein et al., 2021). We take these conditions into account when drawing inferences from our results below.
Table 1Tide gauge stations along the US east coast used in this study.
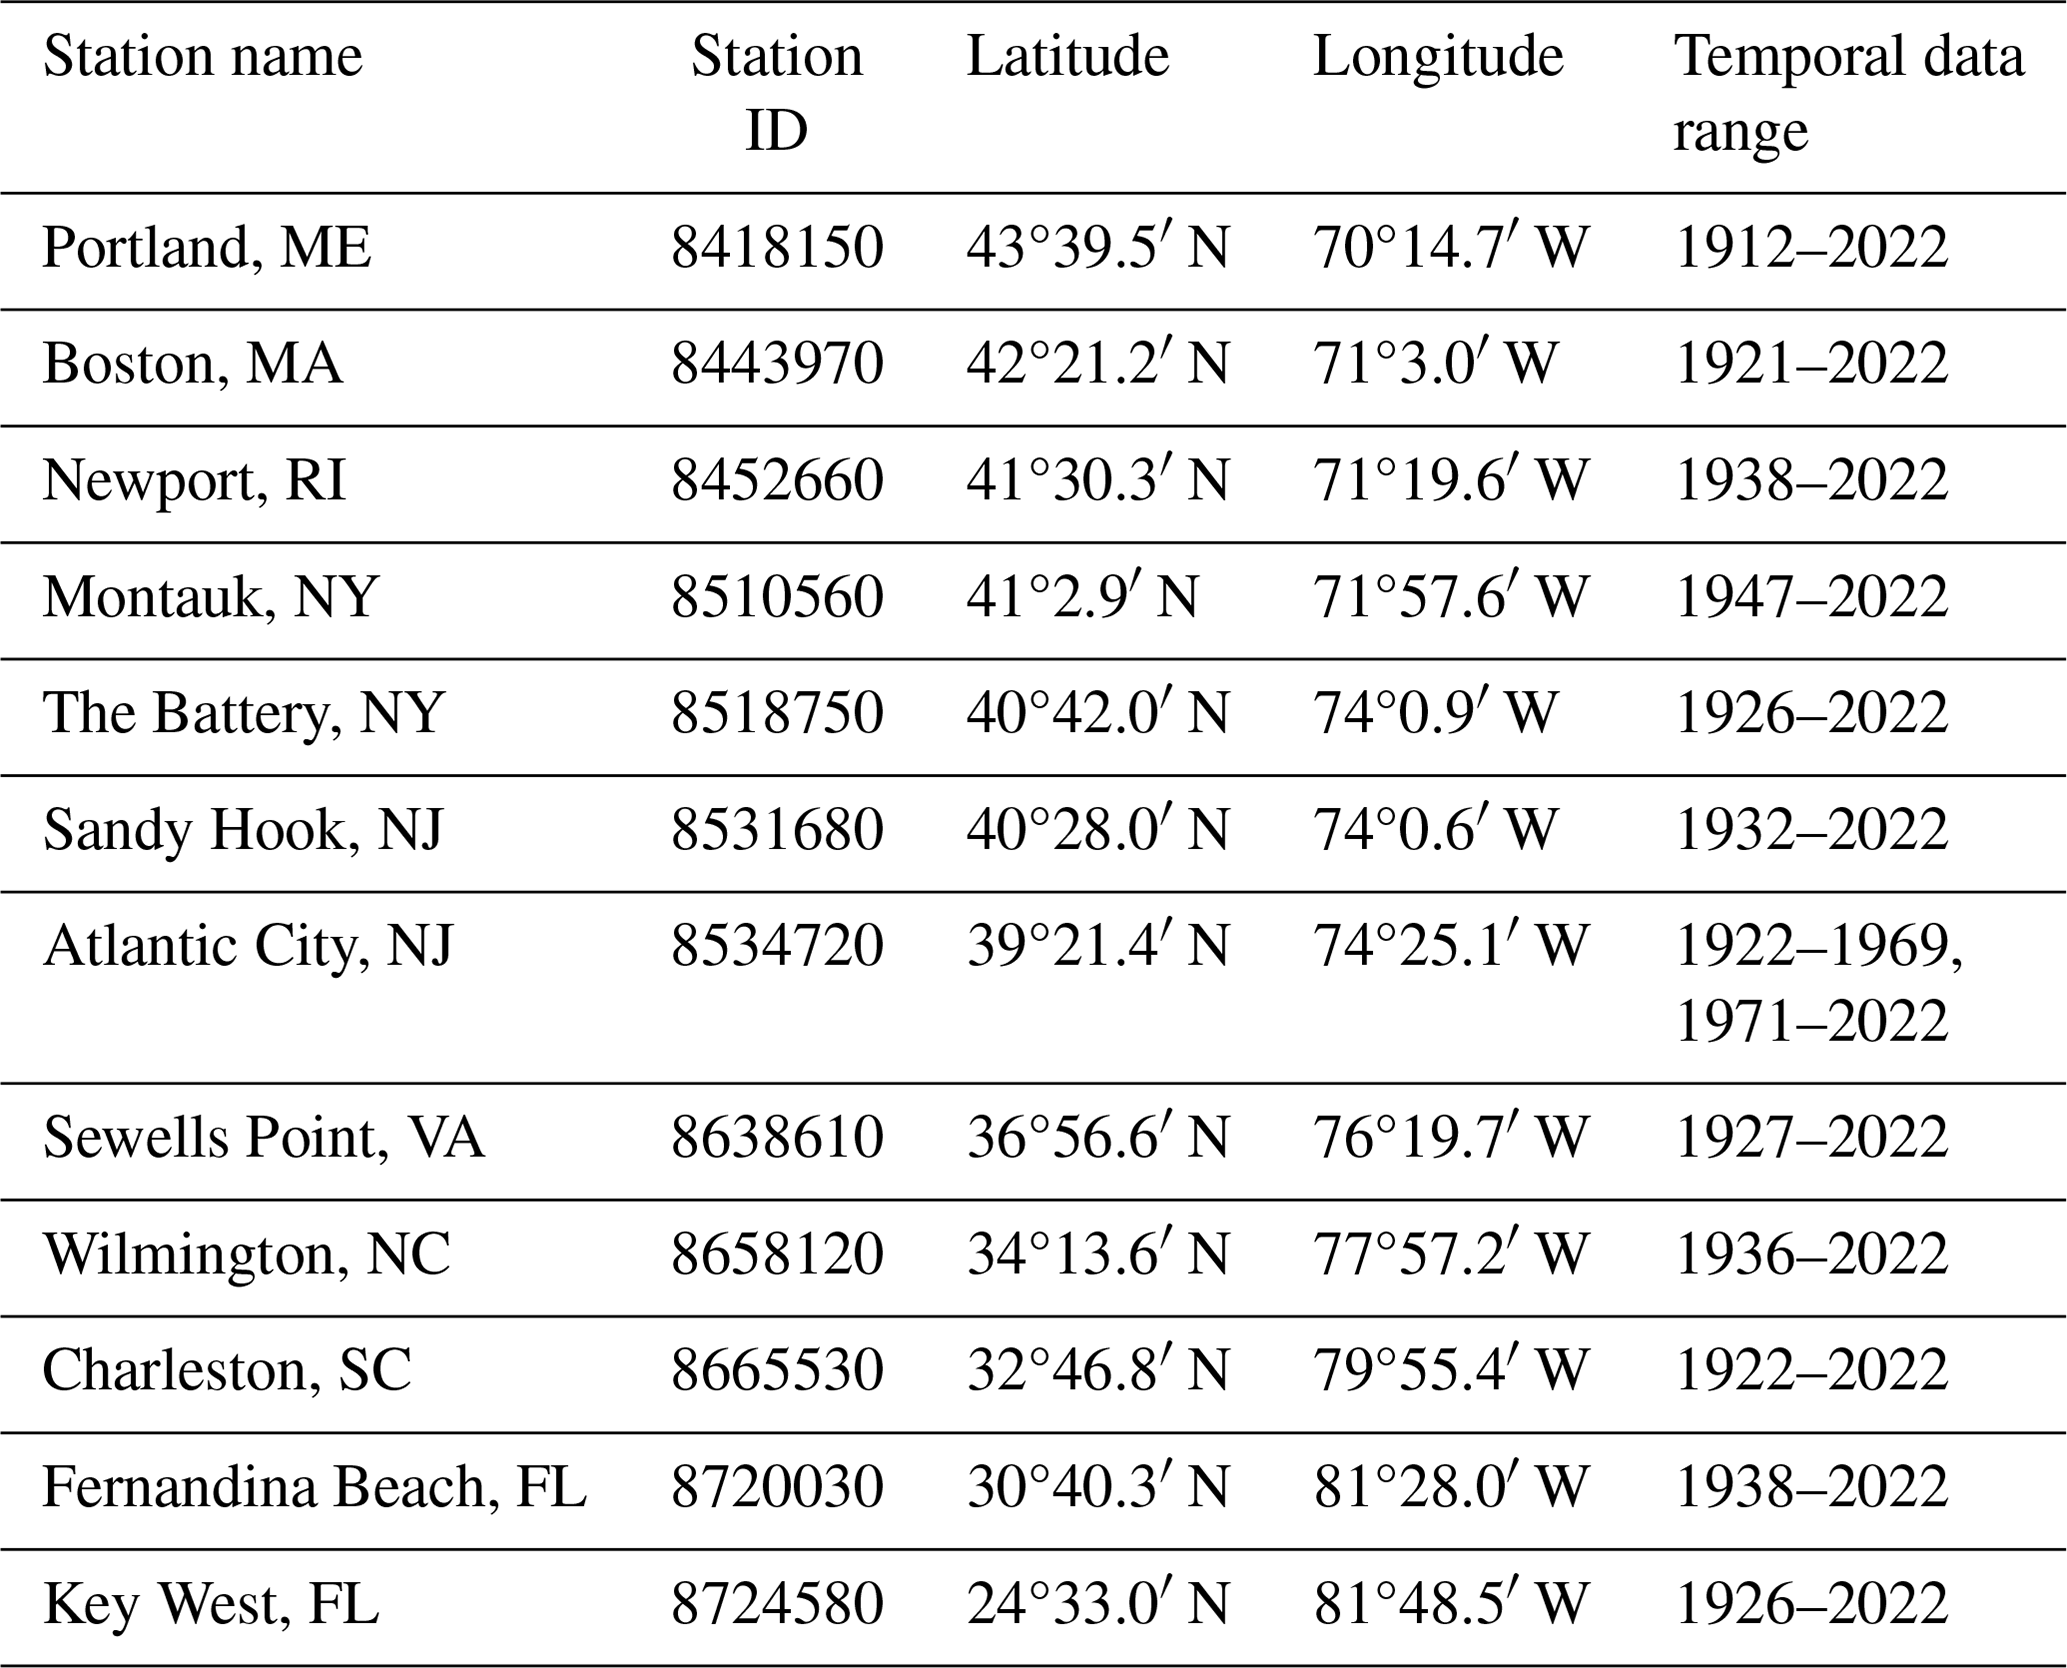

Figure 3Locations of selected tidal gauges along the US east coast corresponding to Table 1.
For each station, we retrieved the following data from NOAA (McManus et al., 2023a, b; Table 1).
-
V(t) represents hourly verified water levels measured relative to the station datum (STND).
-
PCTE(t) represents the hourly predicted tidal levels relative to STND, centered on the mean sea level (MSL) tidal datum of the current tidal epoch (CTE), in order to calculate actual predicted tidal levels.
-
MHWMM represents the monthly means of the mean high water (MHW) in order to calculate annual averages.
-
MSLMM represents the monthly means of the MSL datums in order to calculate annual averages.
-
MSLCTE represents the MSL for the current tidal epoch (1983–2001).
We note that Zhang et al. (2000, 2001) relied on the condition that water levels exceed the mean higher high water (MHHW) value, rather than the MHW, to identify storms. This is because storm tide above MHHW is high enough to directly and forcefully attack the dunes (Zhang, 2001). Because the US east coast experiences largely semi-diurnal tides and because the difference between MHW and MHHW is small, it was not standard practice for NOAA's National Ocean Service to calculate historical MHHW values at tide gauges located on the US east coast (Todd Ehret, NOAA, personal communication, 2023). Furthermore, we conducted sensitivity analyses to determine the differences between MHW and MHHW for more recent years when water level data from both datums were available. These analyses revealed no significant differences in storm identification results for the stations considered using MHW compared to MHHW. It should be noted, however, that MHW should not replace the MHHW threshold in general. It is not expected that the MHW level is high enough for waves to do significant work on dunes for mixed semi-diurnal systems such as the US west coast.
Because the SEPI relies on water level (in this case MHW) to identify storms, we had to remove the trend bias associated with relative sea level rise that has occurred ubiquitously along the US east coast since the beginning of the tide station data used in this study (1912; Sweet et al., 2017). To accomplish this task, we averaged the available mean monthly MHWMM values (daily values are not available) to calculate the average annual mean high water value, , to obtain the first (water level) threshold as discussed above (see Fig. 4 for an example at Sewells Point, Virginia, tide gauge station 8638610).

Figure 4Example of two exceedance thresholds required for water level data to contribute to the SEPI storm magnitude at Sewells Point, Virginia (tide gauge station 8638610). Water levels must exceed the mean high water (MWH) and the storm surge must exceed 2 standard deviations above zero. The MWH threshold is calculated annually to account for sea level rise, while the surge threshold is a single value calculated from all available data.
To produce the PCTE(t) values, NOAA uses a least-squares harmonic analysis at each station to produce a set of harmonic constants, which empirically weight 37 different harmonic constituents to account for various astronomical, hydrodynamical, and seasonal influences on the tides for each station (NOAA, 2023; Parker, 2007). NOAA uses the most current set of harmonic constants to generate these predicted water levels PCTE(t) over the entire period of the data retrieval request and sets the mean of all predicted levels to be the MSL for the current 1983–2001 tidal epoch (CTE) (Todd Ehret, NOAA, personal communication, 2023). Tides are expected to oscillate about the mean sea level, but NOAA's method of prediction does not account for the significant sea level rise that occurs over the timescale of interest. Consequently, the mean of the PCTE(t) values does not match the actual mean sea level for (at least) the time periods prior to the current tidal epoch. We correct for this by setting the mean of the predicted water levels to be equal to the actual mean sea level in any given year. To do this, we retrieved MSLMM sea levels from NOAA to calculate annual averages of the mean sea level, . We then used the MSL for the current tidal epoch, MSLCTE, to calculate the corrected predicted tidal levels as
The hourly storm surge is the measured water level height above the predicted tidal height:
For all 12 stations, the hourly storm surge data are approximately Gaussian-distributed, centered about a value of zero (). The standard deviation of the hourly surge values, σs, measured over approximately 10-year time intervals, does not change appreciably over time for almost all stations, with values ranging from σs=0.07 m (Key West) to σs=0.17 m (the Battery and Sandy Hook). The exception is Wilmington, NC, which had a decreasing value from about σs=0.22 to σs=0.14 over the time period from 1935–1970. However, a sensitivity analysis revealed no significant differences in storm identification results when an annually calculated storm surge threshold was used instead of a single storm surge threshold. Because storm surge distributions remain approximately constant in time (in contrast to the MHW values, which rise with MSL and therefore require annually calculated thresholds), we use a single value calculated from the entire dataset for each station (see Fig. 4).
We present below the annual trends in storm frequency (number and average annual) and magnitude at all 12 tide gauge stations used to characterize storminess along the US east coast using the SEPI criteria as defined above. We then compare the cumulative impacts of successive storms and large-magnitude storms (CSII) on the potential beach erosion to the SEPI magnitudes of each storm. All storms – tropical and extratropical in origin – contribute to the results at each station. Because some stations became nonfunctional during storm events, we excluded years for which ≥10 % of the water level data were missing to eliminate selection bias, i.e., generating annual averages with missing water level data.
4.1 Storm frequency: annual trends
Results from an ordinary least-squares regression analysis of storm frequency show no appreciable increase in the number of storms per year at any of the stations except for Wilmington, NC (station 8658120). Testing the null hypothesis that the trend coefficient = 0, we found that only Wilmington, NC, emerged as statistically significantly and different than 0 (p=0.001), with an increase of 0.05 storms per year, or one additional storm every 20 years, between 1936 and 2022 (Figs. 5a and 6a).

Figure 5Annual results of (a) storm frequency (number of storms per year) and (b) storm magnitude (SEPI averaged over all storms identified in each year) arranged from north (top) to south (bottom). For clarity, the frequency data series (a) from each station is offset vertically by 20 storms. A linear regression trend analysis showed no appreciable increase in the frequency of storms over the period of record. For clarity, storm magnitude datasets (b) are offset vertically by 30 m2h. Unlike frequency, a statistically significant increase in values exists for most stations (8 out of 12). For both (a) and (b), years missing 10 % or more data were not plotted. Consecutive years of valid data are connected by lines.
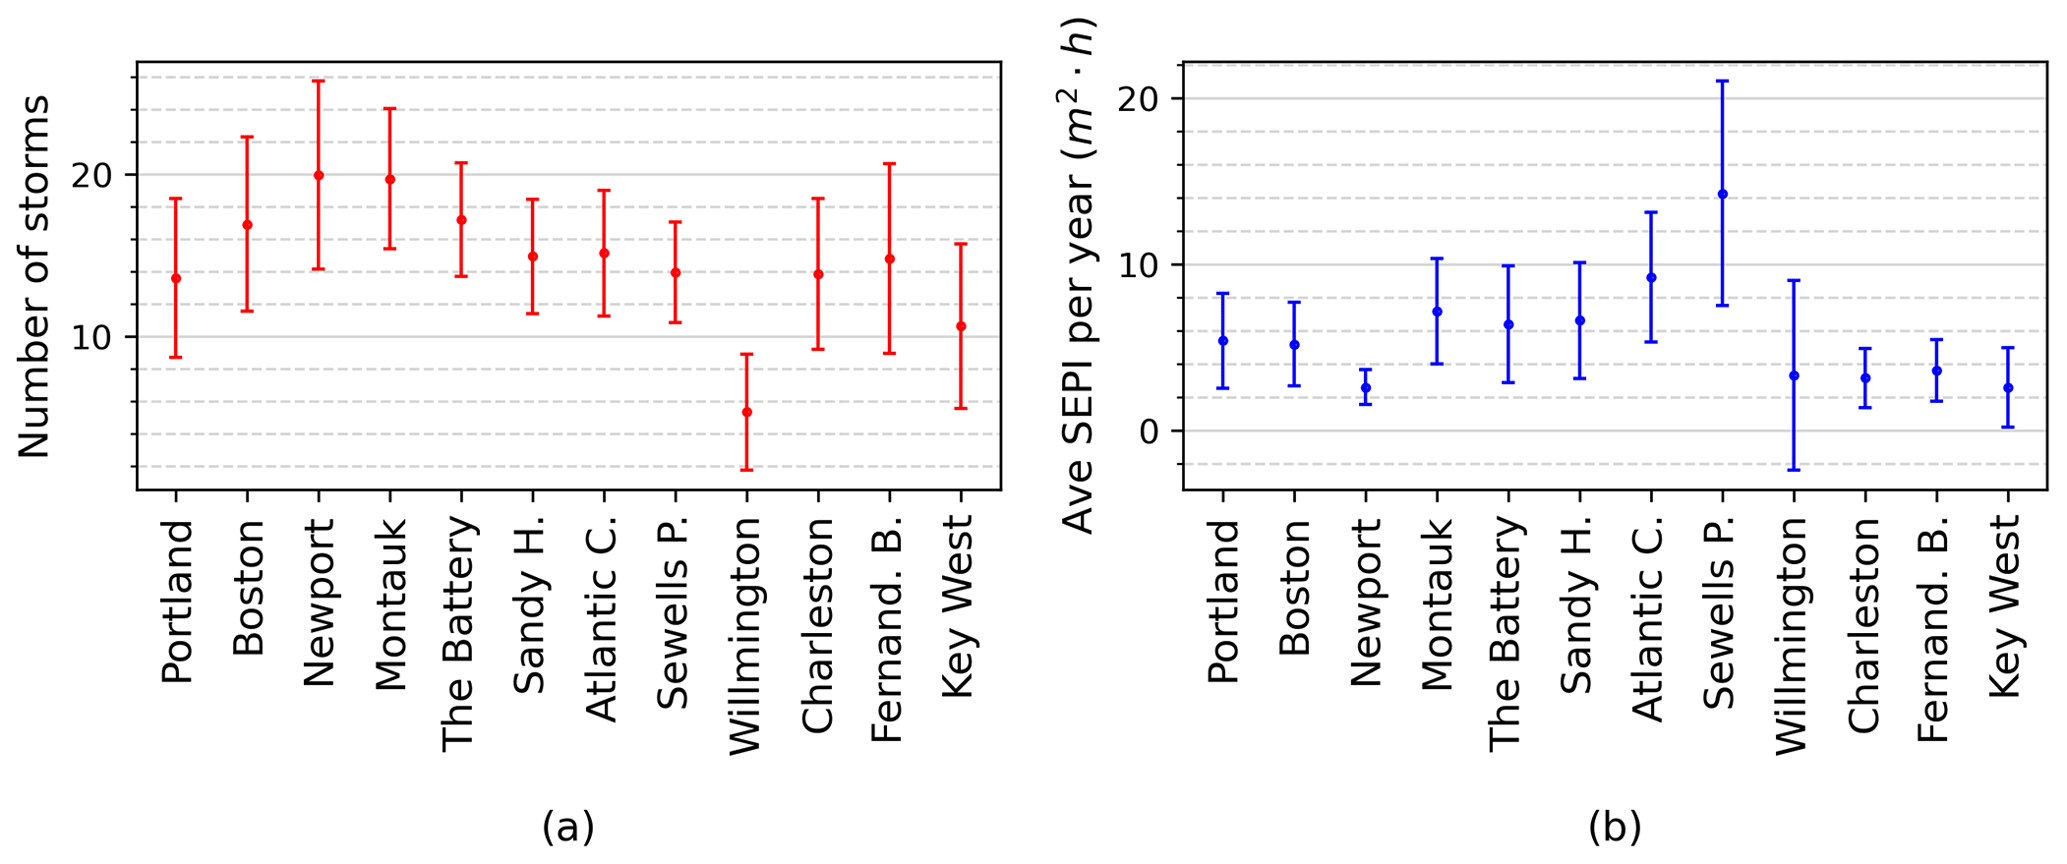
Figure 6Average and standard deviation of each dataset in Fig. 5. Calculations include all years of data plotted in Fig. 5 and similarly exclude years for which ≥10 % of data are missing.
Annual average storm counts range spatially from a minimum of 5 storms ± 4 storms per year at Wilmington, NC (station 8658120), to a maximum of 20 storms ± 6 storms per year at Newport, RI (station 8452660), and Montauk, NY (station 8510560) (Fig. 6a). However, the sheltered location of the Wilmington station may account for this low value. Geographically, the annual storm counts increase from Portland, ME, to Newport and decrease from Newport to Sandy Hook, NJ (Fig. 6a). The high temporal variability in annual storm counts (coefficient of variation ranges from 20 %–70 % with a median of 30 %) reflects the large interannual variation in storminess at each location.
4.2 Storm magnitude: annual trends
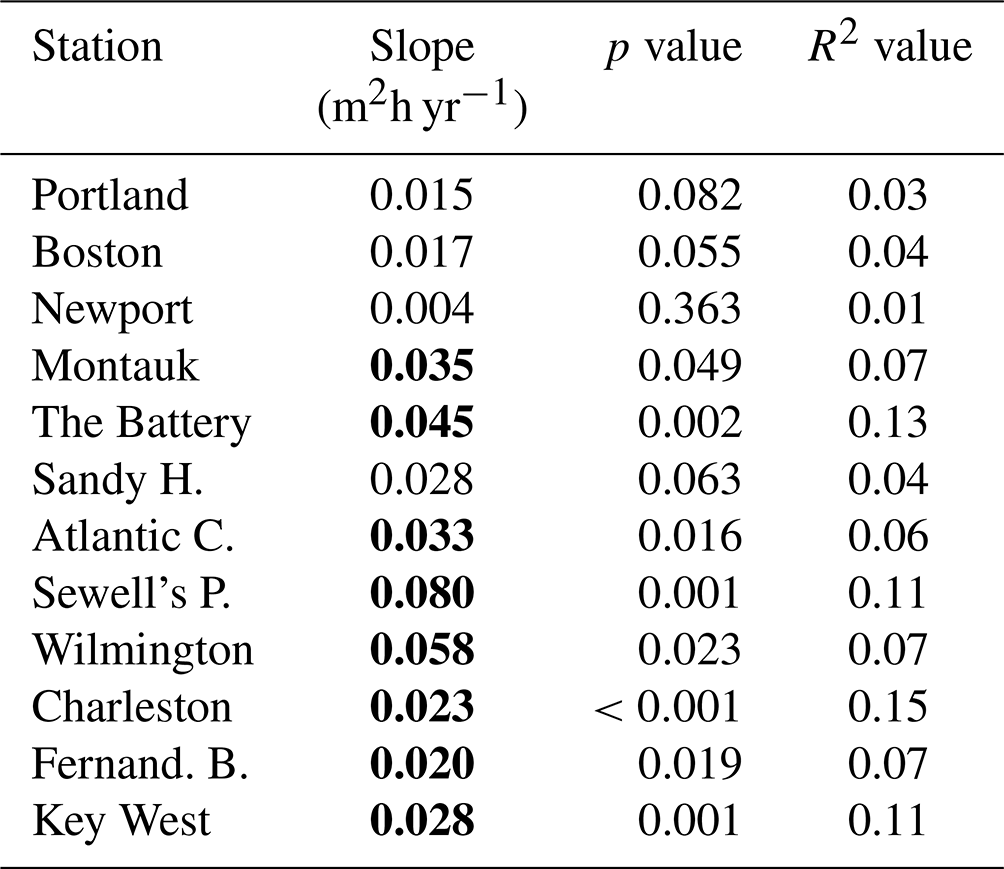
Figure 5b shows the SEPI averaged over all storms each year for each tidal station. Unlike storm frequency, the linear regression significance test (with Bonferroni correction) of change in annual SEPI values over time at each station showed statistically significant increases in time for 8 of the 12 tidal stations (Table 2; Fig. 5b). Stations that showed significant increases in magnitude included Montauk, NY; the Battery, NY; and all six stations from Atlantic City, NJ, southward to Key West, FL. However, the increase in storm magnitude is modest. Sewells Point, VA, had the greatest increase of 0.080 m2 h yr−1. To give some scale, Sewells Point has an overall average storm SEPI of 14 m2 h yr−1. It would therefore take 175 years for the average SEPI value to double with the calculated rate of increase, and 50 % of the data have a SEPI magnitude of ≤5 m2 h yr−1. Similar results are found when a low-pass filter of 4 years is applied to the data in Fig. 5b (Table S3).
Table 2Fit parameters for average annual SEPI per storm, corresponding to Fig. 5b. Slopes in boldface are statistically significant at p≤0.05.
The average annual SEPI values also vary geographically (Fig. 6b). The values increase from Newport, RI (north), to Sewells Point, VA (south) (except for Montauk), and show an opposite trend to the storm frequency; i.e., average annual storm magnitudes increase while storm frequencies decrease from Rhode Island to Virginia. The lowest average annual storm magnitudes come from Newport, RI, and the four southernmost tide stations from Wilmington, NC, to Key West, FL.
4.3 Cumulative impact of storm clustering (frequency) and magnitude
Plots of the individual storm SEPI magnitudes at all tide stations over the entire time record used in this analysis show similar results as the average annual frequency and magnitude results, i.e., no trend in frequency but larger-magnitude “SEPI storms” apparent in the more recent decades (Fig. 7). Plots of CSII values using δ=0.3 at each station show the effect of the larger storms and storm clustering on the beach erosion potential (Fig. 8; Fenster and Dominguez, 2022). Peaks in the CSII values correspond to time periods when beaches were most vulnerable to erosion (least recovered) and the receding limb following the peak corresponds to the beach recovery phase (or, in some cases, missing data; Fenster and Dominguez, 2022). The results plotted in Fig. 8 also show that the tide stations located geographically adjacent to each other from Montauk, NY, south to Sewells Point, VA, have the greatest-magnitude CSII values, more frequent peaks, and the longest recovery times (≈4 years on average) of tide stations to the north and south of this region. In addition to the larger-magnitude CSII values, these four stations show an increasing trend in CSII magnitudes beginning in the 1990s–2000s. Finally, the CSII peaks appear to have a periodicity on the order of 3–10 years for all stations except for Newport, RI, and Wilmington, NC, and spatial autocorrelation corresponding to storm track and intensity during the time period in which the storm reached a particular tide gauge (Fig. 8).

Figure 7SEPI values for each storm identified over the periods of record for all 12 tide gauges along the US east coast. For clarity, datasets are offset vertically by 300 m2 h. Note that datasets are arranged from north to south and use the same color scheme as Fig. 5.
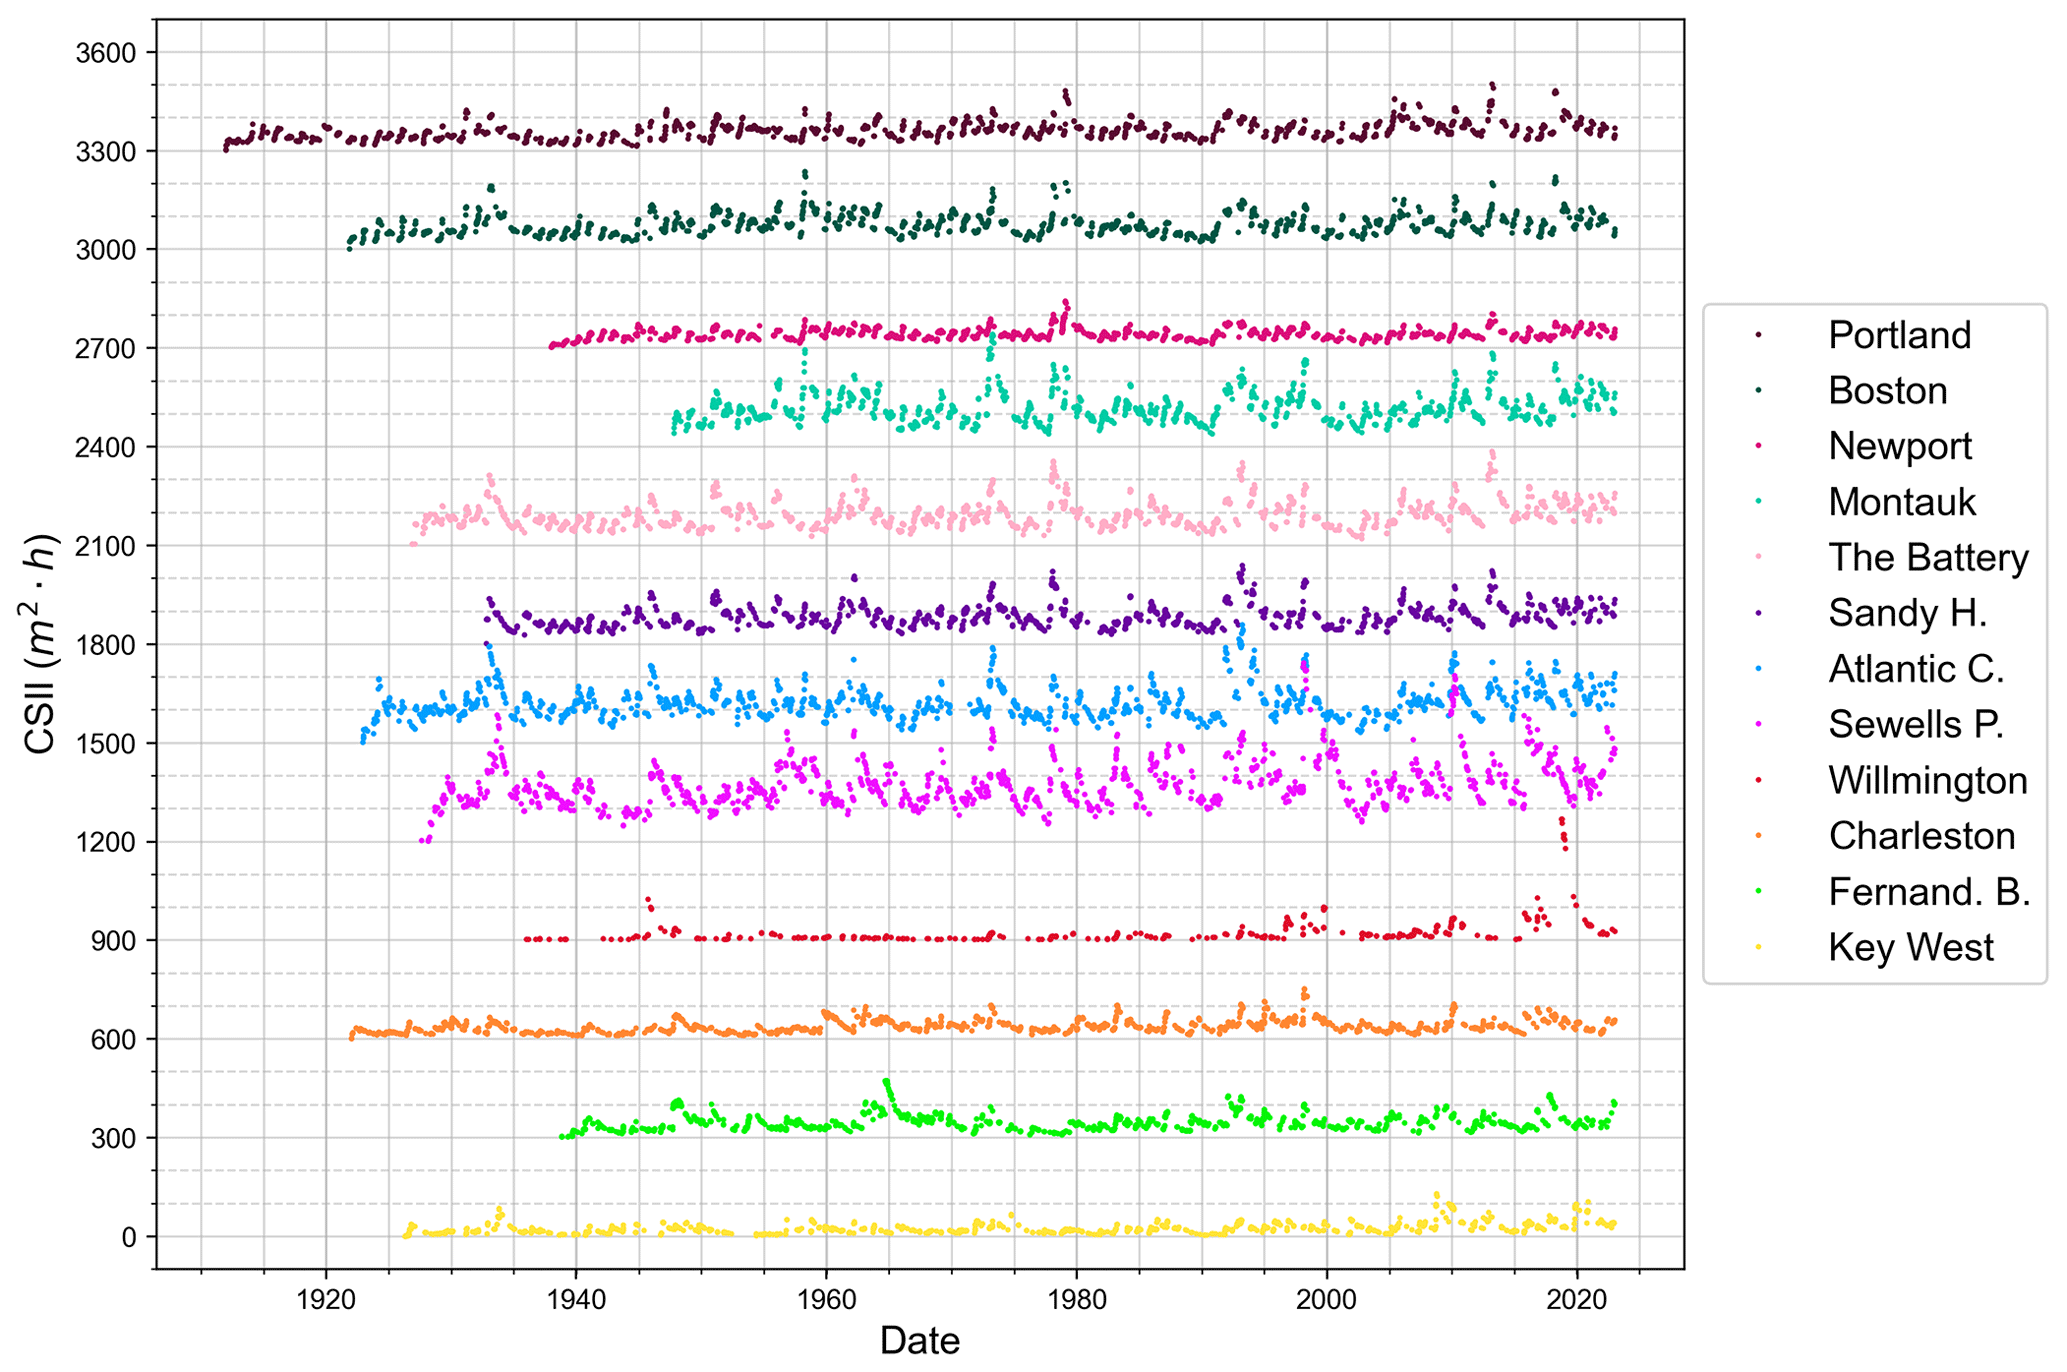
Figure 8CSII (δ=0.3) values for each storm identified over the periods of record for all 12 tide gauges along the US east coast. For clarity, datasets are offset vertically by 300 m2 h. Note that datasets are arranged from north to south and use the same color scheme as Fig. 5.
For comparison, we plotted both the SEPI and CSII values for two sample stations: Newport, RI, in the north and Fernandina Beach in the south (Fig. 9). The SEPI values for Newport station correspond to the seasonal extratropical storm cycle, and the Fernandina Beach station reflects tropical storm seasonality. Additionally, the large CSII values indicate that successive and large-magnitude storms accumulate beach erosion potential and do not allow full beach recovery, thereby masking the seasonal cyclonic variation (Fig. 9). The time spans associated with beach recovery range from ≈3 years to >10 years depending on the storminess in time and space.
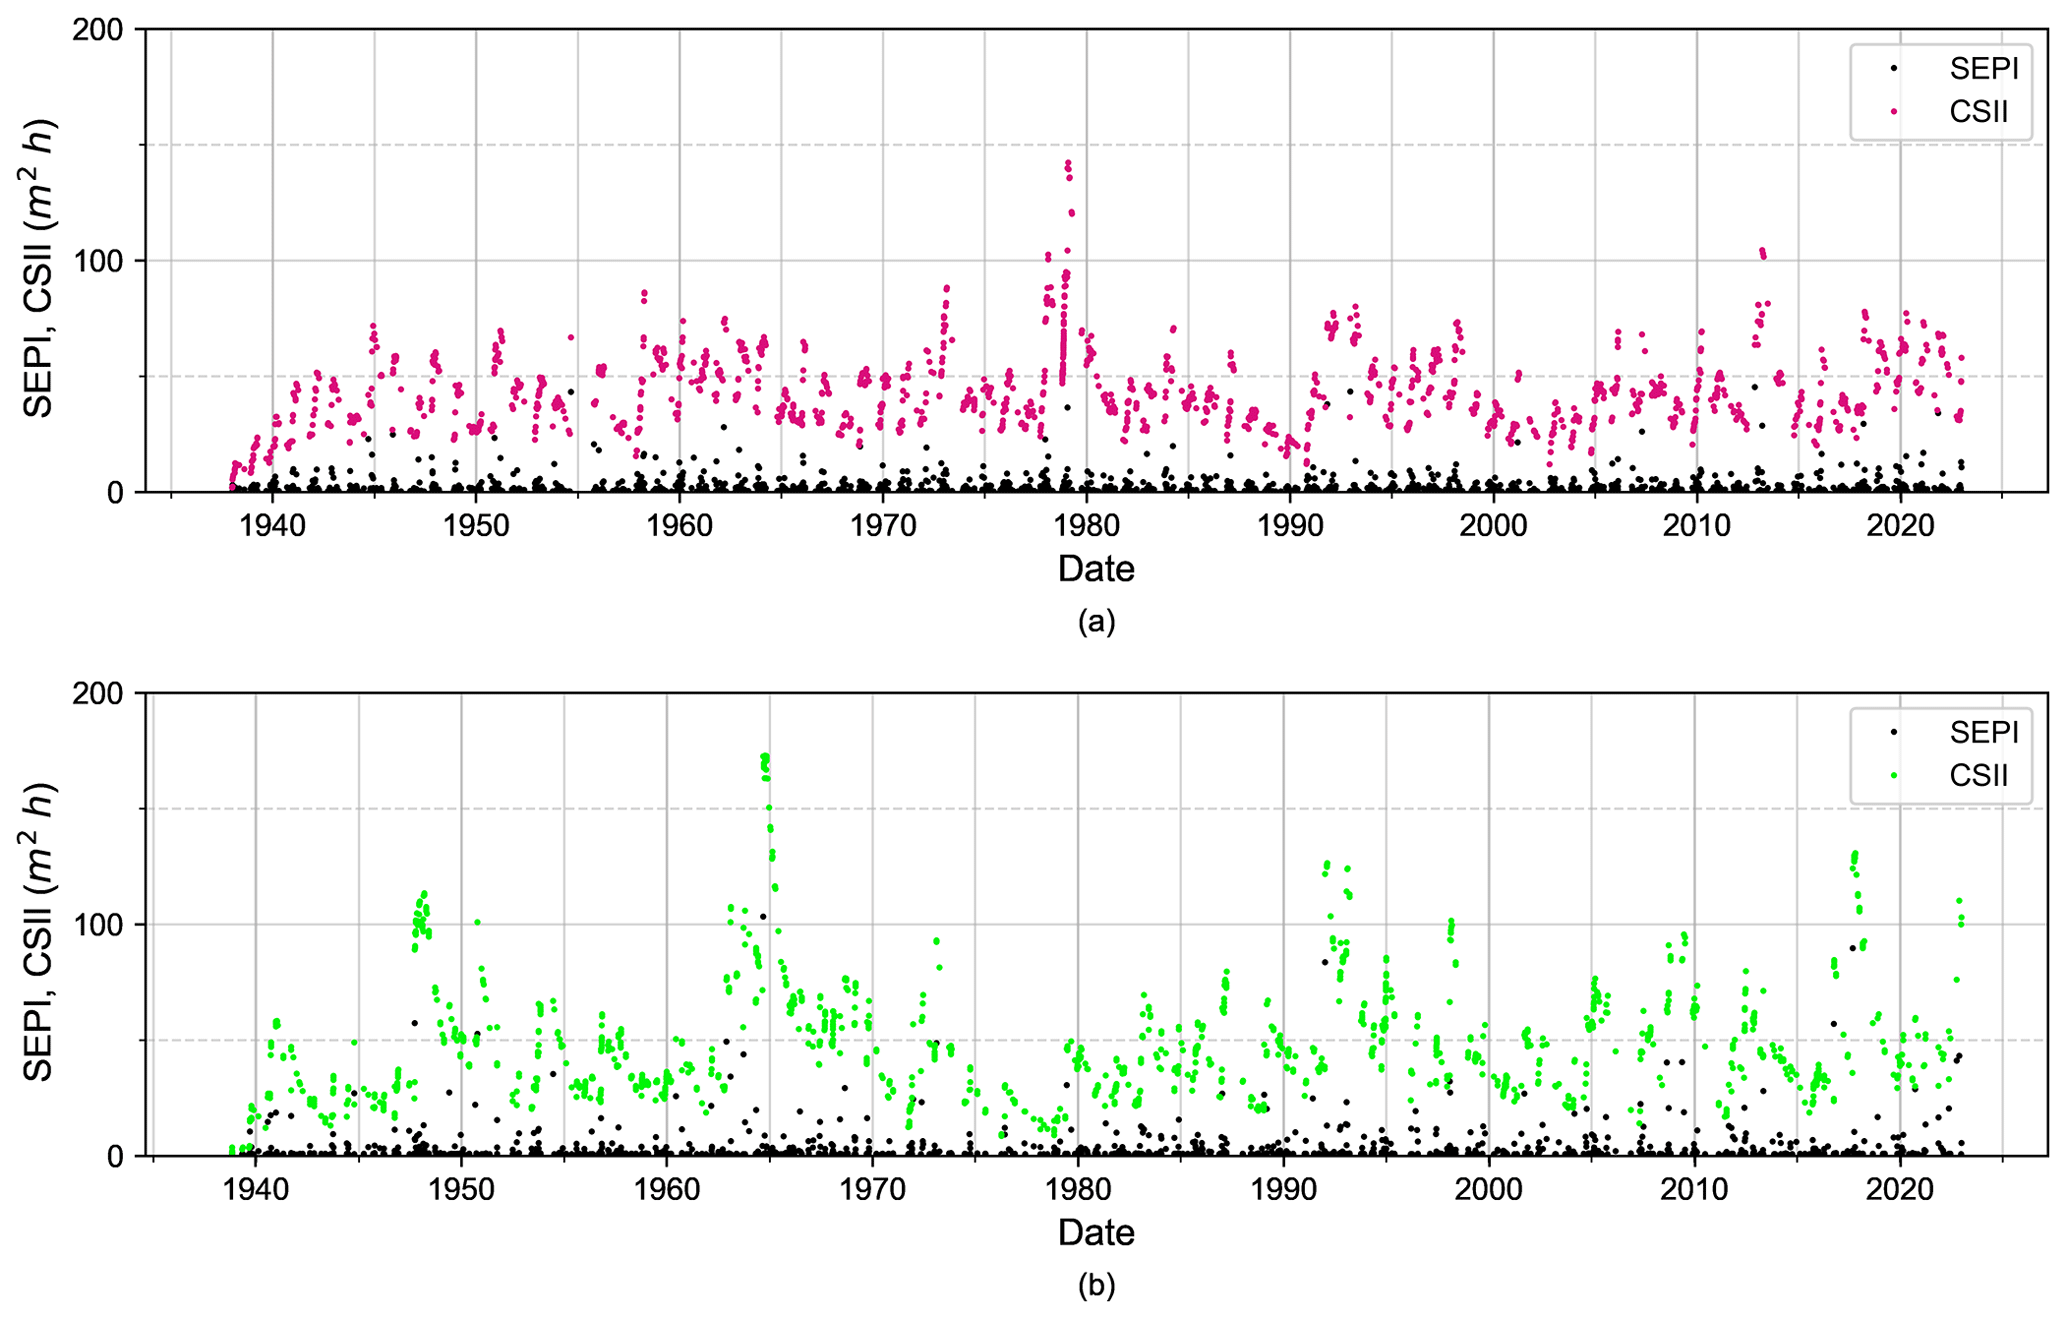
Figure 9Comparison of SEPI and CSII measures of storm magnitude for two selected tide gauges: (a) Newport, RI (to the north), and (b) Fernandina Beach (to the south). The SEPI (lower value) is plotted in black and CSII in color.
The effect of individual named storms on the CSII values over a sample of recent time (2008–2022) shows regional (spatial) correlations in the cumulative effect of beach erosion potential (Fig. 10). The CSII peaks for the northern tide stations correspond to extratropical storms (Fig. 10) and the CSII peaks for the southern tide stations correspond to tropical storms (Fig. 11), thus emphasizing the importance of both storm clustering and magnitude for the cumulative beach erosion potential: more frequent and larger named storms lead to large accumulation of beach erosion potential, and conversely, the lack of named storms can lead to beach recovery (Fig. 10). These phenomena can occur regionally and over varying timescales. For example, the US east coast experienced six notable nor'easters during 2009–2010 (including Nor'ida), five during the 2012–2013 storm season (including “super storm Sandy”), and six in the winter and spring of 2017–2018 (Fig. 10., Table S1). The large CSII peak during the 2018 tropical storm season observed for the Wilmington, NC, tide station corresponds to storm tracks associated with tropical storm Beryl and hurricane Chris. The two named storms occurred within a week of each other, and the latter stalled and intensified from a tropical storm to a category 2 hurricane off the North Carolina coast. Later that season, the category 1 hurricane Florence made landfall at the North Carolina–South Carolina border, placing the Wilmington station in quadrant 1 of this storm. The tide stations to the south of Wilmington did not record these storms appreciably. Despite the particularly stormy July 2018 along the North Carolina coast, we note that the peak stream stage measured at the stream gauge in closest proximity to (and upstream from) the Wilmington tide gauge (Cape Fear R at Lock 1 NR; Kelly, NC; 02105769) was approximately 11.6 % greater than the mean stage (5.4 m vs. 4.9 m, respectively) and 15.5 % greater than the median stage (5.4 m vs. 4.7 m, respectively). Consequently, post-storm river flow most certainly impacted the Wilmington water level data by approximately 11 %–16 %. However, several tropical storms occurring during summer–early fall 2016 (i.e., Bonnie, Colin, “Eight 2016”, Hermine, Julia, and category 2 hurricane Matthew) did have a regional impact that included Wilmington, NC, south to Fernandina Beach, FL (Fig. 11; Table S2). Finally, these results show that unnamed, smaller-magnitude extratropical storms clustered in time can impact CSII without the effects of a named storm (ca. 2018–2021, Fig. 10; see Fenster and Dominguez, 2022).
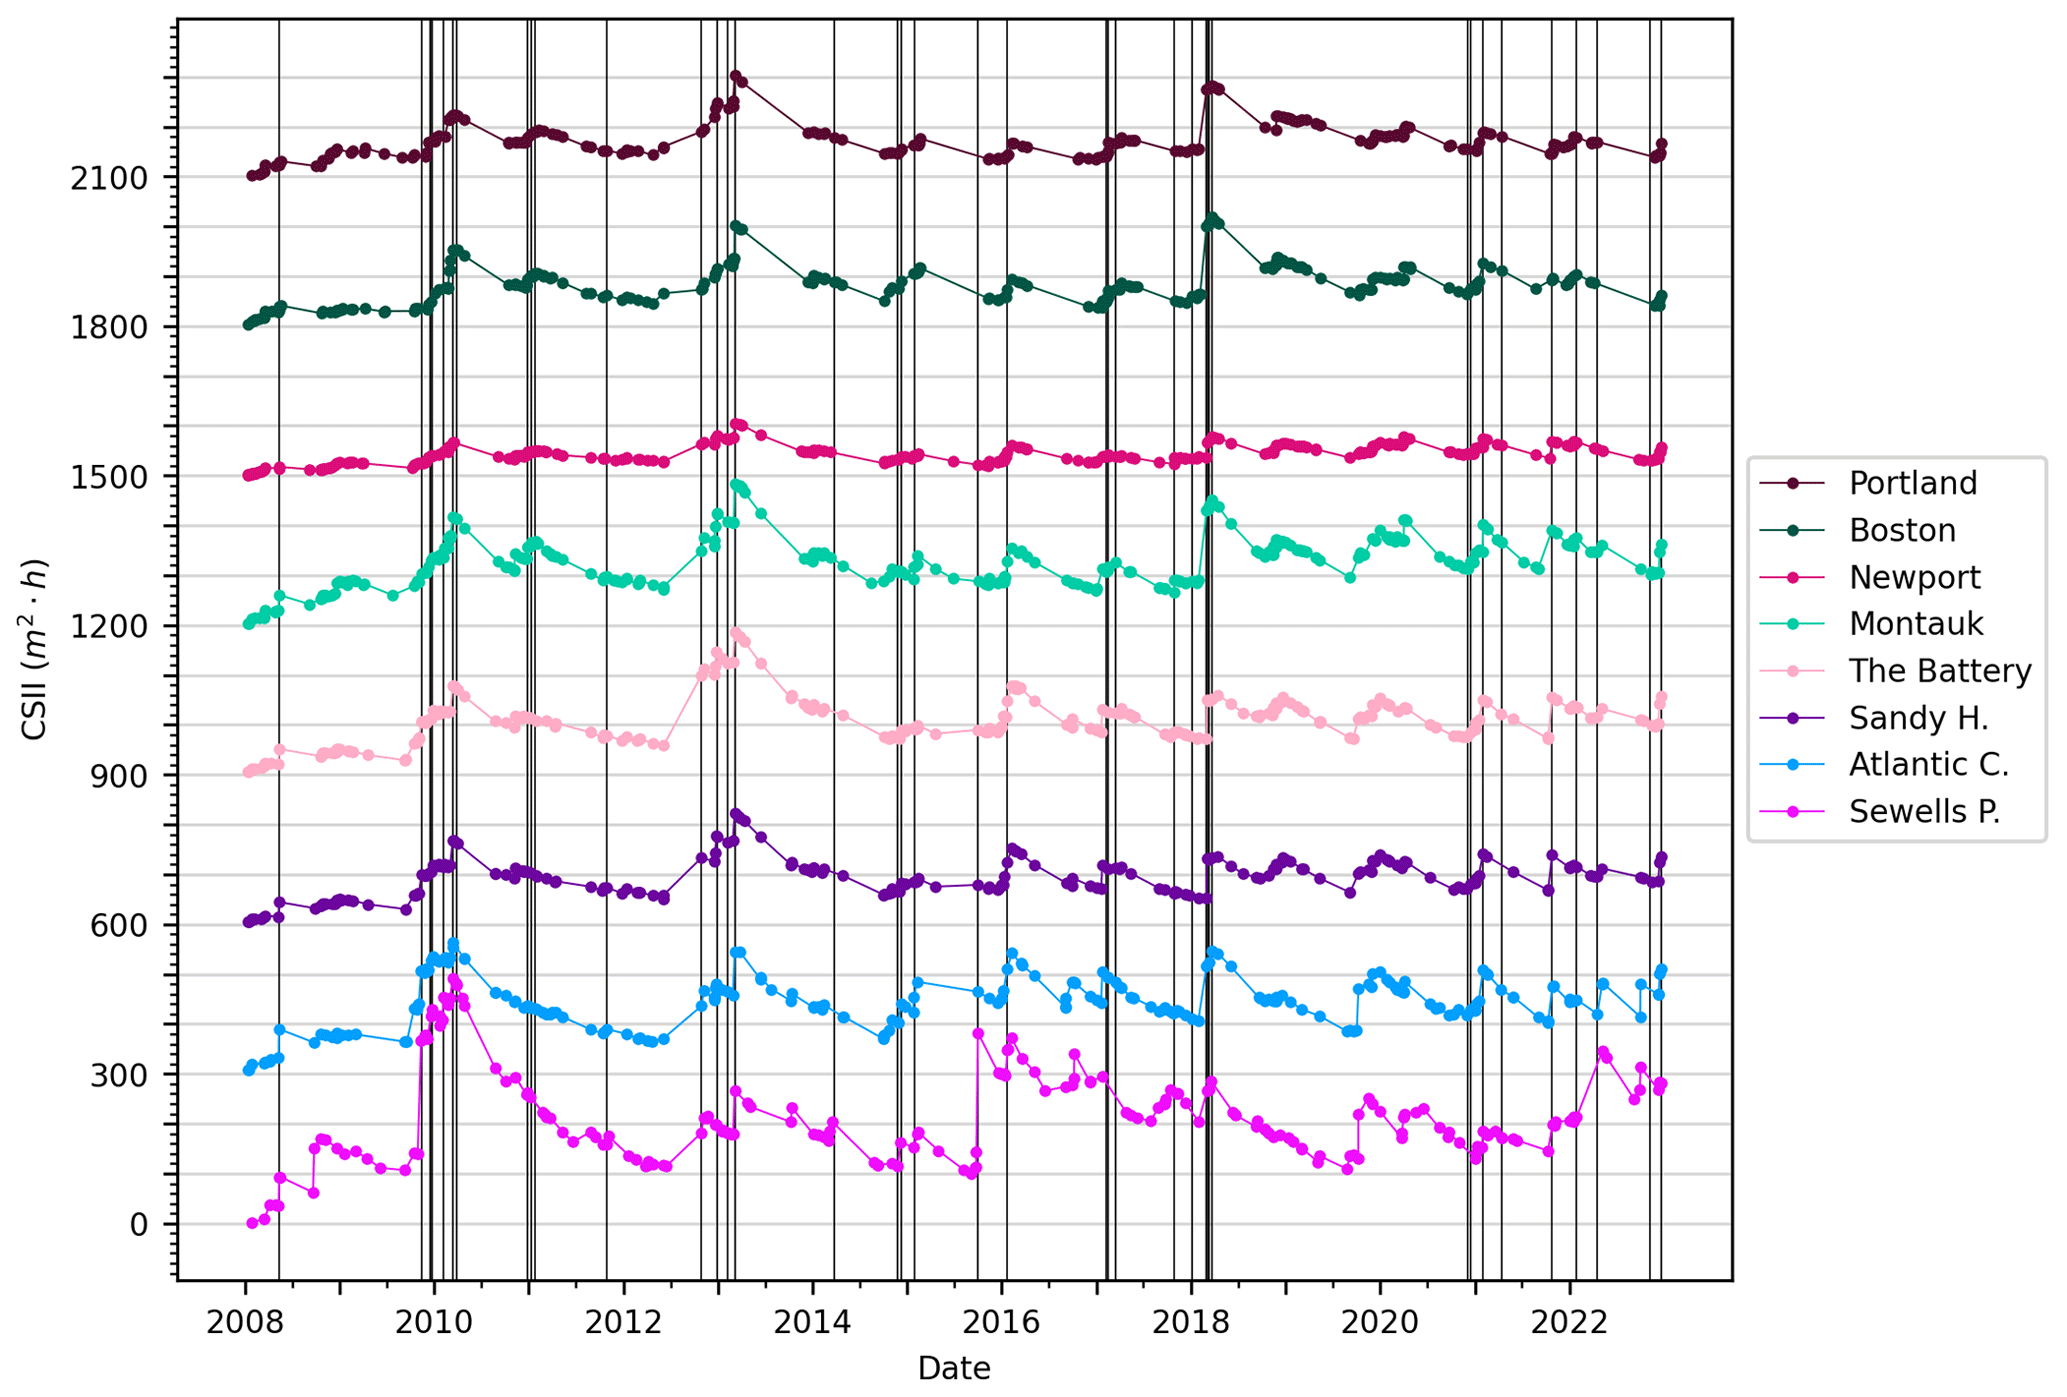
Figure 10CSII values plotted for the period 2008–2022 for all stations used in this analysis with vertical black lines marking the date of major (named) extratropical storms for northern tide stations (Portland, ME, to Sewells Point, VA). For clarity, datasets are offset vertically by 300 m2 h, as in Figs. 7 and 8. Note that greater storm clustering of named storms corresponds to greater density of vertical lines. Table S1 contains a table of the named extratropical storms shown in these plots.
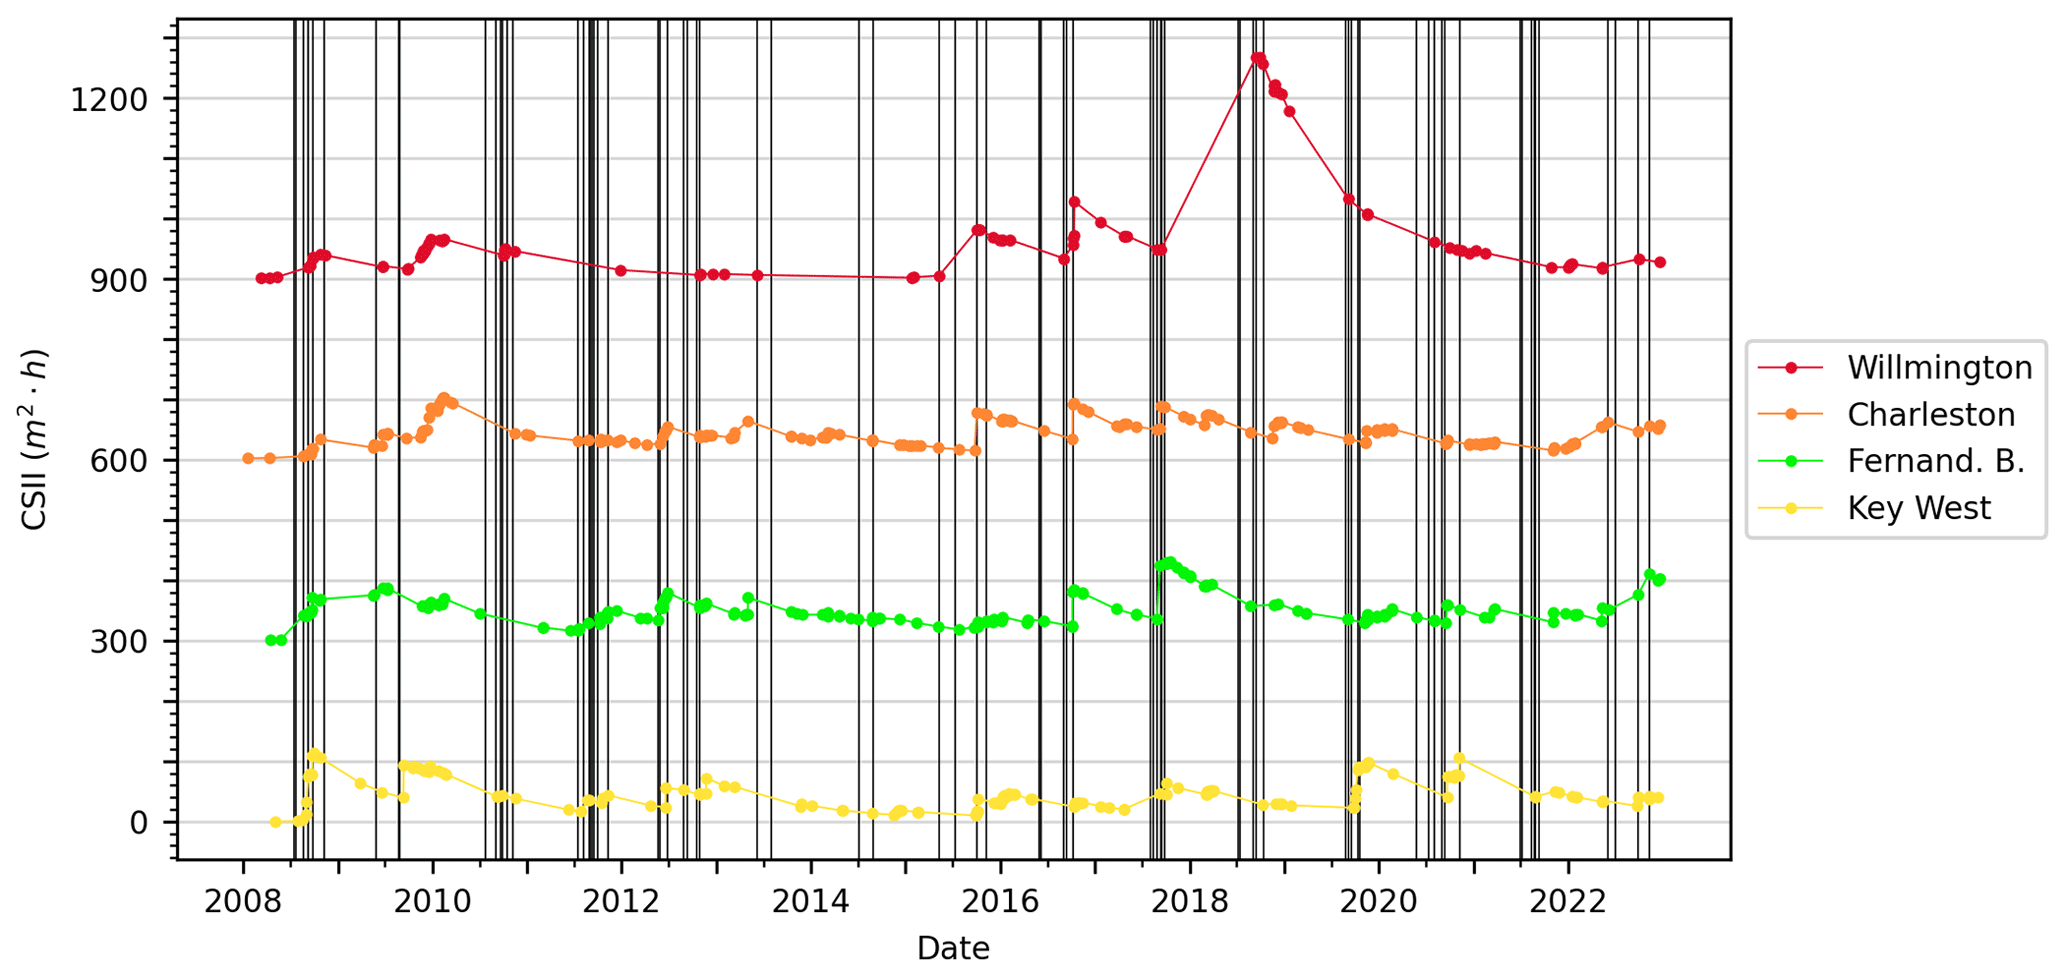
Figure 11CSII values plotted for the period 2008–2022 for all stations used in this analysis with vertical black lines marking the date of major (named) tropical storms for southern tide stations (Wilmington, NC, to Key West, FL). For clarity, datasets are offset vertically by 300 m2 h, as in Figs. 7 and 8. Note that greater storm clustering of named storms corresponds to greater density of vertical lines. Table S2 contains a table of the named tropical storms shown in these plots.
This study extracted historical water level data from 12 NOAA tide gauge stations, spanning the early 20th century to 2022 from central Maine to southern Florida, to determine if temporal and spatial trends existed in storm frequency and magnitude along the US Atlantic Ocean coast. We used the Storm Erosion Potential Index (SEPI) to provide thresholds for storm surges and tides that defined a storm by extreme water levels (Zhang, 1998; Zhang et al., 2000, 2001). Additionally, we examined the potential beach erosion impacts of successive and large-magnitude storms by incorporating SEPI magnitudes into a newly developed cumulative storm impact empirical model (Fenster and Dominguez, 2022).
Our methods avoid typical problems associated with empirical data analyses such as using heterogeneous or hindcasted historical instrumental data and limited temporal data to detect long-term (decadal to centennial) trends in cyclone frequency or intensity (e.g., Schreck et al., 2014; Seneviratne et al., 2021). Consequently, our results (using the SEPI definition) can be used to validate global and regional modeling studies of storm frequency in the Atlantic basin which show no significant increasing or decreasing trend in storminess (Fig. 5a; Colle et al., 2015; Tory et al., 2013; Knutson et al., 2020; Seneviratne et al., 2021; Sobel et al., 2021). Average annual storm counts ranged from 5 to 20 at the 12 tide stations of interest, but the annual storm frequency did not significantly change over time at any of these stations, except for a minor increase at the Wilmington, NC, tide station. This result also builds on the conclusions of Zhang et al. (2000), whose study, which ended in 1996/1997, found no discernible long-term trend in the historical number of storms occurring along the US east coast using the SEPI criterion through 1997.
With respect to average annual storm magnitudes, we found statistically significant,= but modest increases through time for 8 of the 12 tidal stations (Table 2; Fig. 5b). Of the statistically significant stations, slopes of SEPI magnitudes per year ranged from 0.02 additional storms per year to 0.08 additional storms per year, and the statistically significant increases all occurred at the stations from New York to Florida (excluding Sandy Hook, NJ; Table 2; Fig. 5b). This finding is consistent with that of Tadesse et al. (2022), who showed significant increases in the frequency of extreme storm surges over the 95th percentile (2σ) and 99th percentile (3σ) along the New England (northeast US) coast using storm surge time series data from the Global Storm Surge Reconstruction (GSSR) database. Tadesse et al. (2022) do not identify individual storm events, but rather count the number of daily storm surge exceedances over various thresholds. Therefore, their calculation of positive frequency trends is more akin to our magnitude trends for the average annual SEPI (Fig. 5b). The modest increase in the storm magnitude at the eight stations to the south of New England suggests that the well-documented increase in shoreline damage (Smith and Katz, 2013; Smith and Matthews, 2015; Harley, 2017; NOAA NCEI, 2024; Callahan et al., 2022) is most likely due to other (or a combination of) factors such as an increase in frequency and/or intensity the largest storms (e.g., Komar and Allan, 2008; Walsh et al., 2016; Knutson et al., 2020; Kossin et al., 2020; Ghanavati et al., 2023) and/or sea level rise (FitzGerald et al., 2008): the same number of storms will do more overall damage when the work done on beaches is located higher up on the beach profile (Sallenger, 2000; Stockdon et al., 2007; Birchler et al., 2015) and/or when deficits in coastal sediment budgets exist (Ghanavati et al., 2023).
The reason(s) the SEPI magnitudes have increased modestly at the southern stations, but not at the northern stations (from Rhode Island to Maine), may include (1) orogenesis – extratropical cyclones that originate over Florida or north of Cuba, travel northward, and increase in magnitude when they become blocked by stagnating anticyclones over the North Atlantic or New England (Davis et al., 1993); (2) sea surface temperatures – tropical storms that originate in the Atlantic basin are correlated with sea surface temperatures which have increased in the time span of our data and analyses (Kossin et al., 2017; Knutson et al., 2020), but also tend to weaken and veer eastward (away from the coast) in the westerly global atmospheric currents before reaching the New England states; and/or (3) exposure – high-latitude stations experience more consistent large-scale extratropical cyclones associated with the northerly positioning of the jet stream during winter and early spring months (Davis et al., 1993). The latter explanation (3) is supported by the finding that the average SEPI per year is generally smaller for the four southernmost tide stations, but the number of storms per year is larger for the northernmost tide stations (Figs. 5, 6, and 7a). However, our findings do not corroborate northward shifting of tropical cyclone storm tracks (Kossin, 2018; Knutson et al., 2019; Murakami et al., 2020; Yang et al., 2020).
Our results showed that storms become larger and less frequent from Rhode Island to Virginia, indicating that the mid-Atlantic is more prone to larger storms than the northerly tide stations. Sewells Point, VA, had the largest absolute average annual SEPI magnitude and the largest increase in SEPI magnitudes over time. The increase in SEPI magnitude at this location was more than double that of the magnitude increase at all other statistically significant stations except for Wilmington, NC, and the Battery, NY, which both reside in sheltered tidally influenced rivers and experience augmentation of the tidal wave and surge and/or impacts by fluvial processes (Aubrey and Speer, 1985; Speer and Aubrey, 1985; van Rijn, 2011; Hein et al., 2021). This finding is to be expected given its geographic location in the middle of the Atlantic coast and consequent exposure to tropical, extratropical, and transitional storms, as well as the station location relative to the unlimited east fetch of the Atlantic Ocean and the north-facing maximum fetch of the Chesapeake Bay (Nadal-Caraballo et al., 2015; Callahan et al., 2022).
The new CSII parameter gives a perspective on storm impact by using any storm metric to account for the magnitude of an individual storm and the timing and temporal clustering of storms (Fenster and Dominguez, 2022). For this study, we selected the SEPI as a metric to assess spatial and temporal trends in storminess and potential beach erosion (Zhang et al., 2000, 2001). When CSII values approach SEPI values, the beach profile is in a more accretionary (or equilibrium) state, and when the CSII values become much larger than the SEPI values, the beach is in its most vulnerable erosional state, which becomes the antecedent condition for the impact of the next sequential storm (Fig. 12). Accretionary states occur during periods of storm quiescence and erosional states occur following storm clustering in time or large-magnitude storms (assuming no changes to the sediment supply and fluxes). The peak CSII values indicate the time at which beaches are in their most vulnerable state and the “troughs” suggest the beach has approached recovery. The results from this study show that peaks and troughs tend to vary on timescales of 4 to 10 years and provide insight into the timescale allowed for beaches to “heal” after storm clusters and large-magnitude storms occur (Figs. 8–11). This 4- to 10-year time period varies temporally and spatially with some locations apparently more periodic in nature (e.g., Sewells Point), some places less periodic (e.g., Wilmington), and other locations more periodic in recent times (e.g., Charleston). While causative explanations for these variations are beyond the scope of this study, the aperiodic clusters have been thought to correspond to interdecadal to decadal-scale variability observed in cyclonic development caused by North Atlantic Oscillation (NAO) and El Niño–Southern Oscillation (ENSO) phases (Figs. 8–11; Davis et al., 1993; Zhang et al., 2000; Hirsch et al., 2001; Colle et al., 2015).
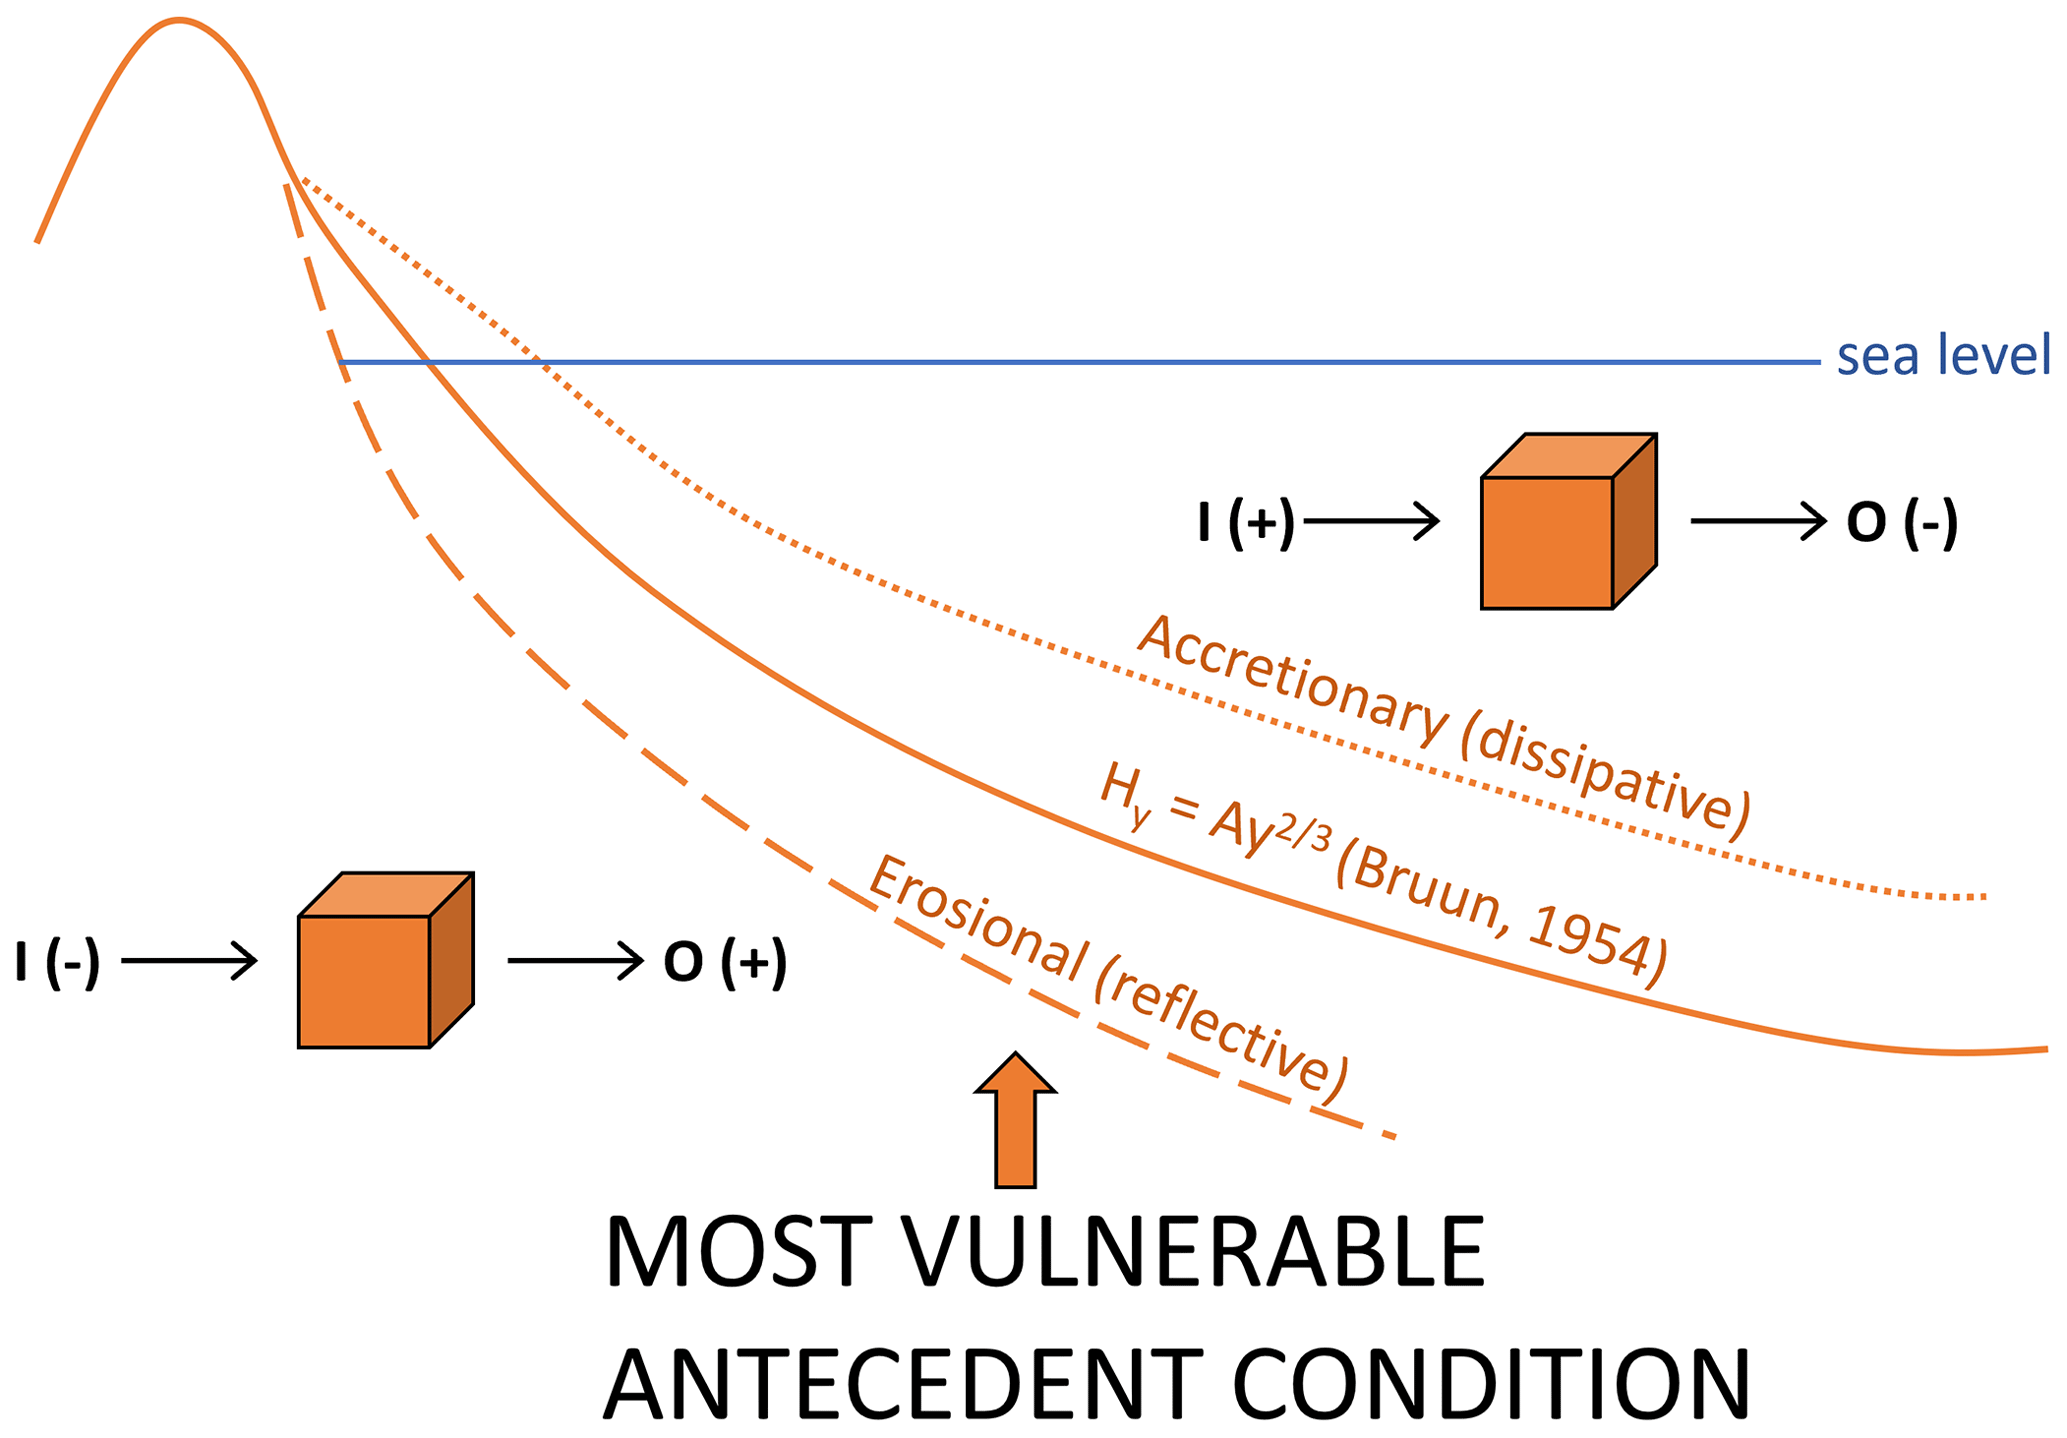
Figure 12Various antecedent beach states that precede a storm impact. The cubes represent control volumes into which an input (I) of sand is transported and out of which an output (O) of sand leaves. Erosional states reflect I<O and accretionary states indicate I>O.
Finally, this study identified the well-known latitudinal gradient between tropical and extratropical storms along the US east coast by revealing the tendency for tropical storms to control beach erosion potential along southern US coasts (Wilmington, NC, to Key West, FL) and extratropical storms to impact the northern beaches (Portland, ME, to Sewells Point, VA) (Figs. 10 and 11; Davis et al., 1993; Zhang et al., 2001; Booth et al., 2016). As noted above, Sewells Point, VA, contained the greatest-magnitude SEPI and CSII values because of its location in the mid-Atlantic reach and exposure to both storm types. Additionally, CSII peak magnitudes were greater for the northern extratropical-storm-influenced stations than the CSII peak magnitudes of the southern stations (except for Wilmington, NC, given the potential augmentation of the surge as discussed above), demonstrating the importance of more frequent extratropical storms in affecting beach states in the north. However, we would expect future CSII values to increase in the southern stations given the potential for sequential tropical cyclone impacts to increase in the future (Xi et al., 2023).
This research provides a comprehensive analysis of storm frequency and magnitude trends along the US east coast, ranging from central Maine to southern Florida. Using historical water level data from 12 NOAA tide gauge stations and the Storm Erosion Potential Index (SEPI) criteria to identify storm events, this study examines both temporal and spatial variations in storminess and its potential impact on beach erosion.
The analysis of storm frequency reveals no significant long-term trend across the studied stations, except for a minor increase observed at the Wilmington, NC, tide station. However, the examination of storm magnitude indicates statistically significant but modest increases over time at 8 out of the 12 tidal stations, particularly evident from New York to Florida. These findings align with previous studies indicating an increase in extreme storm surges along the US east coast, suggesting potential implications for shoreline damage.
Moreover, the research introduces a novel metric, the cumulative storm impact index (CSII), which accounts for both storm magnitude and clustering in time. The CSII analysis highlights the cumulative impact of successive and large-magnitude storms on beach erosion potential, revealing distinct regional patterns. Notably, the study identifies a latitudinal gradient in storm impact, with tropical storms predominantly influencing southern US coasts and extratropical storms impacting northern beaches.
Overall, this research enhances our understanding of storm dynamics and their implications for coastal erosion along the US east coast. By providing insights into both frequency and magnitude trends, as well as the cumulative impact of storms, the findings contribute valuable information for coastal management and resilience planning in the face of changing climatic conditions. Further research in this area is crucial for anticipating future storm impacts and implementing effective mitigation strategies to safeguard vulnerable coastal communities and ecosystems. Such studies should include identifying regional and local factors that control the beach recovery time and comparing that to the time allowed for beach recovery based on the CSII analysis and the observed 4- to 10-year interdecadal variation in the observed CSII values.
The data used for this study come from NOAA Tides and Currents and NOAA About Harmonic Constituents. Software codes used for data curation can be found in McManus et al. (2023a, https://doi.org/10.5281/zenodo.8277727) and McManus et al. (2023b, https://doi.org/10.5281/zenodo.8277745). McManus et al. (2023c, https://doi.org/10.5281/zenodo.8277822) provide the codes used to identify storms and perform the SEPI calculations. Resulting data can be found in McManus et al. (2023d, https://doi.org/10.5281/zenodo.8277826). The study by Dominguez et al. (2023, https://doi.org/10.5281/zenodo.8277826) contains the code used for CSII calculations and figure creation.
The supplement related to this article is available online at: https://doi.org/10.5194/esurf-12-1145-2024-supplement.
MF and RD conceptualized the project and developed the methodology. JM curated the data; MF and RD conducted the investigation and formal analysis. MF and RD wrote the manuscript draft, and RD, MF, and JM reviewed and edited the manuscript.
The contact author has declared that none of the authors has any competing interests.
Publisher's note: Copernicus Publications remains neutral with regard to jurisdictional claims made in the text, published maps, institutional affiliations, or any other geographical representation in this paper. While Copernicus Publications makes every effort to include appropriate place names, the final responsibility lies with the authors.
We thank Charles Gowan for his statistical expertise and contributions and Christopher Hein, Ioannis Georgiou, and Justin Shawler for their helpful discussions and feedback.
This project was funded, in part, by Randolph-Macon College's Walter Williams Craigie Endowment, the Chenery Research Professorship Grant, and the Rashkind Endowment. Additional support came from the Virginia Coast Reserve's Long-term Ecological Research NSF grant DEB-1832221.
This paper was edited by Sagy Cohen and reviewed by two anonymous referees.
Ahmed, M. A., Sridharan, B., Saha, N. Sannasiraj, S. A., and Kuiry, S. N.: Assessment of coastal vulnerability for extreme events, Int. J. Disast. Risk Reduct., 82, 103341, https://doi.org/10.1016/j.ijdrr.2022.103341, 2022.
Aubrey, D. and Speer, P.: A study of non-linear tidal propagation in shallow inlet/estuarine systems Part I: Observations. Estuar. Coast. Shelf Sci., 21, 185–205, 1985.
Balsillie, J. H.: Volumetric beach and coast erosion due to storm and hurricane impact, Open File Report No. 78, Florida Geological Survey, Tallahassee, Florida, 37 pp., https://doi.org/10.35256/OFR78, 1999.
Bender, M. A., Knutson, T. R., Tuleya, R. E., and Held, I.: Modeled impact of anthropogenic warming on the frequency of intense Atlantic hurricanes, Science, 327, 454–458, https://doi.org/10.1126/science.1180568, 2010.
Bengtsson, L., Hodges, K. I., Esch, M., Keenlyside, N., Kornblueh, L., Luo, J.-J., and Yamagata, T.: How may tropical cyclones change in a warmer climate?, Tellus A, 59, 539–561, https://doi.org/10.1111/j.1600-0870.2007.00251.x, 2007.
Bhatia, K., Vecchi, G., Murakami, H., Underwood, S., and Kossin, J.: Projected response of tropical cyclone intensity and intensification in a global climate model, J. Climate, 31, 8281–8303, https://doi.org/10.1175/JCLI-D-17-0898.1, 2018.
Bigelow, F. H. and Moore, W. L.: Storms, Storm Tracks and Weather Forecasting, United States, Dept. of Agriculture, Weather Bureau, Government Printing Office, Washington, DC, 87 pp., 1897.
Birchler, J. J., Dalyander, P. S., Stockdon, H. F., and Doran, K. S.: National assessment of nor'easter-induced coastal erosion hazards – Mid- and northeast Atlantic coast, US Geological Survey Open-File Report 2015-1154, US Geolgical Survey, p. 34, https://doi.org/10.3133/ofr20151154, 2015.
Booth, J. F., Riedre, H. E., and Kushnir, Y.: Comparing hurricane and extratropical storm surge for the Mid-Atlantic and northeast coast of the United States for 1979–2013, Environ. Res. Lett., 11, 094004, https://doi.org/10.1088/1748-9326/11/9/094004, 2016.
Bromirski, P. D. and Kossin, J. P.: Increasing hurricane wave power along the U.S. Atlantic and Gulf coasts, J. Geophys. Res., 113, C07012, https://doi.org/10.1029/2007JC004706, 2008.
Burvingt, O., Masselink, G., Russell, P., and Scott, T.: Classification of beach response to extreme storms, Geomorpology, 295, 722–737, https://doi.org/10.1016/j.geomorph.2017.07.022, 2017.
Callahan, J. A., Leathers, D. J., and Callahan, C. L.: Comparison of extreme coastal flooding events between tropical and midlatitude weather systems in the Delaware and Chesapeake Bays for 1980–2019, J. Appl. Meteorol. Clim., 61, 457–472, https://doi.org/10.1175/JAMC-D-21-0077.1, 2022.
Camargo, S. J.: Global and regional aspects of tropical cyclone activity in the CMIP5 models, J. Climate, 26, 9880–9902, https://doi.org/10.1175/JCLI-D-12-00549.1, 2013.
Chang, E. K. M.: Impacts of background field removal on CMIP5 projected changes in Pacific winter cyclone activity, J. Geophys. Res.-Atmos, 119, 4626–4639, https://doi.org/10.1002/2013jd020746, 2014.
Chang, E. K. M.: CMIP5 projected change in northern hemisphere winter cyclones with associated extreme winds, J. Climate, 31, 6527–6542, https://doi.org/10.1175/JCLI-D-17-0899.1, 2018.
Chi, L., Wolfe, C. L. P., and Hameed, S.: Reconsidering the relationship between gulf stream transport and dynamic sea level at U.S. east coast. Geophys. Res. Lett., 50, e2022GL102018, https://doi.org/10.1029/2022GL102018, 2023.
Cohn, N., Ruggiero, P., García-Medina, G., Anderson, D., Serafin, K. A., and Biel, R.: Environmental and morphologic controls on wave-induced dune response, Geomorphology, 329, 108–128, https://doi.org/10.1016/j.geomorph.2018.12.023, 2019.
Colle, B. A., Zhang, Z., Lombardo, K. A., Chang, E., Liu, P., and Zhang, M.: Historical evaluation and future prediction of eastern North American and western Atlantic extratropical cyclones in the CMIP5 Models during the cool season, J. Climate, 26, 6882–6903, https://doi.org/10.1175/JCLI-D-12-00498.1, 2013.
Colle, B. A., Booth, J. F., and Chang, E. K. M.: A review of historical and future changes of extratropical cyclones and associated impacts along the US East Coast, Curr. Clim. Change Rep., 1, 125–143, https://doi.org/10.1007/s40641-015-0013-7, 2015.
Davis, R. E., Dolan, R., and Demme, G.: Synoptic climatology of Atlantic coast northeasters, Int. J. Climatol., 13, 171–189, 1993.
Dean, R. G.: Equilibrium beach profiles: characteristics and applications, J. Coast. Res., 7, 53–84, 1991.
Dinan, T.: Projected increases in hurricane damage in the United States: The role of climate change and coastal development, Ecol. Econ., 138, 186–198, https://doi.org/10.1016/j.ecolecon.2017.03.034, 2017.
Dolan, R. and Davis, R. E.: Coastal Storm Hazards, J. Coast. Res., 12, 103–114, 1994.
Dominguez, R., Fenster, M. McManus, J.: CSII calculations and Figs., Zenodo [code], https://doi.org/10.5281/zenodo.8277826, 2023.
Doran, K. S., Birchler, J. J., Hardy, M. W., Bendik, K. J., Pardun, J. M., and Locke, H. A.: National assessment of hurricane-induced coastal erosion hazards (ver. 2.0, February 2021): U.S. Geological Survey data release, US Geological Survey, https://doi.org/10.5066/P99ILAB9, 2021.
Edelman, T. I.: Dune erosion during storm conditions, in: Proceedings of 13th conference on coastal engineering, American Society of Civil Engineers, 10–14 June 1972, Vancouver, Canada, 1305–1312, https://doi.org/10.9753/icce.v13.66, 1972.
Emanuel, K. A.: Increasing destructiveness of tropical cyclones over the past 30 years, Nature, 436, 686–688, https://doi.org/10.1038/nature03906, 2005.
Emanuel, K. A.: Downscaling CMIP5 climate models shows increased tropical cyclone activity over the 21st century, P. Natl. Acad. Sci. USA, 110, 12219–12224, https://doi.org/10.1073/pnas.1301293110, 2013.
Ezer, T.: Sea level rise, spatially uneven and temporally unsteady: Why the U.S. East Coast, the global tide gauge record, and the global altimeter data show different trends, Geophys. Res. Lett., 40, 5439–5444, https://doi.org/10.1002/2013GL057952, 2013.
Ezer, T., Atkinson, L. P., Corlett, W. B., and Blanco, J. L.: Gulf Stream's induced sea level rise and variability along the U.S. mid-Atlantic coast, J. Geophys. Res., 118, 685–697, https://doi.org/10.1002/JGRC.20091, 2013.
Fenster, M. S. and Dominguez, R.: Quantifying coastal storm impacts using a new cumulative storm impact index (CSII) model: Application along the Virginia coast, USA, J. Geophys. Res.-Earth, 127, e2022JF006641, https://doi.org/10.1029/2022JF006641, 2022.
Feser, F., Barcikowska, M., Krueger, O., Schenk, F., Weisse, R., and Xia, L.: Storminess over the North Atlantic and northwestern Europe – A review, Q. J. Roy. Meteorol. Soc., 141, 350–382, https://doi.org/10.1002/qj.2364, 2014.
FitzGerald, D. M., Fenster, M. S., Argow, B. A., and Buynevich, I. V.: Coastal impacts due to sea-level rise, Annu. Rev. Earth Planet. Sci., 36, 601–647, https://doi.org/10.1146/annurev.earth.35.031306.140139, 2008.
Friedman, R. M., Dunn, S. V., and Merrell, W. J., Jr.: Summary of the Heinz Center report on coastal erosion and the National Flood Insurance Program, J. Coast. Res., 8, 568–575, 2002.
Ghanavati, M., Young, I., Kirezci, E., Ranasinghe, R., Duong, T. M., Luijendijk, A. P.: An assessment of whether long-term global changes in waves and storm surges have impacted global coastlines, Nat. Sci. Rep., 13, 11549, https://doi.org/10.1038/s41598-023-38729-y, 2023.
Gualdi, S., Scoccimarro, E., and Navarra, A.: Changes in tropical cyclone activity due to global warming: results from a high-resolution coupled general circulation model, J. Climate, 21, 5204–5228, https://doi.org/10.1175/2008JCLI1921.1, 2008.
Hamid, A. I. A., Din, A. H. M., Yusof, N., Abdullah, N. M., Omar, A. H., and Khanan, M. F. A.: Coastal vulnerability index development: A review, in: The International Archives of the Photogrammetry, Remote Sensing and Spatial Information Sciences, 6th International Conference on Geomatics and Geospatial Technology, 1–3 October 2019, Kuala Lumpur, Malaysia, 229–235, https://doi.org/10.5194/isprs-archives-XLII-4-W16-229-2019, 2019.
Harley, M.: Coastal storm definition, in: Coastal Storms: Processes and Impacts, edited by: Ciavola, P. and Coco, G., John Wiley & Sons, 1–21, https://doi.org/10.1002/9781118937099.ch1, 2017.
Harley, M. D., Masselink, G., Ruiz de Alegría-Arzaburu, A., Valiente, N. G., and Scott, T.: Single extreme storm sequence can offset decades of shoreline retreat projected to result from sea-level rise, Commun. Earth Environ., 3, 112, https://doi.org/10.1038/s43247-022-00437-2, 2022.
Harvey, T. C., Hamlington, B. D., Frederikse, T., Nerem, R. S., Piecuch, C. G., Hammond, W. C., Blewitt, G., Thompson, P. R., Bekaert, D. P. S., Landerer, F. W., Reager, J. T., Kopp, R. E., Chandanpurkar, H., Fenty, I., Trossman, D., Walker, J. S., and Boening, C.: Ocean mass, sterodynamic effects, and vertical land motion largely explain US coast relative sea level rise, Commun. Earth Environ., 2, 233, https://doi.org/10.1038/s43247-021-00300-w, 2021.
Hayden, B.: Storm wave climates at Cape Hatteras, North Carolina: recent secular variations, Science, 190, 981–983, 1975.
Hayden, B. P.: Secular variations in Atlantic coast extratropical cyclones, Mon. Weather Rev., 100, 159–167, 1981.
Hayden, B. P.: Climate change and extratropical storminess in the United States: An assessment, J. Am. Water Resour. Assoc., 35, 1387–1397, 1999.
Hein, S. S. V., Sohrt, V., Nehlsen, E., Strotmann, T., and Fröhle, P.: Tidal oscillation and resonance in semi-closed estuaries – empirical analyses from the Elbe Estuary, North Sea, Water, 13, 848, https://doi.org/10.3390/w13060848, 2021.
Hirsch, M., DeGaetano, A., and Colucci, S.: An East Coast winter climatology, J. Climate, 14, 882–899, https://doi.org/10.1175/1520-0442(2001)014<0882:AECWSC>2.0.CO;2, 2001.
Holland, G. and Bruyère, C. L.: Recent intense hurricane response to global climate change, Clim. Dynam., 42, 617–627, https://doi.org/10.1007/s00382-013-1713-0, 2014.
Hosler, C. L. and Gamage, L. A.: Cyclone frequencies in the United States for the period 1905 to 1954.,Mon. Weather Rev., 84, 388–390, 1956.
Kang, N. Y. and Elsner, J. B.: Consensus on climate trends in western north Pacific tropical cyclones, J. Climate, 25, 7564–7573, https://doi.org/10.1175/jcli-d-11-00735.1, 2012.
Karunarathna, H., Pender, D., Ranasinghe, R., Short, A. D., and Reeve, D. E.: The effects of storm clustering on beach profile variability, Mar. Geol., 348, 103–112, https://doi.org/10.1016/j.margeo.2013.12.007, 2014.
Klein, W. H.: A hemispheric study of daily pressure variability at sea level and aloft, J. Meteorol., 8, 332–346, 1951.
Klein, W. H.: The frequency of cyclones and anticyclones in relation to the mean circulation, J. Meteorol., 15, 98–102, 1958.
Klein, W. H.: Application of synoptic climatology and short-range numerical prediction to five-day forecasting, Weather Bureau Research Paper No. 46, Weather Bureau, Washington, DC, 109 pp., 1965.
Kishtawal, C. M., Jaiswal, N., Singh, R., and Niyogi, D.: Tropical cyclone intensification trends during satellite era (1986–2010), Geophys. Res. Lett., 39, 1–6, https://doi.org/10.1029/2012gl051700, 2012.
Knutson, T. R., Sirutis, J. J., Garner, S. T., Held, I. M., and Tuleva, R. E.: Simulation of the recent multidecadal increase of Atlantic hurricane activity using an 18-km-grid regional model, B. Am. Meteorol. Soc., 88, 1549–1565, 2007.
Knutson, T. R., Sirutis, J. J., Garner, S. T., Vecchi, G. A., and Held, I. M.: Simulated reduction in Atlantic hurricane frequency under twenty-first-century warming conditions, Nat. Geosci., 359, 1–6, 2008.
Knutson, T. R., McBride, J. L., Chan, J., Emanuel, K. A., Holland, G. J., Landsea, C. W., Held, I., Kossin, J. P., Srivastava, A. K., and Sugi, M.: Tropical cyclones and climate change, Nat. Geosci., 3, 157–163, https://doi.org/10.1038/ngeo779, 2010.
Knutson, T.R, Sirutis, J. J., Zhao, M., Tuleya, R. E., Bender, M., Vecchi, G. A., Villarini, G., and Chavas, D.: Global projections of intense tropical cyclone activity for the late twenty-first century from dynamical downscaling of CMIP5/RCP4.5 scenarios, J. Climate, 28, 7203–7224, https://doi.org/10.1175/jcli-d-15-0129.1, 2015.
Knutson, T. R., Camargo, S. J., Chan, J. C. L., Emanuel, K., Ho, C. H., Kossin, J. P., Mohapatra, M., Satoh, M., Sugi, M., Walsh, K., and Wu, L.: Tropical cyclones and climate change assessment: Part I: Detection and attribution, B. Am. Meterol. Soc., 100, 1987–2007, https://doi.org/10.1175/BAMS-D-18-0189.1, 2019.
Knutson, T. R., Camargo, S. J., Chan, J. C. L., Emanuel, K., Ho, C. H., Kossin, J. P., Mohapatra, M., Satoh, M., Sugi, M., Walsh, K., and Wu, L.: Tropical cyclones and climate change assessment: Part II: Projected response to anthropogenic warming, B. Am. Meterol. Soc., 101, E303–E322, https://doi.org/10.1175/BAMS-D-18-0194.1, 2020.
Komar, P. and Allan, J. C.: Increasing hurricane-generated wave heights along the U.S. East Coast and their climate controls, J. Coast. Res., 24, 479–488, https://doi.org/10.2112/07-0894.1, 2008.
Kossin, J. P.: A global slowdown of tropical-cyclone translation speed, Nature, 558, 104–107, https://doi.org/10.1038/s41586-018-0158-3, 2018.
Kossin, J. P., Olander, T. L.. and Knapp, K. R.: Trend analysis with a new global record of tropical cyclone intensity, J. Climate, 26, 9960–9976, https://doi.org/10.1175/jcli-d-13-00262.1, 2013.
Kossin, J. P., Hall, T., Knutson, T., Kunkel, K. E., Trapp, R. J., Waliser, D. E., and Wehner, M. F.: Extreme storms, in: Climate Science Special Report: Fourth National Climate Assessment, Volume I, edited by: Wuebbles, D. J., Fahey, D. W., Hibbard, K. A., Dokken, D. J., Stewart, B. C., and Maycock, T. K., US Global Change Research Program, Washington, DC, 256–276, https://doi.org/10.7930/J07S7KXX, 2017.
Kossin, J. P., Knapp, K. R., Olander, T. L., and Velden, C. S.: Global increase in major tropical cyclone exceedance probability over the past four decades, P. Natl. Acad. Sci. USA, 117, 11975–11980, https://doi.org/10.1073/pnas.1920849117, 2020.
Leaman, C. K., Harley, M. D., Splinter, K. D., Thran, M. C., Kinsela, M. A., and Turner, I. L.: A storm hazard matrix combining coastal flooding and beach erosion, Coast. Eng., 170, 104001, https://doi.org/10.1016/j.coastaleng.2021.104001, 2021.
Leckebusch, G. C. and Ulbrich, U.: On the relationship between cyclones and extreme windstorm events over Europe under climate change, Global Planet. Change, 44, 181–193, https://doi.org/10.1016/j.gloplacha.2004.06.011, 2004.
Leckebusch, G. C., Koffi, B., Ulbrich, U., Pinto, J. G., Spangehl, T., and Zacharias, S.: Analysis of frequency and intensity of European winter storm events from a multi-model perspective, at synoptic and regional scales, Clim. Res., 32, 59–74, https://doi.org/10.3354/cr031059, 2006.
Little, C. M., Horton, R. M., Kopp, R. E., Oppenheimer, M., Vecchi, G. A., and Villarini, G.: Joint projections of US East Coast sea level and storm surge, Nat. Clim. Change, 5, 1114–1120, https://doi.org/10.1038/nclimate2801, 2015.
Lozano, I. and Swail, V.: The link between wave height variability in the north Atlantic and the storm track activity in the last four decades, Atmos.-Ocean, 40, 377–388, https://doi.org/10.3137/ao.400401, 2002.
Martin, G. M., Ringer, M. A., Pope, V. D., Jones, A., Dearden, C., and Hinton, T. J.: The physical properties of the atmosphere in the new Hadley Centre Global Environmental Model (HadGEM1). Part I: Model description and global climatology, J. Climate, 19, 1274–1301, https://doi.org/10.1175/JCLI3636.1, 2006.
Mather, J. R., Adams, H., and Yoshioka, G. A.: Coastal storms of the United States, J. Appl. Meteorol., 3, 693–706, 1964.
McInnes, K. L., Walsh, K. J. E., Hoeke, R. K., O'Grady, J. G., Colberg, F., and Hubbert, G. D.: Quantifying storm tide risk in Fiji due to climate variability and change, Global Planet. Change, 116, 115–129, https://doi.org/10.1016/j.gloplacha.2014.02.004, 2014.
Mclaughlin, S. and Cooper, J. A. G.: A multi-scale coastal vulnerability index: A tool for coastal managers?, Environ. Hazards, 9, 233–248, https://doi.org/10.3763/ehaz.2010.0052, 2010.
McManus, J., Dominguez, R., and Fenster, M.: Data pull and groom, Zenodo [code], https://doi.org/10.5281/zenodo.8277727, 2023a.
McManus, J., Dominguez, R., and Fenster, M.: Intermediate water level data set, Zenodo [data set], https://doi.org/10.5281/zenodo.8277745, 2023b.
McManus, J., Dominguez, R., and Fenster, M.: Storm ID and SEPI calculations, Zenodo [code], https://doi.org/10.5281/zenodo.8277822, 2023c.
McManus, J., Dominguez, R., and Fenster, M.: Storm and SEPI data set, Zenodo [data set], https://doi.org/10.5281/zenodo.8277826, 2023d.
Mei, W. and Xie, S. P.: Intensification of landfalling typhoons over the northwest Pacific since the late 1970s, Nat. Geosci., 9, 753–757, https://doi.org/10.1038/ngeo2792, 2016.
Meyer, E. M. I. and Gaslikova, L.: Investigation of historical severe storms and storm tides in the German Bight with century reanalysis data, Nat. Hazards Earth Syst. Sci., 24, 481–499, https://doi.org/10.5194/nhess-24-481-2024, 2024.
Miller, J. K. and Dean, R. G.: An engineering scale model for predicting the shoreline response to variations in waves and water levels, Coast. Eng., 3554–3566, https://doi.org/10.1142/9789812709554_0299, 2006.
Miller, J. K. and Livermont, E.: A predictive index for wave and storm surge induced erosion, in: Proceedings of the 31st International Conference on Coastal Engineering, 31 August–5 September 2008, Hamburg, Germany, 4143–4153, https://doi.org/10.1142/9789814277426_0344, 2008.
Morgan, J. P. and Stone, G. W.: A technique for quantifying the coastal geomorphology of Florida's barrier islands and sandy beaches”, Shore Beach, 53, 19–26, 1985.
Muis, S., Aerts, J. C. J. H., Á. Antolínez, J. A., Dullaart, J. C., Duong, T. M., Erikson, L., Haarsma, R. J., Apecechea, M. I., Mengel, M., Le Bars, D., O'Neill, A., Ranasinghe, R., Roberts, M. J., Verlaan, M., Ward, P. J., and Yan, K.: Global projections of storm surges using high-resolution CMIP6 climate models, Earth's Future, 11, e2023EF003479, https://doi.org/10.1029/2023EF003479, 2023.
Murakami, H., Hsu, P.-C. Arakawa, O., and Li, Y.: Influence of model biases on projected future changes in tropical cyclone frequency of occurrence, J. Climate, 27, 2159–2181, https://doi.org/10.1175/JCLI-D-13-00436.1, 2014.
Murakami, H., Vecchi, G. A., Underwood, S., Delworth, T. L., Wittenberg, A. T., Anderson, W. G., Chen, J.-H., Gudgel, R. G., Harris, L. M., Lin., S.-J., and Zeng, F.: Simulation and prediction of category 4 and 5 hurricanes in the high-resolution GFDL HiFLOR coupled climate model, J. Climate, 28, 9058–9079, https://doi.org/10.1175/jcli-d-15-0216.1, 2015.
Murakami, H., Delworth, T. L., Cooke, W. F., Zhao, M., Xiang, B., and Hsu, P.-C.: Detected climatic change in global distribution of tropical cyclones, P. Natl. Acad. Sci. USA, 117, 10706–10714, https://doi.org/10.1073/pnas.1922500117, 2020.
Nadal-Caraballo, N. C., Melby, J. A., Gonzalez, V. M., and Cox, A. T.: Coastal storm hazards from Virginia to Maine, North Atlantic Comprehensive Study ERDC/CHL TR-15-5, US Army Corps of Engineer Research and Development Center, Vicksburg, MS, 204 pp., https://www.nad.usace.army.mil/Portals/40/docs/ComprehensiveStudy/Coastal_Storm_Hazards_from_Virginia_to_Maine.pdf (last access: 26 September 2024), 2015.
NOAA: About Harmonic Constituents, Tides and Currents website, https://tidesandcurrents.noaa.gov/about_harmonic_constituents.html (last access: 21 August 2023), 2023.
NOAA: Tides and Currents, https://tidesandcurrents.noaa.gov/ (last access: 15 February 2024), 2024.
NOAA NCEI – National Centers for Environmental Information: U.S. billion-dollar weather and climate disasters, https://doi.org/10.25921/stkw-7w73, 2024.
Parker, B. B.: Tidal Analysis and Prediction, NOAA Special Publication NOS CO-OPS 3, US Department of Commerce, Silver Spring, Maryland, 378 pp., https://tidesandcurrents.noaa.gov/publications/Tidal_Analysis_and_Predictions.pdf (last access: 26 September 2024), 2007.
Parker, K., Erikson, L., Thomas, J., Nederhoff, K., Barnard, P., and Muis, S.: Relative contributions of water-level components to extreme water levels along the U.S. Southeast Atlantic Coast from a regional-scale water-level hindcast, Nat. Hazards, 117, 2219–2248, https://doi.org/10.1007/s11069-023-05939-6, 2023.
Roberts, M. J., Camp, J., Seddon, J., Vidale, P. L., Hodges, K., Vanniere, B., Mecking, J., Haarsma, R., Bellucci, A., Scoccimarro, E., Caron, L.-P., Chauvin, F., Terray, L., Valcke, S., Moine, M.-P., Putrasahan, D., Roberts, C., Senan, R., Zarzycki, C., and Ullrich, P.: Impact of model resolution on tropical cyclone simulation using the HighResMIP–PRIMAVERA multimodel ensemble, J. Climate, 33, 2557–2583, https://doi.org/10.1175/jcli-d-19-0639.1, 2020.
Sallenger, A. H.: Storm impact scale for barrier islands, J. Coast. Res., 16, 890–895, 2000.
Sallenger, A. H., Doran, K. S., and Howd, P.: Hotspot of accelerated sea-level rise on the Atlantic coast of North America, Nat. Clim. Change, 2, 884–888, https://doi.org/10.1038/nclimate1597, 2012.
Schreck, C. J., Knapp, K. R., and Kossin, J. P.: The impact of best track discrepancies on global tropical cyclone climatologies using IBTrACS, Mon. Weather Rev., 142, 3881–3899, https://doi.org/10.1175/mwr-d-14-00021.1, 2014.
Seiler, C. and Zwiers, F. W.: How will climate change affect explosive cyclones in the extratropics of the Northern Hemisphere?, Clim. Dynam., 46, 3633–3644, https://doi.org/10.1007/s00382-015-2791-y, 2016.
Seneviratne, S. I., Zhang, X., Adnan, M., Badi, W., Dereczynski, C., Di Luca, A., Ghosh, S., Iskandar, I., Kossin, J., Lewis, S., Otto, F., Pinto, I., Satoh, M., Vicente-Serrano, S. M., Wehner, M., and Zhou, B.: Weather and climate extreme events in a changing climate, in: Climate Change 2021: The Physical Science Basis, Contribution of Working Group I to the Sixth Assessment Report of the Intergovernmental Panel on Climate Change, edited by: Masson-Delmotte, V., Zhai, P., Pirani, A., Connors, S. L., Péan, C., Berger, S., Caud, N., Chen, Y., Goldfarb, L., Gomis, M. I., Huang, M., Leitzell, K., Lonnoy, E., Matthews, J. B. R., Maycock, T. K., Waterfield, T., Yelekçi, O., Yu, R., and Zhou, B., Cambridge University Press, Cambridge, UK and New York, NY, USA, 1513–1766, https://doi.org/10.1017/9781009157896.013, 2021.
Serafin, K. A., Ruggiero, P., and Stockdon, H. F.: The relative contribution of waves, tides, and non-tidal residuals to extreme total water levels on U.S. West Coast sandy beaches, Geophys. Res. Lett., 44, 1839–1847, https://doi.org/10.1002/2016GL071020, 2017.
Shaw, T. A., Baldwin, M., Barnes, E. A., Caballero, R., Garfinkel, C. I., Hwang, Y. T., Li, C., and O'gorman, P. A.: Storm track processes and the opposing influences of climate change, Nat. Geosci., 9, 656–664, https://doi.org/10.1038/ngeo2783, 2016.
Smith, A. B. and Katz, R. W.: US billion-dollar weather and climate disasters: data sources, trends, accuracy and biases, Nat. Hazards, 67, 387–410, https://doi.org/10.1007/s11069-013-0566-5, 2013.
Smith, A. B. and Matthews, J. L.: Quantifying uncertainty and variable sensitivity within the US billion-dollar weather and climate disaster cost estimates, Nat. Hazards, 77, 1829–1851, https://doi.org/10.1007/s11069-015-1678-x, 2015.
Sobel, A. H., Wing, A. A., Camargo, S. J., Patricola, C. M., Vecchi, G. A., Lee, C.-Y., and Tippett, M. K.: Tropical cyclone frequency, Earth's Future, 9, e2021EF002275, https://doi.org/10.1029/2021EF002275, 2021.
Speer, P. and Aubrey, D.: A study of non-linear tidal propagation in shallow inlet/estuarine systems Part II: Theory, Estuar. Coast. Shelf Sci., 21, 207–224, 1985.
Steetzel, H. J.: Cross-shore transport during storm surges, PhD thesis, Deft University of Technology, Delft, 242 pp., https://resolver.tudelft.nl/uuid:83f01c82-f290-485e-b078-7643f1c2d419 (last access: 26 September 2024), 1993.
Stockdon, H. F., Sallenger, A. H., Holman, R. A., and Howd, P.: A simple model for the spatially-variable coastal response to hurricanes, Mar. Geol., 238, 1–20, https://doi.org/10.1016/J.MARGEO.2006.11.004, 2007.
Stockdon, H. F., Long, J. W., Palmsten, M. L., Van der Westhuysen, A., Doran, K. S., and Snell, R. J.: Operational forecasts of wave-driven water levels and coastal hazards for US Gulf and Atlantic coasts, Commun. Earth Environ., 4, 169, https://doi.org/10.1038/s43247-023-00817-2, 2023.
Sweet, W. V., Kopp, R. E., Weaver, C. P., Obeysekera, J., Horton, R. M., Thieler, E. R., and Zervas, C.: Global and regional sea level rise scenarios for the United States, NOAA Tech. Rep. NOS CO-OPS 083, NOAA, Silver Spring, MD, 55 pp. with appendices, https://doi.org/10.7289/v5/tr-nos-coops-083, 2017.
Tadesse, M. G., Wahl, T., Rashid, M. M., Dangendorf, S., Rodríguez-Enríquez, A., and Talke, S. A.: Long-term trends in storm surge climate derived from an ensemble of global surge reconstructions, Sci. Rep., 12, 13307, https://doi.org/10.1038/s41598-022-17099-x, 2022.
Tauvale, L. and Tsuboki, K.: Characteristics of tropical cyclones in the Southwest Pacific, J. Meteorol. Soc. Jpn. Ser. II, 97, 711–731, https://doi.org/10.2151/jmsj.2019-042, 2019.
Thieler, E. R. and Hammar-Klose, E. S.: National assessment of coastal vulnerability to sea level rise: preliminary results for the U.S. Atlanta coast, US Geol. Surv. Open File Rep. 99-593, US Geological Survey, https://doi.org/10.3133/ofr99593, 1999.
Torresan, S., Critto, A., Rizzi, J., and Marcomini, A.: Assessment of coastal vulnerability to climate change hazards at the regional scale: the case study of the North Adriatic Sea, Nat. Hazards Earth Syst. Sci., 12, 2347–2368, https://doi.org/10.5194/nhess-12-2347-2012, 2012.
Tory, K. J., Chand, S. S., McBride, J. L., Ye, H., and Dare, R. A.: Projected changes in late 21st century tropical cyclone frequency in 13 coupled climate models from phase 5 of the coupled model intercomparison project, J. Climate, 26, 9946–9959, https://doi.org/10.1175/JCLI-D-13-00010.1, 2013.
van Rijn, L.C.: Analytical and numerical analysis of tides and salinities in estuaries; part I: Tidal wave propagation in convergent estuaries, Ocean Dynam., 61, 1719–1741, https://doi.org/10.1007/s10236-011-0453-0, 2011.
Vecchi, G. A., Swanson, K. L., and Soden, B. J.: Whither hurricane activity?, Science, 322, 687–689, 2008.
Walsh, K. J. E., Camargo, S. J., Vecchi, G. A., Daloz, A. S., Elsner, J., Emanuel, K., Horn, M., Lim, Y.-K., Roberts, M., Patricola, C., Scoccimarro, E., Sobel., A. H., Strazzo, S., Villarini, G., Wehner, M., Zhao, M., Kossin, J. P., LaRow, T., Oouchi, K., Schubert, S., Wang, H., Bacmeister, J., Chang, P., Chauvin, F., Jablonowski, C., Kumar, A., Murakami, H., Ose, T., Reed, K. A., Saravanan, R., Yamada, Y., Zarzycki, C. M., Vidale, P. L., Jonas, J. A., and Henderson, N.: Hurricanes and climate: The U.S. CLIVAR Working Group on hurricanes, B. Am. Meteorol. Soc., 96, 997–1017, https://doi.org/10.1175/bams-d-13-00242.1, 2015.
Walsh, K. J. E., McBride, J. L., Klotzbach, P. J., Balachandran, S., Camargo, S. J., Holland, G., Knutson, T. R., Kossin, J. P., Lee, T.-C., Sobel, A., and Sugi, M.: Tropical cyclones and climate change, WIREs Clim. Change, 7, 65–89, https://doi.org/10.1002/wcc.371, 2016.
Webster, P. J., Holland, G. J., Curry, J. A., and Chang, H.-R.: Changes in tropical cyclone number, duration, and intensity in a warming environment, Science, 309, 1844–1846, 2005.
Wehner, M., Prabhat, Reed, K. A., Stone, D., Collins, W. D., and Bacmeister, J.: Resolution dependence of future tropical cyclone projections of CAM5.1 in the U.S. CLIVAR Hurricane Working Group idealized configurations, J. Climate, 28, 3905–3925, https://doi.org/10.1175/JCLI-D-14-00311.1, 2015.
Xi, D., Lin, N., and Gori, A.: Increasing sequential tropical cyclone hazards along the US East and Gulf coasts, Nat. Clim. Change, 13, 258–265, https://doi.org/10.1038/s41558-023-01595-7, 2023.
Yamaguchi, M., Chan, J. C. L., Moon, I.-J., Yoshida, K., and Mizuta, R.: Global warming changes tropical cyclone translation speed, Nat. Commun., 11, 47, https://doi.org/10.1038/s41467-019-13902-y, 2020.
Yang, H., Lohmann, G., Lu, J., Gowan, E. J., Shi, X., Liu, J., and Wang, Q.: Tropical expansion driven by poleward advancing mid-latitude meridional temperature gradients, J. Geophy. Res.-Atmos., 125, e2020JD033158, https://doi.org/10.1029/2020JD033158, 2020.
Yin, J.: Rapid decadal acceleration of sea level rise along the U.S. East and Gulf Coasts during 2010–2022 and its impact on hurricane-induced storm surge, J Climate, 1, 1–38, https://doi.org/10.1175/JCLI-D-22-0670.1, 2023.
Yin, J. and Goddard, P. B.: Oceanic control of sea level rise patterns along the East Coast of the United States, Geophys. Res. Lett., 40, 5514–5520, https://doi.org/10.1002/2013GL057992, 2013.
Zappa, G., Shaffrey, L. C., Hodges, K. I., Sansom, P. G,. and Stephenson, D. B.: A multimodel assessment of future projections of North Atlantic and European extratropical cyclones in the CMIP5 climate models, J. Climate, 26, 5846–5862, https://doi.org/10.1175/jcli-d-12-00573.1, 2013.
Zarzycki, C. M. and Ullrich, P. A.: Assessing sensitivities in algorithmic detection of tropical cyclones in climate data, Geophys. Res. Lett., 44, 1141–1149, https://doi.org/10.1002/2016gl071606, 2017.
Zhang, K.: Twentieth century storm activity and sea level rise along the U.S. east coast and their impact on shoreline position, PhD thesis, McKeldin Library, University of Maryland at College Park, College Park, 266 pp., 1998.
Zhang, K., Douglas, B. C., and Leatherman, S. P.: Twentieth-century storm activity along the U.S. east coast, J. Climate, 13, 1748–1761, 2000.
Zhang, K., Douglas, B. C., and Leatherman, S. P.: Beach erosion potential for severe nor'easters, J. Coast. Res., 17, 309–321, 2001.
Zhao, C., Lin, Y., Wu, F., Wang, Y., Li, Z., Rosenfeld, D., and Wang, Y.: Enlarging rainfall area of tropical cyclones by atmospheric aerosols, Geophys. Res. Lett., 45, 8604–8611, https://doi.org/10.1029/2018gl079427, 2018.
Zhao, M., Held, I. M., Lin, S.-J., and Vecchi, G. A.: Simulations of global hurricane climatology, interannual variability, and response to global warming using a 50-km Resolution GCM, J. Climate, 22, 6653–6678, https://doi.org/10.1175/2009JCLI3049.1, 2009.
Zishka, K. M. and Smith, P. J.: The climatology of cyclones and anticyclones over North America and surrounding ocean environs for January and July, 1950–77, Mon Weather Rev., 108, 387–401, 1980.