the Creative Commons Attribution 4.0 License.
the Creative Commons Attribution 4.0 License.
 | 22 Oct 2024
Barchan swarm dynamics from a Two-Flank Agent-Based Model
Dominic T. Robson
Andreas C. W. Baas
In this work, we simulate barchan swarms using the Two-Flank Agent-Based Model and investigate how changes to model parameters and environmental drivers lead to different swarm dynamics. In particular, we explore how the parameter qshift, which controls the rate of equilibration between the flanks of an asymmetric dune and thereby the stability of an asymmetric morphology, influences the frequencies of different collision types in the swarm and can be adjusted to produce swarms with dune sizes that are longitudinally homogeneous. Such size stability has been observed in real-world swarms but has not been obtained by previous agent-based models. We also find that, for certain densities of newly added barchans, the dune number density remains constant with downwind distance, something which has also been reported in nature but not in previous agent-based models. We also investigated how boundary condition changes propagate through swarms, something which will become increasingly important in the face of human infrastructure expansion and anthropogenic climate change. Finally, we are able to investigate how asymmetry and spatially patterning in the swarms are influenced by bimodal wind regimes. Since these simulations produce many more realistic phenomena than previous models, this work represents a significant step forward in the our understanding of the interplay between environmental conditions and dune interactions in shaping the dynamics of barchan swarms.
- Article
(9089 KB) - Full-text XML
- BibTeX
- EndNote


Crescent-shaped barchan dunes are one of the most striking aeolian bedforms and are found on Mars (Bourke, 2010; Rubanenko et al., 2022; Bourke and Goudie, 2009; Robson et al., 2022) and many different locations on Earth (Goudie, 2020; Elbelrhiti et al., 2008; Hersen et al., 2004; Robson et al., 2022). Compared to other types of bedform, barchans migrate quickly, often up to hundreds of metres per year (Sparavigna, 2013; Corbett, 2018; Barnes, 2001). The rate at which the dunes move is controlled primarily by their size (Long and Sharp, 1964; Bagnold, 1941), which means that collisions can occur between the bedforms.
Individual barchans are typically tens of metres wide (Elbelrhiti et al., 2008; Durán et al., 2009) and evolve over timescales on the order of years. The evolution of small numbers of such bedforms can, therefore, be studied using numerical models of the microscopic behaviours of the sediment and fluid flow (Durán et al., 2011; Xiao et al., 2023). It is also possible to study proxies for aeolian barchans in a laboratory setting using a fluid, e.g. water, which is much denser than air (Hersen, 2005; Hersen et al., 2002; Assis and Franklin, 2020, 2021). In nature, however, we do not typically observe barchans forming in small numbers but rather vast populations of interacting dunes (Hersen et al., 2004). These huge systems, known as swarms (Hesse, 2009; Robson et al., 2022), can span tens or hundreds of square kilometres and contain hundreds, thousands, or even tens of thousands of bedforms (King, 1918; Durán et al., 2009; Elbelrhiti et al., 2008).
Swarms display many emergent phenomena such as size selection (Durán et al., 2009; Robson et al., 2022; Génois et al., 2013a), longitudinal homogeneity (Durán et al., 2011; Elbelrhiti et al., 2008), and horn-to-toe alignment (Elbelrhiti et al., 2008), all of which must result from interactions between the bedforms. Yet the exact relationships between barchan interactions and the observed properties of swarms are not well understood. This is an important issue, since it has been shown that anthropogenic climate change will affect many active aeolian systems (Engel et al., 2018; Gunn et al., 2022; Baas and Delobel, 2022), yet it will be difficult to understand the effect these changes will have on swarms without a sufficiently realistic model. This goes beyond merely academic curiosity, since the migration of barchans can pose a direct threat to human infrastructure, heritage sites, and settlements (Boulghobra, 2016; Hermas et al., 2012; Effat et al., 2011; Ding et al., 2020; Finkel, 1959; Lorenz et al., 2013); thus, understanding how dunes in swarms will evolve under contemporary climate change is vital for future planning.
Not only are the length scales of swarms orders of magnitude larger than those of the dunes themselves, but the timescales over which these systems evolve are also much longer than for individual barchans (Hesse, 2009; Xiao et al., 2023). Such length and timescales prohibit use of microscopic simulations due to computational costs (Durán et al., 2011) and laboratory experiments which cannot reach a sufficient size. Instead, one must turn to an alternative approach, agent-based models (ABMs), which treat the dunes themselves as the fundamental objects and distil the complexities of the microscopic motion of sediment into rules for the size evolution and migration of barchans and interactions between the bedforms (Lima et al., 2002).
Several ABMs have been implemented to study barchan swarms (Lima et al., 2002; Durán et al., 2011; Worman et al., 2013; Génois et al., 2013b), each of which included a different subset of known interaction types. Alongside these, several one-dimensional ABMs have also been applied to aeolian systems (Parteli and Herrmann, 2003; Lee et al., 2005; Diniega et al., 2010); however, since barchan swarms are two-dimensional, the results can be very different.
The earliest barchan ABM (Lima et al., 2002) demonstrated that sand flux exchange could lead to spatial structuring, while, since only merging interactions were simulated, the overall size of dunes in the system increased with downwind distance. Allowing exchange collisions to dominate was shown to produce more realistic global size distributions (Durán et al., 2011) but did not eliminate the problem that dune size increased with downwind distance (Durán et al., 2011). When fragmentation collisions, instead, dominate the collision dynamics, clusters form, which exhibit a runaway increase in density which is mitigated only by the destruction of small dunes and an overall loss of sand that has to be compensated for through the spontaneous introduction of new dunes throughout the swarm (Génois et al., 2013b). Furthermore, when fragmentation and sand loss completely dominate the behaviour of a swarm; the largest dunes in the system are the newly injected dunes (Génois et al., 2013b), which contradicts the intuition that newly formed dunes should be the smallest in a swarm (Elbelrhiti, 2012). Finally, when collisions result only in merging, while dunes above a certain size are allowed to spontaneously fragment (calve), the distributions are found to display a large peak at the size at which calving begins to occur and a smaller peak at the size at which newly calved dunes form with very few barchans at other sizes (Worman et al., 2013). The swarms generated with all these model versions contrast with real-world swarms which are found to have typical distributions which are similar to a log-normal distribution (Durán et al., 2009). Thus, none of the existing barchan swarm ABMs has successfully reproduced realistic swarms. Furthermore, each of the previous works has considered the idealised case of symmetric barchans subject to an idealised unidirectional wind.
We have developed a new barchan ABM, the Two-Flank Agent-Based Model (TFABM), which has been shown to not only reproduce all of the observed collision behaviour of barchans but which can also be used to simulate the formation of asymmetric bedforms under the influence of variable wind regimes (Robson and Baas, 2023), thus successfully reproducing the angular dependence of asymmetry growth due to bimodal winds as suggested in previous studies (Parteli et al., 2014; Lv et al., 2016). In this paper, we report the characteristics and behaviours of barchan swarms under unidirectional, as well as bimodal winds, demonstrating that the new model is able to more realistically reproduce certain aspects of barchan swarms than previous ABMs and thus furthers our understanding of the connection between barchan interactions and swarm properties.
The TFABM and its capabilities to replicate all known barchan collision dynamics were introduced in Robson and Baas (2023), and extensive details of the model structure can be found there. However, in this section, we review the key features and provide definitions of the model parameters which are explored in this study.
2.1 Dune morphology
The major difference between the TFABM and previous barchan ABMs is the structure of the dunes (agents) themselves. In the TFABM, each dune is represented by its two flanks, which are able to change size semi-independently of one another. The position of the dunes is recorded as the coordinates of the upwind toe. The central axis of the dune extends in the direction of the dominant wind, which we define to be the positive x direction. The size of the dune is represented by the widths Wp,s of the port and starboard flanks. The widest point of the dune occurs at a distance downwind of the toe, where we use λ1=1, based on comparison with an existing dune dataset (Sherman et al., 2021). The total lengths of the flanks, from the toe to the tip of the horn, are assumed to be proportional to their widths , where we use λ2=1.8, based on real-world dunes (Sherman et al., 2021). Note that because these relationships between length and width are fixed, the TFABM cannot produce asymmetry where a single limb becomes highly extended longitudinally without the bulk of the barchan changing significantly. However, such asymmetry was reported to primarily occur due to bimodal winds with obtuse angular separation (Parteli et al., 2014), and in the later sections, we focus only on bimodality with acute angular separation for which the model performs well.
The width of each horn is a linear function of the flank width , with α=0.05 and Δ=4.6 m (Hersen et al., 2004; Worman et al., 2013). Finally, the volume of a flank is given by
where λ3 is interpreted as the proportionality coefficient of flank height/width, we set this to one-third, such that a symmetric dune has volume , which is in agreement with Elbelrhiti et al. (2008). For further details of the morphology of dunes in the TFABM, see Robson and Baas (2023).
2.2 Sand flux
Unlike previous barchan ABMs, the more realistic morphology of dunes in the TFABM allows for variation in the direction of wind. Incoming sand flux is absorbed by each flank across the windward projection of its width. For oblique winds, this means that the windward flank will absorb proportionally more of the flux, starving the leeward flank of material.
As well as absorbing material across their wind-facing width, dune flanks also lose material across the width of their horns. In the initial study in which the TFABM was introduced, flux was emitted from the horns at a saturated rate, regardless of the influx the horn received, in line with findings from continuum simulations (Hersen et al., 2004). Such a flux rule has also previously been applied in an earlier ABM (Worman et al., 2013), and we will refer to it as “unscaled” flux. However, others have suggested that the outflux from the horns should scale with the influx such that a dune which receives no incoming sediment will also emit comparatively less (Durán et al., 2010). Such a rule, which we will call “scaled” flux, has also previously been applied in an ABM (Durán et al., 2011).
Finally, in asymmetric dunes, there is an effective transfer of material from the larger to the smaller flank. If this were not the case, then any asymmetry in a barchan would persist, which contradicts with the view of symmetric barchan morphology as an attractor (Werner, 1995; Groh et al., 2008), as well as with the results of continuum simulations (Parteli et al., 2014) and water tank experiments (Assis and Franklin, 2020). In the TFABM, the rate of this lateral transfer of material is governed by the phenomenological model parameter qshift and occurs at a rate proportional to the difference in the streamwise projection of the flank lengths (note that this is not the same as the full length during periods of oblique flow). Combining the absorption, emission, and lateral equilibration flux, the evolution of the flank volume is governed by
where qin is the received influx, including both ambient flux and that streaming off of the horns of upwind dunes which overlap the flank; θ is the wind direction; and is the flank width perpendicular to the wind. The outflux term qout is simply qsat, the saturated sand flux, set to 79 m2 yr−1, which is the average value of those reported for Tarfaya in Elbelrhiti et al. (2008) in the case of unscaled flux but for scaled flux is a linear function of the influx as follows:
where a and b are scaling parameters set to 0.45 and 1 as in Durán et al. (2011). Note that this change will significantly influence the rate at which dunes of different sizes grow. In particular, Wtot≲28 m outflux will be higher under scaled flux, while for larger dunes the outflux is higher under the unscaled flux.
2.3 Calving
The sizes of the flanks of a dune are coupled only through the third term in Eq. (2) above. However, when dunes become very asymmetric, this term may become larger than the other terms in Eq. 2, meaning that spanwise fluxes exceed streamwise fluxes. Since this is no longer the typical behaviour of a barchan, we take this to define a maximum asymmetry threshold for dunes in our model. This threshold occurs when the asymmetry ratio, defined as , exceeds
For highly asymmetric dunes, the typical barchan geometry shown in Robson and Baas (2023) can break down if the asymmetry ratio exceeds the threshold
Thus, combining these two terms, the maximum asymmetry of a dune with flank widths Wp and Ws is
When a dune exceeds this maximum asymmetry threshold, its two flanks spontaneously break apart and are reformed into symmetric barchans, a process we refer to as calving.
2.4 Collisions
One of the reasons that barchans have been studied so extensively is that they migrate rapidly at a rate governed by the sand flux conditions and the size of the bedform. We use the commonly accepted expression for the migration rate as
where c=45 (Elbelrhiti et al., 2008) relates to the speeding up of wind passing over the crest of a dune, and W0=16.6 m (Elbelrhiti et al., 2008) ensures that the migration rate of small dunes remains finite.
From this expression, it follows that larger dunes will migrate more slowly than smaller ones, which ensures that collisions are frequent occurrences in barchan swarms. The TFABM uses a simple rule for collisions, which is, nonetheless, able to reproduce a wide range of known collision behaviours (Robson and Baas, 2023). Each dune has three associated centres of mass (CoMs), namely one for each flank and one for the combined dune. The collision algorithm is triggered whenever one of these centres of mass intersects with the footprint of another dune. When that condition is met, the following algorithm is used to determine the output of a collision:
-
The intersecting flanks merge together.
-
The volume of merged flanks is used to calculate an effective flank width Wmerged.
-
A non-intersecting flank with the width Wi will also join the merged flanks if .
-
If , then the non-intersecting flank forms into a separate symmetric barchan in the same manner as during calving.
-
Finally, the flanks which merged together form a barchan with a preserved centre of mass and an asymmetry ratio determined by the relative mass that was initially to the left and right of the centre of mass.
The algorithm itself can produce between one and three output dunes, although calving may occur on the following time step, such that a collision may effectively produce up to four outputs. We refer to collisions which decrease the number of dunes (i.e. have a single output) as merging or aggregation, collisions which conserve the dune number as exchange, and collisions which increase the dune number as fragmentation. For more information on the phase space of the TFABM collision rule, see Robson and Baas (2023). In particular, the supplementary material of Robson and Baas (2023) compares the ability of the collision rules applied in the different barchan ABMs to reproduce collision phase spaces from cellular automata (Katsuki et al., 2011) and subaqueous experiments (Assis and Franklin, 2020), revealing that the TFABM is able to reproduce the greatest number of collision outcomes.
2.5 Boundary conditions and dune injection
The simulation space has a downwind length of 10 km and a central strip with a width of 3 km or, in some cases, 5 km set to ensure a sufficient number of dunes were present. On either side of the central strip there were empty strips of the same width to allow for an oblique movement of the dunes. At the upwind boundary over the entire width (9 or 15 km) of the simulation space, we supply a free flux q0=0.25 qsat (Elbelrhiti et al., 2008). This flux is projected downwind until it is intercepted by a dune, downwind of which the free flux is zero.
In this work, we do not use periodic boundaries; thus, once dunes exit the simulation space, they are lost. To account for this, new dunes enter the simulation space at the upwind boundary. The rate of injection of new dunes is governed by assuming that just upwind of the domain, there is a number density ρ0 of symmetric barchans each with a width , which corresponds to the known unstable equilibrium size under the unscaled outflux (Hersen et al., 2004; Worman et al., 2013). Dunes are injected only into the central 3 or 5 km wide strip of the simulation space to ensure that the dunes do not reach the lateral borders. The length of a time step was set to years ≈45 d. As we will see, the smallest dunes in the system are typically the newly created bedforms with width Weq. With our choice of qsat, c, and W0 (see Eq. 7), the turnover time (time taken for a dune to migrate its own length) of barchans with width Weq is tturnover(Weq)=84 d, meaning that our choice of time step is still much shorter than the shortest timescale relevant to the dunes in our simulations. The number of dunes entering the system each time step is then determined by
3.1 Unimodal wind
For the first series of simulations, we use a Gaussian distribution for the direction of the wind centred around 0°. We experimented with different values of the standard deviation but found that, provided the standard deviation remains relatively small (we tested up to 5°), the exact value is not important. Therefore, all of the simulations shown in this section were performed using a standard deviation of 3°. Since the wind angle is normally distributed, this standard deviation ensures that 99.7 % of the time, the angle of the wind is within ±9° of the primary mode. Under this wind regime we investigated the effect of changes in qshift and ρ0, as well as the differences between scaled and unscaled outflux. We also performed simulations in which the properties were allowed to stabilise before the injection density was changed in order to explore how the TFABM might be applied to investigate boundary condition change (Marvin et al., 2023).
3.1.1 Varying qshift
As shown in Robson and Baas (2023), the rate of equilibration between the flanks, represented by the flank-balancing flux, qshift, has a major impact on the output of collisions. This is because a higher value of qshift means a lower maximum asymmetry ratio (see Eq. 4), thus increasing qshift leads to a larger portion of the collision phase space, resulting in fragmentation collisions (Robson and Baas, 2023). However, the properties of the entire phase space of collisions may not be relevant in a real-world swarm, since it has been shown that barchans in swarms exhibit spatial structuring, such as preferential alignment (Elbelrhiti et al., 2008; Lima et al., 2002), which may result in collisions occurring more frequently in a particular part of the phase space, i.e. only a small range of lateral offsets. Therefore, to investigate the effects of varying qshift, we fixed ρ0=37 km−2 and performed simulations with qshift=0, 0.05 qsat, 0.1 qsat, and 0.15 qsat. Each of these simulations was performed over a timescale long enough for the entire 10 km length of the simulation space to be filled and for the properties of the dunes to have stabilised; this meant simulations of >350 years in all cases. In Figs. 1 and 2, we show the final states of these simulations for unscaled and scale outfluxes respectively alongside plots showing that the population size and mean width had stabilised during the simulations. Animations showing the entire evolution of the swarms can be found in Robson (2024a).
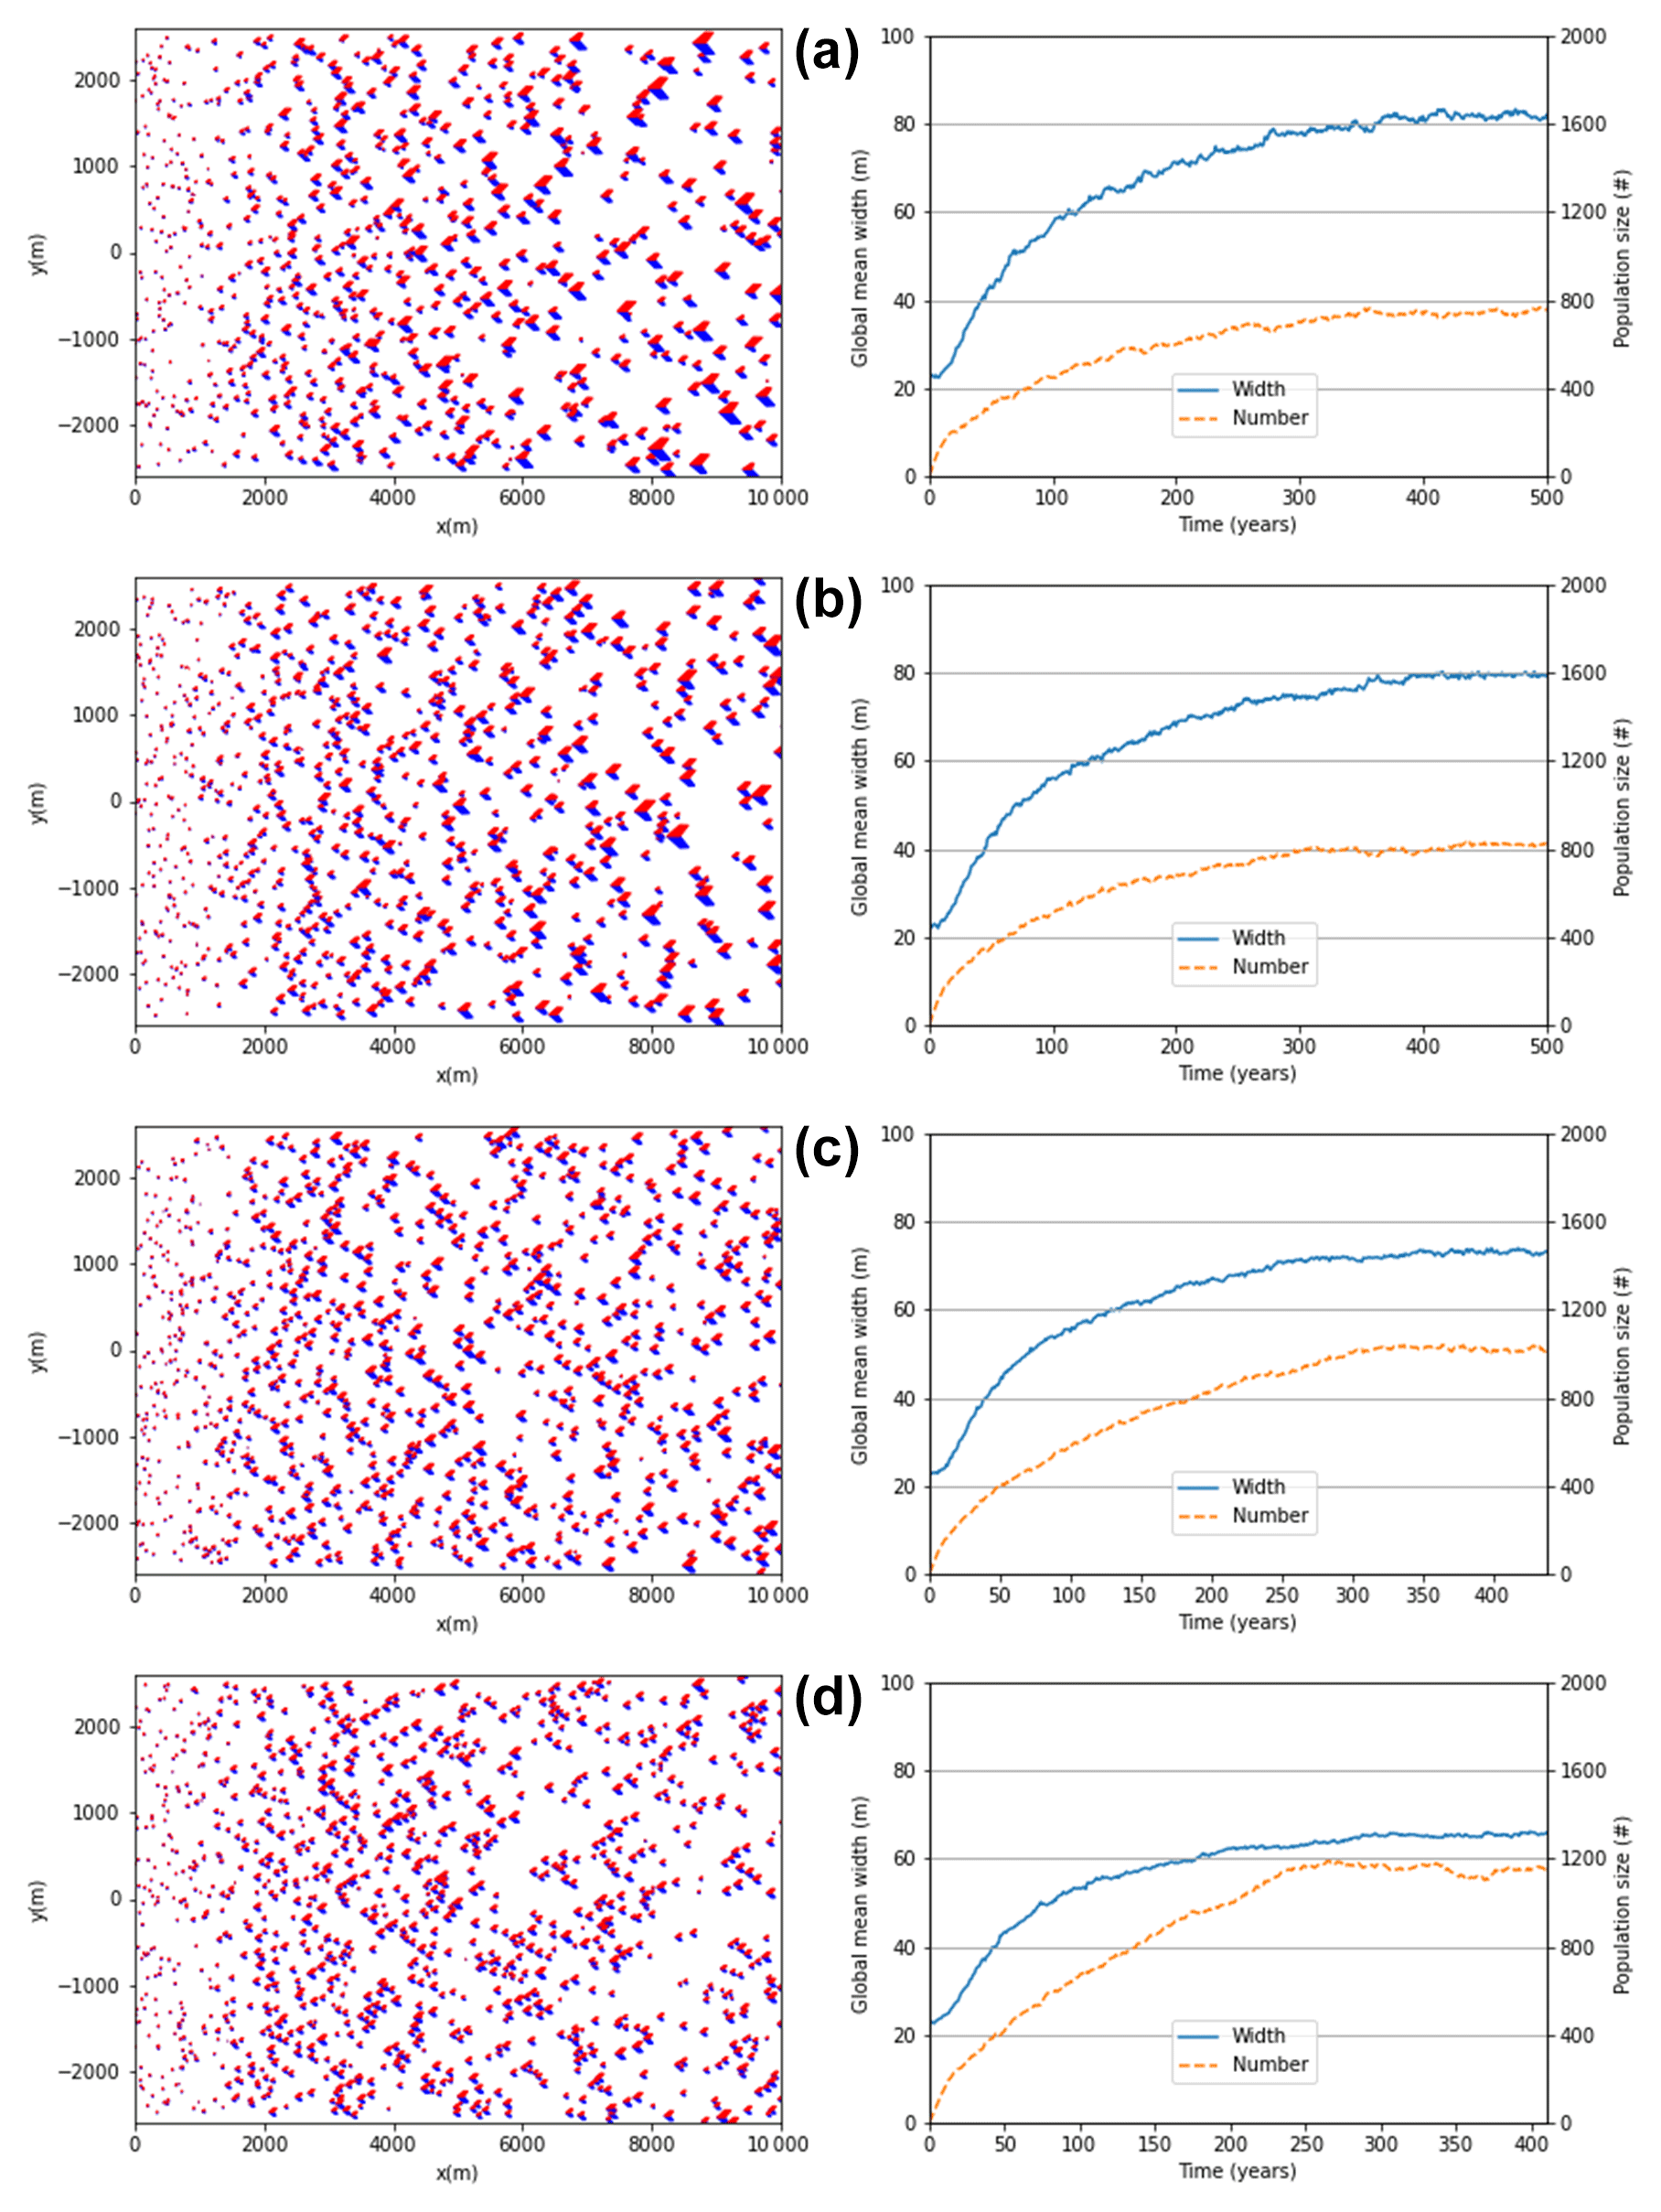
Figure 1The final states of the simulated swarms and plots showing that the mean dune width and population size had stabilised for the unscaled outflux, ρ0=37 km−2. = (a) 0.00, (b) 0.05, (c) 0.10, and (d) 0.15.
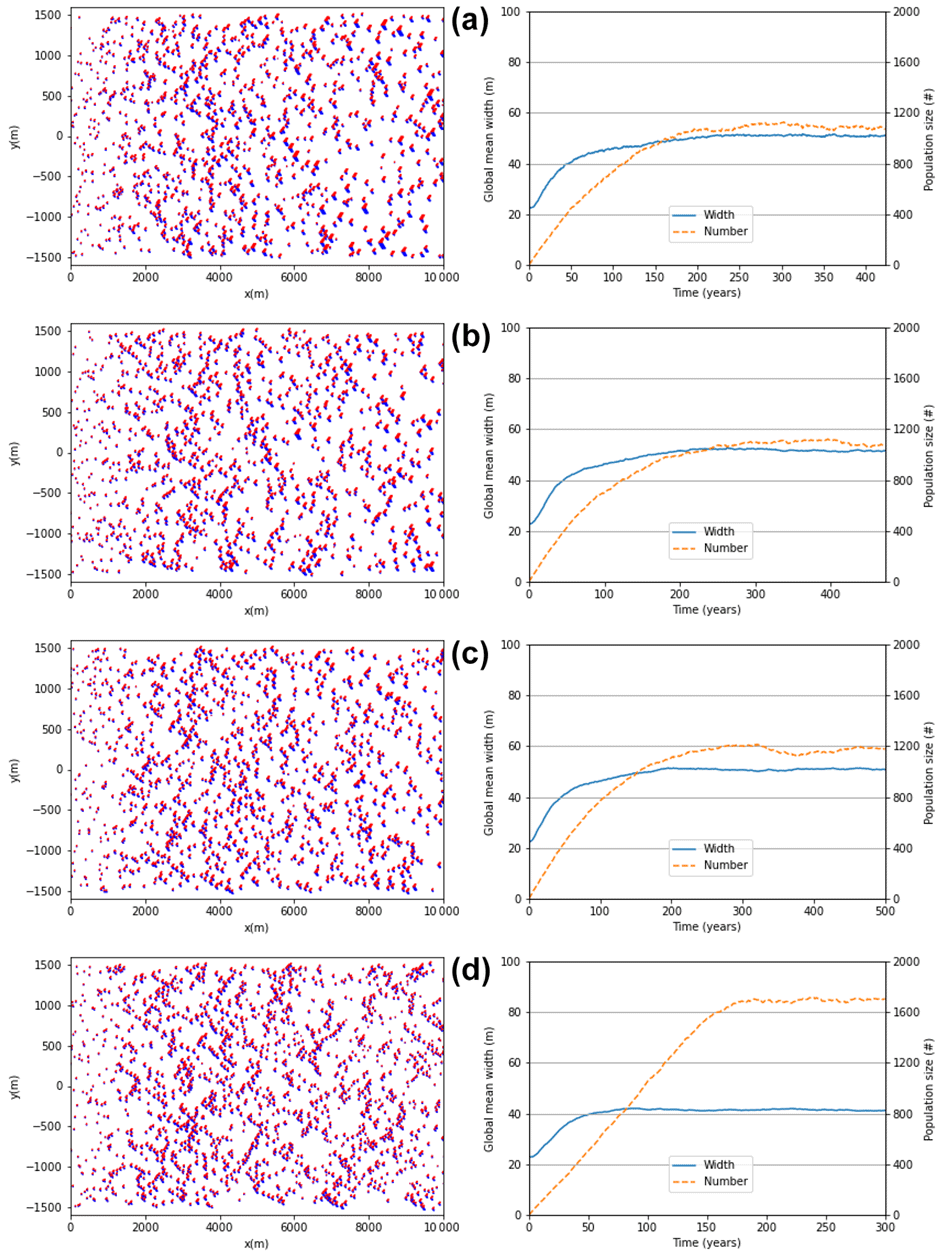
Figure 2The final states of the simulated swarms and plots showing that the mean dune width and population size had stabilised for the scaled outflux, ρ0=37 km−2. = (a) 0.00, (b) 0.05, (c) 0.10, and (d) 0.15.
Regardless of the choice of outflux, lower values of qshift lead to a smaller total number of dunes in the system, and therefore a lower overall density, while the average size of dunes in simulations with lower qshift is greater than when qshift is high. To explain this, we show in Fig. 3 how changing qshift affects the frequency of the different collision types. We observe that, as qshift increases, the frequency of merging collisions decreases, while the frequency of fragmentation increases sharply from the least frequent at qshift=0 to the most frequent when qshift=0.15 in the case of unscaled flux or, similar to exchange collisions, in the case of scaled flux.
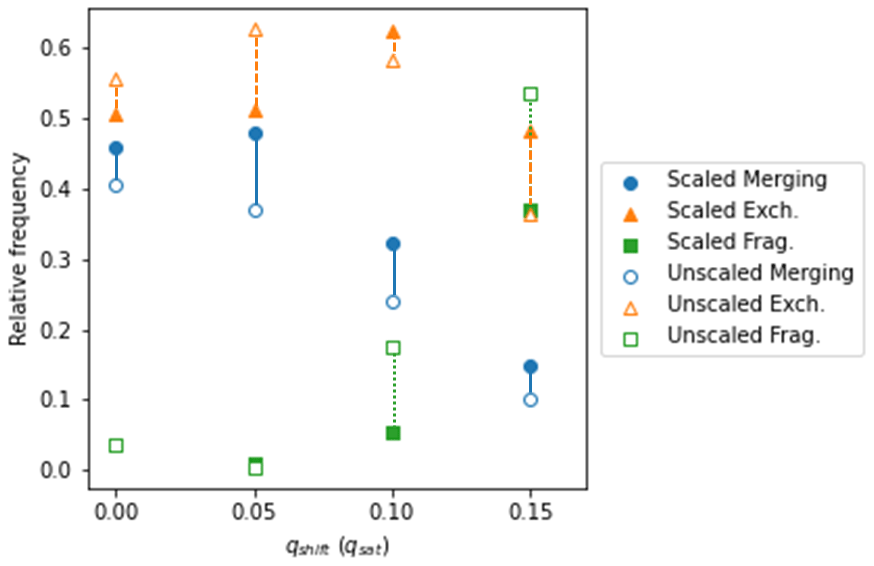
Figure 3Relative frequencies of different types of collisions: merging (circle), exchange (triangles), and fragmentation (squares) observed in simulations with ρ0=37 km−2. , 0.05, 0.1, and 0.15, with scaled (solid markers) and unscaled (open markers) outfluxes.
It has been found that the sizes of dunes in real-world swarms remain stable in the longitudinal dimension (Elbelrhiti et al., 2008; Durán et al., 2011); however, this is not something that previous agent-based models have been able to reproduce (Lima et al., 2002; Durán et al., 2011; Worman et al., 2013). In Fig. 4, we show that, in contrast, when using unscaled outflux, we are able to produce stabilised sizes of dunes when qshift=0.15 qsat, with the swarms exhibiting a trend whereby the sizes of dunes increase until around 2–3 km, after which the size distribution remains approximately steady. For the unscaled outflux and , the stabilisation of sizes did not occur within the simulation space, though it is possible that it may have done further downwind. Such an increase in size has been observed in narrow real-world swarms (or monocorridors) but not large swarms, as simulated here (Elbelrhiti et al., 2008; Durán et al., 2011).
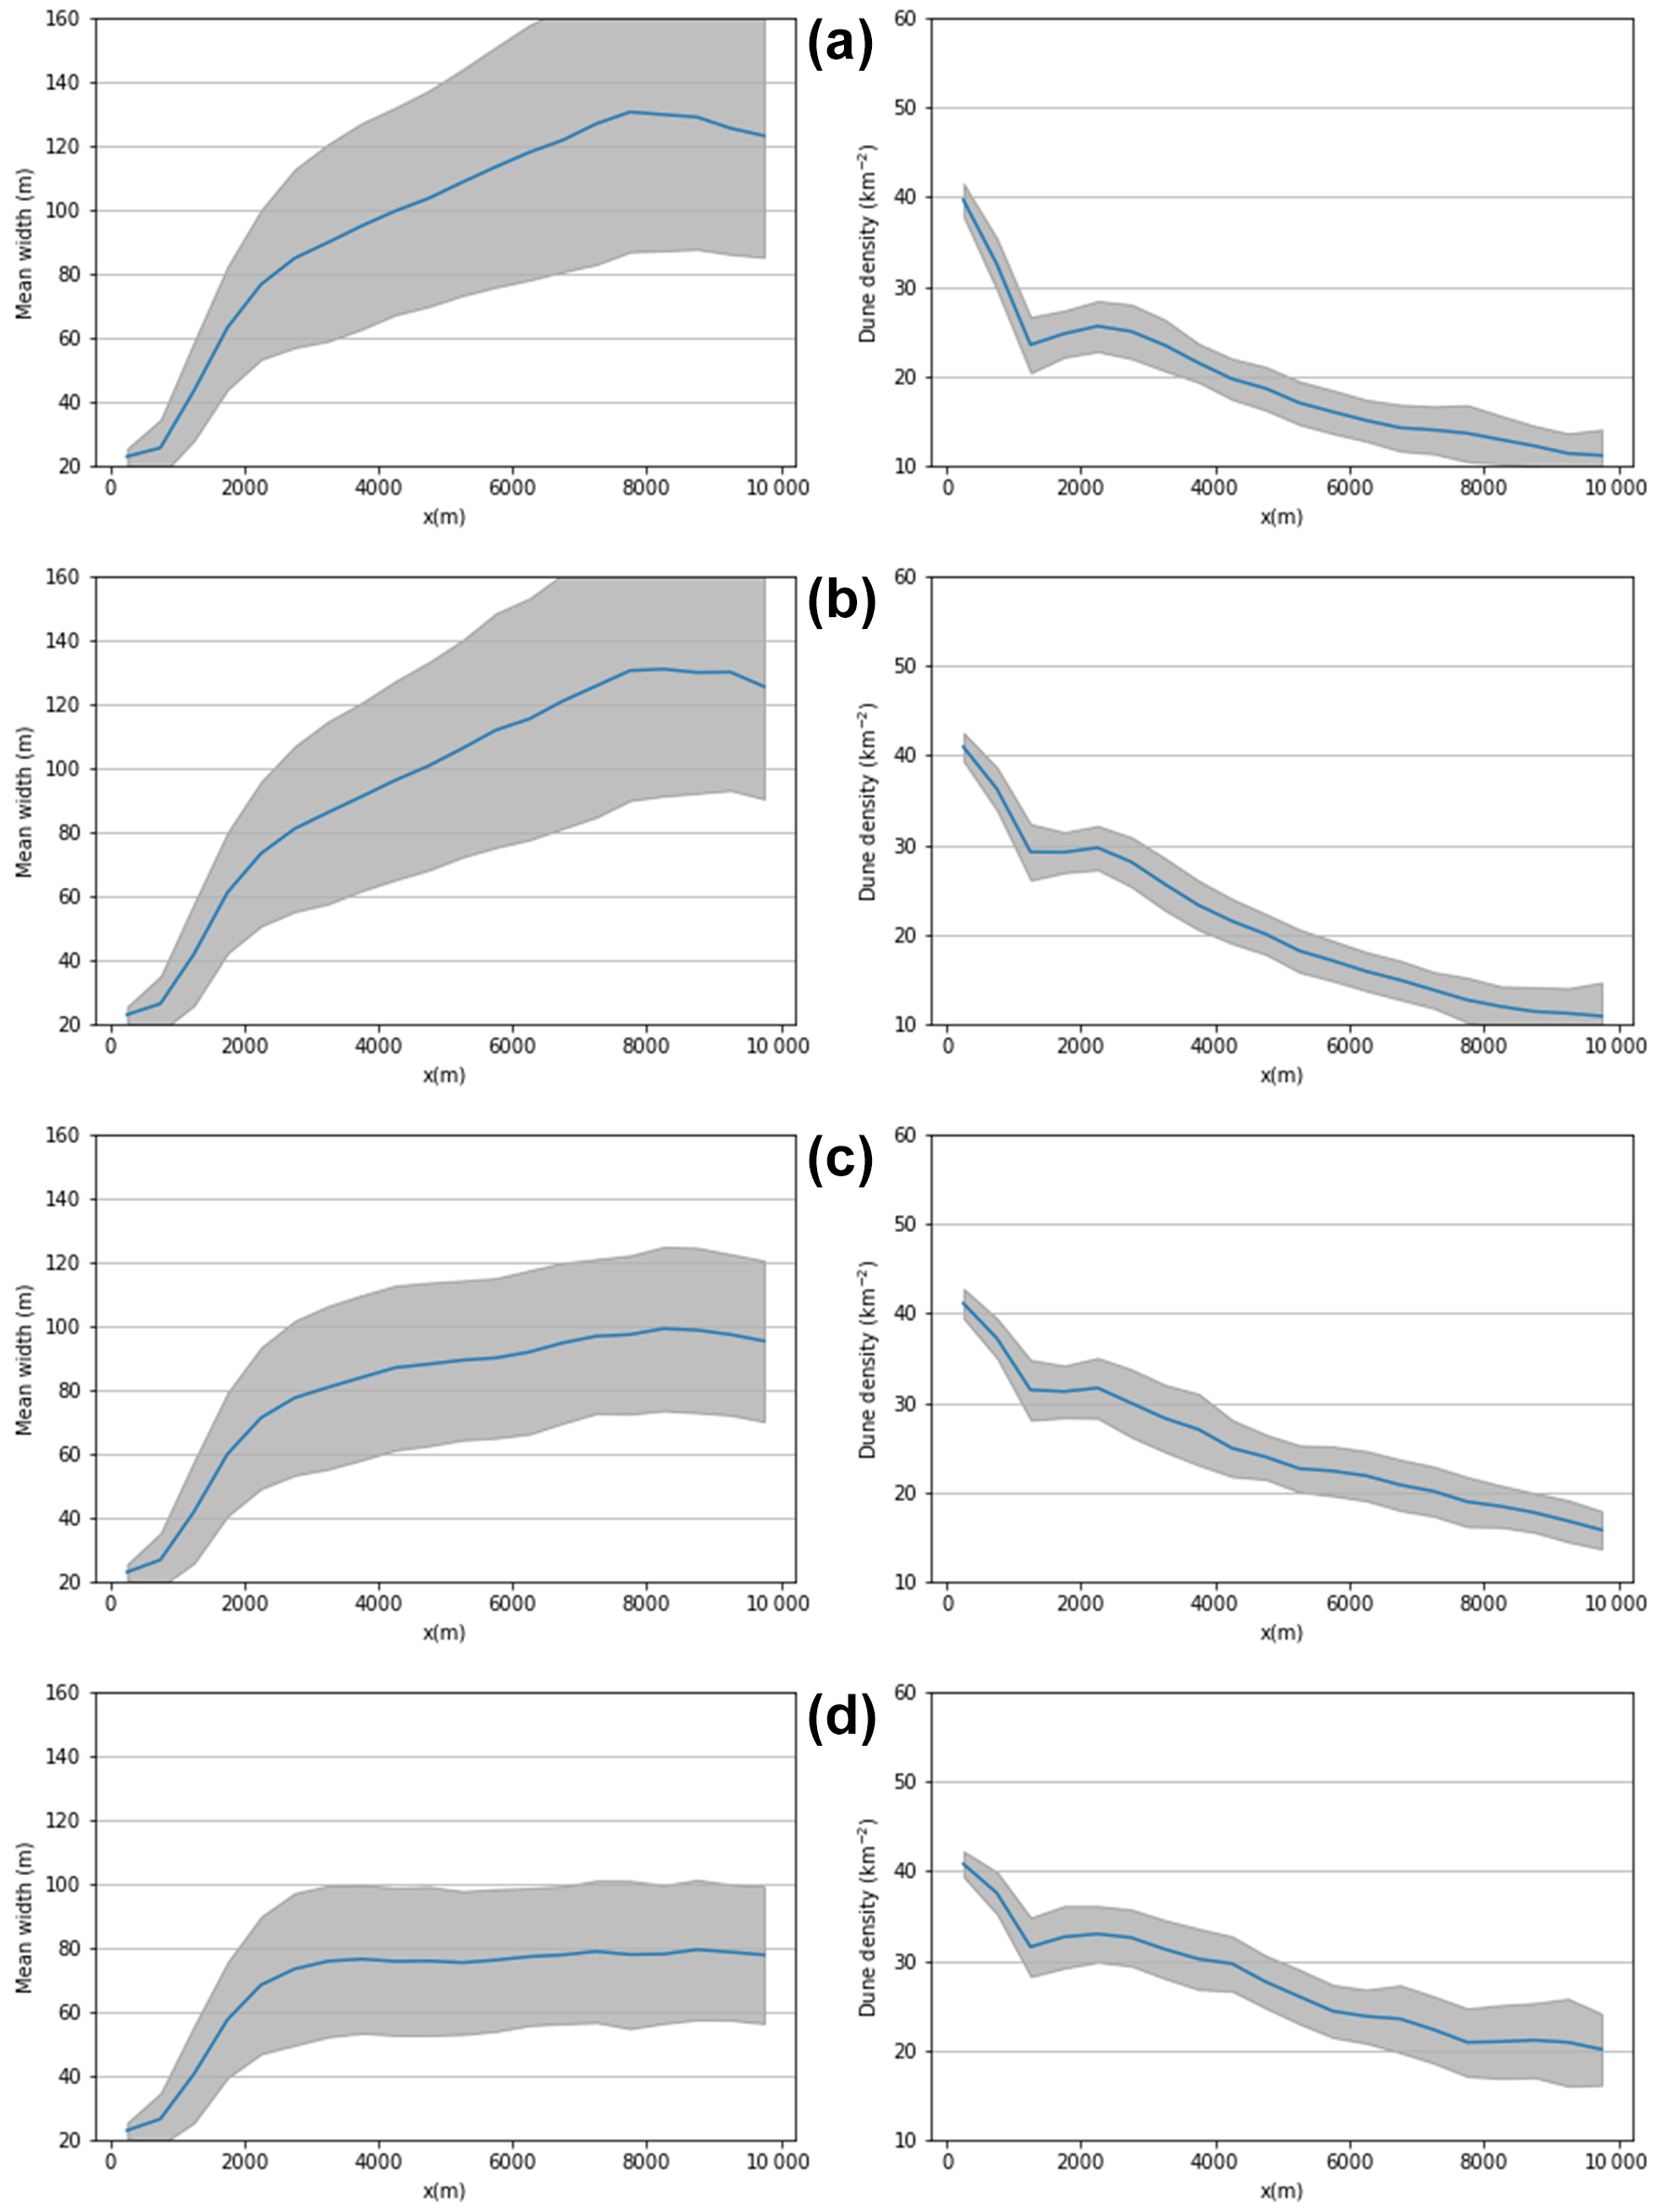
Figure 4The mean width and dune density in 500 m cross sections averaged from measurements at the end of each year once the swarm properties stabilised. , 0.05, 0.1, and 0.15 in panels (a)–(d) respectively and unscaled dune outflux. The grey areas represent 1 standard deviation.
Figure 5 shows that when dune outflux scaled with influx, low values of qshift (0 or 0.05 qsat) lead to swarms in which dune size increases with downwind distance; for qshift=0.1 qsat, the size stabilises at some distance, beyond which it remains constant, and for qshift=0.15, the dune size initially increases before reaching an apex and subsequently decreasing with downwind distance. In other words, it is possible to produce swarms with longitudinally homogeneous size distributions for both types of outflux, but the value of qshift required to do so is higher for the case where the flux streaming off of the dunes is not scaled by the flux they receive.
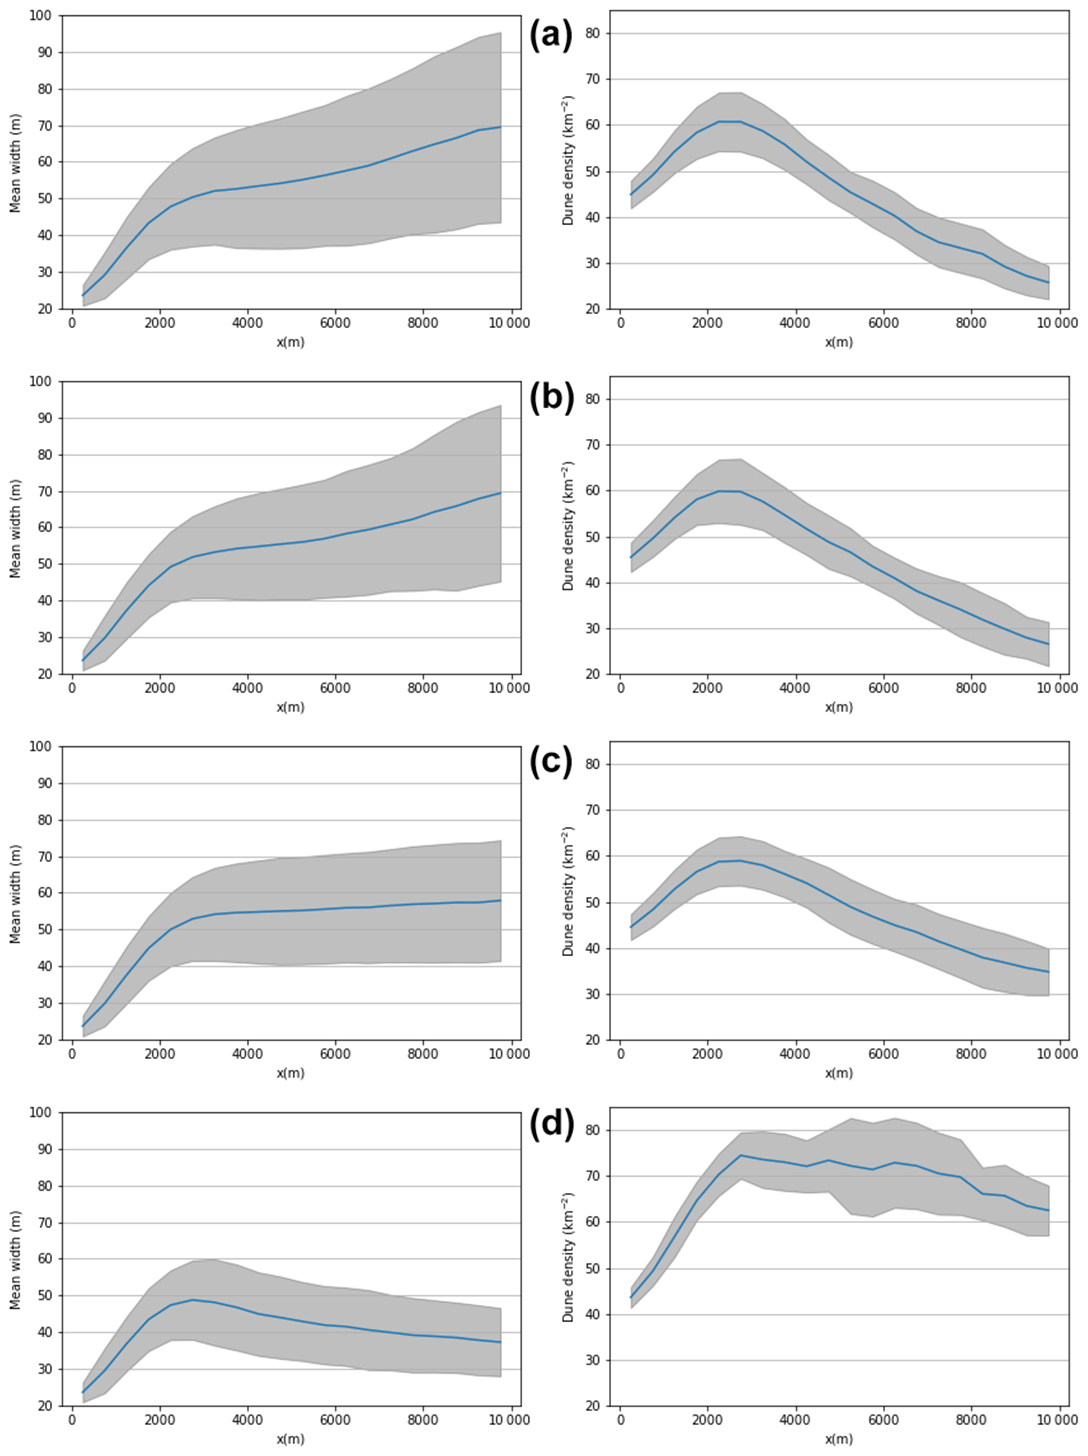
Figure 5The mean width and dune density in 500 m cross sections averaged from measurements at the end of each year once the swarm properties stabilised. , 0.05, 0.1, and 0.15 in panels (a)–(d) respectively and scaled dune outflux. The grey areas represent 1 standard deviation.
Whereas, in some instances, we observe longitudinally homogeneous dune sizes, the simulated swarms are not homogeneous in the dune number density. In all of the simulated swarms with unscaled outflux, the overall dune density shows a decreasing trend with downwind distance. On the other hand, for the scaled outflux, the dune density initially increases to a maximum and then begins to decrease in all cases. However, for qshift=0.15, the density of the profile is approximately flat between around 2.5–6 km downwind; i.e. there is an area of around 4 km over which the density profile appears homogeneous.
We have already shown how varying qshift affects the relative frequency of the different types of collisions; however, qshift also controls asymmetry growth and calving in the TFABM. In Fig. 6, we show the different asymmetry distributions (the ratio of the widths of the flanks) from the scaled flux simulations with different qshift alongside the asymmetry distribution observed across three areas of a swarm, containing a total of around 3000 dunes, in Tarfaya (Robson et al., 2022), which has a close-to-unimodal wind regime (Robson and Baas, 2024b). The data on dune morphology used to calculate the asymmetry distributions are freely available from Robson and Baas (2024a). The comparison reveals that the Tarfaya asymmetry distribution lies somewhere between the simulated distributions for qshift=0 and 0.05 qsat, with much lower values than those which produce longitudinally homogeneous size distributions. However, the asymmetry distributions of other real-world swarms have very different standard deviations, as shown in Fig. 7. In particular, the width of the asymmetry distribution for a swarm in Mauritania is best fit by the simulated swarm with qshift=0.1 qsat for which the size distribution is longitudinally homogeneous.
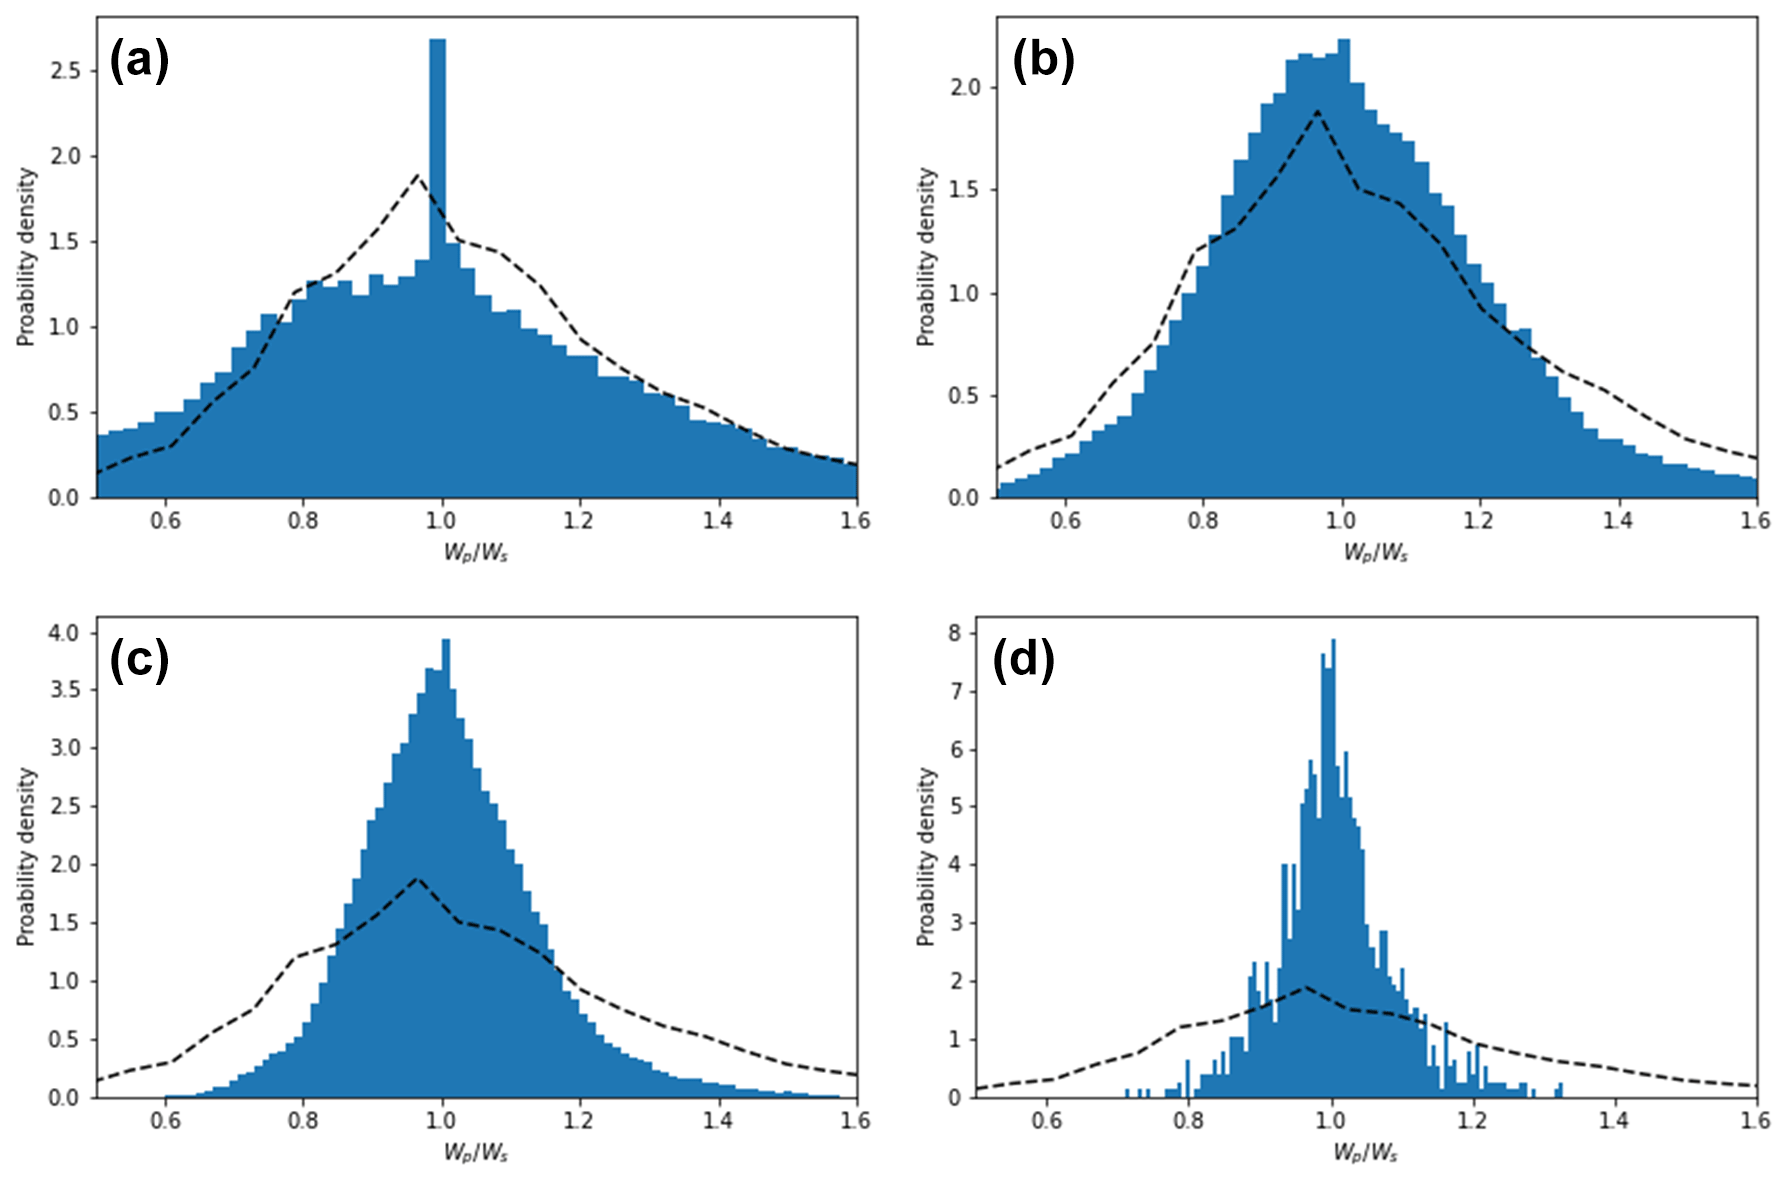
Figure 6Histograms of dune asymmetries defined at the ratio of port and starboard flank widths are shown in panels (a)–(d) for respectively , 0.05, 0.1, and 0.15, with ρ0=37 km−2 and scaled flux. The dotted black lines show the distribution from a real-world swarm in Tarfaya.
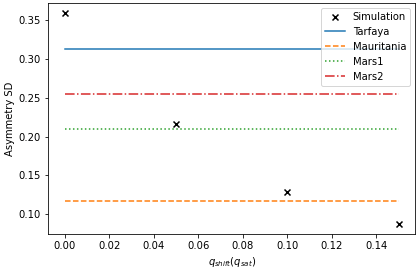
Figure 7The standard deviation of the ratio of flank widths for () for the simulated swarms and real-world swarms in Tarfaya, Mauritania, and two swarms in the northern circumpolar region of Mars. For the natural swarms, the ordering of the flank widths in the ratio was chosen to minimise the mean of the distributions.
3.1.2 Varying ρ0
The previous section shows that varying qshift leads to significant differences in the simulated swarms through changing the collision, asymmetry, and calving behaviour of the dunes. However, the rate of injection of new dunes at the upwind domain boundary was kept at ρ0=37 km−2 in those simulations. Real-world swarms, however, are observed to have a wide range of densities (Elbelrhiti et al., 2008). Figure 8 shows simulated swarms and property convergence for qshift=0.15 qsat and used ρ0=12, 24, and 37 km−2 (these correspond to 5%, 10%, and 15% of the density of Tarfaya 1 in Robson and Baas, 2024a; Robson et al., 2022). We focus on the results from the scaled outflux simulations; however, the swarms displayed similar properties in the case of unscaled outflux. As seen in Fig. 8, as the injection density increases, so too does the overall number of dunes in the swarm, while, as in the case of increasing qshift, the mean sizes of dunes decreases. While these densities are lower than some swarms (Robson et al., 2022), there are many examples of swarms with similar densities to these (Elbelrhiti et al., 2008). It is possible to simulate swarms with a higher density using the TFABM, but the computational time increases with dune number, meaning that high-density swarms need more time to simulated.
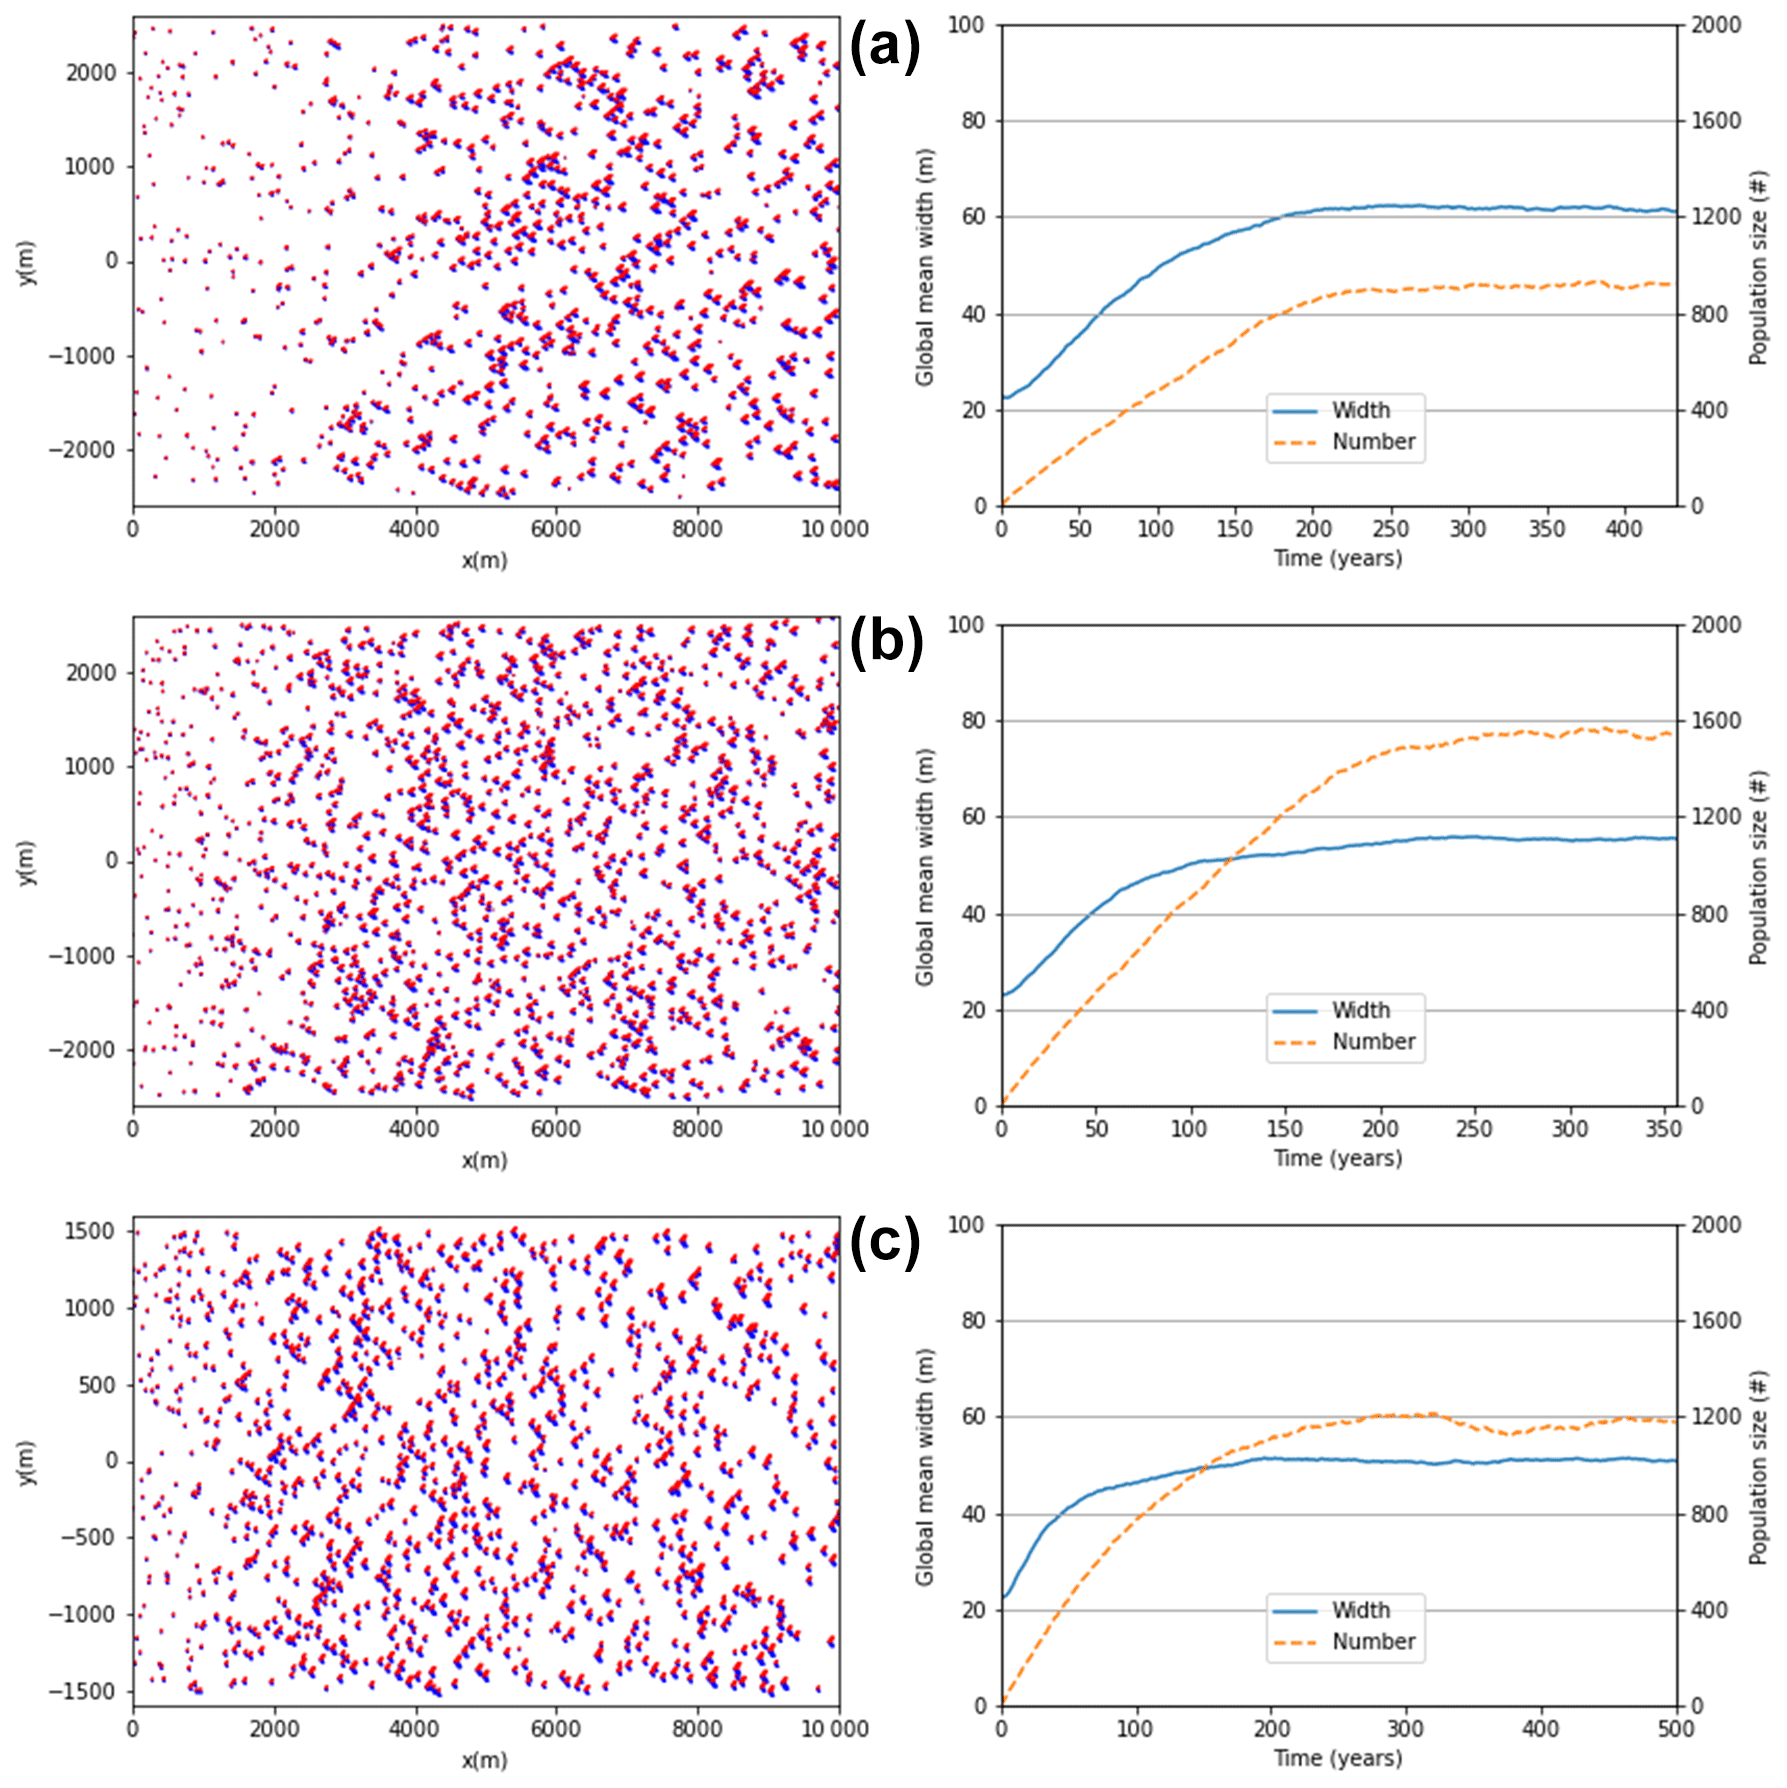
Figure 8The final states of simulations and stabilisation of the dune number and mean size with time for swarms with scaled outflux. qshift=0.1 qsat and ρ0=12, 24, 37 km−2 in panels (a)–(c) respectively. Note that in panels (a) and (b), the width of the swarms is 5 km, and in panel (c) the width is 3 km.
The longitudinal variation in the dune size and the number density are shown in Fig. 9. Since qshift remained constant across the simulations, the relative frequency of the different collision types did not vary, leading to all three simulations reaching a longitudinally homogeneous size distribution. On the other hand, the downwind distance at which the dune size stabilised decreased with increasing injection density.
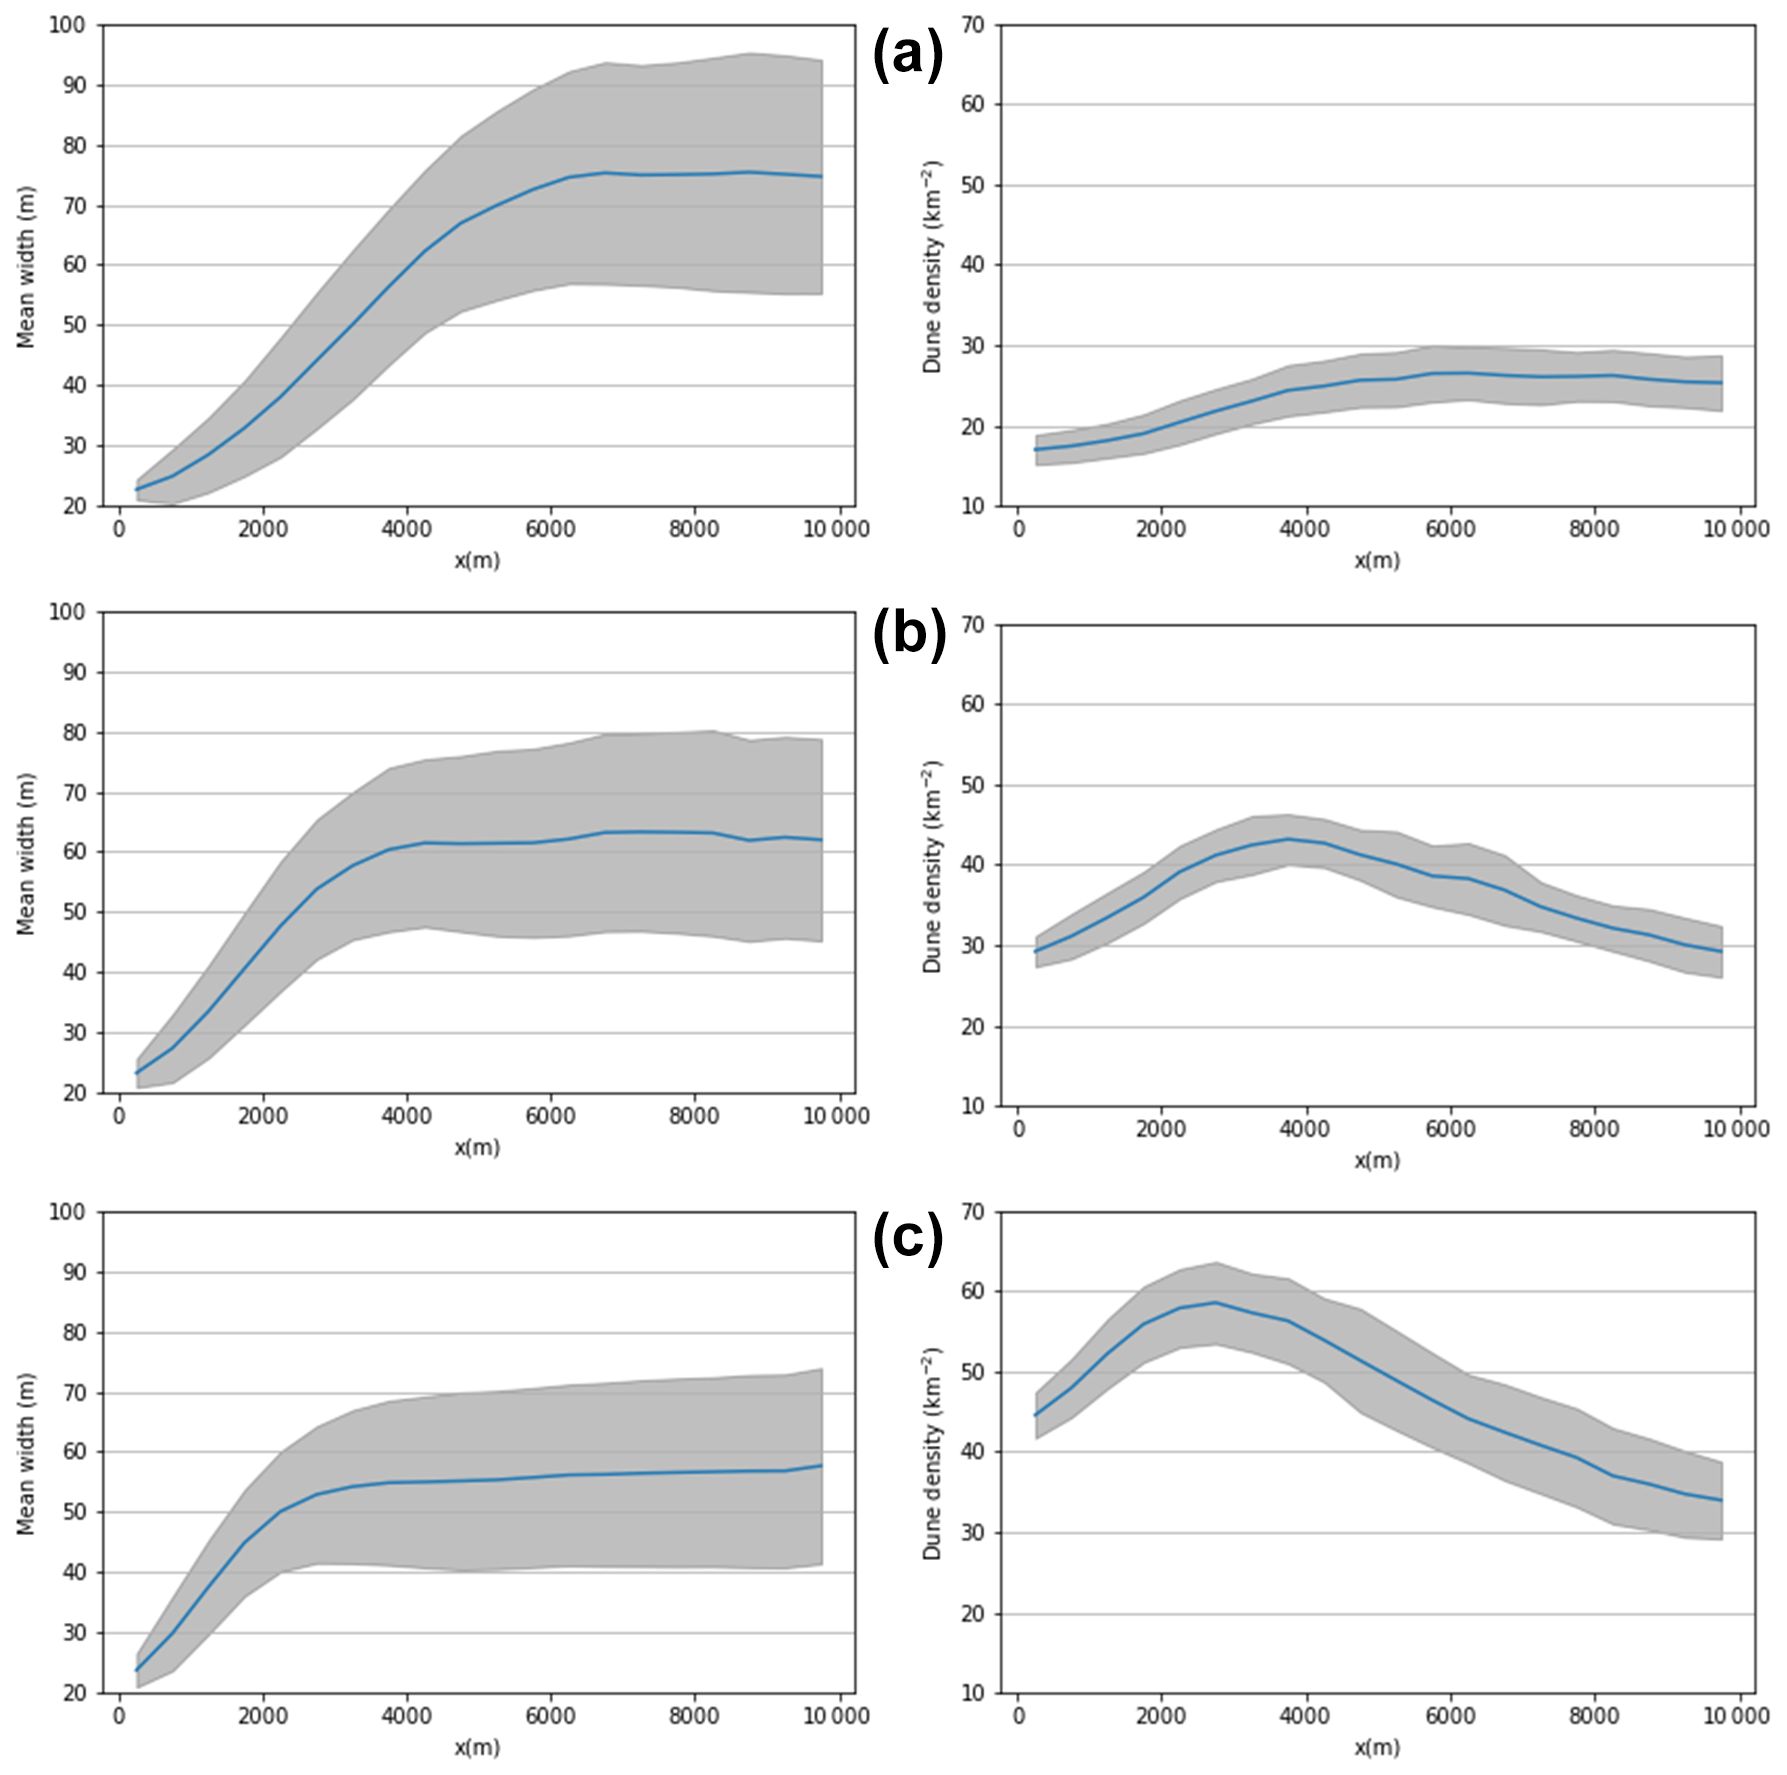
Figure 9The mean width and dune density in 500 m cross sections averaged from measurements at the end of each year once the swarm properties stabilised. The grey areas represent 1 standard deviation. Scaled outflux was used for simulations with and ρ0=12, 24, and 37 km−2 in panels (a)–(c) respectively.
As we have already discussed, for ρ0=37 km−2 the dune density exhibits a non-monotonic behaviour with downwind distance, but after a peak at around 2.5 km, the number density decreases, moving downwind. The same trend is observed for an injection density ρ0=37 km−2, with the peak moving downwind to around 3.5 km. However, for ρ0=12 km−2, we are able to produce a swarm which for which the dune density remains constant from around 4.5 km. In the same swarm, the size distribution stabilises at around 6 km, meaning that over the final 4 km of the simulation space both the dune density and dune size are homogeneous, as expected for real-world swarms. The size distribution of that swarm from 6 km (when it stabilises) is shown in Fig. 10 and can be fit with a log-normal distribution, as has been reported for barchan swarms in many studies (Elbelrhiti et al., 2008; Durán et al., 2009, 2011; Génois et al., 2013a; Robson et al., 2022).
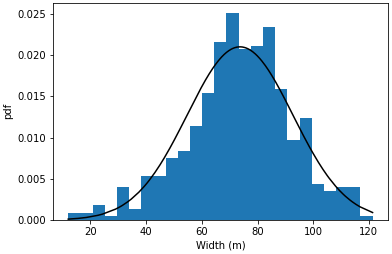
Figure 10The stable size distribution from 6–10 km in the scaled flux simulation with and ρ0=12 km−2. The solid black line shows a fitted log-normal distribution.
3.1.3 Boundary condition change
Recent studies have begun to consider the impacts of future anthropogenic climate change on dune systems (Gunn et al., 2022; Baas and Delobel, 2022). Other studies have previously examined how cultivation (Long and Sharp, 1964), quarrying (Al-Dousari and Pye, 2005), and mining (Engel et al., 2018) can lead to increases in both aeolian activity and dune formation.
To explore how the TFABM might be used to study such human-induced changes, we performed simulations in which a swarm was allowed to form and stabilise under a particular combination of boundary conditions before these conditions were then suddenly changed.
In Fig. 11, we show the snapshots and longitudinal width profiles of a stable swarm exposed to a sudden decrease in the injection density. From the width profiles, one can see that after the change in boundary conditions, the swarm adjusts to reach a new steady state. In fact, the new steady state is the same as that of a swarm that had formed entirely under the changed boundary conditions. In other words, after a sufficiently long time, the properties of the swarm no longer preserve any information about the initial boundary conditions and are described solely by the new state. This challenges the idea that barchan swarms record palaeoenvironmental change (Hesse, 2009).
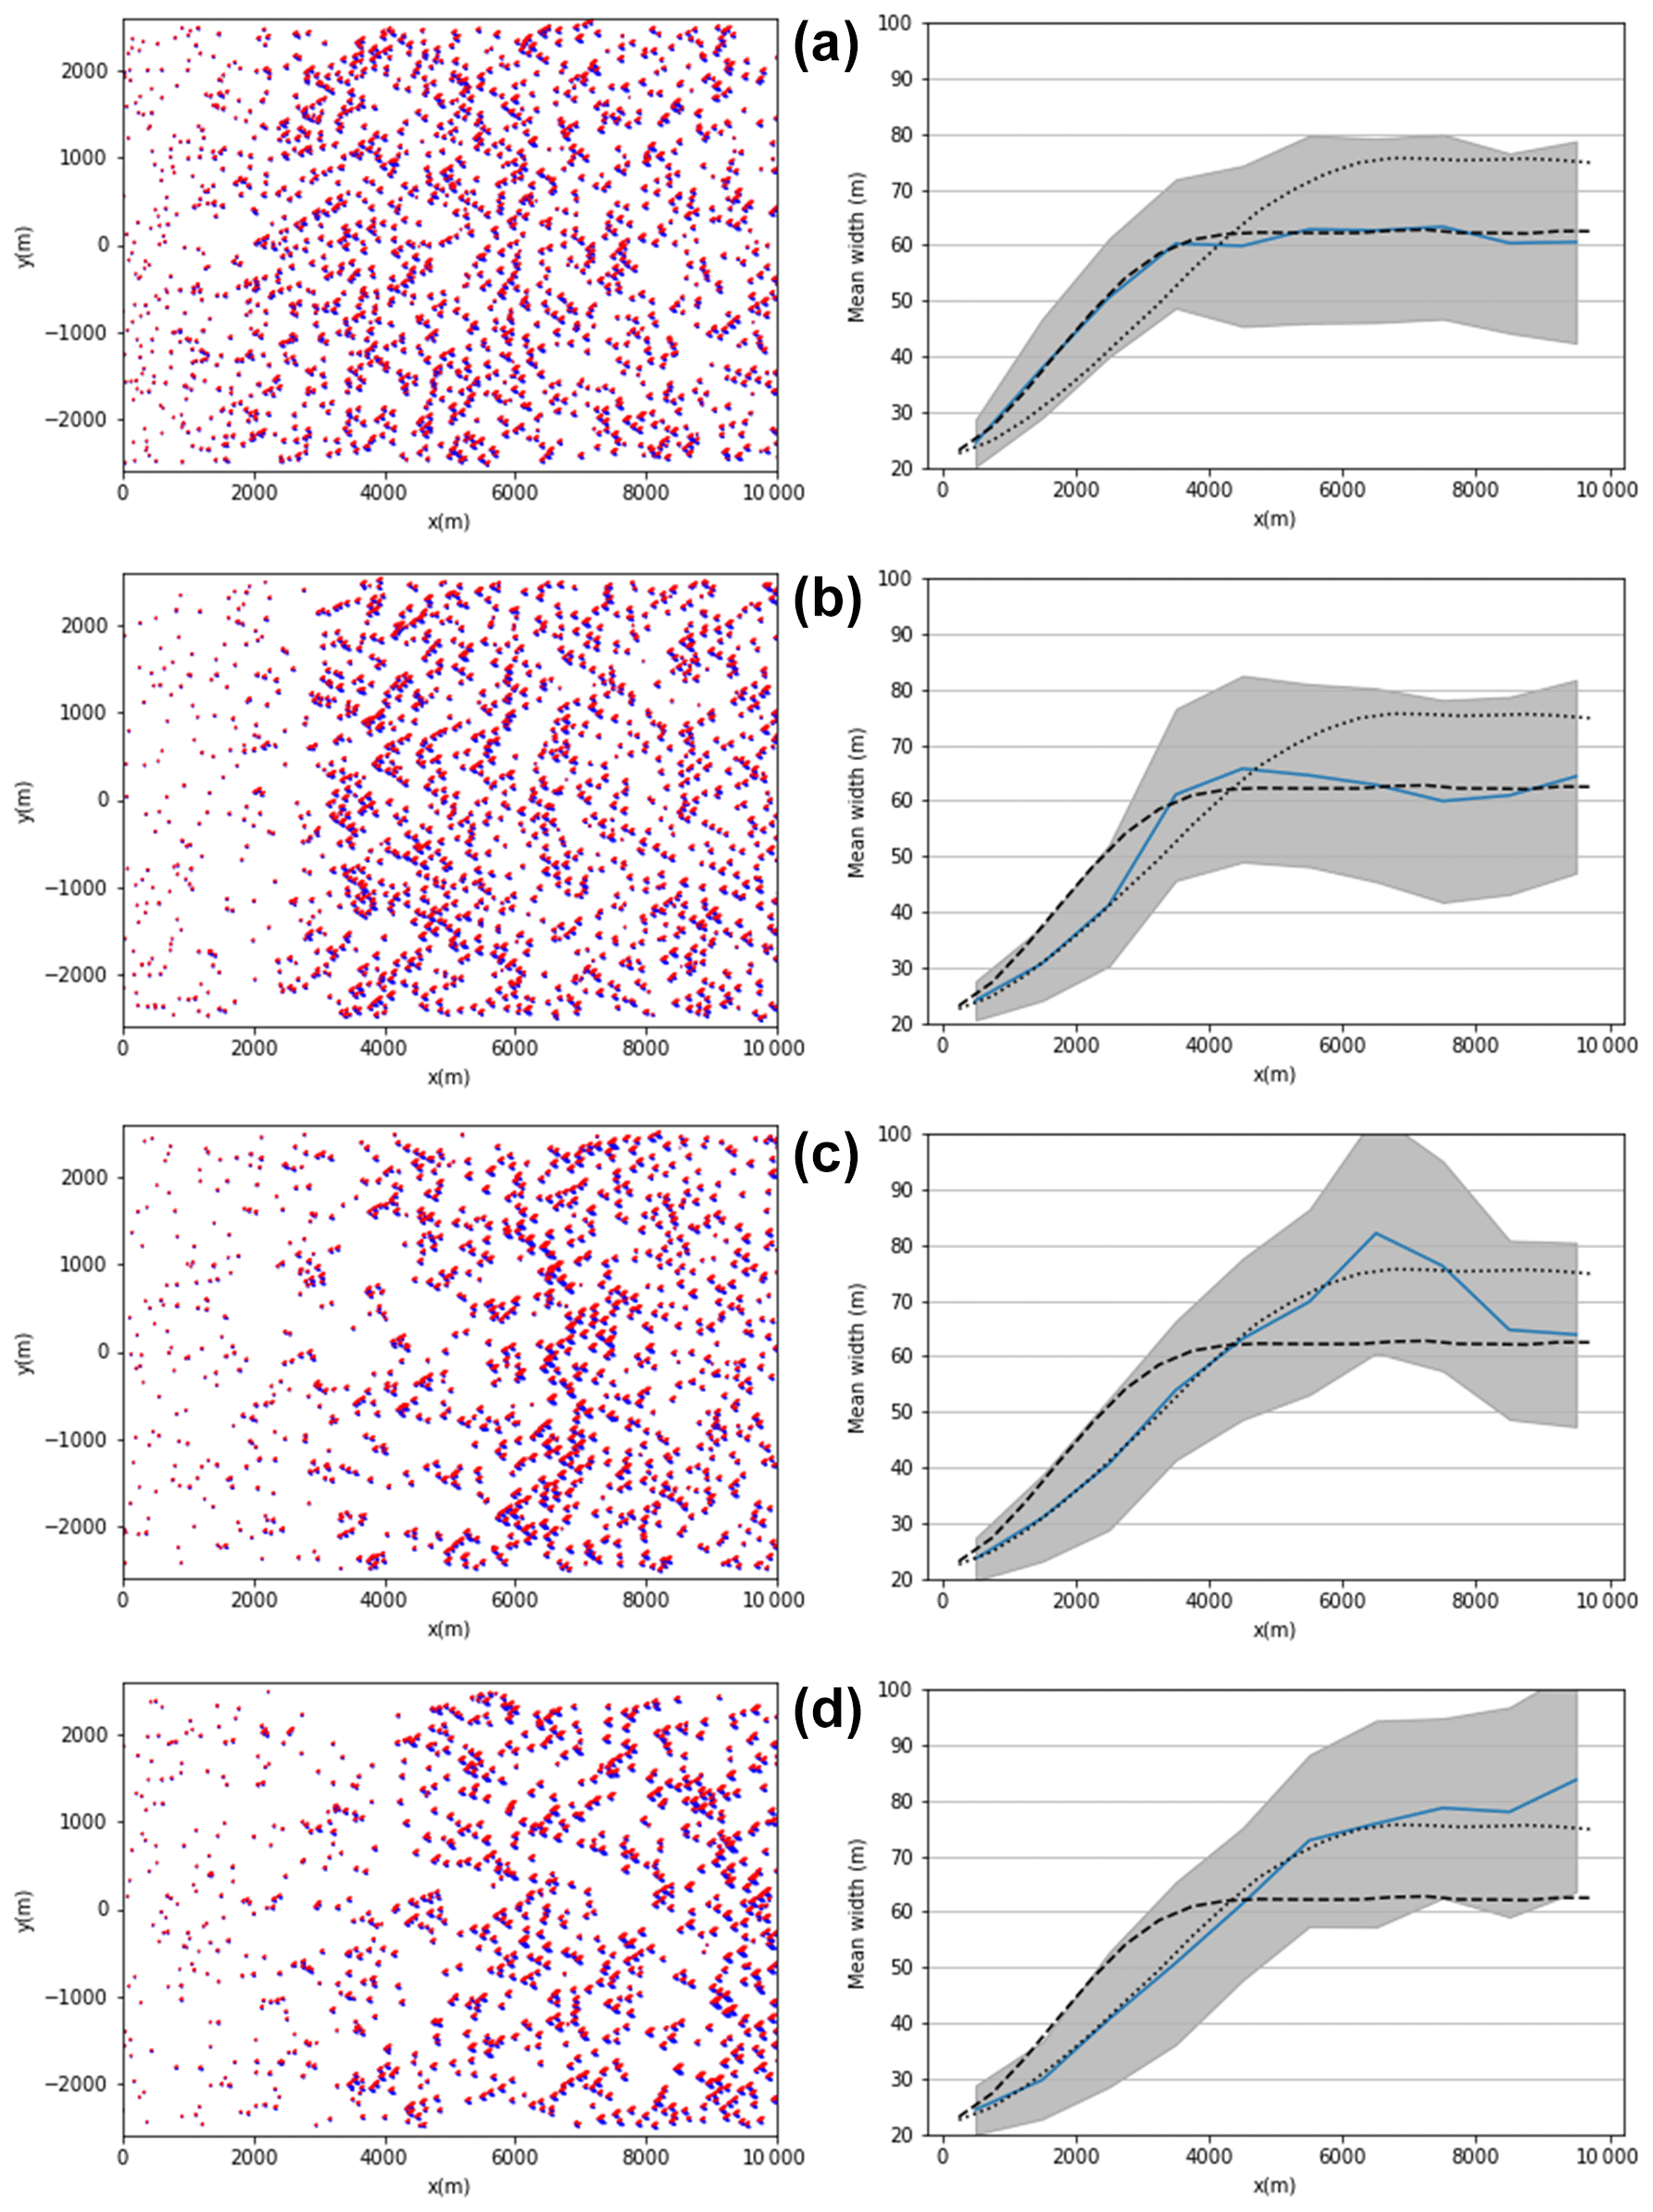
Figure 11A simulated swarm and its longitudinal width profile at 300, 400, 500, and 600 years in panels (a)–(d) respectively. The swarm formed with qshift=0.1 qsat and a scaled outflux with an initial injection density of ρ0=24 km−2 until 356 years, after which ρ0=12 km−2. The dashed and dotted lines represent the results from simulations where ρ0 was kept fixed at 24 and 24 km−2 respectively, with the other model parameters unchanged.
Although there is no long-term memory, a swarm does not instantaneously adapt to the new conditions; instead, we observe a “wavefront” progressing through the snapshots shown in the left panels of Fig. 11. Comparing the position of this front (around 4 km in Fig. 11b, 6 km in Fig. 11c, and 10 km in Fig. 11d) with the longitudinal width profiles, we see that upwind of the front, the swarm has reached its new state, while downwind of the front, the swarm is still in its original state. Thus, there is a finite time during which the properties of a swarm might record changes in boundary conditions. In the case of a change in injection density, the time of the transition is the time it takes for the wavefront to travel the entire length of the swarm. Of course, other boundary condition changes which simultaneously impact all areas of a swarm (rather than just the upwind boundary, as for the case of injection) might have very different rates of transition to the novel state.
It has recently been suggested that changing boundary conditions in aeolian systems are associated with a temporary increase in the interaction density (Marvin et al., 2023). We observe an overall decrease in the rate of collision during the change in boundary condition simulations shown here; however, this change in the global collision rate simply reflects the fact that the total density of dunes is decreasing. On the other hand, the wavefront does appear to show a higher density at a very small range of downwind distances. If this is the case, then there would be a very localised increase in the interaction density, consistent with Marvin et al. (2023). However, due to the limited longitudinal range of the front, and the high variability in collision rate in the swarm as a whole, we have been unable to identified any localised increase in collisions.
3.2 Bimodal simulations
While the simulations in the previous section all simulated a unimodal wind, many real-world swarms are exposed to a secondary mode for some parts of the year (Robson and Baas, 2024b), which is something that we can simulate using the TFABM but which was inaccessible to earlier models. We performed simulations with ρ0=37 km−2 and qshift=0.1 qsat, where for three-quarters of the year the wind follows the dominant mode, set to a Gaussian distribution centred on 0° with standard deviation of 3°, while for the remaining season, the wind direction was set to a Gaussian distribution with the same standard deviation but centred on an angle θb for which we used 22.5, 45, and 67.5°. We chose these angles since barchan swarms have been observed in locations with bimodal wind regimes with acute angular separations but not for obtuse separations.
In Fig. 12, we show the final states of the simulations for the different modal angular separations with ρ0=37 km−2 and qshift=0.1 qsat alongside plots indicating that both the mean size and dune number stabilise during the course of the run. The number of dunes is typically less stable than the unimodal swarms, which suggests that the individual dunes are not so stable when the secondary mode is included. For all cases, we also observe that the starboard edge of the swarm (which is further upwind during the secondary mode) appears to have a higher density of larger dunes compared to the downwind (port edge) area, with this affect becoming more pronounced with increasing angular separation.
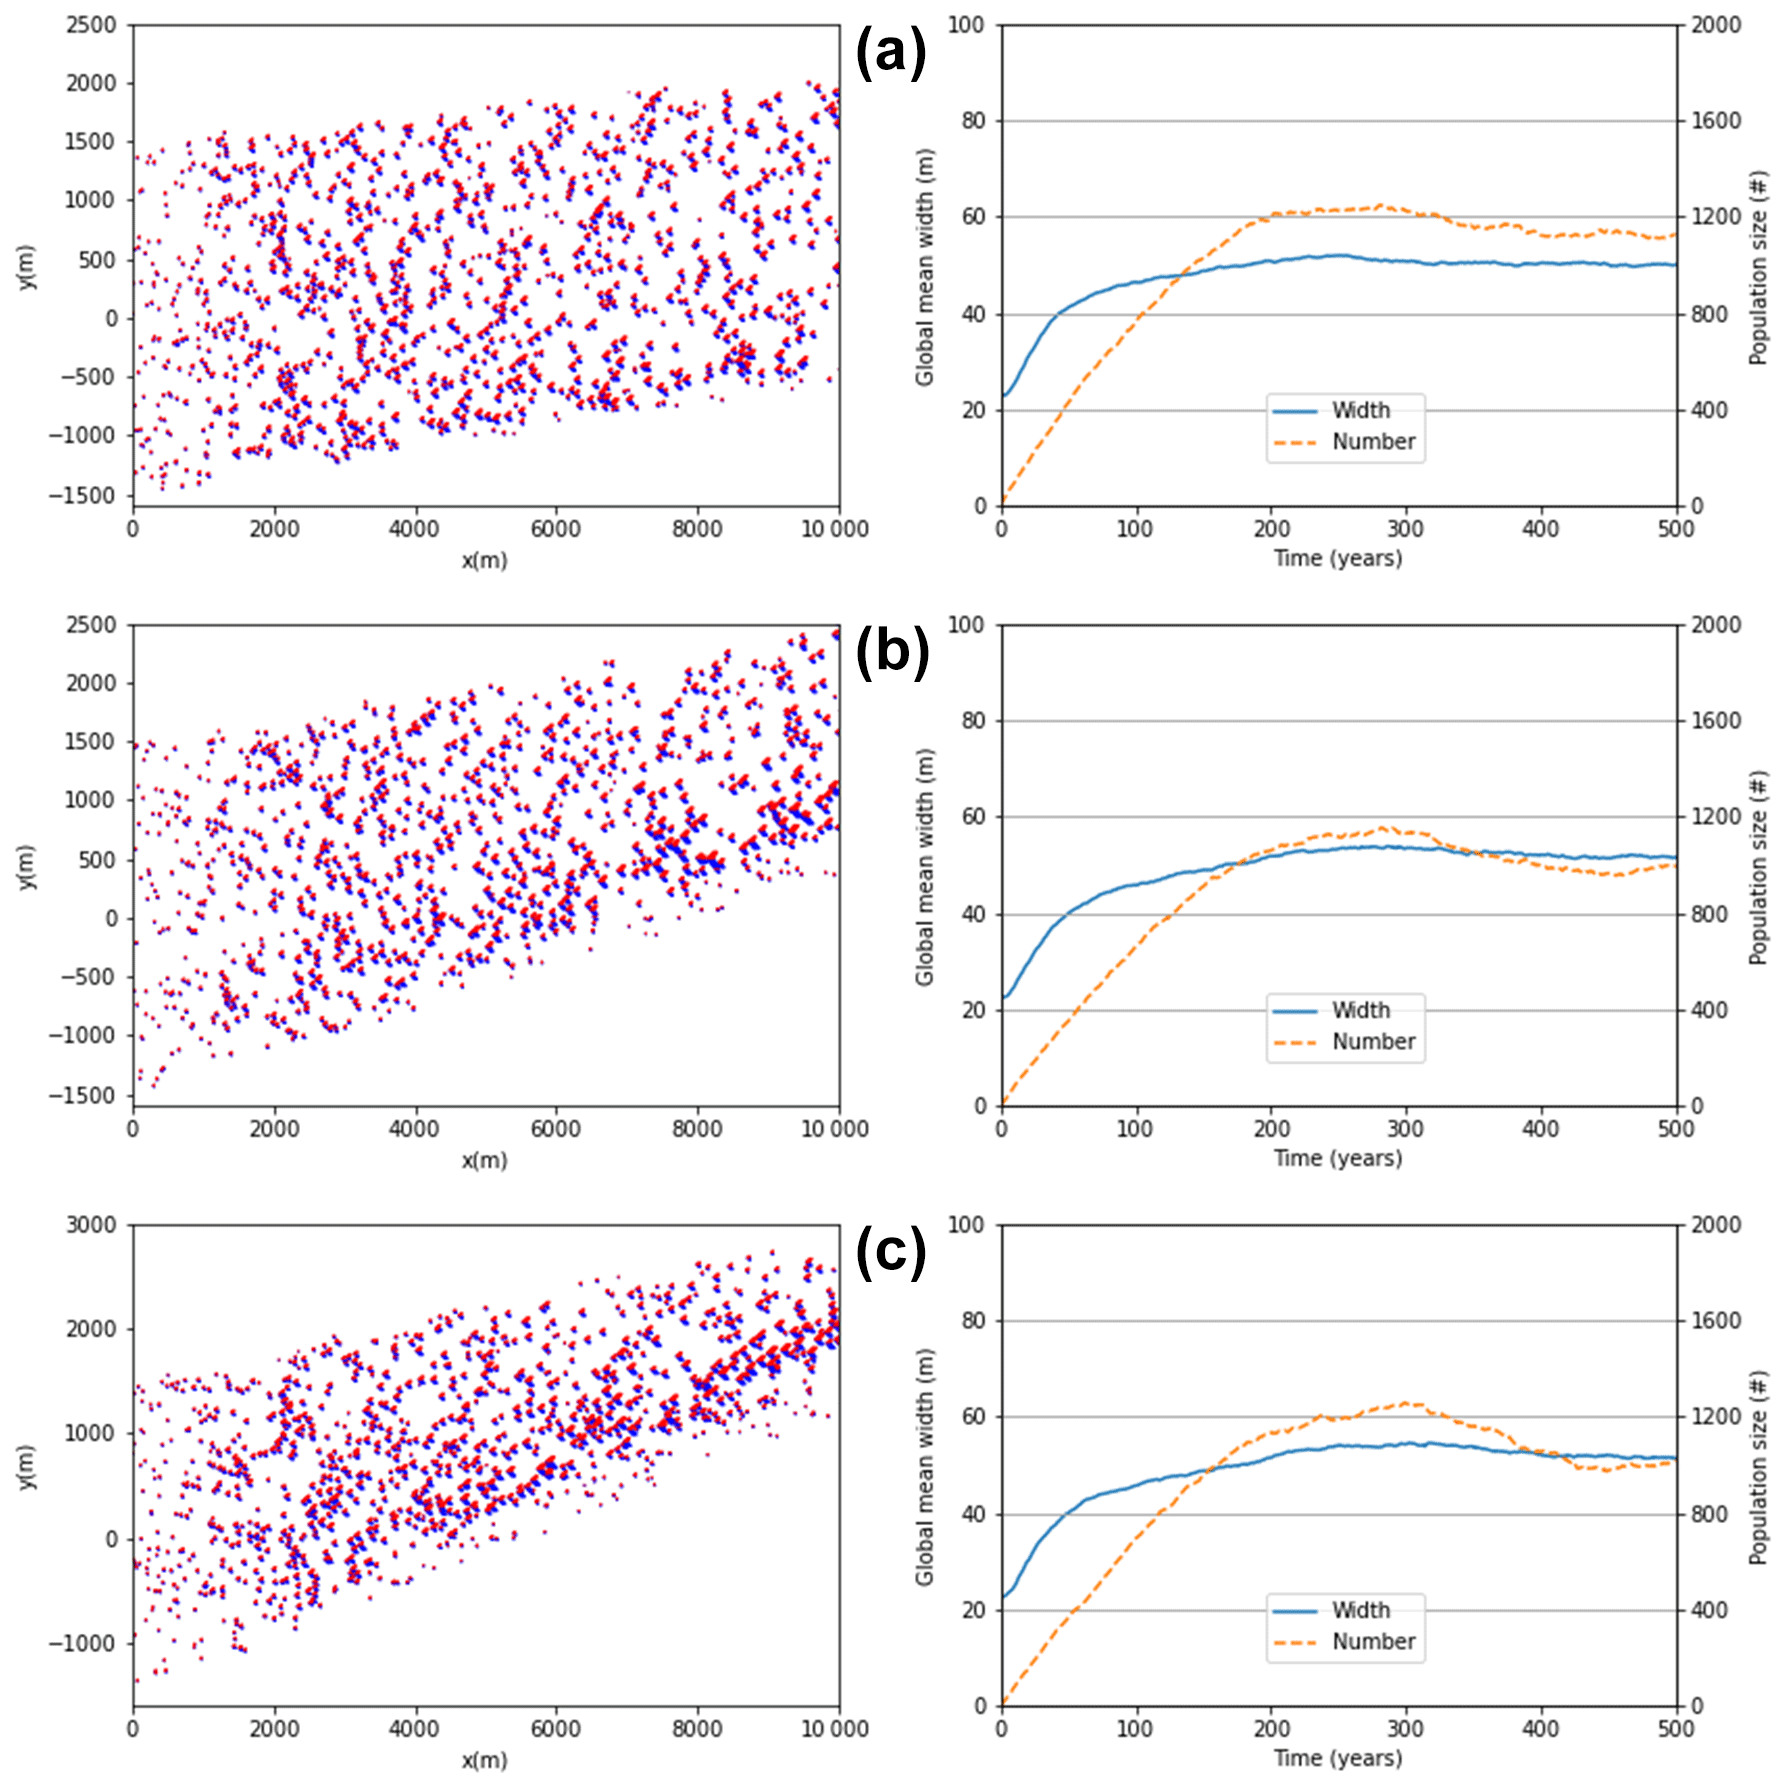
Figure 12Final states and stabilisation of mean size and dune number for ρ0=37 km−2 and qshift=0.1 qsat, scaled outflux, and secondary wind mode for the last quarter of each year with angular separation. (a) 22.5°, (b) 45°, and (c) 67.5°.
Although qshift is the major control on collision outcomes in the TFABM, it has also been shown that the relative asymmetry of colliding dunes (Robson and Baas, 2023) and direction of migration (Bo and Zheng, 2013) can also control barchan interactions. However, we did not observe significant changes in the relative frequencies of the different collision types as the angular separation increased. There was a slight decrease in the number of exchange collisions (62 % to 56 %) as the angular separation increased, accompanied with an increase from 5 % to around 13 %, while merging changed only by around 1 %. The rate of calving also increased as the angular separation increased, but overall it remained significantly lower than the rate of collisions, as predicted in mean field modelling (Robson et al., 2022).
It was shown in Robson and Baas (2023) that, using the Two-Flank Agent-Based Model, under a bimodal wind where the secondary mode has an acute angular separation from the dominant mode, asymmetry grows according to the Bagnold model (Bagnold, 1941; Bourke, 2010), whereas for obtuse angular, separation it grows according to the Tsoar model (Tsoar, 1984; Tsoar and Parteli, 2016; Bourke, 2010). Similar findings have also been reported using other types of modelling (Parteli et al., 2014; Lv et al., 2016).
The distributions of asymmetry are shown in Fig. 13. One would expect that under the Bagnold model for asymmetry growth (Bagnold, 1941), the starboard flank would grow predominantly under our bimodal winds, leading to , while under the Tsoar model we would see . In Fig. 13e), we see that in all of the bimodal runs, the average of is less than one, indicating that overall the asymmetry of dunes is growing predominantly, according to the Bagnold model (Bagnold, 1941; Bourke, 2010). We do observe, however, that the mean asymmetry varies with the angle of the secondary mode. Specifically, as the angle increases, the mean decreases from unity. However, none of the swarms become as asymmetric as those observed in Mauritania and Mars zone 1 (Robson et al., 2022; Robson and Baas, 2024a, b). The standard deviation of the distribution is not significantly affected by the change in angle and is primarily controlled by qshift, as shown in Figs. 6 and 7.
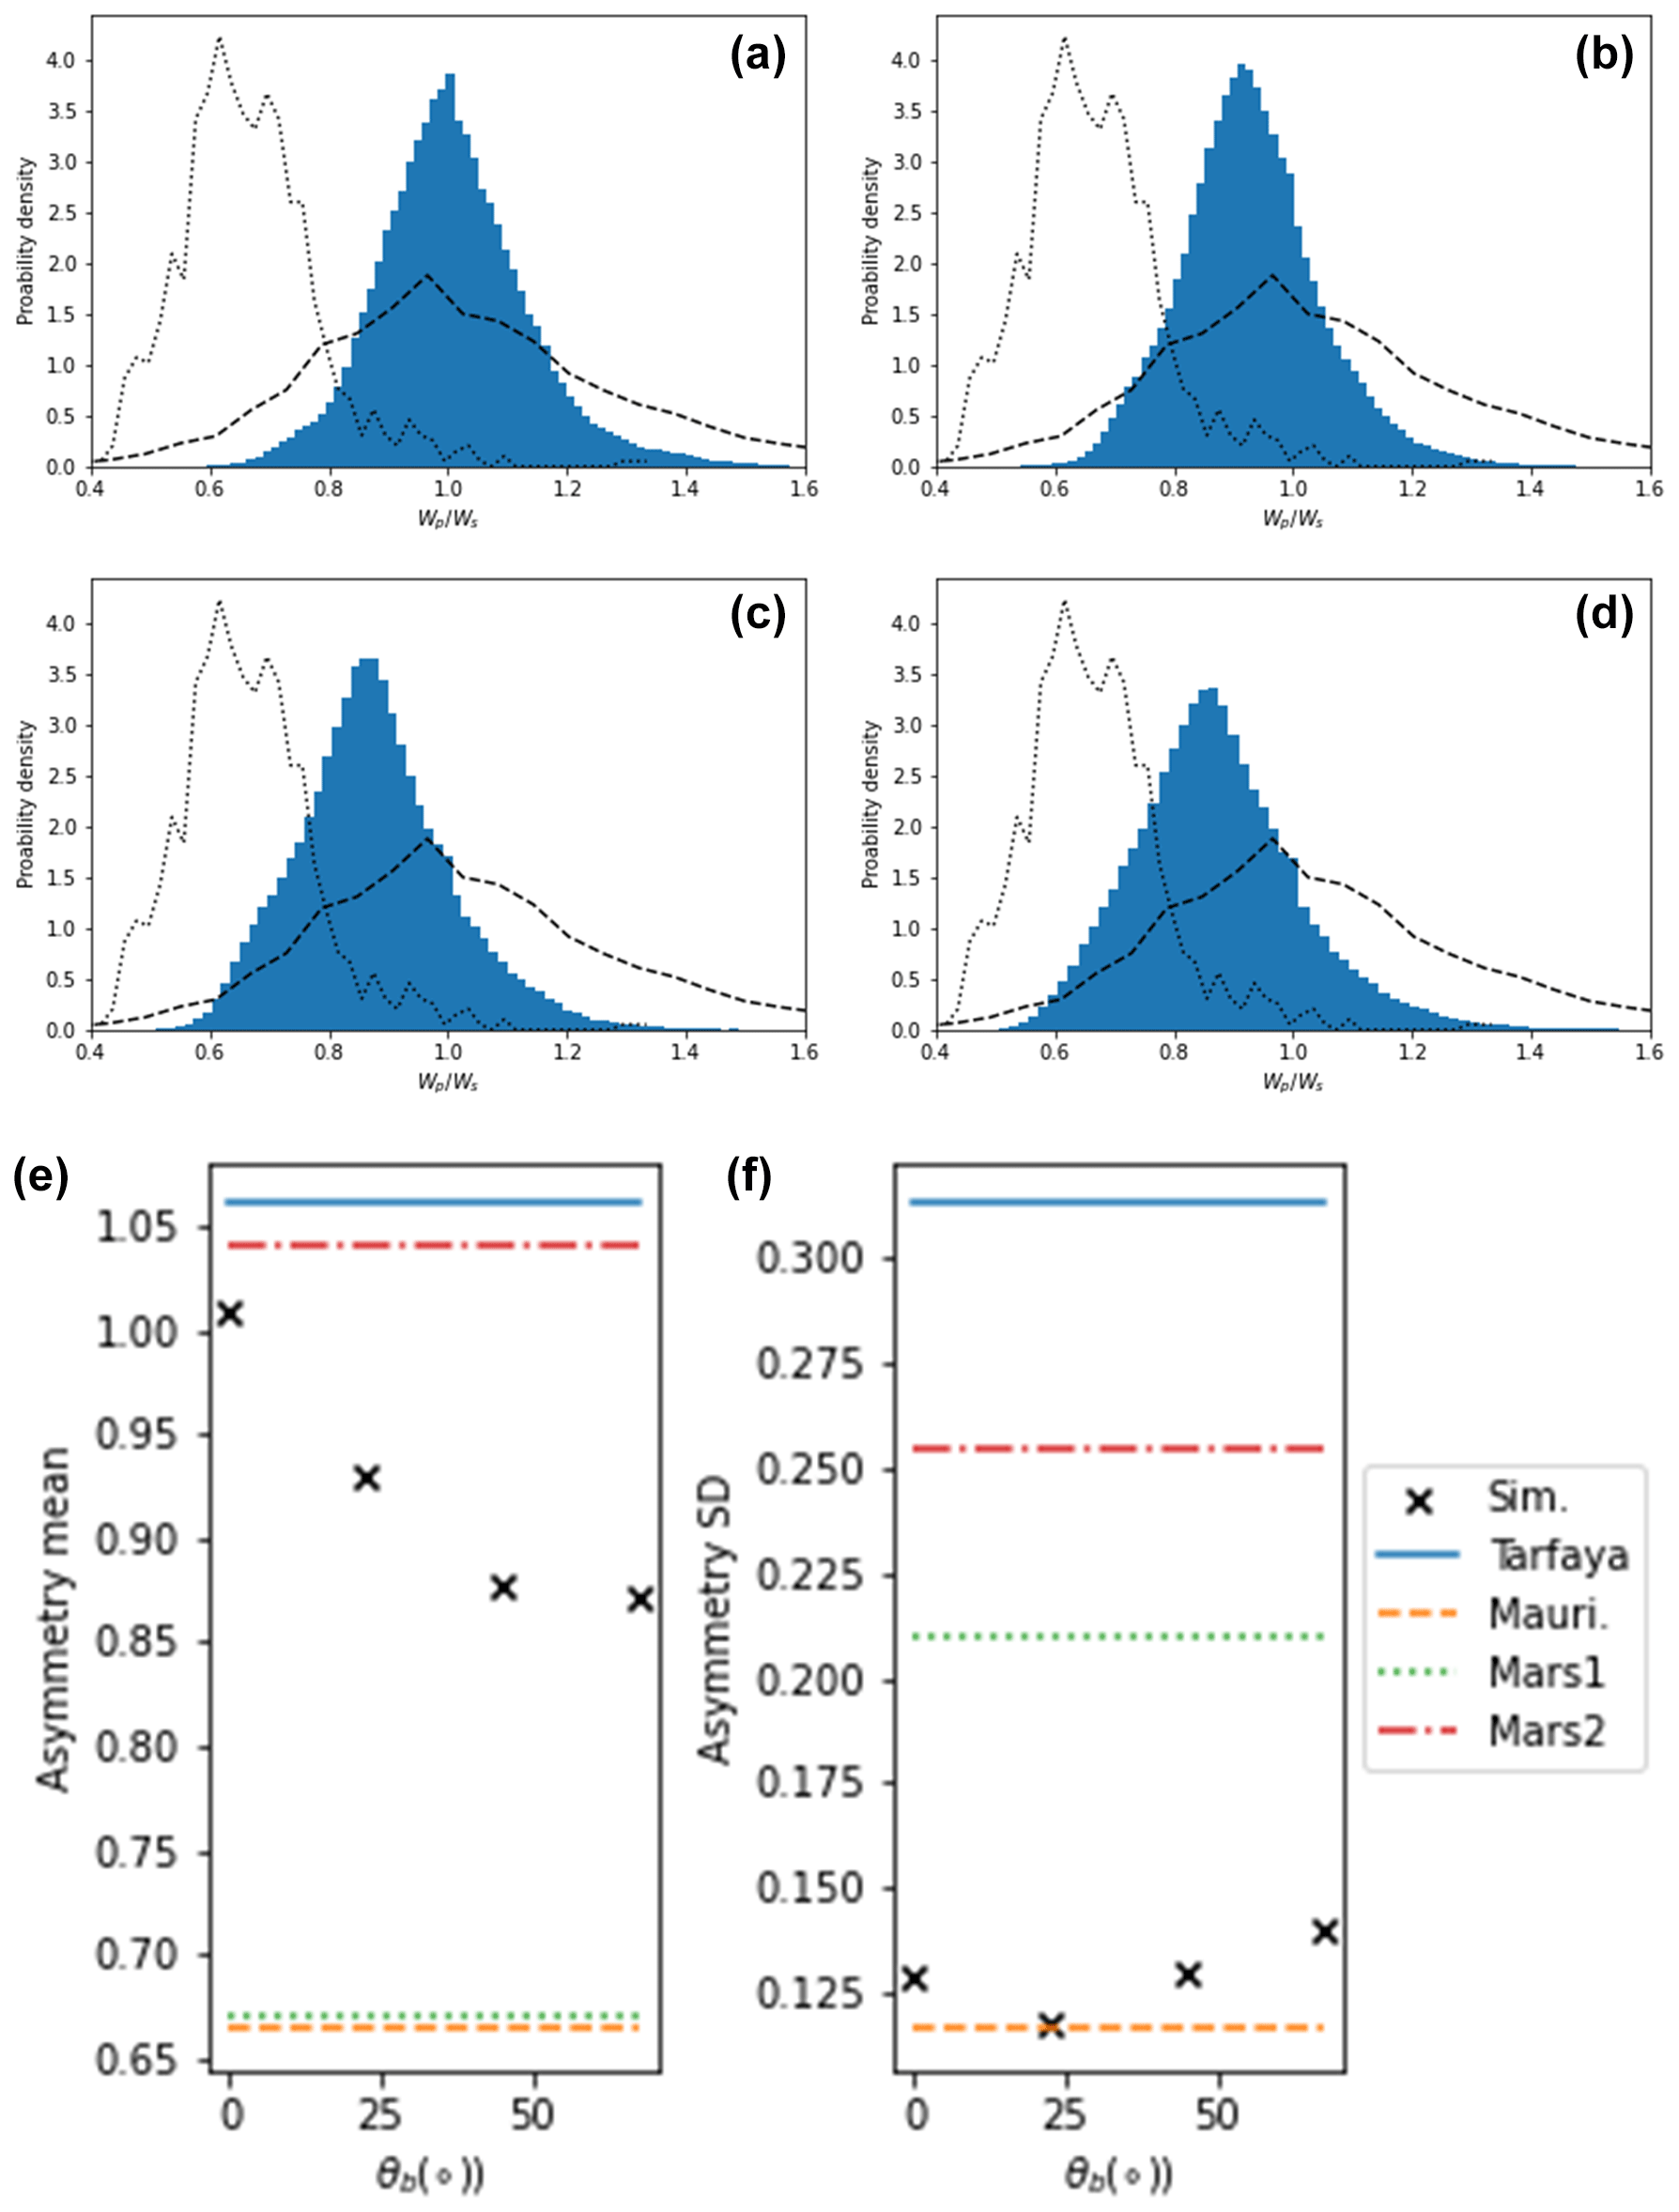
Figure 13Histograms of dune asymmetries defined at the ratio of port and starboard flank widths are shown in panels (a)–(d) for θb=0, 22.5, 45, and 67.5°, with and scaled outflux. The dashed and dotted lines show the distributions for real-world swarms in Tarfaya and Mauritania. Panels (e) and (f) show the mean and standard deviations of the distributions shown in panels (a)–(d) compared to four real-world barchan swarms.
A feature of barchan swarms that we have not yet discusses is that a downwind dune tends to align with the horn of its upwind neighbour (Bagnold, 1941; Elbelrhiti et al., 2008). In the earliest barchan ABM, this was evidenced by peaks in an angular correlation function (Lima et al., 2002); however, such peaks have not been reported widely for real-world barchan swarms. On the other hand, Elbelrhiti et al. (2008) showed that this affect could be measured by looking at the normalised lateral offset of dunes and their nearest downwind neighbours, which showed double-peaked distributions (with peaks indicating alignment downwind of the horns) when the downwind neighbour was smaller than the upwind dune and a flat distribution when the downwind dune was larger than its neighbour. In Fig. 14, we show the distributions of the lateral offset of dunes and their nearest downwind neighbour in each case normalised by the width of the upwind dune for each of the six barchan swarms from Robson et al. (2022) and Robson and Baas (2024a, b). The three Tarfaya swarms (Fig. 14a–c) show the same double-peaked behaviour as reported in Elbelrhiti et al. (2008), although the distribution for which the downwind neighbour is larger is not as uniform as previously reported. The Mauritanian swarm (Fig. 14d) shows an approximately uniform distribution for both cases, with only small peaks at ±1. Finally, the Martian swarms (Fig. 14e and f) show double-peaked distributions but with the peaks occurring at ±2, indicating that the barchans do not occur with any lateral overlap with their upwind neighbour.
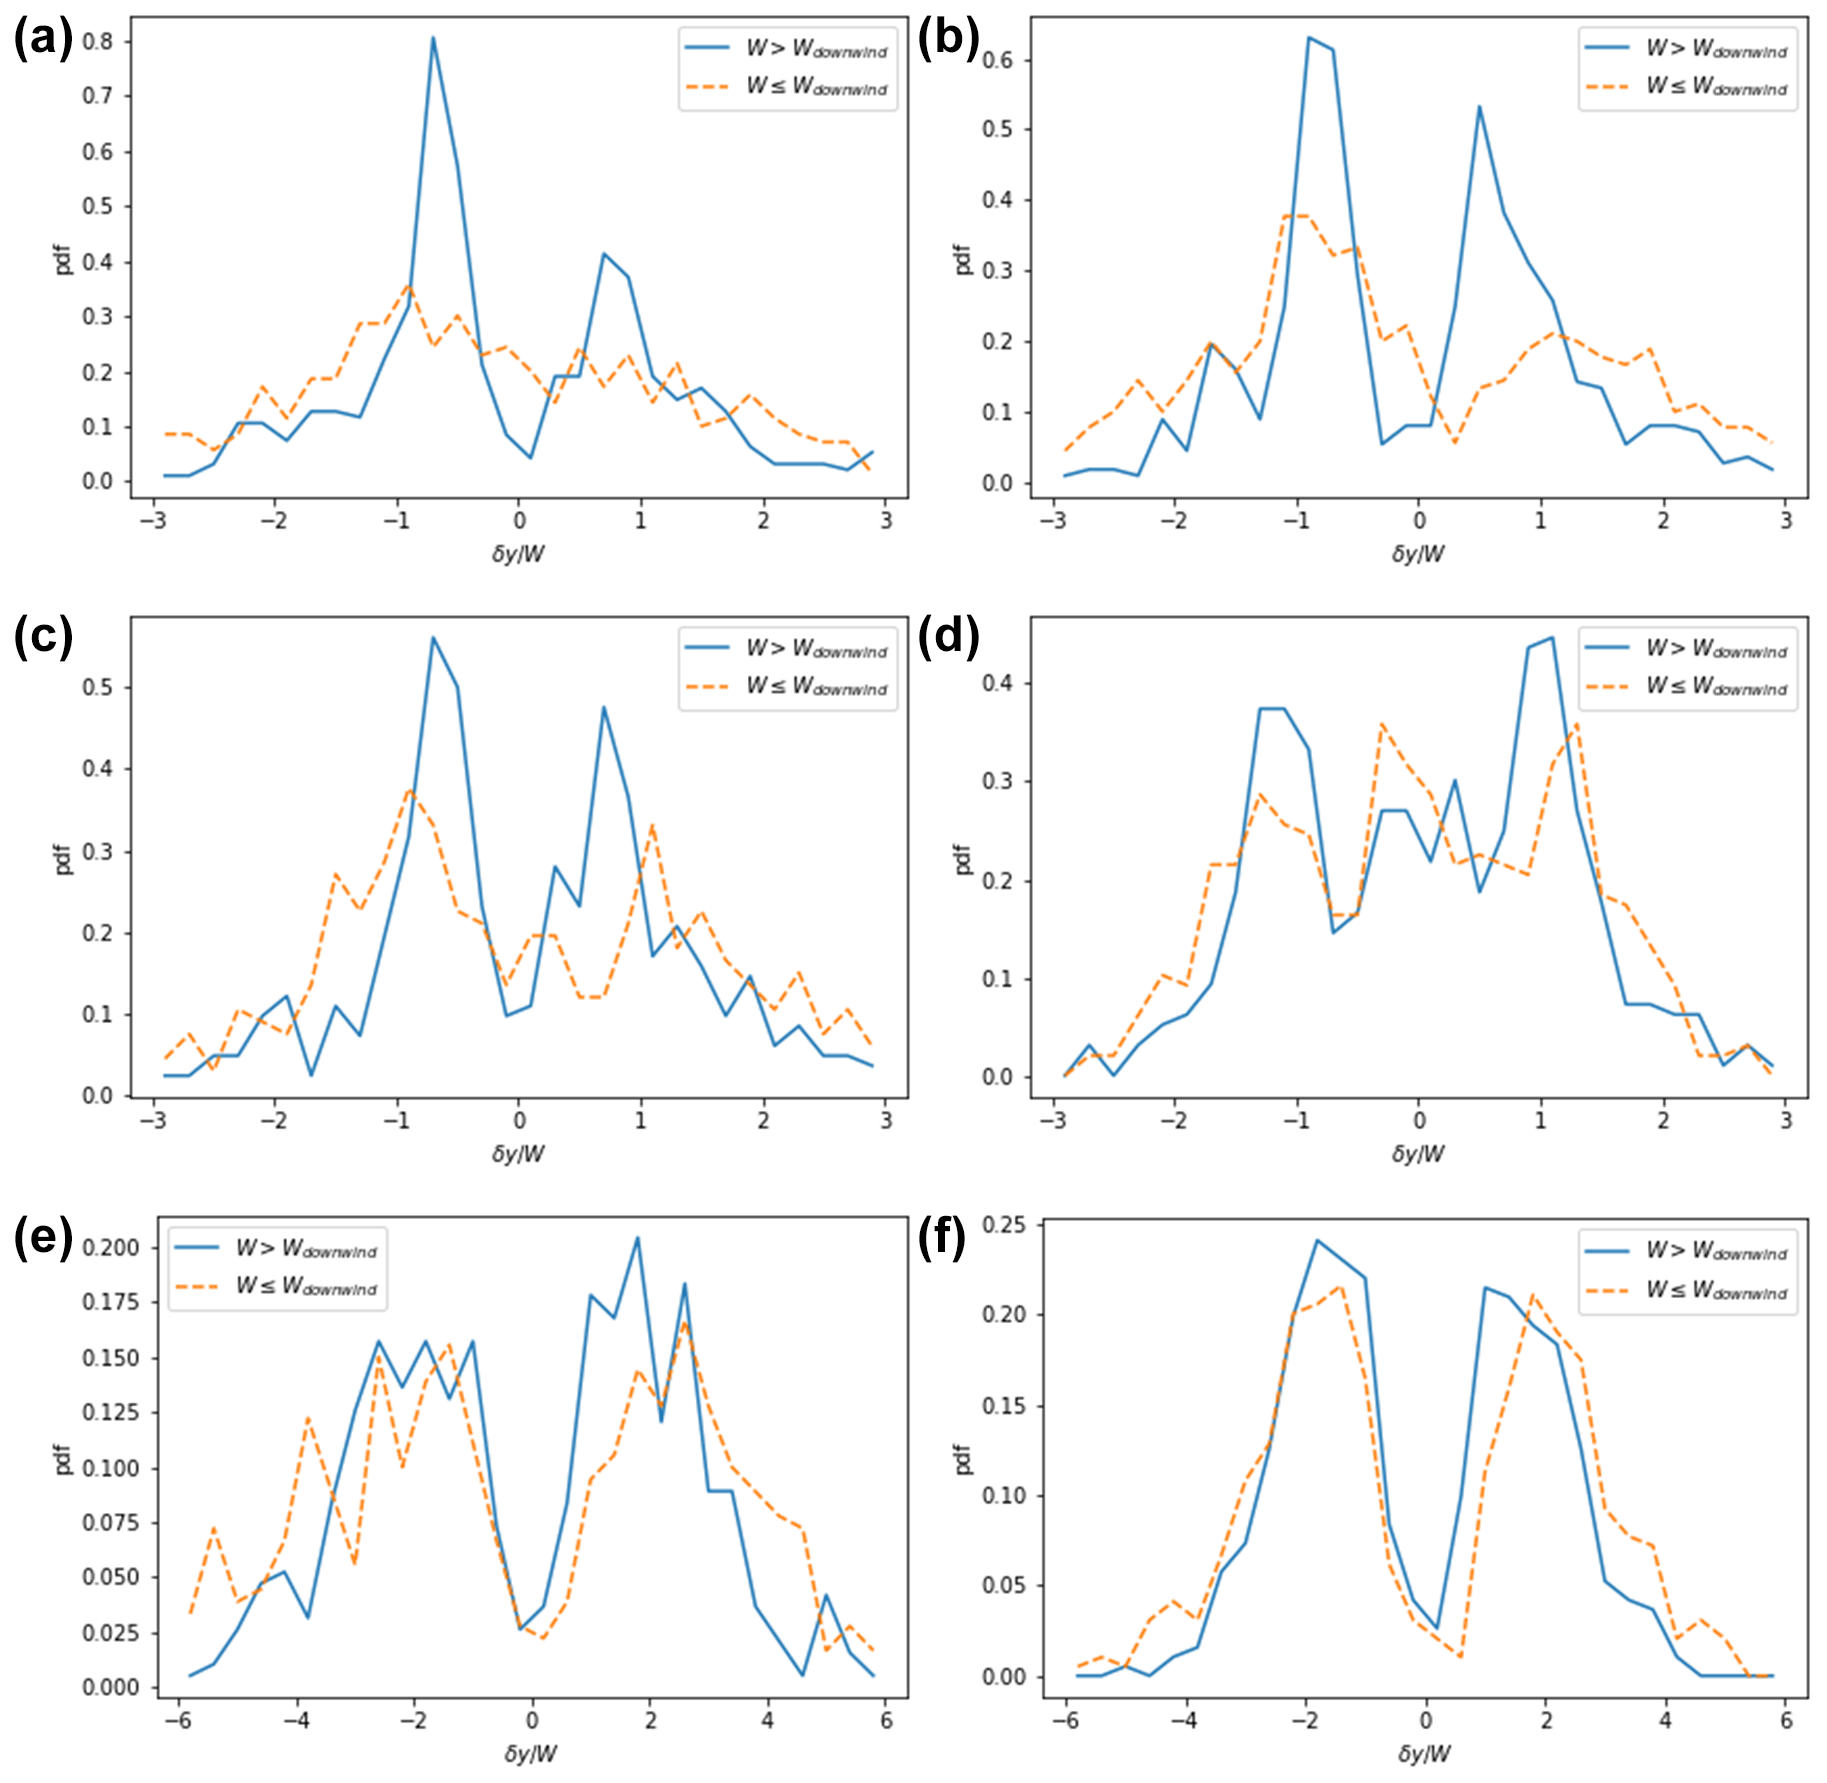
Figure 14The normalised lateral offset of the nearest downwind neighbours (defined as the lateral offset divided by the width of the upwind dune) in the populations of (a) Tarfaya 1, (b) Tarfaya 2, (c) Tarfaya 3, (d) Mauritania, (e) Mars 1, and (f) Mars 2 (available at https://doi.org/10.5281/zenodo.10848514) (Robson and Baas, 2024a).
In Fig. 15, we show lateral offset of the nearest downwind neighbours in the simulated swarms with θb=0, 22.5, 45, and 67.5°. Unlike the real-world results, we see the double-peaked shape in both cases where the downwind dune is smaller and larger than the upwind dune. Increasing the angle between the wind modes has the affect of widening the peaks in both distributions. We also see that for greater angular separation the distributions for the cases of smaller and larger dunes begin to become offset from one another, whereas for unimodal wind they are perfectly aligned.
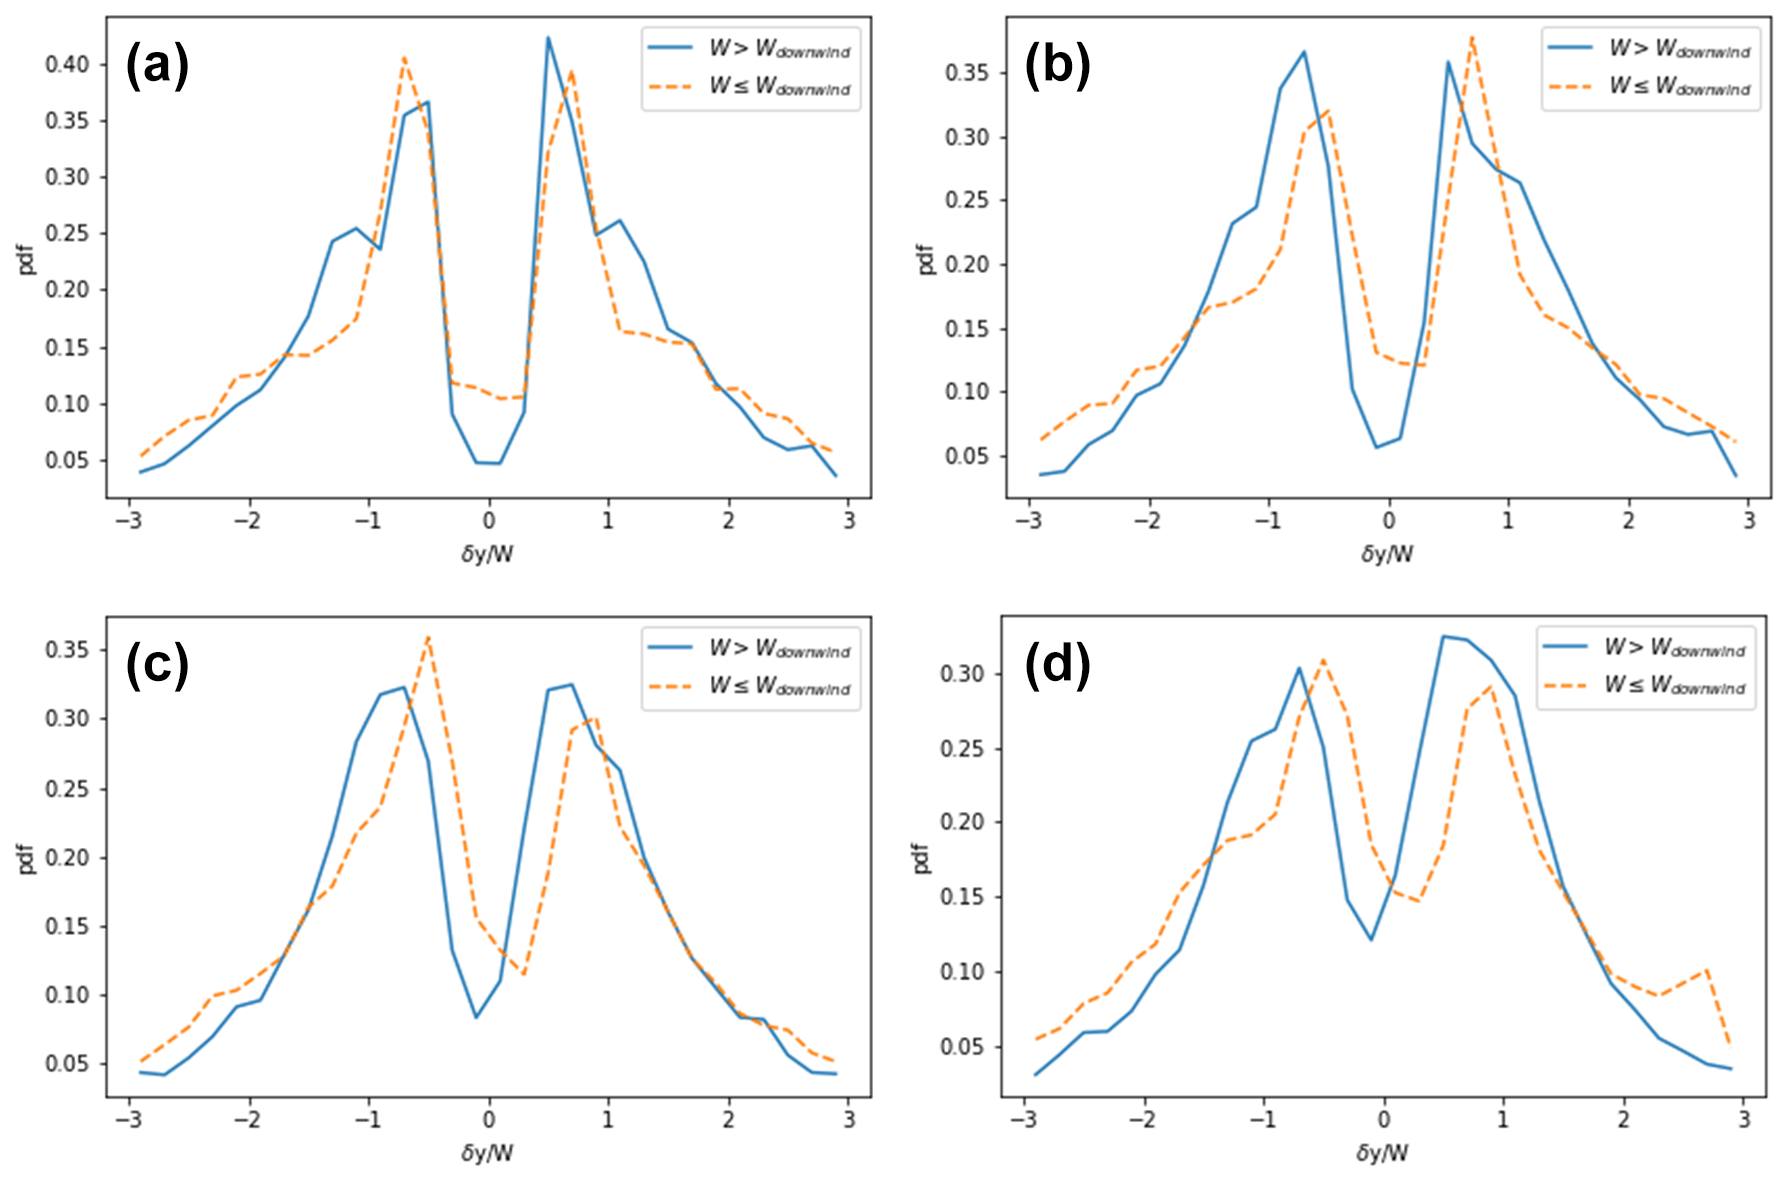
Figure 15The lateral offset of the nearest downwind neighbour of dunes normalised by the width of the upwind dune for scaled outflux . θb=0, 22.5, 45, and 67.5° in panels (a)–(d) respectively.
The efficiency of the TFABM has meant that we have been able to perform a significant number of swarm-scale simulations and investigate the impact of a number of parameters on the types of swarms that are produced. Previous ABMs have not been able to produce the longitudinally homogeneous size distributions (Lima et al., 2002; Durán et al., 2011; Worman et al., 2013) which are expected for real-world swarms (Elbelrhiti et al., 2008; Durán et al., 2011). In contrast, we have shown that for several combinations of model parameters the TFABM is able to produce longitudinally homogeneous swarms.
The phenomenological parameter qshift, which relates to the lateral motion of sediment within an asymmetric barchan and, therefore, controls the stability of asymmetric dunes, is found to be the most important factor in generating stable dune sizes through its influence on the collision dynamics. However, the types of collisions required to produce homogeneity depend upon whether the outflux of sand from the dunes is scaled with the influx that they receive. If the outflux is saturated across the horns, there is an unstable equilibrium size which should lead to runaway growth or shrinking (Hersen et al., 2004; Hersen and Douady, 2005; Worman et al., 2013). We find, in such cases, that homogeneity results from a dominance of fragmentation collision which occurs for qshift≥0.1 qsat. Fragmentation collisions serve to counteract the runaway growth of dunes which become larger than equilibrium, and so the homogeneity is seen as a balance between the rate of growth of the large dunes due to flux and the rate of collisions resulting in fragmentation.
Fragmentation collisions are able to reduce the size of a large dune through the creation of at least one additional new dune. However, these dunes are often too small to persists on their own, as has previously been reported using continuum simulations (Durán et al., 2005). The formation of ephemeral small dunes, whose sediment is converted to free flux when the dunes become too small to persist, is what leads to the decrease in dune density in the unscaled flux simulations. Without additional effects, such as the spontaneous creation of sand patches which evolve into dunes (Delorme et al., 2023), this decrease in density is inevitable if fragmentation collisions are required to stabilise dune size.
If, on the other hand, the outflux from dunes scales with the influx they receive then, rather than an equilibrium size for dunes, there is an equilibrium flux for which a barchan of any size would be stable. In this case, longitudinal homogeneity can be achieved if collisions typically drive dunes to a particular size. Size selection has been shown to be possible using exchange collisions only (Durán et al., 2009; Robson et al., 2021), with stronger peaks indicating the higher the relative prevalence of exchange over merging and fragmentation (Robson et al., 2022). The explains why we observe stable sizes in TFABM swarms with scaled outflux when qshift=0.1 qsat, since at this value exchange collisions dominate, as shown in Fig. 3. At qshift=0.1 qsat, over 60 % of collisions result in exchange, with ∼35 % merging and the remainder being fragmentation. This also explains why, although exchange dominance leads to a constant size distribution which can be described by a log-normal distribution (Fig. 10), the overall density typically decreases with downwind distance, since merging collisions (which decrease dune number) occur significantly more frequently than fragmentation collisions (which increase dune number). For the values of qshift we tested, only if the density of dunes is low, which reduces the number of collisions, do we observe a swarm that is homogeneous in both size and density (Fig. 9).
Looking at Fig. 3, it is possible that between and 0.15 there exists a point at which the rates of fragmentation and merging are equal, allowing the homogeneity of size and density to coexist at higher densities; however, we were unable to find such a point with a manual search of the parameter combinations.
In order to constrain the range of parameters in the TFABM to reproduce realistic swarms, the longitudinal size and density profiles of real-world swarms require further investigation. In Fig. 1 of Durán et al. (2011), the size profiles of four swarms in Tarfaya are shown to be longitudinally homogeneous for between 3 and 13 km, but there is no discussion of dune density. Qualitatively the swarms shown in that work display non-monotonic density over their downwind extent. Elbelrhiti et al. (2008) is the only other study which has explored longitudinal profiles of size and density over 4–5 km. Some of the profiles show sizes which remain constant over the entire distance, while others shown an initial increase in size followed by either a plateau or decrease in size (similar to many of our simulations). Similarly, the density profiles for some of the locations are flat, while others display non-monotonic behaviour, including an increase to a peak followed by a decrease, as observed in many of the swarms we presented here. Interestingly, in paragraph 8 of chapter 14 in Bagnold (1941) (p. 218 of the 1954 reprint), it was claimed that it is “common for barchan belts to terminate because the frequency of their occurrence dwindles to nothing”. In other words, the density of dunes should decrease significantly towards the end of a swarm. Bagnold (1941) also suggests that this could be mitigated if additional sediment becomes available following that supplied at the upwind boundary. Indirect evidence for the stability of dune density comes from the Tarfaya zones of Robson et al. (2022) and Robson and Baas (2024a), which could be interpreted as several areas within a large swarm and which have very similar sizes and densities to one another. However, much more work is needed to establish how barchan size and density behave in natural swarms.
Assuming that swarms are longitudinally homogeneous, at least in size, the values of qshift which produce homogeneity are 0.15 qsat and 0.1 qsat in the unscaled and scaled flux cases respectively. These were the same values of qshift which were shown to reproduce over 80 % of collisions from cellular automata (Katsuki et al., 2005), and water tank experiments (Assis and Franklin, 2020), as shown in the supplementary material of Robson and Baas (2023). Thus, it seems that collisions produced by other techniques coincide with those that produce longitudinally stable size distributions in swarms.
On the other hand, we have shown in Fig. 7 that there are significant differences in the width of asymmetry distributions in real-world swarm, and consequently, a wider range of qshift is required to reproduce all of the different distributions in observed swarms. This suggests that it might be necessary to decouple the dynamics of collisions and asymmetry growth in the TFABM to capture a wider range of swarm-scale properties. Figure 13 also shows that, although bimodal wind regimes can drive dunes away from symmetry, we are unable to produce the extreme asymmetries observed in some locations. In order to reproduce such asymmetries, one could adjust the shape parameters in the TFABM which currently prevent dunes from becoming too asymmetric according to Eq. (5).
Finally, we have been able to reproduce the two-peak distribution of the alignment of dunes and their downwind neighbours, which is something that has been observed previously for real-world swarms (Elbelrhiti et al., 2008). However, there are some differences between the observed distributions and those produced using the TFABM; the most significant is that in the simulated swarms, there is little difference between the shape of the distribution for smaller and larger downwind dunes. It is possible that one must include the lateral diffusion of sand flux (Schwämmle and Herrmann, 2005) or the deflection of sand flux around a barchan so that the effective shadow cast by a dune only lasts a finite distance. For instance, it has been observed that erosion downwind of the bulk of a fixed model of a barchan in a wind tunnel persists only to around 20 dune heights, depending upon the wind speed and size of the dune, with deposition resuming beyond this point (Cai et al., 2021). We do observe, in Fig. 14, a slightly different behaviour than Elbelrhiti et al. (2008) in some cases (especially the Martian swarms), and so future work should look further into the alignment of barchans in swarms.
We have demonstrated that the Two-Flank Agent-Based Model is capable of generating swarms of barchans which have longitudinally homogeneous size distributions which had not been produced using previous agent-based models but which are known to be the case for some real-world barchan swarms. The model and results presented here, therefore, represent a step forward in our understanding of the behaviour of these complex swarms. We observed that, depending on whether or not outflux of sand from dunes scales with the influx, different relative frequencies of collision types are required to produce longitudinal homogeneity. However, in both cases, the necessary collision dynamics coincide with those reported in numerical and experimental studies and are produced by the TFABM with qshift in the range 0.1–0.15 qsat. It may be possible to test this prediction using more involved computational models or water tank experiments.
Longitudinal stability of dune density is a rarer occurrence in the simulated swarms; however, it is possible to create sparse swarms exhibiting this kind of homogeneity. Current quantitative evidence is lacking for the assessment of whether such stability is indeed a universal property of barchan swarms in nature. If it is a universal property, then it may be necessary to incorporate sand patch formation or additional sediment supply in the TFABM to produce dense homogeneous swarms.
Unlike with previous agent-based models, the Two-Flank Agent-Based Model is capable of simulating swarms under bimodal winds, which revealed that bimodality may be responsible for asymmetry distributions centred away from unity, and it also changes in the alignment of dunes with their neighbours. This adds to our understanding of how dune interaction shape the properties of swarms.
Being able to simulate more realistic swarms using an agent-based model presents many exciting opportunities for future work, including the investigation of changing boundary conditions. Preliminary results indicate that there is a finite transition time for barchan swarms, after which historical boundary conditions are no longer reflected in the properties of swarms. Future work could explore changing boundary conditions further to understand how swarms will be affected by anthropogenic change. It may also be possible to use the TFABM to train machine-learning algorithms to trace individual barchans through satellite imagery of dense swarms.
Two-Flank Agent-Based Model has been developed openly, and version 3 is published at https://doi.org/10.5281/zenodo.13169266 (Robson, 2024b) and https://github.com/DTRobson/TwoFlankABModel. Animations showing the swarm simulations using the model are available at https://doi.org/10.5281/zenodo.13168898 (Robson, 2024a).
DTR led the development of the model, performed the simulations described, and wrote the initial and second draft of this paper. ACWB assisted in the design of the model and the research strategy and carried out text edits on the submitted paper.
At least one of the (co-)authors is a member of the editorial board of Earth Surface Dynamics. The peer-review process was guided by an independent editor, and the authors also have no other competing interests to declare.
Publisher's note: Copernicus Publications remains neutral with regard to jurisdictional claims made in the text, published maps, institutional affiliations, or any other geographical representation in this paper. While Copernicus Publications makes every effort to include appropriate place names, the final responsibility lies with the authors.
We are grateful for the helpful suggestions of the reviewers which improved this work.
This research has been supported by the Engineering and Physical Sciences Research Council (grant no. EP/L015854/1).
This paper was edited by Tom Coulthard and reviewed by Dongxu Cai and one anonymous referee.
Al-Dousari, A. and Pye, K.: Mapping and monitoring of dunes in northwestern Kuwait, Kuwait J. Sci. Eng., 32, 119–134, 2005. a
Assis, W. R. and Franklin, E. D. M.: A comprehensive picture for binary interactions of subaqueous barchans, Geophys. Res. Lett., 47, e2020GL089464, https://doi.org/10.1029/2020GL089464, 2020. a, b, c, d
Assis, W. R. and Franklin, E. D. M.: Morphodynamics of barchan-barchan interactions investigated at the grain scale, J. Geophys. Res.-Earth, 126, e2021JF006237, https://doi.org/10.1029/2021JF006237, 2021. a
Baas, A. C. and Delobel, L. A.: Desert dunes transformed by end-of-century changes in wind climate, Nat. Clim. Change, 12, 999–1006, 2022. a, b
Bagnold, R. A.: The Physics of Blown Sand and Desert Dunes, Methuen, London, ISBN- :0-486-43931-3, 1941. a, b, c, d, e, f, g
Barnes, J.: Barchan dunes on the Kuiseb River delta, Namibia, South African Geogr. J., 83, 283–292, 2001. a
Bo, T.-L. and Zheng, X.-J.: Collision behaviors of barchans in aeolian dune fields, Environ. Earth Sci., 70, 2963–2970, 2013. a
Boulghobra, N.: Climatic data and satellite imagery for assessing the aeolian sand deposit and barchan migration, as a major risk sources in the region of In-Salah (Central Algerian Sahara), Arab. J. Geosci., 9, 1–15, 2016. a
Bourke, M. C.: Barchan dune asymmetry: Observations from Mars and Earth, Icarus, 205, 183–197, 2010. a, b, c, d
Bourke, M. C. and Goudie, A. S.: Varieties of barchan form in the Namib Desert and on Mars, Aeolian Res., 1, 45–54, 2009. a
Cai, D., Li, S., Gao, X., and Lei, J.: Wind tunnel simulation of the aeolian erosion on the leeward side of barchan dunes and its implications for the spatial distribution patterns of barchan dunes, Catena, 207, 105583, https://doi.org/10.1016/j.catena.2021.105583, 2021. a
Corbett, I.: The Influence of the Benguela Low-Level Coastal Jet on the Architecture and Dynamics of Aeolian Transport Corridors in the Sperrgebiet, Namibia, Communications of the Geological Survey of Namibia, 9–58, https://www.researchgate.net/publication/330726981 (last access: 14 November 2023), 2018. a
Delorme, P., Nield, J., Wiggs, G. F., Baddock, M. C., Bristow, N. R., Best, J., Christensen, K. T., and Claudin, P.: Field evidence for the initiation of isolated aeolian sand patches, Geophys. Res. Lett., 50, e2022GL101553, https://doi.org/10.1029/2022GL101553, 2023. a
Ding, C., Feng, G., Liao, M., and Zhang, L.: Change detection, risk assessment and mass balance of mobile dune fields near Dunhuang Oasis with optical imagery and global terrain datasets, Int. J. Digit. Earth, 13, 1604–1623, 2020. a
Diniega, S., Glasner, K., and Byrne, S.: Long-time evolution of models of aeolian sand dune fields: Influence of dune formation and collision, Geomorphology, 121, 55–68, 2010. a
Durán, O., Schwämmle, V., and Herrmann, H. J.: Breeding and solitary wave behavior of dunes, Phys. Rev. E, 72, 021308, https://doi.org/10.1103/PhysRevE.72.021308, 2005. a
Durán, O., Schwämmle, V., Lind, P. G., and Herrmann, H. J.: The dune size distribution and scaling relations of barchan dune fields, Granular Matter, 11, 7–11, 2009. a, b, c, d, e, f
Durán, O., Parteli, E. J., and Herrmann, H. J.: A continuous model for sand dunes: Review, new developments and application to barchan dunes and barchan dune fields, Earth Surf. Proc. Land., 35, 1591–1600, 2010. a
Durán, O., Schwämmle, V., Lind, P. G., and Herrmann, H. J.: Size distribution and structure of Barchan dune fields, Nonlin. Processes Geophys., 18, 455–467, https://doi.org/10.5194/npg-18-455-2011, 2011. a, b, c, d, e, f, g, h, i, j, k, l, m, n, o
Effat, H. A., Hegazy, M. N., and Haack, B.: Mapping sand dunes risk related to their terrain characteristics using SRTM data and cartographic modeling, J. Land Use Sci., 6, 231–243, 2011. a
Elbelrhiti, H.: Initiation and early development of barchan dunes: A case study of the Moroccan Atlantic Sahara desert, Geomorphology, 138, 181–188, 2012. a
Elbelrhiti, H., Andreotti, B., and Claudin, P.: Barchan dune corridors: field characterization and investigation of control parameters, J. Geophys. Res.-Earth, 113, F02S15, https://doi.org/10.1029/2007JF000767, 2008. a, b, c, d, e, f, g, h, i, j, k, l, m, n, o, p, q, r, s, t, u, v, w
Engel, M., Boesl, F., and Brückner, H.: Migration of barchan dunes in Qatar–controls of the Shamal, teleconnections, sea-level changes and human impact, Geosciences, 8, 240, https://doi.org/10.3390/geosciences8070240, 2018. a, b
Finkel, H. J.: The barchans of southern Peru, J. Geol., 67, 614–647, 1959. a
Génois, M., Du Pont, S. C., Hersen, P., and Grégoire, G.: An agent-based model of dune interactions produces the emergence of patterns in deserts, Geophys. Res. Lett., 40, 3909–3914, 2013a. a, b
Génois, M., Hersen, P., Du Pont, S. C., and Grégoire, G.: Spatial structuring and size selection as collective behaviours in an agent-based model for barchan fields, Eur. Phys. J. B, 86, 1–13, 2013b. a, b, c
Goudie, A. S.: Global barchans: A distributional analysis, Aeolian Res., 44, 100591, https://doi.org/10.1016/j.aeolia.2020.100591, 2020. a
Groh, C., Wierschem, A., Aksel, N., Rehberg, I., and Kruelle, C. A.: Barchan dunes in two dimensions: Experimental tests for minimal models, Phys. Rev. E, 78, 021304, https://doi.org/10.1103/PhysRevE.78.021304, 2008. a
Gunn, A., East, A., and Jerolmack, D. J.: 21st-century stagnation in unvegetated sand-sea activity, Nat. Commun., 13, 3670, https://doi.org/10.1038/s41467-022-31123-8, 2022. a, b
Hermas, E., Leprince, S., and Abou El-Magd, I.: Retrieving sand dune movements using sub-pixel correlation of multi-temporal optical remote sensing imagery, northwest Sinai Peninsula, Egypt, Remote Sens. Environ., 121, 51–60, 2012. a
Hersen, P.: Flow effects on the morphology and dynamics of aeolian and subaqueous barchan dunes, J. Geophys. Res.-Earth, 110, F04S07, https://doi.org/10.1029/2004JF000185, 2005. a
Hersen, P. and Douady, S.: Collision of barchan dunes as a mechanism of size regulation, Geophys. Res. Lett., 32, L21403, https://doi.org/10.1029/2005GL024179, 2005. a
Hersen, P., Douady, S., and Andreotti, B.: Relevant Length Scale of Barchan Dunes, Phys. Rev. Lett., 89, 264301, https://doi.org/10.1103/PhysRevLett.89.264301, 2002. a
Hersen, P., Andersen, K. H., Elbelrhiti, H., Andreotti, B., Claudin, P., and Douady, S.: Corridors of barchan dunes: Stability and size selection, Phys. Rev. E, 69, 011304, https://doi.org/10.1103/PhysRevE.69.011304, 2004. a, b, c, d, e, f
Hesse, R.: Do swarms of migrating barchan dunes record paleoenvironmental changes? – A case study spanning the middle to late Holocene in the Pampa de Jaguay, southern Peru, Geomorphology, 104, 185–190, 2009. a, b, c
Katsuki, A., Nishimori, H., Endo, N., and Taniguchi, K.: Collision dynamics of two barchan dunes simulated using a simple model, J. Phys. Soc. Jpn., 74, 538–541, 2005. a
Katsuki, A., Kikuchi, M., Nishimori, H., Endo, N., and Taniguchi, K.: Cellular model for sand dunes with saltation, avalanche and strong erosion: collisional simulation of barchans, Earth Surf. Proc. Land., 36, 372–382, 2011. a
King, W. J. H.: Study of a dune belt, Geogr. J., 51, 16–33, 1918. a
Lee, J. H., Sousa, A., Parteli, E., and Herrmann, H.: Modelling formation and evolution of transverse dune fields, Int. J. Mod. Phys. C, 16, 1879–1892, 2005. a
Lima, A., Sauermann, G., Herrmann, H. J., and Kroy, K.: Modelling a dune field, Physica A, 310, 487–500, 2002. a, b, c, d, e, f, g
Long, J. T. and Sharp, R. P.: Barchan-dune movement in imperial valley, California, Geol. Soc. Am. Bull., 75, 149–156, 1964. a, b
Lorenz, R. D., Gasmi, N., Radebaugh, J., Barnes, J. W., and Ori, G. G.: Dunes on planet Tatooine: Observation of barchan migration at the Star Wars film set in Tunisia, Geomorphology, 201, 264–271, 2013. a
Lv, P., Dong, Z., Narteau, C., and Rozier, O.: Morphodynamic mechanisms for the formation of asymmetric barchans: improvement of the Bagnold and Tsoar models, Environ. Earth Sci., 75, 1–9, 2016. a, b
Marvin, M. C., Lapôtre, M. G., Gunn, A., Day, M., and Soto, A.: Dune interactions record changes in boundary conditions, Geology, 51, 947–951, 2023. a, b, c
Parteli, E. J. and Herrmann, H. J.: A simple model for a transverse dune field, Physica A, 327, 554–562, 2003. a
Parteli, E. J., Kroy, K., Tsoar, H., Andrade Jr, J. S., and Pöschel, T.: Morphodynamic modeling of aeolian dunes: Review and future plans, Eur. Phys. J. Spec. Top., 223, 2269–2283, 2014. a, b, c, d
Robson, D.: Barchan Swarm Simulations Using the Two-Flank Agent-Based Model v3, Zenodo [code], https://doi.org/10.5281/zenodo.13168898, 2024a. a, b
Robson, D. T.: DTRobson/TwoFlankABModel: Two-Flank Agent-Based Model v3 (TFABM), Zenodo [code], https://doi.org/10.5281/zenodo.13169266 (code also available at: https://github.com/DTRobson/TwoFlankABModel, last access: 18 October 2024), 2024b. a
Robson, D. T. and Baas, A. C.: A Simple Agent-Based Model That Reproduces All Types of Barchan Interactions, Geophys. Res. Lett., 50, e2023GL105182, https://doi.org/10.1029/2023GL105182, 2023. a, b, c, d, e, f, g, h, i, j, k, l
Robson, D. T. and Baas, A.: Point locations for spatial and morphological analyses of barchans in swarms [dataset], Zenodo [data set], https://doi.org/10.5281/zenodo.10848514, 2024a. a, b, c, d, e, f
Robson, D. T. and Baas, A. C.: Size-dependent asymmetry of barchans indicates dune growth controlled by basal area or bulk volume, Earth Surf. Proc. Land., 49, 3063–3072, https://doi.org/10.1002/esp.5876, 2024b. a, b, c, d
Robson, D. T., Baas, A. C., and Annibale, A.: A combined model of aggregation, fragmentation, and exchange processes: insights from analytical calculations, J. Stat. Mech., 2021, 053203, https://doi.org/10.1088/1742-5468/abfa1d, 2021. a
Robson, D. T., Annibale, A., and Baas, A. C.: Reproducing size distributions of swarms of barchan dunes on Mars and Earth using a mean-field model, Physica A, 606, 128042, https://doi.org/10.1016/j.physa.2022.128042, 2022. a, b, c, d, e, f, g, h, i, j, k, l, m
Rubanenko, L., Lapôtre, M. G., Ewing, R. C., Fenton, L. K., and Gunn, A.: A distinct ripple-formation regime on Mars revealed by the morphometrics of barchan dunes, Nat. Commun., 13, 7156, https://doi.org/10.1038/s41467-022-34974-3, 2022. a
Schwämmle, V. and Herrmann, H. J.: A model of barchan dunes including lateral shear stress, Eur. Phys. J. E, 16, 57–65, 2005. a
Sherman, D. J., Zhang, P., Bae, J., Butler, R., and Hosahng, R.: Barchan Dunes: Geomorphometric Data, Zenodo [data set], https://doi.org/10.5281/zenodo.5637339, 2021. a, b
Sparavigna, A. C.: A Study of Moving Sand Dunes by Means of Satellite Images, Int. J. Sci., 8, 33–42, https://doi.org/10.18483/ijSci.229, 2013. a
Tsoar, H.: The formation of seif dunes from barchans-a discussion, Z. Geomorphol., 28, 99–103, 1984. a
Tsoar, H. and Parteli, E. J.: Bidirectional winds, barchan dune asymmetry and formation of seif dunes from barchans: a discussion, Environ. Earth Sci., 75, 1–10, 2016. a
Werner, B.: Eolian dunes: computer simulations and attractor interpretation, Geology, 23, 1107–1110, 1995. a
Worman, S. L., Murray, A. B., Littlewood, R., Andreotti, B., and Claudin, P.: Modeling emergent large-scale structures of barchan dune fields, Geology, 41, 1059–1062, 2013. a, b, c, d, e, f, g, h
Xiao, X., Liu, H., and Zheng, X.: Temporal evolution of dune number density in a barchan dune field, J. Geophys. Res.-Earth, 128, e2022JF007036, https://doi.org/10.1029/2022JF007036, 2023. a, b