the Creative Commons Attribution 4.0 License.
the Creative Commons Attribution 4.0 License.
A simple model for faceted topographies at normal faults based on an extended stream-power law
Stefan Hergarten
Mountain fronts at normal faults are often faceted in the sense that they contain strikingly planar surface elements that follow the surface trace of the fault. Since the dip angle of the facets is typically much lower than the dip angle of the fault, it is clear that the facets are not just the exhumed footwall but have been eroded considerably. It has also been shown that a constant erosion rate in combination with a constant rate of displacement can explain the occurrence of planar facets. Quantitatively, however, the formation of faceted topographies is still not fully understood. In this study, the shared stream-power model for fluvial erosion and sediment transport is used in combination with a recently published extension for hillslopes. As a major theoretical result, it is found that the ratio of the tangents of the facet angle and the dip angle of the fault as well as the ratio of the baseline length and horizontal width of perfect triangular facets mainly depend on the ratio of the horizontal rate of displacement and the hillslope erodibility. Numerical simulations reveal that horizontal displacement is crucial for the formation of triangular facets. For vertical faults, facets are rather multiangular and much longer than wide. While the sizes of individual facets vary strongly, the average size is controlled by the ratio of hillslope erodibility and fluvial erodibility.
- Article
(11244 KB) - Full-text XML
- BibTeX
- EndNote
Faceted topographies are the perhaps most impressive footprints of active tectonics in geomorphology. They typically form in the exhumed footwalls at normal faults and consist of several more or less planar surfaces, which are separated by transverse valleys (Fig. 1). While triangular facets are the simplest geometry, multiangular facets are also found.
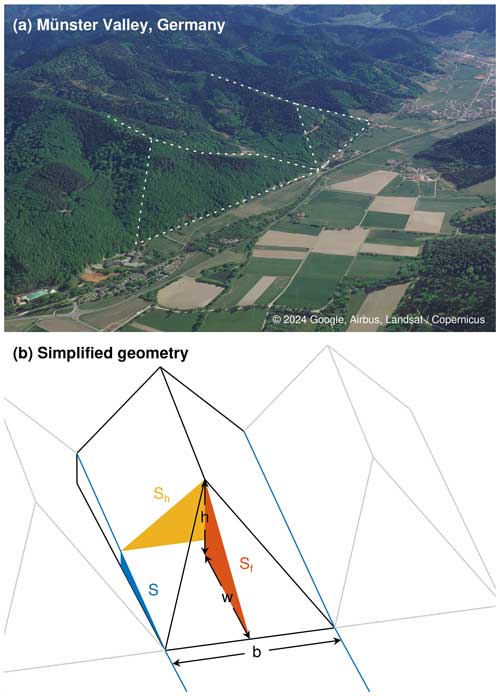
Figure 1(a) A triangular facet and a multiangular facet in the Münster Valley, Germany. (b) Simplified geometry of triangular facets between parallel rivers.
Tucker et al. (2020) provided several examples of faceted topographies as well as a short history of research on this topic with numerous references to the original literature. In a nutshell, the earliest studies interpreted facets as exhumed fault planes with little modification by erosion. It was, however, already recognized almost 100 years ago that faceted surfaces are typically less steep than the respective fault planes. While normal faults typically dip at angles between 50 and 70°, faceted surfaces are rarely steeper than 40°. So faceted surfaces must have been strongly affected by erosion, despite their often strikingly planar shape.
The importance of erosion for the formation of faceted surfaces raises several questions such as the following.
-
Under what conditions do planar slopes occur?
-
What causes the observed strong variation in dip angles of facets from less than 20° (e.g., Menges, 1990) to more than 40° (e.g., Wilkinson et al., 2015)?
-
How does the interplay of fluvial and hillslope processes influence the shape and size of individual facets?
The first two questions can be answered to some extent with the help of geometrical considerations by Tucker et al. (2011, 2020). As illustrated in Fig. 2, a spatially and temporally constant erosion rate in combination with a constant rate of displacement at the fault yields a planar surface. If vh is the horizontal rate of displacement, vv the vertical rate (throw rate), and E the erosion rate (measured vertically, not normal to the surface), the angle θ of the exhumed and eroded surface is given by the relation
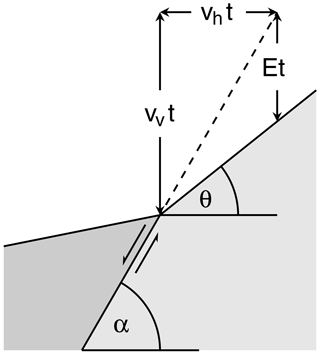
Figure 2Illustration of a planar erosional surface for constant rates of displacement (vh and vv) and erosion (E), where t is the time span of exposure.
In combination with the dip angle α of the fault, which constrains vh and vv according to
this relation can be written in the form
Assuming α = 60° as a typical dip angle for normal faults, typical facet angles θ≤ 40° require the erosion rate to be more than half of the fault throw rate vv according to Eq. (3). In turn, rather low facet angles of θ≤ 20° are achieved for E≥0.8vv. So the simple model with constant rates of displacement and erosion explains not only the occurrence of planar surfaces qualitatively, but also the large variation in slope for moderate changes in rates of erosion or displacement.
With regard to the third question, drainage patterns upstream of faults have been investigated numerically for more than 15 years (Castelltort and Simpson, 2006; Perron et al., 2008). However, these early studies focused on apparently regular river spacing (Hovius, 1996; Perron et al., 2009) but not on the hillslopes facing the fault.
The number of studies addressing the properties of faceted topographies with the help of numerical landform evolution models still seems to be small. Densmore et al. (1998) and Ellis et al. (1999) started from a model of fluvial erosion and sediment transport, in which hillslope processes were represented by a linear diffusion equation. This model was extended by a model for bedrock landsliding. It was found that landsliding becomes dominant over diffusion at hillslopes close to the fault at high rates of tectonic displacement. Hillslopes become planar then, with a slope depending mainly on the properties of the rock and not much on the rate of displacement.
Petit et al. (2009) returned to the diffusion equation for hillslope processes without including landslide events explicitly. However, linear diffusion, i.e., with constant diffusivity D, cannot explain the occurrence of faceted topographies. First, linear diffusion predicts convex topographies under erosion. Second, typical diffusivities obtained from field observations (e.g., Fernandes and Dietrich, 1997) are so small that diffusion dominates over fluvial processes only in a narrow range around drainage divides, where convex profiles indeed occur frequently in reality (e.g., Selby, 1985).
So explaining faceted topographies with a diffusion model requires nonlinear models with a slope-dependent diffusivity. Nowadays, the approach suggested by Roering et al. (1999) is widely used, which assumes D→∞ if the slope approaches a given limit slope. Petit et al. (2009) assumed that D increases instantaneously by a given factor if the slope exceeds a given threshold value. Both approaches can be interpreted as the long-term effect of landsliding and are able to produce planar slopes under erosion.
As a limitation, the spatial resolution of the published studies (Densmore et al., 1998; Ellis et al., 1999; Petit et al., 2009) is quite low (100 m grid spacing). Furthermore, planarity is limited to a narrow range of slope angles with a weak dependence on the fault dip angle and the rate of displacement. In order to explain the observed wide range of facet angles, the cellular automaton model proposed by Tucker et al. (2020) goes deeper into the hillslope processes. This model takes into account weathering and partial coverage of the surface by regolith. In turn, however, it is limited to longitudinal profiles and does not capture the interaction with the drainage pattern.
This study is based on the shared stream-power model (Hergarten, 2020b) in combination with the extension for hillslopes proposed by Hergarten and Pietrek (2023). The shared stream-power model is a simple model that combines fluvial incision and sediment transport. Mathematically, it is equivalent to the linear decline model (Whipple and Tucker, 2002) and to the ξ–q model (Davy and Lague, 2009). The shared stream-power model is described by the equation
where E is the erosion rate, Q the sediment flux (volume per time), A the upstream catchment size (a proxy for the mean discharge), and S the channel slope. It involves the four parameters Kd, Kt, m, and n.
The shared stream-power model was designed as an extension of the stream-power incision model (SPIM),
which contains a single erodibility K instead of Kd and Kt. For spatially uniform erosion, the sediment flux is Q=EA, and Eq. (4) collapses to a form analogous to Eq. (5) with an effective erodibility K according to
So the exponents m and n are the same as in the SPIM. The ratio of m and n is constrained quite well by long profiles of real-world rivers, whereby either or is typically used (e.g., Whipple et al., 2013; Lague, 2014). The absolute values of m and n are, however, more uncertain (e.g., Lague, 2014; Harel et al., 2016; Hilley et al., 2019; Adams et al., 2020). The widely used choice n=1 is mainly a matter of convenience since it makes the model linear with regard to the channel slope S (and thus also with regard to the surface elevation).
The parameter Kd describes the ability to erode the riverbed, while the transport capacity
(the sediment flux at E=0) is proportional to Kt. According to Eq. (6), estimates of K made for the SPIM can be used to constrain Kd and Kt, but 1 degree of freedom remains. The end-members are defined by Kd=K and Kt→∞, which leads back to the SPIM directly, and the transport-limited model obtained by setting Kd=∞ and Kt=K. The findings of Guerit et al. (2019), however, rather suggest Kd≈Kt, which is somehow the middle between the two end-members.
While most of the following calculations could also be performed with the SPIM instead of the shared stream-power model, the extension for hillslopes proposed by Hergarten and Pietrek (2023) plays a central part. This extension subdivides the model domain dynamically into channel sites and hillslope sites. Flow routing is based on the widely used D8 scheme (O'Callaghan and Mark, 1984) on a regular mesh, which assumes that the entire flow of water and sediment of a site is directed towards the neighbor with the steepest descent. Sites that have only one neighbor with a lower elevation than the site itself are considered channel sites. These are the sites for which a splitting of the fluxes towards multiple neighbors would not make sense. Other sites are considered hillslope sites. As an additional rule for delineating channels, it was assumed that the flow target of a channel site is also a channel site under all conditions.
Hergarten and Pietrek (2023) proposed basically the same shared stream-power model for hillslopes as for channels (Eq. 4), but with m=0,
The erodibilities κd and κt (originally termed and ) are different from Kd and Kt and also have different physical dimensions. In principle, even the exponent n may differ between channels and hillslopes, which is not taken into account in the following.
Solving the scaling issue that occurs when Eq. (4) or (5) is combined with a diffusion equation (Perron et al., 2008; Pelletier, 2010; Hergarten, 2020a) was the main motivation behind this approach. The scaling problem arises from the occurrence of regions where fluvial erosion is not negligible compared to diffusion but not strong enough to develop a dendritic flow pattern. For parallel flow patterns, the catchment size A depends on grid spacing, which finally causes a dependence of the results on the spatial resolution. Equation (8) avoids this problem because the first term is independent of A and the ratio of Q and A in the second term is independent of the spatial resolution.
As a main result, a self-organization of channels and hillslopes was found. While channel formation does not take place at a unique catchment size, the observed range of channel-forming catchment sizes depends on the values of κd and κt in relation to Kd and Kt.
Concerning the scope of this study, it should be kept in mind that assuming m=0 for hillslopes already defines planar hillslopes as a preferred morphology. For spatially uniform erosion, Eq. (8) turns into
with
and thus
Therefore, S is constant for spatially uniform erosion. So straight hillslope profiles are a preferred state in this model, in contrast to concave river profiles (for m>0) or convex hillslopes predicted by the diffusion equation.
Since straight hillslopes are already a part of the model concept, this study cannot address the question of why faceted topographies typically have little curvature. Instead, the key points are the geometrical properties (length, width, slope) of facets at normal faults and how they differ from hillslopes along rivers. Simple estimates for triangular facets in equilibrium will be derived analytically in the following section. In Sect. 5, numerical simulations will be performed in order to find out why normal faults facilitate the formation of triangular facets compared to vertical faults and how the drainage network affects the evolution.
Let us start by considering a river that crosses a normal fault (Fig. 3). If we assign the coordinate system to the footwall, the hanging wall moves at a velocity vh horizontally (to the left) and at a velocity vv vertically (downward). In the simplest scenario, the river erodes at a uniform erosion rate E into the footwall and neither erodes the hanging wall nor deposits sediments there. Then the erosion rate at the footwall can be described by Eq. (5) with the effective erodibility K defined in Eq. (6).
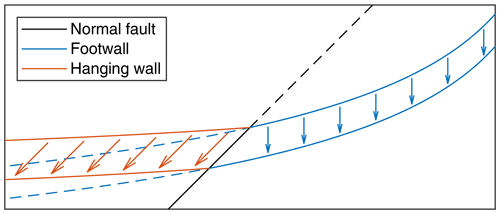
Figure 3Long profile of a river crossing a normal fault. Solid blue lines describe the river incising into the footwall at a constant rate. Dashed blue lines are the continuation of the profile into the hanging wall. Red lines describe the river at the hanging wall, which just follows the movement of the hanging wall.
Equation (1) can be transferred to this scenario by replacing tan θ with the channel slope . In combination with Eq. (5), we obtain
and for the linear version of the shared stream-power model (n=1),
Strictly speaking, the solution with a uniform erosion rate cannot exist since the channel slope decreases downstream at uniform erosion. However, S is typically much smaller than the tangent of the fault angle (Eq. 2), so the variation in erosion rate (and its difference towards vv) is small.
So horizontal displacement reduces the erosion rate and thus also the equilibrium channel slope at the footwall compared to a vertical fault. For large rivers, however, the effect is weak. If we assume a typical erodibility of K = 2.5 Myr−1 (e.g., Robl et al., 2017) for m=0.5 and n=1, horizontal movement with vh = 1 mm yr−1 reduces the channel slope only by 4 % for A = 100 km2.
For hillslopes, however, the effect of horizontal movement is stronger. The respective relations are readily obtained by replacing KAm with κ in Eqs. (12) and (13), which yields the relation
for the facet slope Sf, and for n=1
This relation can be written conveniently in terms of the dip angles α of the fault (Eq. 2) and of the facet (tan θ=Sf),
Figure 4 shows the obtained facet angle θ as a function of . The ratio has a strong influence on θ for n=1. A variation from to 1 covers the range from θ = 20° to 40° for α = 60°. We will see in Sect. 5 that κ = 0.75 mm yr−1 is a reasonable value. Then the respective range in total displacement vh is from 0.19 to 0.75 mm yr−1, equivalent to a total rate of displacement from 0.38 to 1.5 mm yr−1. The dependence of θ on becomes weaker for n>1. This means that we need a greater range in vh to explain a given variation in θ at constant α than for n=1.
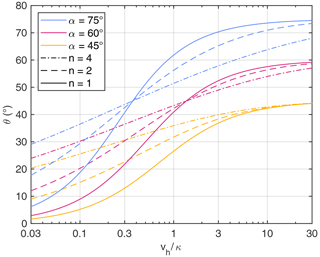
Figure 4Facet angle as a function of the ratio (Eq. 14 with tan θ=Sf) for different fault angles α and different values of the exponent n.
The length-to-width ratio of perfect triangular facets can also be determined analytically. Let us assume that the facet is bounded by two rivers flowing perpendicularly to the fault (Fig. 1b) with identical catchment sizes large enough to ensure that the effect of horizontal movement on their erosion rate is negligible. Then their erosion rate is E=vv and their channel slope is
Since the erosion rate of the hillslopes draining into these rivers must be the same, the respective slope of the hillslopes must be
If A is sufficiently large, the direction of steepest descent at the hillslopes is normal to the rivers. Then the height of the triple junction of the facet and the two hillslopes must be
with the baseline length b and the width w measured horizontally (Fig. 1b). Equation (19) yields the length-to-width ratio
with S from Eq. (17), Sh from Eq. (18), and Sf defined implicitly by Eq. (14). Using Eq. (15), this ratio can be computed analytically for n=1,
The second term in Eq. (21) can be neglected if the rivers are sufficiently large (KAm≫κ). Then the length-to-width ratio only depends on the ratio in the form
In this case, the ratio controls the ratio of the tangents of the dip angles (Eq. 16) as well as the shape of perfect triangular facets (Eq. 22).
If the rivers are small, the ratio comes in as a second control. This ratio describes erosion at hillslopes relative to erosion in channels. An increase in this ratio makes the facets wider in relation to their length.
Equation (21) can also be generalized to facets bounded by rivers with different catchment sizes. All considerations have to be made for the left-hand part and the right-hand part of the facet separately, where has to be replaced by the width of the respective part. Adding the two widths yields the relation
instead of Eq. (21), where A1 and A2 are the catchment sizes of the two rivers. As a major difference, the facets become asymmetric.
As mentioned in Sect. 2, there is still uncertainty about the value of the exponent n in stream-power erosion models. This uncertainty is even higher for the extension towards hillslopes since it is not clear whether the value of n is the same as for rivers. As a first validation of the approach and in order to get an estimate of n, the geometrical properties of facets at 10 normal faults in Greece and Bulgaria published by Tsimi and Ganas (2015) are used. The data listed in Table 1 consist of the mean values for each fault, taken over 13 to 66 facets.
Table 1Average data from 10 faults investigated by Tsimi and Ganas (2015). The last column contains the best-fit value of κ for n=1.
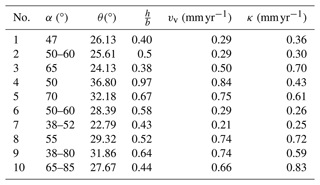
For each fault, the mean dip angle α is used as a given property. If a range is given, the mean value is used. The ratio is then adjusted for each fault individually to fit the slopes of the fault Sf=tan θ (Eq. 14 with ) and the hillslopes (Eq. 19, assuming S≪Sh). The deviations obtained for the 10 faults are shown in Fig. 5.
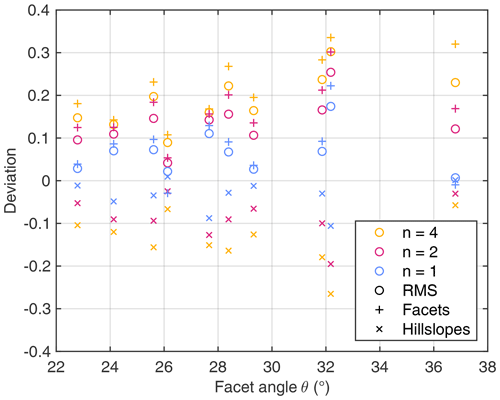
Figure 5Deviations in Sf (facets) and Sh (hillslopes) obtained by fitting the ratio for each of the faults considered by Tsimi and Ganas (2015). The root mean square (rms) deviation is computed from the deviations in Sf and Sh and is always positive, while the individual deviations may be positive or negative.
For all faults, the deviations for n=1 are lower than for n=2 and for n=4. This holds for the root mean square (rms) deviation as well as for the individual deviations in Sf and Sh. The deviations are smaller than 0.1 for 8 out of the 10 faults for n=1. The obtained R2 values range from 0.36 for n=4 to 0.89 for n=1.
The model systematically overestimates Sf and underestimates Sh and thus underestimates the difference between the two, except for two faults at n=1. These findings suggest that the best-fit exponent may even be n<1 for the data considered here. However, the data set is limited and should not be overrated. Furthermore, neglecting the channel slope S of the rivers causes a systematic bias. Taking S into account in Eq. (19) yields lower slopes Sh at a given baseline length b and height h. So the underestimation of the difference between Sh and Sf may at least partly arise from neglecting S. Nevertheless, the results tentatively suggest that n=1, which makes the model linear, is a reasonable choice for hillslopes rather than any value of n>1.
After fitting the for each fault, the respective hillslope erodibility κ can be estimated using the given throw rate vv. The obtained values cover a range from κ = 0.25 to 0.83 mm yr−1 (Table 1) with a mean value of 0.51 mm yr−1.
While the theoretical considerations from Sect. 3 predict some geometrical properties of faceted topographies, the role of the drainage network has to be explored numerically. In this section, the formation of triangular and multiangular facets, facet sizes, and the development of faceted topographies through time will be investigated.
5.1 Numerical setup
All simulations are based on the shared stream-power model with the extension for hillslopes described in Sect. 2 and the simplest parameter choices m=0.5 and n=1. As discussed by Hergarten and Pietrek (2023), converting nondimensional coordinates to real-world properties is particularly simple then since time, horizontal length scale, and height scale are completely independent.
All simulations were performed with the landform evolution model OpenLEM (Hergarten, 2024a) on a regular 6000 × 6000 grid. The southern and northern boundaries are kept at zero elevation and periodic boundary conditions are applied to the eastern and western boundaries. The only real-world length scale already included in the model design is that the grid spacing should be δx = 10 m. This is a quite high resolution compared to typical applications of large-scale landform evolution models, which was chosen in order to allow for simulating a large number of facets with a reasonable resolution, given that typical facet sizes are roughly a few hundred meters.
The timescale and the height scale are in principle arbitrary and all results can be rescaled afterwards. As the dimension of the erodibilities is inverse time, the timescale is immediately defined by the real-world values of the erodibilities. Since the findings of Guerit et al. (2019) suggest Kd≈Kt, is a convenient choice in nondimensional coordinates. Then the effective erodibility is K=1 according to Eq. (6). If we define, e.g., K = 2.5 Myr−1 (Robl et al., 2017), as a real-world erodibility, one nondimensional time unit corresponds to a time span of = 0.4 Myr. This timescale is used for illustration in the following, keeping in mind that it could be adjusted easily. A vertical length scale of 2 m is used for convenience, which could also be adjusted easily.
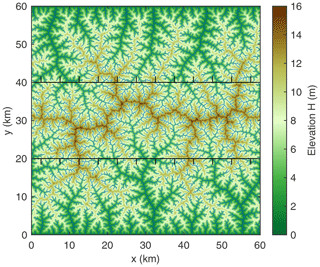
An equilibrium topography with a uniform uplift rate of U=1 (2 m per 0.4 Myr with the scaling defined above) is the starting point of all simulations. The respective topography is shown in Fig. 6. As discussed by Hergarten and Pietrek (2023), the model with the hillslope extension does not yield steady-state topographies in the strict sense. Using a time increment of , there are still about 133 000 changes in flow direction per time step (about 0.4 % of all sites), but the maximum change in elevation is constantly below 10−15 and therefore within the numerical precision. Overall, the relief of the equilibrium topography is small, which means that it is mainly a prescribed drainage pattern on an almost flat topography.
The hillslope erodibilities κd and κt are the only nontrivial parameter choices. For m=0.5, their dimension is length per time. So the ratio of the effective erodibilities (Eqs. 6 and 10) defines a length scale, which controls channelization. In this study, l = 300 m (30 pixels) is assumed. This choice yields a drainage density (total channel length per area) of 1.09 km−1. For simplicity, is assumed.
A horst structure bounded by two normal faults is considered in all simulations (Fig. 6). The two faults are located at y = 20 km and y = 40 km for H=0, and the rates of displacement vv and vh define the inclination of the fault plane. While the entire domain (including the fault plane) is still uplifted at the low rate U, all material above the fault plane (including the boundaries) is continuously lowered at the throw rate vv and moved towards the boundaries at the velocity vh.
Since the model OpenLEM assumes a fixed regular grid, displacement is performed in discrete steps of one grid spacing. This means that all material above the fault plane is moved towards the boundaries after time intervals of . In order to reduce potential artifacts arising from the discrete steps, data are only evaluated at times in the middle between steps of displacement.
Due to the linearity of the model for n=1, vv only defines how steep the topography will become but has no further effect, provided that it is much higher than U. A throw rate of vv=100 (0.5 mm yr−1 with the scaling defined above) is assumed in all simulations, while the effect of vh will be investigated.
In order to keep the analysis simple, facets are defined by their drainage pattern and not by their planar shape at first. In this sense, a facet is a continuous set of hillslope nodes at the footwall that drains directly to the outcrop line of the fault without forming a channel. Since small transient channels form occasionally close to the fault, channels reaching less than 100 m (10 pixels) into the footwall are disregarded. Formally, facets defined this way are just hillslopes, and their planar shape will be investigated afterwards.
5.2 Vertical faults
As a first step towards understanding the formation of faceted topographies, vertical faults are considered, although they are of limited geological relevance. Since there is no horizontal displacement, there is no need to displace the hanging walls in discrete steps as described in the previous section. A continuous vertical displacement at the faults is assumed, which means that the northern and southern parts of the domain (y < 20 km and y > 40 km) are continuously lowered.

Figure 7Formation of facets at the two vertical faults. Colored lines are the map projections of the outlines of the facets. Only the part of the domain around the faults is shown.
Figure 7 shows the evolution of facets (without regard for their planar shape) at different times. As the most striking result, the evolution is fast in the beginning but ceases soon. While a few triangular facets form, large parts of the faceted area consist of multiangular facets with baseline lengths b of up to several kilometers. Breaking these long facets into smaller, potentially more triangular facets seems to be impossible.
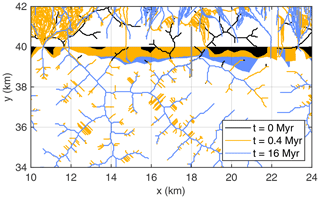
The persistence of these long, multiangular facets is related to the persistence of the drainage pattern. Figure 8 shows the change in drainage pattern around the longest facet. The occurrence of this facet is related to a river flowing almost parallel to the fault for about 10 km. The biggest changes in the drainage pattern occur in the hanging wall. As a permanent effect, rivers draining from the hanging wall across the fault are rapidly disconnected. Furthermore, the drainage pattern on the hanging wall becomes quite irregular and changes rapidly. These changes reflect frequent avulsions of channels in a phase of strong deposition of sediments due to the increased sediment flux from the footwall. Most of these channels have small catchment sizes but are still detected by the criterion based on morphology. Some transient effects also occur on the footwall, where rapid incision temporarily generates channels in the hillslopes. These transient changes are, however, not able to modify the drainage pattern on the footwall permanently.
The effect of the more or less persistent river pattern becomes visible in the north–south profile shown in Fig. 9. At t = 0.2 Myr, relief is still small across the section on the footwall. This part of the domain has mainly been uplifted by 100 m without changes in erosion rate. At t = 0.4 Myr, however, the river crossing the profile at y≈ 39.2 km has already incised into the footwall. This incision finally inhibits the growth of the facet. The hillslopes draining towards this river and towards the fault become planar (straight in the profile) soon. Since the erosion rate of the river finally equals the fault throw rate, erosion rates are the same at both hillslopes, resulting in identical slope angles. The drainage divide does not move in this situation, which means that the facet is somehow locked and cannot change much.
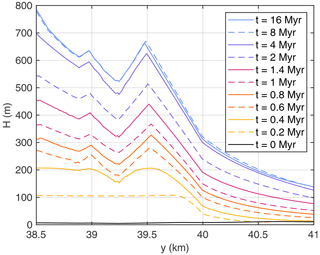
Figure 9Topographic profiles along the gray line shown in Fig. 8. The height H is measured relative to the boundary of the domain.
The retarded incision of the river into the footwall is related to knickpoint migration starting from the fault. As discussed by Hergarten (2021), knickpoints migrate upstream at a speed KdAm in the shared stream-power model for n=1. Similarly, the speed is κd at hillslopes. As long as the rivers are not too small, knickpoint migration in rivers is much faster than on hillslopes. The intersection of the river with the profile shown in Fig. 9 (x = 18 km, y≈ 39.2 km) is more than 7 km away (along the river) from its intersection with the fault (x≈ 11.6 km, y = 40 km). Since incision is already visible at t = 0.4 Myr in Fig. 9, the knickpoint needs less than 0.4 Myr to travel along the river. In turn, the direct distance from the fault is about 0.8 km. With the scaling defined above (κd=2κ = 1.5 mm yr−1), knickpoint migration from the fault to the river along a hillslope would take more than 0.5 Myr. If this time was shorter than the time along the river, a part of the river could be captured and then drain directly towards the fault, which would dissect the long facet. This example with a quite long river close to the fault, however, shows that this process is unlikely so that the long facets tend to persist.
5.3 Normal faults
While knickpoint migration in the rivers at the footwall is basically the same as described in the previous section, the erosion rates at hillslopes facing towards the fault and towards the rivers on the footwall differs. Since the rivers on the footwall define the base level for the respective hillslopes, these hillslopes adopt the erosion rates of the rivers. As found in Sect. 3, this erosion rate is only slightly lower than the throw rate of the fault. In turn, the erosion rate of the facets is considerably lower. As a consequence, the drainage divide moves permanently towards the respective fault. Since the outcrop of the fault also migrates, it could be said that the facets slide down the exhumed footwall at the horizontal velocity vh.

Figure 10Formation of facets at the two normal faults for . Colored lines are the map projections of the outlines of the facets. Only the part of the domain around the faults is shown.
Figure 10 shows the formation of faceted areas for a moderate rate of horizontal displacement, . With the scaling defined above, this rate is vh = 0.25 mm yr−1. It it immediately recognized that the original outcrop lines of the faults (at y = 20 km and y = 40 km) play an important role in the evolution of facets. Several large facets still cross the respective line at t = 4 Myr. While the majority of these facets are multiangular, the parts of their outlines below the original outcrop line are already straight. In turn, all facets are entirely located on the exhumed and eroded fault plane at t = 16 Myr and are triangular.
The different morphologies of the facets above and below the original outcrop line arise from the different flow patterns. As shown in Fig. 11, the channel pattern on the exhumed and eroded footwall (between the original and the actual outcrop line) is totally different from that in the rest of the domain. It consists of more or less straight rivers normal to the fault, which form on the pristine exhumed surface. In contrast, the channel pattern upstream of the original outcrop is almost unaffected, similar to the situation at the vertical fault considered in Sect. 5.2, owing to the persistence of the existing pattern.
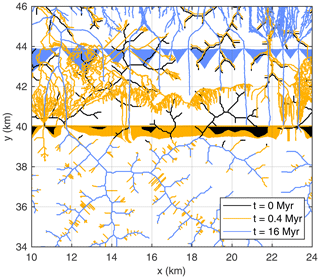
Figure 11Evolution of the channel pattern for around the fault segment shown in Fig. 8. Facets are represented by filled areas with colors corresponding to the channel pattern at the respective time.
Asymmetric triangular facets are visible at x≈ 12 km and at x≈ 17 km, where the rivers at both sides of the facets differ strongly in length and thus also in catchment size. Returning to Fig. 10, however, it is recognized that strongly asymmetric facets are rare in this scenario.
The transition from multiangular to triangular facets is also visible in the analysis of the facet sizes shown in Fig. 12. Long facets form rapidly in the beginning, and their width increases through time. Long facets are finally separated into smaller facets, causing an increase in the number of facets between t = 4 Myr and t = 16 Myr. The ratio of baseline length and horizontal width approaches the theoretical relation for large rivers (Eq. 22) during this phase. The mean and median baseline length is about 1.4 km at t = 16 Myr, with a standard deviation of about 0.6 km.
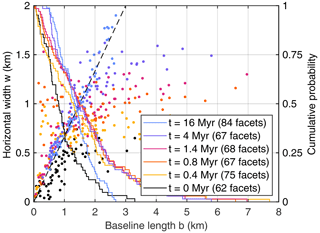
Figure 12Facet sizes for . Each dot refers to an individual facet, and the dashed line describes the theoretical relation between baseline length and horizontal width for large rivers (Eq. 22). Solid lines show the inverse cumulative probability of the baseline length, i.e., the probability that a randomly picked facet has a baseline length of at least b.
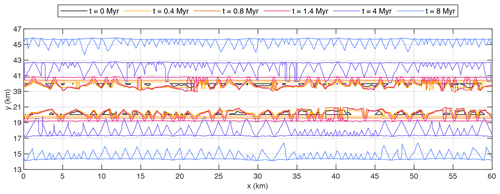
Figure 13Formation of facets at the two normal faults for vh=κ. Colored lines are the map projections of the outlines of the facets. Only the part of the domain around the faults is shown.
Figure 13 shows the formation of faceted areas for a faster horizontal displacement with vh=κ (0.75 mm yr−1 with the scaling defined above). In order not to come too close to the boundary, the last state is t = 8 Myr instead of t = 16 Myr.
The behavior is qualitatively similar to that observed for the lower rate of displacement. Figure 14, however, reveals that the geometry of the facets is different. While Eq. (22) predicts for the previous scenario (), it predicts w=b here. In turn, the facets are shorter now, with a mean and median baseline length of about 1 km at t = 8 Myr. This shortening almost compensates for the different length-to-width ratio so that the horizontal width is about 1 km on average in both scenarios.
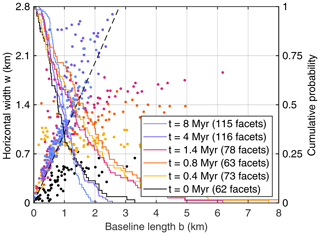
Figure 14Facet sizes for vh=κ. Each dot refers to an individual facet, and the dashed line describes the theoretical relation between baseline length and horizontal width for large rivers (Eq. 22). Solid lines show the inverse cumulative probability of the baseline length.
As discussed in Sect. 3 (Eq. 23), smaller catchment sizes of the rivers reduce the ratio , corresponding to a shift to the left compared to the dashed straight line in Fig. 14. This trend is clearly visible here, while it is not in Fig. 12. The stronger trend for faster horizontal displacement arises from the decrease in the first term in Eq. (23) with increasing vh, which increases the effect of the finite catchment size. As a further consequence, the tendency towards asymmetric facets becomes stronger, which is visible to some extent in Fig. 14 in comparison to Fig. 12.
Finally, the topography of the faceted areas is investigated in Fig. 15, where a single profile is plotted across the largest facet at the northern fault for each scenario (vh=0, , and vh=κ) and each time. While the profiles show a convex curvature at early times, they become more or less straight at t = 4 Myr for all considered scenarios, indicating a planar shape of the facets. So the transition from convex hillslopes to planar facets appears to be independent of the horizontal displacement rate. In particular, the transition from convex to planar hillslopes appears to be at least as fast as the transition from multiangular to triangular areas.
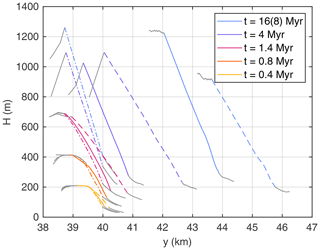
Figure 15North–south profiles across the largest facets at the northern fault, taken along the line of greatest width. Solid lines refer to , dashed lines to vh=κ (with t = 8 Myr instead of t = 16 Myr), and dash-dotted lines to vh=0. For illustration, the profiles are extended by 500 m beyond the facets (gray lines).
In this study, the shared stream-power model was used in combination with a recently published extension for hillslopes (Hergarten and Pietrek, 2023) for modeling the evolution of faceted topographies at normal faults. A first validation based on data published by Tsimi and Ganas (2015) yielded a better fit for the linear version of the model than for nonlinear versions with exponents n>1. However, this result only applies to the exponent in the stream-power model used for the hillslopes, while the exponent may be different in the fluvial regime.
Two theoretical relations for the geometry of perfect triangular facets were derived. The first relation (Eq. 16) refers to the cross-sectional geometry and describes the ratio of the tangents of the facet angle θ and the dip angle α of the fault. The second relation (Eq. 21 or 23) describes the ratio of baseline length and horizontal width (normal to the baseline).
As a major result, the nondimensional ratio of the horizontal rate of displacement vh and the hillslope erodibility κ is the only parameter in both relations. Strictly speaking, this holds for the second relation only in the limit of infinite catchment sizes of the rivers between the facets (Eq. 22). The facets become relatively wider for finite catchment sizes and become asymmetric if the catchment sizes of the adjacent rivers differ. These effects become stronger with increasing rate of displacement.
The formation of facets and the question whether triangular or multiangular facets are preferred had to be addressed numerically. The persistence of the drainage network in the region upstream of the fault plays a central part in this context. The limited ability to modify the existing channel network inhibits the expansion of facets into this region. In turn, a new drainage network is created on the exhumed fault plane, allowing for the formation of facets. These facets are shifted downslope through time and typically achieve a triangular shape as soon as they are entirely located on the exhumed fault plane. For this reason, vertical faults produce long and narrow multiangular facets rather than triangular facets.
The size of the facets varies strongly even after they have achieved a triangular shape. While the mean baseline length decreases with increasing horizontal displacement rate, the horizontal width does not change much on average. The absolute size depends on the ratio of hillslope erodibility and fluvial erodibility, which was = 300 m in the simulations. This value yielded a drainage density of 1.09 km−1 and a mean horizontal facet width of about 1 km. These properties can be rescaled by changing the ratio . Increasing this ratio by a given factor reduces the drainage density and increases the facet sizes by the same factor.
Overall, the shared stream-power model with the extension for hillslopes appears to be able to explain the formation of faceted topographies and the geometric properties of individual facets reasonably well. It should, however, be kept in mind that the model already includes planar hillslopes as a preferred state, in contrast to convex hillslopes predicted by the widely used diffusion approach.
All codes are available in a Zenodo repository at https://doi.org/10.5281/zenodo.10473156 (Hergarten, 2024b). This repository also contains the data obtained from the numerical simulations. Users who are interested in using the landform evolution model OpenLEM in their own research are advised to download the most recent version from http://hergarten.at/openlem (Hergarten, 2024a). The author is happy to assist interested readers in reproducing the results and performing subsequent research.
A video showing the evolution of the topography is available at http://hergarten.at/openlem/facets (Hergarten, 2024a).
The author has declared that there are no competing interests.
Publisher's note: Copernicus Publications remains neutral with regard to jurisdictional claims made in the text, published maps, institutional affiliations, or any other geographical representation in this paper. While Copernicus Publications makes every effort to include appropriate place names, the final responsibility lies with the authors.
The author would like to thank the two reviewers for their comments and Greg Hancock for the editorial handling.
This research has been supported by the Deutsche Forschungsgemeinschaft (grant no. 432703650).
This open-access publication was funded by the University of Freiburg.
This paper was edited by Greg Hancock and reviewed by two anonymous referees.
Adams, B. A., Whipple, K. X., Forte, A. M., Heimsath, M., and Hodges, K. V.: Climate controls on erosion in tectonically active landscapes, Sci. Adv., 6, eaaz3166, https://doi.org/10.1126/sciadv.aaz3166, 2020. . a
Castelltort, S. and Simpson, G.: River spacing and drainage network growth in widening mountain ranges, Basin Res., 18, 267–276, https://doi.org/10.1111/j.1365-2117.2006.00293.x, 2006. a
Davy, P. and Lague, D.: Fluvial erosion/transport equation of landscape evolution models revisited, J. Geophys. Res.-Earth, 114, F03007, https://doi.org/10.1029/2008JF001146, 2009. a
Densmore, A. L., Ellis, M. A., and Anderson, R. S.: Landsliding and the evolution of normal-fault-bounded mountains, J. Geophys. Res., 103, 15203–15219, https://doi.org/10.1029/98JB00510, 1998. a, b
Ellis, M. A., Densmore, A. L., and Anderson, R. S.: Development of mountainous topography in the Basin Ranges, USA, Basin Res., 11, 21–41, https://doi.org/10.1046/j.1365-2117.1999.00087.x, 1999. a, b
Fernandes, N. F. and Dietrich, W. E.: Hillslope evolution by diffusive processes: The timescale for equilibrium adjustments, Water Resour. Res., 33, 1307–1318, https://doi.org/10.1029/97WR00534, 1997. a
Guerit, L., Yuan, X. P., Carretier, S., Bonnet, S., Rohais, S., Braun, J., and Rouby, D.: Fluvial landscape evolution controlled by the sediment deposition coefficient: Estimation from experimental and natural landscapes, Geology, 47, 853–856, https://doi.org/10.1130/G46356.1, 2019. a, b
Harel, M.-A., Mudd, S. M., and Attal, M.: Global analysis of the stream power law parameters based on worldwide 10Be denudation rates, Geomorphology, 268, 184–196, https://doi.org/10.1016/j.geomorph.2016.05.035, 2016. a
Hergarten, S.: Rivers as linear elements in landform evolution models, Earth Surf. Dynam., 8, 367–377, https://doi.org/10.5194/esurf-8-367-2020, 2020a. a
Hergarten, S.: Transport-limited fluvial erosion – simple formulation and efficient numerical treatment, Earth Surf. Dynam., 8, 841–854, https://doi.org/10.5194/esurf-8-841-2020, 2020b. a
Hergarten, S.: The influence of sediment transport on stationary and mobile knickpoints in river profiles, J. Geophys. Res.-Earth, 126, e2021JF006218, https://doi.org/10.1029/2021JF006218, 2021. a
Hergarten, S.: OpenLEM, [code], http://hergarten.at/openlem (last access: 18 July 2024), 2024a. a, b, c
Hergarten, S.: A simple model for faceted topographies at normal faults, Zenodo [code and data set], https://doi.org/10.5281/zenodo.10473156, 2024b. a
Hergarten, S. and Pietrek, A.: Self-organization of channels and hillslopes in models of fluvial landform evolution and its potential for solving scaling issues, Earth Surf. Dynam., 11, 741–755, https://doi.org/10.5194/esurf-11-741-2023, 2023. a, b, c, d, e, f
Hilley, G. E., Porder, S., Aron, F., Baden, C. W., Johnstone, S. A., Liu, F., Sare, R., Steelquist, A., and Young, H. H.: Earth's topographic relief potentially limited by an upper bound on channel steepness, Nat. Geosci., 12, 828–832, https://doi.org/10.1038/s41561-019-0442-3, 2019. a
Hovius, N.: Regular spacing of drainage outlets from linear mountain belts, Basin Res., 8, 29–44, https://doi.org/10.1111/j.1365-2117.1996.tb00113.x, 1996. a
Lague, D.: The stream power river incision model: evidence, theory and beyond, Earth Surf. Proc. Land., 39, 38–61, https://doi.org/10.1002/esp.3462, 2014. a, b
Menges, C. M.: Soils and geomorphic evolution of bedrock facets on a tectonically active mountain front, western Sangre de Cristo Mountains, New Mexico, Geomorphology, 3, 301–332, https://doi.org/10.1016/0169-555X(90)90009-F, 1990. a
O'Callaghan, J. F. and Mark, D. M.: The extraction of drainage networks from digital elevation data, Comput. Vision Graph., 28, 323–344, https://doi.org/10.1016/S0734-189X(84)80011-0, 1984. a
Pelletier, J. D.: Minimizing the grid-resolution dependence of flow-routing algorithms for geomorphic applications, Geomorphology, 122, 91–98, https://doi.org/10.1016/j.geomorph.2010.06.001, 2010. a
Perron, J. T., Dietrich, W. E., and Kirchner, J. W.: Controls on the spacing of first-order valleys, J. Geophys. Res.-Earth, 113, F04016, https://doi.org/10.1029/2007JF000977, 2008. a, b
Perron, J. T., Kirchner, J. W., and Dietrich, W. E.: Formation of evenly spaced ridges and valleys, Nature, 460, 502–505, https://doi.org/10.1038/nature08174, 2009. a
Petit, C., Gunnell, Y., Gonga-Saholiariliva, N., Meyer, B., and Séguinot, J.: Faceted spurs at normal fault scarps: Insights from numerical modeling, J. Geophys. Res., 114, B05403, https://doi.org/10.1029/2008JB005955, 2009. a, b, c
Robl, J., Hergarten, S., and Prasicek, G.: The topographic state of fluvially conditioned mountain ranges, Earth Sci. Rev., 168, 290–317, https://doi.org/10.1016/j.earscirev.2017.03.007, 2017. a, b
Roering, J. J., Kirchner, J. W., and Dietrich, W. E.: Evidence for nonlinear, diffusive sediment transport on hillslopes and implications for landscape morphology, Water Resour. Res., 35, 853–870, https://doi.org/10.1029/1998WR900090, 1999. a
Selby, M. J.: Earth's Changing Surface: An Introduction to Geomorphology, Clarendon Press, Oxford, ISBN 9780198232513, 1985. a
Tsimi, C. and Ganas, A.: Using the ASTER global DEM to derive empirical relationships among triangular facet slope, facet height and slip rates along active normal faults, Geomorphology, 234, 171–181, https://doi.org/10.1016/j.geomorph.2015.01.018, 2015. a, b, c, d
Tucker, G. E., McCoy, S. W., Whittaker, A. C., Roberts, G. P., Lancaster, S. T., and Phillips, R.: Geomorphic significance of postglacial bedrock scarps on normal-fault footwalls, J. Geophys. Res.-Earth, 116, F01022, https://doi.org/10.1029/2010JF001861, 2011. a
Tucker, G. E., Hobley, D. E. J., McCoy, S. W., and Struble, W. T.: Modeling the shape and evolution of normal-fault facets, J. Geophys. Res.-Earth, 125, e2019JF005305, https://doi.org/10.1029/2019JF005305, 2020. a, b, c
Whipple, K. X. and Tucker, G. E.: Implications of sediment-flux-dependent river incision models for landscape evolution, J. Geophys. Res., 107, 2039, https://doi.org/10.1029/2000JB000044, 2002. a
Whipple, K. X., DiBiase, R. A., and Crosby, B. T.: Bedrock rivers, in: Fluvial Geomorphology, vol. 9 of Treatise on Geomorphology, edited by Shroder, J. and Wohl, E., Academic Press, San Diego, CA, https://doi.org/10.1016/B978-0-12-374739-6.00254-2, pp. 550–573, 2013. a
Wilkinson, M., Roberts, G. P., McCaffrey, K., Cowie, P. A., Faure Walker, J. P., Papanikolaou, I., Phillips, R. J., Michetti, A. M., Vittori, E., Gregory, L., Wedmore, L., and Watson, Z. K.: Slip distributions on active normal faults measured from LiDAR and field mapping of geomorphic offsets: an example from L'Aquila, Italy, and implications for modelling seismic moment release, Geomorphology, 237, 130–141, https://doi.org/10.1016/j.geomorph.2014.04.026, 2015. a


