the Creative Commons Attribution 4.0 License.
the Creative Commons Attribution 4.0 License.
 | 18 Jan 2024
Past anthropogenic land use change caused a regime shift of the fluvial response to Holocene climate change in the Chinese Loess Plateau
Hao Chen
Xianyan Wang
Yanyan Yu
Huayu Lu
Ronald Van Balen
The Wei River catchment in the southern part of the Chinese Loess Plateau (CLP) is one of the centers of the agricultural revolution in China. The area has experienced intense land use changes since ∼6000 BCE, which makes it an ideal place to study the response of fluvial systems to past anthropogenic land cover change (ALCC). We apply a numerical landscape evolution model that combines the Landlab landscape evolution model with an evapotranspiration model to investigate the direct and indirect effects of ALCC on hydrological and morphological processes in the Wei River catchment since the mid-Holocene. The results show that ALCC has not only led to changes in discharge and sediment load in the catchment but also affected their sensitivity to climate change. When the proportion of agricultural land area exceeded 50 % (around 1000 BCE), the sensitivity of discharge and sediment yield to climate change increased abruptly indicating a regime change in the fluvial catchment. This was associated with a large sediment pulse in the lower reaches. The model simulation results also show a link between human settlement, ALCC and floodplain development: changes in agricultural land use led to downstream sediment accumulation and floodplain development, which in turn resulted in further spatial expansion of agriculture and human settlement.
- Article
(11426 KB) - Full-text XML
-
Supplement
(15708 KB) - BibTeX
- EndNote


The Chinese Loess Plateau (CLP) located in central China is heavily affected by soil erosion (Wang et al., 2006; Bloemendal et al., 2008; Zhao et al., 2013), which is caused both by climate change and by the development of agriculture that started a few thousand years ago (He et al., 2002; Huang et al., 2006; Y. Chen et al., 2015; Chen et al., 2021). However, the exact impact of these changes and the mechanisms involved remain largely unknown, especially for the time period around 1000 BCE when a sediment pulse associated with the soil erosion occurred in the CLP river systems (Song et al., 2020). The Wei River catchment, located in the southeastern part of the CLP, is one of the most important sediment transport routes between the CLP and the Yellow River (Fig. 1). Past anthropogenic land use change, starting 8000 years ago (Li et al., 2009; Zhuang and Kidder, 2014), makes the Wei River catchment an ideal place for investigating the interplay between climate change and human activities since the mid-Holocene.
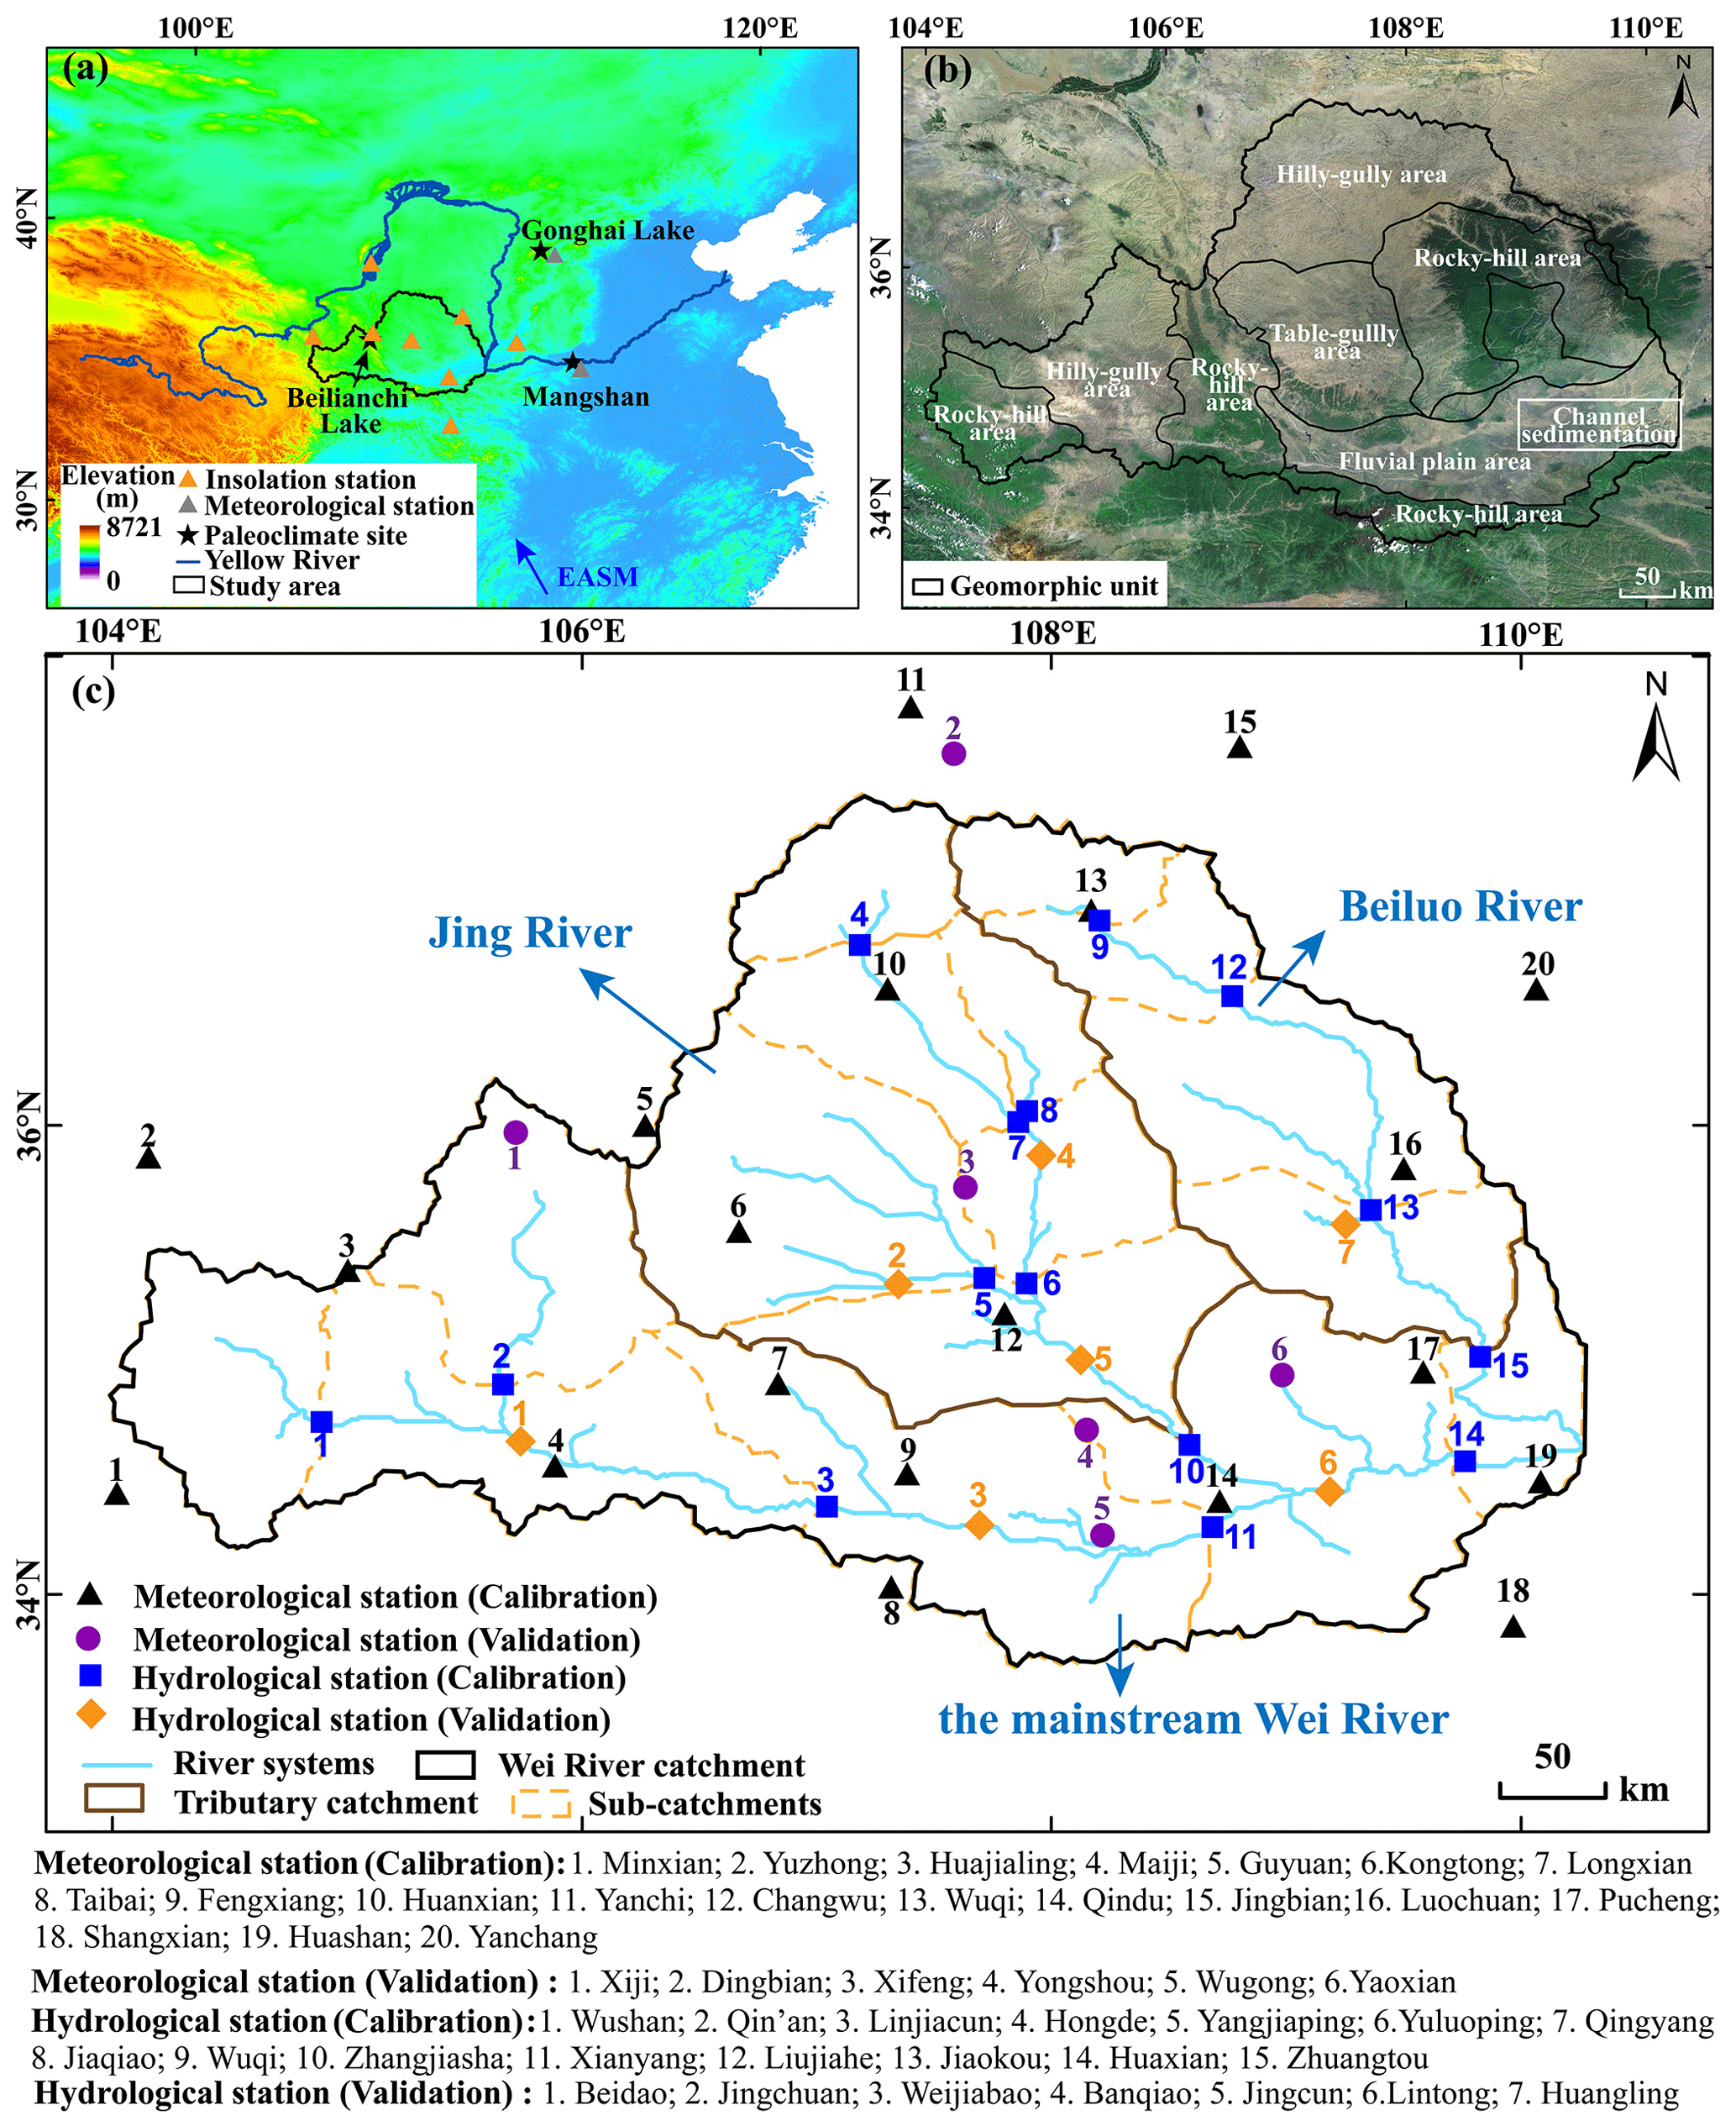
Figure 1The Wei River catchment: (a) location of the Wei River and Yellow River; (b) landform types in the catchment; (c) meteorological stations, hydrological stations and rivers in and around the Wei River catchment. The topographic map used in (a) is extracted from the NASA SRTM 90 m digital elevation model (Rabus et al., 2003); the satellite imagery used in (b) is from GoogleEarth map (https://www.earthol.com/, last access: 10 December 2022).
Recent studies have raised the possibility that increasing anthropogenic stress on a fluvial catchment may increase its vulnerability to future extreme climate events, e.g., floods and droughts, since the resilience of the river system may be reduced by human activities, thus allowing it to cross a tipping point (Best and Darby, 2020; Choudhury et al., 2022). Studying the history of a river catchment can provide insight into the effects of anthropogenic perturbations that are likely to unfold in its evolution (Macklin and Lewin, 2019). However, the response of fluvial catchments to external perturbations is not straightforward, but includes non-linearities and feedback (Broothaerts et al., 2014; Guo et al., 2016; Verstraeten et al., 2017). Moreover, a regime shift of a fluvial catchment is difficult to notice, since gradual changes may alter the resilience of a fluvial catchment with only a small effect on the current state (Scheffer et al., 2001). As a result, the extent to which the vulnerability of a fluvial catchment is affected by human-induced changes (e.g., land use change) and the moment when the threshold is crossed remains unclear. In addition, unraveling the mechanisms governing the response of a fluvial catchment to multiple, simultaneous forcings is notoriously difficult, especially in large river systems, where external factors and their effects are unique in each catchment and even in each river reach (Mao and Cherkauer, 2009; Fuller et al., 2015; Verstraeten et al., 2017; Macklin and Lewin, 2019).
Therefore, landscape evolution models (LEMs) have been widely used to investigate the development of fluvial morphology under the impact of external disturbance (Tucker and Hancock, 2010; Van Balen et al., 2010; Coulthard and Van de Wiel, 2013; Pan et al., 2021; Zhao et al., 2022a,b). They have been used to study the influence of vegetation (Istanbulluoglu and Bras, 2005; Carriere et al., 2019), climate (Routschek et al., 2014; Manley et al., 2020), and their combined effects (Schmid et al., 2018; Sharma et al., 2021). For example, Sharma et al. (2021) found that the effect of Milankovitch periodicity variations on erosion is lower in sparsely vegetated landscape than in densely vegetated landscape. However, the changes in fluvial response to climatic variations caused by land use change still need further study.
In this study, we combine the Landlab LEM (Hobley et al., 2017; Barnhart et al., 2020) with an evapotranspiration model (Thornton et al., 2002) to simulate the temporal and spatial changes of discharge and sediment yield in the Wei River catchment of the CLP, from 6000 BCE to 1850 AD. In the simulations, we apply spatially and temporally varying precipitation and temperature, based on paleo-climate records (F. Chen et al., 2015; Peterse et al., 2011). The changes of anthropogenic land use are taken from Kaplan et al. (2011). Their KK10 database provides the anthropogenic land cover change from 8000 years ago to 1850 AD, based on a model that relates changes of global population to past land use (Kaplan et al., 2009). We specifically address the fluvial regime shift of the Wei River response to climate change, as a result of land use change.
2.1 Geographic setting
As the largest tributary of the Yellow River, the Wei River is 818 km long and has a total drainage area of about 1.35×10⁵ km2 (Guo et al., 2016) (Fig. 1a). The headwaters of the river are located in the Niaoshushan Mountains, in the western part of the CLP (Chang et al., 2016; Jia et al., 2021) (Fig. 1b). The Wei River catchment is located at the transitional zone of arid (north) to humid (south) areas. The catchment has an average annual precipitation of 500–700 mm and belongs to the East Asian monsoon region. The precipitation mainly occurs from June to September (Jia et al., 2021). The mean annual temperature ranges from 7.8 to 13.5∘ (Tian et al., 2022). The mean annual discharge and sediment load of the Wei River are 7.5×10⁹ m3 and 3.9×10⁸ t (from 1956 to 2010), respectively (Chang et al., 2016). The natural vegetation cover in the catchment changes from deciduous broadleaf forest in the east to the temperate steppe in the west (Zhou et al., 2015), and about 50 % of the valley area is cultivated (Yu et al., 2016).
The northern part of the Wei River catchment is located in the southern part of the CLP and is mainly covered by loess (Liu, 1985; Li and Lu, 2010). The tributaries draining the CLP are relatively long and contribute large amounts of sediment (Fig. 1c) (Chang et al., 2016; Jia et al., 2021). The two major tributaries of the Wei River are located here, the Jing River and the Beiluo River (Fig. 1c). The southern part of the catchment lies in the northern Qin Ling and has relatively short tributaries characterized by flash flows (Fig. 1c) (Jia et al., 2021). There are four types of landforms in the catchment: “hilly-gully”, “rocky-hill”, “table-gully” and “fluvial-plain” areas. These landforms also have different vegetation covers (Fig. 1b) (Yang, 2020). The “hilly-gully area” is located in the upper reaches of the main stream of the Wei River and in the northern part of the catchment (Fig. 1b). The widely distributed steep gullies in these areas cause a significant sediment yield (Chen et al., 2016; J. Zhang et al., 2020; Tian et al., 2022). The “rocky-hill area” includes the west-central and southern portions of the catchment (Fig. 1b). The drainage divide between the Jing River and the Beiluo River also belongs to this “rocky-hill area” (Fig. 1b). It has a long history with high forest cover (Zhang et al., 2017). The central parts of the Jing River and Beiluo River belong to the “table-gully area” (Fig. 1b), which is a high platform surrounded by gullies (Chen et al., 2016). The middle and lower reaches of the main stream of the Wei River belong to the “fluvial-plain area” (Fig. 1b). They are mainly covered by alluvial deposits.
2.2 Land use history
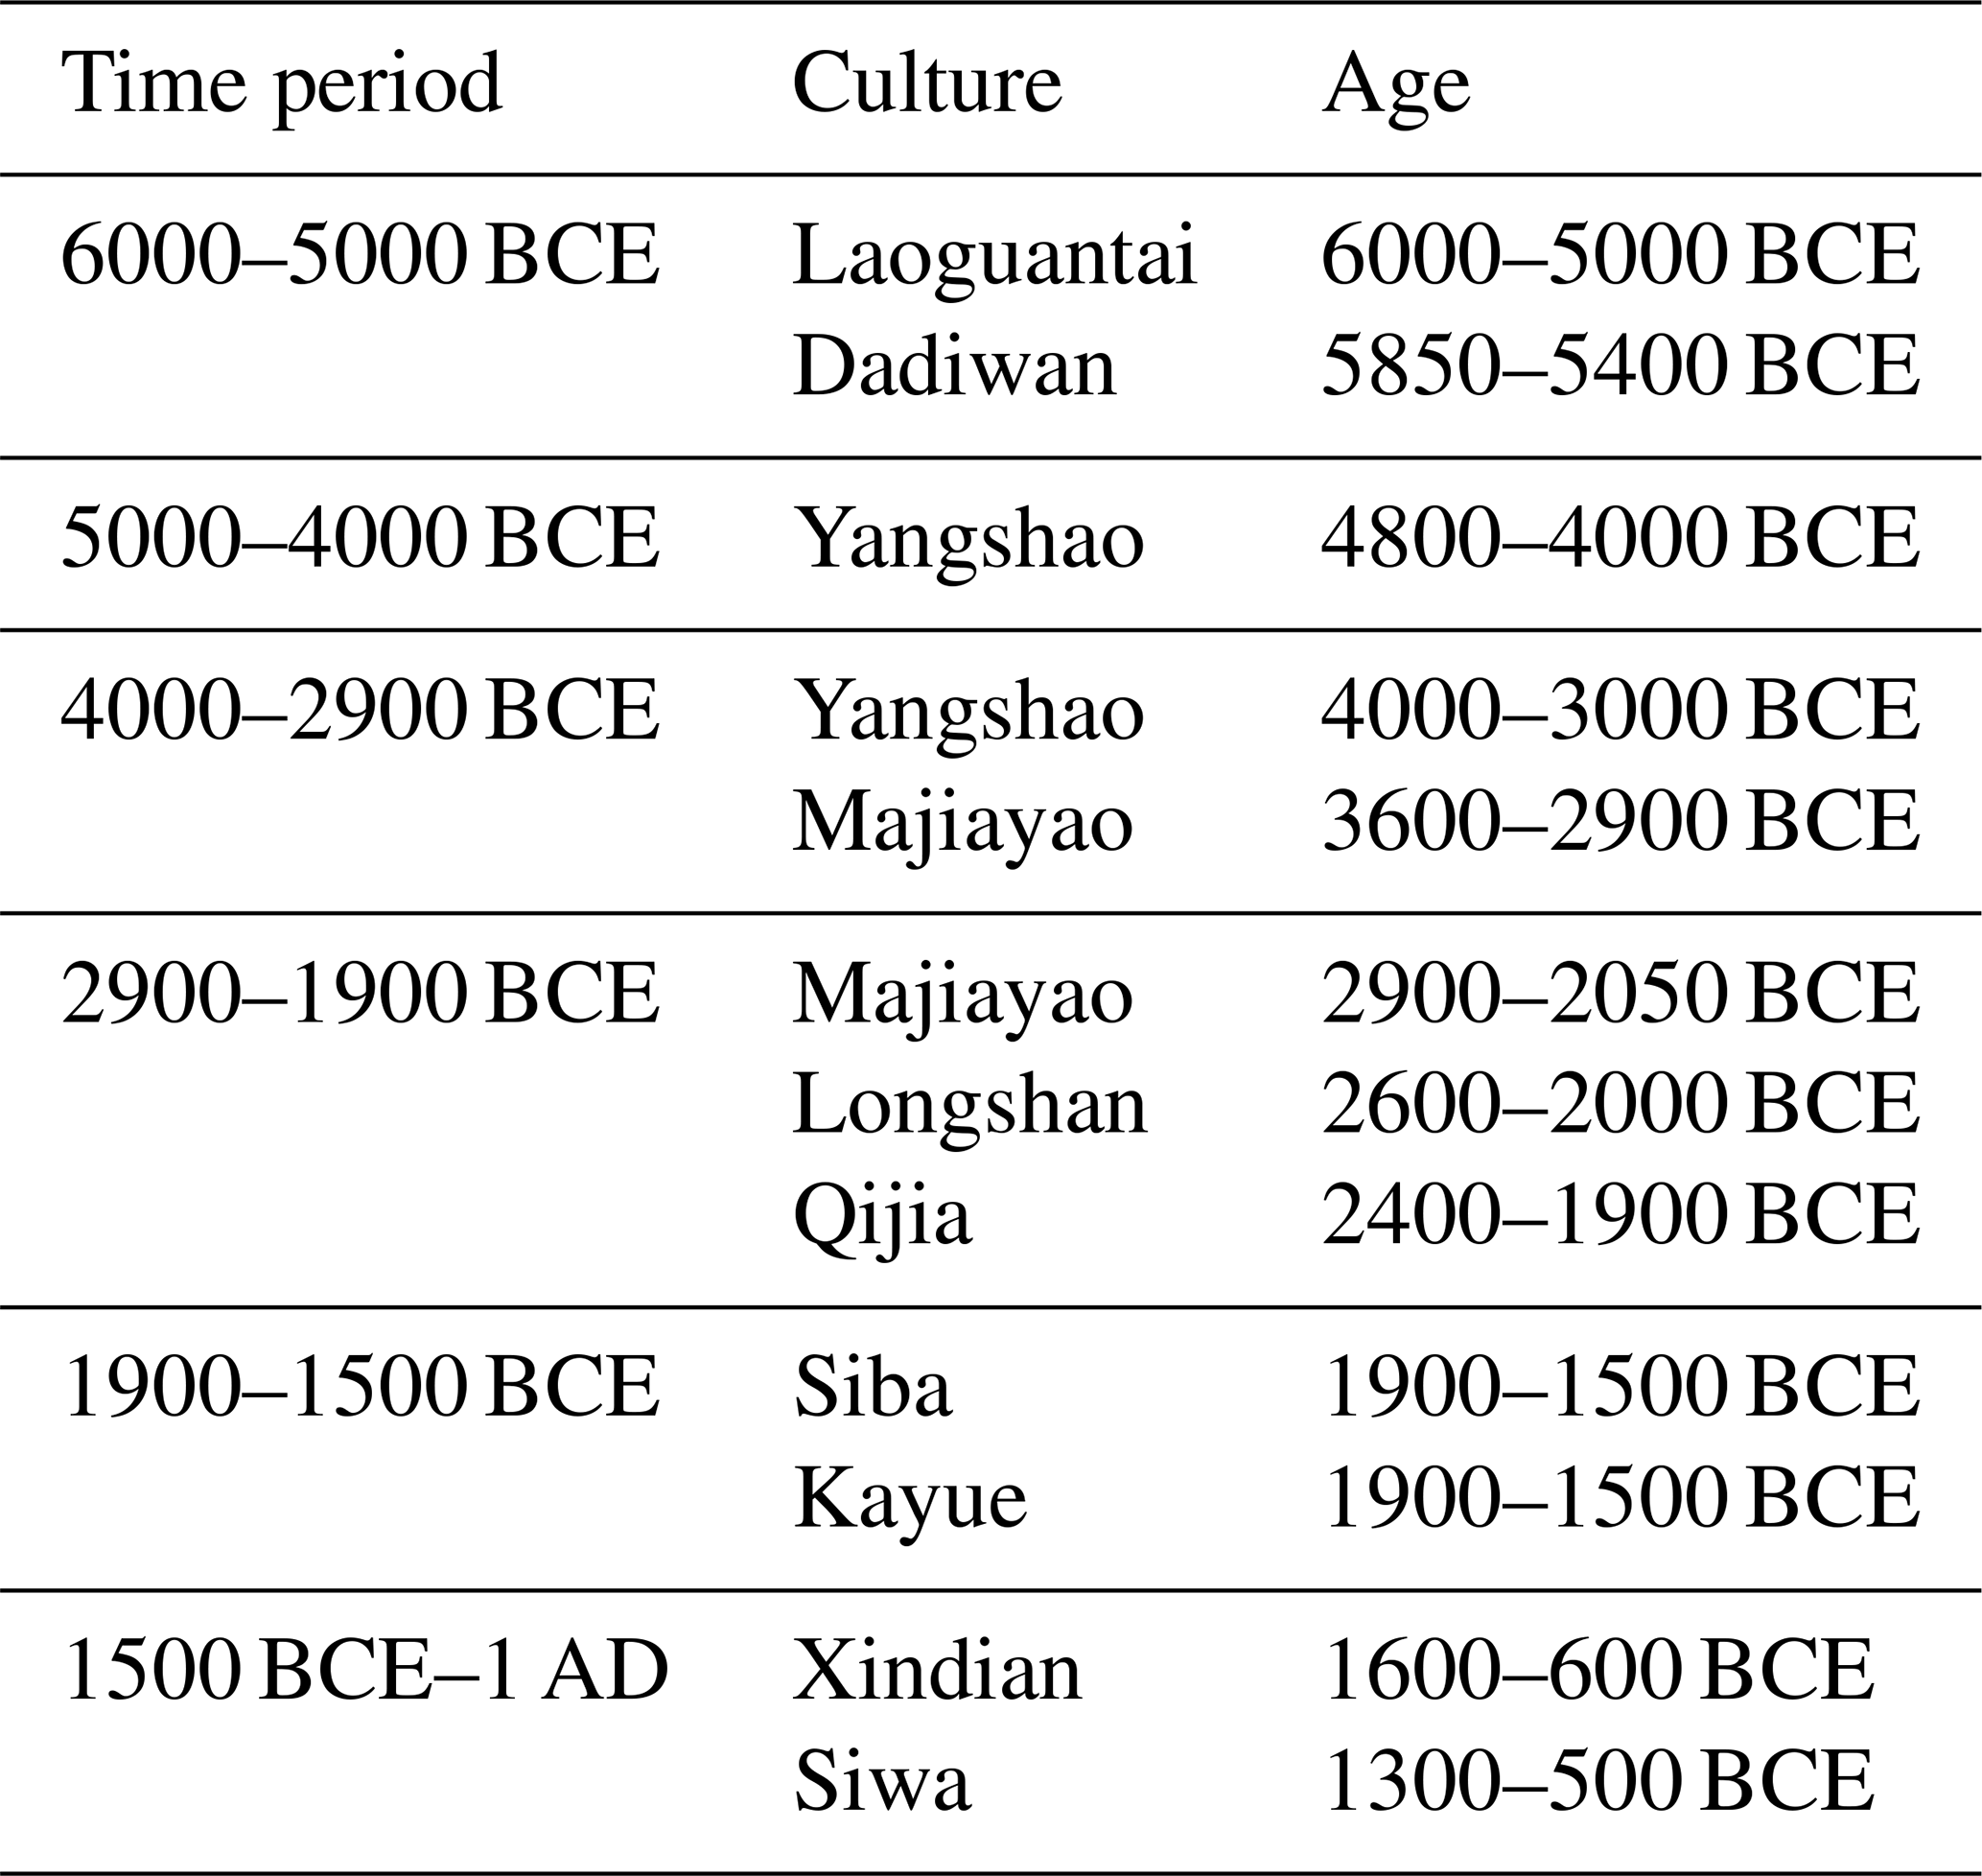
In the Wei River catchment, numerous local agricultural cultures have developed since the mid-Holocene (Table 1). Agriculture first developed at about 6000 BCE (Li et al., 2009). It started with small settlements in the southeastern part of the catchment (Laoguantai Culture; Jia, 2003) and on the terraces of tributaries in the northwestern part of the catchment (Dadiwan Culture; Feng, 1985). Next, during the development of the Yangshao Culture, from 5000 to 3000 BCE, the intensity of agriculture and the number of settlements increased (Li et al., 2009; Tan et al., 2011). Later, the Longshan Culture emerged, from 3000 to 2000 BCE (Jin et al., 2002). The significant increase in charcoal concentration and the diversity of food utensils during this period indicate the rapid development of an agriculture-based civilization (Jin et al., 2002). From 2000 to 1000 BCE, the food demand of the growing population led to further expansion of the area of agricultural land (Zhao, 2004). In addition, more high-yield crops, such as wheat, were planted in this period (pre-Zhou and Western Zhou dynasties) (Zhao, 2004). After about 1000 BCE, the intensity of agricultural activity increased significantly, with more natural vegetation being converted to crop land due to innovations in agricultural technology (Jia, 2003). From about 1000 BCE to the present, the forest cover in the Loess Plateau decreased by about 44 % (Zhao et al., 2013).
Table 1The development of agriculture in the Wei River catchment since the mid-Holocene (Shi, 1986; Zhou, 2003; Yu et al., 2016).
2.3 Hydrology and hydrological stations
The yearly data from 22 hydrological stations are used (Fig. 1c). The Wushan, Qin'an, Beidao and Linjiacun hydrological stations are located in the upper reaches of the Wei River (Fig. 1c), where the mean annual discharge and sediment load account for 26 % and 30 % of the entire catchment (from 1956 to 2000; Wang, 2013), respectively. Here, the discharge mostly originates between the Beidao and Linjiacun stations, while the sediment load is mostly produced in the upper area of the Qin'an station (Fig. 1c) (Wang, 2013). The Weijiaobao, Xianyang, Lintong and Huaxian hydrological stations (Fig. 1c) are located in the middle and lower reaches of the Wei River, which contribute about 48 % of the discharge of the catchment (from 1956 to 2000; Zhang et al., 2007). The downstream part of the Wei River, which includes the Lintong and Huaxian hydrological stations (Fig. 1c), is a typical sediment accumulation area (Gao, 2006).
The Jing River is the largest tributary. About 71 % of its sediment is transported to the Wei River (from 1956 to 2015; J. Zhang et al., 2020). There are nine hydrological stations located in this river: the Hongde, Jiaqiao, Qingyang, Yuluoping, Jingchuan, Yangjiaping, Jingcun and the Zhangjiashan stations (Fig. 1c). Overall, 73 % of the discharge in the Jing River catchment comes from the upper reaches of the Yangjiaping station and from the reaches between the Yangjiaping, Yuluoping and Zhangjiashan stations (from 1956 to 2015; J. Zhang et al., 2020). The sediment load comes mainly from upstream of the Yuluoping station, accounting for 54 % of the sediment load in the Jing River basin (from 1959 to 2016; Han, 2019).
For the Beiluo River, data from five hydrological stations are used in this work: the Wuqi, Liujiahe, Jiaokou, Huangling and Zhuangtou stations (Fig. 1c). Overall, 57 % of the discharge in the Beiluo River catchment is produced between the Liujiahe and Zhuangtou stations (from 1957 to 2009; Ran et al., 2000, 2012). Most of the sediment load is produced in the reaches upstream of the Liujiahe station, which accounts for 90.6 % of the sediment load in the Beiluo River basin (from 1957 to 2009; Zhang et al., 2017).
3.1 Model summary
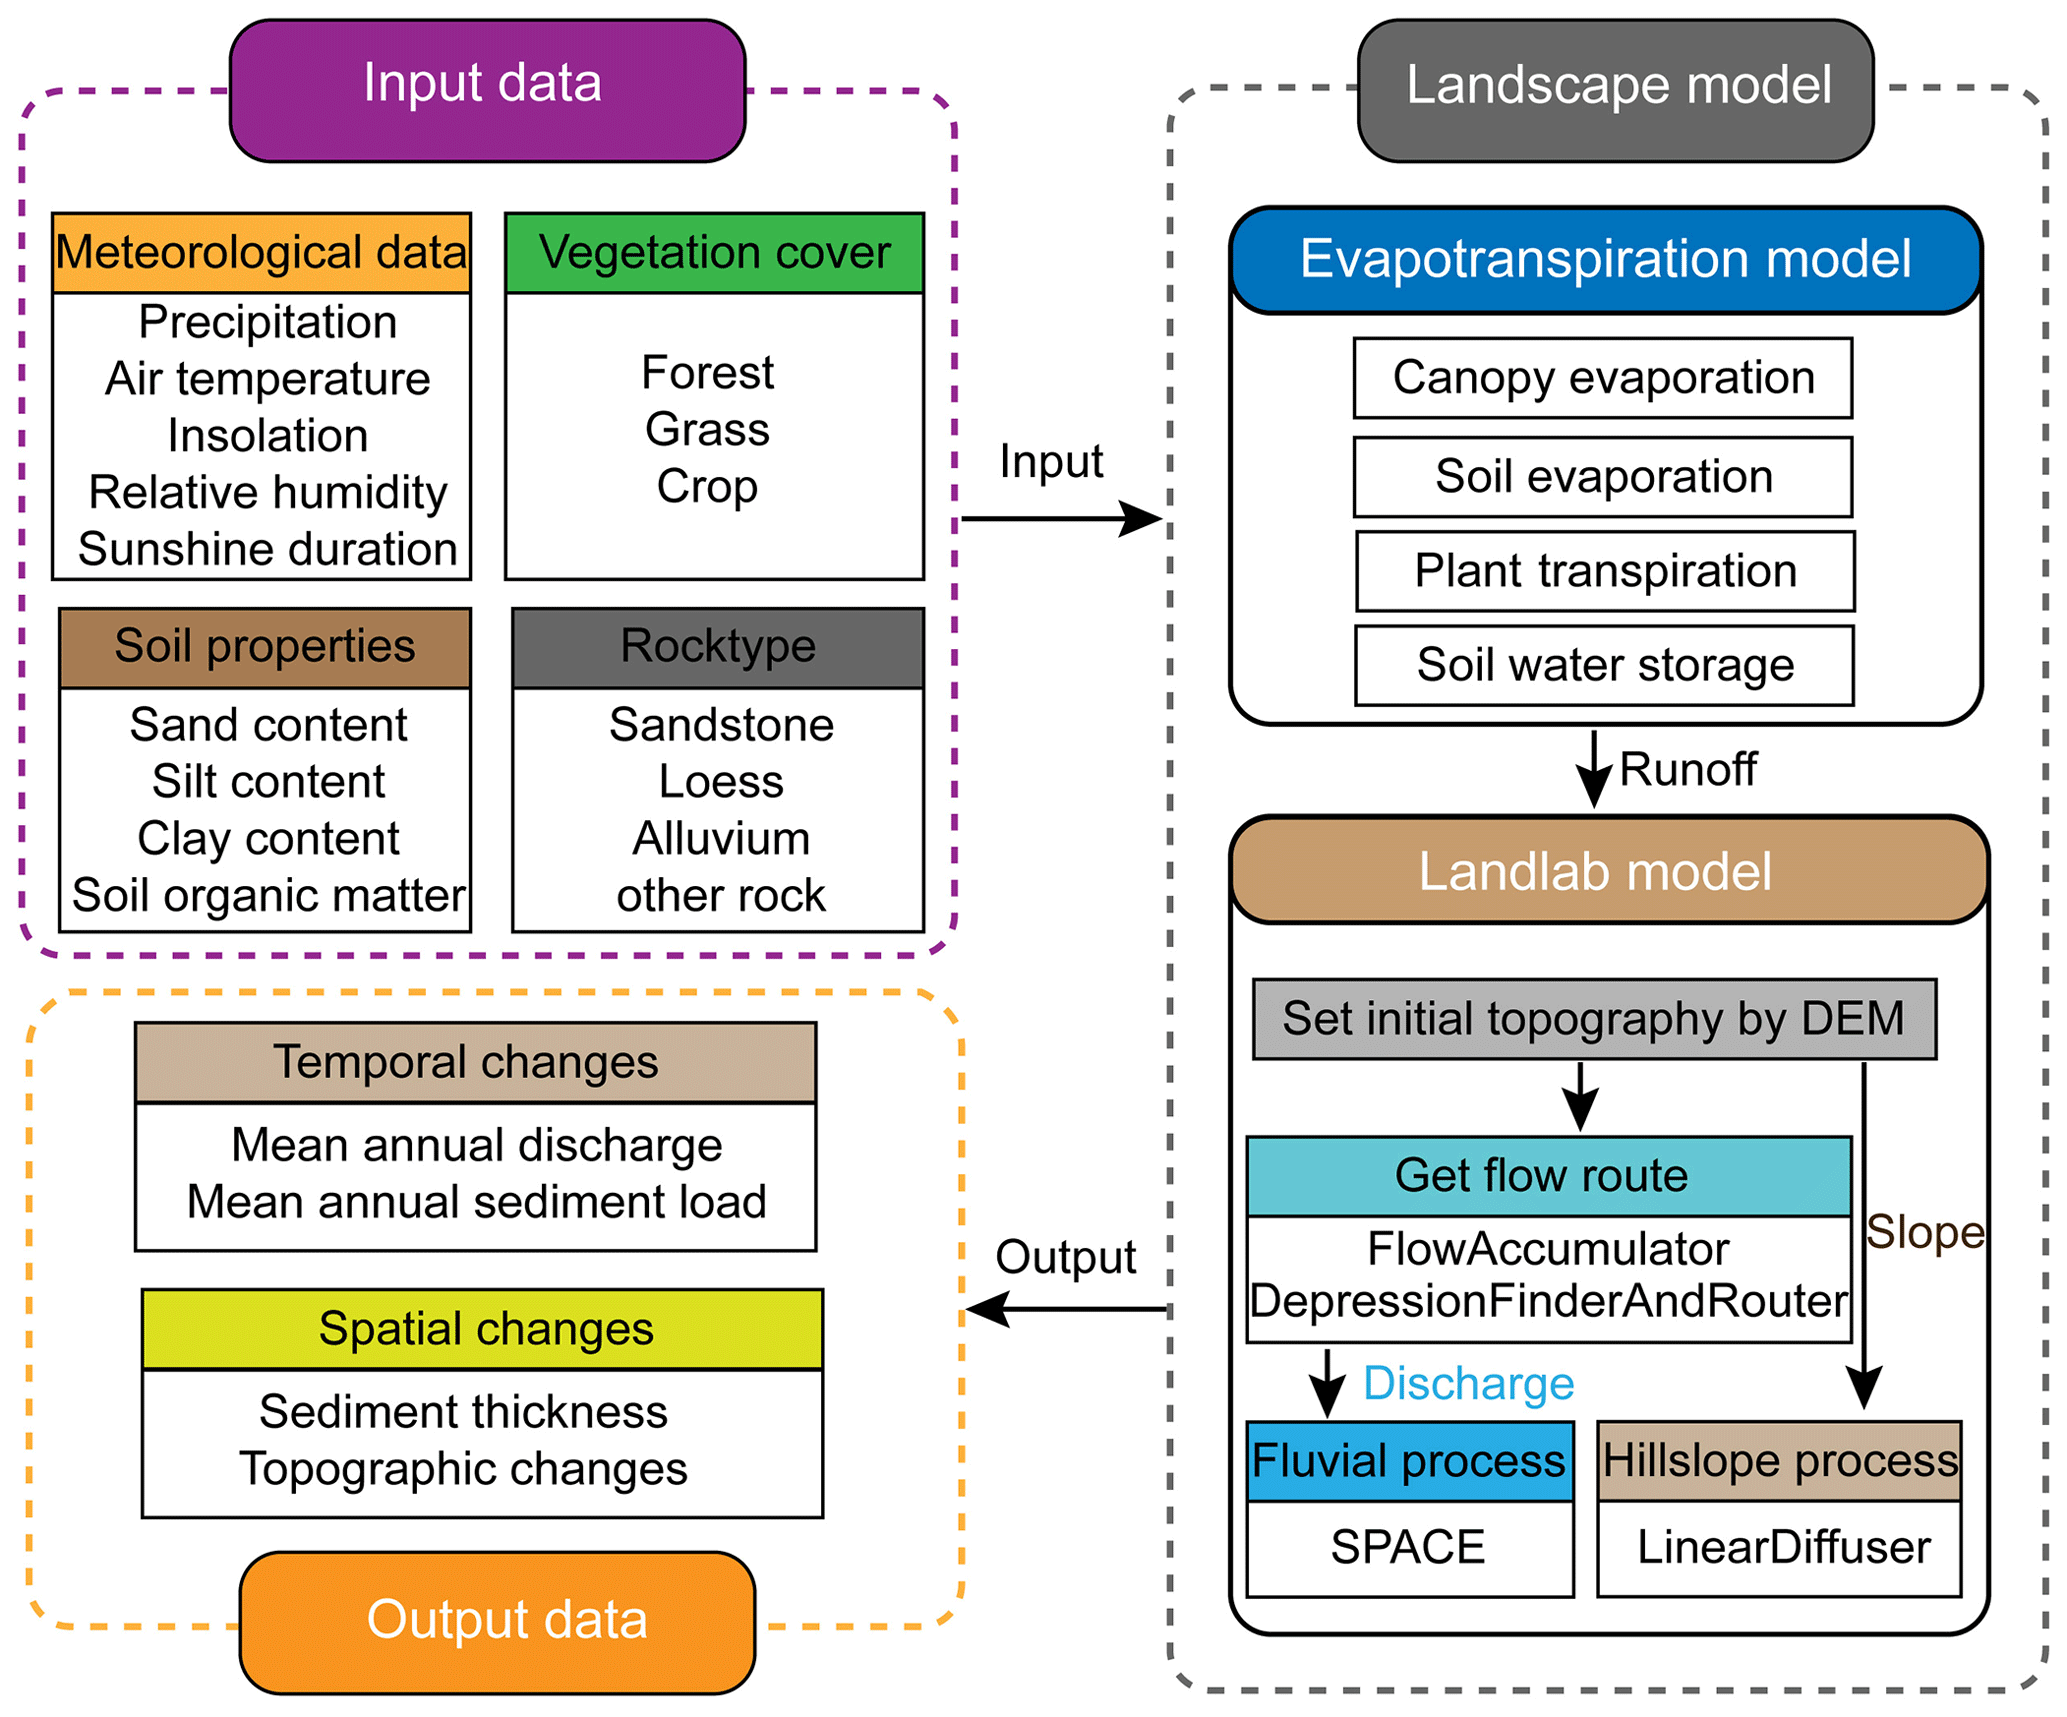
In order to simulate the trends of fluvial sediment load and discharge changes under the impacts of land use and climate change, we apply the Landlab landscape model (Hobley et al., 2017; Barnhart et al., 2020) combined with an evapotranspiration model (Thornton et al., 2002) (Fig. 2). The models are described in more detail in the work by Chen et al. (2021).
Model parameters are calibrated by tuning simulated discharges and sediment loads to measured values at the hydrological stations for the period from 1996 to 2016, using the meteorological, land use and soil data. The tuning method is an iterative calibration process that involves changing the parameter from an initial value to the most appropriate value to minimize the mismatch between the simulated and observed hydrological data. For simplicity, only the most important model parameters are calibrated, which are the effective root depths of plants and the soil erodibility. The additional, less important, parameters such as biological parameters in the evapotranspiration model (Table S1 in the Supplement) and the value of “n” (a scaling exponent) in the Landlab SPACE model component (Shobe et al., 2017) (Table S2) are provided by previous researchers (Thornton et al., 2002; Shobe et al., 2017). Details of the calibration procedure are included in Sect. 3.2. The calibrated model parameters are subsequently used in simulations for the period from 6000 BCE to 1850 AD.
3.1.1 Evapotranspiration model
The simulated vegetation types include deciduous broadleaf forest, grassland and crops, the distributions of which are shown in Sect. 3.3. Ecological parameters of deciduous broadleaf forests and grasslands are based on the default values of the Biome-BGC model (White et al., 2000; Thornton et al., 2002). They have previously been successfully applied to the discharge and sediment load simulations in a tributary, the Beiluo River catchment (Chen et al., 2021).
For the crops, we use the ecological parameters of winter wheat, since that is the dominant crop type in the Wei River catchment (Zhang et al., 1987). The soil nitrogen content, which is one of the required parameters in the model for the areas covered by crops, is assumed to be constant (0.0004 kgN m−2) to simulate the effects of fertilization (Qin et al., 2010). The crop is irrigated twice during its growth and the timing of irrigation depends on local farming practices (Zhang et al., 1987). The applied value of irrigation each year is set equal to the mean annual value of irrigation in the Wei River catchment after the 1990s (Liu, 2003). In the modeling, similar to previous studies (Hu et al., 2011), 80 % of the stems and leaves are removed each year to simulate the harvest processes.
3.1.2 Spatial distribution of climate data
For the calibration simulations of the period 1996–2016, we use the Kriging interpolation to compute the spatial distribution of evapotranspiration and runoff. The meteorological data used are the same as the previous simulations performed in the Beiluo River catchment (Chen et al., 2021). These data, from 20 meteorological stations located in and around the catchment (Fig. 1c), are collected from the National Meteorological Information Centre (Ren et al., 2016). Eight insolation stations in and around the study area (Fig. 1a) are used to obtain the insolation data. We select another six meteorological stations (Fig. 1c) to test the accuracy of data obtained by this method. The predicted and measured data match well (R2>95 %, Fig. S1 in the Supplement).
For the simulations of the Holocene (from 6000 BCE to 1850 AD), the spatial distributions of climatic inputs are the same as those used in the calibration simulations. The Holocene precipitation and temperature series are calculated based on the annual precipitation reconstruction from Gonghai Lake (F. Chen et al., 2015) and the air temperature reconstruction from the Mangshan Loess Plateau (Peterse et al., 2011). The methods are the same as those used by Chen et al. (2021). The calculated precipitation and air temperatures fit well with the reconstructed data from Beilianchi Lake (C. Zhang et al., 2020, 2021) (Sect. S2, Fig. S2), which is located in the northwestern part of the Wei River catchment (Fig. 1a). Holocene atmospheric CO2 concentrations are from the results of the Vostok ice core (Barnola et al., 1995; Petit et al., 1999). Holocene insolation values are calculated using the method of Laskar et al. (2004). The humidity and the sunshine duration values are set equal to modern values, because a sensitivity analysis has shown that variation of these two parameters has a limited impact on the results (Chen et al., 2021).
3.1.3 Anthropogenic land cover change
The changes in anthropogenic land use since the mid-Holocene (Fig. S3) are obtained from the KK10 database, which in turn is calculated from a global ALCC model that is driven by population density and land suitability (Kaplan et al., 2009, 2011). Land suitability takes into account that agriculture develops first on the most productive crop lands (Kaplan et al., 2009). The time series of the KK10 model used is from 6000 BCE to 1850 AD. Because only the provincial data from 221 BCE to 1850 AD (Zhao and Xie, 1988) were available to calibrate the spatial patterns of population changes in China used by Kaplan et al. (2009), there is an uncertainty in the land use changes in our study region prior to 221 BCE. In previous simulations focusing on a tributary, the Beiluo River catchment, Chen et al. (2021) applied a variation of 25 % for the ALCC from 6000 to 221 BCE to estimate the impact of this uncertainty. This showed the uncertainty of ALCC had a limited effect on the simulation results for discharges and sediment loads.
3.1.4 Initial topography
There are two layers in the LEM, a base layer and a surface layer (Shobe et al., 2017). The surface layer consists of loose material and is above the base layer, which is composed of basement (i.e., bedrock and loess in different areas). The surface layer is composed of sediment produced by hillslope and fluvial processes. The material of the base layer is set on the basis of the rocky types, consisting of loess, sandstone, etc. (Fig. S4a).
The initial topography for the simulations is extracted from the NASA SRTM 90 m digital elevation model (DEM) (Rabus et al., 2003) and resampled to a spatial resolution of 1000 m for computational reasons. Since the river network is disrupted after resampling, we resample the elevation of the network separately and combine it with the previously resampled DEM. Then, the steady-state topography is calculated over 5000 model years in order to remove DEM errors in the fluvial network (e.g., Campforts et al., 2020; Sharma et al., 2021; Chen et al., 2021). Subsequently, the elevation of the base layer used in the Holocene simulations is set equal to the steady-state topography. This assumption is reasonable since recent studies have used the modern topography to accurately simulate the soil erosion processes in the Loess Plateau during the Holocene (Zhao et al., 2022a, b). Their simulated soil erosion intensities are in good agreement with the evidence provided from loess-paleosol profiles (Zhao et al., 2022a) and sediment deposition rates in the Yellow River Delta (Zhao et al., 2022b). In addition, because we use similar erodibility for loess and sediment, the initial sediment thickness (the thickness of the surface layer) is set to 0 m.
3.2 Calibration
Here, we present the calibrations of model parameters by fitting the simulated discharge and sediment load to the observed values at the hydrological stations (Fig. 1c). The discharge and sediment load data from another seven hydrological stations (Fig. 1c) are used for validation. Since our models do not consider the impacts of, e.g., dams and irrigation systems, mean annual discharge and sediment load data measured at the stations are re-calculated into natural discharge and sediment load data by using the method of double-mass curves (DMCs). This method uses the correlation between cumulative precipitation and annual discharge or sediment load (Chang et al., 2016). Details are presented in the supplemental materials (Sect. S1, Table S3). The calibrated parameters are the effective root depth of plants and the erodibility of the base and surface layers. The calibration results are accepted when the mismatch between the simulated and observed discharges and sediment loads is less than 10 %. This evaluation criterion was chosen based on the previous simulation works (Carriere et al., 2019; Chen et al., 2021).
3.2.1 Effective root depth of plants
For the evapotranspiration model, we only calibrate the effective root depth, which is determined by the vegetation types and soil environment (Vörösmarty et al., 1989), because it has the largest impact on the evapotranspiration rates and soil water content in the evapotranspiration model.
For the root depth calibration, the catchment is subdivided into 16 sub-catchments (Fig. 1c). We use the present-day precipitation and temperature, and fit the mean annual discharge at the outlet of each sub-catchment (blue rectangle in Fig. 1c). The initial effective root depths of plants are set at 1.5 m for deciduous broadleaf forest and 1 m for grass and crop lands, based on the average root depth in the Loess Plateau (You et al., 2009). During the iterative calibration processes we vary the root depth incrementally by 1 cm, while the difference between the initial root depths of trees and grass/croplands is kept constant. After calibration, the mismatches between the observed and simulated annual discharge at the calibration stations are between 0.48 % and 6.10 % (Fig. S5).
In order to validate the accuracy of our calibration results, we further compare the differences between the predicted and natural annual discharge at another seven hydrological stations (orange rhombus in Fig. 1c). The results show that the model predicts annual discharge with an error that ranges between 0.35 % and 7.95 % (Fig. S5).
3.2.2 Erodibility
For the parameters in the Landlab model, we calibrate the erodibility of the base and surface layers based on measured annual sediment loads (Fig. 1c). The initial values of the base layer erodibility are calculated based on the geological map (Fig. S4a), which is extracted from a 1:250 000 digital geological map of China (Zuo et al., 2018), and the bedrock erodibility values used in the LAPSUS model (Schoorl and Veldkamp, 2001). For the initial values of the surface layer erodibility, we calculate the values with the method of Hancock et al. (2019), which uses the soil properties and the NDVI data (normalized difference vegetation index). The data of soil properties (Fig. S4b–e) come from the China soil map, which in turn is collected from the Harmonized World Soil Database (v1.0) (Nachtergaele et al., 2008). The NDVI data (Fig. S4f) are based on the SPOT vegetation index database of China (Maisongrande et al., 2004).
Then, the erodibility of the base layer and surface layer in each sub-catchment is adjusted until the simulated sediment load matches the observed data at the hydrological stations located at the sub-catchment outlet (blue rectangle in Fig. 1c). After calibrations, the mismatches between the observed and simulated annual sediment load at the calibration stations range from 0.01 % to 9.39 % (Fig. S6). For the validation stations, the model predicts an annual sediment load with an error that ranges between 1.50 % and 7.27 % (Fig. S6).
3.3 Holocene simulations
Two model scenarios (a model with land use and climate change, Normal, and a model without climate change, WCC) are used in the Holocene simulations. The Normal scenario uses reconstructed paleo-climate data and KK10 land use data to model the spatial and temporal changes in water and sediment discharges due to climate change and anthropogenic land cover changes. The WCC scenario is used to study solely the effects of land use change; the climatic conditions are the same as those applied in the Normal scenario from 6000 to 5500 BCE, and they are kept constant during the simulation.
In order to demonstrate the effects of anthropogenic land cover change on drainage hydrology, we calculate the changes of discharge and sediment yield at the outlet as well as their coefficient of spatial variation (CV, Eq. 1) for the whole catchment.
where, CV is the coefficient of spatial variation of the mean annual discharge or sediment yield; xa is the average discharge or sediment yield of the whole catchment; xi is the discharge or sediment yield in the i grid cell, and n is the total number of grid cells.
Next, the sensitivities of the mean annual discharge and sediment yield as well as their spatial variation coefficients to climate change are calculated based on the differences between the Normal and WCC scenarios (Eq. 2). Finally, the calculated sensitivities are correlated with the different intensities of human activity to reveal the impact of land use change on the fluvial response mechanisms.
where, Sc is the sensitivity of the simulation results to climate change. A higher value of Sc means a more sensitive response; difclimate-basic is the difference between the simulation results between the Normal and WCC scenarios. The simulation results are the mean annual discharge, the CV of the mean annual discharge, the mean annual sediment yield and the CV of the mean annual sediment yield, resulting in four different sensitivity values. Δclimate is the difference between the climate conditions for the scenarios. We use the difference of precipitation between both scenarios as the Δclimate parameter, since precipitation is the climate parameter that has the most significant impact on the simulation results (Chen et al., 2021).
In the Holocene simulation, the time step is 1 year and the spatial resolution is 1000 m. Since the temporal resolution of the reconstructed Holocene climate data, especially for air temperature, is around 500 years (Peterse et al., 2011), we set the annual climatic parameters and anthropogenic land cover constant for each 500-year interval for simplicity. Therefore, the mean annual discharge or sediment yield are calculated for each 500 years. For the modeling of discharge and sediment load, the distributions of natural plants are determined by the pollen-based reconstruction of main vegetation types in different geomorphic units in the Loess Plateau (Sun et al., 2017). By associating the reconstructed vegetation data with the modern geomorphic distribution map (Yang, 2000), the natural plants in the Wei River catchment are grouped into forest and grass (Fig. S7). The type of crop and its management parameters, such as soil nitrogen content and irrigations, were set the same as the modern values, because of lack of available data. This assumption is reasonable because wheat has been cultivated in the middle reaches of the Yellow River as early as the mid-Holocene (Dodson et al., 2013; Zhuang and Kidder, 2014).
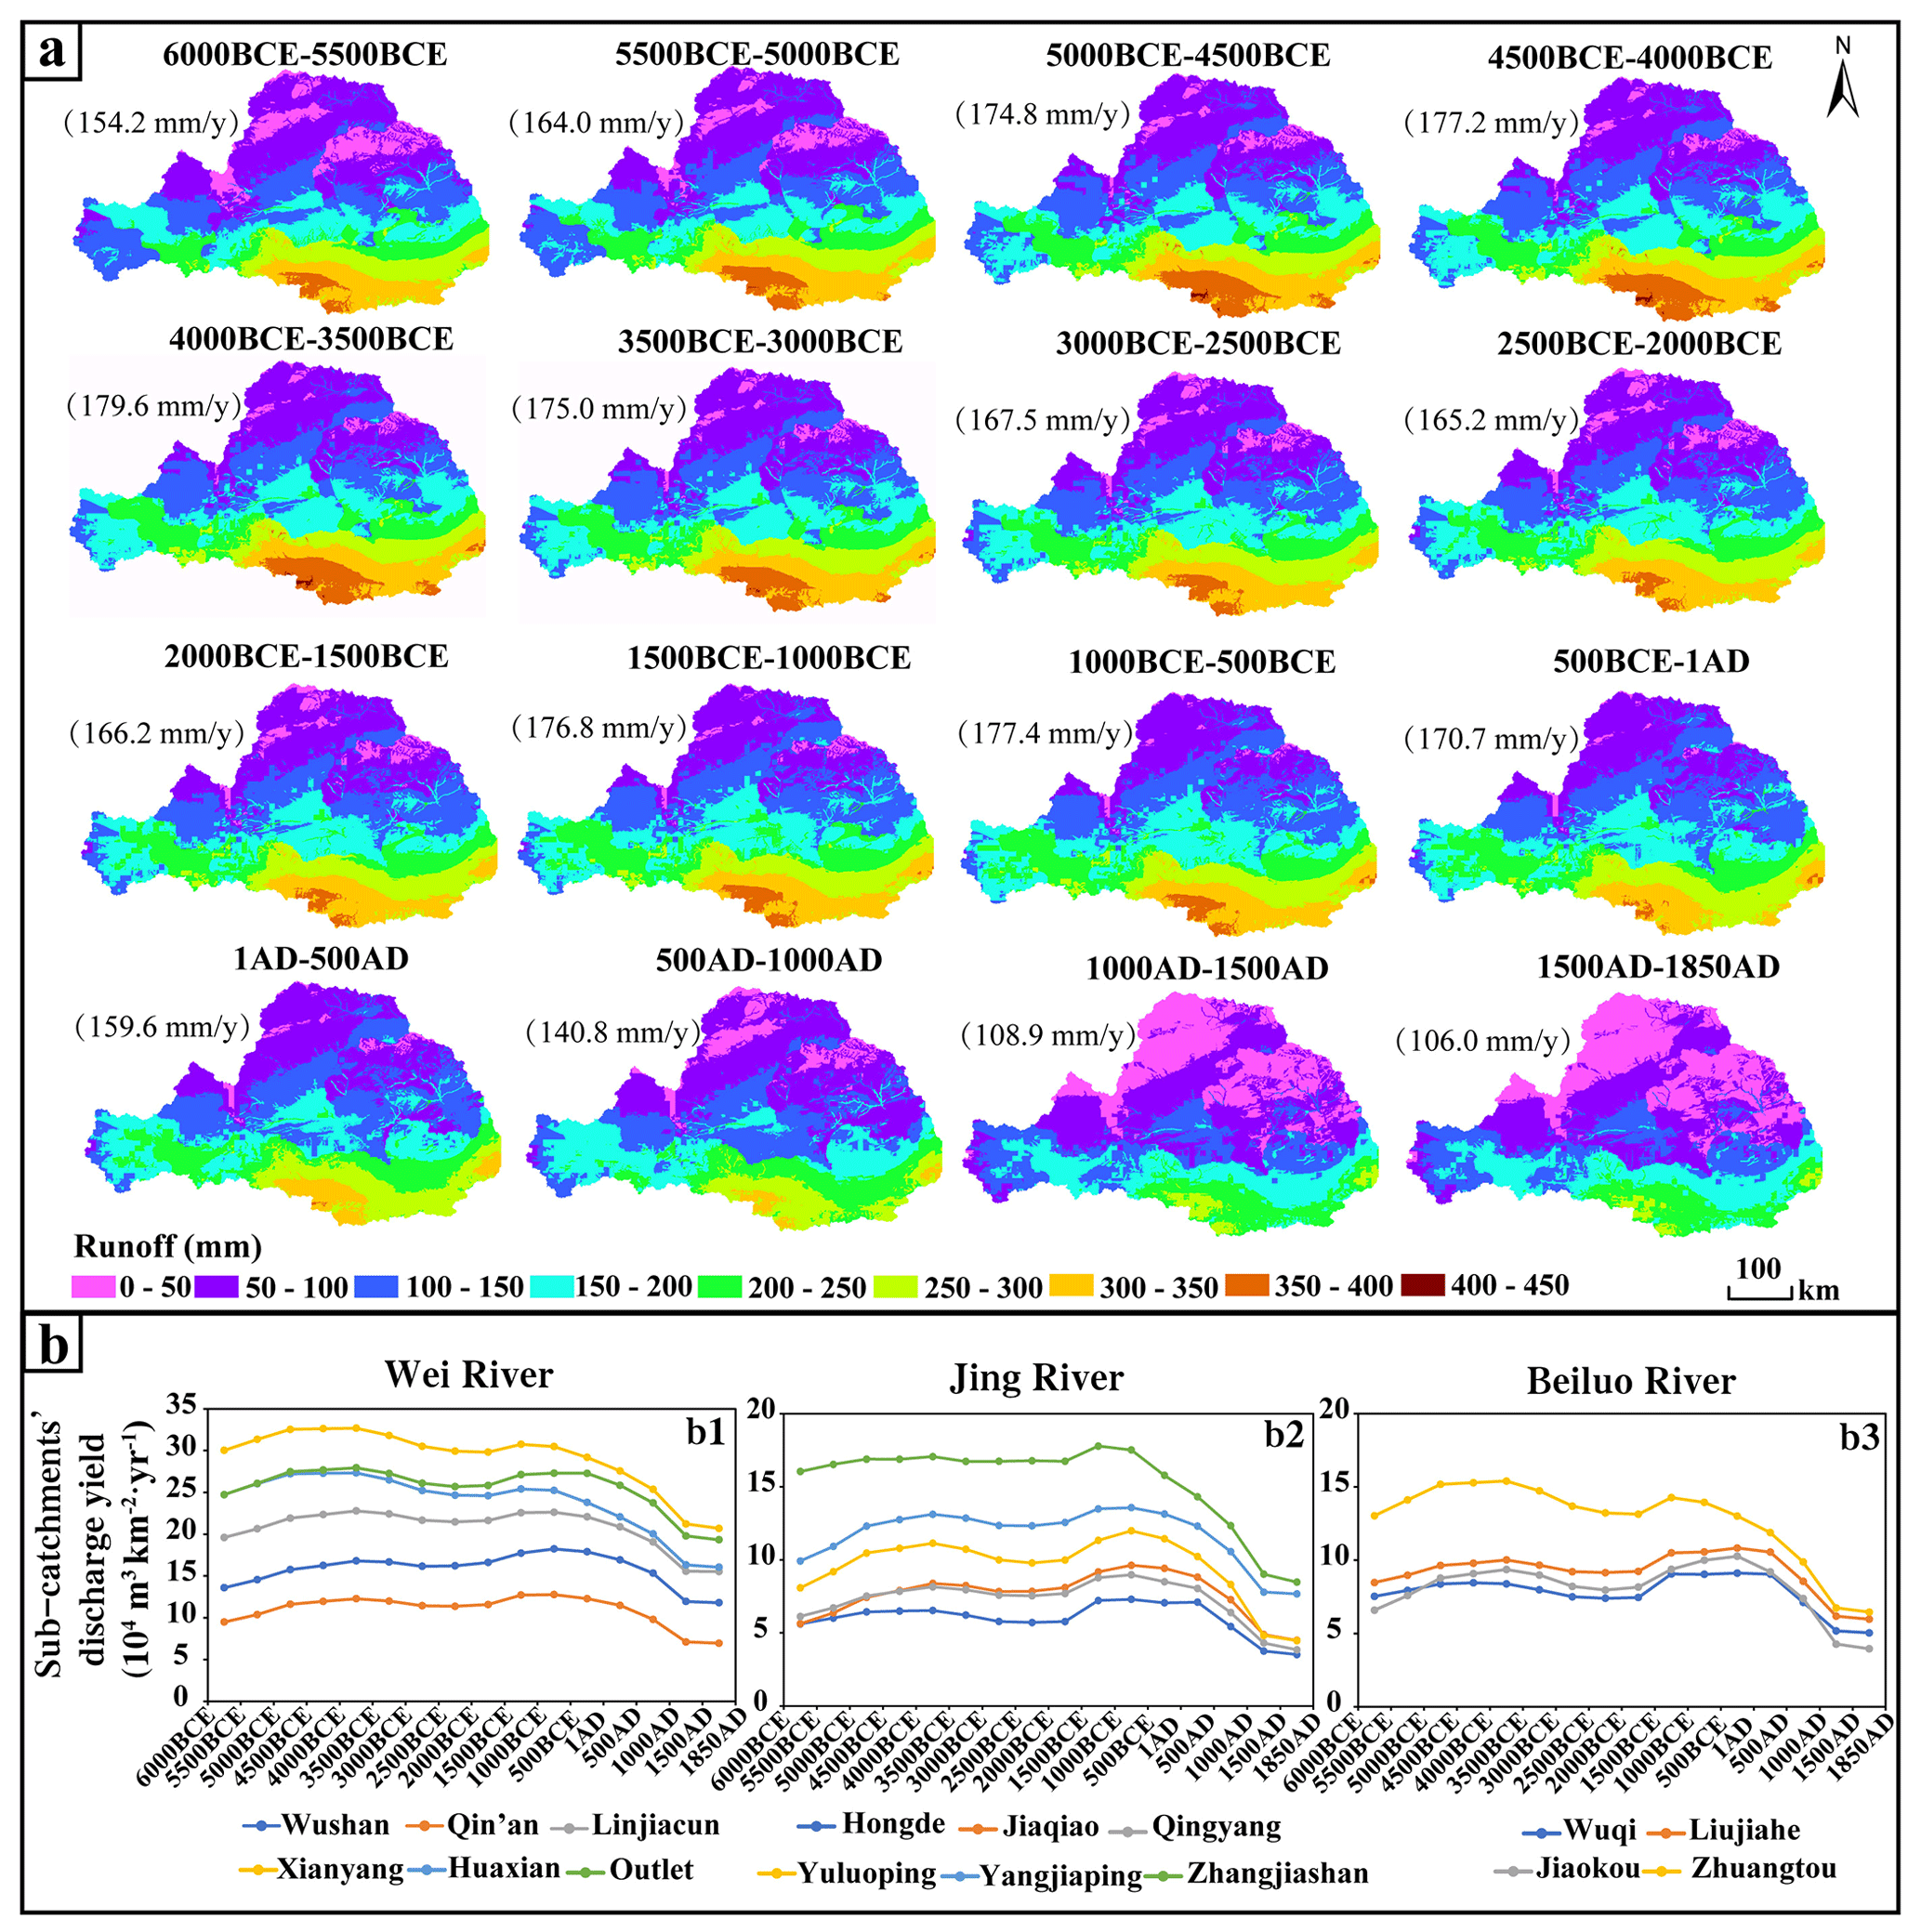
Figure 3Simulated mean annual runoff (a) and the time trend of sub-catchment mean annual discharge (b).
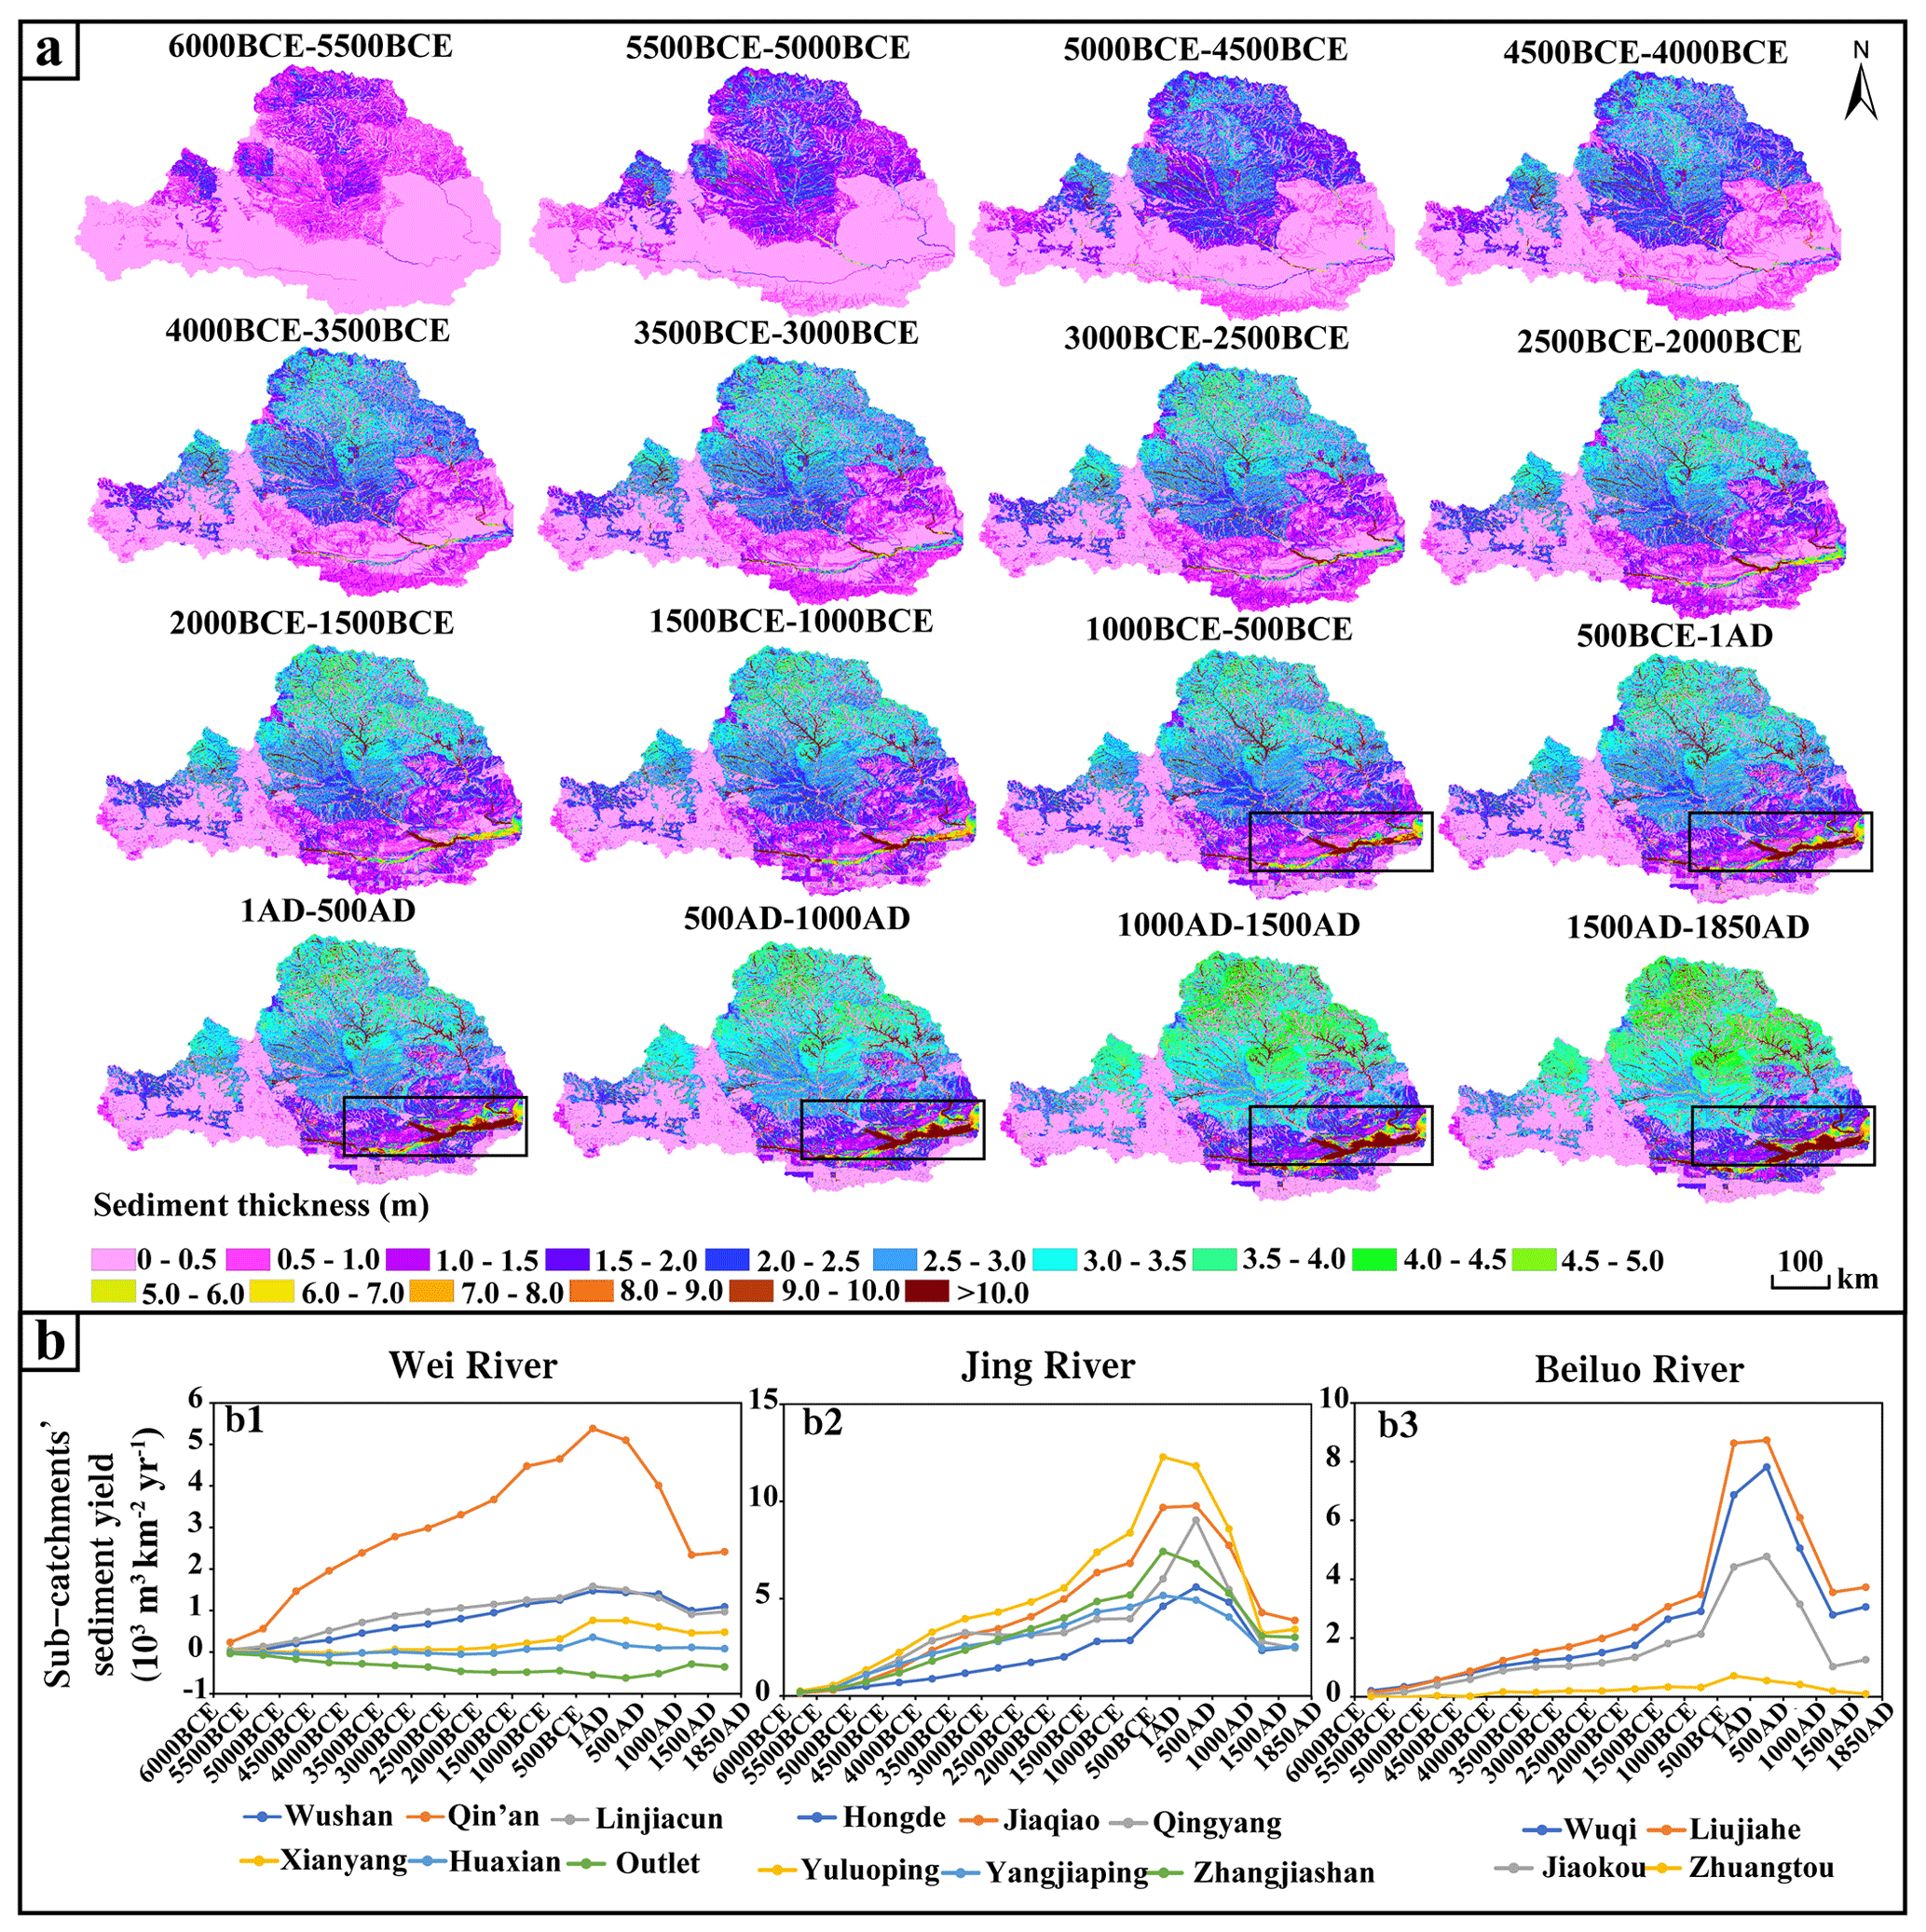
Figure 4Sediment thickness (a) and the evolution of sub-catchment mean annual sediment yield (b).
4.1 Normal scenario
4.1.1 Runoff and discharge
The evolution of the simulated runoff and discharge from 6000 BCE to 1850 AD is shown in Fig. 3. The mean annual runoff (catchment average) increases about 16.5 % during the first 2000 years (6000 to 4000 BCE). A second increase of around 6.7 % takes place from 2000 to 500 BCE (Fig. 3a). Spatially, the simulated runoff rates show a gradual increasing trend from north to south, which is caused by the distribution of mean annual precipitation. A low value occurs in the middle reaches of the Jing River and the Beiluo River, which may be caused by the high value of effective root depth (Fig. S5) resulting in a locally high value of evapotranspiration.
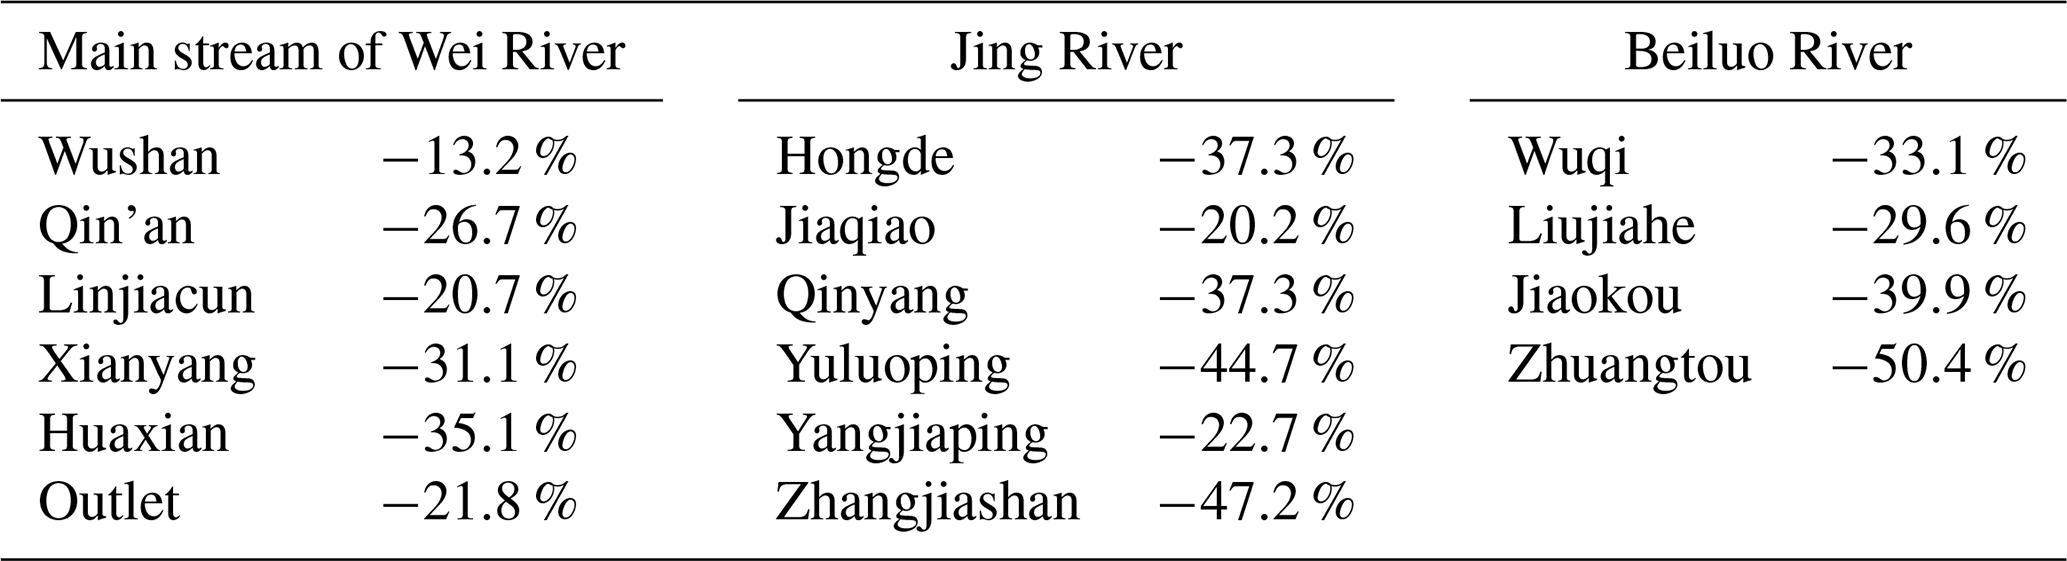
In each sub-catchment, the fluctuations of the mean annual discharge are similar (Fig. 3b). The main contribution to the discharge at the catchment outlet is provided by the downstream part of the Wei River (Fig. 3b1). During the Holocene, the decreases in discharge in the sub-catchments belonging to the main stream of the Wei River range from 13.2 % to 35.1 % (Fig. 3b1, Table 2). In the Jing River, the decreases in discharge range from 20.2 % to 47.2 % in the sub-catchments (Fig. 3b2, Table 2). In the Beiluo River sub-catchments, reductions in discharge range from 29.6 % to 50.4 % (Fig. 3b3, Table 2).
Table 2The total difference in mean annual discharge in each sub-catchment from 6000 BCE to 1850 AD.
4.1.2 Sediment thickness and sediment yield
Figure 4 shows the distribution of sediment thickness and the evolution of sediment yield in each sub-catchment. The sediment thickness has a decreased trend from northwest to southeast. The upper and lower reaches of the main stream of the Wei River have a thin accumulation of sediment (less than 2 m) (Fig. 4a). A prominent sediment accumulation is simulated in the lower reaches from 1000 BCE onward; its lateral extension results from lateral channel migration (Fig. 4a).
Table 3The total difference of mean annual sediment load in each sub-catchment from 6000 BCE to 1850 AD.
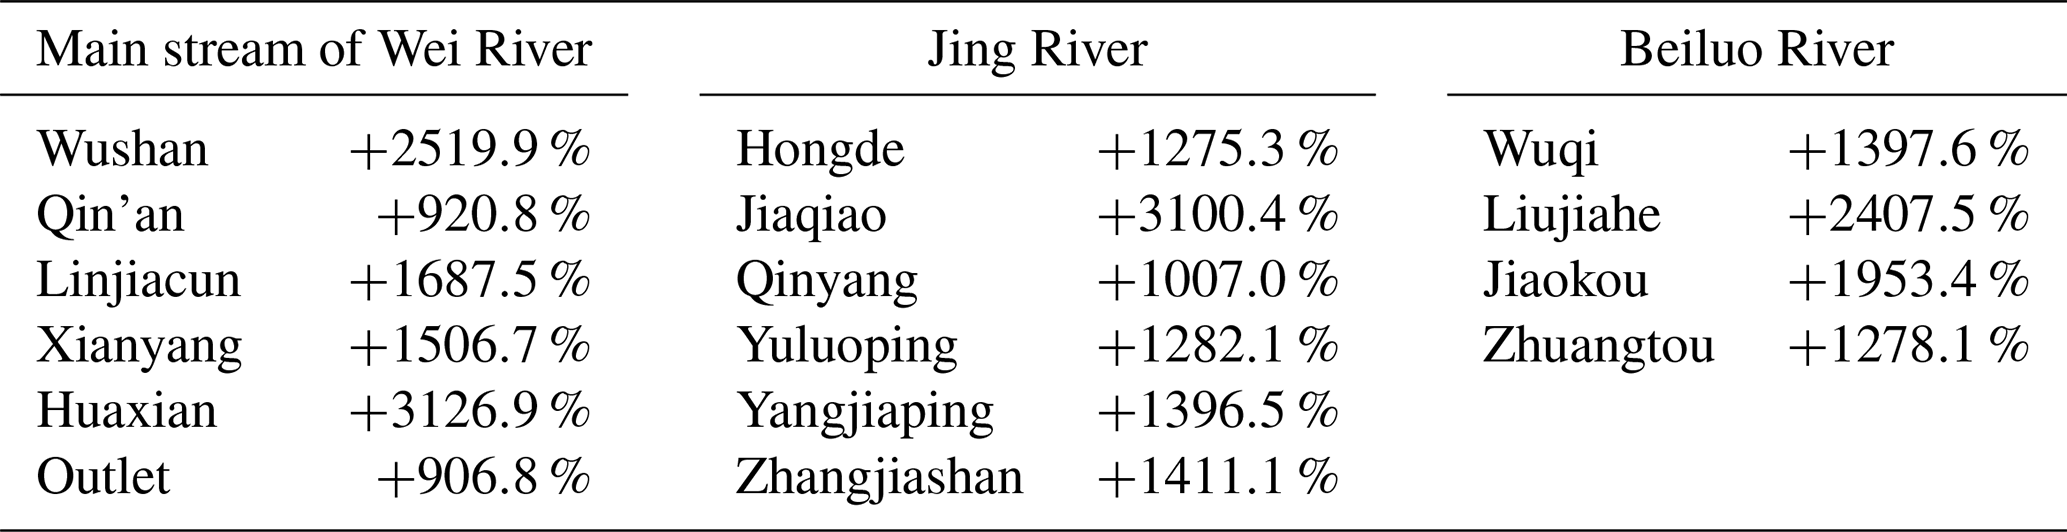
For the main stream of the Wei River, the sediment flux mainly comes from the Qin'an sub-catchment (Fig. 4b1). There is no sediment yield at the outlet of the Wei River, which indicates it is a sedimentation zone (Fig. 4b1). Sediment yields are higher in the Jing River than in other sub-catchments; the maximum value is located in the Yuluoping sub-catchment (Fig. 4b2). In the Beiluo River, the sediment is mostly produced in the Wuqi and Liujiahe sub-catchments (Fig. 4b3). The trends in mean annual sediment yield in each sub-catchment are similar and had a total increase of 10–30 times during the simulation (Fig. 4b, Table 3). Before 1000 BCE, the mean annual sediment yield had an approximately steady, linear increase in all sub-catchments (Fig. 4b). Subsequently, they experienced a sharp increase between 1000 BCE and 1 AD. Then, a rapid decrease occurred after 1 AD (Fig. 4b).
4.2 The difference of model results for the two scenarios
The spatial distributions of mean annual runoff in the Normal and WCC scenarios are similar (Figs. 3a and S8A). However, the evolution of simulated mean annual runoff (catchment average) has fluctuations in the Normal scenario while it increases almost linearly in the WCC scenario (Figs. 3a and S8A). Compared to the Normal scenario (Fig. 3b), the discharge yields of the sub-catchments belonging to the southeastern part (such as Zhangjiashan and Zhuangtou) increase appreciably in the WCC scenario (Fig. S8b). The comparison of the mean annual discharge (catchment average) and its spatial variation coefficient for these two scenarios show that the impacts of climate change on the temporal and spatial trends of discharge start to increase after 1 AD (more than 20 %) (Fig. 5a and b).
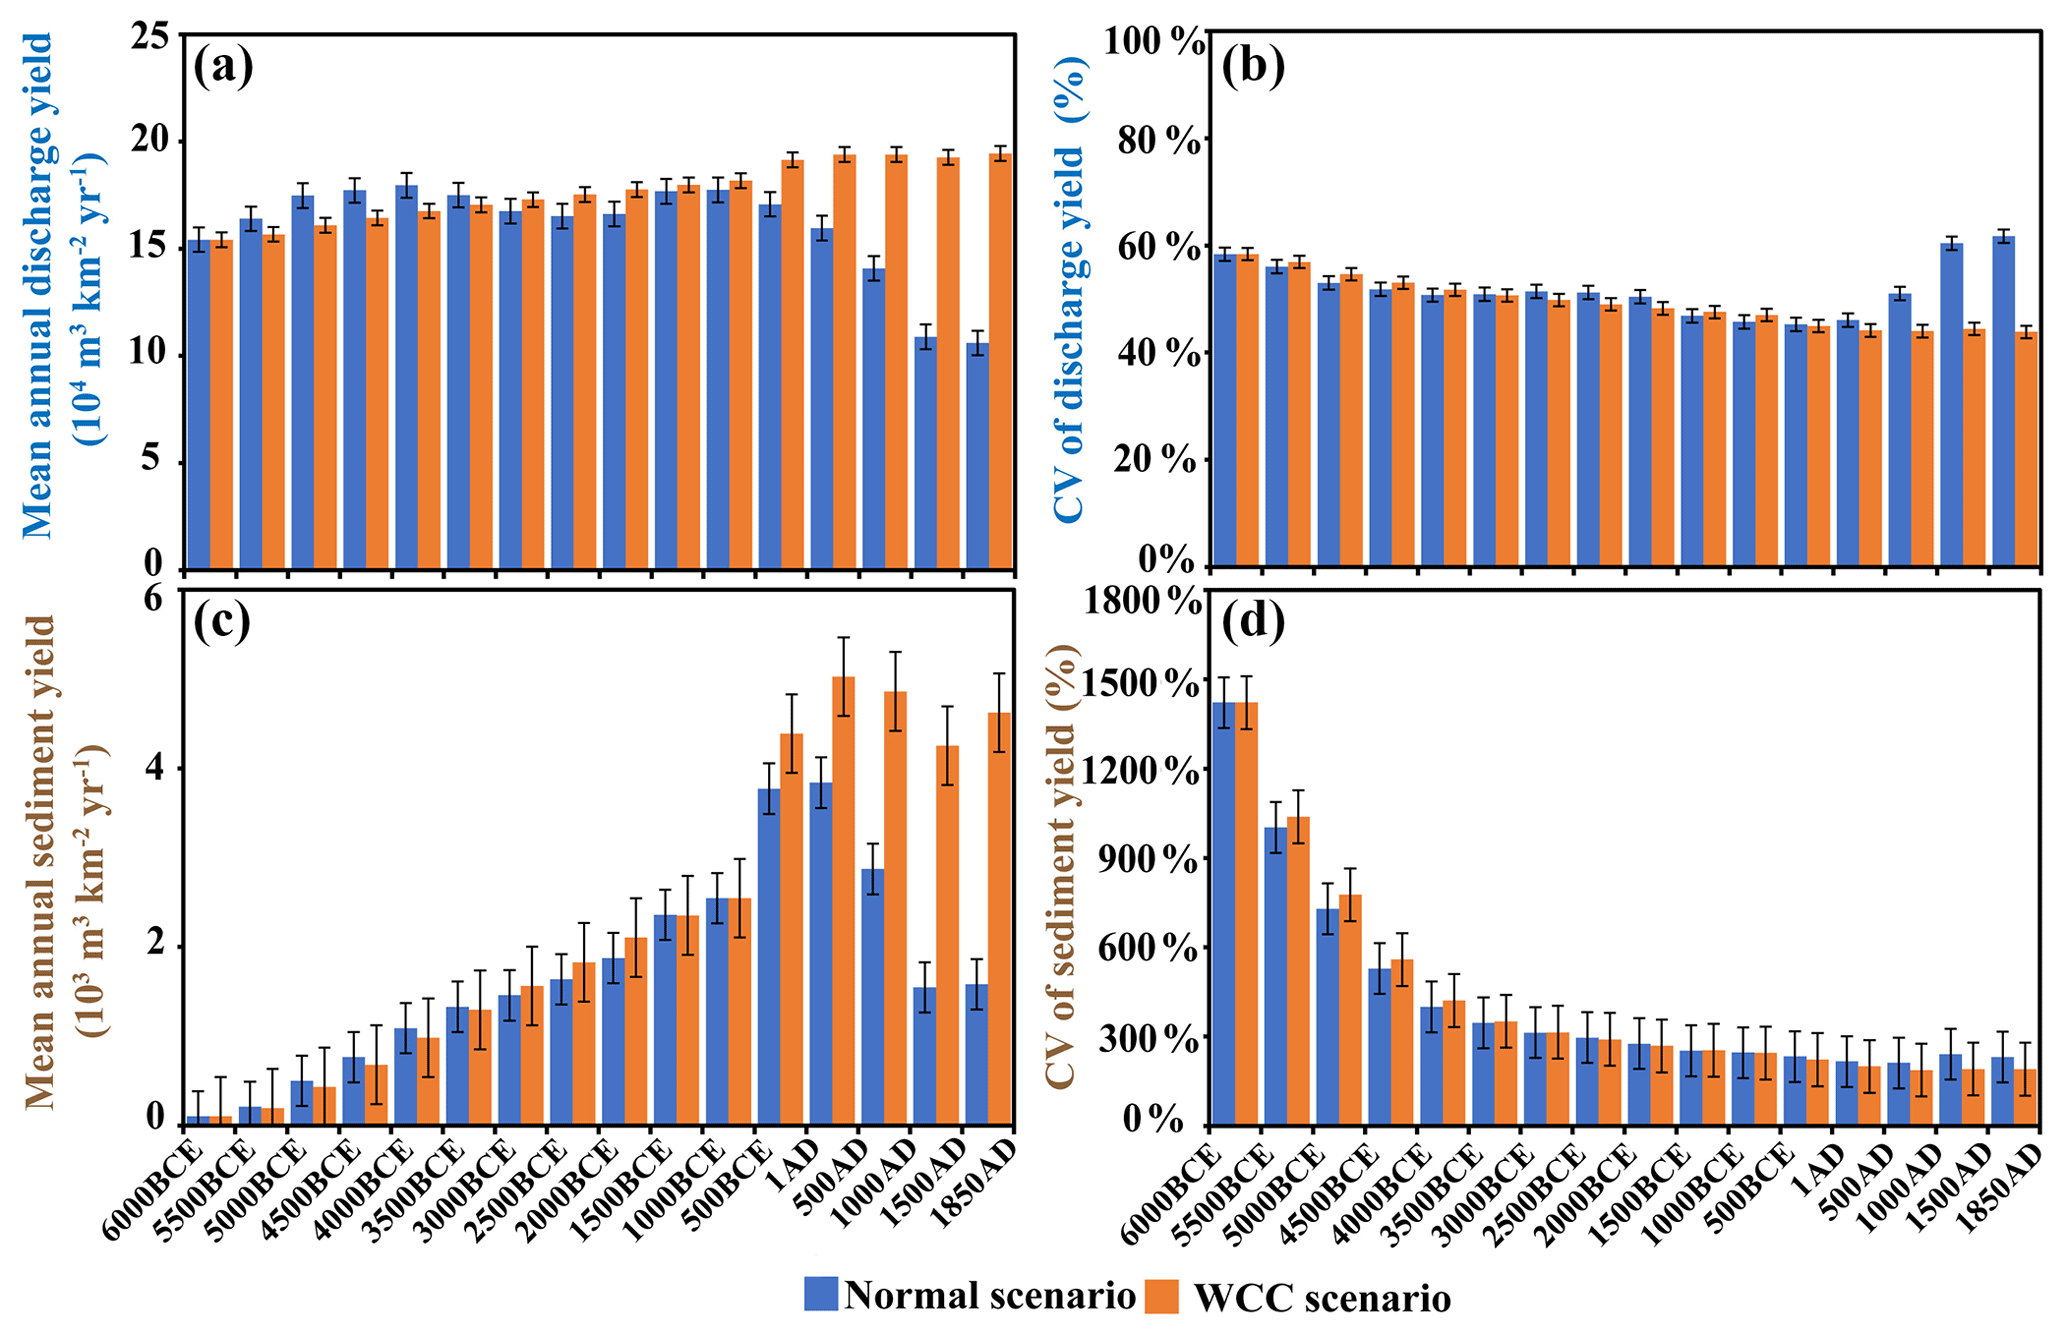
Figure 5Comparison of mean annual discharge yield (a), CV of discharge yield (b), mean annual sediment yield (c) and CV of sediment yield (d) for the Normal and WCC Scenarios.
In both the Normal and WCC scenarios, a large accumulation occurs in the middle reaches of Jing River at about 4000 BCE and in the downstream part of the Wei River around 1000 BCE (Figs. 4a and S9a). However, the sediment thickness in the northern part of the catchment is thicker in the Normal scenario than in the WCC scenario (Figs. 4a and S9a). In the WCC scenario (Fig. S9b), the sediment yields of the sub-catchments located in the northwestern part (such as Jiaoqiao, Qinyang) are larger compared to the Normal scenario (Fig. 4b). Based on the comparison of the results of the Normal scenario with those of the WCC scenario, the intensity of the impact of climate change on the mean annual sediment yield (in the Normal scenario) increases to some extent after 1 AD (more than 20 %, Fig. 5c). The spatial variation coefficients of sediment yield in the two scenarios are almost the same during the simulation (less than 20 %, Fig. 5d), which indicates that climate change has limited impact on the spatial characteristics of sediment yield.
5.1 A regime shift around 1000 BCE
The sediment thickness distribution in the Normal scenario shows a significant increase in the lower reaches of the main Wei River after 1000 BCE (Fig. 4a, black rectangle). The mean annual sediment yield in each sub-catchment also experiences a large increase at the same time (Fig. 4b). Since the comparisons between the Normal and WCC scenarios showed the changes of climate variations would cause a significant decrease for both mean annual discharge and sediment yield after 1000 BCE (Fig. 5), the increments of sediment thickness and sediment yield should be a consequence of the large increase of the land use around the 1000 BCE. This is in agreement with the evaluation of accelerated soil erosion due to human land use change in the Loess Plateau recorded by colluvial components in Holocene loess–soil sequences (Huang et al., 2006), dike breaches (He et al., 2006), temporal changes of sedimentation rate from the Yellow River Delta (Zhao et al., 2013) and previous modeling of the Beiluo River tributary of the Yellow River (Chen et al., 2021). The onset of the human-dominant soil erosion in our simulations (∼1000 BCE) could be earlier than the inferences from the sedimentation rate records in Beilianchi Lake (see the location in Fig. 1a; ∼600 AD; Zhang et al., 2019) and simulated soil erosion rate in the middle reaches of Yellow River (∼1 AD; Zhao et al., 2022a, b). These differences may be caused by the spatial variations of the development of agriculture in the Loess Plateau (Zhuang and Kidder, 2014; Yu et al., 2016).
However, the contribution of climate change to the annual discharge and sediment yield does show some increases after 1000 BCE (Fig. 5). Therefore, these changes would be a signal indicating the change in sensitivity of the fluvial catchment to climate change as a result of increasing ALCC.
Figure 6 shows the trend of sensitivity to climate change of mean annual discharge and sediment yield and their coefficient of spatial variation. The sensitivity alters abruptly when the areal extent of land use exceeds a certain threshold (Fig. 6). When the areal extent is low (<30 %), the sensitivity to climate change declines steadily with increasing areal extent (and thus also with time; Fig. 6). The sensitivity fluctuates when the areal extent is between 30 % and 50 % (Fig. 6). However, when the areal extent of land use is high (>50 %), starting at ∼1000 BCE, the sensitivity increases with increasing areal extent (Fig. 6) indicating a regime shift of the fluvial catchment.
These changes in sensitivity are associated with the change in the geographic center of land use change, which shifts from northwest to southeast in the catchment, and thus the different shifts of vegetation to crops (Fig. S3). In the catchment, the natural vegetation is made up of forest and grass (Fig. S7), which is converted to cropland. Runoff in grassland is more sensitive to climate change than runoff in cropland, whereas runoff in forest is less sensitive than runoff in cropland (Mao and Cherkauer, 2009). The main vegetation change in the catchment during the period from 6000 BCE to around 3000 BCE is from grass to crop in the western and northern parts of the catchment (Fig. S3), which leads to the decreased sensitivity of the catchment discharge and sediment yield and their spatial variations, CV, to climate change (Fig. 6). From around 3000 to 1000 BCE, the sensitivity first sharply increases and then decreases rapidly, which shows its instability. This may be caused by changes in other parameters, such as air temperature (Fig. S2), which are not considered. From 1000 BCE onward, the major anthropogenic vegetation changes are from forest to crop in the southeastern part of the catchment (Fig. S3), which results in the increase in the sensitivity (Fig. 6).
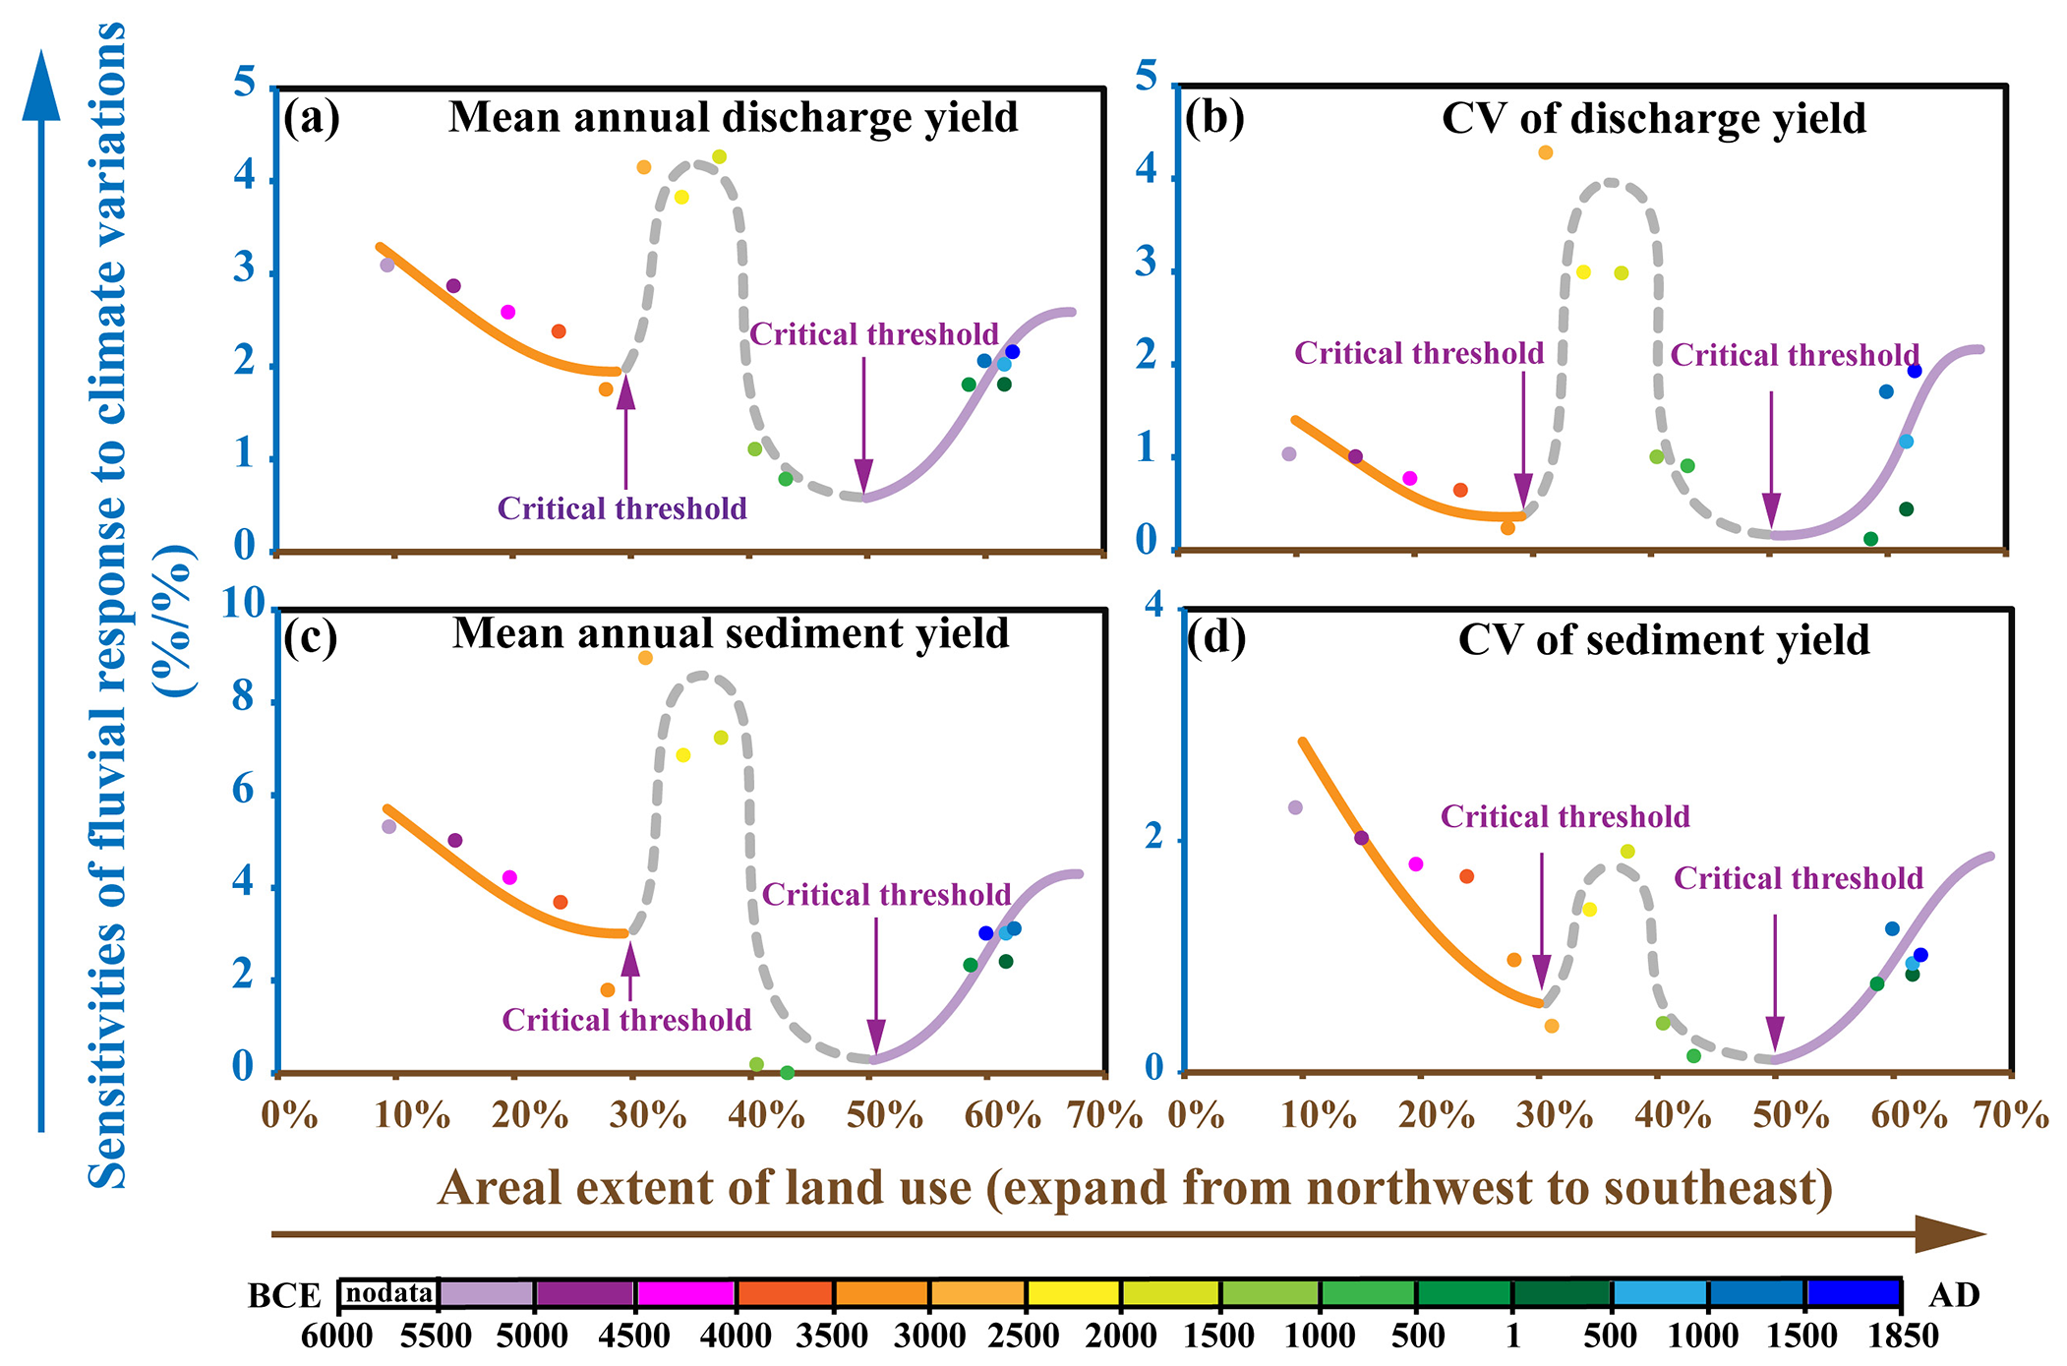
Figure 6Sensitivity of discharge and sediment yield to changes in climate due to the increasing areal extent of land use with time. The colors of dots indicate the simulated time; 50 % land use area corresponds to 1000 BCE.
5.2 Coupling between ALCC by human settlement and floodplain development
The shift of the geographic center of land use change, which causes the change in sensitivity of the Wei River catchment to climate change, could be a result of the increase of the areal extent of land use. Figure 7 shows a good correlation between the spatial distribution of sediment accumulation and the distribution of archaeological sites during the mid-Holocene (Yu et al., 2016). Sediment accumulation and floodplain construction first occur in the downstream part, and then expand to the northwestern part becoming concentrated in the upstream part in the western section of the CLP, in the Qi'an and Yangjiaping sub-catchments (Fig. 7a). This pattern of expansion is consistent with the spatial trend in the growth of the number of archaeological sites during the same period (Yu et al., 2016).
This correlation can be explained by the spatially asynchronous development of floodplains, caused by migration of sediment waves in the catchment. The floodplains provided ideal locations for initial settlements (Clevis et al., 2006). These new settlements, in turn, would have led to an increase in local land use, which, in turn, would result in higher sediment yields. These sediments are then transported further and accumulated downstream, which results in floodplain development there and thus provides new suitable places for further human settlement (Fig. 8). The settlements built on floodplains near rivers that were forced by population increase and the predominance of wheat farming have been common in the middle reaches of the Yellow River since the Late Bronze Age (∼1000 BCE) (Zhuang and Kidder, 2014).
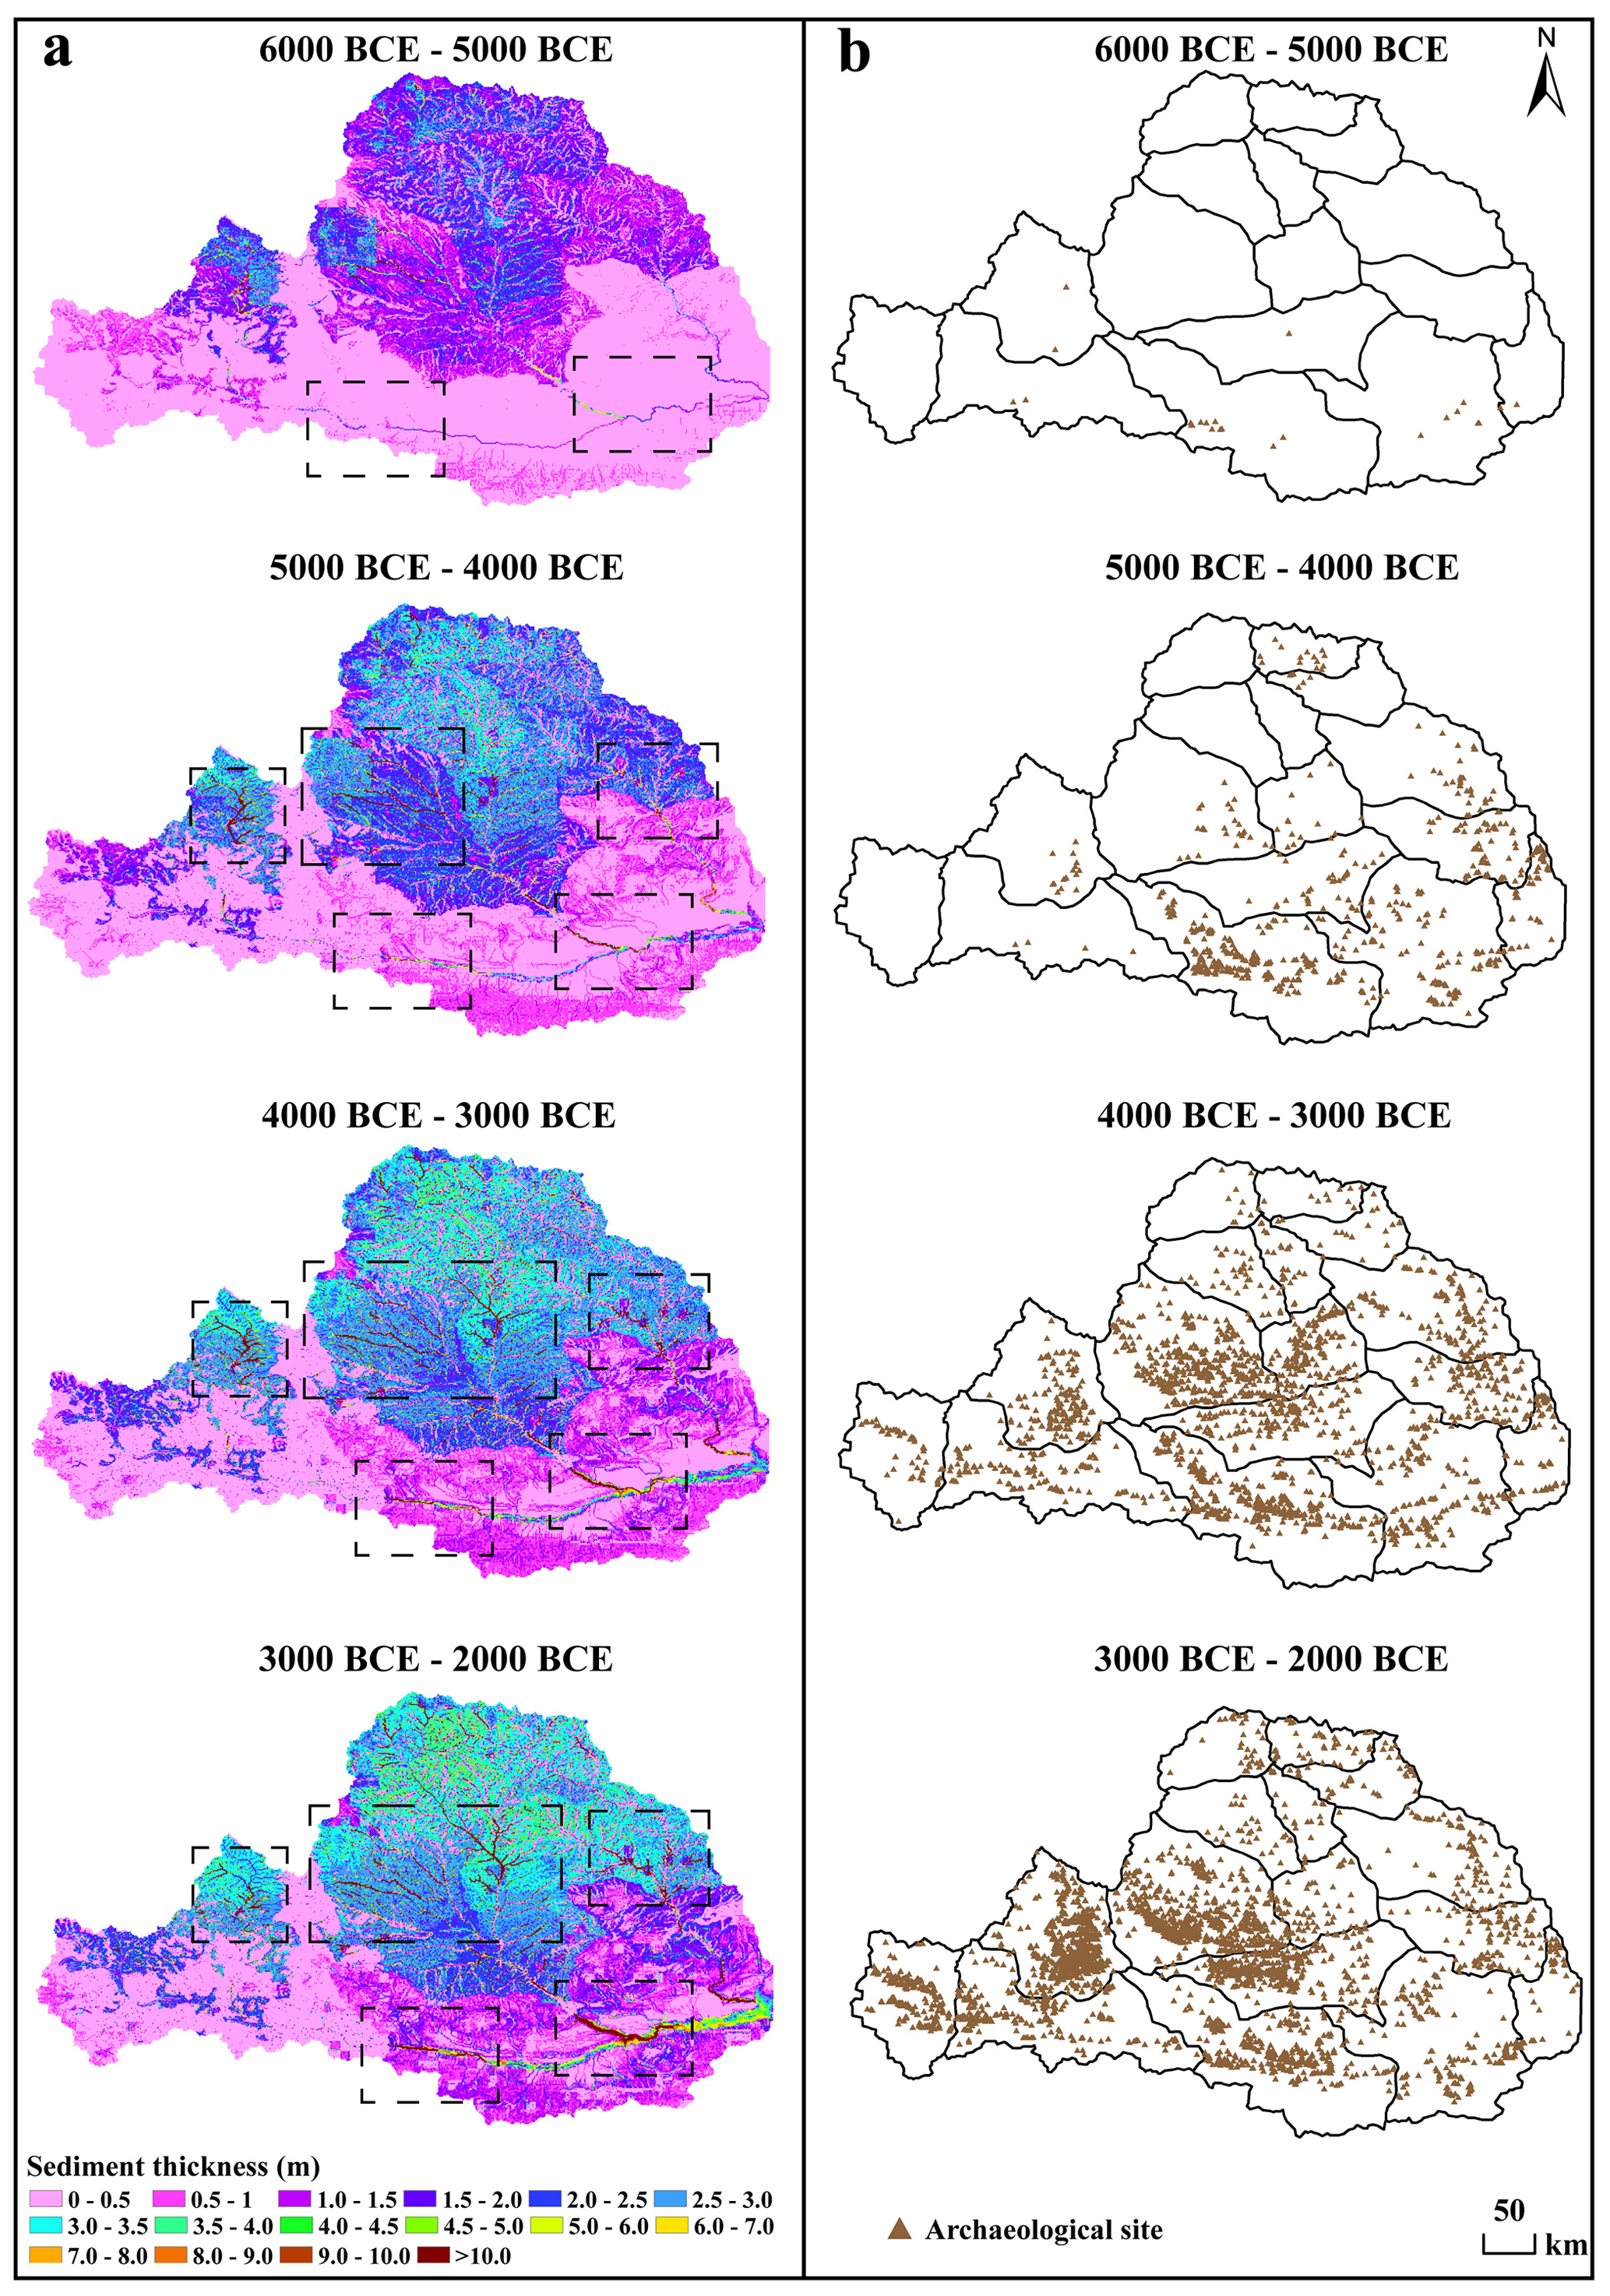
Figure 7The spatial correspondence between the location of sediment aggradation (a) and archaeological sites (b, Yu et al., 2016) during the mid-Holocene.
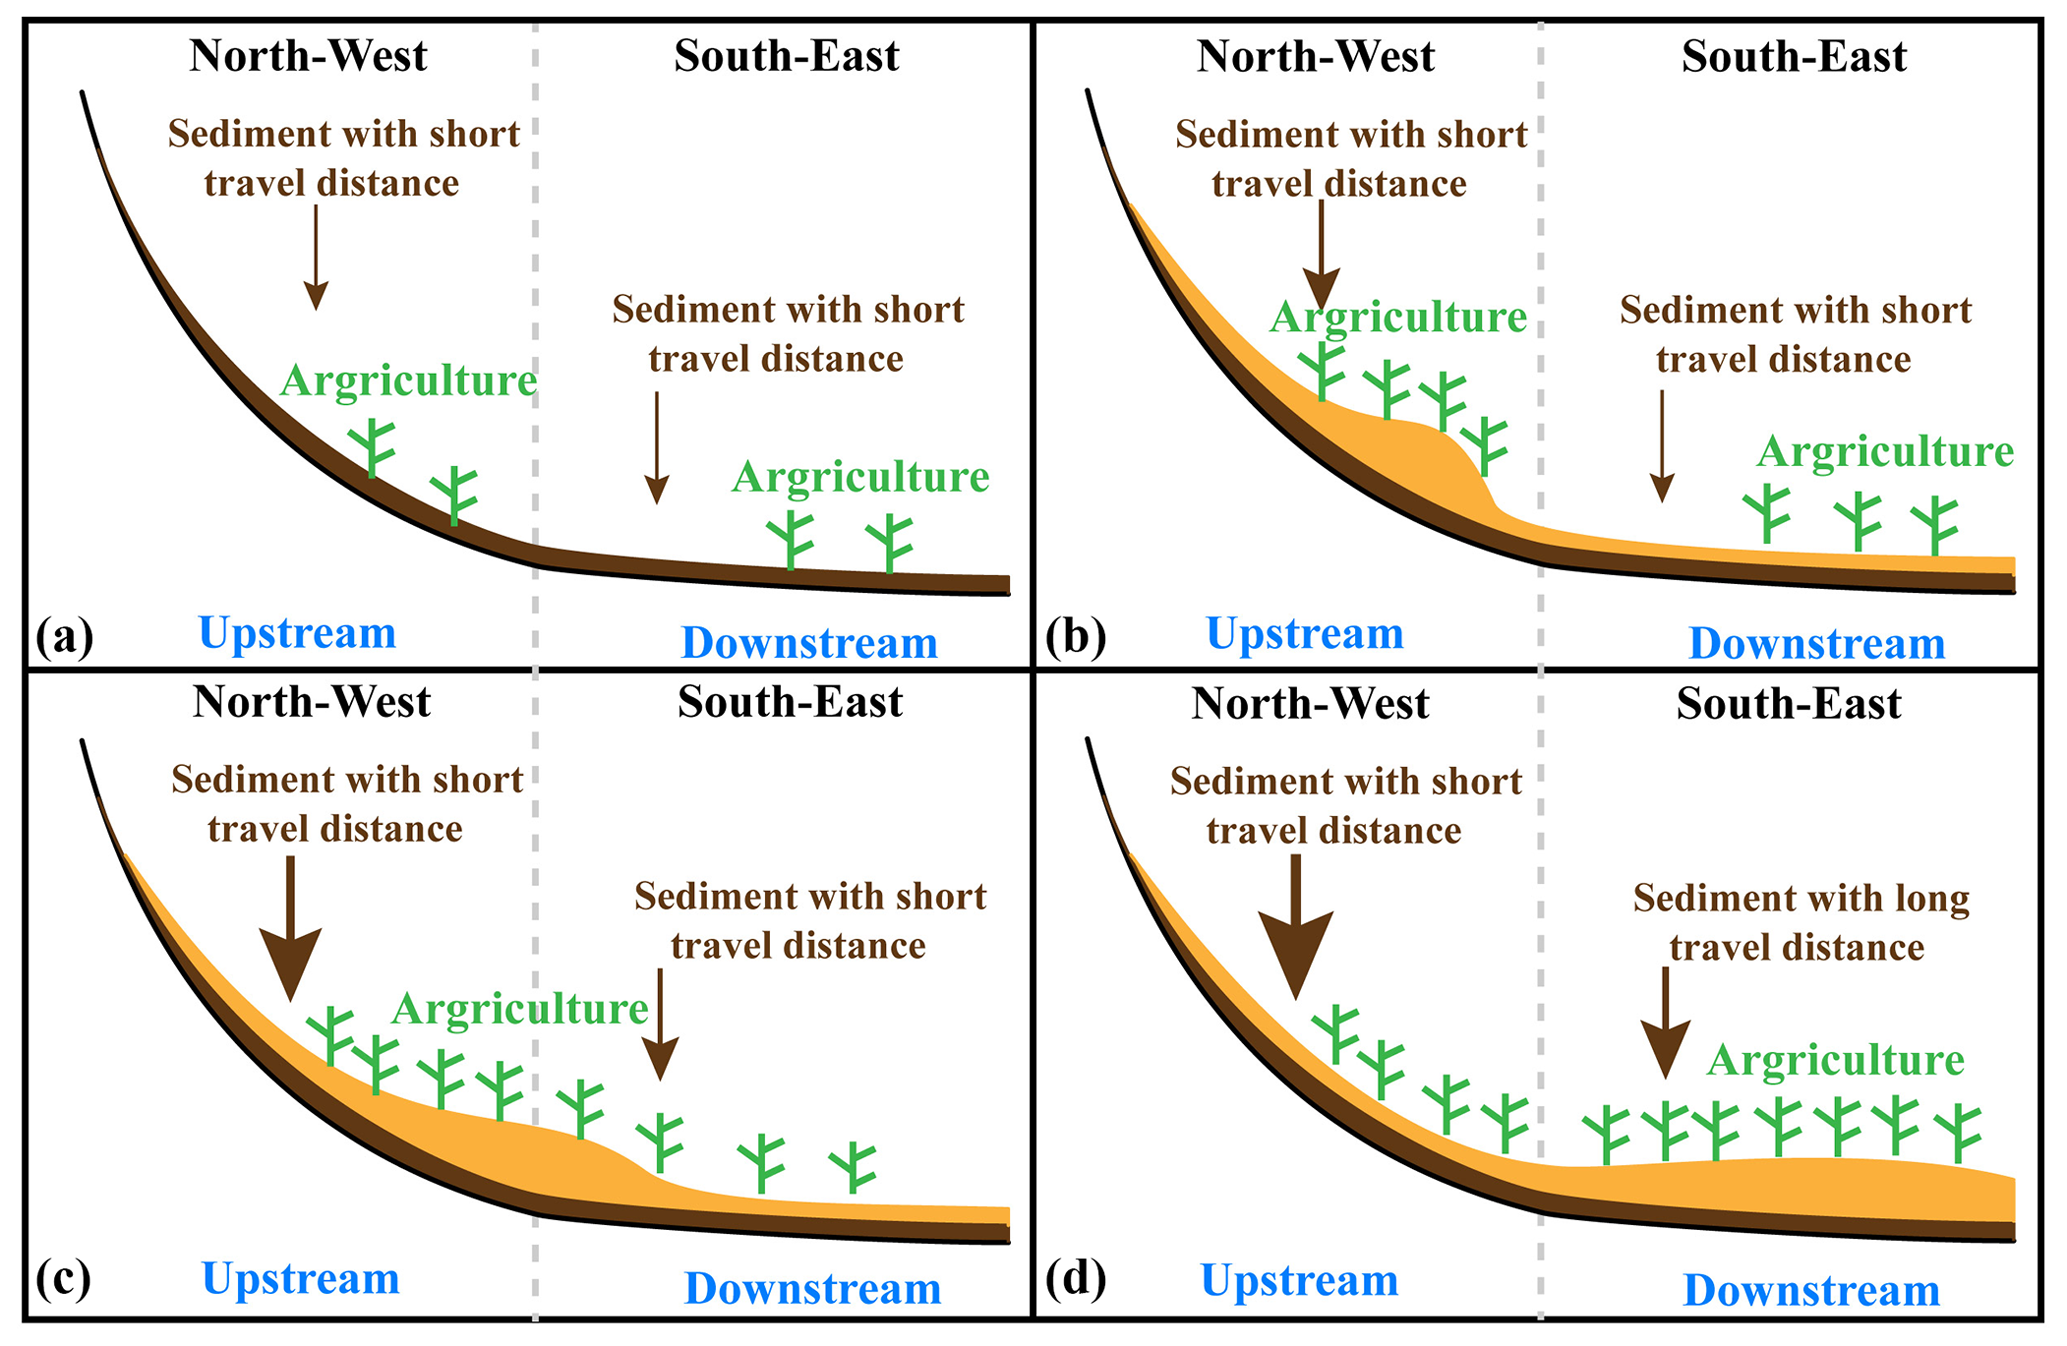
Figure 8Conceptual model for the relationship between expansion of agriculture and fluvial floodplain aggradation.
Therefore, the asynchronous development between human settlement, ALCC and floodplain development shifts the geographic center of land use change as the areal extent of land use increases. This resembles niche construction theory (NCT) from biological and ecological systems (Laland et al., 1996, 1999, 2001; O'Brien and Laland, 2012). NCT places emphasis on the capacity of organisms, in this case humans, to modify their environment and thereby act as co-directors of their own and other species' evolution (Laland et al., 2001; Spengler, 2021).
Land use change in the Wei River catchment in the Chinese Loess Plateau (CLP) not only has a significant direct impact on discharge and sediment yield, but also alters the resilience of this fluvial catchment to climate change. The sensitivity of the catchment to climate change decreases with increasing amounts of areal extent of land use, as long as it is less than 30 %, when the increase in areal extent is dominated by a change from grass to cropland. The sensitivity increases when the areal extent of land use exceeds 50 % of the catchment around 1000 BCE. During this increase in extent, the main vegetation cover changed from trees to crops. This regime shift can be seen by the significant sediment accumulation in the lower reaches starting around 1000 BCE. Our simulation results also suggest that there is a shift of the geographic center of land use change caused by a coupling between early land use, sediment accumulation and resultant floodplain development: new settlements on floodplains lead to further increases in sediment yield and floodplain formation further downstream.
The mapped shapefiles and the code used to process the mapped data are available upon request to the corresponding author. The data for the KK10 scenario can be accessed at https://doi.org/10.1594/PANGAEA.871369 (Kaplan and Krumhardt, 2011). The documentation of the Landlab can be found at https://landlab.readthedocs.io/ (Hutton et al., 2020). The source of Biome-BGC model can be accessed at http://www.ntsg.umt.edu (Bond-Lamberty, 2014).
The supplement related to this article is available online at: https://doi.org/10.5194/esurf-12-163-2024-supplement.
HC wrote the code and performed the simulations. XW and RvB modified the code and improved the simulations. YY provided the data of the archaeological sites. HL modified the main text of the manuscript. HC wrote the manuscript with contributions from all co-authors.
The contact author has declared that none of the authors has any competing interests.
Publisher's note: Copernicus Publications remains neutral with regard to jurisdictional claims made in the text, published maps, institutional affiliations, or any other geographical representation in this paper. While Copernicus Publications makes every effort to include appropriate place names, the final responsibility lies with the authors.
We appreciate Jed O Kaplan for providing the anthropogenic land cover change data simulated by the KK10 model. We also thank Kuang Xueyuan for the simulated paleo-climate results from the CESM model.
This research has been supported by the National Natural Science Foundation of China (grant nos. 42021001 and 41971005) and the Second Tibetan Plateau Scientific Expedition Program (grant no. 2019QZKK0205).
This paper was edited by Andreas Lang and reviewed by Weiming Liu, Amanda Schmidt, and one anonymous referee.
Barnhart, K. R., Hutton, E. W. H., Tucker, G. E., Gasparini, N. M., and Bandaragoda, C.: Short communication: Landlab v2.0: a software package for Earth surface dynamics, Earth Surf. Dynam., 8, 379–397, https://doi.org/10.5194/esurf-8-379-2020, 2020.
Barnola, J. M., Anklin, M., Porcheron, J., Raynaud, D., Schwander, J., and Stauffer, B.: CO2 evolution during the last millennium as recorded by Antarctic and Greenland ice, Tellus B, 47, 264–272, https://doi.org/10.1034/j.1600-0889.47.issue1.22.x, 1995.
Best, J. and Darby, S. E.: The pace of human-induced change in large rivers: Stresses, resilience, and vulnerability to extreme events, One Earth, 2, 510–514, https://doi.org/10.1016/j.oneear.2020.05.021, 2020.
Bloemendal, J., Liu, X., Sun, Y., and Li, N.: An assessment of magnetic and geochemical indicators of weathering and pedogenesis at two contrasting sites on the Chinese Loess plateau, Palaeogeogr. Palaeoclim. Palaeoecol., 257, 152–168, https://doi.org/10.1016/j.palaeo.2007.09.017, 2008.
Bond-Lamberty, B.: bpbond/Biome-BGC, GitHub [data set], https://github.com/bpbond/Biome-BGC (last access: 8 January 2024), 2014.
Broothaerts, N., Notebaert, B., Verstraeten, G., Kasse, C., Bohncke, S., and Vandenberghe, J.: Non-uniform and diachronous Holocene floodplain evolution: a case study from the Dijle catchment, Belgium, J. Quaternary Sci., 29, 351–360, https://doi.org/10.1002/jqs.2709, 2014.
Campforts, B., Shobe, C. M., Steer, P., Vanmaercke, M., and Braun, J.: HyLands 1.0: a Hybrid Landscape evolution model to simulate the impact of landslides and landslide-derived sediment on landscape evolution, Geosci. Model Dev., 13, 3863–3886, https://doi.org/10.5194/gmd-13-3863-2020, 2020.
Carriere, A., Bouteiller, C. L., Tucker, G. E., Klotz, S., and Naaim, M.: Impact of vegetation on erosion: Insights from the calibration and test of a landscape evolution model in alpine badland catchments, Earth Surf. Proc. Land., 45, 1085–1099, https://doi.org/10.1002/esp.4741, 2019.
Chang, J., Li, Y., Wei, J., Wang, Y., and Guo, A.: Dynamic changes of sediment load and water discharge in the Weihe River, China, Environ. Earth Sci., 75, 1–17, https://doi.org/10.1007/s12665-016-5841-9, 2016.
Chen, F., Xu, Q., Chen, J., Birks, H. J. B., Liu, J., Zhang, S., Jin, L., An, C., Telford, R., Cao, X., Wang, Z., Zhang, X., Selvaraj, K., Lu, H., Li, Y., Zheng, Z., Wang, H., Zhou, A., Dong, G., Zhang, J., Huang, X., Bloemendal, J., and Rao, Z.: East Asian summer monsoon precipitation variability since the last deglaciation, Sci. Rep., 5, 11186, https://doi.org/10.1038/srep11186, 2015.
Chen, H., Wang, X., Lu, H., and Van Balen, R.: Anthropogenic impacts on Holocene fluvial dynamics in the Chinese Loess Plateau, an evaluation based on landscape evolution modeling, Geomorphology, 392, 107935, https://doi.org/10.1016/j.geomorph.2021.107935, 2021.
Chen, N., Ma, T., and Zhang, X.: Responses of soil erosion processes to land cover changes in the Loess Plateau of China: A case study on the Beiluo River basin, Catena, 136, 118–127, https://doi.org/10.1016/j.catena.2015.02.022, 2016.
Chen, Y., Wang, K., Lin, Y., Shi, W., Song, Y., and He, X.: Balancing green and grain trade, Nat. Geosci., 8, 739–741, https://doi.org/10.1038/ngeo2544, 2015.
Choudhury, M., Pervez, A., Sharma, A., and Mehta, J.: Human-induced stresses on the rivers beyond their assimilation and regeneration capacity, Ecological Significance of River Ecosystems, Elsevier, 281–298, https://doi.org/10.1016/B978-0-323-85045-2.00019-4, 2022.
Clevis, Q., Tucker, G. E., Lock, G., Lancaster, S. T., Gasparini, N., Desitter, A., and Bras, R. L.: Geoarchaeological simulation of meandering river deposits and settlement distributions: A three-dimensional approach, Geoarchaeology, 21, 843–874, https://doi.org/10.1002/gea.20142, 2006.
Coulthard, T. and Van de Wiel, M.: Climate, tectonics or morphology: what signals can we see in drainage basin sediment yields?, Earth Surf. Dynam., 1, 13–27, https://doi.org/10.5194/esurf-1-13-2013, 2013.
Dodson, J. R., Li, X., Zhou, X., Zhao, K., Sun, N., and Atahan, P.: Origin and spread of wheat in China, Quaternary Sci. Rev., 72, 108–111, https://doi.org/10.1016/j.quascirev.2013.04.021, 2013.
Feng, S.: Origin of Chinese agriculture as viewed from Daliwan cultural relics, Acta Geogr. Sin., 40, 207–214, https://doi.org/10.11821/xb198503002, 1985.
Fuller, I. C., Macklin, M. G., and Richardson, J. M.: The geography of the Anthropocene in New Zealand: Differential river catchment response to human impact, Geogr. Res., 53, 255–269, https://doi.org/10.1111/1745-5871.12121, 2015.
Gao, W.: Effects of water and sediment of Jing Rvier on the deformation of riverbed of Wei River, MS thesis, Xi'an University of Technology, https://doi.org/10.7666/d.D293702, 2006.
Guo, A., Chang, J., Wang, Y., and Huang, Q.: Variations in the runoff-sediment relationship of the Weihe River basin based on the copula function, Water, 8, 223, https://doi.org/10.3390/w8060223, 2016.
Han, X.: Spatial and temporal variation of runoff and sediment in Jing River basin and the influencing factors, MS thesis, Southwest University, https://kns.cnki.net/kcms2/article/abstract (last access: 8 January 2024), 2019.
Hancock, G. R., Wells, T., Dever, C., and Braggins, M.: Hillslope and point based soil erosion – an evaluation of a Landscape Evolution Model, Earth Surf. Proc. Land., 44, 1163–1177, https://doi.org/10.1002/esp.4566, 2019.
He, X., Tang, K., Matthews, J. A., and Owen, G.: Erosion response to anthropogenic activity and climatic changes during the Holocene: case studies in northwestern China and southern Norway, J. Geogr. Sci., 12, 467–471, https://doi.org/10.1007/BF02844605, 2002.
He, X., Zhou, J., Zhang, X., and Tang, K.: Soil erosion response to climatic change and human activity during the Quaternary on the Loess Plateau, China, Reg. Environ. Change, 6, 62–70, https://doi.org/10.1007/s10113-005-0004-7, 2006.
Hobley, D. E. J., Adams, J. M., Siddhartha Nudurupati, S., Hutton, E. W. H., Gasparini, N. M., Istanbulluoglu, E., and Tucker, G. E.: Creative computing with Landlab: an open-source toolkit for building, coupling, and exploring two-dimensional numerical models of Earth-surface dynamics, Earth Surf. Dynam., 5, 21–46, https://doi.org/10.5194/esurf-5-21-2017, 2017.
Hu, B., Sun, R., Chen, Y., Feng, L., and Sun, L.: Estimation of the net ecosystem productivity in Huang-Huai-Hai region combining with Biome-BGC model and remote sensing data, J. Nat. Resour., 26, 2061–2071, https://doi.org/10.11849/zrzyxb.2011.12.006, 2011.
Huang, C., Jia, Y., Pang, J., Zha, X., and Su, H.: Holocene colluviation and its implications for tracing human-induced soil erosion and redeposition on the piedmont loess lands of the Qinling Mountains, northern China, Geoderma, 136, 838–851, https://doi.org/10.1016/j.geoderma.2006.06.006, 2006.
Hutton, E., Barnhart, K., Hobley, D., Tucker, G., Siddhartha Nudurupati, S., Adams, J., Gasparini, N. M., Shobe, C., Strauch, R., Knuth, J., margauxmouchene, Lyons, N., Litwin, D., Glade, R., Giuseppecipolla95, Manaster, A., alangston, Thyng, K., and Rengers, F.: landlab/landlab: Mrs. Weasley (v2.0.1), Zenodo [data set], https://doi.org/10.5281/zenodo.3776837, 2020.
Istanbulluoglu, E. and Bras, R. L.: Vegetation-modulated landscape evolution: Effects of vegetation on landscape processes, drainage density, and topography, J. Geophys. Res.-Earth, 110, F02012, https://doi.org/10.1029/2004JF000249, 2005.
Jia, H., Qu, W., Ren, W., and Qian, H.: Impacts of chemical weathering and human perturbations on dissolved loads of the Wei River, the Yellow River catchment, J. Hydrol., 603, 126950, https://doi.org/10.1016/j.jhydrol.2021.126950, 2021.
Jia, Y.: Study on the Holocene environmental change in the Eastern region of Guanzhong basin and its influence on human culture – a case study on loess profile in Laoguantai, M.S. thesis, Shaanxi Normal University, https://d.wanfangdata.com.cn/thesis/Y505144 (last access: 8 January 2024), 2003.
Jin, R., Li, Y., and Ma, Z.: The historical geography background of Chinese civilization origin on Guan-zhong area, J. Tianjin Normal Univers., 161, 35–42, https://doi.org/10.3969/j.issn.1671-1106.2002.02.008, 2002.
Kaplan, J. O. and Krumhardt, K. M.: The KK10 Anthropogenic Land Cover Change scenario for the preindustrial Holocene, link to data in NetCDF format, PANGAEA [data set], https://doi.org/10.1594/PANGAEA.871369, 2011.
Kaplan, J. O., Krumhardt, K. M., and Zimmermann, N.: The prehistoric and preindustrial deforestation of Europe, Quaternary Sci. Rev., 28, 3016–3034, https://doi.org/10.1016/j.quascirev.2009.09.028, 2009.
Kaplan, J. O., Krumhardt, K. M., Ellis, E. C., Ruddiman, W. F., Lemmen, C., and Goldewijk, K. K.: Holocene carbon emissions as a result of anthropogenic land cover change, Holocene, 21, 775–791, https://doi.org/10.1177/0959683610386983, 2011.
Laland, K. N., Odling-Smee, F. J., and Feldman, M. W.: The evolutionary consequences of niche construction: a theoretical investigation using two-locus theory, J. Evol. Biol., 9, 293–316, https://doi.org/10.1046/j.1420-9101.1996.9030293.x, 1996.
Laland, K. N., Odling-Smee, F. J., and Feldman, M. W.: Evolutionary consequences of niche construction and their implications for ecology, P. Natl. Acad. Sci. USA, 96, 10242–10247, https://doi.org/10.1073/pnas.96.18.10242, 1999.
Laland, K. N., Odling-Smee, J., and Feldman, M. W.: Cultural niche construction and human evolution, J. Evol. Biol., 14, 22–33, https://doi.org/10.1046/j.1420-9101.2001.00262.x, 2001.
Laskar, J., Robutel, P., Joutel, F., Gastineau, M., Correia, A. C. M., and Levrard, B.: A long-term numerical solution for the insolation quantities of the Earth, Astron. Astrophys., 428, 261–285, https://doi.org/10.1051/0004-6361:20041335, 2004.
Li, L. and Lu, H.: A preliminarily quantitative estimation of the sedimentation and erosion rates of loess deposits in Chinese Loess Plateau over the past 250 ka, Acta Geogr. Sin., 65, 37–52, https://doi.org/10.1017/S0004972710001772, 2010.
Li, X., Xue, S., Dodson, J., and Zhou, X.: Holocene agriculture in the Guanzhong Basin in NW China indicated by pollen and charcoal evidence, Holocene, 19, 1213–1220, https://doi.org/10.1177/0959683609345083, 2009.
Liu, D. (Ed.): Loess and Environment, China Ocean Press, Beijing, ISBN: 130312999, 1985.
Liu, H.: Analysis of the conditions and trends of water and sediment in the Weihe River basin, MS thesis, Xi'an University of Technology, https://kns.cnki.net/kcms2/article/abstract (last access: 8 January 2024), 2003.
Macklin, M. G. and Lewin, J.: River stresses in anthropogenic times: Large-scale global patterns and extended environmental timelines, Prog. Phys. Geogr., 43, 3–23, https://doi.org/10.1177/0309133318803013, 2019.
Maisongrande, P., Duchemin, B., and Dedieu, G.: VEGETATION/SPOT: an operational mission for the Earth monitoring; presentation of new standard products, Int. J. Remote Sens., 25, 9–14, https://doi.org/10.1080/0143116031000115265, 2004.
Manley, K., Salles, T., and Müller, D.: Modeling the dynamic landscape evolution of a volcanic coastal environment under future climate trajectories, Front. Earth Sci., 8, 550314, https://doi.org/10.3389/feart.2020.550312, 2020.
Mao, D. and Cherkauer, K. A.: Impacts of land-use change on hydrologic responses in the Great Lakes region, J. Hydrol., 374, 71–82, https://doi.org/10.1016/j.jhydrol.2009.06.016, 2009.
Nachtergaele, F. O., Van Velthuizen, H., Verelst, L., Batjes, N. H., Dijkshoorn, J. A., Van Engelen, V. W. P., Fischer, G., Jones, A., Montanarella, L., Petri, M., Prieler, S., Teixeira, E., Wilberg, D., and Shi, X.: Harmonized World Soil Database (version 1.0), FAO, https://edepot.wur.nl/30776 (last access: 8 January 2024), 2008.
O'Brien, M. J. and Laland, K. N.: Genes, culture, and agriculture: An example of human niche construction, Curre. Anthropol., 53, 434–470, https://doi.org/10.1086/666585, 2012.
Pan, B., Cai, S., and Geng, H.: Numerical simulation of landscape evolution and mountain uplift history constrain – A case study from the youthful stage mountains around the central Hexi Corridor, NE Tibetan Plateau, Sci. China Earth Sci., 64, 412–424, https://doi.org/10.1007/s11430-020-9716-6, 2021.
Peterse, F., Prins, M. A., Beets, C. J., Troelstra, S. R., Zheng, H., Gu, Z., Schouten, S., and Damste, S.: Decoupled warming and monsoon precipitation in East Asia over the last deglaciation, Earth Planet. Sc. Lett., 301, 256–264, https://doi.org/10.1016/j.epsl.2010.11.010, 2011.
Petit, J. R., Jouzel, J., Raynaud, D., Barkov, N. I., Barnola, J. M., Basile, I., Bender. M., Chappellaz, J., Davis, M., Delaygue, G., Delmotte, M., Kotlyakov, V. M., Legrand, M., Lipenkov, V. Y., Lorius, C., Pepin, L., Ritz, C., Saltzman, E., and Stievenard, M.: Climate and atmospheric history of the past 420,000 years from the Vostok ice core, Antarctica, Nature, 399, 429–436, https://doi.org/10.1038/20859, 1999.
Qin, Z., Su, G., Zhang, J., Ouyang, Y., Yu, Q., and Li, J.: Identification of important factors for water vapor flux and CO2 exchange in a cropland, Ecol. Mdel., 221, 575–581, https://doi.org/10.1016/j.ecolmodel.2009.11.007, 2010.
Rabus, B., Eineder, M., Roth, A., and Bamler, R.: The shuttle radar topography mission – a new class of digital elevation models acquired by spaceborne radar, ISPRS J. Photogram. Remote Sens., 57, 241–262, https://doi.org/10.1016/S0924-2716(02)00124-7, 2003.
Ran, D., Liu, L., Zhao, L., Bai, Z., Liu, B., and Wang, H.: The soil conservation practices and streamflow and sediment load changes in the Hekou-Longmen region of middle reaches of Yellow River, edited by: Zhao, L., Yellow River Water Conservancy Press, Zhengzhou, China, ISBN: 9787806213889, 2000.
Ran, D., Zuo, Z., Wu, Y., Li, X., and Li, Z.: Streamflow and sediment load changes response to human activites in the middle reaches of the yellow river, Science China Press, Beijing, China, ISBN: 9787030339331, 2012.
Ren, Z., Zou, F., Yu, Y., Wang, G., Zhang, Z., Fan, S., Zhang, Z., and Sun, C.: China surface daily meteorological dataset (v3.0), National Meteorological Information Centre, http://data.cma.cn/ (last access: 8 January 2024), 2016.
Routschek, A., Schmidt, J., and Kreienkamp, F.: Impact of climate change on soil erosion – A high-resolution projection on catchment scale until 2100 in Saxony/Germany, Catena, 121, 99–109, https://doi.org/10.1016/j.catena.2014.04.019, 2014.
Scheffer, M., Carpenter, S., Foley, J. A., Folke, C., and Walker, B.: Catastrophic shifts in ecosystems, Nature, 413, 591–596, https://doi.org/10.1038/35098000, 2001.
Schmid, M., Ehlers, T. A., Werner, C., Hickler, T., and Fuentes-Espoz, J. P.: Effect of changing vegetation and precipitation on denudation – Part 2: Predicted landscape response to transient climate and vegetation cover over millennial to million-year timescales, Earth Surf. Dynam., 6, 859–881, https://doi.org/10.5194/esurf-6-859-2018, 2018.
Schoorl, J. M. and Veldkamp, A.: Linking land use and landscape process modelling: a case study for the Alora region (south Spain), Agricult. Ecosyst. Environ., 85, 281–292, https://doi.org/10.1016/S0167-8809(01)00194-3, 2001.
Sharma, H., Ehlers, T. A., Glotzbach, C., Schmid, M., and Tielbörger, K.: Effect of rock uplift and Milankovitch timescale variations in precipitation and vegetation cover on catchment erosion rates, Earth Surf. Dynam., 9, 1045–1072, https://doi.org/10.5194/esurf-9-1045-2021, 2021.
Shi, X.: Yangshao culture, in: Encyclopedia of China (Archaeology), edited by: Archaeological Editorial Committee, Encyclopedia of China Publishing House, Beijing, ISBN: 9787500059493, 1986.
Shobe, C. M., Tucker, G. E., and Barnhart, K. R.: The SPACE 1.0 model: a Landlab component for 2-D calculation of sediment transport, bedrock erosion, and landscape evolution, Geosci. Model Dev., 10, 4577–4604, https://doi.org/10.5194/gmd-10-4577-2017, 2017.
Song, S., Wang, S., Fu, B., Liu, Y., Wang, K., Li, Y., and Wang, Y.: Sediment transport under increasing anthropogenic stress: Regime shifts within the Yellow River, China, Ambio, 49, 2015–2025, https://doi.org/10.1007/s13280-020-01350-8, 2020.
Spengler, R. N.: Niche Construction Theory in archaeology: A critical review, J. Archaeol. Meth. Theory, 28, 925–955, https://doi.org/10.1007/s10816-021-09528-4, 2021.
Sun, A., Guo, Z., Wu, H., Qin, L., and Li, X.: Reconstruction of the vegetation distribution of different topographic units of the Chinese Loess Plateau during the Holocene, Quaternary Sci. Rev., 173, 236–247, https://doi.org/10.1016/j.quascirev.2017.08.006, 2017.
Tan, Z., Huang, C., Pang, J., and Zhou, Q.: Holocene wildfires related to climate and land-use change over the Weihe River Basin, China, Quatern. Int., 234, 167–173, https://doi.org/10.1016/j.quaint.2010.03.008, 2011.
Thornton, P. E., Law, B. E., Gholz, H. L., Clark, K. L., Falge, E., Ellsworth, D. S., Goldstein, A. H., Monson, R. K., Hollinger, D., Falk, M., Chen, J., and Sparks, J. P.: Modeling and measuring the effects of disturbance history and climate on carbon and water budgets in evergreen needleleaf forests, Agr. Forest Meteorol., 113, 185–222, https://doi.org/10.1016/S0168-1923(02)00108-9, 2002.
Tian, P., Liu, L., Tian, X., Zhao, G., Klik, A., Wang, R., Lu, X., Mu, X., and Bai, Y.: Sediment yields variation and response to the controlling factors in the Wei River Basin, China, Catena, 213, 106181, https://doi.org/10.1016/j.catena.2022.106181, 2022.
Tucker, G. E. and Hancock, G. R.: Modelling landscape evolution, Earth Surf. Proc. Land., 35, 28–50, https://doi.org/10.1002/esp.1952, 2010.
Van Balen, R., Busschers, F. S., and Tucker, G. E.: Modeling the response of the Rhine–Meuse fluvial system to Late Pleistocene climate change, Geomorphology, 114, 440–452, https://doi.org/10.1016/j.geomorph.2009.08.007, 2010.
Verstraeten, G., Broothaerts, N., Van Loo, M., Notebaert, B., D'Haen, K., Dusar, B., and De Brue, H.: Variability in fluvial geomorphic response to anthropogenic disturbance, Geomorphology, 294, 20–39, https://doi.org/10.1016/j.geomorph.2017.03.027, 2017.
Vörösmarty, C. J., Moore III, B., Grace, A. L., Gildea, M. P., Melillo, J. M., Peterson, B. J., Rastetter, E. B., and Steudler, P. A.: Continental scale models of water balance and fluvial transport: An application to South America, Global Biogeochem. Cy., 3, 241–265, https://doi.org/10.1029/GB003i003p00241, 1989.
Wang, L., Shao, M., Wang, Q., and Gale, W. J.: Historical changes in the environment of the Chinese Loess Plateau, Environ. Sci. Policy, 9, 675–684, https://doi.org/10.1016/j.envsci.2006.08.003, 2006.
Wang, S.: Variation and regularity of water and sediment characteristics in the upper reaches of Wei River, Water Resour. Plan. Design, 9, 8–10, https://doi.org/10.3969/j.issn.1672-2469.2013.09.003, 2013.
White, M. A., Thornton, P. E., Running, S. W., and Nemani, R. R.: Parameterization and sensitivity analysis of the BIOME–BGC terrestrial ecosystem model: Net primary production controls, Earth Interact., 4, 1–84, https://doi.org/10.1175/1087-3562(2000)004<0003:PASAOT>2.0.CO;2, 2000.
Yang, J.: Analysis and driving attribution of hydrological variation transfer law in Wei River basin, MS thesis, Changan University, https://d.wanfangdata.com.cn/thesis/D02278219 (last access: 8 January 2024), 2020.
Yang, Q.: The geomorphic distribution map of Loess Plateau, Loess Plateau SubCenter, National Earth System Science Data Center, National Science & Technology Infrastructure of China, https://doi.org/10.11866/db.loess.2014.21, 2000.
You, S., Di, S., and Yuan, Y.: Study on soil field capacity estimation in the Loess Plateau region, J. Nat. Resour., 24, 545–552, https://doi.org/10.11849/zrzyxb.2009.03.020, 2009.
Yu, Y., Wu, H., Finke, P. A., and Guo, Z.: Spatial and temporal changes of prehistoric human land use in the Wei River valley, northern China, Holocene, 26, 1788–1801, https://doi.org/10.1177/0959683616645943, 2016.
Zhang, C., Zhao, C., Zhou, A., Zhang, K., Wang, R., and Shen, J.: Late Holocene lacustrine environmental and ecological changes caused by anthropogenic activities in the Chinese Loess Plateau, Quaternary Sci. Rev., 203, 266–277, https://doi.org/10.1016/j.quascirev.2018.11.020, 2019.
Zhang, C., Zhao, C., Yu, Z., Zhang, H., Zhou, A., Zhang, X., Feng, X., Sun, X., and Shen, L.: Western Pacific Ocean influences on monsoon precipitation in the southwestern Chinese Loess Plateau since the mid-Holocene, Clim. Dynam., 54, 3121–3134, https://doi.org/10.1007/s00382-020-05159-9, 2020.
Zhang, C., Zhao, C., Zhou, A., Zhang, H., and Chen, F.: Quantification of temperature and precipitation changes in northern China during the “5000-year” Chinese History, Quaternary Sci. Rev., 255, 106819, https://doi.org/10.1016/j.quascirev.2021.106819, 2021.
Zhang, F., Wang, D., and Qiu, B.: Agricultural Phenology Atlas of China, Science Press, Beijing, ISBN: 130313471, 1987.
Zhang, H., Zhao, H., Gu, M., and Zhang, H.: Analysis of variation of water and sediment of Weihe basin in Shaanxi province, J. Yangling Vocat. Tech. College, 6, 1–4, https://doi.org/10.3969/j.issn.1671-9131.2007.02.001, 2007.
Zhang, J., Zhang, X., Li, R., Chen, L., and Lin, P.: Did streamflow or suspended sediment concentration changes reduce sediment load in the middle reaches of the Yellow River, J. Hydrol., 546, 357–369, https://doi.org/10.1016/j.jhydrol.2017.01.002, 2017.
Zhang, J., Shang, Y., Liu, J., Fu, J., Wei, S., and Tong, L.: Causes of variations in sediment yield in the Jinghe River Basin, China, Sci. Rep., 10, 1–18, https://doi.org/10.1038/s41598-020-74980-3, 2020.
Zhao, G., Mu, X., Wen, Z., Wang, F., and Gao, P.: Soil erosion, conservation, and eco-environment changes in the Loess Plateau of China, Land Degrad. Dev., 24, 499–510, https://doi.org/10.1002/ldr.2246, 2013.
Zhao, H., Lin, Y., Delang, C. O., Ma, Y., Zhou, J., and He, H.: Contribution of soil erosion to the evolution of the plateau-plain-delta system in the Yellow River basin over the past 10,000 years, Palaeogeogr. Palaeoclim. Palaeoecol., 601, 111133, https://doi.org/10.1016/j.palaeo.2022.111133, 2022a.
Zhao, H., Lin, Y., Zhou, J., Delang, C. O., and He, H.: Simulation of Holocene soil erosion and sediment deposition processes in the Yellow River basin during the Holocene, Catena, 219, 106600, https://doi.org/10.1016/j.catena.2022.106600, 2022b.
Zhao, W. and Xie, S.: History of Population in China (Zhong guo Ren Kou Shi), People's Publishing House, Beijing, China, ISBN: 9787010002514, 1988.
Zhao, Z.: The elementary analysis of the floating sieving result from the Zhouyuan site (Wangjiazui site), Cult. Relic., 10, 89–96, 2004.
Zhou, J., Zhang, C., and Xie, X.: Vegetation net primary productivity temporal and spatial patterns and influence factors analysis in Weihe watershed, J. Soil Water Conserv., 29, 274–277, https://doi.org/10.13870/j.cnki.stbcxb.2015.02.051, 2015.
Zhou, Q.: High-resolution studies of the evolution of pedogenic environment and effect of human activity during Holocene in the Weihe valley, PhD thesis, Shaanxi Normal University, https://d.wanfangdata.com.cn/thesis/ (last access: 8 January 2024), 2003.
Zhuang, Y. and Kidder, T. R.: Archaeology of the Anthropocene in the Yellow River region, China, 8000–2000 cal. BP, Holocene, 24, 1602–1623, https://doi.org/10.1177/0959683614544058, 2014.
Zuo, Q., Ye, T., Feng, Y., Ge, Z., and Qang, Y. Spatial database of 1:250 000 construction and structure maps in mainland China, Geol. China, 45, 130–163, 2018.