the Creative Commons Attribution 4.0 License.
the Creative Commons Attribution 4.0 License.
 | 18 Jan 2024
Statistical characterization of erosion and sediment transport mechanics in shallow tidal environments – Part 2: Suspended sediment dynamics
Andrea D'Alpaos
Luigi D'Alpaos
Andrea Rinaldo
Luca Carniello
A proper understanding of sediment resuspension and transport processes is key to the morphodynamics of shallow tidal environments. However, a complete spatial and temporal coverage of suspended sediment concentration (SSC) to describe these processes is hardly available, preventing the effective representation of depositional dynamics in long-term modelling approaches. Through aiming to couple erosion and deposition dynamics in a unique synthetic theoretical framework, we here investigate SSC dynamics, following a similar approach to that adopted for erosion (D'Alpaos et al., 2024). The analysis with the peak-over-threshold theory of SSC time series computed using a fully coupled, bi-dimensional model allows us to identify interarrival times, intensities, and durations of over-threshold events and test the hypothesis of modelling SSC dynamics as a Poisson process. The effects of morphological modifications on spatial and temporal SSC patterns are investigated in the Venice Lagoon, for which several historical configurations in the last 4 centuries are available. Our results show that, similar to erosion events, SSC can be modelled as a marked Poisson process in the intertidal flats for all the analysed morphological lagoon configurations because exponentially distributed random variables describe over-threshold events well. Although erosion and resuspension are intimately intertwined, erosion alone does not suffice to describe also SSC because of the non-local dynamics due to advection and dispersion processes. The statistical characterization of SSC events completes the framework introduced for erosion mechanics, and together, they represent a promising tool to generate synthetic, yet realistic, time series of shear stress and SSC for the long-term modelling of tidal environments.
- Article
(14634 KB) - Full-text XML
-
Supplement
(9598 KB) - BibTeX
- EndNote


A comprehensive understanding of morphological processes is key to addressing management and restoration strategies for shallow tidal landscapes. The morphodynamic evolution of these systems can be described by Exner's equation:
where n is the bed porosity, zb is the bed elevation, qb is the bedload, and D and E are the deposition and entrainment rates of sediment, respectively. Bedload is usually negligible in mud-dominated tidal systems because sediment transport mainly occurs in suspension, and thus, the bed level changes are essentially a function of erosion and deposition processes. In order to complete the stochastic framework introduced by D'Alpaos et al. (2024) for the description of erosion events, this study deals with the statistical characterization of suspended sediment concentration (SSC), considered a proxy for depositional processes.
Suspended sediment dynamics in shallow tidal systems are influenced by different hydrodynamic and sedimentological factors that vary over a wide range of spatial and temporal scales (Woodroffe, 2002; Masselink et al., 2014). Both tide and waves represent key drivers controlling sediment entrainment and transport in shallow tidal environments (Wang, 2012), with stochastic wave-forced resuspension occasionally considerably increasing cyclic tide-driven sediment reworking, especially under storm conditions. Wave resuspension together with tide- and wave-driven sediment transport give rise to advection and dispersion mechanisms, leading to basin-wide sediment movement, which largely affect local suspended sediment dynamics (e.g. Nichols and Boon, 1994; Carniello et al., 2011; Green and Coco, 2014). Owing to the complexity of the underlying processes, suspended sediment dynamics in shallow tidal systems is rather entangled, and it is not only linked to the local bottom resuspension. Therefore, to effectively describe suspended sediment transport in shallow tidal systems, a dedicated analysis is required.
Several numerical models have been developed to describe sediment transport, and different techniques have been proposed to upscale the effects on the morphological evolution of tidal systems. For instance, explorative point-based models are extensively used to understand the relative importance of sediment transport processes because of their simplified parameterization, as well as their great conceptual value (Murray, 2007). Furthermore, their reduced computational burden is ideal for investigating trends over long-term timescales. For these reasons, point-based models have been largely adopted, for example, to examine salt marsh fate under different sea level rise scenarios at the century timescale (D'Alpaos et al., 2011; Fagherazzi et al., 2012). However, point-based models potentially miss spatial dynamics associated with sediment transport and, hence, might fail to represent interactions between different morphological units. More detailed, process-based models can fill this gap and account for sediment fluxes between different points up to the whole-basin scale (e.g. Lesser et al., 2004; Carniello et al., 2012). But, because of the explicit description of the short-term interaction between hydrodynamics and sediment transport, the application of process-based models to the long-term timescale is often computationally expensive or even prohibitive. A widespread solution to overcome this limitation is to upscale the effects of short-term sediment transport on bed evolution by means of the so-called “morphological factor”, which is basically a multiplication factor to accelerate the computation of the effects on the morphology (Lesser et al., 2004; Roelvink, 2006).
These approaches implicitly assume that the morphological response of a system in the long term can be directly upscaled from the bed level changes explicitly computed using a representative forcing condition on a much shorter timescale. However, as soon as the morphological evolution of a system is substantially affected by stochastic, episodic events, namely wind waves and storm surges (Tognin et al., 2021), and, therefore, cannot be represented as a continuous process (i.e. purely driven by the tide), this assumption may provide misleading results. Moreover, in tidal systems with fine sediments because of the effect of consolidation, stratification, and armouring of the sediment bed (Mehta et al., 1989), the morphological response is usually critically influenced by the magnitude and the time history of events (Mathew and Winterwerp, 2022), which obviously cannot be reproduced by considering simplified, repetitive forcing conditions.
To explicitly model the effects of stochastic, morphologically meaningful events, as well as their temporal succession, a possible alternative would be to directly consider the physical processes responsible for the morphological evolution (i.e. erosion, transport, and deposition of sediment) instead of upscaling the bed level changes. From this perspective, synthetic statically based models represent a particularly promising framework to reduce the computation burden associated with the explicit description of these processes through the use of independent Monte Carlo realizations.
For this purpose, sufficiently long SSC time series are required. SSC dynamics is usually characterized either by in situ point measurements (e.g. Wren et al., 2000; Gartner, 2004; Brand et al., 2020) or by remote sensing and satellite image analysis (Miller and McKee, 2004; Ruhl et al., 2001; Volpe et al., 2011). However, both of these techniques have some drawbacks and do not offer the proper spatial and temporal coverage required for the statistical characterization. In situ measurements can provide an accurate description of the temporal dynamics of SSC but lack information on its spatial heterogeneity. Moreover, acoustic and optical sensors installed in point turbidity stations require periodic cleaning to prevent failure due to biofouling. Satellite-based data can supply instantaneous information on SSC spatial variability but are barely informative on its temporal dynamics. Indeed, SSC events can hardly be fully captured by satellites with fixed and often long revisit periods. Furthermore, intense SSC typically occurs during severe storms, frequently characterized by clouds, which make satellite data useless. As a matter of fact, reliable long-term SSC time series at the basin scale, required for the statistical analysis performed herein, are seldom available.
In order to overcome these shortcomings and to exploit measurements of in situ point observations and satellite images, these data can be combined to calibrate and test numerical models (Ouillon et al., 2004; Carniello et al., 2014; Maciel et al., 2021), thereby using them as physically based “interpolators” to compute temporal and spatial SSC dynamics required by this analysis. Here, we used a previously calibrated and widely tested Wind Wave–Tidal Model (WWTM) (Carniello et al., 2005, 2011) coupled with a sediment transport model (Carniello et al., 2012) to investigate SSC dynamics.
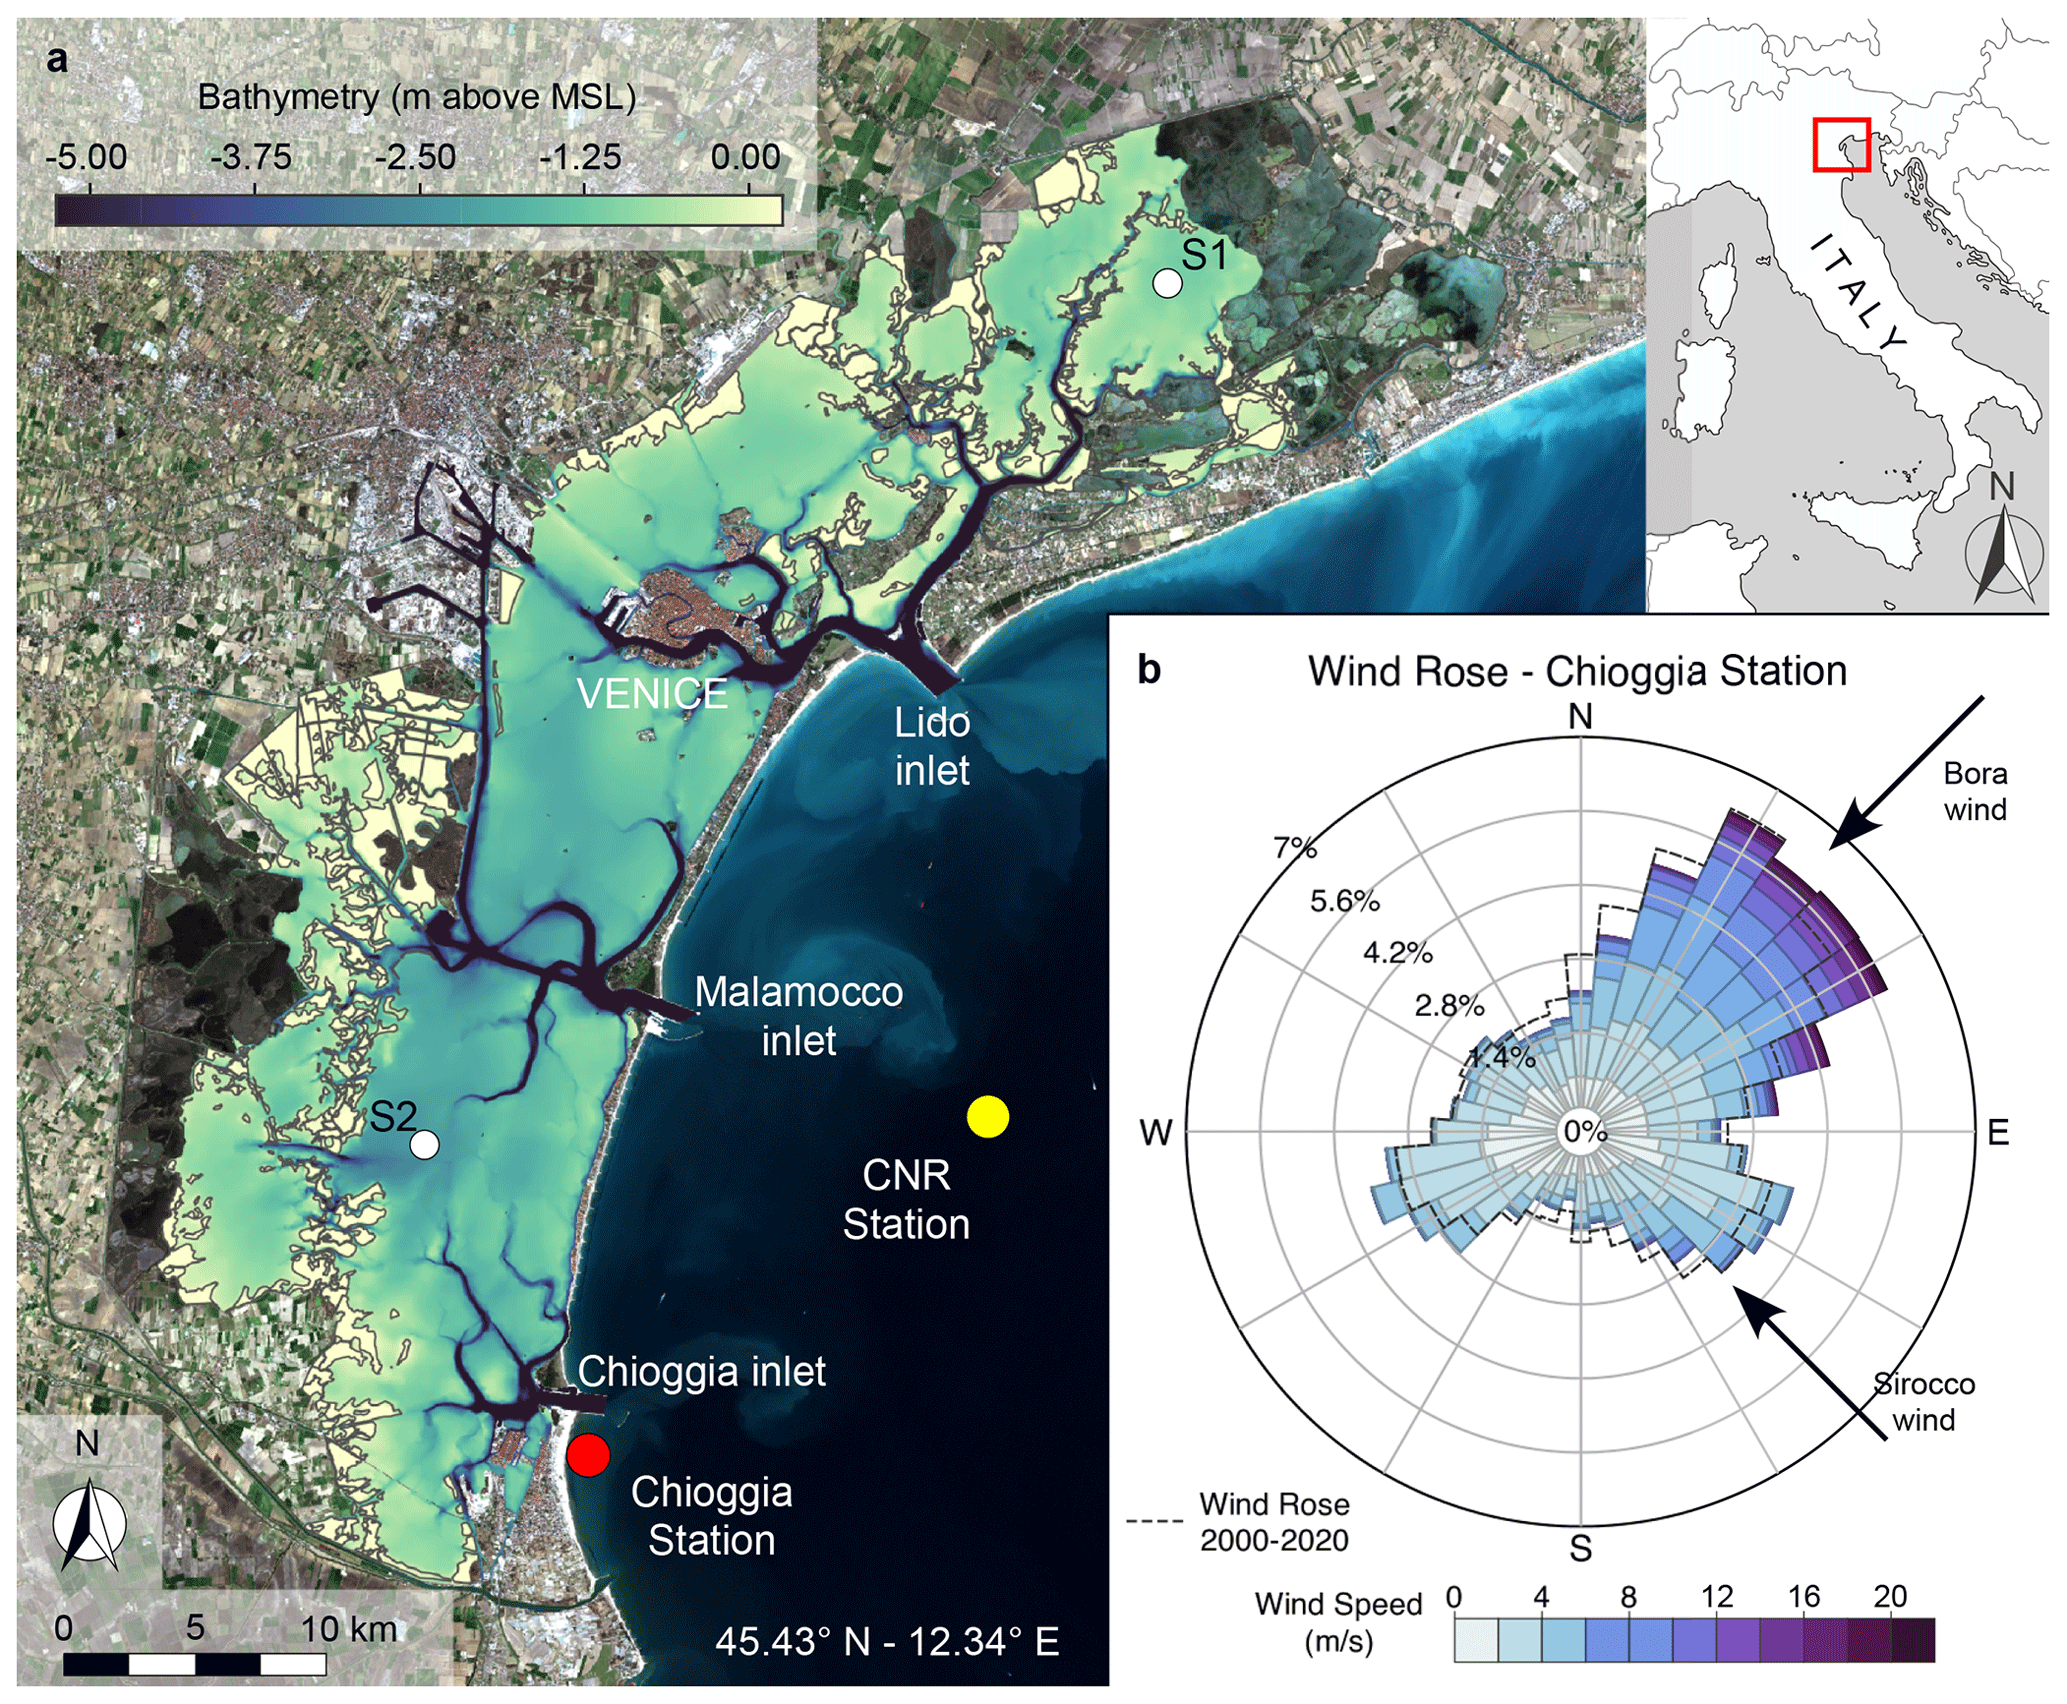
Figure 1Morphological features and wind conditions characterizing the Venice Lagoon. (a) Bathymetry of the Venice Lagoon (Base satellite image: Copernicus Sentinel data 2020, https://scihub.copernicus.eu/, last access: 15 January 2024). The locations of the anemometric (Chioggia) and oceanographic (CNR Oceanographic Platform) stations are also shown, together with the locations of the two stations (S1 and S2) for which we provide detailed statistical characterization of over-threshold events. (b) Wind rose for the data recorded at the Chioggia station in 2005. Dashed line shows the wind rose for the period 2000–2020.
This study aims to verify if the proposed framework can be properly applied over long-term timescales and, hence, is independent of the specific morphological setting of a tidal basin. Hence, we perform the analysis on the Venice Lagoon, Italy (Fig. 1), for which several historical morphological configurations are available in the last 4 centuries (Carniello et al., 2009; D'Alpaos, 2010; Finotello et al., 2023). In particular, we considered the following six historical configurations: 1611, 1810, 1901, 1932, 1970, and 2012. For each of them, we run a 1-year-long simulation forced with representative tidal and meteorological boundary conditions. The computed SSC time series have been analysed on the basis of the peak-over-threshold (POT) theory, following the approach introduced by D'Alpaos et al. (2013) and expanding the analysis performed by Carniello et al. (2016) to study the statistics of SSC in the present configuration of the Venice Lagoon. Our analysis provides a spatial and temporal characterization of resuspension events for the Venice Lagoon from the beginning of the 17th century to the present day, in order to show how morphological modifications affected sediment transport and to set up a stochastic framework to forecast future scenarios.
The Venice Lagoon (Fig. 1) has undergone different morphological changes over the last 4 centuries, mainly associated with anthropogenic modifications (Carniello et al., 2009; D'Alpaos, 2010; Finotello et al., 2023). From the beginning of the 15th century, the main rivers (Brenta, Piave, and Sile) were gradually diverted in order to flow directly into the sea and prevent the lagoon from silting up, but this triggered the present-day sediment starvation condition. The inlets were provided with jetties between 1839 and 1934, and deep navigation channels were excavated to connect the inner harbour with the sea between 1925 and 1970 (D'Alpaos, 2010). The jetties deeply changed the hydrodynamics at the inlets, establishing an asymmetric hydrodynamic behaviour responsible for a net export of sediment toward the sea after their construction (Martini et al., 2004; Finotello et al., 2023), especially during severe storm events, which are responsible for the resuspension of large sediment volumes (Carniello et al., 2012). In general, these modifications, together with sea level rise, heavily influenced sediment transport and triggered strong erosion processes in the following period. The net sediment loss clearly emerges from the comparison among the different surveys of the Venice Lagoon, which show a generalized deepening of tidal flats and subtidal platforms, as well as a reduction in the salt marsh area (Carniello et al., 2009). Indeed, in the last century, the average tidal-flat bottom elevation lowered from −0.51 m to −1.49 m a.m.s.l., above mean sea level), while the salt marsh area progressively shrank from 164.36 to 42.99 km2 (Tommasini et al., 2019). This erosive trend displays a relative slowdown in the last 30 years because of the larger hydrodynamic forcing required to rework bed sediment at an increasing water depth (Finotello et al., 2023). However, repeated closures of storm surge barriers designed to protect the city of Venice from flooding and known as the Mo.S.E. system are expected to further exacerbate this morphological degradation by cutting off significant supplies of inorganic sediments brought in by intense storm surge events (Tognin et al., 2022a). As a result, the morphological evolution of the lagoon in the last 4 centuries has been strongly affected by anthropogenic interventions, along with sea level rise.
To study the influence of these morphological changes on suspended sediment dynamics, we considered six different historical configurations of the Venice Lagoon, ranging from the beginning of the 17th century to the present (Fig. S1 in the Supplement). The three oldest configurations (i.e. 1611, 1810, and 1901) were modelled by relying on historical maps, whereas the topographic surveys carried out by the Venice Water Authority (Magistrato alle Acque di Venezia) in 1932, 1970, and 2003 were used for the more recent ones (D'Alpaos, 2010; Finotello et al., 2023). Due to some morphological modifications at the three inlets associated with the Mo.S.E. system (almost completed in 2012), the 2003 configuration was updated, so we will refer to this configuration as the 2012 configuration. Each bathymetry and, hence, the elevation of grid elements refers to the local mean sea level at the time when each survey was performed. For a detailed description of the methodology applied for the reconstruction of the historical configurations of the Venice Lagoon and additional information on the more recent bathymetric data, we refer the reader to Tommasini et al. (2019). Further details on the geomorphological setting and the implications on erosion and resuspension events are reported in D'Alpaos et al. (2024).
2.1 Numerical model
The flow field and sediment transport in the six configurations of the Venice Lagoon are computed by using a numerical model, consisting of three modules. The coupling of the hydrodynamic module with the wind wave module describes the hydrodynamic flow field, together with the generation and propagation of wind waves (WWTM; Carniello et al., 2005, 2011), while the sediment transport and the bed evolution module (STABEM) evaluates the sediment dynamics and the effects on the morphology (Carniello et al., 2012). All modules share the same computational grid.
The hydrodynamic module solves the 2-D shallow water equations using a semi-implicit staggered finite-element method, based on Galerkin's approach (Defina, 2000). The equations are suitably rewritten in order to deal with flooding and drying processes in morphologically irregular domains. Moreover, the hydrodynamic module provides the flow field characteristic used by the wind wave module to simulate the generation and propagation of wind waves.
The wind wave module (Carniello et al., 2011) solves the wave action conservation equation parameterized using the zero-order moment of the wave action spectrum in the frequency domain (Holthuijsen et al., 1989). The spatial and temporal patterns of the wave period are computed using an empirical function relating the mean peak wave period to the local wind speed and water depth (Young and Verhagen, 1996; Breugem and Holthuijsen, 2007; Carniello et al., 2011).
The WWTM provides both current- and wave-induced bottom shear stresses. The bottom shear stress induced by currents, τtc, is computed using the Strickler formulation, which, in the case of a turbulent flow over a rough wall, reads as follows (Defina, 2000):
where ρ is water density; g is the gravity acceleration; Y is the effective water depth (i.e. the actual volume of water per unit area); q is the flow rate per unit width; Ks is the Strickler roughness coefficient; and H is an equivalent water depth accounting for ground irregularities (Defina, 2000). The bottom shear stress induced by wind waves, τww, is computed as a function of the total horizontal orbital velocity at the bottom, um, and the wave friction factor, fw, as follows:
The bottom orbital velocity, um, is evaluated by applying the linear theory and is also used, together with the wave period and median grain size, to compute the wave friction factor (Soulsby, 1997). Because of the non-linear interaction between the wave and current boundary layers, the total bottom shear stress, τwc, is enhanced beyond the linear addition of the current- and wave-driven stresses. To account for this process, in the WWTM, the empirical formulation suggested by Soulsby (1995, 1997) is adopted:
The sediment transport and bed evolution module (STABEM; Carniello et al., 2012) is based on the solution of the advection–diffusion equation and Exner's equation:
where C is the depth-averaged sediment concentration, represents the space- and time-dependent 2-D diffusion tensor, E and D are the entrainment and deposition rate of bed sediment, zb is the bed elevation, and n is the bed porosity that is assumed to be equal to 0.4. The subscript i refers to the sediment classes that are typically represented by non-cohesive (sand – s) and cohesive (mud – m) sediment in shallow tidal environments. The relative local content of mud (pm) can be used to mark off the transition between the cohesive or non-cohesive nature of the mixture and determines the critical value of the bottom shear stress. To discriminate between non-cohesive and cohesive behaviours, the threshold value of mud content pmc is set equal to 10 % (van Ledden et al., 2004).
The deposition rate of pure sand, Ds, is given by
where ws is the sand settling velocity, and r0 is the ratio of near-bed to depth-averaged concentration, which is assumed constant and equal to 1.4 (Parker et al., 1987).
The deposition rate of pure cohesive mud, Dm, is computed using Krone's formula:
where wm is the mud settling velocity, τwc is the bottom shear stress, and τd is the critical shear stress for deposition. The settling velocities, ws and wm, are computed using the formulation proposed by van Rijn (1984) for solitary particles in clear and still water, thus not incorporating flocculation effects that are negligible for particle diameters larger than 20 µm (Mehta et al., 1989). The critical shear stress for deposition, τd, largely varies among different tidal systems and, for the Venice Lagoon, we set τd=1 Pa on the basis of field measurements (Amos et al., 2004).
Both sand and mud erosion rates strongly depend on the cohesive nature of the mixture. The erosion rate for pure sand, Es, is described by the van Rijn (1984) formulation when the mixture is non-cohesive (pm≤pmc) and by the Partheniades formula for cohesive mixtures (pm>pmc):
The erosion rate for pure mud, Em, is described by the formulation proposed by van Ledden et al. (2004) for non-cohesive mixtures (pm≤pmc) and by the Partheniades formula for cohesive mixtures (pm>pmc):
In Eqs. (9) and (10), D* denotes the dimensionless grain size, and it is computed as , where S is the sediment-specific density, and ν is the water kinematic viscosity. T is the transport parameter. Mnc and Mc are the specific entrainments for non-cohesive and cohesive mixtures, respectively, which can be computed as follows (van Rijn, 1984; van Ledden et al., 2004):
where Mm is the specific entrainment for pure mud, and it is set equal to g m s−1 (Carniello et al., 2012). The parameter α is equal to (Carniello et al., 2012).
The transport parameter, T, is usually defined as , where τc is the critical shear stress for erosion and can be assumed to vary monotonically between the critical value for pure sand, τcs, and the critical value for pure mud, τcm, depending on the mud content (van Ledden et al., 2004):
However, this classic definition of the transport parameter describes a sharp transition between T=0 and that does not take into account the spatial and temporal variability in both τwc and τc. Indeed, in real tidal systems, the bottom shear stress slightly varies, owing to the non-uniform flow velocity, wave characteristics, and small-scale bottom heterogeneity, while the critical shear stress is also affected by the random grain exposure and bed composition in time and space. Hence, following the stochastic approach suggested by Grass (1970), both the total bottom shear stress, τwc, and the critical shear stress for erosion, τc, are treated as random variables ( and , respectively) with lognormal distributions, and their expected values are those calculated by WWTM and STABEM. Consequently, the erosion rate depends on the probability that exceeds (Carniello et al., 2012). The result of this stochastic approach is a smooth transition between T=0 and . The comparison with SSC field measurements shows a much better agreement of the stochastic approach when compared to that of the classic formulation (see the Supplement and Fig. S3). Finally, erosion and deposition rates of sand and mud result in a variation in the bed level and composition through time, which is computed using Eq. (6) and updating the local mud content.
The model has been widely calibrated and tested in the most recent configuration of the Venice Lagoon, i.e. when field data are available. Since the hydrodynamic model performance has been reported when considering the erosion dynamics (D'Alpaos et al., 2024), here we summarize the ability of the sediment transport model to reproduce SSC by reporting the standard Nash–Sutcliffe model efficiency (NSE) parameter computed when field data are available and refer the interested reader to the Supplement (Figs. S4 and S5) and the literature (Carniello et al., 2012; Tognin et al., 2022a) for a more detailed comparison. Adopting the classification proposed by Allen et al. (2007), the model performance can be rated from excellent to poor (i.e. NSE > 0.65 excellent; 0.5 < NSE < 0.65 very good; 0.2 < NSE < 0.5 good; NSE < 0.2 poor). The STABEM model is very good to excellent in reproducing SSC (NSEmean=0.65; NSEmedian=0.62; NSESD=0.17) (statistics are derived from calibration reported in Carniello et al., 2012, their Tables 2 and 3, and Tognin et al., 2022a, their Table S2). Importantly, the sediment transport model not only correctly reproduces the magnitude of the SSC but also captures its modulation induced by tidal currents and wind wave variations (Figs. S4 and S5).
The coupled hydrodynamic and sediment transport models were used to perform 1-year-long simulations within the six different computational grids representing the historical configurations of the Venice Lagoon and the portion of the Adriatic Sea in front of it. The hourly tidal level gauged at the Consiglio Nazionale delle Ricerche (CNR) Oceanographic Platform, located in the Adriatic Sea offshore of the lagoon, and wind velocities and directions recorded at the Chioggia anemometric station are imposed as boundary conditions (Fig. 1).
All configurations were forced with tidal levels and wind climate measured during the whole year of 2005 because the cumulative distribution frequency of wind velocity measured in 2005 is the closest to that of the whole period from 2000 to 2020 (D'Alpaos et al., 2024) and, consequently, can be considered a representative year for the wind climate (Fig. 1). Forcing all the historical configurations of the Venice Lagoon with the same wind and tidal conditions enables us to isolate the effects of the morphological modifications on the wind wave field, hydrodynamics, and sediment dynamics. Because bed elevation in each computational grid refers to the mean sea level at the time of each survey, we implicitly take into account the effects of historical relative sea level variations.
To correctly model SSC and bed evolution, the knowledge of the bed sediment composition is crucial. Sufficiently detailed, spatially distributed grain-size data are available for the present-day configuration of the Venice Lagoon (Amos et al., 2004; Umgiesser et al., 2006). Using this dataset, Carniello et al. (2012) empirically related the median grain size D50 to the local bottom elevation and the distance from the inlets:
where hf is the bottom elevation (in m a.m.s.l., above mean sea level); L is the linear distance from the closer inlet (in km); and D50 and Dhf are the grain diameter (µm). This relationship describes a coarsening of the sediment grain size distribution at deeper locations (i.e. channels) and at shorter distances from the sea (Fig. S2). Because the bottom elevation and the distance from the inlet are the two main parameters describing the spatial variation in sediment grain size, we assume that this relationship holds independently on the specific morphological configuration of the Venice Lagoon, and we used Eqs. (13) and (14) to compute the distribution of median grain size D50 in all of the six selected historical configurations.
The spatial distribution of mud content, pm, is then computed as a combination of the local D50 and the typical grain size of mud and sand fractions (Umgiesser et al., 2006) as follows:
where Dm and Ds are the typical grain size of mud and sand, respectively. Analysing the grain size distribution measured in the Venice Lagoon (Amos et al., 2004; Umgiesser et al., 2006), we set Dm=20 µm and Ds=200 µm.
Another important issue to consider when studying SSC dynamics in shallow tidal environments is the presence of benthic and halophytic vegetation, which both shelters the bed against the hydrodynamic action and increases the local critical shear stress for erosion because of the presence of roots. While the presence of halophytic vegetation over salt marshes is almost ubiquitous, reconstructing the presence of benthic vegetation on the tidal flats is much more difficult, even for the present configuration of the lagoon, and is practically impossible for the older configurations (Goodwin et al., 2023). For the above reasons and for the sake of homogeneity, the simulations of the present study neglect the presence of benthic vegetation on the tidal flat and assume all salt marsh platforms to be completely vegetated in each configuration of the lagoon, thus neglecting sediment resuspension over them (Christiansen et al., 2000; Temmerman et al., 2005).
2.2 Peak-over-threshold analysis of SSC
The interplay among the different drivers that control suspended sediment dynamics in shallow tidal environments can be fully framed only by also taking into account its stochastic components, associated with wind waves and storm surges, which are largely responsible for the morphodynamic evolution of these systems (Carniello et al., 2011; Tognin et al., 2021). To this aim, in the present work, we statistically characterize the spatial and temporal dynamics of resuspension events by applying the peak-over-threshold (POT) theory (Balkema and de Haan, 1974) to the 1-year-long time series of SSC computed with the numerical model described above for the different configurations of the Venice Lagoon.
Before applying the POT analysis, the SSC time series provided by the numerical simulations were low-pass filtered, by applying a moving average procedure with a time window of 6 h, in order to preserve the tide-induced modulation of the signal but, at the same time, to remove artificial up-crossing and down-crossing of the threshold generated by short-term fluctuations. This pre-processing procedure prevents the identification of a false dependence of subsequent over-threshold events due to spurious fluctuations.
Once a proper threshold, C0, is chosen, the POT identifies the following three different random variables: interarrival times, durations, and intensities of the threshold exceedances. The interarrival time is defined as the time interval between two consecutive up-crossings of the threshold, the duration of the events is the time elapsed between any up-crossing and the subsequent down-crossing of the threshold, and, finally, the intensity is calculated as the largest exceedance of the threshold in the time lapse between an up-crossing and the subsequent down-crossing. These random variables are characterized by their probability density functions and the corresponding moments for any location in all the considered configurations of the Venice Lagoon, in order to provide a complete description of the SSC pattern. Besides synthetically characterizing over-threshold events, these three variables can be combined to compute more complex metrics to describe SSC dynamics (e.g. the volume of sediment reworked in a selected time frame).
The nature of the stochastic processes can be determined by the analysis of the interarrival times distribution. Indeed, resuspension events can be mathematically modelled as a Poisson process if the interarrival times between subsequent exceedances of the threshold, C0, are independent and exponentially distributed random variables (Cramér and Leadbetter, 1967; Gallager, 2013). Moreover, the memorylessness of the Poisson process guarantees that the number of events observed in disjoint subperiods is an independent, Poisson-distributed random variable (Gallager, 2013). When the sequence of random events that define a 1-D Poisson process along the time axis can be associated with a vector of random marks that defines the duration and intensity of each over-threshold event, the process can be defined as a marked Poisson process. The distribution of these marks does not affect the chance to model the process as Poissonian, which, indeed, relies only on the exponentiality of interarrival times. However, when duration and intensity are also exponentially distributed, the set-up of a stochastic framework can be further simplified. In order to assess whether over-threshold SSC events can be modelled as a marked Poisson process, we performed the Kolmogorov–Smirnov (KS) goodness-of-fit test on the distribution of the interarrival times, intensity, and duration of over-threshold events.
In the POT analysis, the threshold value plays a critical role, and its choice deserves careful attention. As already noted for BSS (D'Alpaos et al., 2024), SSC is also locally influenced by many factors, making the threshold non-universal and highly site-specific. In the case of erosion dynamics, the identification of the threshold with the critical shear stress for erosion seems to be relatively straightforward, offering the advantage of preserving a physical meaning related to the process. Instead, when dealing with SSC, the absence of a clear physical threshold mechanism might complicate the identification of the threshold value.
Nonetheless, even though a threshold on SSC may lack a physical meaning, the POT analysis can be performed to statistically characterize the bulk effect of morphologically meaningful SSC events. To this end, the choice of a threshold value, C0, has to meet two opposite requirements. On the one hand, stochastic sediment concentration generated by storm-induced wind waves can be distinguished from pseudo-deterministic, tide-modulated daily concentration only if C0 is large enough. On the other hand, values of C0 that are too high either require a long, computationally prohibitive simulated time series or can lead to a non-informative analysis because of the large number of events that are unaccounted for. These observations narrow the range in which the threshold can be selected. The lower boundary is set by the SSC observed in the absence of wind and, therefore, exclusively associated with the tide. The upper boundary has to be maintained well below the maximum observed values to consider all the morphologically meaningful events. In the specific case of the Venice Lagoon, to satisfy these requirements, the C0 value has to fall between 30 and 60 mg L−1, as suggested by in situ SSC measurements (Carniello et al., 2012, 2014).
The sensitivity analysis performed on the present-day configuration of the Venice Lagoon (Carniello et al., 2016) suggests that the chance to model SSC events as a Poisson process is weakly affected by the specific threshold value in the above range. Indeed, using threshold values equal to 30, 40, 50, or 60 mg L−1 hardly changes the areas in which interarrival times are not exponentially distributed, and therefore, wind-induced SSC cannot be described as a Poisson process (Fig. S6). On the basis of these observations and to allow the comparison among the different configurations, in the present analysis, we used a constant threshold, C0, equal to 40 mg L−1.
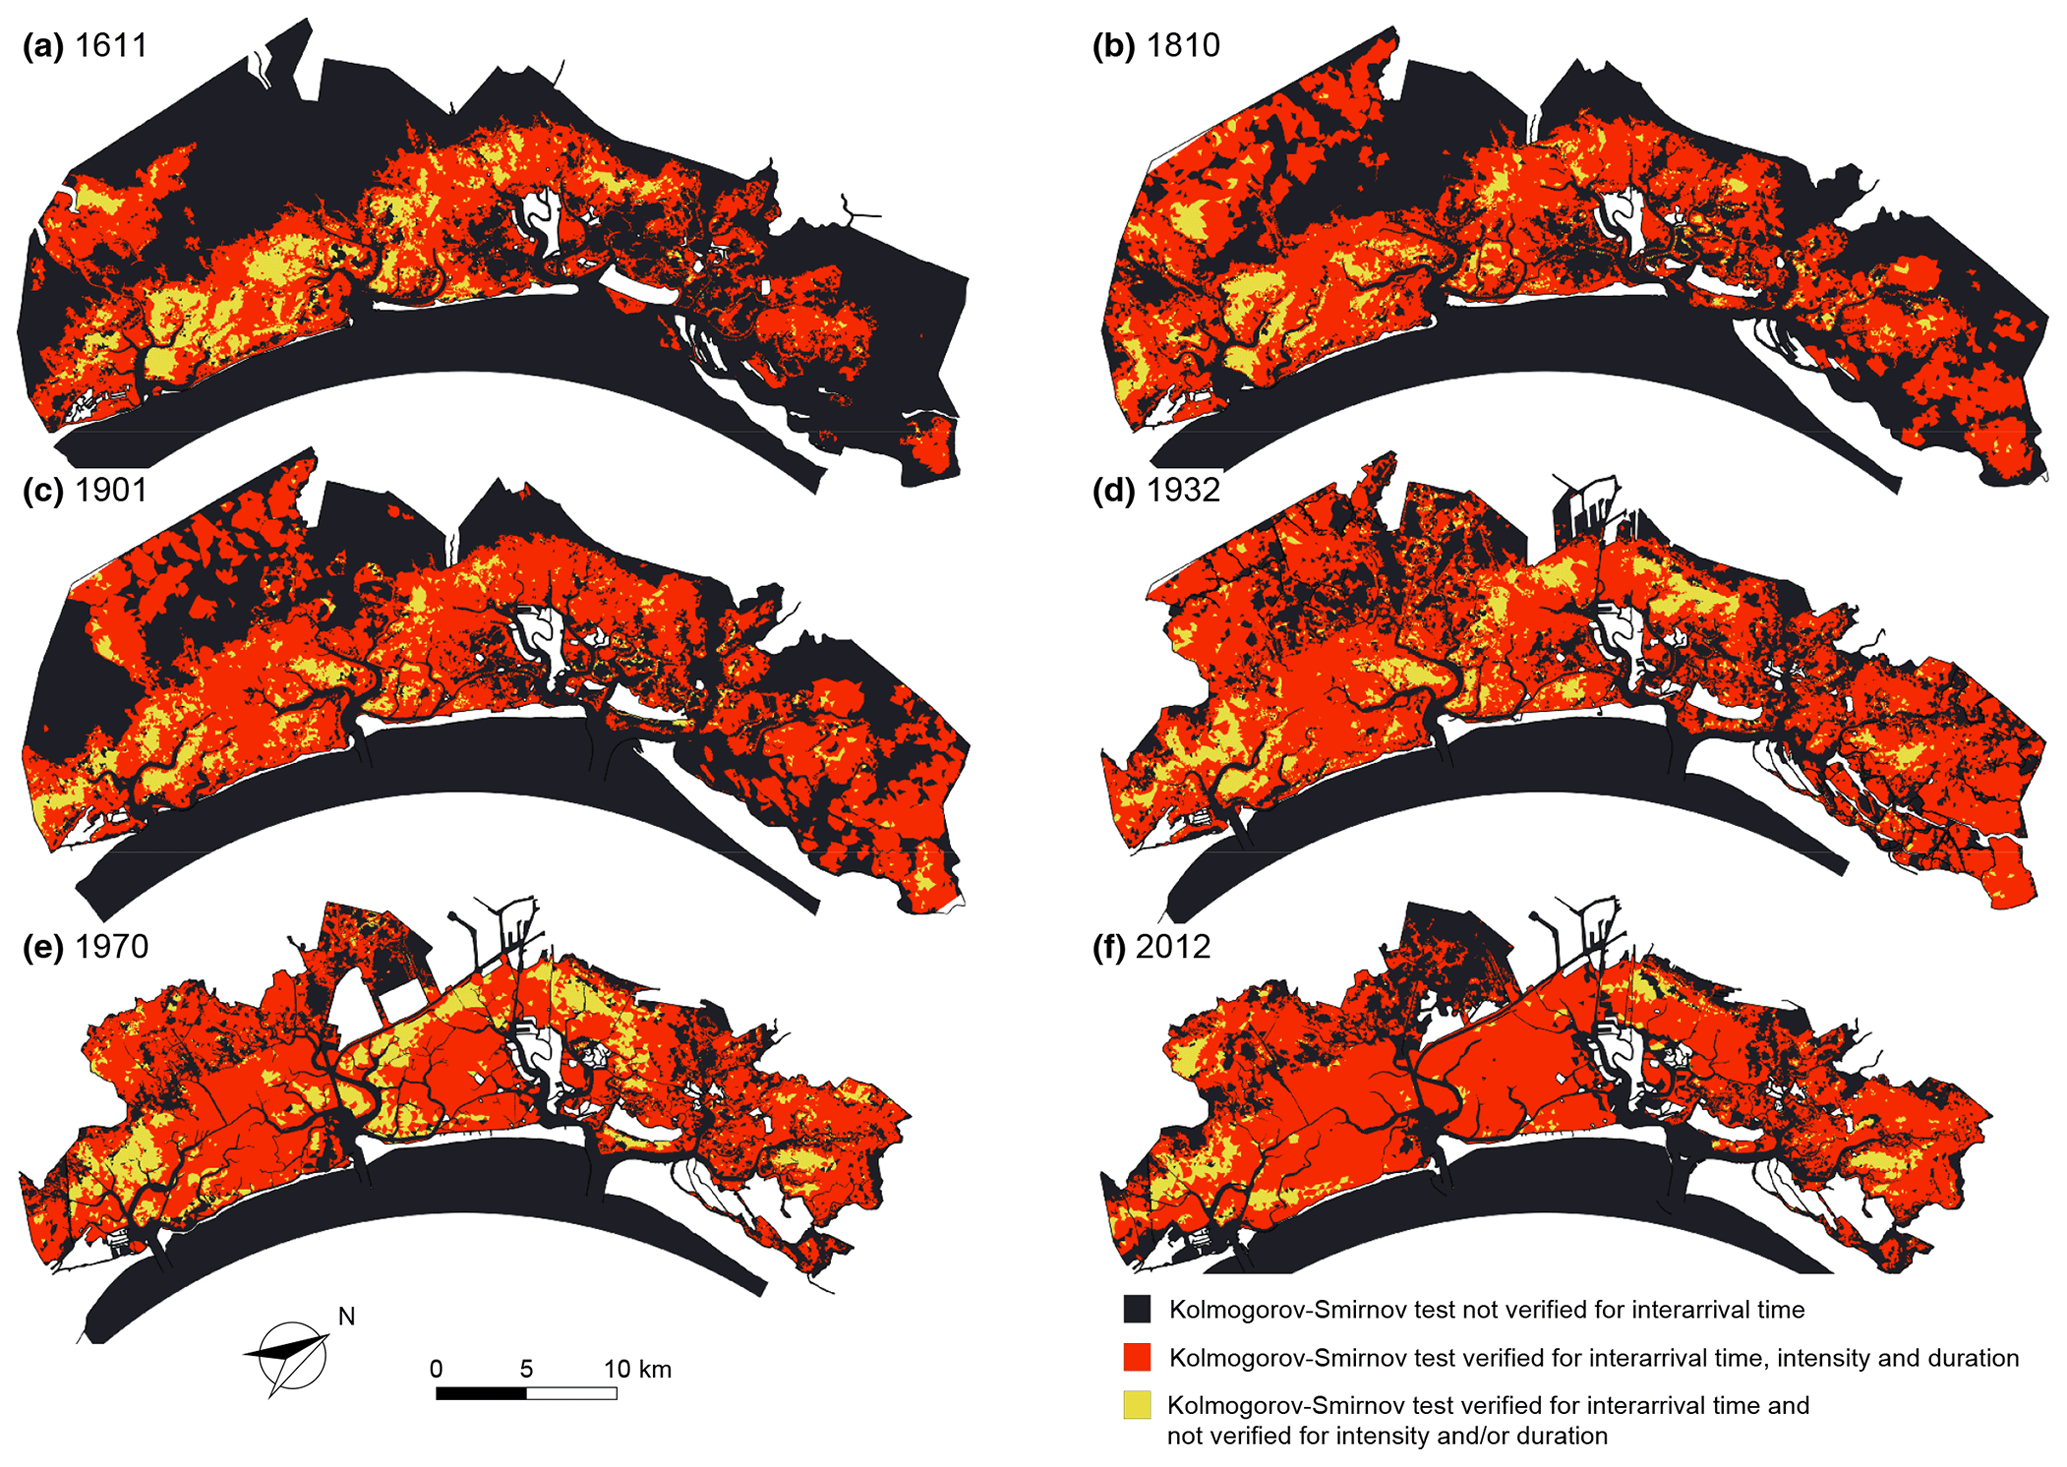
Figure 2Kolmogorov–Smirnov test for over-threshold SSC events. Spatial distribution of Kolmogorov–Smirnov (KS) test at significance level α=0.05 for the six different configurations of the Venice Lagoon: (a) 1611, (b) 1810, (c) 1901, (d) 1932, (e) 1970, and (f) 2012. We can distinguish areas where the KS test is not verified (dark blue); is verified for all the considered stochastic variables (interarrival time, intensity over the threshold and duration) (red); and is verified for the interarrival time and not for intensity and/or duration (yellow).
We analysed the time series of computed total SSC at any node of the computational grids reproducing the six selected configurations of the Venice Lagoon on the basis of the POT method, in order to characterize the over-threshold events in terms of interarrival times, peak excess, and duration. We then performed the KS test (significance level α=0.05) to compare the distributions of interarrival times with an exponential distribution and to test the hypothesis of modelling SSC events as a Poisson process. The KS test is also applied to the peak excess and duration of the over-threshold events to test if these marks can be described by exponential distributions as well. The chance to model SSC dynamics as a Poisson process relies only on the exponentiality of interarrival times, and it is not affected by the specific distribution of peak excess and duration. However, the set-up of the final stochastic framework is simplified when the duration and peak excess also follow an exponential distribution.
Therefore, in the spatial distribution of the KS test results (Fig. 2), we can identify the following three different situations:
-
SSC events cannot be described as a Poisson process (i.e. the KS test is not satisfied for interarrival times in the dark blue areas);
-
SSC events are indeed a marked Poisson process because interarrival times, peak excesses, and durations satisfy the KS test, and, thus, are exponentially distributed random variables (in the red areas);
-
SSC events still are a marked Poisson process, but at least one variable between intensity and duration does not satisfy the KS test (i.e. although interarrival times follow an exponential distribution, at least one between intensity and duration does not) (in the yellow areas).
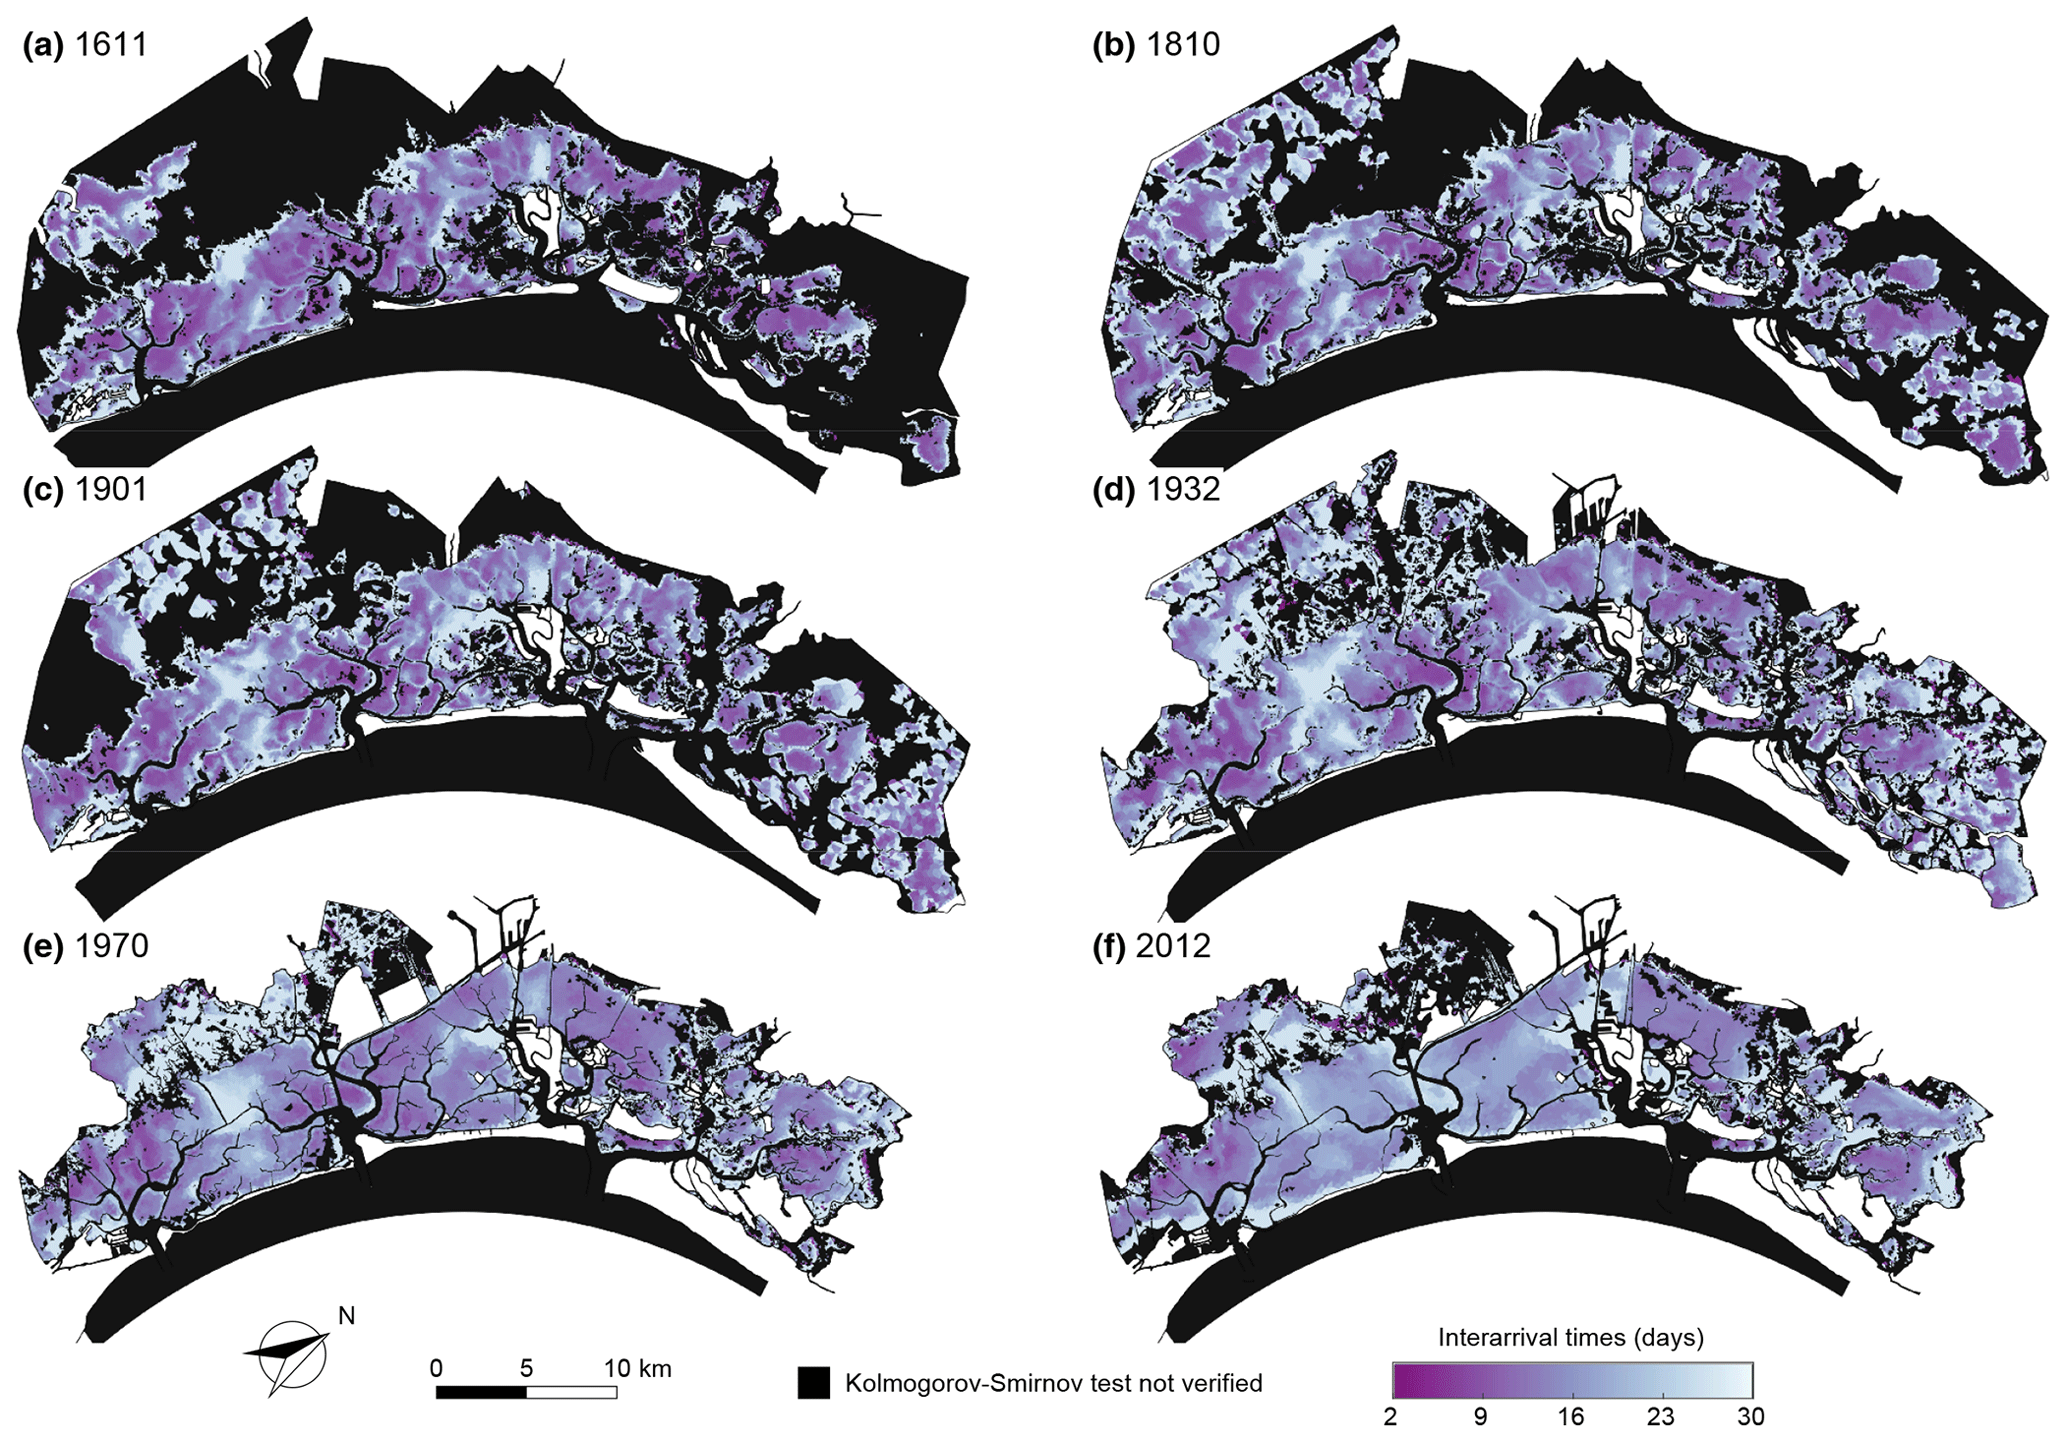
Figure 3Mean interarrival time of over-threshold SSC events. Spatial distribution of mean interarrival times of over-threshold exceedances at sites where SSC events can be modelled as a marked Poisson process, as confirmed by the KS test (α=0.05) for the six different configurations of the Venice Lagoon: (a) 1611, (b) 1810, (c) 1901, (d) 1932, (e) 1970, and (f) 2012.
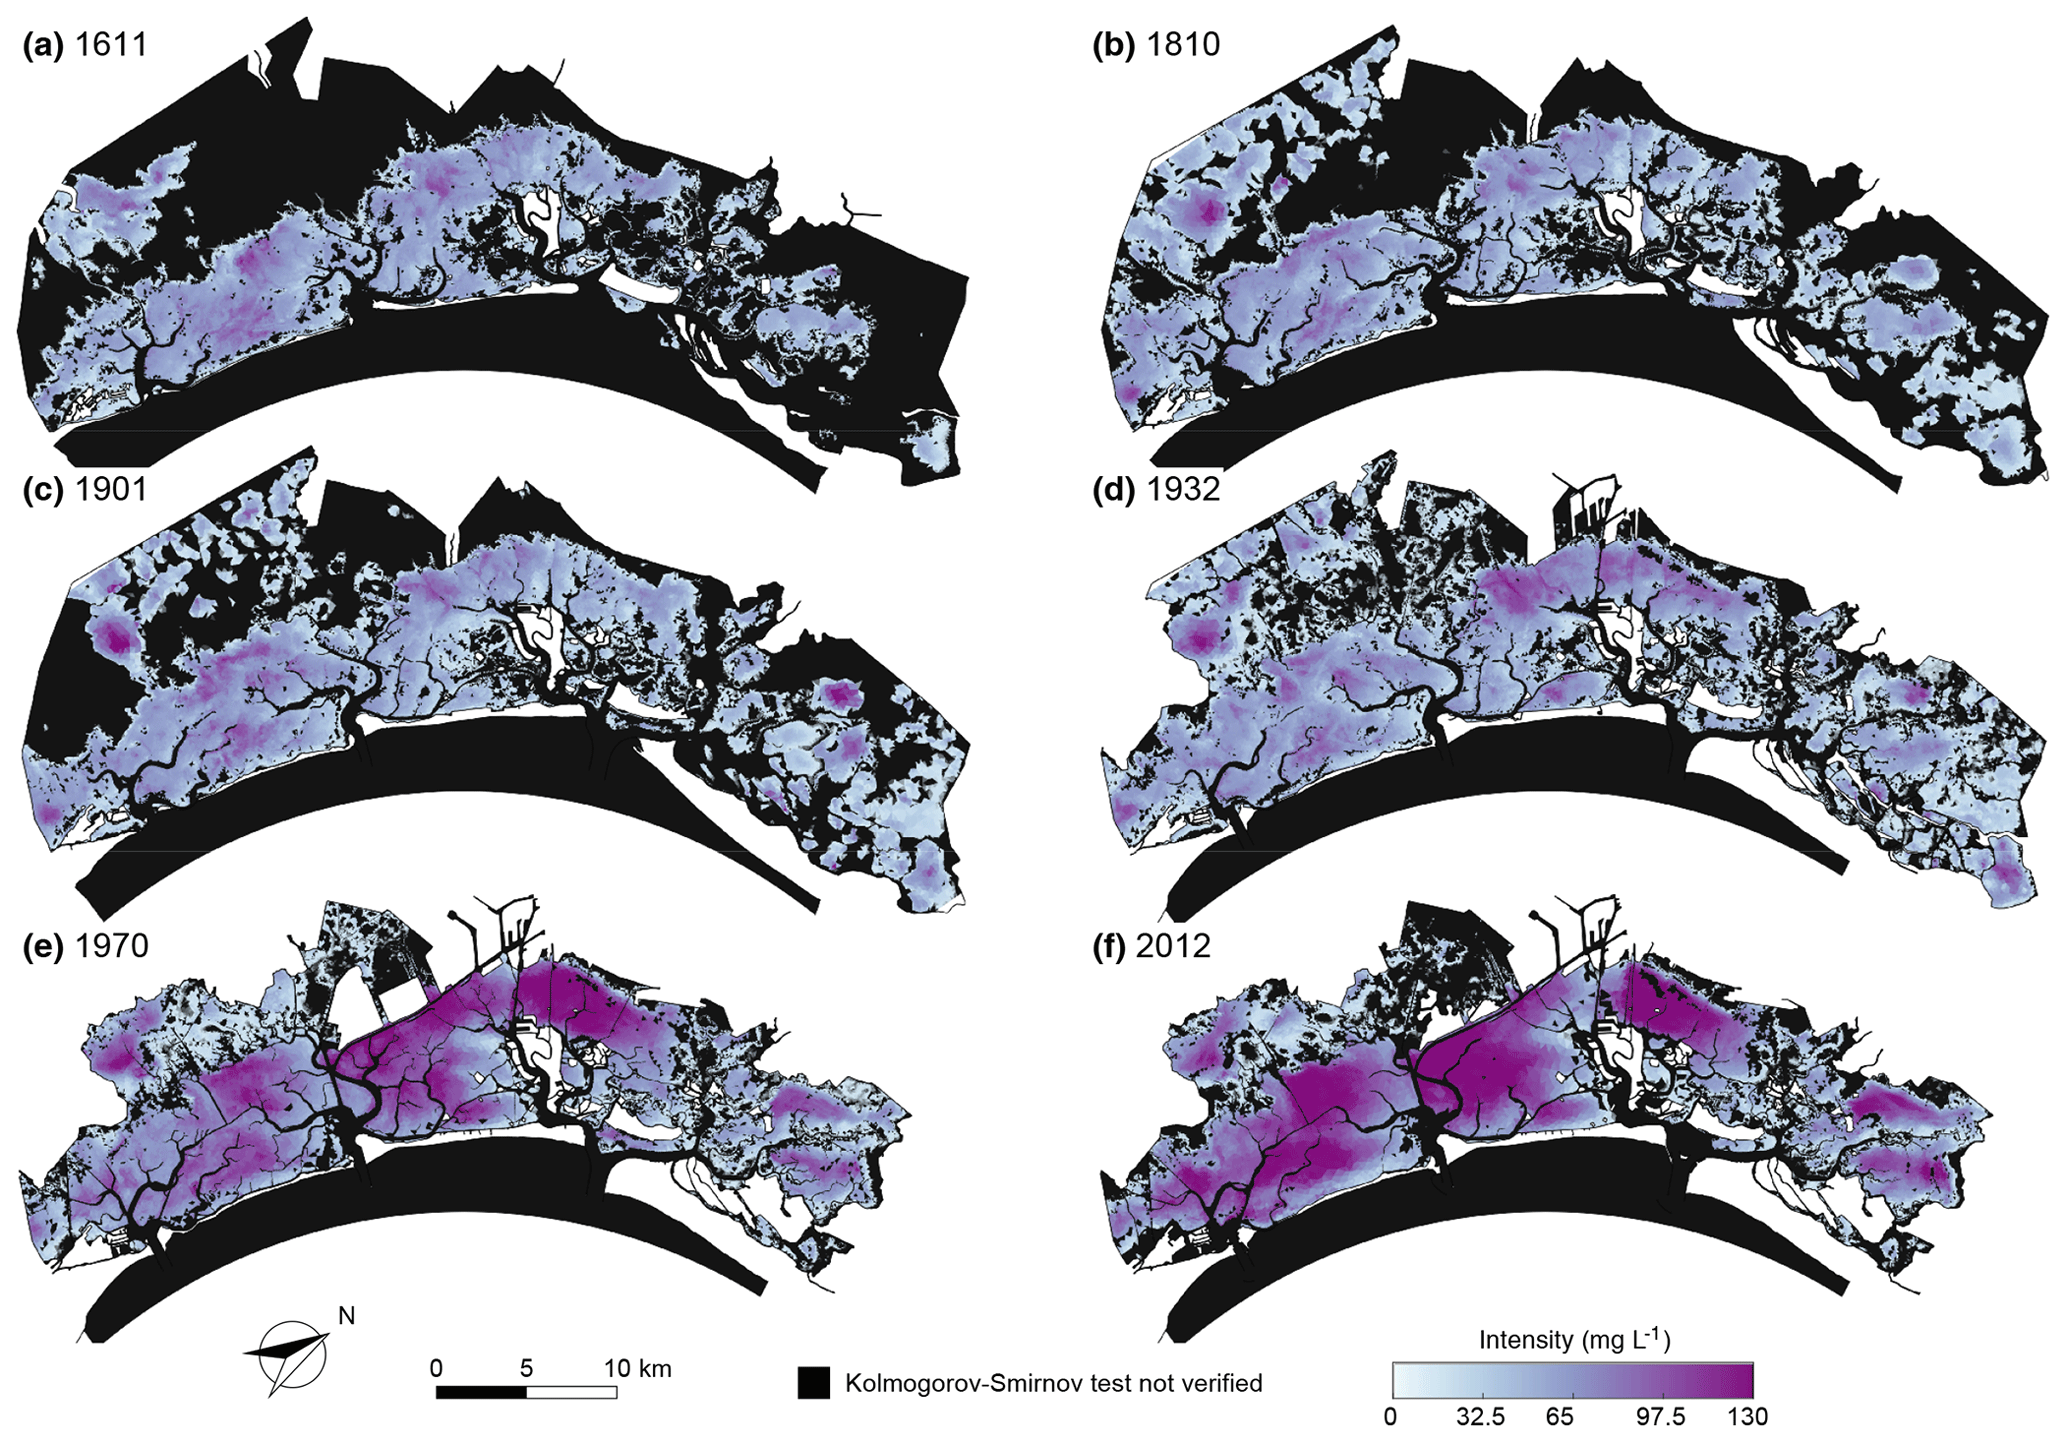
Figure 4Mean intensity of over-threshold SSC events. Spatial distribution of mean intensity of peak excesses of over-threshold exceedances at sites where SSC events can be modelled as a marked Poisson process, as confirmed by the KS test (α=0.05) for the six different configurations of the Venice Lagoon: (a) 1611, (b) 1810, (c) 1901, (d) 1932, (e) 1970, and (f) 2012.
The spatial distribution of mean interarrival times (Fig. 3), mean intensities of peak excesses (Fig. 4), and mean durations (Fig. 5) of over-threshold events are shown at any location within each of the six historical configurations where SSC events can be modelled as a Poisson process (i.e. the KS test is verified for interarrival times at significance level α=0.05). The mean values of these three random variables are shown where at least interarrival times are exponentially distributed (i.e. yellow areas in Fig. 2) because the SSC dynamics can be modelled as a Poisson process, although the marks are described by a distribution different from the exponential one, and mean peak excess and mean duration are nonetheless informative.
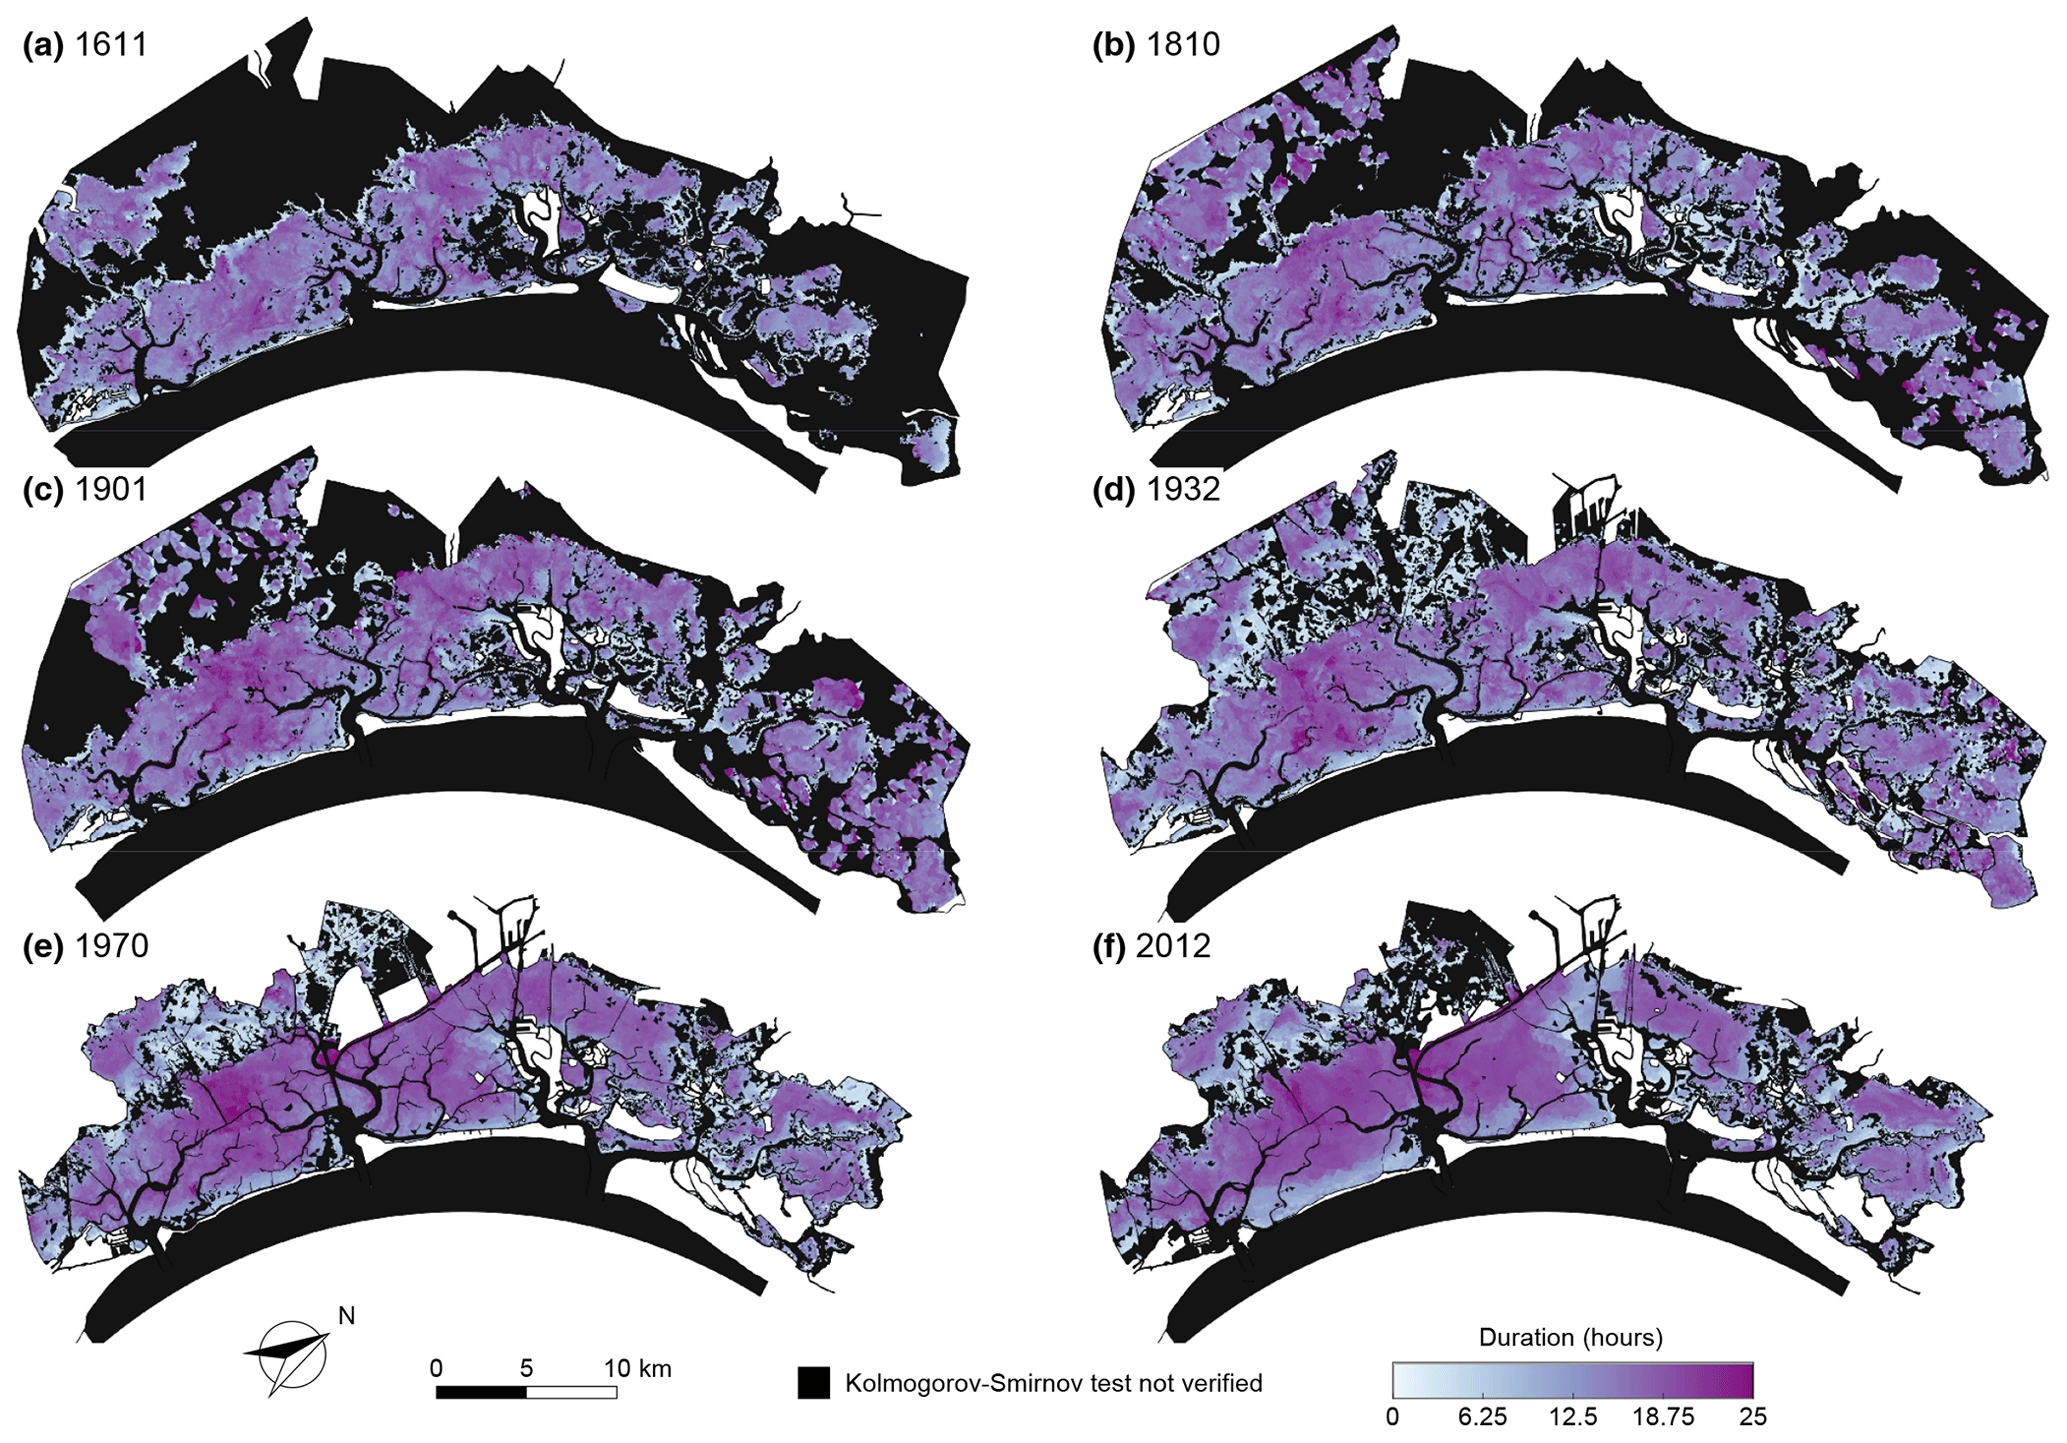
Figure 5Mean durations of over-threshold SSC events. Spatial distribution of mean durations of over-threshold exceedances at sites where SSC events can be modelled as a marked Poisson process, as confirmed by the KS test (α=0.05) for the six different configurations of the Venice Lagoon: (a) 1611, (b) 1810, (c) 1901, (d) 1932, (e) 1970, and (f) 2012.
The areas of the lagoon where over-thresholds SSC events cannot be modelled as Poisson processes are mostly represented by salt marshes and tidal channels in all configurations (see dark blue areas in Fig. 2), similar to the results for bottom shear stress (BSS) (D'Alpaos et al., 2024). On salt marsh areas, both BSS and SSC thresholds (τC and C0, respectively) are seldom exceeded (Figs. S7 and S8) because the reduced water depth over the marsh prevents the propagation of large wind waves, and the presence of halophytic vegetation limits sediment advection by promoting deposition and stabilizes the bottom preventing erosion (e.g. Möller et al., 1999; Temmerman et al., 2005; Carniello et al., 2005). Within the main tidal channels and at the three inlets, as for BSS, SSC dynamics are not Poissonian, but the reason why the interarrival times of erosion and SSC events are not exponentially distributed are slightly different. In the main channel network and at the inlets, SSC exceeds the threshold value, C0, on only a few occasions, or it does not exceed the threshold at all, due to vertical dispersion mechanisms that decrease the local concentration of sediment in suspension in deeper areas (Fig. S8). Conversely, BSS typically exceeds the threshold τc 2 or 4 times a day (Fig. S7), mainly because of the tide action, but the BSS time evolution cannot be modelled as a Poisson process, as confirmed by the KS test on the interarrival times of over-threshold BSS events (D'Alpaos et al., 2024).
However, SSC events can be modelled as a Poisson process over wide areas of the six configurations of the Venice Lagoon, in particular over tidal flats and subtidal platforms (see red and yellow areas in Fig. 2). As a consequence, SSC dynamics can be effectively modelled by using a synthetic framework based on Poisson processes over widespread portions of the different morphological configurations experienced by the Venice Lagoon in the last 4 centuries.
Large interarrival times (i.e. larger than 30 d; Fig. 3) are observed on tidal flats close to the main channel network because dilution processes within higher water depth, enhanced by the higher velocities in these sites, reduce sediment concentration, and hence only severe, but infrequent, events can lead to an exceedance of the threshold. Sheltered areas are also characterized by large interarrival times, as represented by the northern portion of the lagoon, which is protected by the mainland from the northeasterly bora wind, the most intense and morphologically significant wind in the Venice Lagoon (Fig. 1b), and which is where the presence of extensive salt marsh areas continuously interrupts the propagation of wind waves. In this case, the reduced number of up-crossing events, and, consequently, large interarrival times is due to the sheltering action of salt marshes and islands in reducing wind wave resuspension. SSC events over the marsh platform slightly changed through the centuries. In the three oldest configurations (i.e. 1611, 1810, and 1901), mainly because of the wide extent of salt marshes, resuspension events over salt marshes do not even reach the threshold, as shown by the number of up-crossing events (Fig. S8). In the more recent ones, where salt marsh extent importantly decreases, marshes start experiencing some over-threshold SSC events because of the advection of sediment from the adjacent areas, but the lower number of up-crossing events allows the mean interarrival time to assume large values.
Over wide tidal flat areas, where the threshold is exceeded in all the considered configurations, the mean interarrival time generally slightly increases through the centuries (Fig. S10a). This trend is more evident in the central and southern parts of the lagoon, where, because of the deepening experienced in the last century, the number of events able to resuspend sediments from the bottom decreased importantly, hence increasing the mean interarrival time of intense SSC events. In fact, over the central-southern shallow tidal flats of the four oldest configurations, interarrival times present relatively low values (about 10 d), whereas they generally become longer (between 20 and 25 d) in the same areas in the more recent configurations. On the contrary, in the better preserved, northern portion of the lagoon, where the fetch is continuously interrupted by islands, spits, and salt marshes (also in the more recent configurations), the mean interarrival times experienced only slight changes over centuries. As an example, Fig. 6a shows the mean interarrival times, λt, experienced by the Palude Maggiore tidal flat (station S1 in Fig. 1) that do not vary remarkably over time. On the contrary, the subtidal flat at the watershed divide between the Chioggia and Malamocco inlets, known as Fondo dei Sette Morti (station S2 in Fig. 1), display a much larger variation of λt, with decreasing interarrival times through centuries (Fig. 6d). In the older configurations, thanks to its relatively lower depth and the sheltering effects of shallower tidal flats, station S2 experienced over-threshold events only during severe events. In the more recent configurations, over-threshold events become more frequent due to the deepening of the surrounding tidal flats, thus allowing larger waves and currents to propagate in this area and enhancing resuspension, as well as suspended sediment transport.
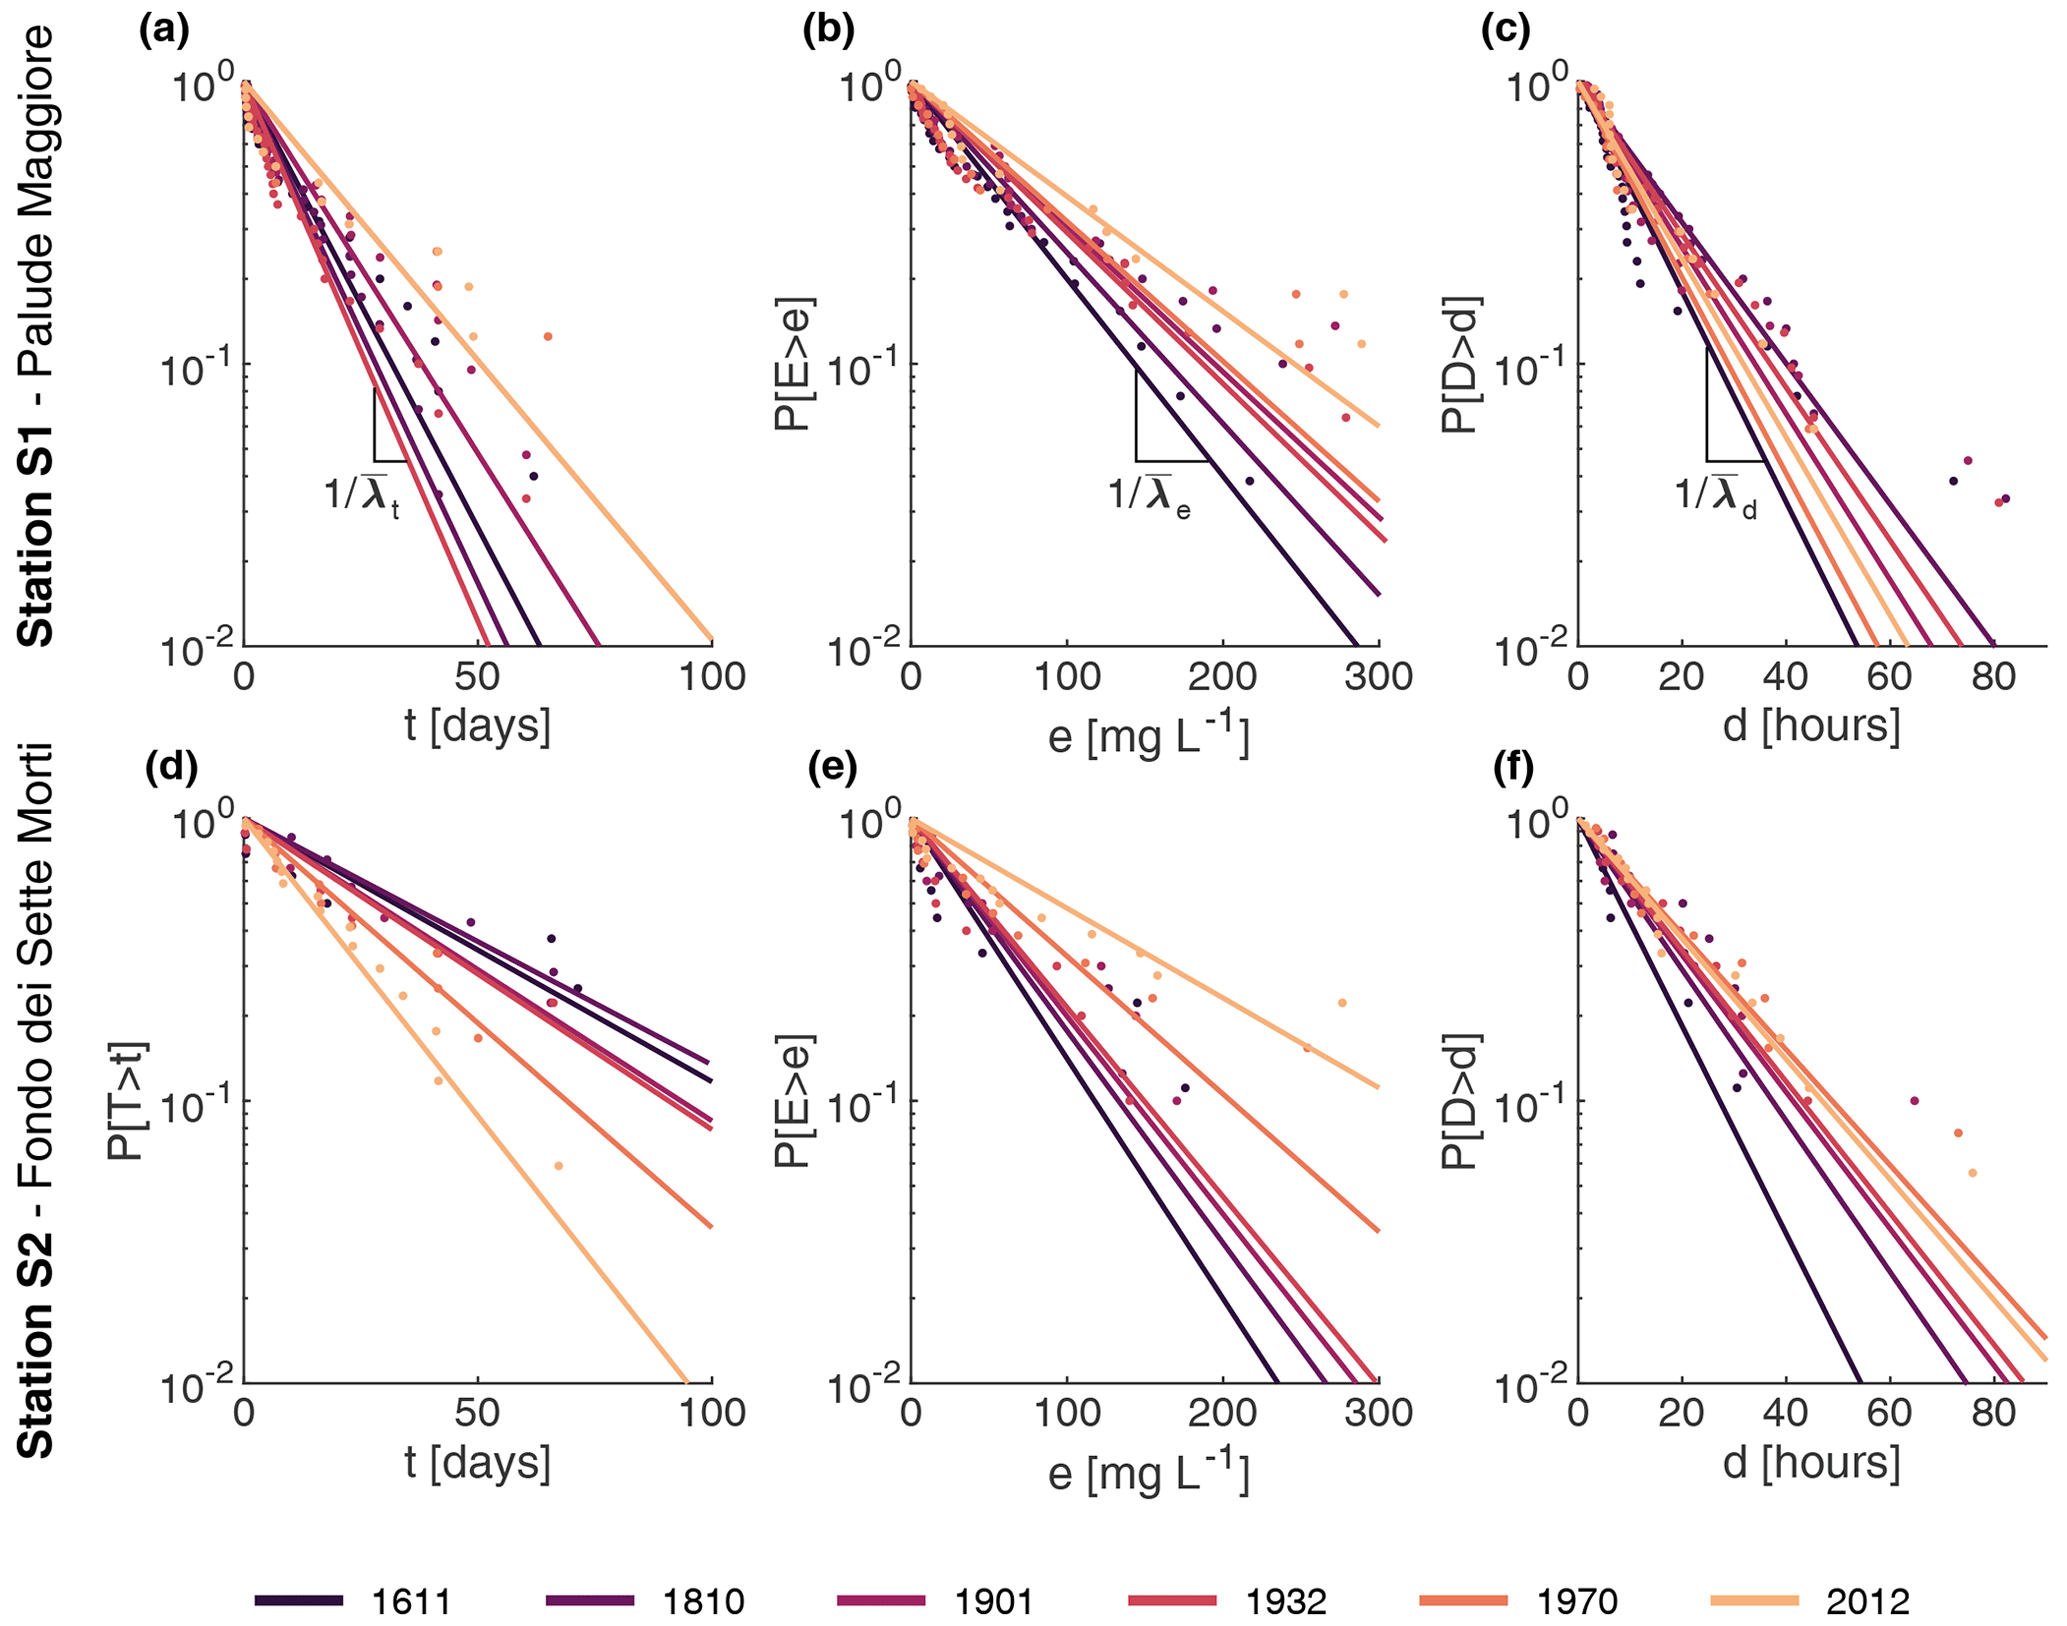
Figure 6Over-threshold SSC events at stations S1 and S2. Statistical characterizations of over-threshold events at two stations S1 Palude Maggiore and S2 Fondo dei Sette Morti (see Fig. 1a for locations) in the six configurations of the Venice Lagoon. (a, b) Probability distributions of interarrival times, t. (c, d) Probability distributions of intensities of over-threshold exceedances, e. (e, f) Probability distributions of durations of over-threshold events, d. denotes the mean interarrival time, the mean peak excess intensity, and the mean duration.
The intensity of over-threshold events abruptly increases between 1932 and 1970 (Figs. 4 and S10b). Indeed, SSC exceedance intensity maintains low mean values, generally below 60 mg L−1, in all the configurations until 1932; thereafter, it doubles on wide tidal-flat areas, especially in the central-southern lagoon and northwest of the city of Venice, where the action of wind waves is stronger because of the generalized deepening of those areas. This analysis confirms that the intensity increase is much more important in the central lagoon (station S2; Fig. 6e) than in the northern part (station S1; Fig. 6b).
Overall, over-threshold event durations slightly increase through the centuries (Figs. 5 and S10c). However, two different trends can be distinguished in different portions of the lagoon; the same applies for the interarrival times and intensities. The duration increase in the more pristine northern portion of the basin is much lower than that in the central and southern lagoon, due to the heavier morphological modifications the latter areas experienced (Fig. 6c and f).
SSC dynamics are affected by local entrainment and advection–dispersion processes from and toward the surrounding areas. Furthermore, the local resuspension is highly influenced by the combined effect of tidal currents and wind waves, thus depending on current velocity, water depth, fetch, wind intensity, and duration (Fagherazzi and Wiberg, 2009; Carniello et al., 2016). As a consequence, the mean values of the random variables characterizing SSC events present highly heterogeneous spatial patterns in the oldest configurations of the Venice Lagoon due to their higher morphological complexity.
To describe the relationship between interarrival times, durations, and intensities, the temporal cross-correlation between these three random variables was computed for each point within the six configurations of the Venice Lagoon (Figs. S11–S13). The duration of over-threshold exceedances and the intensity of peak excesses are highly correlated in all six of the considered configurations, suggesting that longer events are linked to more intense ones (Figs. S11 and S14a). On the contrary, durations and interarrival times, as well as intensities and interarrival times, display almost no correlation (Figs. S11, S12, and S14b, c). These relations between interarrival time, intensity, and duration back up the idea that, as for BSS dynamics (D'Alpaos et al., 2024), over-threshold SSC events can be modelled as a 3-D Poisson process in which the marks (intensity and duration of over-threshold events) are mutually dependent but independent on interarrival times.
As a result of the cause–effect relationship between the BSS (cause) and SSC (effect), their spatial and temporal dynamics show a high cross-correlation between the interarrival times (Fig. 7), intensity (Fig. 8), and duration (Fig. 9) of BSS and SSC over-threshold events. Recalling the absence of correlation between interarrival times and both intensities and durations for both BSS and SSC events, we can conclude that, when generating synthetic time series, the interarrival times of BSS and SSC events are mutually dependent but not related to their intensity and duration. Intensities and durations of SSC are instead strongly correlated with the corresponding properties of BSS events.
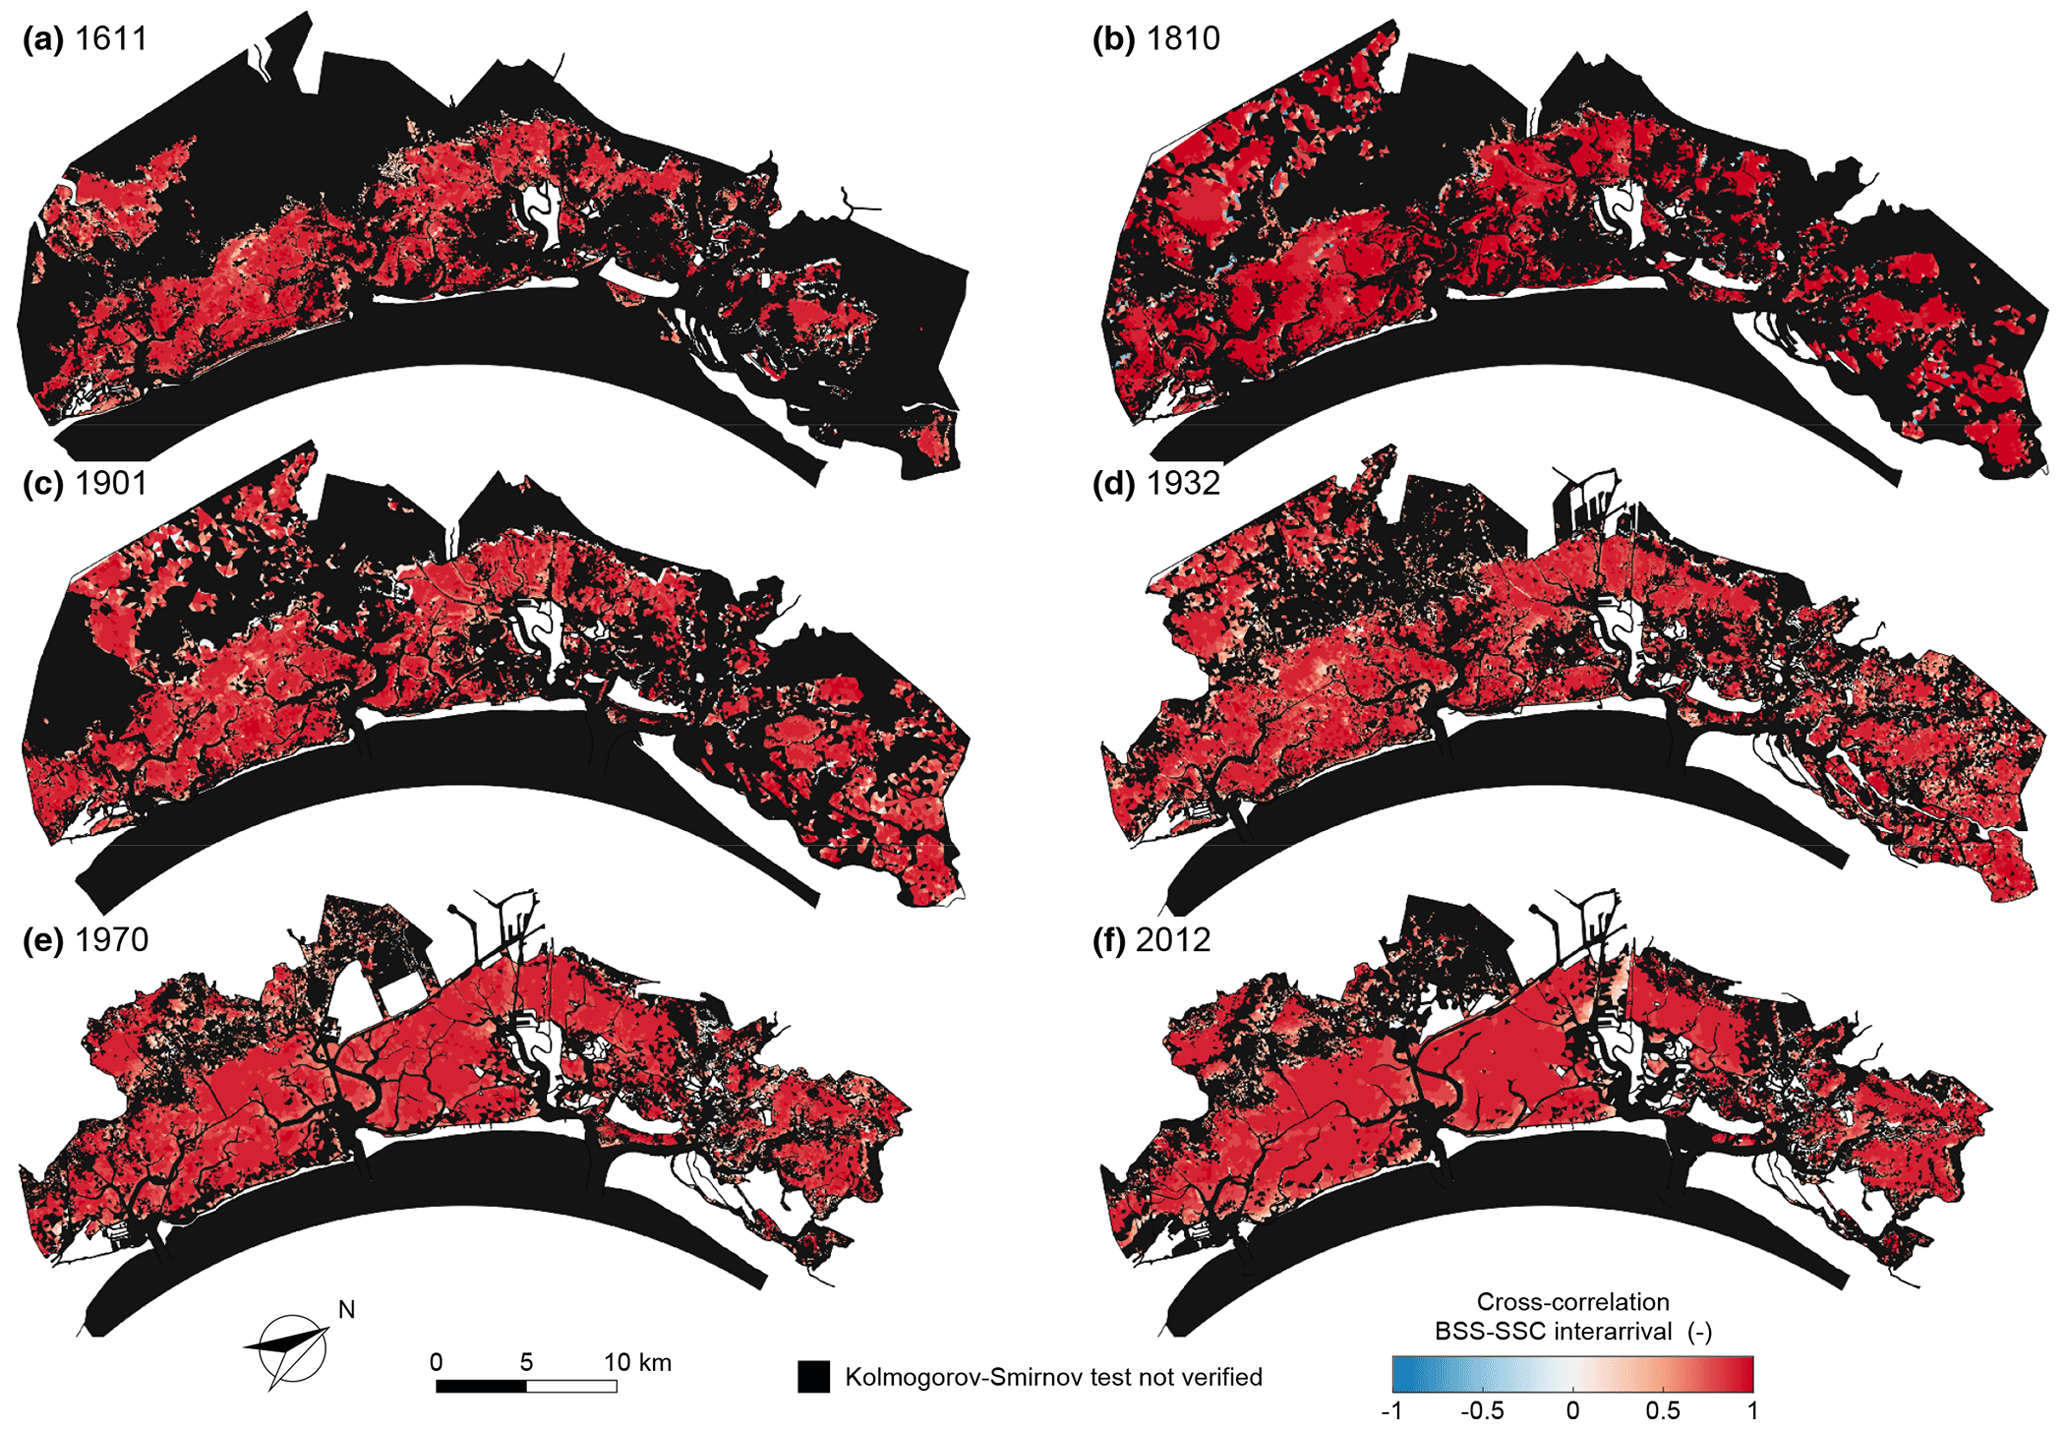
Figure 7Cross-correlation between the interarrival times of over-threshold BSS and SSC events. Spatial distribution of the cross-correlation between interarrival times of over-threshold BSS and SSC exceedances for the six different configurations of the Venice Lagoon: (a) 1611, (b) 1810, (c) 1901, (d) 1932, (e) 1970, and (f) 2012. Black identifies sites where over-threshold BSS or SSC events cannot be modelled as a marked Poisson process (i.e. the KS test is not verified for the interarrival time).
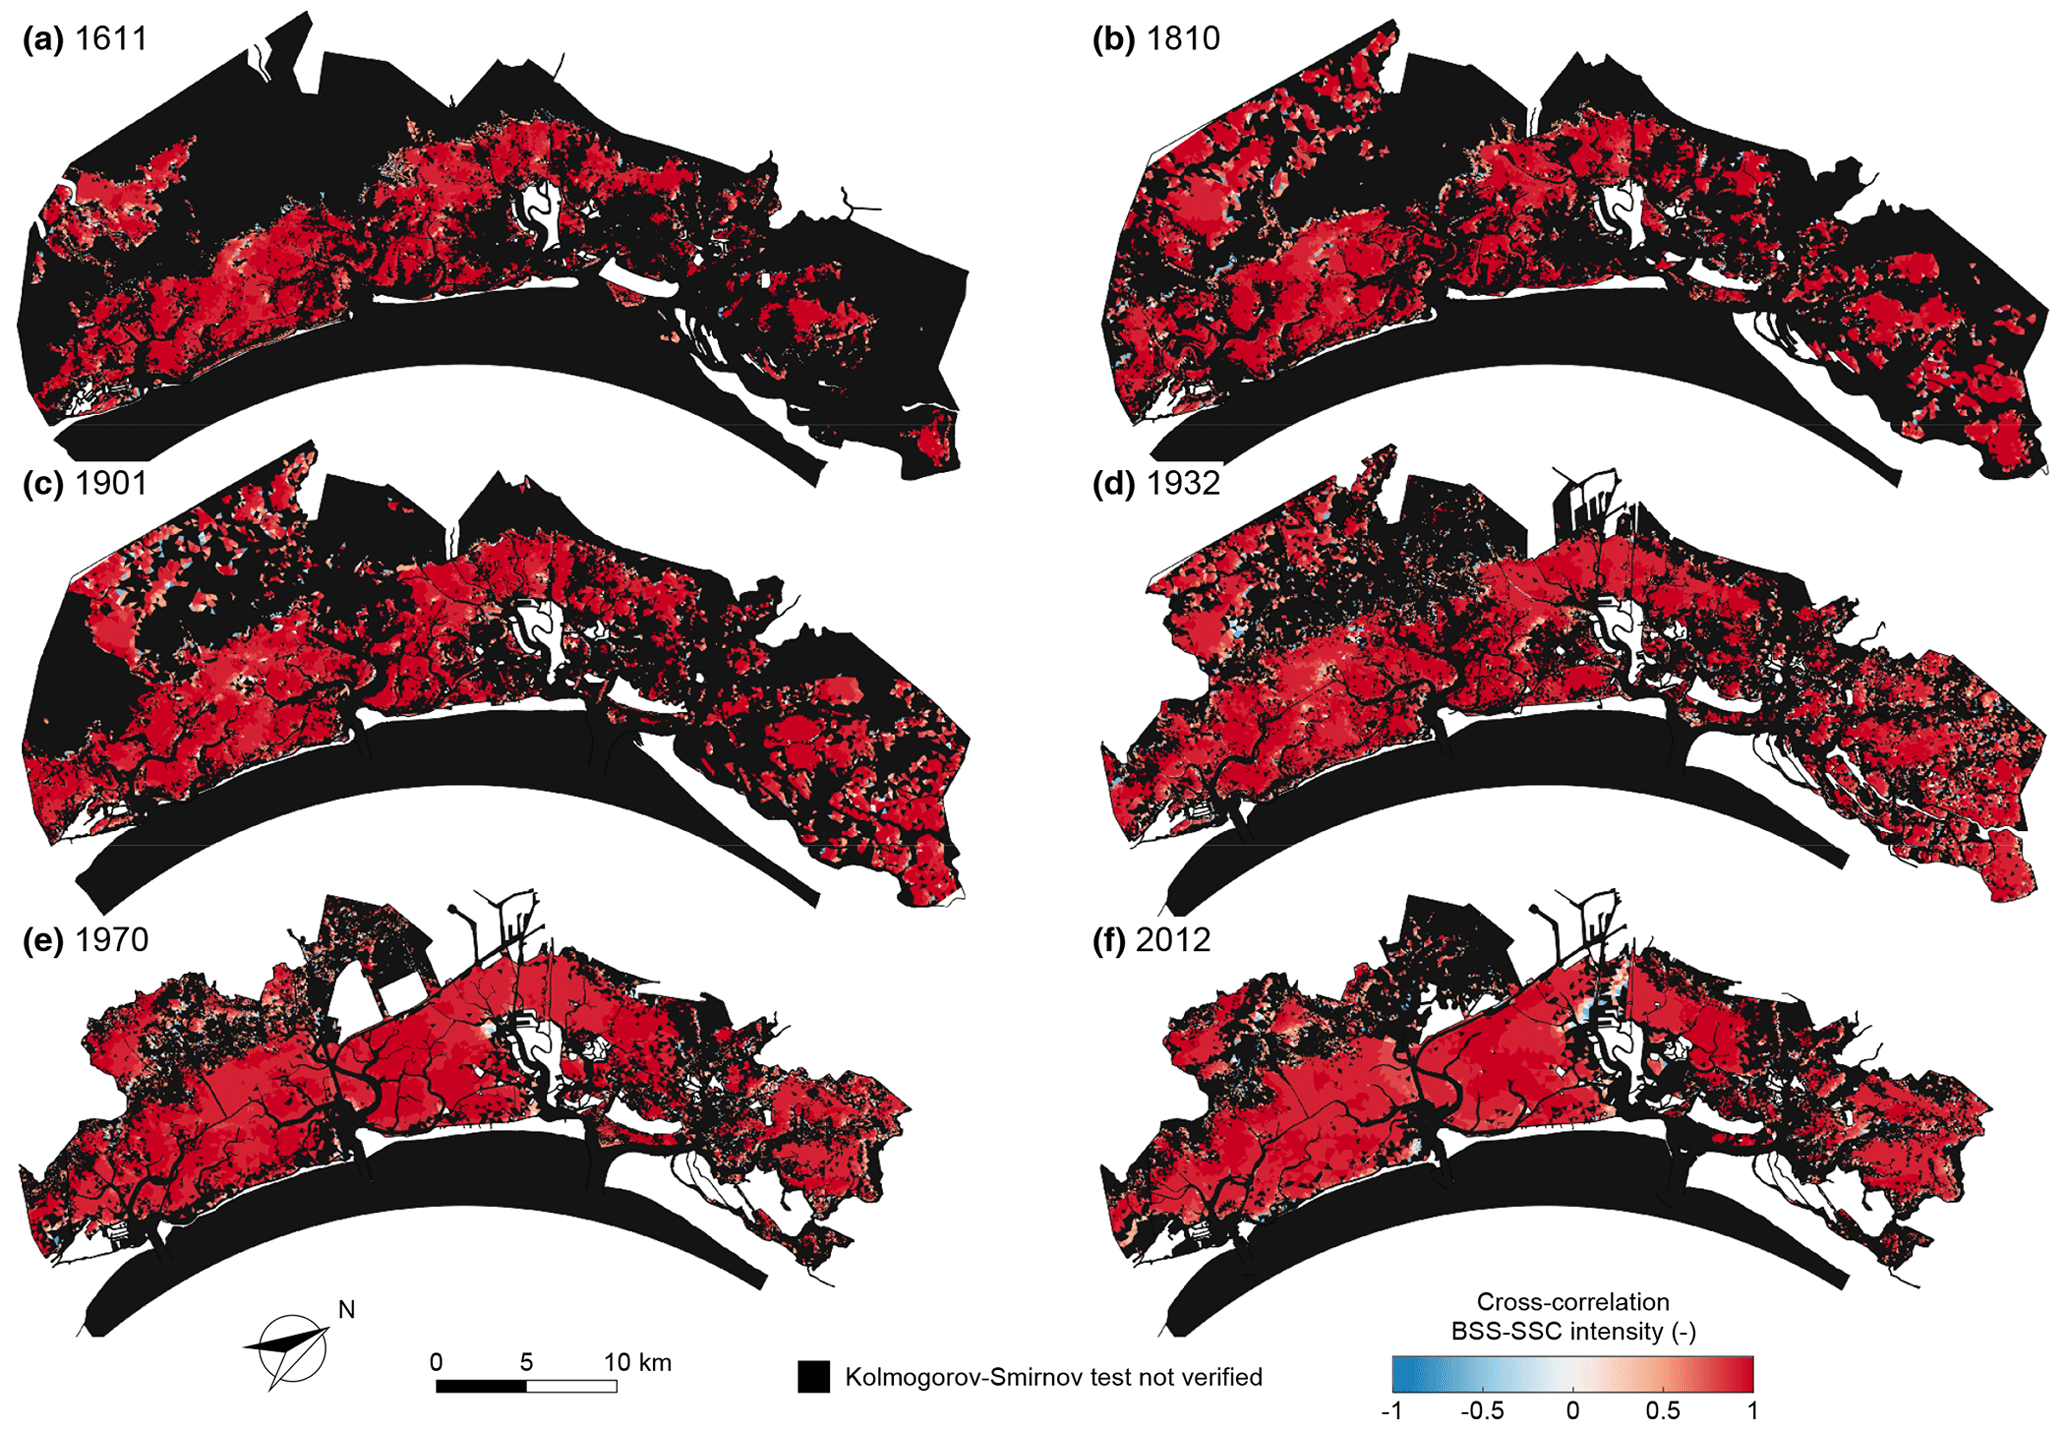
Figure 8Cross-correlation between intensities of over-threshold BSS and SSC events. Spatial distribution of the cross-correlation between intensities of over-threshold exceedances BSS and SSC for the six different configurations of the Venice Lagoon: (a) 1611, (b) 1810, (c) 1901, (d) 1932, (e) 1970, and (f) 2012. Black identifies sites where over-threshold BSS or SSC events cannot be modelled as a marked Poisson process (i.e. the KS test is not verified for the interarrival time).
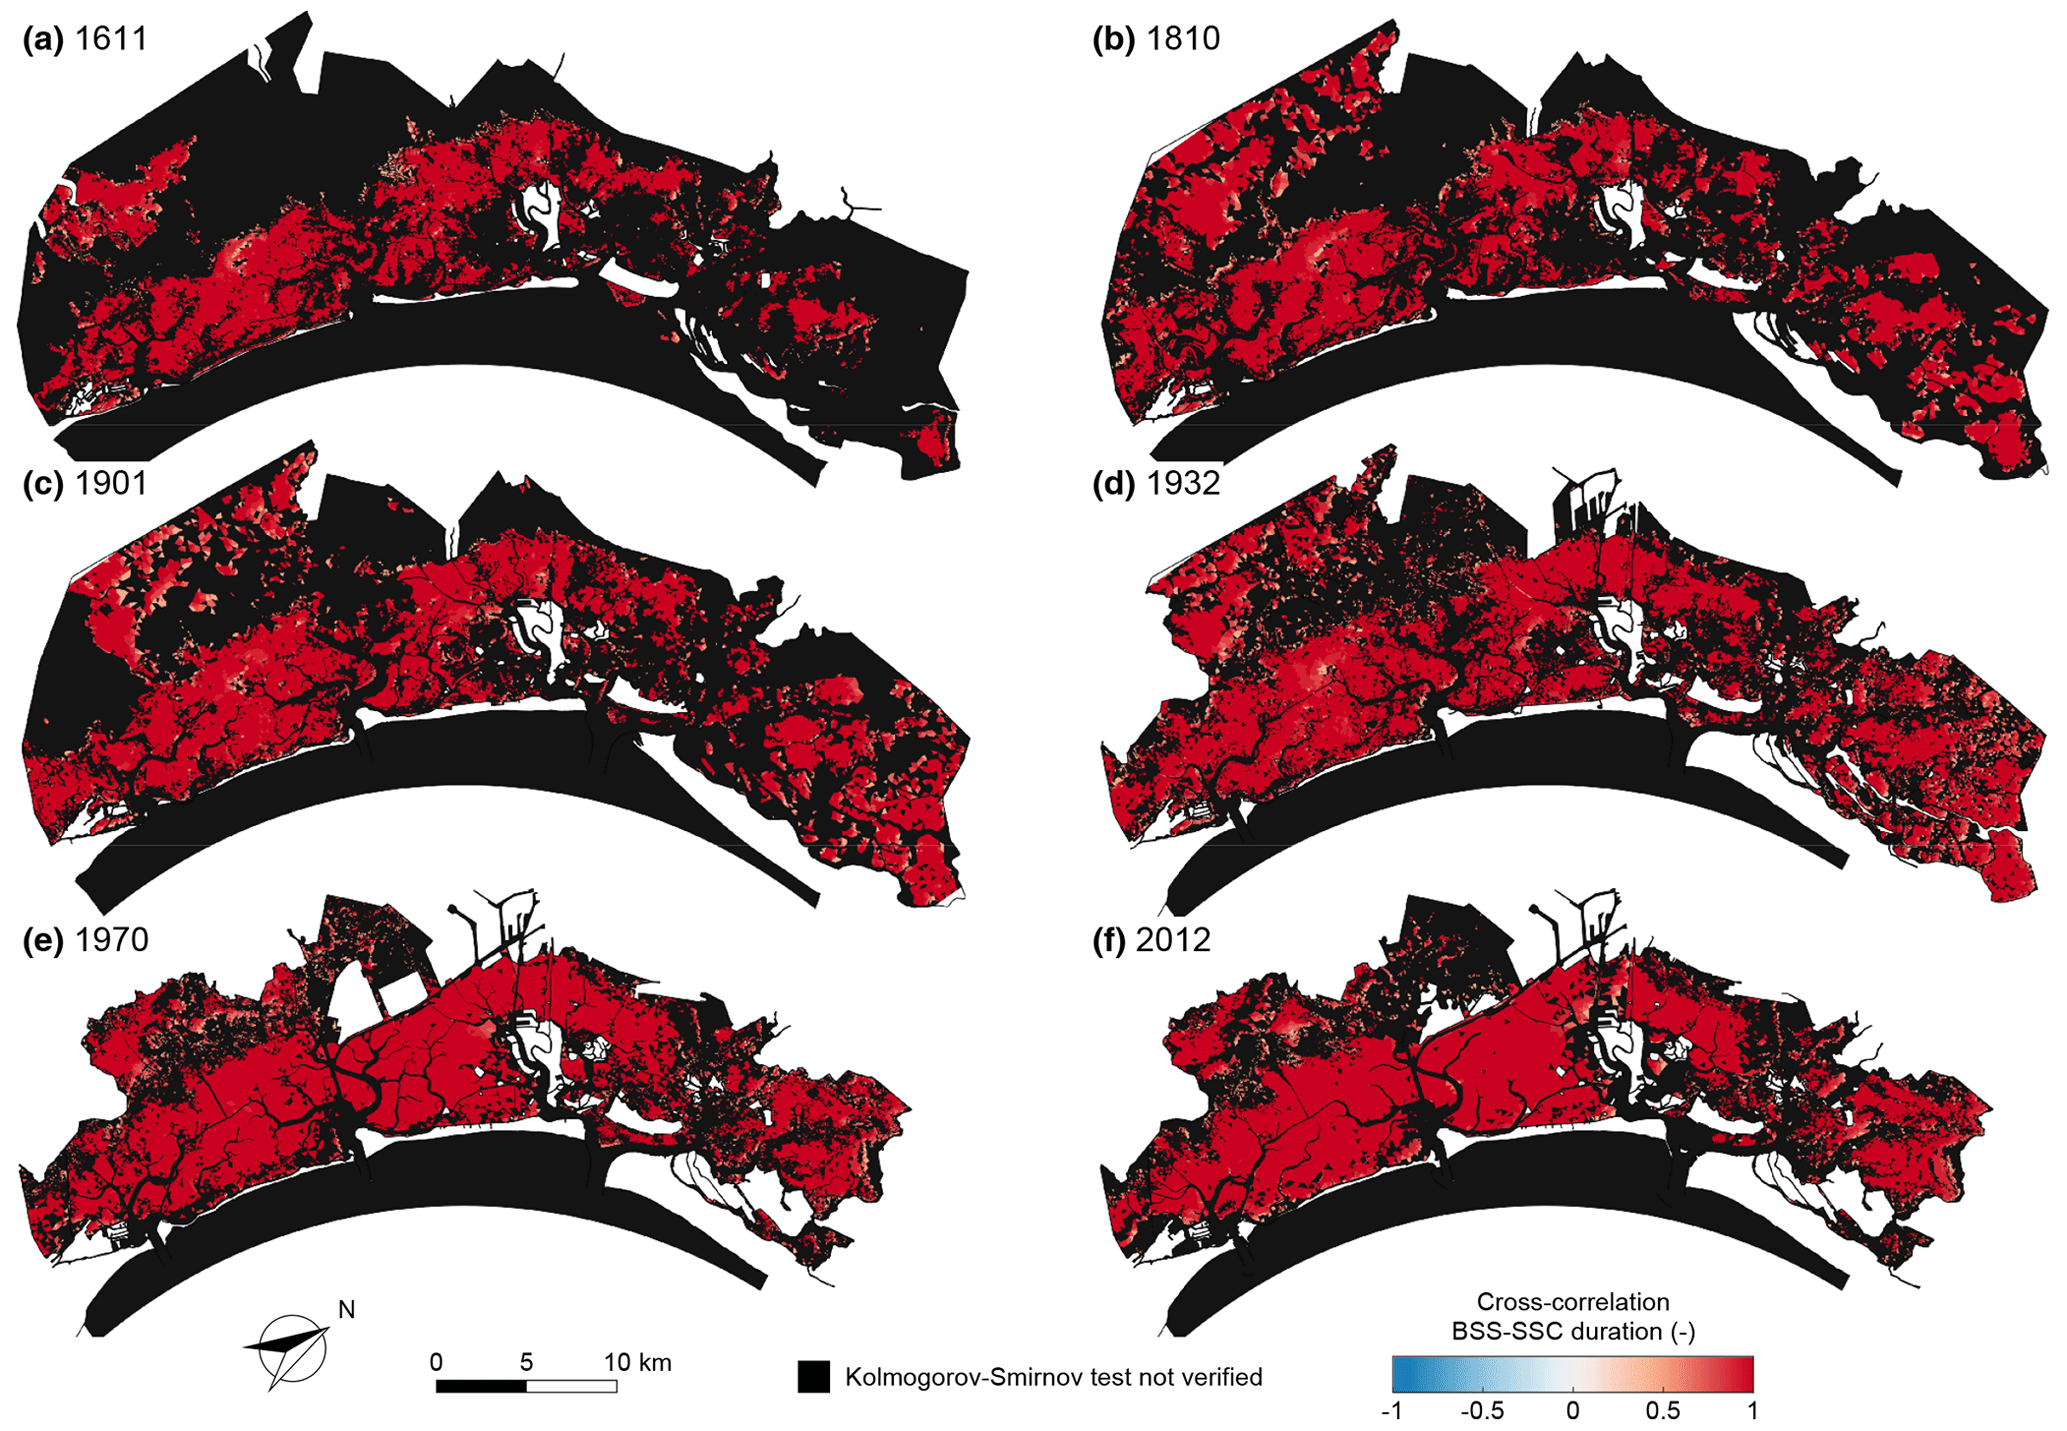
Figure 9Cross-correlation between durations of over-threshold BSS and SSC events. Spatial distribution of the cross-correlation between durations of over-threshold exceedances BSS and SSC for the six different configurations of the Venice Lagoon: (a) 1611, (b) 1810, (c) 1901, (d) 1932, (e) 1970, and (f) 2012. Black identifies sites where over-threshold BSS or SSC events cannot be modelled as a marked Poisson process (i.e. the KS test is not verified for the interarrival time).
Despite showing high similarity and correlation, BSS and SSC events are not identical. The BSS ultimately depends on the local hydrodynamics; i.e. the local value of the bed shear stress τwc produced by tidal currents and wind waves. On the contrary, the SSC is not only a function of the local entrainment but also of the suspended sediment flux from and towards the surrounding areas. As a result of the advection–dispersion processes, the spatial pattern of SSC is smoother than that of BSS.
The statistical characterization of over-threshold SSC events, using their mean interarrival times, intensities, and durations, can be useful to estimate the total amount of reworked sediment. Although different portions of the lagoon experience different trends in these parameters, depending on specific morphological modifications, a spatial average over the whole area where over-threshold SSC events can be described as Poisson processes shows that, globally, mean interarrival times and duration slightly vary and remain almost equal to about 30 d and 13 h, respectively (Fig. S10a and c). In contrast, intensity of the peak excess abruptly changes between 1932 and 1970. Between 1611 and 1932, the mean intensity maintains a value lower than 45 mg L−1 but increases to 64 mg L−1 in 1970 and further to 73 mg L−1 in 2012 (Fig. S10b).
Table 1Sediment reworking in the historical configurations of the Venice Lagoon. Area (km2) is the area of the lagoon where KS is verified; h (m) is the mean water depth of the area; Vw (106 m3) is the mean volume of water, obtained as the product of area and water depth; e (mg L−1) is the mean intensity of over-threshold SSC events; and Smob (106 kg) is the sediment that is mobilized, assuming a triangular-shaped temporal evolution of over-threshold SSC events, with peak excess e.
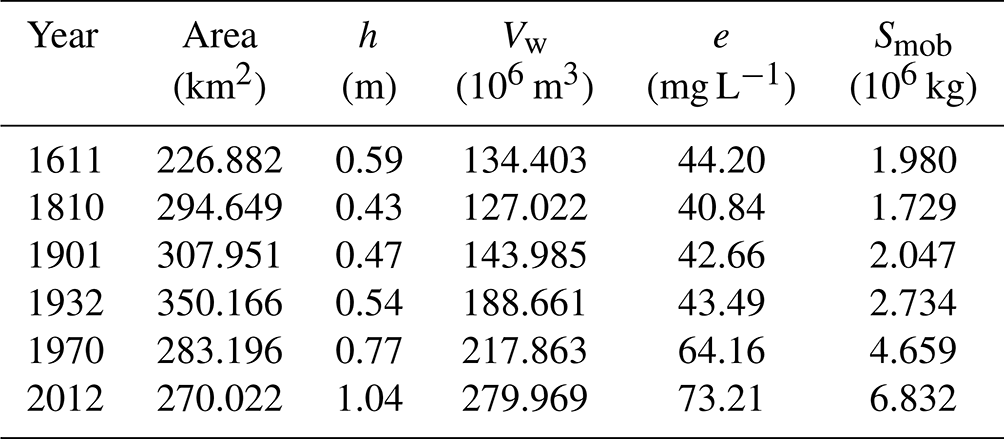
This increase in the intensity of over-threshold SSC events, which is clearly associated with the generalized deepening of the tidal-flat areas, generates an increase in the amount of reworked sediment. This means that, on average every month, for about 13 h, the amount of sediment mobilized within the basin increases from about 2×10⁶ kg in the three oldest configurations to more than 6.8×10⁶ kg in the 2012 configuration (Table 1). Besides directly boosting the amount of sediment available for export toward the open sea, given the ebb-dominated character of the Venice Lagoon (Ferrarin et al., 2015; Finotello et al., 2023), the increase in the suspended sediment also affects numerous biological and ecological processes that in turn influence the morphological evolution of the tidal system (e.g. Venier et al., 2014; Pivato et al., 2019).
As already mentioned, modelling the morphodynamic evolution of tidal landscapes over long timescales (decades or centuries) necessarily requires the use of simplified approaches. However, a classical assumption of long-term evolution models is that the sediment supply is constant or monotonically related to mean water depth. The results presented in this study, together with those obtained for erosion events (D'Alpaos et al., 2024), demonstrate that the time series of both BSS and SSC can be described as marked Poisson processes with exponentially distributed interarrival times, intensities, and durations, thereby setting a framework for the synthetic generation of statistically significant external forcing factors (shear stress at the bottom and suspended sediment available in the water column) that should improve the reliability of long-term biomorphodynamic models with a limited increase in the number of parameters.
SSC dynamics in shallow tidal environments is usually investigated by means of field measurements or remote sensing analysis. However, due to the limited spatial coverage of field measurement and the temporal resolution of satellite images, long-term SSC dynamics at the basin scale are seldom available. Numerical models, once properly calibrated and tested, can provide reliable long SSC time series, which can be used to statistically characterize the spatial and temporal variability in the intense SSC events.
In the present study, we applied a custom-built and extensively tested 2-D finite-element numerical model to reproduce SSC dynamics at the basin scale in six historical configurations of the Venice Lagoon, covering a time span of 4 centuries. The computed SSC time series were analysed on the basis of the peak-over-threshold theory. Statistical analyses suggest that over-threshold SSC events can be modelled as a marked Poisson process over wide areas of all the selected configurations of the Venice Lagoon.
We found that, due to the morphological evolution experienced by the lagoon in the last 4 centuries, the mean interarrival time, intensity, and duration of over-threshold events generally increase through the centuries, generating slightly less frequent and longer, but stronger, resuspension events.
Furthermore, almost no correlation is shown to exist between durations and interarrival times of over-threshold exceedances and between intensities and interarrival times, whereas the intensity of peak excesses and duration are highly correlated. This confirms that resuspension events can be modelled as a 3-D marked Poisson process with marks (intensity and duration) that are mutually dependent but independent on the interarrival times in all the historical configurations of the Venice Lagoon. Moreover, a comparison with the analysis of over-threshold BSS events shows that interarrival times, intensities, and durations of both BSS and SSC events are mutually related but are complementary features because of the non-local dynamics due to advection and dispersion processes.
These findings, together with those obtained for BSS events (D'Alpaos et al., 2024), provide the basis to develop a theoretical framework for generating synthetic, yet statistically realistic, forcings to be used in the long-term morphodynamic modelling of shallow tidal environments in general and for the Venice Lagoon in particular.
All data presented in this study and used for the analysis of the suspended sediment concentration are available at https://doi.org/10.25430/researchdata.cab.unipd.it.00000729 (Tognin et al., 2022b).
The supplement related to this article is available online at: https://doi.org/10.5194/esurf-12-201-2024-supplement.
Conceptualization: DT, ADA, AR, and LC. Methodology: DT, ADA, and LC. Formal analysis and investigation: DT. Figures: DT. Writing – original draft preparation: DT. Writing – review and editing: all authors. Funding acquisition: ADA and LC. Resources: ADA, LC, LDA, and AR. Supervision: ADA and LC.
The contact author has declared that none of the authors has any competing interests.
Publisher's note: Copernicus Publications remains neutral with regard to jurisdictional claims made in the text, published maps, institutional affiliations, or any other geographical representation in this paper. While Copernicus Publications makes every effort to include appropriate place names, the final responsibility lies with the authors.
This scientific activity was partially performed within the Research Programme Venezia2021, with contributions from the Provveditorato for the Public Works of Veneto, Trentino Alto Adige and Friuli Venezia Giulia, provided through the concessionary of State Consorzio Venezia Nuova and coordinated by CORILA, Research Line 3.2 (P.I. A.D.), the University of Padova SID2021 project, “Unraveling Carbon Sequestration Potential by Salt-Marsh Ecosystems” (P.I. A.D.).
This research has been supported by
-
iNEST (Interconnected Nord-Est) Innovation Ecosystem, which has received funding from the European Union NextGenerationEU (National Recovery and Resilience Plan – NRRP, Mission 4, Component 2 – D.D. 1058 23/6/2022, ECS00000043), (grant no. ECS00000043);
-
RETURN Extended Partnership, which has received funding from the European Union NextGenerationEU (National Recovery and Resilience Plan – NRRP, Mission 4, Component 2, Investment 1.3 – D.D. 1243 2/8/2022, PE0000005) (grant no. PE0000005); and
-
the PRIN project, “Reconciling coastal flooding protection and morphological conservation of shallow coastal environments” via the Italian Ministry for University and Research (grant no. 2022FZNH82).
This paper was edited by Paola Passalacqua and reviewed by two anonymous referees.
Allen, J. I., Somerfield, P. J., and Gilbert, F. J.: Quantifying uncertainty in high-resolution coupled hydrodynamic-ecosystem models, J. Mar. Syst., 64, 3–14, https://doi.org/10.1016/j.jmarsys.2006.02.010, 2007. a
Amos, C. L., Bergamasco, A., Umgiesser, G., Cappucci, S., Cloutier, D., Denat, L., Flindt, M., Bonardi, M., and Cristante, S.: The stability of tidal flats in Venice Lagoon - The results of in-situ measurements using two benthic, annular flumes, J. Mar. Syst., 51, 211–241, https://doi.org/10.1016/j.jmarsys.2004.05.013, 2004. a, b, c
Balkema, A. A. and de Haan, L.: Residual Life Time at Great Age, Ann. Probabil., 2, 792–804, https://doi.org/10.1214/aop/1176996548, 1974. a
Brand, E., Chen, M., and Montreuil, A.-L.: Optimizing measurements of sediment transport in the intertidal zone, Earth-Sci. Rev., 200, 103029, https://doi.org/10.1016/j.earscirev.2019.103029, 2020. a
Breugem, W. A. and Holthuijsen, L. H.: Generalized Shallow Water Wave Growth from Lake George, J. Waterway Port Coast. Ocean Eng., 133, 173–182, https://doi.org/10.1061/(asce)0733-950x(2007)133:3(173), 2007. a
Carniello, L., Defina, A., Fagherazzi, S., and D'Alpaos, L.: A combined wind wave-tidal model for the Venice lagoon, Italy, J. Geophys. Res.-Earth, 110, 1–15, https://doi.org/10.1029/2004JF000232, 2005. a, b, c
Carniello, L., Defina, A., and D'Alpaos, L.: Morphological evolution of the Venice lagoon: Evidence from the past and trend for the future, J. Geophys. Res., 114, F04002, https://doi.org/10.1029/2008JF001157, 2009. a, b, c
Carniello, L., D'Alpaos, A., and Defina, A.: Modeling wind waves and tidal flows in shallow micro-tidal basins, Estuar. Coast. Shelf Sci., 92, 263–276, https://doi.org/10.1016/j.ecss.2011.01.001, 2011. a, b, c, d, e, f
Carniello, L., Defina, A., and D'Alpaos, L.: Modeling sand-mud transport induced by tidal currents and wind waves in shallow microtidal basins: Application to the Venice Lagoon (Italy), Estuar. Coast. Shelf Sci., 102–103, 105–115, https://doi.org/10.1016/j.ecss.2012.03.016, 2012. a, b, c, d, e, f, g, h, i, j, k, l
Carniello, L., Silvestri, S., Marani, M., D'Alpaos, A., Volpe, V., and Defina, A.: Sediment dynamics in shallow tidal basins: In situ observations, satellite retrievals, and numerical modeling in the Venice Lagoon, J. Geophys. Res.-Earth, 119, 802–815, https://doi.org/10.1002/2013JF003015, 2014. a, b
Carniello, L., D'Alpaos, A., Botter, G., and Rinaldo, A.: Statistical characterization of spatiotemporal sediment dynamics in the Venice lagoon, J. Geophys. Res.-Earth, 121, 1049–1064, https://doi.org/10.1002/2015JF003793, 2016. a, b, c
Christiansen, T., Wiberg, P. L., and Milligan, T. G.: Flow and Sediment Transport on a Tidal Salt Marsh Surface, Estuar. Coast. Shelf Sci., 50, 315–331, https://doi.org/10.1006/ecss.2000.0548, 2000. a
Cramér, H. and Leadbetter, M. R.: Stationary and related stochastic processes, John Wiley & Sons, Ltd, New York, ISBN 10:0486438279, ISBN 13:978-0486438276, 1967. a
D'Alpaos, A., Mudd, S. M., and Carniello, L.: Dynamic response of marshes to perturbations in suspended sediment concentrations and rates of relative sea level rise, J. Geophys. Res.-Earth, 116, 1–13, https://doi.org/10.1029/2011JF002093, 2011. a
D'Alpaos, A., Carniello, L., and Rinaldo, A.: Statistical mechanics of wind wave-induced erosion in shallow tidal basins: Inferences from the Venice Lagoon, Geophys. Res. Lett., 40, 3402–3407, https://doi.org/10.1002/grl.50666, 2013. a
D'Alpaos, A., Tognin, D., Tommasini, L., D'Alpaos, L., Rinaldo, A., and Carniello, L.: Statistical characterization of erosion and sediment transport mechanics in shallow tidal environments – Part 1: Erosion dynamics, Earth Surf. Dynam., 12, 181–199, https://doi.org/10.5194/esurf-12-181-2024, 2024. a, b, c, d, e, f, g, h, i, j, k
D'Alpaos, L.: Fatti e misfatti di idraulica lagunare. La laguna di Venezia dalla diversione dei fiumi alle nuove opere delle bocche di porto, Istituto Veneto di Scienze, Lettere e Arti, Venice, ISBN 9788895996219, 2010. a, b, c, d
Defina, A.: Two-dimensional shallow flow equations for partially dry areas, Water Resour. Res., 36, 3251–3264, https://doi.org/10.1029/2000WR900167, 2000. a, b, c
Fagherazzi, S. and Wiberg, P. L.: Importance of wind conditions, fetch, and water levels on wave-generated shear stresses in shallow intertidal basins, J. Geophys. Res.-Earth, 114, F03022, https://doi.org/10.1029/2008JF001139, 2009. a
Fagherazzi, S., Kirwan, M. L., Mudd, S. M., Guntenspergen, G. R., Temmerman, S., D'Alpaos, A., Van De Koppel, J., Rybczyk, J. M., Reyes, E., Craft, C., and Clough, J.: Numerical models of salt marsh evolution: Ecological, geomorphic, and climatic factors, Rev. Geophys., 50, RG1002, https://doi.org/10.1029/2011RG000359, 2012. a
Ferrarin, C., Tomasin, A., Bajo, M., Petrizzo, A., and Umgiesser, G.: Tidal changes in a heavily modified coastal wetland, Cont. Shelf Res., 101, 22–33, https://doi.org/10.1016/j.csr.2015.04.002, 2015. a
Finotello, A., Tognin, D., Carniello, L., Ghinassi, M., Bertuzzo, E., and D'Alpaos, A.: Hydrodynamic Feedbacks of Salt-Marsh Loss in the Shallow Microtidal Back-Barrier Lagoon of Venice (Italy), Water Resour. Res., 59, e2022WR032881, https://doi.org/10.1029/2022WR032881, 2023. a, b, c, d, e, f
Gallager, R. G.: Stochastic Processes: Theory for Applications, Cambridge University Press, https://doi.org/10.1017/CBO9781139626514, 2013. a, b
Gartner, J. W.: Estimating suspended solids concentrations from backscatter intensity measured by acoustic Doppler current profiler in San Francisco Bay, California, Mar. Geol., 211, 169–187, https://doi.org/10.1016/j.margeo.2004.07.001, 2004. a
Goodwin, G., Marani, M., Silvestri, S., Carniello, L., and D'Alpaos, A.: Toward coherent space–time mapping of seagrass cover from satellite data: an example of a Mediterranean lagoon, Biogeosciences, 20, 4551–4576, https://doi.org/10.5194/bg-20-4551-2023, 2023. a
Grass, A. J.: Initial Instability of Fine Bed Sand, J. Hydraul. Div., 96, 619–632, https://doi.org/10.1061/JYCEAJ.0002369, 1970. a
Green, M. O. and Coco, G.: Review of wave-driven sediment resuspension and transport in estuaries, Rev. Geophys., 52, 77–117, https://doi.org/10.1002/2013RG000437, 2014. a
Holthuijsen, L. H., Booij, N., and Herbers, T. H. C.: A prediction model for stationary, short-crested waves in shallow water with ambient currents, Coast. Eng., 13, 23–54, https://doi.org/10.1016/0378-3839(89)90031-8, 1989. a
Lesser, G., Roelvink, J., van Kester, J., and Stelling, G.: Development and validation of a three-dimensional morphological model, Coast. Eng., 51, 883–915, https://doi.org/10.1016/j.coastaleng.2004.07.014, 2004. a, b
Maciel, F. P., Santoro, P. E., and Pedocchi, F.: Spatio-temporal dynamics of the Río de la Plata turbidity front; combining remote sensing with in-situ measurements and numerical modeling, Cont. Shelf Res., 213, 104301, https://doi.org/10.1016/j.csr.2020.104301, 2021. a
Martini, P., Carniello, L., and Avanzi, C.: Two dimensional modelling of flood flows and suspended sedimenttransport: the case of the Brenta River, Veneto (Italy), Nat. Hazards Earth Syst. Sci., 4, 165–181, https://doi.org/10.5194/nhess-4-165-2004, 2004. a
Masselink, G., Hughes, M., and Knight, J.: Introduction to Coastal Processes and Geomorphology, Routledge, ISBN 9781444122411, https://doi.org/10.4324/9780203785461, 2014. a
Mathew, R. and Winterwerp, J. C.: Morphodynamic modeling and morphological upscaling in a fine sediment system, Adv. Water Resour., 166, 104224, https://doi.org/10.1016/j.advwatres.2022.104224, 2022. a
Mehta, A., Hayter, E. J., Parker, W. R., Krone, R. B., and Teeter, A. M.: Cohesive sediment transport. I: Process description, J. Hydraul. Eng., 115, 1076–1093, 1989. a, b
Miller, R. L. and McKee, B. A.: Using MODIS Terra 250 m imagery to map concentrations of total suspended matter in coastal waters, Remote Sens. Environ., 93, 259–266, https://doi.org/10.1016/j.rse.2004.07.012, 2004. a
Möller, I., Spencer, T., French, J. R., Leggett, D. J., and Dixon, M.: Wave transformation over salt marshes: A field and numerical modelling study from north Norfolk, England, Estuar. Coast. Shelf Sci., 49, 411–426, https://doi.org/10.1006/ecss.1999.0509, 1999. a
Murray, A. B.: Reducing model complexity for explanation and prediction, Geomorphology, 90, 178–191, https://doi.org/10.1016/j.geomorph.2006.10.020, 2007. a
Nichols, M. M. and Boon, J. D.: Sediment Transport Processes in Coastal Lagoons, in: Coastal Lagoon Processes, chap. 7, edited by: Kjerfve, B., C, Elsevier, 157–219, https://doi.org/10.1016/S0422-9894(08)70012-6, 1994. a
Ouillon, S., Douillet, P., and Andréfouët, S.: Coupling satellite data with in situ measurements and numerical modeling to study fine suspended sediment transport: a study for the lagoon of New Caledonia, Coral Reefs, 23, 109–122, https://doi.org/10.1007/s00338-003-0352-z, 2004. a
Parker, G., Garcia, M., Fukushima, Y., and Yu, W.: Experiments on turbidity currents over an erodible bed, J. Hydraul. Res., 25, 123–147, https://doi.org/10.1080/00221688709499292, 1987. a
Pivato, M., Carniello, L., Moro, I., and D'Odorico, P.: On the feedback between water turbidity and microphytobenthos growth in shallow tidal environments, Earth Surf. Proc. Land., 44, 1192–1206, https://doi.org/10.1002/esp.4567, 2019. a
Roelvink, J.: Coastal morphodynamic evolution techniques, Coast. Eng., 53, 277–287, https://doi.org/10.1016/j.coastaleng.2005.10.015, 2006. a
Ruhl, C. A., Schoellhamer, D. H., Stumpf, R. P., and Lindsay, C. L.: Combined Use of Remote Sensing and Continuous Monitoring to Analyse the Variability of Suspended-Sediment Concentrations in San Francisco Bay, California, Estuar. Coast. Shelf Sci., 53, 801–812, https://doi.org/10.1006/ecss.2000.0730, 2001. a
Soulsby, R. L.: Bed shear‐stresses due to combined waves and currents, in: Advances in Coastal Morphodynamics, edited by: Stive, M. J. F., Delft Hydraul., Delft, the Netherlands, 420–423, ISBN 90-9009026-6, 1995. a
Soulsby, R. L.: Dynamics of Marine Sands: A Manual for Practical Applications, Thomas Telford, London, ISBN 9780727725844, 1997. a, b
Temmerman, S., Bouma, T. J., Govers, G., and Lauwaet, D.: Flow paths of water and sediment in a tidal marsh: Relations with marsh developmental stage and tidal inundation height, Estuaries, 28, 338–352, https://doi.org/10.1007/BF02693917, 2005. a, b
Tognin, D., D'Alpaos, A., Marani, M., and Carniello, L.: Marsh resilience to sea-level rise reduced by storm-surge barriers in the Venice Lagoon, Nat. Geosci., 14, 906–911, https://doi.org/10.1038/s41561-021-00853-7, 2021. a, b
Tognin, D., Finotello, A., D'Alpaos, A., Viero, D. P., Pivato, M., Mel, R. A., Defina, A., Bertuzzo, E., Marani, M., and Carniello, L.: Loss of geomorphic diversity in shallow tidal embayments promoted by storm-surge barriers, Sci. Adv., 8, eabm8446, https://doi.org/10.1126/sciadv.abm8446, 2022a. a, b, c
Tognin, D., D'Alpaos, A., and Carniello, L.: Statistical characterization of suspended sediment dynamics in shallow tidal environments, UNIPD [data set], 10.25430/RESEARCHDATA.CAB.UNIPD.IT, 2022b. a
Tommasini, L., Carniello, L., Ghinassi, M., Roner, M., and D'Alpaos, A.: Changes in the wind-wave field and related salt-marsh lateral erosion: inferences from the evolution of the Venice Lagoon in the last four centuries, Earth Surf. Proc. Land., 44, 1633–1646, https://doi.org/10.1002/esp.4599, 2019. a, b
Umgiesser, G., De Pascalis, F., Ferrarin, C., and Amos, C. L.: A model of sand transport in Treporti channel: northern Venice lagoon, Ocean Dynam., 56, 339–351, https://doi.org/10.1007/s10236-006-0076-z, 2006. a, b, c
van Ledden, M., Wang, Z. B., Winterwerp, H., and De Vriend, H. J.: Sand-mud morphodynamics in a short tidal basin, Ocean Dynam., 54, 385–391, https://doi.org/10.1007/s10236-003-0050-y, 2004. a, b, c, d
van Rijn, L. C.: Sediment transport, part II: suspended load transport, J. Hydraul. Eng., 110, 1613–1641, 1984. a, b, c
Venier, C., D'Alpaos, A., and Marani, M.: Evaluation of sediment properties using wind and turbidity observations in the shallow tidal areas of the Venice Lagoon, J. Geophys. Res.-Earth, 119, 1604–1616, https://doi.org/10.1002/2013JF003019, 2014. a
Volpe, V., Silvestri, S., and Marani, M.: Remote sensing retrieval of suspended sediment concentration in shallow waters, Remote Sens. Environ., 115, 44–54, https://doi.org/10.1016/j.rse.2010.07.013, 2011. a
Wang, P.: Principles of Sediment Transport Applicable in Tidal Environments, in: Principles of Tidal Sedimentology, vol. c, edited by: Davis, R. A. and Dalrymple, R. W., Springer Netherlands, Dordrecht, 1–621, ISBN 978-94-007-0122-9, https://doi.org/10.1007/978-94-007-0123-6, 2012. a
Woodroffe, C. D.: Coasts, Cambridge University Press, Cambridge, ISBN 9780521812542, https://doi.org/10.1017/CBO9781316036518, 2002. a
Wren, D. G., Barkdoll, B. D., Kuhnle, R. A., and Derrow, R. W.: Field Techniques for Suspended-Sediment Measurement, J. Hydraul. Eng., 126, 97–104, https://doi.org/10.1061/(ASCE)0733-9429(2000)126:2(97), 2000. a
Young, I. R. and Verhagen, L. A.: The growth of fetch limited waves in water of finite depth. Part 1. Total energy and peak frequency, Coast. Eng., 29, 47–78, https://doi.org/10.1016/S0378-3839(96)00006-3, 1996. a