the Creative Commons Attribution 4.0 License.
the Creative Commons Attribution 4.0 License.
 | 07 Nov 2025
A novel acoustic bedload monitoring system with phased microphone arrays and an accelerometer for particle localization and size estimation
Zheng Chen
Siming He
Alexandre Badoux
Dieter Rickenmann
Accurate measurement of bedload transport flux in rivers remains an important issue in hydraulic engineering. Acoustic-based devices provide a promising way to measure the transport rate with established calibration relationships between the signal and bedload particles. We have developed a novel acoustic bedload monitoring system with phased microphone arrays (PMA) and an accelerometer to identify the particle impact location and to better determine the particle size. Impact experiments with glass and quartz spheres in a flume setting were performed to investigate the dynamic signal response of the PMA monitoring system for varying particle size and impact location. For a similar virtual set-up, the conventional beamforming method was used to determine the source characteristics of the acoustic wave on the scanning plane of the PMA structure. The model provides a calculation of the cross-power matrix of the recorded pressures generated by bedload which localizes the particle impacts on the plate. The results show separate correlation relationships between bedload grain size and three key signal characteristics: the number of signal impulses per particle mass, the amplitude, and the centroid frequency. The findings of this study contribute to the measurement of the bedload transport with the PMA system, which helps to localize the bedload impact positions and improves the predictions of particle size.
- Article
(15025 KB) - Full-text XML
- BibTeX
- EndNote


The transport of bedload in mountain rivers is responsible for the evolution of channel morphology and bedrock incision (Turowski et al., 2015). Quantification of the bedload transport is needed for the study of river dynamics, for the application of hydraulic engineering structures, and for the assessment of flood hazards (Rickenmann, 2017). Moreover, accurate measurements of bedload transport rates help to validate empirical models that rely on experimental and field data using traditional techniques (Habersack and Laronne, 2002). However, quantifying bedload transport processes particularly in steep mountain streams still remains a considerable challenge. This is mainly due to the fact that the bedload transport process is characterized by a large spatio-temporal variability (Recking, 2010; Rickenmann, 2018; Rindler et al., 2023), which is complicated by streambed characteristics and sediment availability.
In the past decade, considerable efforts have spurred towards the development of novel surrogate monitoring technologies, with a goal to better understand the bedload transport process especially in steep streams (Rickenmann, 2017; Rickenmann et al., 2022). Acoustic monitoring devices, which record vibration signals generated by particle impacts, can provide continuous and accurate bedload transport data, including hydrophones (Barton et al., 2010; Camenen et al., 2012; Geay et al., 2017; Rigby et al., 2016), microphones (Halfi et al., 2020; Mizuyama et al., 2010), piezoelectric sensors (Krein et al., 2008; Rickenmann and McArdell, 2007), geophones (Rickenmann, 2017) and seismic sensors (Antoniazza et al., 2023; Gimbert et al., 2019; Roth et al., 2016; Tsai et al., 2012). This is because the vibration signal contains useful information in the form of signal amplitude, impulse and frequency (Barton et al., 2010; Burtin et al., 2011; Govi et al., 1993; Hsu et al., 2011; Vasile, 2020; Wyss et al., 2016a), which can be transformed to bedload transport rates and particle size classes using predefined calibration functions (Nicollier et al., 2021; Wyss et al., 2016a, c).
The Swiss plate geophone (SPG) system, as one of these surrogate monitoring techniques, has been deployed for bedload measurement in numerous steep mountainous streams and rivers in Europe for about 30 years (Rickenmann, 2017, 2024). Linear or power-law calibration functions between the electric signal and the bedload size or mass flux have been developed based on continuous data recorded by the geophone sensor, which enable to estimate spatio-temporal bedload fluxes in steep streams. However, considerable differences were also observed between the calibration functions obtained from the field measurement or lab-based experiments, and the linear calibration coefficients for total bedload mass flux can exhibit a variation of approximately a factor of 20 across different measurement sites (Rickenmann and Fritschi, 2017; Rickenmann et al., 2014). This is mainly considered due to variations of impact location of bedload particles (Turowski et al., 2013) and other factors, including particle shape (Cassel et al., 2021; Krein et al., 2008), streamflow velocity (Wyss et al., 2016a), grain size distribution (Lagarde et al., 2021; Nicollier et al., 2021; Stark et al., 2024), and particle transport mode (Chen et al., 2022b; Krein et al., 2008; Tsakiris et al., 2014). In particular, it has been found that the acoustic amplitude of the recorded signal can be decreased approximately 50 % from centric to eccentric impact on the system plate (Chen et al., 2022a). Considering that the spatial location of bedload particles could considerably affect the accuracy of particle size estimates using the pre-defined calibration relationships, there is a practical need for research into a refined recognition of bedload impact locations on the plate. Furthermore, an identification of the impact location of bedload particle helps to improve correlation relations (electric signal vs. bedload size or mass flux) that have been developed.
To address the problem of prediction uncertainties of sediment transport, partly due to its spatial variations, several efforts have been made, including the use of (i) dense networks of seismometers (Antoniazza et al., 2023; Bakker et al., 2020; Piantini et al., 2022) characterized by high temporal and spatial resolution; (ii) multiple characteristics of the bedload-generated signals, e.g. the hybrid approach of the amplitude-frequency-based method (Nicollier et al., 2022); and (iii) different acoustic systems which indicate varying signal sensitivities to the bedload transport process (Rickenmann et al., 2022). Given that (i) the scale of investigation here is limited to the plate dimensions, and (ii) the seismic waves, particularly the solid waves propagating inside the monitoring system, travel so fast (generally up to several kilometers per second in metallic materials), it is conceivable that conventional localization methods using the seismic arrival times would be very challenging within the dimensions of the plate. Therefore, we consider making use of air fluctuations, which propagate at a much slower velocity than the elastic waves in solid materials, to construct a new monitoring system consisting of phased microphone arrays (PMA), which uses beamforming techniques with the goal of inverting the acoustic source distribution generated by bedload impacts and localizing the spatial position of particle impacts on the plate.
The aim of the present paper is to quantitatively investigate the effects of bedload size and particle impact location on the signal response of the PMA system. The first step was to build the PMA system, which consists of a number of functional layers and acoustic sensors, including an accelerometer and an array of microphone elements. Secondly, the system was calibrated by laboratory impact experiments performed mainly with quartz spheres of various diameters falling onto the plate at different locations. Subsequently, we used a propagation model to simulate and reconstruct an acoustic source distribution on the plate produced by the impact of a particle, which appears as an acoustic image with the centre corresponding to the location of the particle impact. Combined with the calibration relationship obtained from the acoustic signals, the prediction of bedload size can be eventually improved in this way.
2.1 Phased microphone arrays bedload monitoring system
This section presents a bedload transport monitoring system based on microphone element arrays, which consists of a number of microphone sensors set at a specific spacing on the lower internal plate of the PMA system (Fig. 1). The acoustic data recorded by the microphone elements are then calculated and transformed to an acoustic source map (or so-called acoustic image), which is used to detect the position of bedload particles impacting on the plate, thereby optimizing the prediction of particle size.
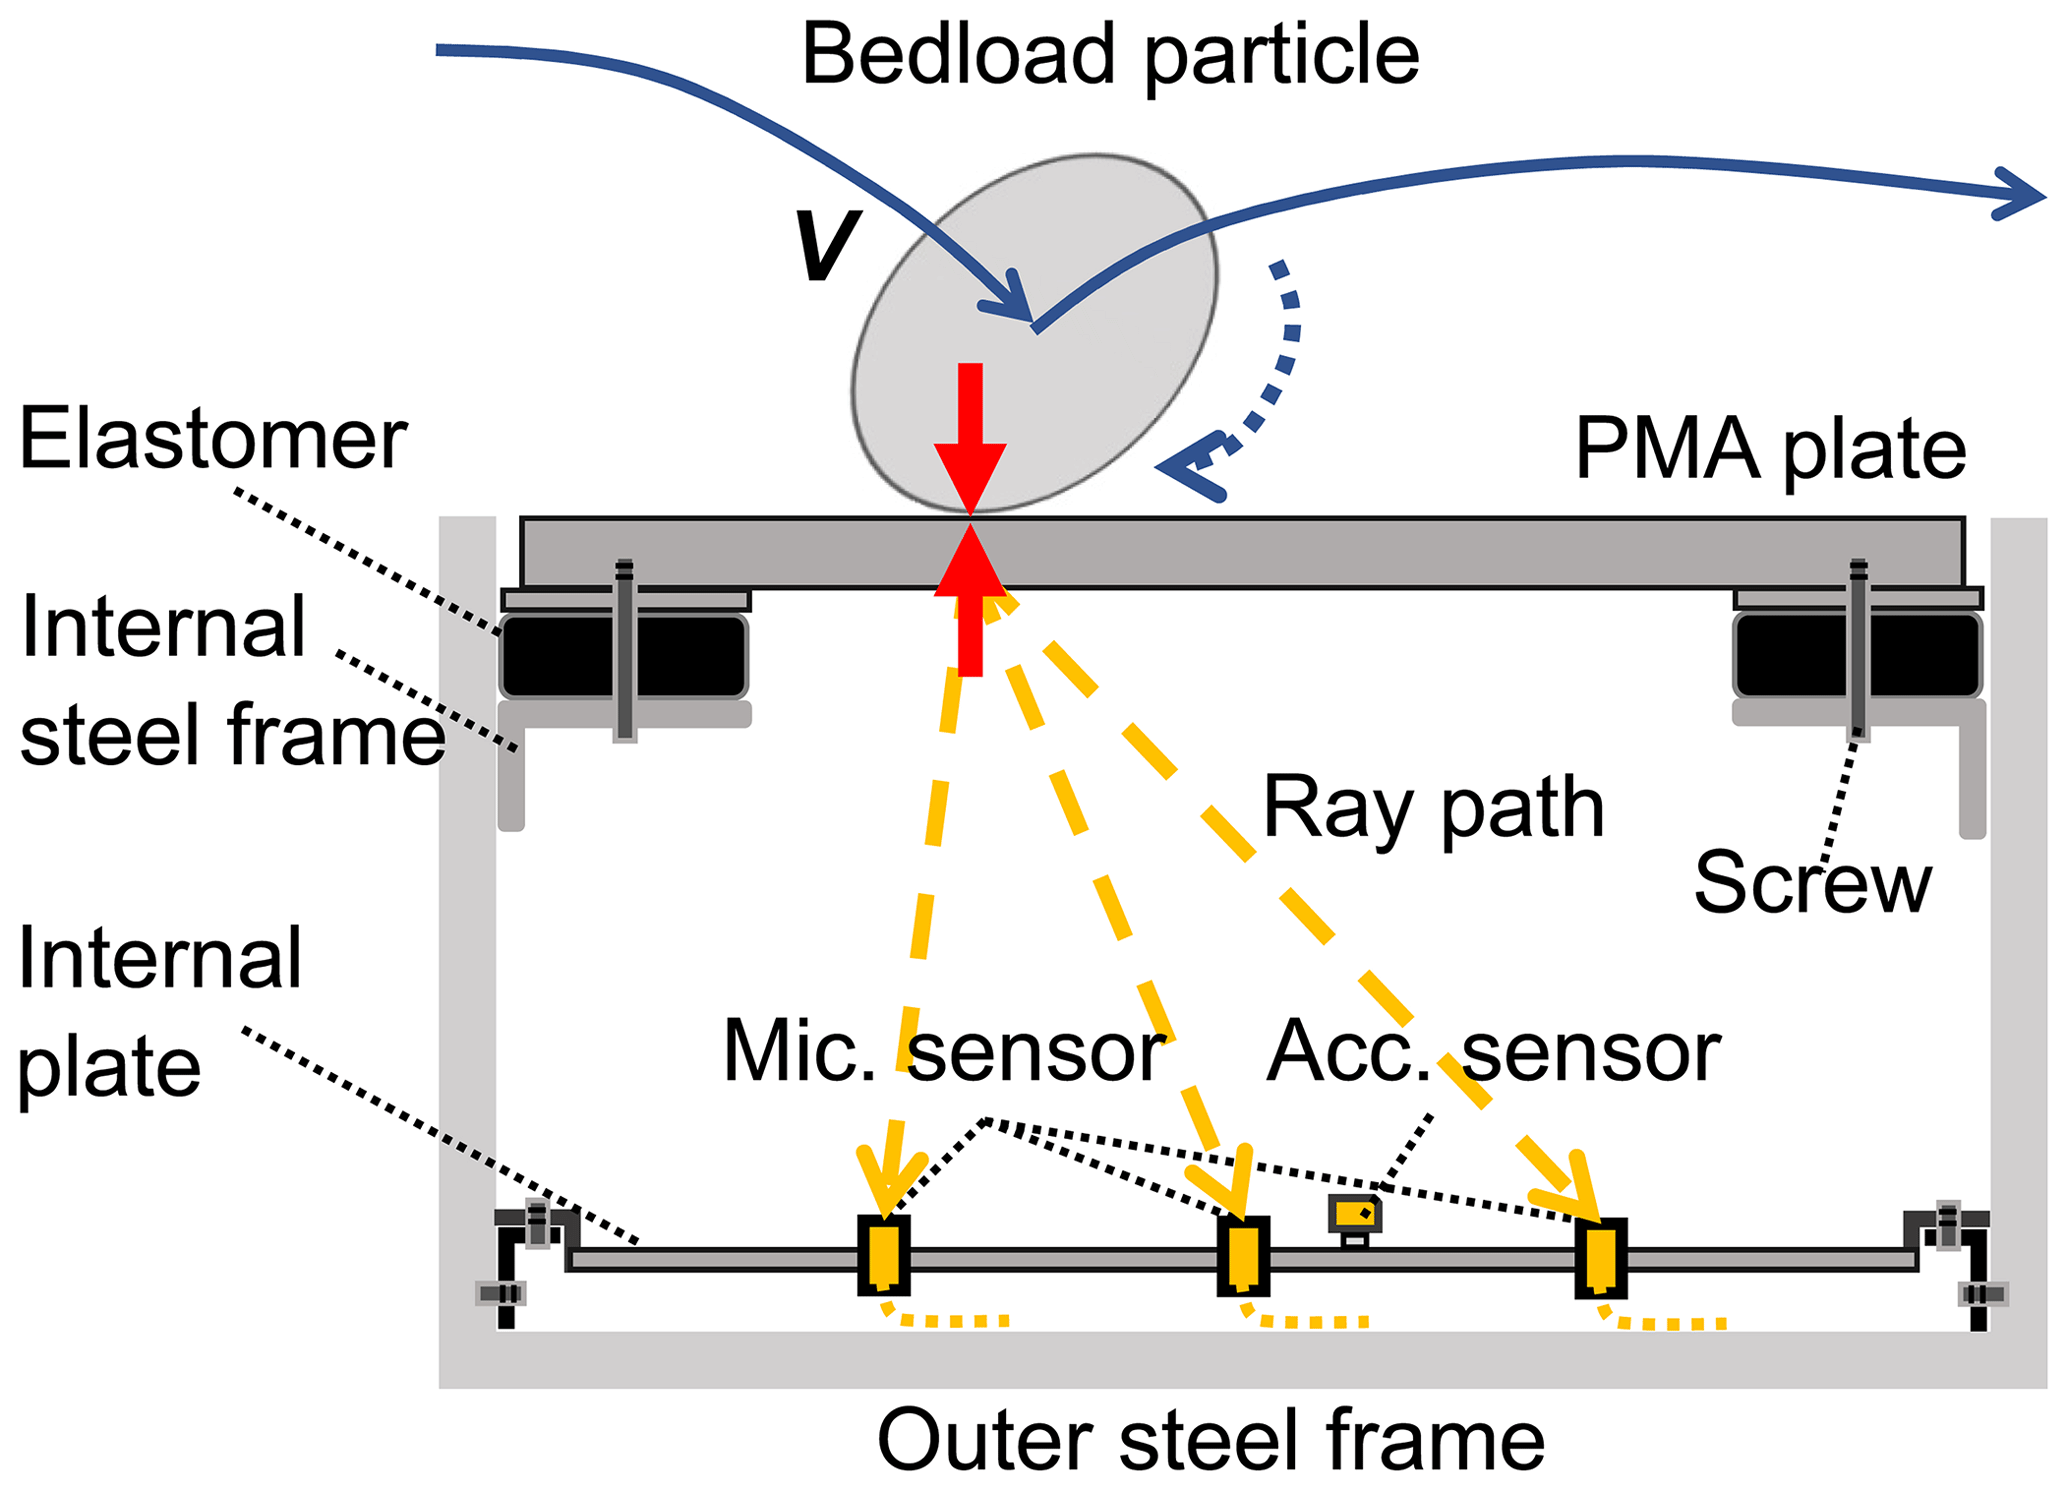
Figure 1Sketch showing a bedload particle impacting the PMA system plate at an impact velocity V. The yellow blocks represent the array of miniature microphone (Mic.) elements mounted on the internal plate of the PMA system. The acceleration (Acc.) sensor, which is fixed to the same plate, is also shown in yellow.
The PMA system consists of a series of steel plates secured onto elastomers (elastic rubber) and embedded within a large stainless-steel U frame. The PMA plate is 510 mm in length, 510 mm in width and 15 mm in thickness, and has a total mass of 30.5 kg. The elastomer layer within the PMA system serves two primary functions: (i) to reduce the transmission of vibrations to an acoustic sensor caused by bedload impacts on the surrounding material, and (ii) to prevent water from entering into the system. An internal plate, pre-punched with a matrix of circular holes, is bolted to the lower part of the system to accommodate the microphone sensors and the accelerometer (Fig. 1). The microphone element is a 4958-A model from Brüel & Kjær (Nærum, Denmark), with a frequency response range of 10 Hz to 20 kHz and a sensitivity of 11.2 mV Pa−1. This acoustic sensor records the variation in aerodynamic pressure in the PMA system generated by bedload impacts. The accelerometer is a 1A316E piezoelectric sensor from DHC (Jiangsu, China), with a frequency response range of 0.5 Hz to approximately 10 kHz and a sensitivity of 50.0 mV g−1. It is used to record the vibrations of the internal plate caused by the same impacts.
When a bedload particle with an impact velocity V collides on the PMA plate, both air pressure fluctuations and structural vibrations are generated, which forces the microphone membranes and accelerometer to vibrate. The microphone output is a voltage signal proportional to the air pressure in the PMA system, while the accelerometer output is related to the deformation velocity of the internal plate and can be converted to acceleration using its calibration coefficient. The calibration coefficients for the microphone and accelerometer are only valid within their specified frequency ranges. Outside these ranges, a frequency-dependent calibration based on sensor-specific response curves may be required. All sensor outputs are recorded at a sampling frequency of 10 kHz using a DH5902N data acquisition system from DHC, which features 16 synchronized channels and 24-bit resolution.
2.2 Laboratory impact experiment
Controlled impact experiments were designed at the Swiss Federal Research Institute WSL, Switzerland and were performed in the Key Laboratory of Mountain Hazards and Earth Surface Processes, Chinese Academy of Sciences in Chengdu, China, to investigate the signal responses of the PMA system by controlling factors such as particle size and impact location. Systematic impact experiments were carried out with glass and quartz spheres (Fig. 2, Table 1) with known particle masses ranging from 9.5 × 10⁻³ to 2.2 kg and diameters ranging from 20 to 116 mm. A height vernier caliper (Fig. 2a) was used to control the drop height, defined as the vertical height from the sphere centre (i.e., centre of mass) to the surface of the PMA plate. For all particle sizes, centre-of-mass drop height was fixed at 100 mm. This design follows the setup used in previous SPG calibration experiments and simulations (e.g., Chen et al., 2022a) and allows direct comparison with earlier studies. While this configuration results in slightly different impact velocities among particle size classes due to their differing radii, the trend is consistent with natural bedload transport conditions, in which smaller particles typically attain higher velocities under the same flow forcing. The actual impact velocity of each sphere colliding onto the PMA plate, in both water and air environments, was calculated using experimental image frames captured by a high-speed camera mounted with a side view (Fig. 2a).
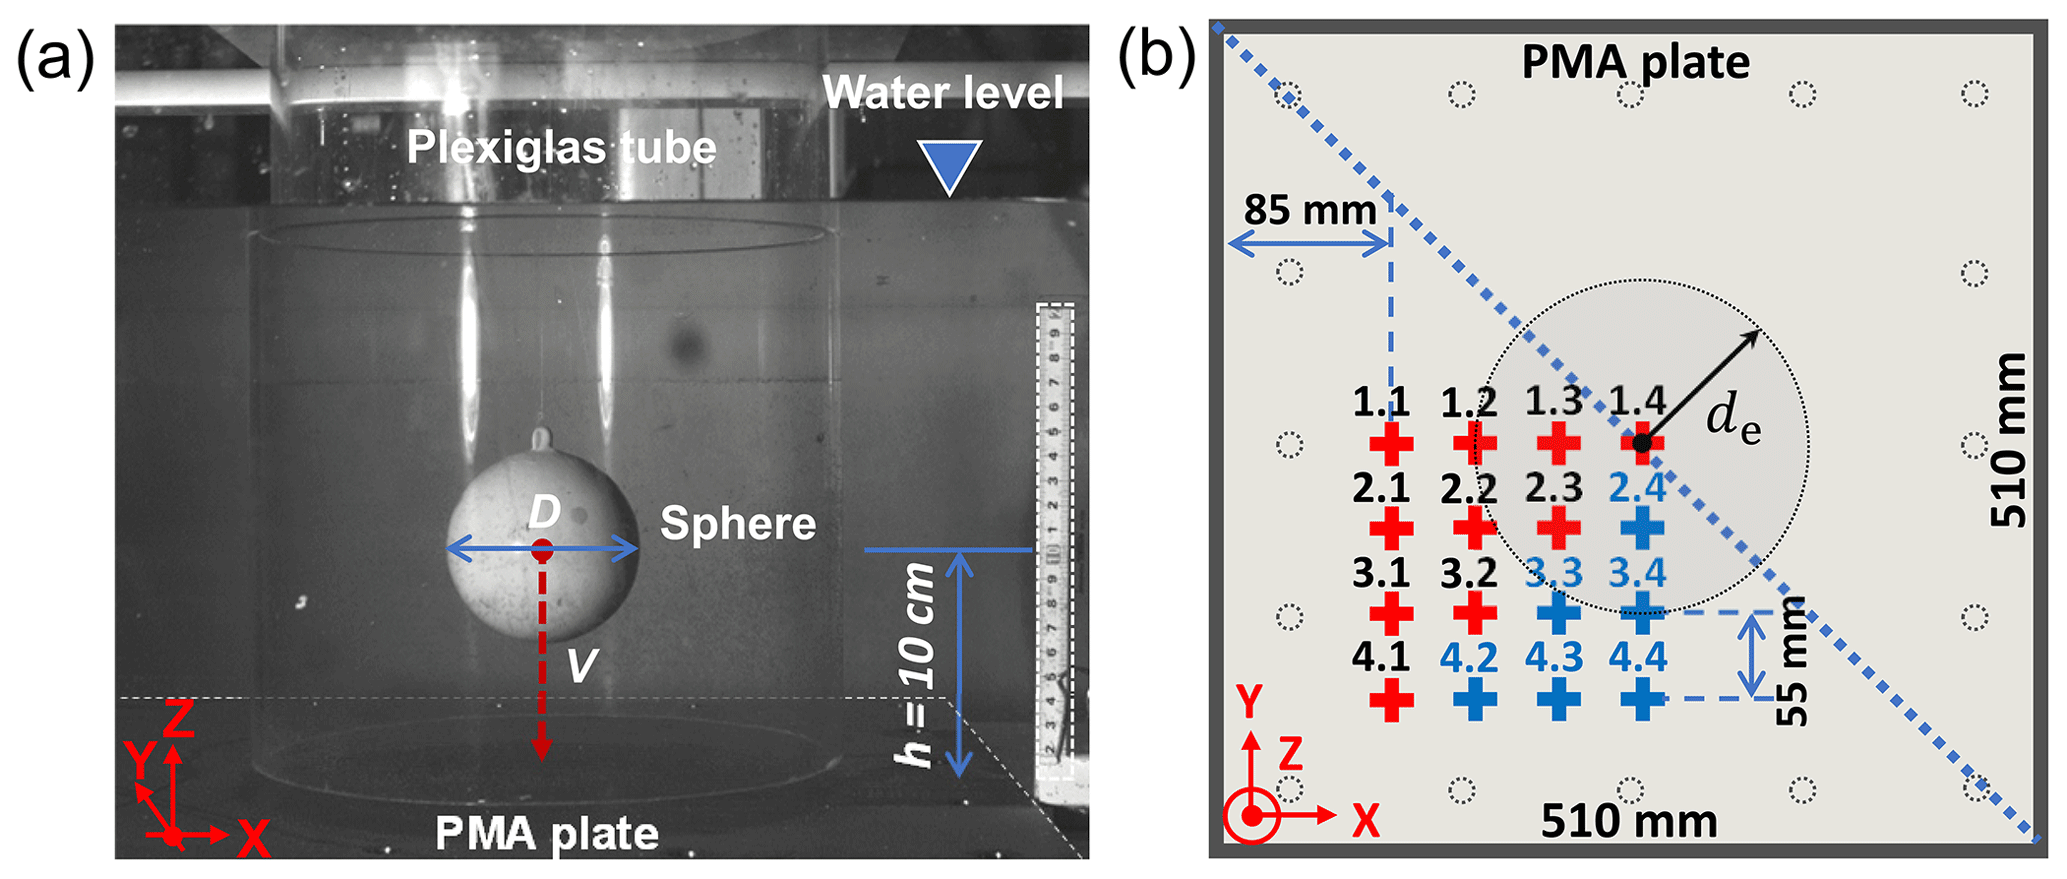
Figure 2(a) Side view of the dropping sphere during the laboratory experiments. (b) Design of the particle impact locations “+” on the plate of the phased microphones array (PMA) bedload monitoring system. The signal data generated by particles impacting on the locations coloured in red (1.1, 1.2, …, 4.1) was used for calibration, while the data generated by particles impacting on the locations marked in blue (2.4, 3.3, …, 4.4) was used for validation.
Table 1Characteristic values, including particle diameter D, mass M, particle density ρs, and impact velocity V (VA and VW) of the spheres hitting at 16 impact positions (from 1.1 to 4.4) on the plate. VA and VW indicate the impact velocities measured in the air and water, respectively.
Different particle impact locations were designed as a 4 × 4 matrix, i.e. a total of 16 positions (see Fig. 2b) from centric to eccentric on the plate. Here, we refer to “centric” impacts as those occurring at the centre of the PMA plate (location 1.4), and “eccentric” impacts as those occurring at locations further from the centre of the plate. The impact tests were repeated 10 times for each sphere on each impact location in both air and water environment. In total, 880 particle impacts were conducted, with diameters D ranging from 19.9 to 116.4 mm and eccentricity distances de ranging from 0 to 233.4 mm. The eccentricity distance de is defined as the distance between the particle impact location and the centre of the PMA plate. During the drop experiments, each impact generates 12 channels of acoustic signal data. The signal characteristics of the PMA system, generated by glass and quartz spheres impacting vertically onto the plate, were then analysed. Although tests were conducted in both air and water, only the air-based results are presented in this study, as stronger signal responses were obtained at higher impact velocities. The detailed information can be found in Table 1.
2.3 Conventional beamforming technique
The theoretical foundation and algorithmic framework of the beamforming technique have been developed over several decades (Merino-Martínez et al., 2019; Brandstein and Ward, 2001), and have been successfully applied to source localization and direction-of-arrival estimation problems in various fields (Brooks and Humphreys, 2006; Schmidt, 1982). The basic principles of the conventional beamforming technique are described below, with the first step being to calculate the Fourier transforms of the recording pressure data for each microphone element of the array, as shown in Eq. (1).
where pi(f) (i=1, …, N) are the components of the N-dimensional vector p that are obtained by fast Fourier transform (FFT) on the recorded signals, N is the number of microphone sensors, [⋯]T represents the transpose of the vector.
A propagation model to calculate the acoustic signal at the microphone locations can be selected as the “steering vector” g (see Eq. 2), considering each node of scanning plane as a hypothetical sound source (see Fig. 3). The components gj,m of g indicate the amplitude of the pressure signals recorded by the microphone sensors induced by an ideal sound source with unit strength.
where xm is the coordinate vector of microphone sensor m, ξj is the coordinate vector of node j on the scanning plane, , and Δtj,m is the emission time delay that can be expressed as:
where c is the speed of sound.
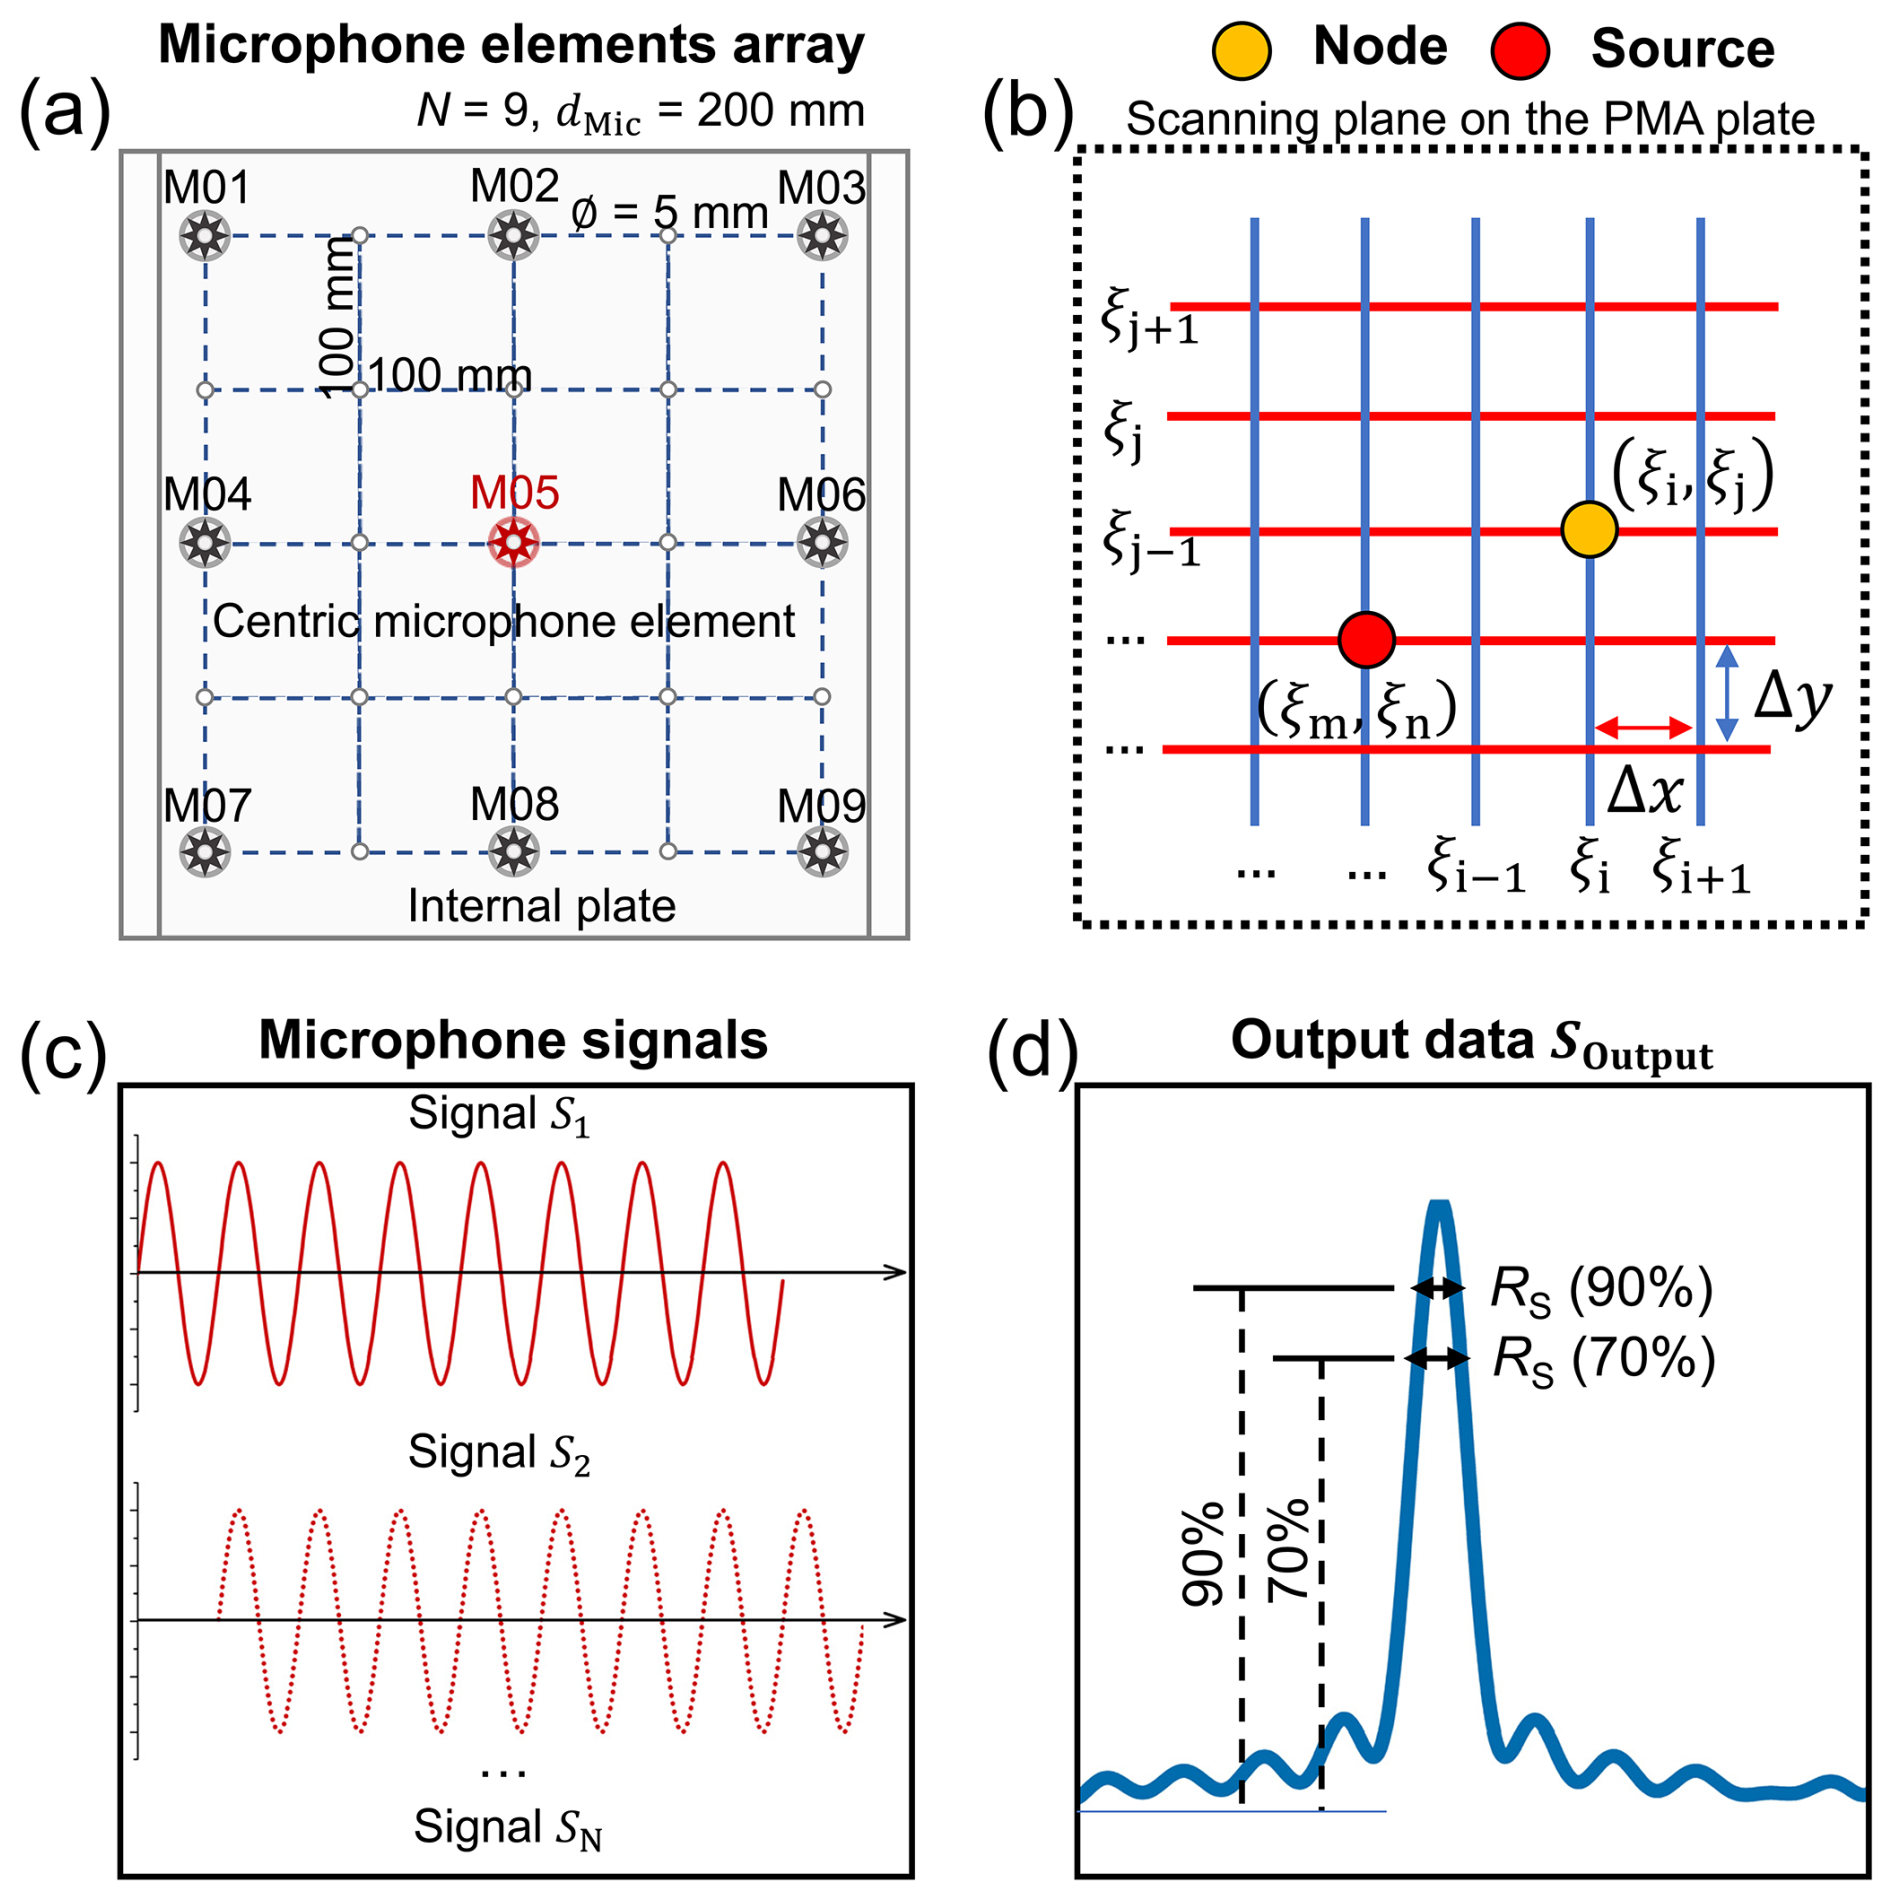
Figure 3Numerical model for the analysis of acoustic source generated by bedload particle impacts. (a) Sketch of the microphone elements mounted on the internal plate of the PMA system at a spacing distance of dMic = 200 mm, where the element in the centric position of the internal plate is marked in red. (b) Scanning plane with a standard rectangular grid and surface dimensions of LPMA × WPMA m2, where LPMA and WPMA are the length and width of the PMA plate, respectively. (ξi,ξj) indicates a node of the scanning plane on the plate, while (ξm,ξn) is the source location on the PMA plate. (c) Illustration of input signals during the numerical procedure. (d) Definition of array resolution RS based on the beamwidth of the main lobe. Here, RS is calculated as the width corresponding to a 30 % and 10 % drop from the maximum amplitude of the output data.
Since Eq. (2) indicates the pressure amplitude induced by the unit-strength sound source, the complex amplitude As of the sound source must now be determined. One consideration is to minimize the following comparison (Sijtsma, 2010), which indicates the differences Dpg between the measured or recorded pressure vector p and the calculated pressure vector Asg.
Eq. 4 can be fully rewritten as:
The minimization solution of Eq. (5) is given as
when
In general, it is convenient to consider the source auto-powers in the case of broadband noise as:
If the N×N cross-power matrix of the measured pressures is defined as C:
where p∗ is the complex conjugate transpose of p, then the calculated amplitude of the sound source can be written as:
where w is the weighted steering vector and can be expressed as:
With the above cross-power matrix C (Eq. 8) and the weighted steering vector w (Eq. 10), the strength of acoustic pressure over the nodes of the scanning plane can be calculated, resulting in an image of the sound source.
2.4 Numerical simulation
2.4.1 Numerical simulation setup
This section presents numerical examples of the impact-induced acoustic source reconstruction for a single bedload particle (monopole source) and for multiple particles (multipole sources) at different impact locations and spacing distances. Additionally, the effects of the arrangement of the microphone elements and the frequency of the source emission signal on the reconstructed acoustic image are estimated using numerical methods. Although real acoustic sources are distributed in three dimensions, fully reconstructing them in 3D would require voxel-based scanning across a volumetric domain, resulting in significantly higher computational costs. In this study, however, we focus on bedload particle impacts that occur on the surface of the PMA plate, which is approximately parallel to the riverbed. Under these conditions, the problem can be simplified to a two-dimensional source distribution on a planar surface. This allows the scanning domain to be reduced to a 2D grid and greatly reduces computational complexity while still capturing the spatial characteristics of the impact sources relevant to our application.
Numerical simulations are conducted with a planar array of N microphone elements positioned on the internal plate of the PMA system (located at Z = 0 m), as illustrated in Fig. 3. Both monopole (Mon.) and multipole (Mul.) sources were simulated above the microphones array, respectively, which are located on the surface plate (in the plane Z = 0.25 m) of the PMA system. Subsequently, acoustic beamforming was applied to a scanning plane parallel to the plate surface and located at the same height (Z = 0.25 m), covering the entire area of the PMA plate (LPMA × WPMA = 0.51 × 0.51 m2). This domain was discretized into a standard rectangular grid with a spatial resolution of 0.01 m in both the X and Y directions, resulting in NGrid = 1.02 × 10⁴ grid nodes. The acoustic image was computed by scanning each grid node and evaluating the beamforming response, on the assumption that each node represents a potential point source. Consequently, the resulting amplitude field provides a spatial map of the reconstructed acoustic source distribution, which is analyzed in the following sections.
2.4.2 Microphone elements arrangement
Figure 3a displays an array with N = 9 microphone elements, where the number of elements and the spacing, dMic, are mutually constrained because the structural dimensions of the PMA system have been predetermined. Hence, the planar dimensions of the PMA in terms of its length LPMA and width WPMA control the distribution range of the microphone element arrays, while the height HPMA constraints the wave propagation distance from the sound source to the element arrays.
An illustration of the output source plot from the scanning process over the grids (Fig. 3b) using the microphone signals (Fig. 3c) is presented in Fig. 3d which is also called “beam pattern” and generally ranges in dB. The beam pattern consists of the main lobe which is determined by the peak value and its neighbourhood and a number of side lobes. The array resolution RS of the PMA system is defined as the beamwidth of the main lobe in the reconstructed acoustic image. This beamwidth is measured as the spatial width around the peak amplitude where the response drops by 3 dB, which is the standard definition in array signal processing. In addition to this conventional 3 dB criterion, we use more restrictive thresholds of 30 % and 10 % below the peak value in the present study, as shown in Fig. 3d. These thresholds were chosen empirically to provide a broader perspective on how the spatial spread of the reconstructed acoustic energy varies under different amplitude criteria. The beamwidth shows dependencies on signal frequency, wave propagation distance, microphone arrangement, beamforming algorithm, etc. In particular, the spacing between array elements dMic is an important parameter controlling the characteristics of beam pattern of the reconstructed acoustic source, especially the beamwidth.
Theoretical and computational studies have shown that the beamwidth is affected by the array spacing and the signal frequency (Flanagan, 1985; Brandstein and Ward, 2001). In general, the aim of the array design is to create a sharper beam (i.e. a higher main lobe with lower side lobes), which indicates more concentrated energy in the desired direction. Hence, the microphone elements spacing dMic can be adjusted appropriately to optimize resolution. However, overly large spacing can lead to undesirable outcomes, such as noise suppression and the occurrence of spatial aliasing. In particular, spatial aliasing occurs when dMic exceeds half the wavelength of the signal, resulting in less differentiation between the main and side lobes. In the numerical simulations, we selected a representative signal frequency of 1600 Hz, which corresponds to the typical centroid frequency observed in experiments for medium-sized particles. To avoid spatial aliasing in the array response, the microphone elements spacing dMic was set to satisfy the Nyquist sampling criterion:
where the wavelength of signal , with the speed of sound c = 340 m s−1 and f = 1600 Hz, resulting in dMic≤106.3 mm. To guide the numerical implementation, the corresponding angular frequency w=2πf ≈ 10 048 Hz and wave number ≈ 29.6 m−1 were also computed for this reference frequency. These values are summarized along with other key simulation parameters in Table 2.
Table 2Characteristic parameters of the sound source used for numerical simulations, including sound speed c, sampling frequency fS, block length T, frequency of interest f, angular frequency w, wave number k, number of microphone elements N, signal-noise ratio SNR, grid size in the X and Y directions, Δx and Δy respectively.
2.4.3 Numerical tests
The objective of the numerical tests was to localize the spatial position of the bedload particles using a minimum number of microphone elements mounted on the internal plate. A periodic cosine waveform was chosen as the input emission signal to enable more precise control of the signal frequency and simplify the analysis process. This type of waveform resembles the initial oscillatory features observed in real impact-generated acoustic signals which are influenced by factors such as particle size, contact stiffness, and impact dynamics (Chen et al., 2022a). This synthetic signal was propagated to each microphone element using the propagation model (steering vector g). White noise was added to the received signal of each microphone element, with the signal-to-noise ratio (SNR) of 10. This white Gaussian noise was selected to simulate moderate ambient disturbances in a controlled manner, consistent with common practices in inversion and signal processing tests. However, it should be noted that real-world acoustic noise may exhibit more complex spectral characteristics. Beamforming was then performed over the predefined scanning plane to reconstruct the acoustic image of the sound source. Key parameters used in the numerical simulations are summarized in Table 2. The number of microphone elements N varied from 3 to 25, and different layouts were tested, as detailed in Appendix A.
2.5 Experimental signal processing
2.5.1 Maximum amplitude
Acoustic signals, including microphone signals and acceleration vibrations, can be triggered by bedload impacts and recorded by the PMA system. Typical signals recorded by the accelerometer (mounted near the centre of the internal plate of the PMA system) and the microphone element (M01; see Fig. 3a) during an impact experiment using a 24.8 mm diameter sphere impacting the plate at the location 1.4 are shown in Fig. 4. A packet is defined as an envelope (see blue lines in Fig. 4) of the raw signals which is computed with Hilbert transform as introduced by Wyss et al. (2016a), reflecting an impact event of a particle hitting on the plate. The packet-based amplitude histogram method was developed by Wyss et al. (2016a) to derive bedload size information from geophone data recorded by the SPG system, through a predefined calibrated power-law relationship.
where APac,j indicates the mean amplitude (V) of a signal packet for each class j, Dj (mm) is the mean particle size for class j, and the two coefficients α and β in Eq. (12) are determined by calibrated laboratory experiments or field bedload measurements.
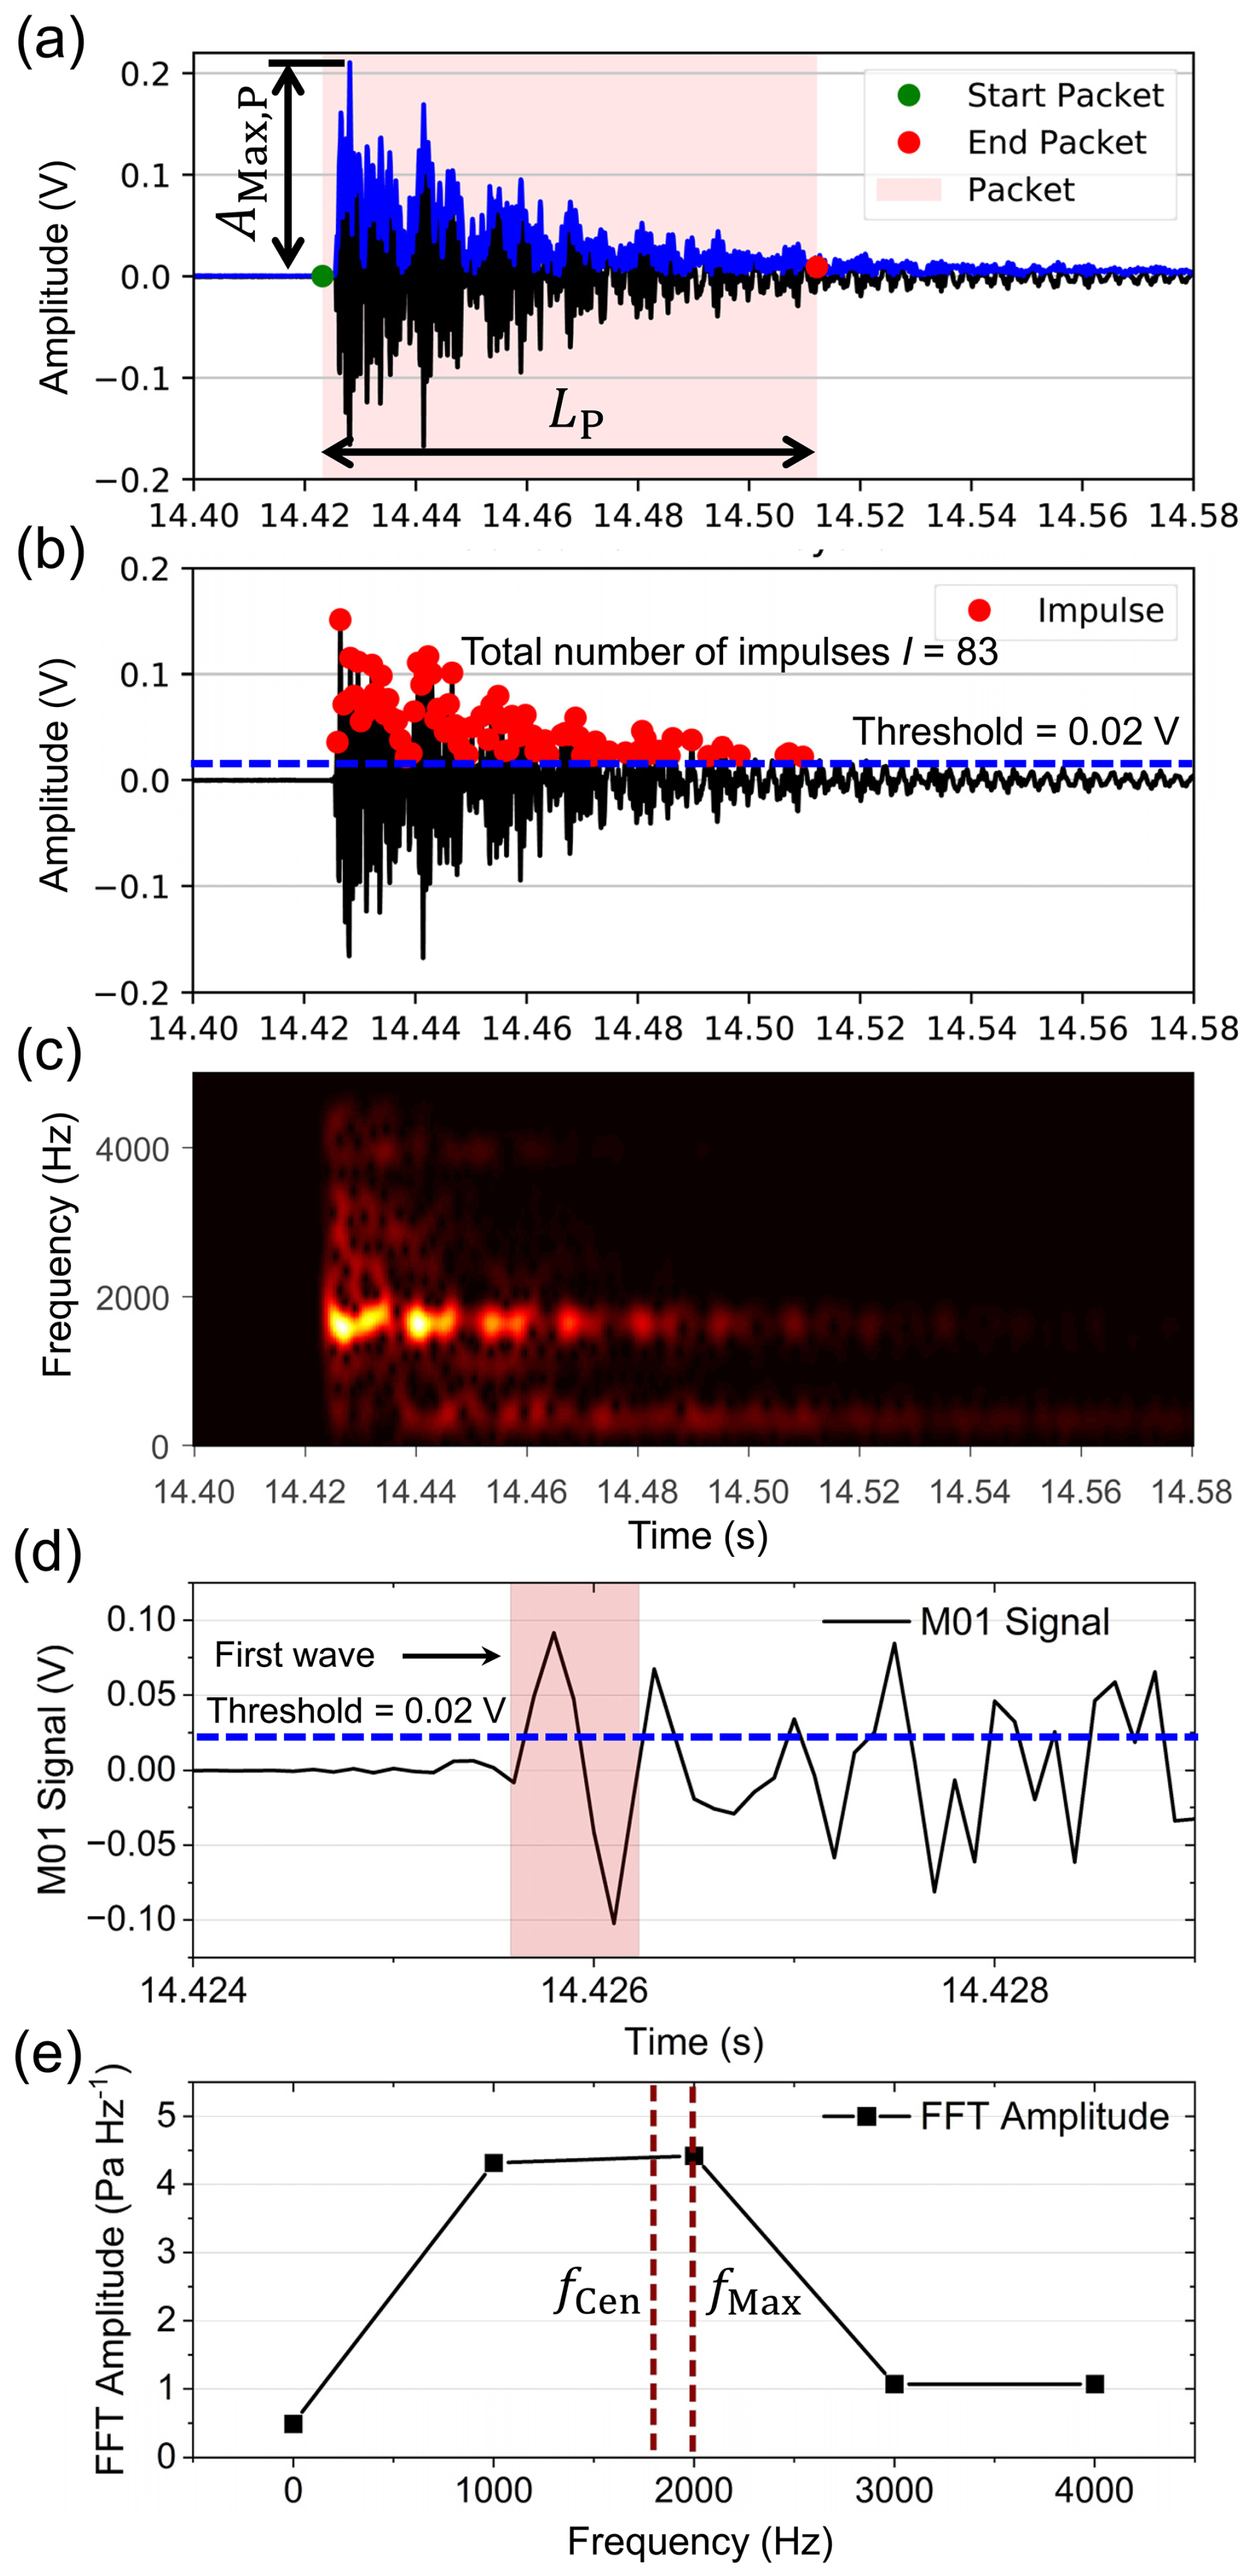
Figure 4Illustration of the internal plate vibrations of the PMA system generated by a centric impact with a sphere of 24.8 mm in diameter. (a) The signals in the vertical direction were generated by a centric impact (location 1.4) onto the PMA plate with a velocity of 1.05 m s−1. A signal packet (see solid blue line) was presented as an envelope of the signal, which was computed with the Hilbert transform. (b) Signal impulses I = 83 were counted as the number of times the signal exceeded the threshold value (see dashed horizontal blue line) that is defined as 0.02 V in the positive domain. (c) Spectrogram of the vibration signals. (d) Illustration of the first wave. (e) Calculation of the centric fCen and peak fMax frequency of the first wave signal.
In the present study, we follow the above method to determine a packet of acoustic signals generated by a falling sphere impacting on the PMA plate. Based on the calculated packet, the positive maximum amplitude of the generated signal is defined as AMax,P in voltage (V) and the packet length (time duration) is determined as LP, as shown in Fig. 4a. In addition to studying the signal characteristics within an entire envelope, we also focus on the effective “first wave” of the signals, as its physical properties are more significant than the entire signal including reflection waves, as illustrated in Fig. 4d and e. The length of the effective first wave is approximately 1 to 2 ms, whereas LP typically lasts tens to hundreds of milliseconds.
2.5.2 Signal impulses
A packet contains a number of impulses I which corresponds to the number of times the positive signal peaks cross the pre-defined amplitude threshold (Rickenmann et al., 2014; Wyss et al., 2016b), as illustrated in Fig. 4. On the basis of impulses counting, we further define a calibration coefficient. This is the number of impulses per particle mass kIPM (see Eq. 13), which indicates the signal vibrations triggered by a single particle impact.
where Ii,j are the signal impulses recorded by the system and generated by a single particle impact for an experimental run i and particle size class j, and Mi,j is the corresponding mass of that particle.
2.5.3 Centroid frequency
The centroid frequency fCen of the plate vibrations is proposed as an important parameter which helps to identify the bedload particle size, according to the Hertz contact theory (Chen et al., 2022a; Johnson, 1985; Rickenmann, 2017; Thorne, 1986, 2014). In this study, the frequency spectrum of a signal packet is determined by a fast Fourier transform (FFT), and the centroid frequency of the microphone and acceleration signal of a packet are computed as fCen−Mic and fCen−Acc, respectively, using the following Eq. (14). With regard to the signal of the first wave, we also consider calculating its centroid frequency as well as peak frequency fMax, as seen in Fig. 4e.
where fm is the spectrum frequency (Hz) and AFFT,m is the amplitude (V Hz−1) which is calculated by performing FFT on the recorded signals.
2.6 Particle size estimation and model-based correction
To improve the accuracy of particle size estimation, the amplitude–size calibration relationships were analyzed across 10 different impact locations (see positions marked in red in Fig. 2b). The data generated for the remaining six impact locations (marked in blue in Fig. 2b) were then used for particle size validation. We further developed a model-based correction approach to improve the accuracy of particle size estimation. This procedure consists of the following steps: (i) The calibrated data revealed a correlation between the coefficient lgα and the eccentricity distance de. (ii) For particle sizes ranging from 19.9 to 116.4 mm, the signal data generated by particle impacts was used to calculate the sources' centre coordinates using the acoustic model developed earlier in this study. (iii) The value of de for each impact is to the distance from the acoustic centre according to the model inversion to the centre of the PMA plate. The value of α can be then calculated using the relationship lgα−de. (iv) With the previously determined value of α and the assumed constant value of β, along with the application of the power-law relationship , the particle size DE, after mitigating the influence of eccentricity, can be calculated as Eq. (15) below:
where DE and αE are the optimized particle size and coefficient α after reducing the influence of eccentricity, respectively; is the mean value of the maximum amplitude of a packet for 10 repetitive impact tests.
For a better comparison between the optimized and the non-optimized predicted particle sizes, the packet amplitudes resulting from eccentric impacts (e.g., impact at 2.4, 3.4, …, 4.2) were employed for the computation of particle size DA. This was achieved using variable calibration relationships, employing the original values of α, which were determined at different impact locations (1.4, 2.3, 3.2, and 4.1).
3.1 Performance of the array of microphone elements
3.1.1 Number of microphone elements
Figure 5 shows the acoustic images of monopole sources determined with a number of microphone elements N. The results of pressure distribution are displayed and normalized by the maximum amplitude of the main lobe. Figure 5a to d present the monopole source images determined with N = 4, 9, 16, and 25, respectively. Figure 5e plots the corresponding beam patterns, with dMic = 100 mm, and f = 1600 Hz, for different microphone arrays. The beam pattern consists of a total of one main lobe for N = 4 and 9, while two side lobes appear for N = 16 and 25. According to the results, the resolution value of the beam pattern becomes finer as the number of microphone sensors increases, with N ranging from 3 to 25 (Fig. 5f).
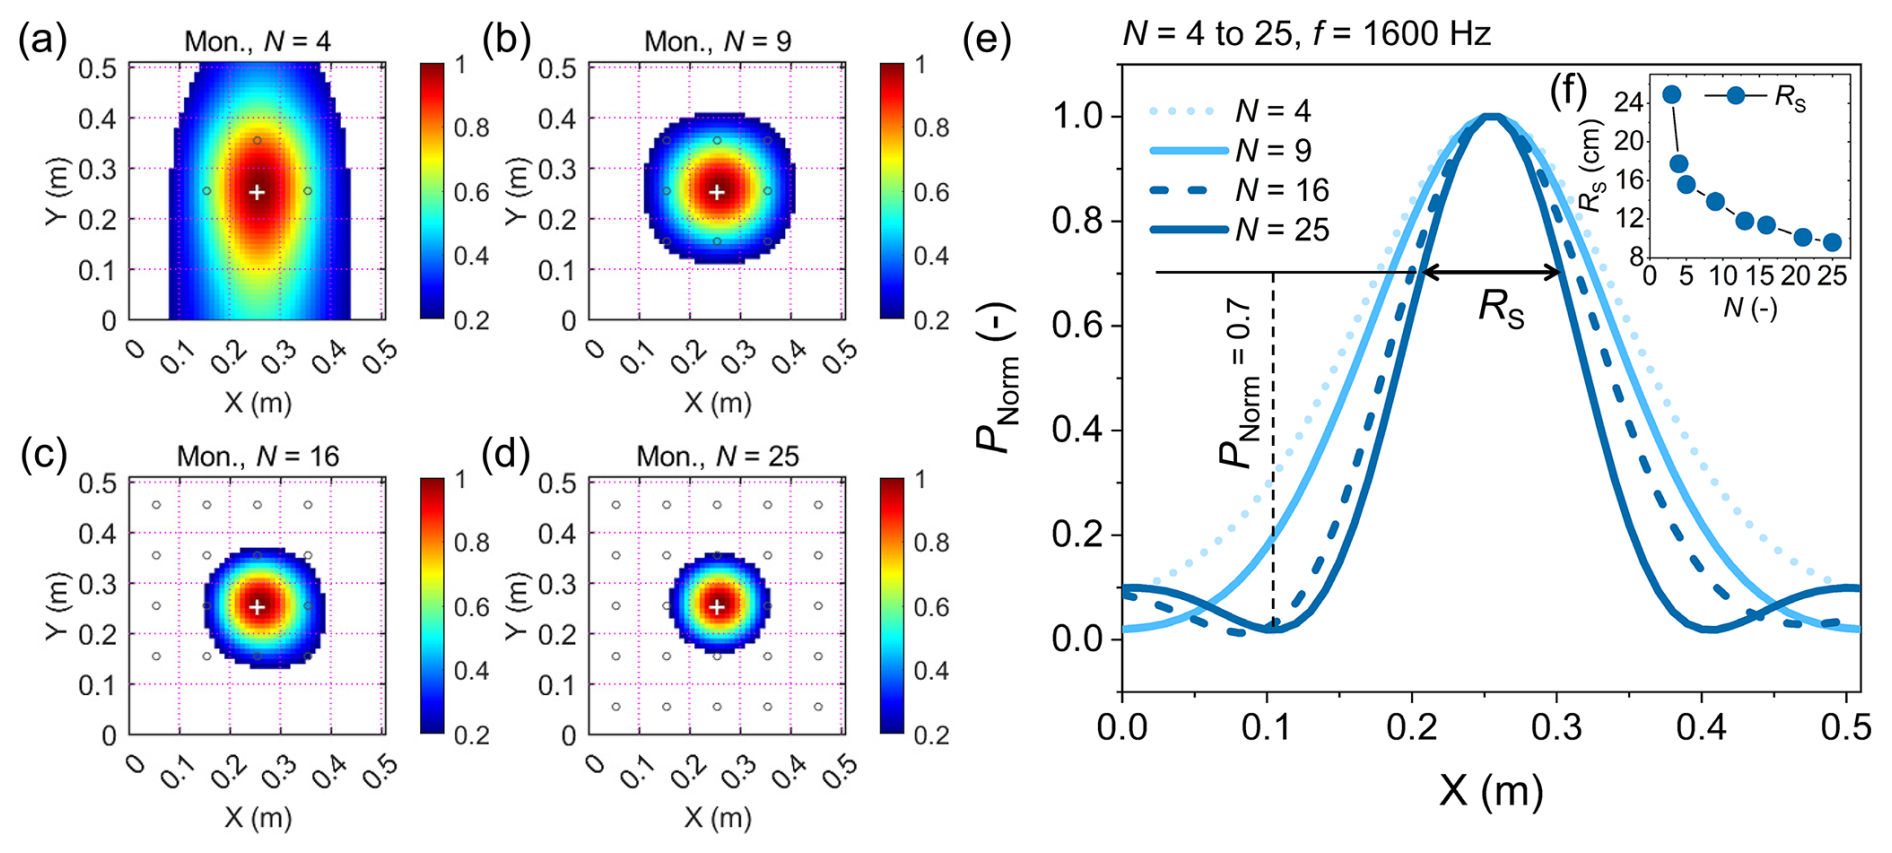
Figure 5The acoustic image and beam pattern determined with varied microphone element numbers N ranging from 3 to 25. (a–d) The acoustic images derived from the monopole source (Mon.) at the centric location of the PMA plate, obtained by using the beamforming technology with different numbers of microphones N = 4, 9, 16, 25, respectively. The microphone elements are marked with black circles. The colour bar indicates the non-dimensional acoustic intensity PNorm, representing the value of the reconstructed acoustic pressure normalized by the maximum amplitude at the centre of the acoustic image. (e) The corresponding beam patterns of N-sensor arrays when dMic = 100 mm and frequency f = 1600 Hz for monopole sources. (f) Resolution of the beam pattern RS as a function of N (ranging from 3 to 25). The emission coordinate (0.255, 0.255) is at the centre of the plane, as marked by the white cross “+”.
3.1.2 Microphone elements arrangement
The acoustic images shown in Fig. 6a–d are determined with nine microphone elements for the four different sensor arrangements Arr01–Arr04. Figure 6e plots the corresponding beam patterns with N = 9, dMic = 100–200 mm, and f = 1600 Hz, for different microphone arrangements. The spacing distances dMic between microphone elements in an array range from 100 to 200 mm when changing their arrangement from Arr01 to Arr04, see Appendix A for more information. The results indicate that the microphone element array with the Arr04 arrangement (dMic = 200 mm) has the finest resolution of the beam pattern with the highest side lobes.
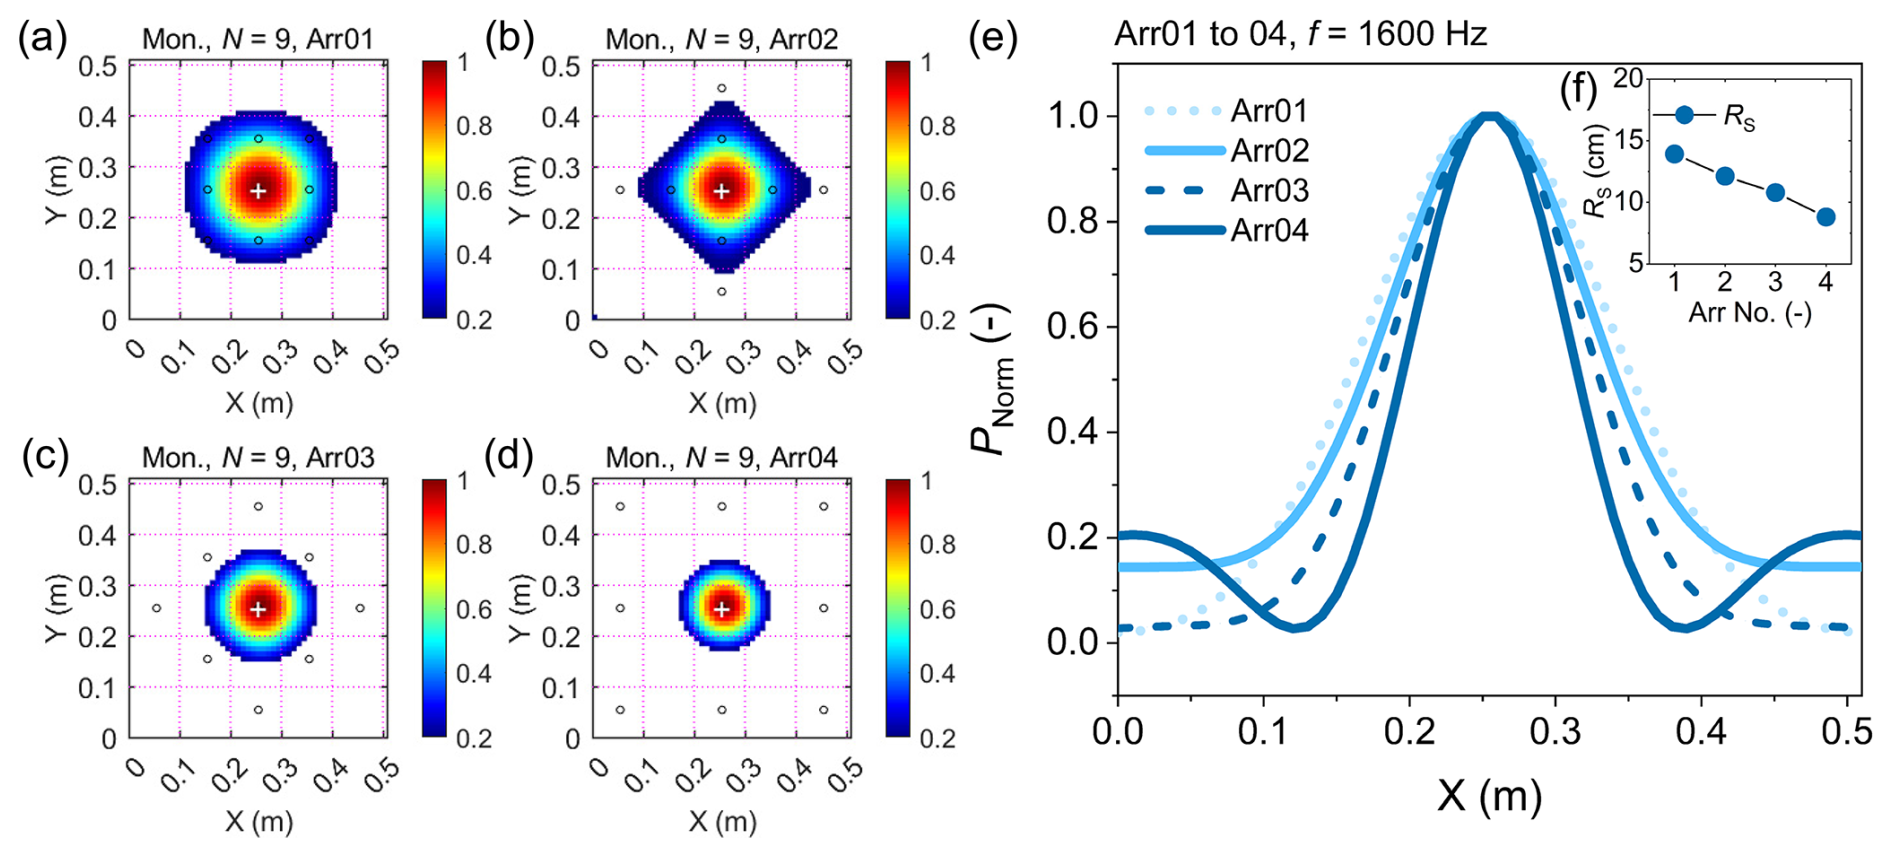
Figure 6The acoustic image and beam pattern determined with different microphone element arrangements. (a–d) The acoustic images for a monopole source determined with microphone element arrangements Arr01 to Arr04, respectively. The microphone elements are marked with black circles. (e) The beam patterns of the 9-sensor array for different element arrangements Arr01 to Arr04, with dMic = 100 mm and f = 1600 Hz for monopole sources, respectively. (f) Resolution of the beam pattern RS for Arr01 to Arr04. See the caption of Fig. 5 for details regarding the colour scale.
3.1.3 Locations and spacing distances of sound sources
Figure 7 shows the reconstructed acoustic images of the sources generated with varying signal emission locations for monopole sources. The results of pressure distribution are displayed and normalized by the maximum amplitude of the main lobe. Figure 7a to d present the monopole source images under the condition of the emission coordinates (0.09, 0.09), (0.145, 0.145), (0.200, 0.200), and (0.255, 0.255), respectively. According to the results, the coordinates of the reconstructed acoustic source, corresponding to the centre of the red-black area, generally agree well with the locations of the emission signals. Figure 7e plots the beam pattern for a microphone array with nine sensors, dMic = 100 mm, and f = 1600 Hz, for different signal emission locations. The beam pattern consists of a total of three beams for the signal emission locations close to the boundary of the plate. The one with the maximum amplitude is the so-called main lobe and the rest are side lobes with relatively smaller amplitudes, as mentioned above. In contrast, the shape of the beam pattern changes, becoming more symmetrical as the emission location is moved from the boundary to the plate centre (0.255, 0.255). The simulation results also show that, as the emission source moves from the plate edge towards the centre, the amplitudes of the side lobes decrease significantly, centre indicating better spatial focusing and reduced side lobe interference in the reconstructed acoustic image.
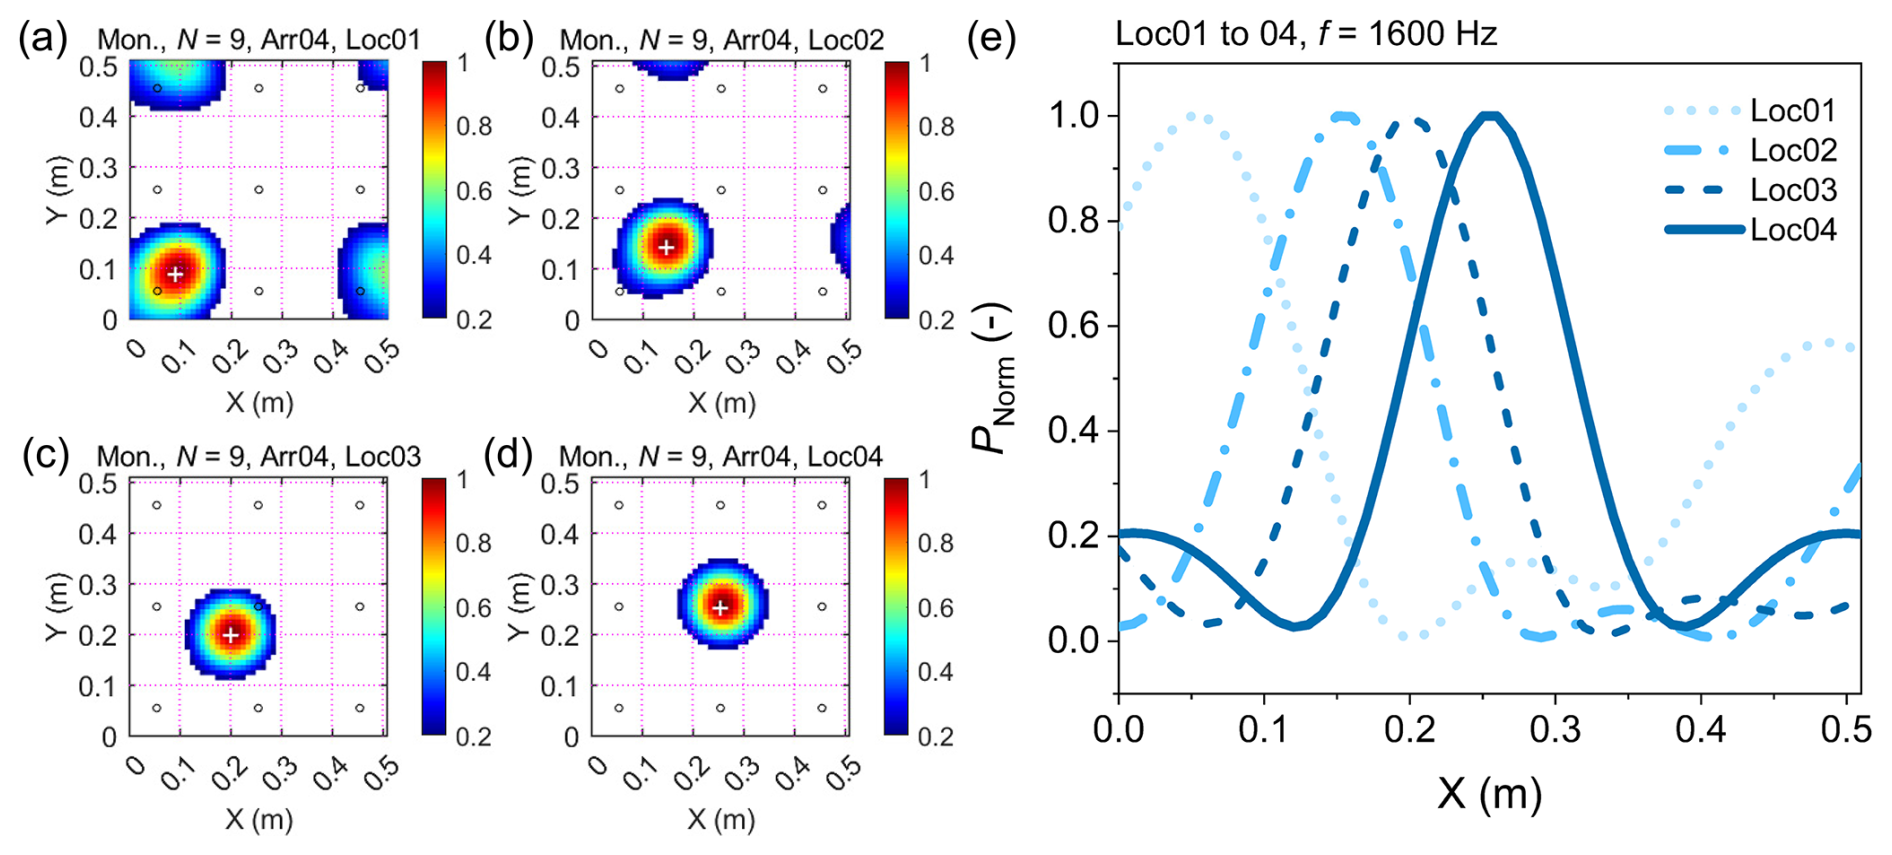
Figure 7Reconstructed acoustic image and beam patterns for monopole sources. Panels (a) to (d) show monopole source images at different impact locations. Panel (e) displays the corresponding beam patterns obtained with a 9-sensor array (dMic = 100 mm, f = 1600 Hz) for monopole source. The signal emission coordinates in (a) to (d) are (0.09, 0.09), (0.145, 0.145), (0.200, 0.200), and (0.255, 0.255). See the caption of Fig. 5 for details regarding the colour scale.
The reconstructed acoustic images, on the other hand, for two simultaneous sources with varying spacing distances ranging from 0.12 to 0.3 m, are presented in Appendix B. There are two main lobes of approximately the same amplitude, corresponding to two acoustic sources, as shown in Fig. B1. The number of beams decreases to one when the spacing is reduced. For more closely spaced sources, the side lobe between the two main lobes disappears, while the amplitudes of the rest side lobes increase significantly, which indicates that the gain pattern of the competing sources becomes larger when the two sources are close to each other. Furthermore, as the spacing distance drops to 0.12 m, the number of beams in the beam pattern remains as a single beam with a much higher resolution of the main lobe. Under the current sensor layout and signal conditions, the reconstructed acoustic image shows a single merged peak when two sources are placed within approximately 12 cm of each other, suggesting a resolution threshold near this value. Additional numerical results involving three or four simultaneous sources with varying arrangements are also provided in Appendix B (see Fig. B2).
3.2 Signal responses of the PMA system generated by particle impacts
3.2.1 Maximum amplitude
The maximum amplitude AMax,P-Acc of a packet recorded by the accelerometer increases with particle size D for both the centric (location 1.4) and eccentric (locations 2.3, 3.2, and 4.1) impacts, as shown in Fig. 8a. To make a direct comparison with the SPG system, we performed an additional calculation by integrating the acceleration signals to obtain the deformation velocity which can be then transformed into a voltage signal using the calibration coefficient (27.6 V m−1 s) of the SPG geophone. In Fig. 8a, the empirical relationship based on the laboratory flume experiments of Wyss et al. (2016a) and the results of the field experiments at the Erlenbach site with the SPG system (Wyss et al., 2016c) are presented for comparison with the AMax,P-Vel. AMax,P-Vel indicates the maximum packet amplitude in voltage, which is derived from the velocity signals integrated from accelerations in the Z direction, using the SPG system geophone's calibration coefficient. An increasing trend can be observed for the AMax,P-Mic data recorded by the microphone element M05 (Fig. 8b). All measurements show a generally larger amplitude triggered by centric impacts compared to that induced by eccentric impacts, except for the largest particles with D = 116.4 mm. The differences between the centric and eccentric impacts also show an increasing trend with increasing particle size (up to size class 6).
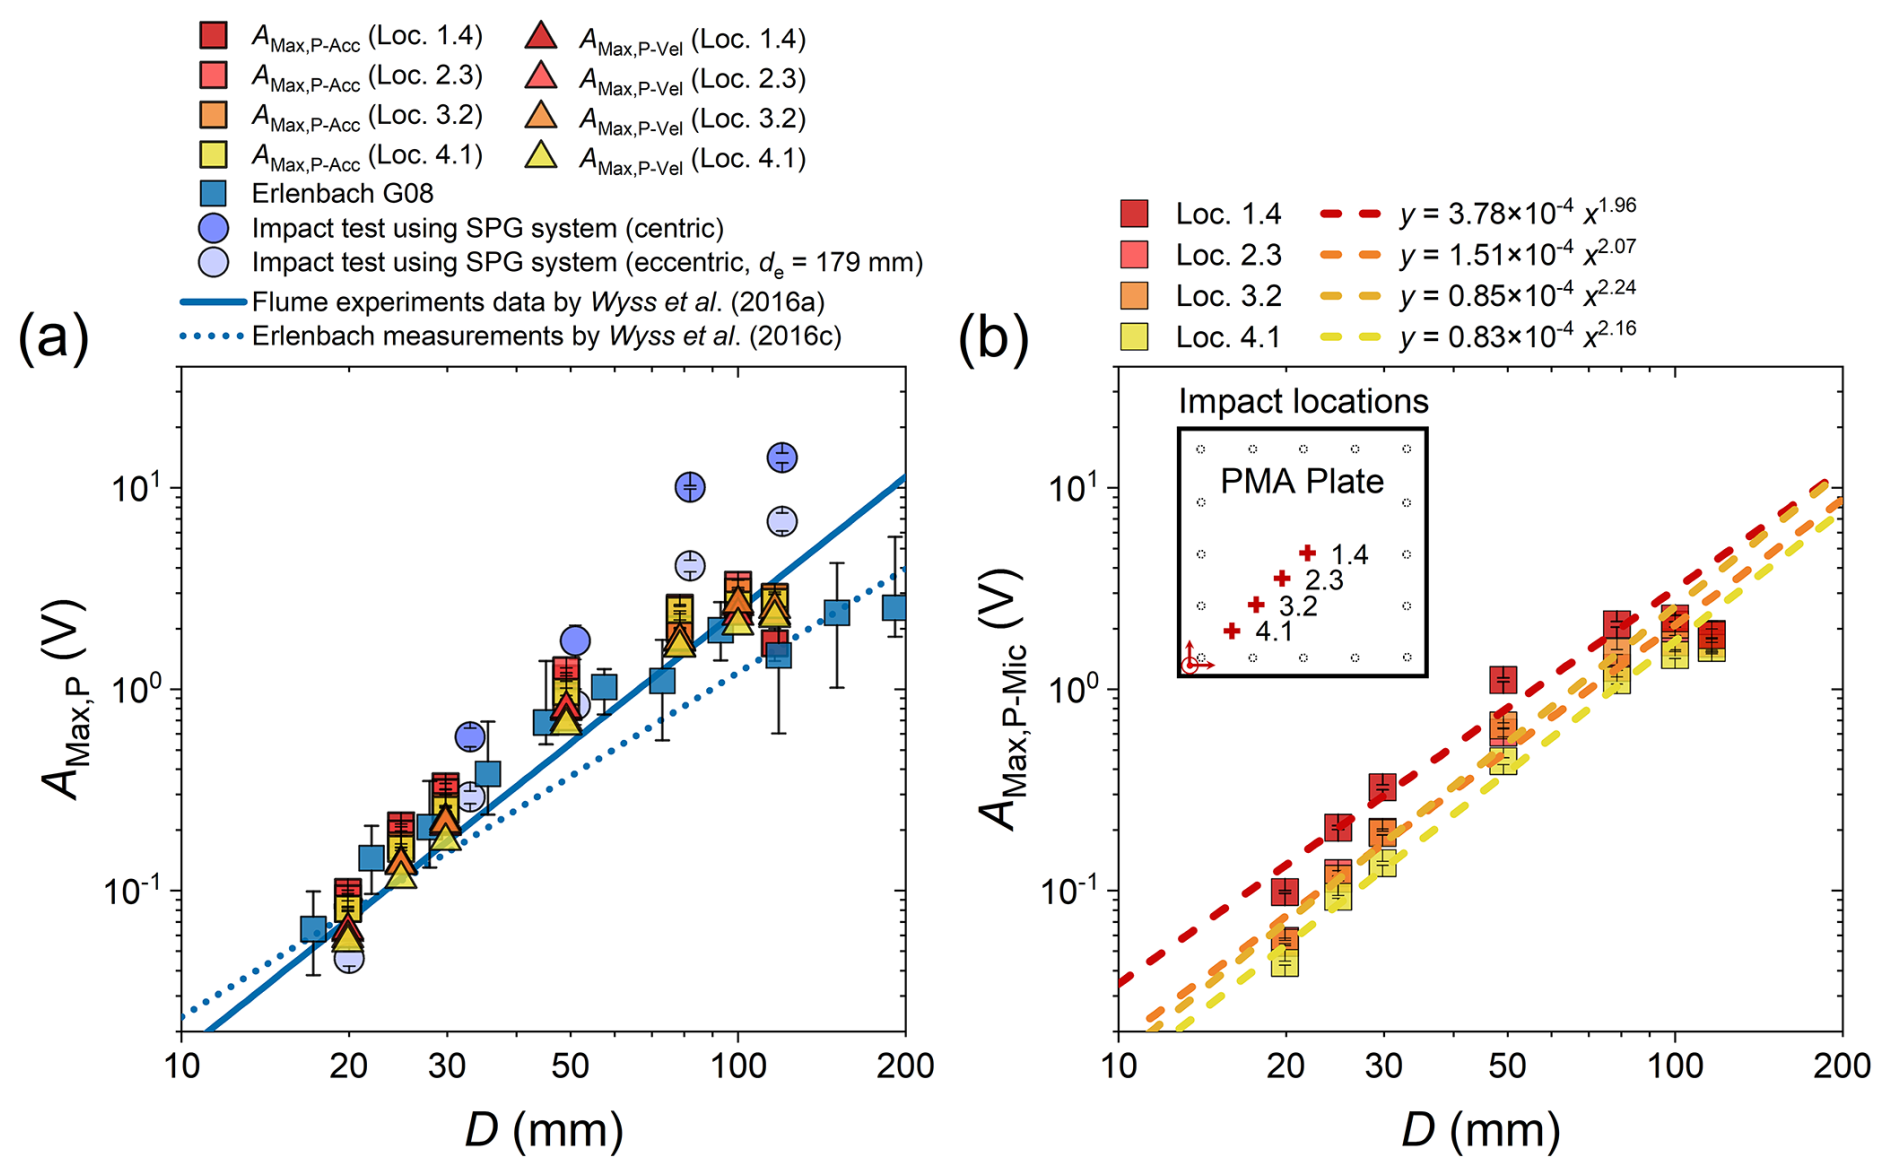
Figure 8The maximum packet amplitude AMax,P as a function of particle diameter D for centric (1.4) and eccentric (2.3, 3.2, and 4.1) impacts. (a) AMax,P-Acc and AMax,P-Vel calculated from the acceleration signals in the Z (vertical) direction of the PMA system. The different colours of the dots from red to yellow represent four different impact locations (1.4, 2.3, 3.2, and 4.1). (b) AMax,P-Mic from the microphone element M05 mounted at the centric position of the internal plate, with fitted curves for different impact locations. Schematic layout of the four selected impact locations on the PMA plate (inset in panel b).
Table 3The coefficients in the power functions determined between the maximum amplitudes of the acceleration and microphone signals with particle size. The fitting utilized signal data generated by particle impacts at various positions on the PMA plate, with the eccentricity distance de ranging from 0 to 233.4 mm. The coefficients αAcc and βAcc presented in Table 3 indicate the values obtained from the vertical acceleration signals, while the coefficients with the subscript “Mic” were computed from the microphone (sensor M05) signals.
The mean of the maximum packet amplitudes for each impact location (marked in red in Fig. 2b) were obtained though repeated drop experiments for all particle size classes. Subsequently, the power-law functions were determined from the acceleration and microphone signals, respectively, as: , where the coefficients α and β and the correlation coefficient R are presented in Table 3. Significant deviations in the signal packet amplitude induced by the largest particle size class (D = 116.4 mm) were observed in Fig. 8, which is likely due to the small accelerating distance measured from the sphere centre to the plate which is 10 cm for all size classes. Therefore, these data were not utilized for calibration.
3.2.2 Signal impulses
The drop experiments data indicate that the signal impulses per particle mass kIMP depend on particle size and impact location, with a nonlinear decreasing trend with increasing sphere size D (Fig. 9). In Fig. 9a, the data obtained from the flume experiments by Wyss et al. (2016a) for two water flow velocities (1.5 and 4.7 m s−1) and the results of the Erlenbach snowmelt experiments for the geophone sensor G08 are presented for comparison with the kIMP-Vel values that are calculated from the integrated velocity signals. In general, the decreasing trend of the coefficients kIMP calculated from the signals recorded by the PMA system is consistent with that determined from the flume experiments by Wyss et al. (2016a) and the Erlenbach field site (Wyss et al., 2016b) using the SPG system. However, the kIMP values in our study are within an order of magnitude larger than the data in Wyss et al. (2016a, b), except for the two smallest particle size classes when using a threshold value of 0.1 V (Fig. 9b). Also, the influence of the particle impact location on the impulse-mass coefficient kIMP is greater for the smallest serval classes than for the remaining size classes.
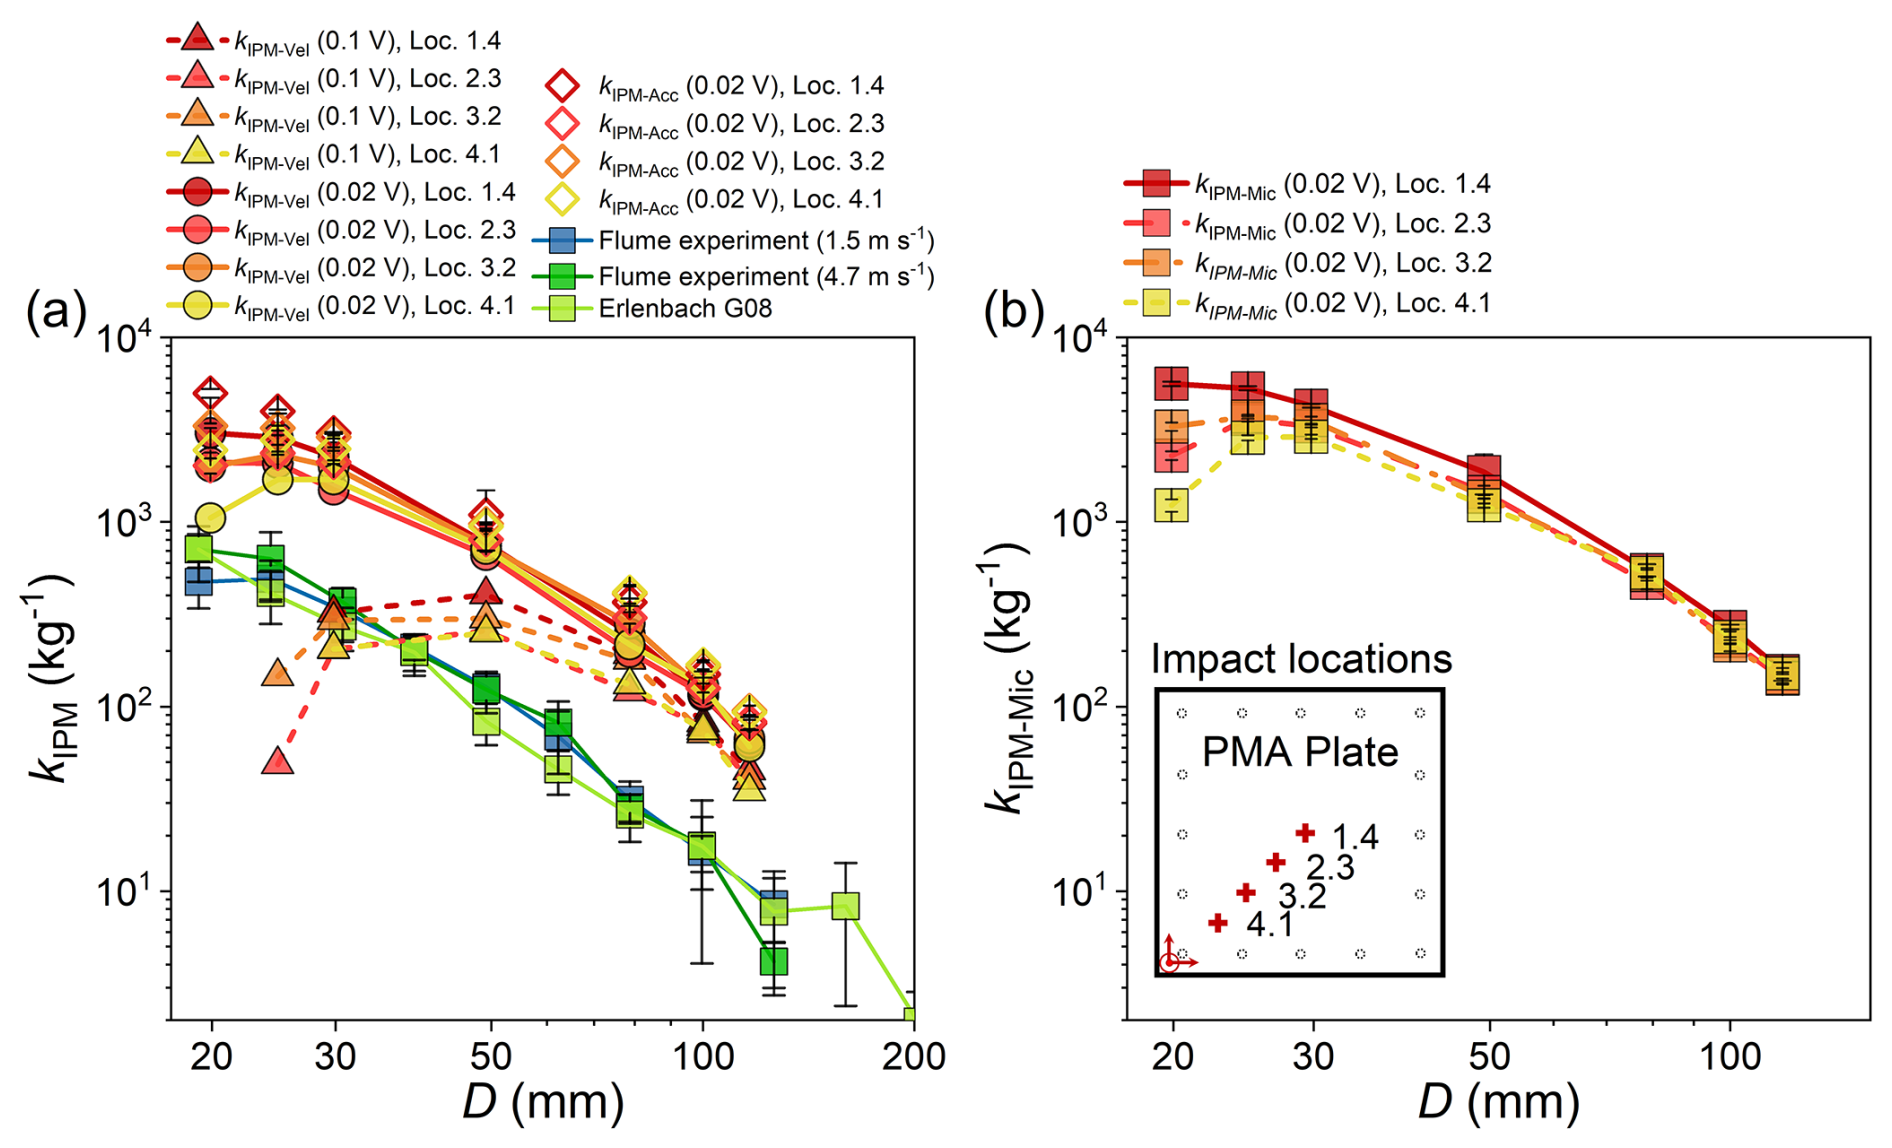
Figure 9Relationship between the signal impulses per particle mass kIMP and the sphere diameter D with variable impact locations 1.4, 2.3, 3.2 and 4.1 on the PMA plate. (a) The value of kIMP calculated from acceleration vibrations in the vertical direction. The diamond and round dots in panel (a) indicate the kIMP-Acc and kIMP-Vel values calculated using a threshold value of 0.02 V, respectively. The triangle dots in panel (a) indicate the kIMP-Vel values calculated using a threshold value of 0.1 V. The different colours from red to yellow represent four different impact locations (1.4, 2.3, 3.2, and 4.1). (b) The value of kIMP-Mic calculated from microphone signals (recorded by the microphone element M05).
3.2.3 Centroid frequency
From the drop experiments, the centroid frequencies fCen-Acc, fCen-Vel and fCen-Mic of the signals of acceleration, integrated velocity, and microphone sensors, respectively, generally decrease with increasing sphere size D for all impact locations (Fig. 10). For the different sphere classes, the value of fCen for the eccentric impact at the location 4.1 is generally the largest. For particle size D ranging from about 78.6 to 116.4 mm, the fCen-Acc values are in fairly good agreement with the contact model (Thorne, 2014). However, for the smallest size classes, our data show better agreement with the flume experiment results (Wyss et al., 2016a). The empirical model proposed by Wyss et al. (2016a) is approximately 2.0 and 1.3 times as large as the value of fCen-Vel for the smallest four particle size classes and the largest three size classes ranging from 78.6 to 116.4 mm. In general, the values of fCen-Mic are larger than those of fCen-Acc.
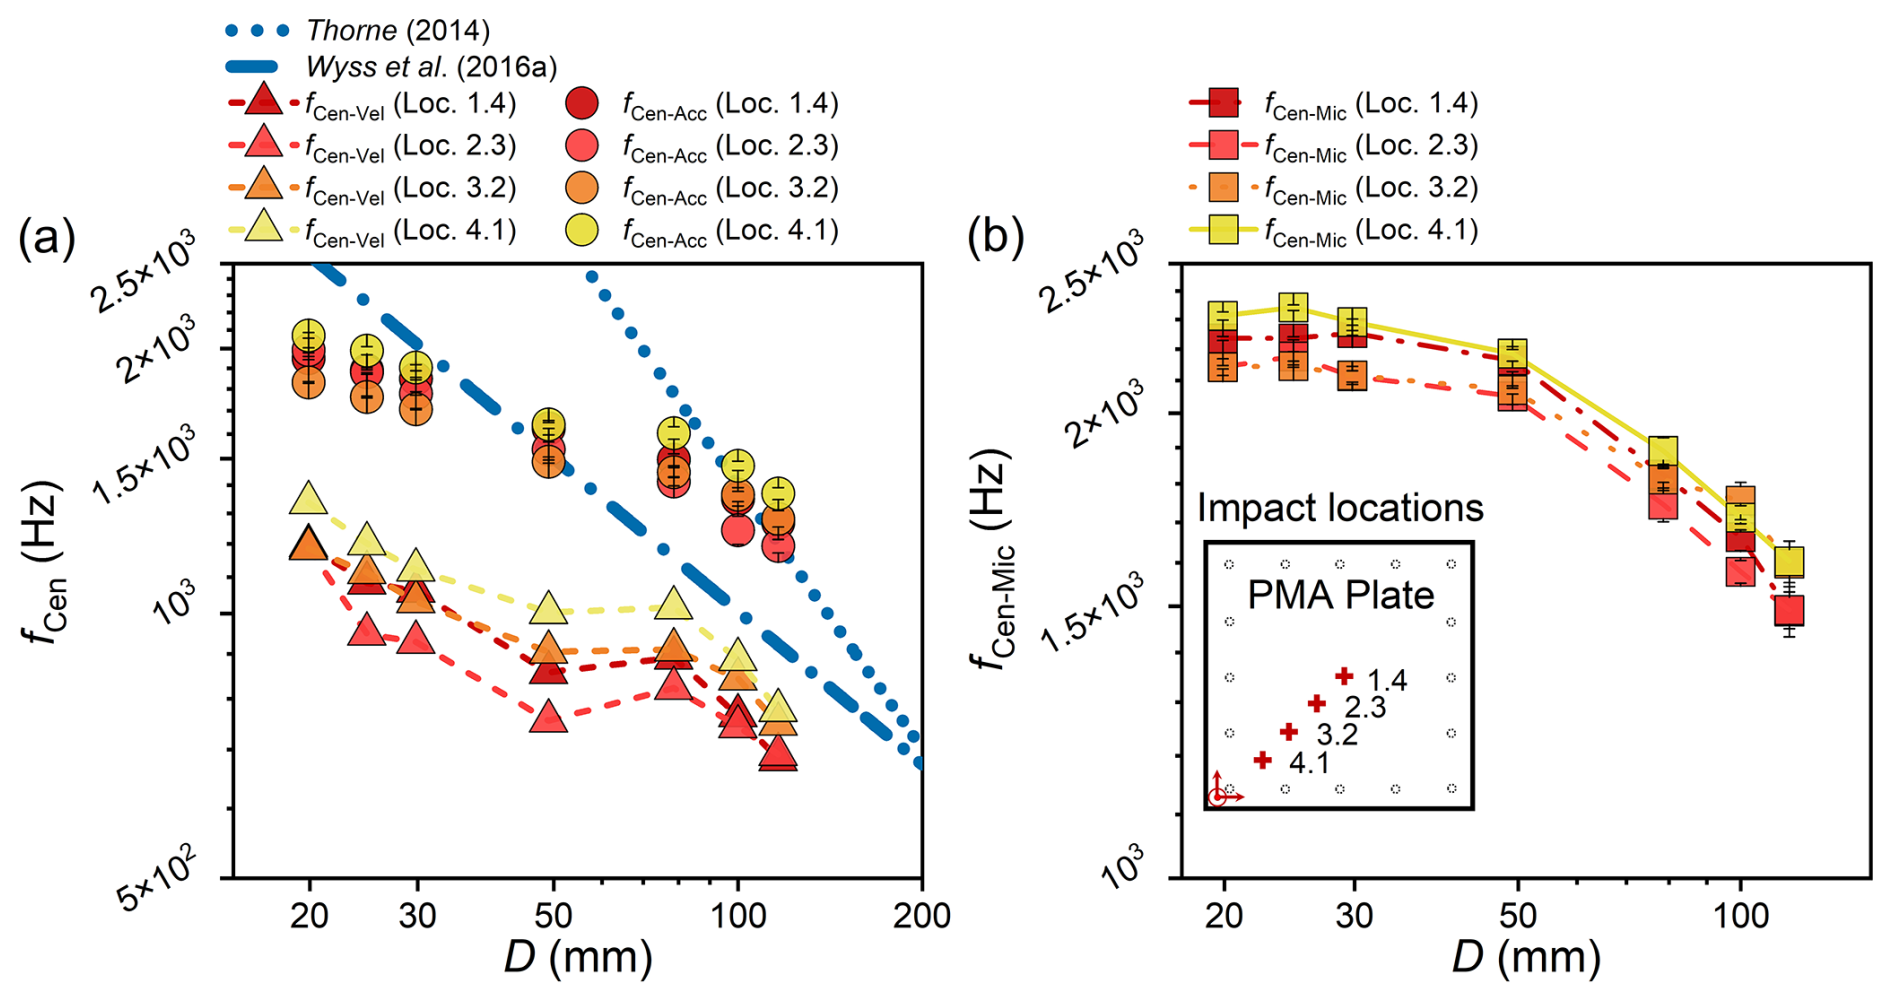
Figure 10Relationship between the centroid frequency fCen of the generated signals and the sphere diameter D for variable impact locations. (a) fCen−Acc and fCen−Mic calculated from acceleration vibrations in the vertical direction. The triangle dots in panel (a) indicate the centroid frequency values calculated from the velocity signals integrated from the vertical accelerations using a threshold value of 0.1 V. In panel (b), the centroid frequency of the microphone signals (recorded by the microphone sensor M05). The data generated by particles impacting the plate at the locations (1.4, 2.3, 3.2, and 4.1) indicated by colours from red to yellow.
3.3 Acoustic source image reconstructed using the PMA data
Acoustic images of the source calculated from the measured signals of the PMA system are presented in overhead view in Fig. 11. They show the intensity of the air shock on the underside of the PMA plate after centric and eccentric impacts of a class 4 sphere (D = 49 mm). The impact location of the sphere is indicated by the centre of the main lobe in the reconstructed acoustic image. The acoustic intensity is normalized by the maximum amplitude at the centre of the acoustic image.
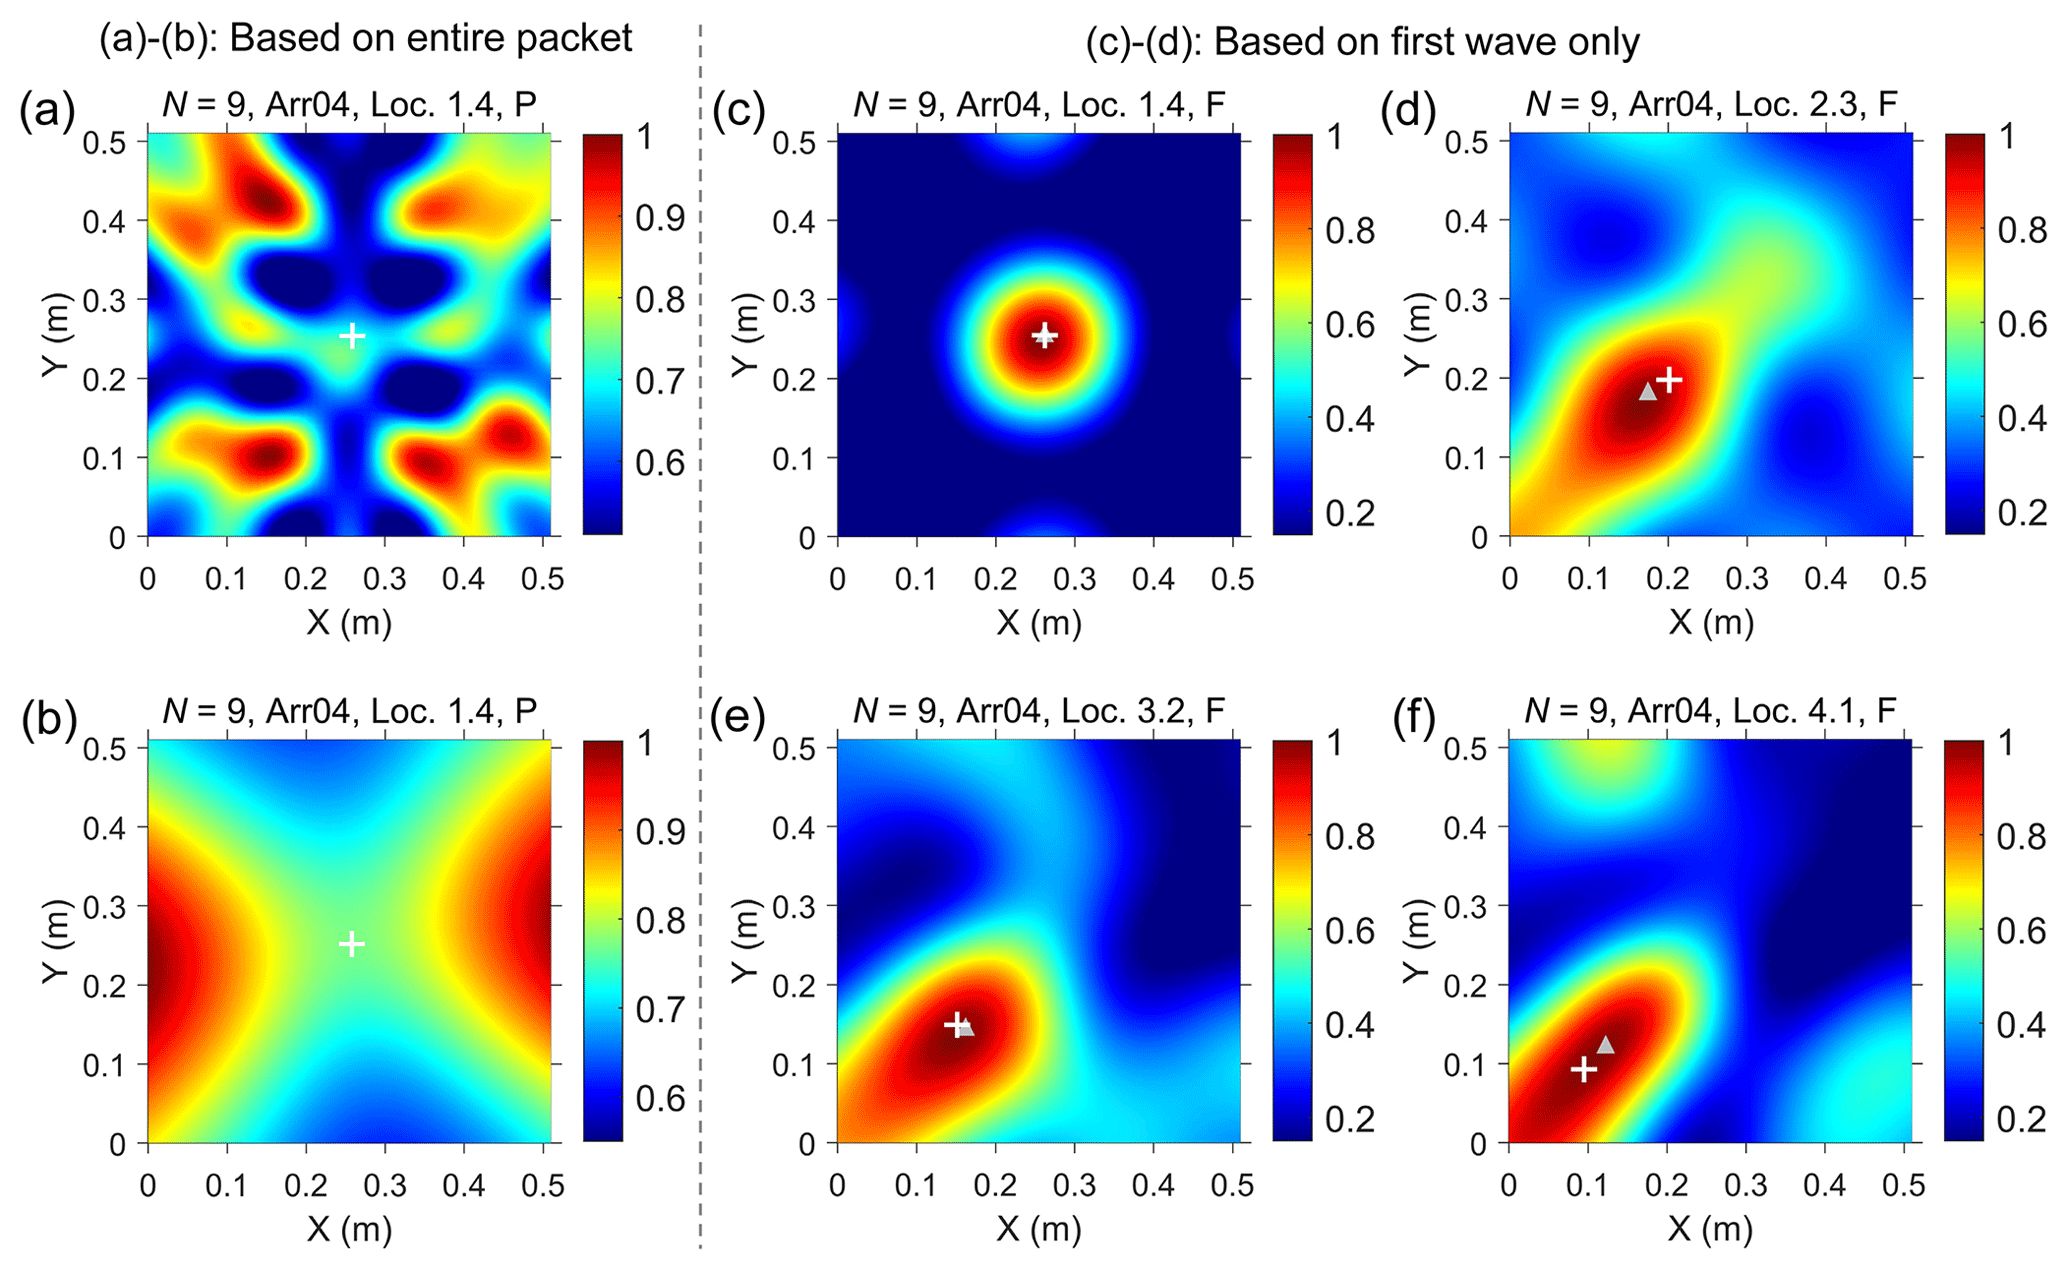
Figure 11The acoustic image of a monopole source triggered by eccentric and centric impacts. (a, b) The results obtained with the centroid (a) or peak (b) frequency as the frequency of interest in the calculation process, using the signals within the entire packet “P” generated by a particle impact at the centre of the plate “Loc. 1.4”, marked by the white cross “+”. (c) The results which are calculated using only the signal of the first wave “F” from the microphone array. (d, e, f) The acoustic images are determined using experimental signals (the first wave) for eccentric impacts, e.g. Loc. 2.3, Loc. 3.2, and Loc. 4.1, respectively. The gray triangles in panels (c) to (f) indicate the acoustic centres calculated from the model. The colour scale indicates the non-dimensional acoustic intensity.
Figure 11a and b display the acoustic images obtained with the centroid frequency and the peak frequency, respectively, as the frequency of interest in the calculation process, using the signals within the entire packet generated by a particle impact at the centre of the plate and recorded by the array of microphone elements. For comparison, Fig. 11c shows the results calculated using only the first wave signal from the microphone array. The comparison between Fig. 11a, b and c reveals that the use of signals induced by the entire impact event leads to very complex results, mainly showing an increase of the side lobes, which is a challenge for the derivation of particle location information. In contrast, calculations using only the first wave information from the microphone array produced generally good results. We also present the acoustic images obtained using the experimental signals for eccentric impacts (e.g. Loc. 2.3, Loc. 3.2 and Loc. 4.1; Fig. 11d–f) to facilitate comparison between results from different impact locations.
To quantitatively evaluate the localization performance of the PMA system, we reconstructed acoustic images for 10 representative impact locations with known truth locations. The coordinate of the impact location was determined by identifying the maximum amplitude in the beamformed acoustic field through model inversion. To characterize localization uncertainty, we measured the width of the main lobe at 70 % of the peak amplitude of the sound source, representing the effective resolution bandwidth. For comparative evaluation, we computed a dimensionless localization accuracy metric defined as the ratio between the model inversion and true coordinates in both X and Y directions. These normalized values, shown in Fig. 12, were generally close to the value of one, indicating good agreement between the model-derived inversion and the true impact locations. However, the variation in values gradually increases as the impact location moves away from the centre of the PMA plate and approaches its edge. In addition, to provide an absolute measure of localization accuracy, we computed the root mean square error (RMSE) between the estimated and true impact coordinates across test locations. The resulting average RMSE values were approximately 4 and 3 cm in the X and Y directions, respectively. These results confirm quantitatively that the PMA system can localize bedload impacts with reasonable precision under the current sensor configuration.
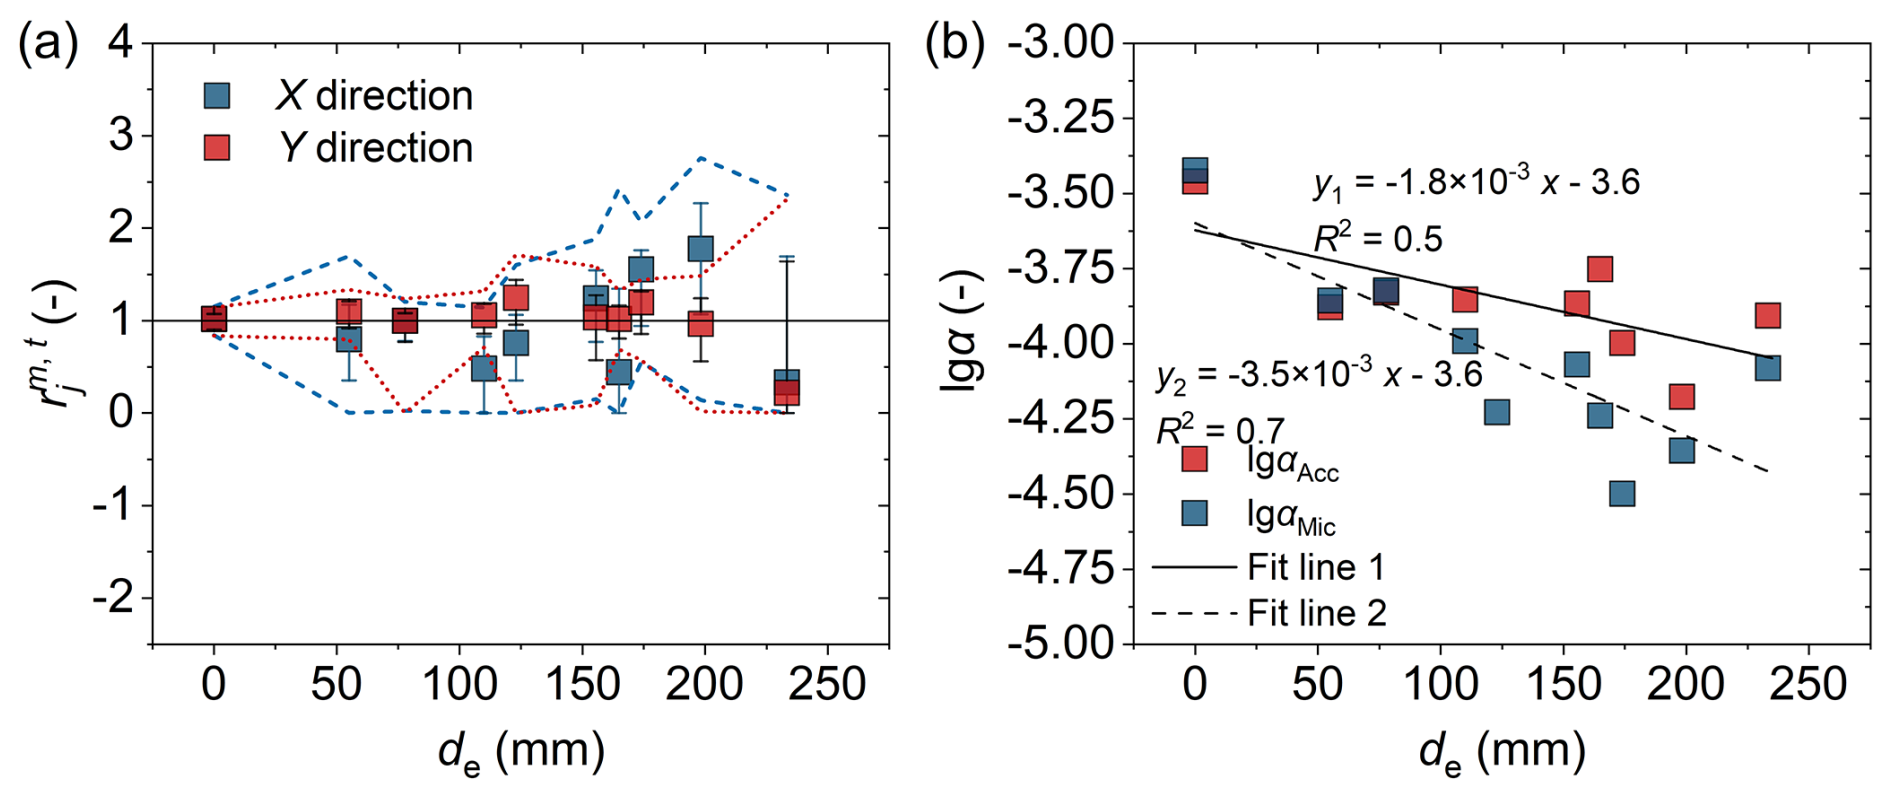
Figure 12The ratio of the coordinates of a particle impact location and lgα as functions of the eccentricity distance de. (a) The ratio was calculated based on acoustic images by the model inversion to the true coordinates of the sphere impact location for particle size class j = 4. The boxes in blue and red are the results for the X and Z directions, respectively. The dashed/dotted lines and the error bars indicate the beam pattern resolution that covers a range of 30 % and 10 % below the peak value, respectively. (b) The values of lgα calculated from the data presented in Table 3, and by fixing the exponent β of the power law relation between AMax,P and D.
3.4 Optimized particle size estimation
To evaluate the effect of correcting for impact-position-induced amplitude variability, we first analyzed the amplitude–particle size calibration relationship across multiple positions. The signal amplitude AMax,P and particle size D follow a power-law relationship in log–log coordinates: . The power-law exponent β remains relatively stable, with mean values of 2.26 and 2.22 for acceleration and microphone signals, respectively (Table 3). However, the coefficient α varies significantly with impact location, as reflected in changes to the vertical intercept lgα. This suggests that spatial variability in impact location is a key factor influencing amplitude-based size estimation. To address this, we applied the correction procedure described in Sect. 2.6 to six eccentric impact locations (2.4, 3.4, 3.3, 4.4, 4.3, and 4.2; see Fig. 2b). For each case, the impact location was first localized using the microphone array, and the corresponding eccentricity distance de was calculated. The coefficient α was then adjusted using the lgα–de relationship (Fig. 12b), after which the particle size DE was re-estimated using the modified power-law expression.
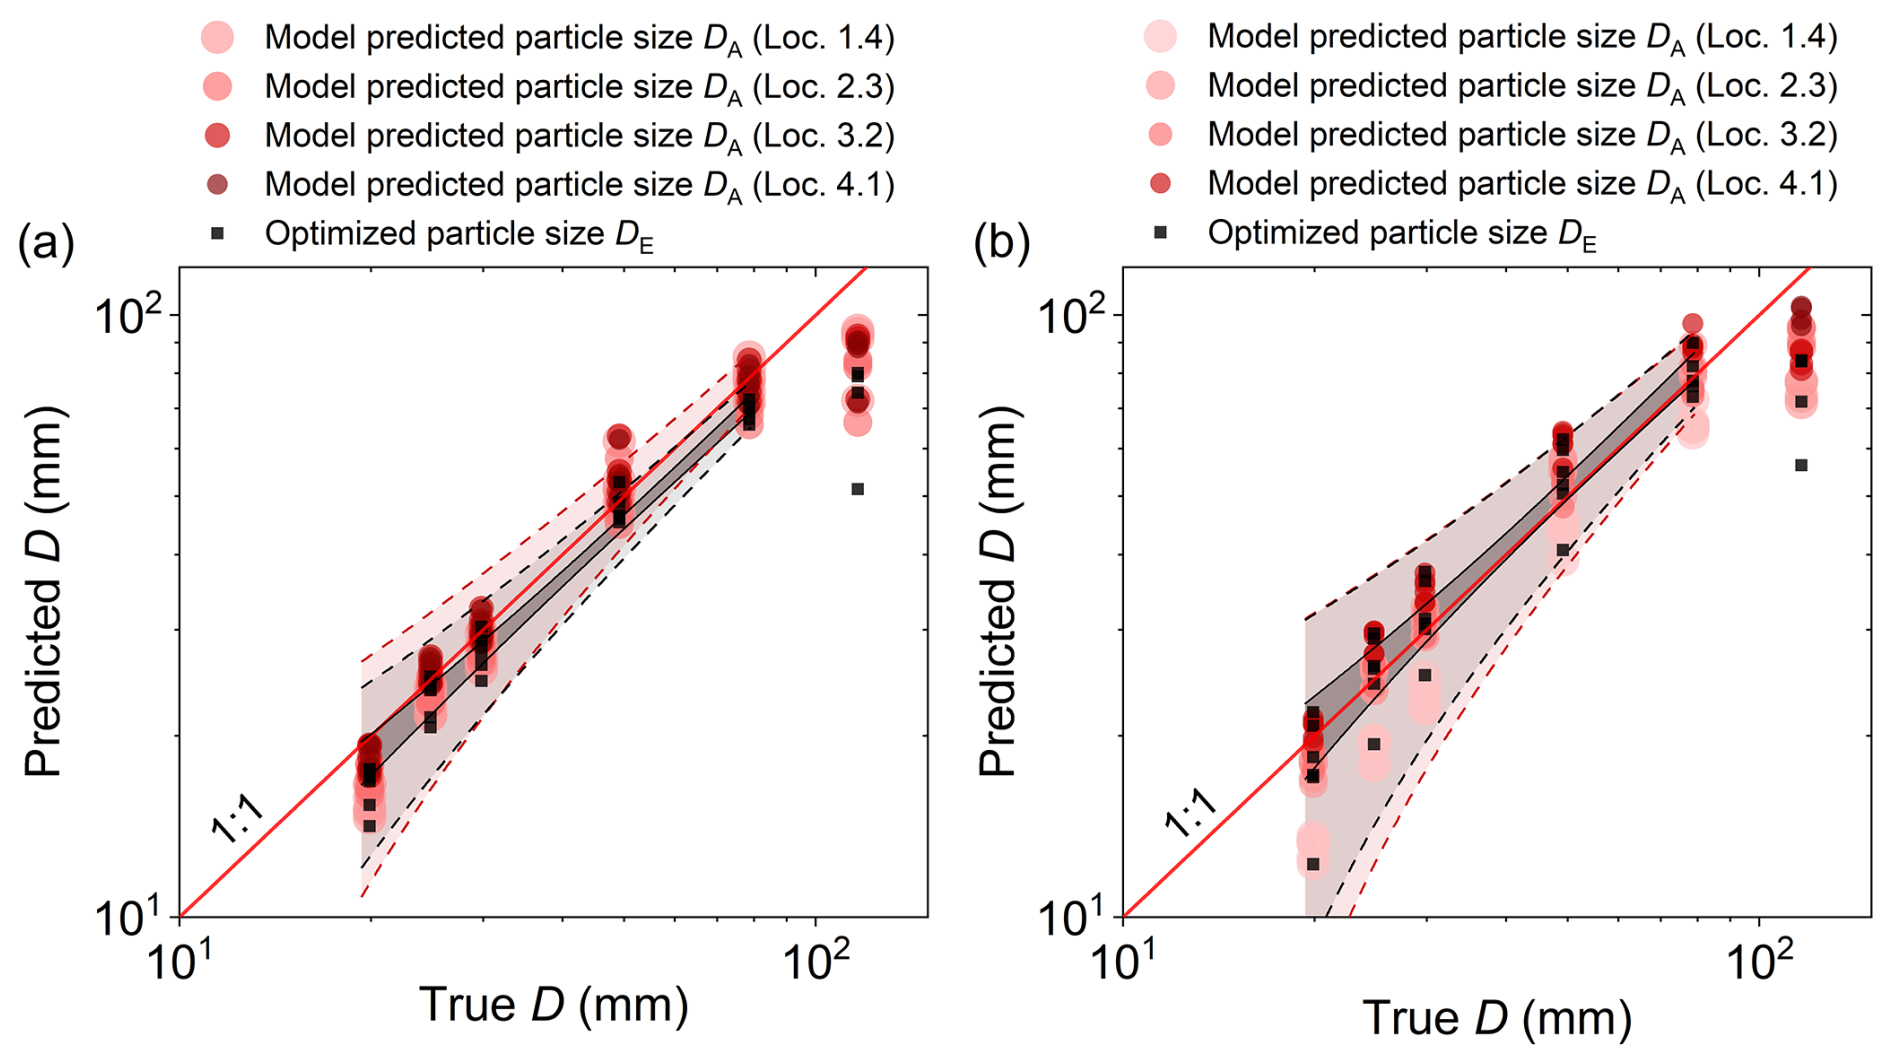
Figure 13Predicted and optimized particle size vs. true particle size in the drop experiments with different impact locations. Particle sizes are derived from the signal amplitude recorded by the (a) accelerometer and (b) microphone sensor M05. The transparent red and black areas between the dashed lines represent the prediction bands for DA and DE, respectively. The black area between the solid lines is the confidence band for DE.
Figure 13 compares the optimized particle size estimates DE with the non-optimized particle size DA, for both accelerometer and microphone (sensor M05) signals. The results demonstrate a substantial improvement in estimation consistency: the variation in predicted sizes was reduced by an average of 37 %, and up to 65 % in certain cases, excluding the largest particle class which was not included in the calibration dataset.
4.1 General performance of the microphone array
We evaluated the performance of the microphone element array and specifically investigated the effect of the number of elements and their arrangement on the accuracy of the model inversion, as shown in Figs. 5 and 6, respectively. Here, the accuracy is quantified by the array resolution of the PMA system, RS, defined as the beamwidth of the main lobe in the reconstructed acoustic image (a smaller RS indicates a sharper image). The results demonstrate that as the number of microphones increases, the accuracy improves, manifested by a decrease in RS. However, the reduction in RS becomes progressively smaller as the number of microphone elements further increases, indicating a gradual saturation of spatial resolution improvement at higher array densities. Meanwhile the fourth arrangement (Arr04) displayed optimal performance among the four types of arrangements tested. These findings emphasize the importance of balancing accuracy with cost considerations, when designing monitoring systems. In the future, it will also be worth considering how microphone elements could be incorporated into the existing surrogate bedload monitoring system, and exploring the combined use of microphone and geophone signals, as was done with the latest bedload monitoring device, the square pipe system SPS (Rickenmann et al., 2022). Such efforts have the potential to enhance the prediction accuracy of bedload particle size and transport rates.
4.2 Effect of bedload impact location on the PMA signal response
4.2.1 Maximum amplitude
The maximum amplitude of a packet AMax,P for the acceleration and the microphone signal shows similar trends with increasing particle size for power-law approximations of the data (Fig. 8), except for the largest size class (D = 116.4 mm). The results indicate an asymptotic behaviour of reaching an upper (maximum) limit of AMax,P for larger particles, which shows similarities with the results obtained by finite element modelling for the SPG system in Chen et al. (2022a) and observed for the Obernach flume experiments data for the saltating particles in Chen et al. (2022b). This resembles the asymptotic behaviour of the signal frequency reaching a lower limit for larger particles (Rickenmann, 2017). The following two reasons may be raised to explain this behaviour: (i) The low impact velocity caused by the small accelerating distance for the large particles measured from the sphere centre to the plate which is 10 cm for all size classes. (ii) The maximum particle size that can be detected by an impact plate system may be essentially determined by the total mass of the plate, which is indicated by theory (Thorne, 2014) and by Erlenbach data for the SPG system (Rickenmann, 2017).
To ensure a meaningful comparison between the PMA and SPG systems in terms of signal amplitude, it is important to recognize that they are based on different sensing principles: the PMA system measures acceleration vibrations using a piezoelectric accelerometer, whereas the SPG system measures deformation velocity using a geophone (Rickenmann et al., 2014; Rickenmann, 2017). Furthermore, the PMA and SPG plates differ in geometry, the former being square (510 × 510 mm) and the latter rectangular, with the same thickness (15 mm) and comparable boundary constraints. In terms of structural dynamics, the material deformation velocity of the SPG plate may be smaller than that of the PMA plate under an impact, but it is not comparable to that of the internal plate of the PMA system. One may rigorously compare the differences in signal types recorded by different types of sensors. To address this, we integrated the acceleration signals from the PMA system to obtain material deformation velocity signals (Fig. 8b) and compared them to the geophone signals from the SPG system. The results show that the maximum amplitude of the velocity signals recorded by the geophone in the SPG system is approximately equal to that derived from the PMA system.
For the PMA system, the amplitude of the acceleration signal packet generated by eccentric impacts exhibits an attenuation ranging from approximately 19 % to 38 % compared to centric impacts across all particle size classes, as illustrated in Fig. 8a. As a result, the presence of eccentric impacts can lead to an underestimation of bedload particle size when using a calibration relationship between the signal amplitude and particle size. This observation is qualitatively consistent with findings obtained with the SPG system (Chen et al., 2022a). However, compared to the impact test results obtained for the SPG system in Chen et al. (2022a), the decay in signal amplitude AMax,P for the PMA system is relatively smaller when the impact location is moved from the centre to an eccentric position. This indicates that the acceleration signal from the PMA system is comparatively less sensitive to changes in particle impact location than the SPG system. This discrepancy is likely due to the different sensor mounting positions in the two systems. In the PMA system, the acceleration sensor is mounted on the internal plate, whereas the geophone in the SPG system is positioned on the underside of the plate directly impacted by particles. As a result, the dissimilarities in elastic wave propagation distance and refraction at the component interface contribute to the different sensitivities of the signal responses to impacts in these two systems.
In contrast, the amplitude of the signal packet from the microphone, when excited by an eccentric impact, exhibited a decrease ranging from 13 % to 60 % compared to the centric impact (see Fig. 8c). The attenuation in microphone signal amplitude surpasses the reduction observed in the acceleration signals, indicating that the microphone signals are more sensitive to the changes in the impact location than the latter. By utilizing the signals captured by the microphone element arrays, we can derive the location of the acoustic source on the PMA plate. This information can be then employed to eliminate the acceleration variations due to changing impact locations by constructing an appropriate compensation function.
4.2.2 Impulses-mass coefficient
The impulses-mass coefficient kIPM provides an effective way for the conversion of the vibration signals recorded by the PMA system into the bedload mass transported over the plate. The values of kIPM tend to change less with decreasing size for the smallest several particle size classes for a constant impact location (Fig. 9), which indicates a qualitative agreement with the results obtain by the SPG system (Chen et al., 2022a). However, the variability of kIPM calculated from the signals generated by different impact locations increases with decreasing particle size. This is possibly because the smaller particles generate less impulses due to the lower impact energy but at a higher frequency, which makes the generated elastic waves more sensitive to changes in the propagation medium in the PMA system due to changes of the impact locations.
The decreasing trend in the impulse coefficient kIMP resulting from the PMA signals is generally consistent with findings from Wyss et al. (2016a)'s flume experiments and the Erlenbach field site (Wyss et al., 2016b), which utilized the SPG system. However, direct comparison using deformation velocity signals show that the kIMP values calculated using a threshold value of 0.1 V in our work are approximately 1.0 to 6.1 times larger than those reported by Wyss et al. (2016a, c), except for the two smallest particle size classes. This is due to the fact that, as mentioned above, the installation positions of the accelerometer in the PMA system and the geophone sensor in the SPG system are different, resulting in a larger number of signal impulses for the PMA system than for the SPG system. The accelerometer is installed on the internal plate of the PMA system, while the geophone sensor is installed on the underside of the SPG plate (Wyss et al., 2016b). The PMA internal plate is thinner than the SPG plate, and the two are fixed in different ways. Another possible reason is that the PMA accelerometer's output range is being limited to 100 g, whereas the 10 V limit for the SPG geophone sensor corresponds to approximately 500 g.
In the present study, both the microphone-derived (kIMP-Mic) and accelerometer-derived (kIMP-Acc) impulses–mass coefficients decrease with increasing particle size. Furthermore, for all sizes except the smallest, the kIMP-Mic values are consistently slightly higher than the kIMP-Acc values. For finer particles, kIMP-Mic exhibits greater sensitivity to impact location than kIMP-Acc. This difference likely reflects the fact that microphones respond directly to impact-induced air pulses, whereas accelerometers only detect solid acoustic waves. The latter are attenuated by structural damping and interface reflections during propagation, thereby diminishing the effect of changing impact locations.
4.2.3 Centroid frequency
The centroid frequency fCen of the generated signals decreases with increasing particle size, demonstrating qualitative agreement with the findings of the SPG system (Wyss et al., 2016a) and conclusions derived from the contact theory (Thorne, 2014). Specifically, the centroid frequency fCen-Vel derived from the integrated PMA velocity in this study are somewhat lower than the predictions of the contact theory and slightly lower (ca. 0.5–0.8 times) than the results of the flume experiments conducted by Wyss et al. (2016a). This may be due to the fact that, as discussed by Chen et al. (2022a) in relation to the SPG system, the calculation of the centroid frequency is based on the signals within the entire packet generated by an impact event. In contrast, the contact theory considers the transient duration of the contact, which typically lasts only a few milliseconds, whereas the former usually persists for tens or hundreds of milliseconds. The discrepancy between the drop test results in this study and Wyss's flume experiment results may also be attributed to structural differences between the two systems. Furthermore, the process of integrating from the acceleration signal to the deformation velocity signal may also result in the loss of frequency.
Furthermore, our measurements reveal that the centroid frequency fCen-Mic calculated from the microphone signals is a bit higher than that determined from the acceleration signals fCen-Acc. This indicates that the microphone sensor is slightly more sensitive to air fluctuations than the accelerometer responds to material vibrations of the internal plate of the PMA system, which is likely to be a result of different sensor types. Both sets of data indicate that the outcomes resulting from eccentric impacts tend to have larger fCen values than those resulting from centric impacts. This is likely to be due to the fact that the edge of the PMA structure is more complex and more constrained, resulting in higher frequency responses.
4.3 Spatial resolution of the PMA system and multi-source detection
4.3.1 Spatial resolution of the PMA system
Figure 11 illustrates acoustic images obtained through model inversion using the measured microphone signals generated by particle impacts at different locations on the PMA plate. The acoustic pressure intensity shown in the images is normalized to the maximum amplitude at the centre of the calculated sound source. When the drop position is moved from the centre to eccentric locations of the PMA plate, the beam pattern shows some asymmetry, with notable side lobes. This characteristic arises from the increased gain of interfering signals as the sound source is moved from the centre of the plate to its boundaries centre. Furthermore, the inversion results derived from the measured signals within the entire packet are complicated compared to the results calculated using only the signal of the first wave. This applies in particular to the enhanced side lobes and a shift in the centre of the acoustic source. One factor that may contribute to these differences is that the refraction and reflection of the acoustic signals by the PMA plate and the internal structural layers throughout an entire impact event may add to the complexity of the inversion process.
As shown in Fig. 12, localization results for 10 impact locations on the PMA plate yield values close to one, indicating a general agreement between the inverted positions determined by the model and the true coordinates. In addition, the beamwidth increases as the impact location moves away from the centre of the plate. This can be attributed to the fact that some components of the PMA system, such as the surrounding locking components, might generate noise interference which could influence the structural dynamic response and the inversion results. As confirmed by numerical simulations (see in Fig. 7), when the spacing between two sources falls below ∼ 12 cm, the beamforming output fails to resolve two separate main lobes (merged to a single lobe), indicating the current system's spatial resolution limit. However, it is important to note that this resolution is also dependent on particle size, with the frequency value of 1600 Hz utilized in our numerical tests corresponding to a particle size of approximately 50 mm. By employing higher frequency signals in simulations, the spatial resolution can be improved.
4.3.2 Implications for multi-source detection
The ability to distinguish and localize multiple simultaneous particle impacts is essential for the field application of any impact-based bedload monitoring system. In our beamforming-based PMA system, the current array configuration shows that two sources can be reliably resolved when their spatial separation exceeds ∼ 12 cm, as demonstrated in numerical tests. When the distance between impact sources falls below this threshold, the resulting acoustic image displays a merged energy peak, making it difficult to identify multiple distinct events. To further explore this limitation, we conducted additional simulations involving three and four simultaneous sources placed at off-centre positions (see Appendix B). These tests reveal that spatial interference becomes more pronounced at small spacings, where the array gain is lower. Nevertheless, for impact sources spaced beyond the resolution threshold, the PMA system is capable of reconstructing multiple distinct acoustic sources, with localization errors within ∼ 5 cm.
Previous work by Wyss et al. (2016b) quantified the probability of overlapping impact signals based on field measurements, showing that simultaneous impacts are unlikely and single-particle signals can generally be isolated for bedload transport rates below about 5 kg m−1 s−1. At very intense transport rates, such as those exceeding 100 kg m−1 s−1 reported for the Erlenbach site, the number of identified packets from the geophone signal may not deliver accurate surrogate bedload transport estimates. In such high-rate scenarios, the PMA system could be valuable for disentangling complex impact patterns and improving size and flux estimation. To enhance this capability, further work should focus on increasing the system's resolution, through optimized sensor layouts or extended signal bandwidth. While the current study focuses on stationary point-source impacts, future research will aim to capture more complex, time-varying acoustic patterns associated with rolling, sliding, and saltating particles. The PMA system thus provides a promising framework for capturing not only the location but also the dynamics of bedload transport in mountain streams.
4.4 Improved estimation of particle size and outlook to field application
To improve the accuracy of particle size estimation, we analyzed the amplitude–size calibration relationships across 10 different impact locations (marked in red in Fig. 2b), as summarized in Table 3. While the power-law exponent β remains relatively stable for acceleration and microphone signals, the coefficient α varies significantly with impact location. This is characterized by changes in the vertical axis intercept (lgα) of the calibration relationship between signal amplitude and particle size in log-log coordinates. A similar shift in the calibration relationships was also observed in field and flume measurements of bedload utilizing the SPG system at different flow velocities (Wyss et al., 2016a). These findings reinforce the importance of applying spatial compensation for amplitude prior to estimating particle size, while allowing β to be treated as a location-invariant parameter in future models.
Based on the calibrated lgα–de relationship, we applied a correction for eccentricity effects on impact amplitude in the context of the particle size estimation. The comparison between non-optimized and the optimized size predictions (Fig. 13) shows that the use of the proposed correction model reduces estimation variability by approximately 37 % on average, and up to 65 % in some cases, excluding the largest size class which was not included in the calibration dataset. This highlights the benefit of localizing impact position for improving the robustness of amplitude-based particle size estimates, which, in turn, provides a foundation for more accurate bedload flux and particle size estimation under natural conditions, where impact locations are highly variable. While the experimental configuration of this study does not include impacts at the extreme corners of the plate, the results demonstrate that the proposed localization and correction method performs reliably for highly eccentric impacts up to ∼ 230 mm from the plate centre. Further testing at marginal positions is planned as part of future studies and will be complemented by numerical simulations to assess plate-edge behavior more comprehensively.
The results in Fig. 13 show that particle size estimates derived from acceleration signals exhibit less variability than those based on microphone signals, indicating greater robustness to impact location effects. One possible explanation is that the microphone array captures air-transmitted acoustic energy more directly associated with the initial impact, whereas the acceleration signal may be influenced by internal structural damping. This observation suggests that both sensor placement and signal type affect the stability of particle size estimation for varying impact locations. As a result, we reasonably infer that the acoustic model proposed in this study may be particularly effective in improving particle size estimates when applied to acceleration (or a geophone) signals acquired from sensors mounted at the underside of an impact plate, as is typical in the existing SPG system, rather than to sensors fixed to an internal plate. This is attributed to the shorter and more direct wave propagation paths associated with underside-mounted sensors. While further investigation is warranted, these findings support the view that integrating multiple signal types (i.e. microphone and acceleration data in the present study) can help reduce uncertainty and improve particle size estimation accuracy under spatially variable conditions.
These improvements support the development of signal conversion models for grain-size estimation that account for varying particle impact locations. When combined with systematic flume-scale calibrations, they lay the groundwork for future field applications of the PMA system. Field deployment is a critical next step toward full-scale application of the PMA system in natural settings. Its ability to localize impact positions and compensate for impact location variability offers advantages over existing systems lacking spatial resolution. Under natural conditions, where multiple bedload particles may impact simultaneously or in rapid succession for very high bedload transport rates, the PMA system's capacity for acoustic sources imaging can help resolve complex signal patterns and improve bedload rate estimation robustness. Such a system may potentially also be further developed to obtain other important characteristics of bedload motion, such as determining the transport modes of bedload particles (e.g., saltating, rolling or sliding).
This study addresses a central challenge in surrogate bedload monitoring using impact systems, namely how to reduce the impact of variations in impact location on particle size estimation. By integrating a phased microphone array with an internal accelerometer, and combining beamforming-based localization with amplitude calibration, we demonstrate a viable approach to improve the reliability of acoustic bedload measurements. These findings directly address the key research question of whether impact-based acoustic systems can be refined to provide more accurate particle size estimates and offer both conceptual and methodological advances towards this goal. The main conclusions of this study are:
-
Both accelerometer and microphone signals from the PMA system show a clear positive correlation relationship between the maximum amplitude of a signal packet and particle size, for both centric and eccentric impacts. However, the signal amplitude can be attenuated by up to 38 % for acceleration signals and 60 % for microphone signals under eccentric impacts, highlighting the need to correct for this.
-
The number of signal impulses per particle mass (kIMP) decreases nonlinearly with increasing particle size and varies with impact locations. Similarly, the centroid frequencies of both acceleration and microphone signals tend to decrease as particle sizes increase.
-
We developed a theoretical model for acoustic imaging inversion based on bedload-generated signals. Using beamforming techniques, we have successfully reconstructed acoustic images of bedload particle impacts, allowing the spatial localization of individual bedload particle impacts. The accuracy of spatial localization is affected by factors such as particle size, the number of microphone elements, and how they are arranged, with a resolution threshold of approximately 12 cm for closely spaced sources.
-
We significantly reduced particle size estimation errors by correcting for impact location effects using a calibrated function between the power exponent and eccentricity distance. The optimized approach reduced the uncertainty in particle size predictions caused by eccentric impacts by an average of 37 % (up to 65 %) and demonstrated that integrating multiple signal types (microphone and acceleration signals in this study) enhances robustness. This offers potential improvements over the traditional independent use of either microphone systems or accelerometer/geophone plate systems.
Future work will focus on flume-based calibration and field deployment, as well as long-term monitoring in mountain streams. With further validation, this technology could contribute to more accurate, continuous bedload transport measurements.
Figure A1 shows different microphone arrangements with various element number ranging from 0 to 25 on the internal plate of the PMA system. Figure A1a–d and i–k show different numbers of microphone elements which are used in numerical simulation as presented in Fig. 5. Figure A1e–h show four arrangements Arr01 to Arr04 of the microphone elements arrays with nine elements are used in the corresponding calculations of Fig. 6.
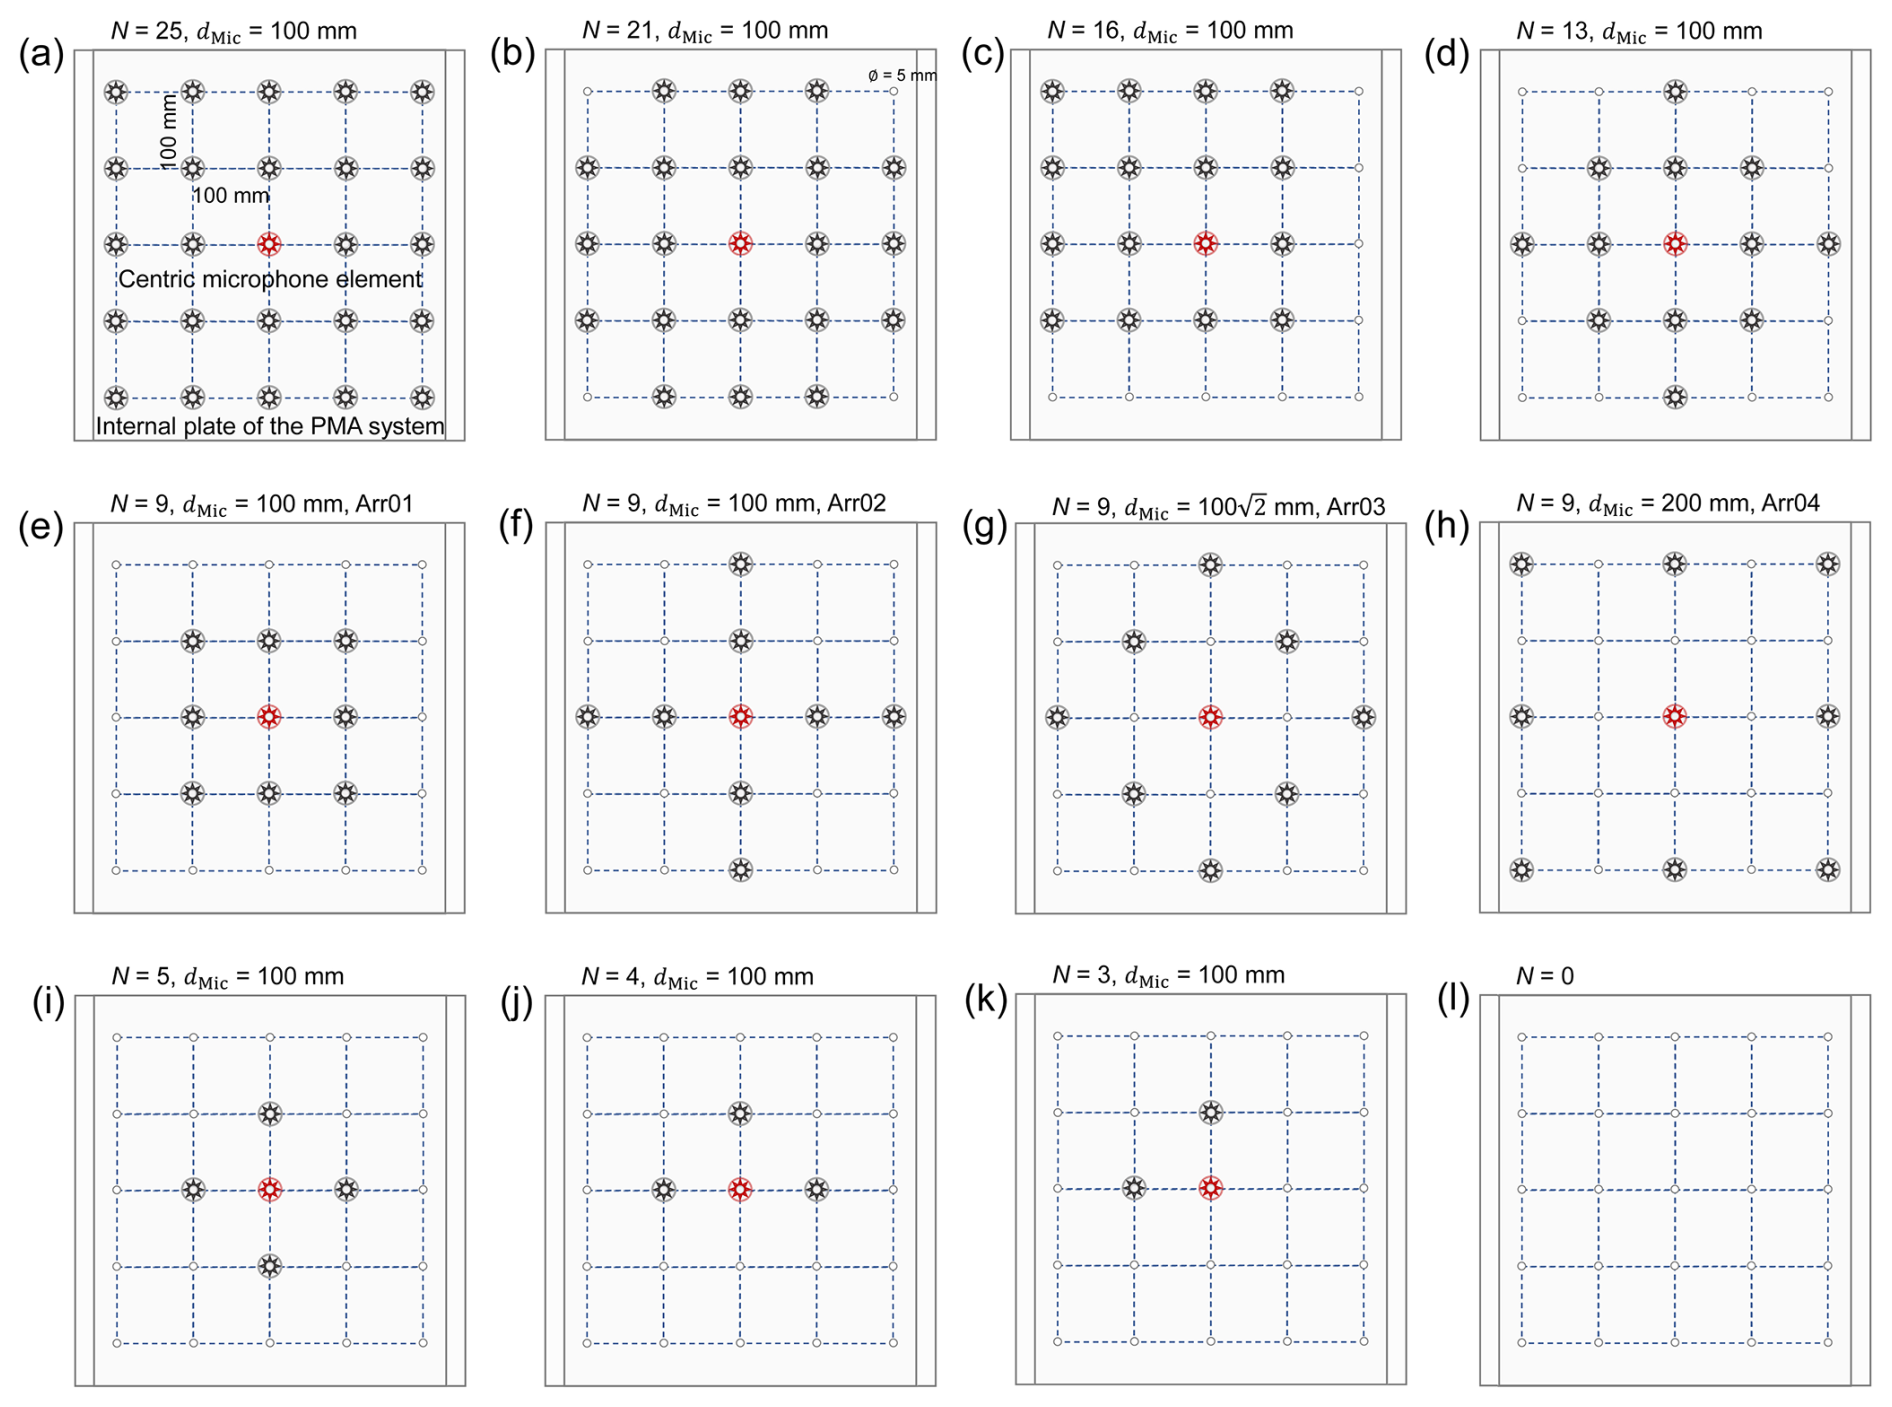
Figure A1Microphone element arrangements with various number ranging from 0 to 25 positioned on the internal plate of the PMA system.
This appendix presents additional numerical simulation results for multi-source impact scenarios. Figure B1 shows reconstructed acoustic images for two simultaneous sources with different source spacings. Figure B2 extends the analysis to three- and four-source configurations with different spatial arrangements, to assess the PMA system's performance under more complex source interference conditions.
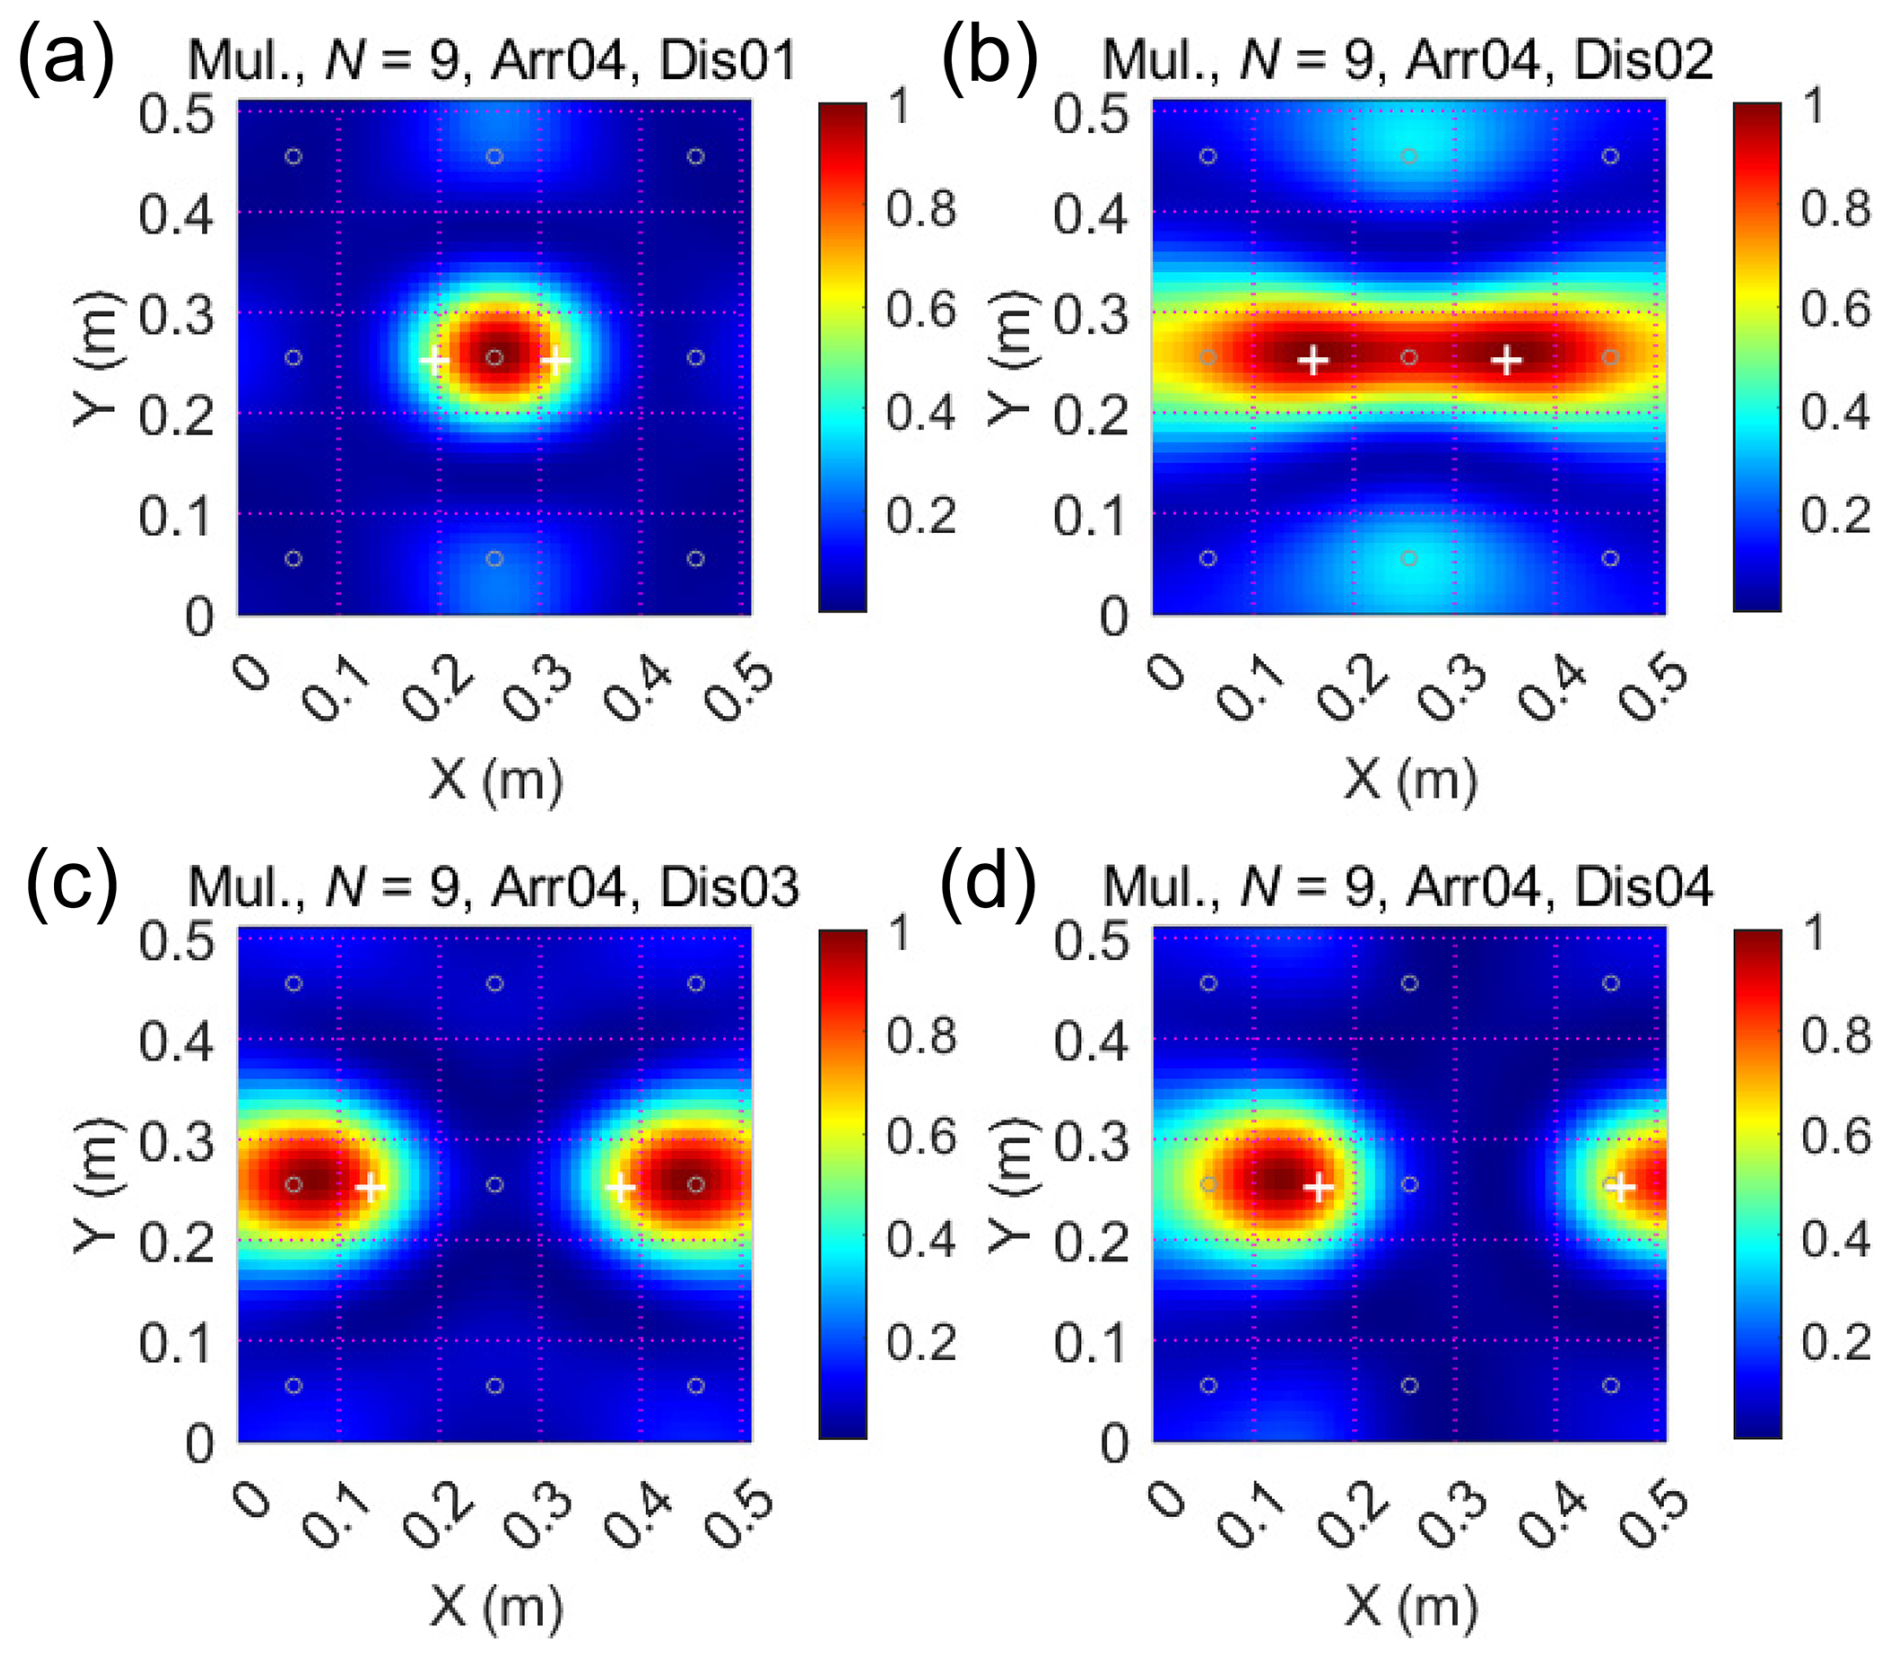
Figure B1Reconstructed acoustic image for two simultaneous sources obtained with a 9-sensor array (dMic = 100 mm, f = 1600 Hz). Panels (a) to (d) show results for different source spacings. The signal emission coordinates in panel (a) are (0.195, 0.255) and (0. 315, 0.255), those in panel (b) are (0.160, 0.255) and (0. 350, 0.255), in panel (c) are (0.135, 0.255) and (0.375, 0.255), and in panel (d) are (0.165, 0.255) and (0.465, 0.255). See the caption of Fig. 5 for details regarding the colour scale.
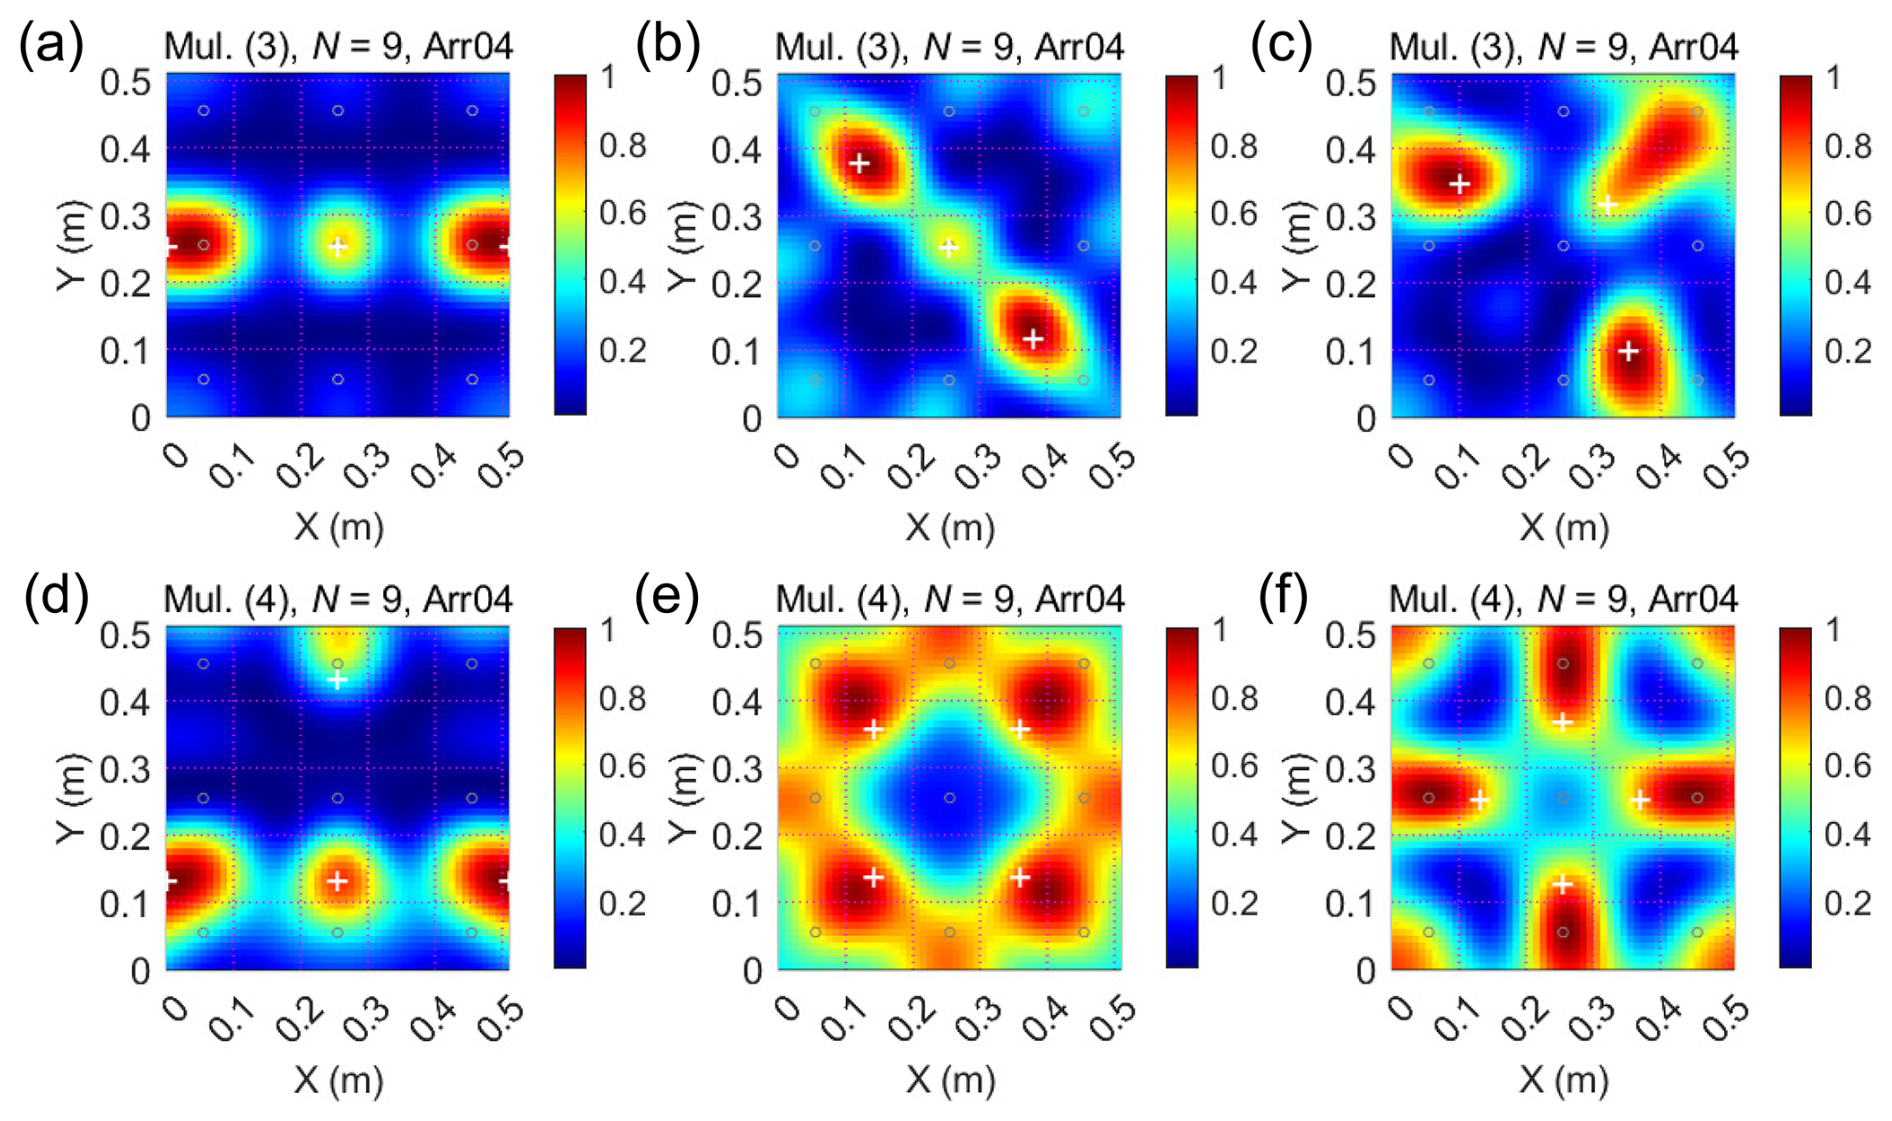
Figure B2Reconstructed acoustic image for three and four simultaneous sources obtained with a 9-sensor array (dMic = 100 mm, f = 1600 Hz). Panels (a)–(c) show three-source cases: (a) (0.000, 0.255), (0.255, 0.255), (0. 510, 0.255); (b) (0.120, 0.380), (0.255, 0.255), (0. 380, 0.120); (c) (0.100, 0.350), (0.320, 0.320), (0.350, 0.100). Panels (d)–(f) show four-source cases: (d) (0.000, 0.135), (0.255, 0.135), (0.510, 0.135), (0. 255, 0.435); (e) (0.150, 0.150), (0.350, 0.150), (0. 350, 0.350), (0.150, 0.350); (f) (0.130, 0.135), (0.255, 0.130), (0.370, 0.255), (0. 255, 0.370).
| AFFT,m | amplitude obtained by FFT of the signal (V Hz−1) |
| Mon. | monopole source (–) |
| Mul. | multipole sources (–) |
| AMax,P | maximum positive amplitude of a packet (V) |
| APac,j | mean amplitude of a signal packet for each class j (V) |
| As | complex amplitude of the sound source (–) |
| C | cross-power matrix (–) |
| c | sound speed (m s−1) |
| D | particle size (m) |
| de | eccentricity distance (m) |
| DE | optimized particle size after mitigating the influence of eccentricity (mm) |
| DA | predicted particle size with calibration model (mm) |
| Dj | mean particle size for class j (mm) |
| dMic | spacing distance of the microphone elements (m) |
| Dpg | difference between the measured or recorded pressure (Pa2) |
| f | frequency of interest (Hz) |
| fCen | centroid frequency (Hz) |
| FFT | fast Fourier transform (–) |
| fS | sampling frequency (Hz) |
| g | steering vector (–) |
| Ii,j | signal impulses triggered by one impact of a single particle for experimental run i and particle size class j (–) |
| k | wave number (m−1) |
| kIPM | number of impulses per particle mass (kg−1) |
| LP | length of a signal packet (s) |
| LPMA | length of the PMA plate (m) |
| M | particle mass (kg) |
| Mi,j | particle mass for experimental run i and particle size class j (kg) |
| N | number of microphone elements (–) |
| p | N-dimensional vector of pressure data (–) |
| p∗ | complex conjugate transpose of p (–) |
| PNorm | non-dimensional acoustic intensity (–) |
| ratio of coordinates obtained from model inversion to the real (–) | |
| RS | resolution of the microphone array (m) |
| SNR | signal-noise ratio (–) |
| T | block length (s) |
| VA | impact velocity in the air (m s−1) |
| VW | impact velocity in the water (m s−1) |
| w | weighted steering vector (–) |
| w | angular frequency (Hz) |
| WPMA | width of the PMA plate (m) |
| xm | coordinate vector of microphone sensor m (–) |
| α | calibration coefficient in power-law function (–) |
| β | calibration coefficient in power-law function (–) |
| Δtj,m | emission time delay (s) |
| Δx | grid size in the X direction (m) |
| Δy | grid size in the Y direction (m) |
| ξi,j | coordinate of a node on the scanning plane (–) |
| ρs | particle density (kg m−3) |
The dataset associated with Fig. 4 is available online in the EnviDat repository (https://doi.org/10.16904/envidat.711, Chen et al., 2025). All other data used in this study were obtained through laboratory experiments and have been fully described in the figures and tables.
ZC: Conceptualization, Formal analysis, Investigation, Methodology, Software, Visualization, Funding acquisition, Writing – original draft preparation, Writing – review & editing; SH: Resources, Supervision, Writing – review & editing; AB: Supervision, Writing – review & editing; DR: Supervision, Writing – review & editing.
The contact author has declared that none of the authors has any competing interests.
Publisher's note: Copernicus Publications remains neutral with regard to jurisdictional claims made in the text, published maps, institutional affiliations, or any other geographical representation in this paper. While Copernicus Publications makes every effort to include appropriate place names, the final responsibility lies with the authors. Views expressed in the text are those of the authors and do not necessarily reflect the views of the publisher.
The first author thanks Huijuan Chen, Jing Xu, and his colleagues of Chengdu University of Technology for their support with the additional laboratory experiments.
This research has been supported by the National Natural Science Foundation of China (grant no. 42307254 awarded to ZC), the Sichuan Science and Technology Program (grant no. 2024NSFSC0861 awarded to ZC), and the State Key Laboratory of Geohazard Prevention and Geoenvironment Protection Independent Research Project (grant no. SKLGP2022Z024 awarded to ZC).
This paper was edited by Kieran Dunne and reviewed by two anonymous referees.
Antoniazza, G., Dietze, M., Mancini, D., Turowski, J. M., Rickenmann, D., Nicollier, T., Boss, S., and Lane, S. N.: Anatomy of an Alpine Bedload Transport Event: A Watershed-Scale Seismic-Network Perspective, J. Geophys. Res. Earth Surface, 128, e2022JF007000, https://doi.org/10.1029/2022JF007000, 2023.
Bakker, M., Gimbert, F., Geay, T., Misset, C., Zanker, S., and Recking, A.: Field application and validation of a seismic bedload transport model, J. Geophys. Res. Earth Surface, 125, e2019JF005416, https://doi.org/10.1029/2019JF005416, 2020.
Barton, J. S., Slingerland, R. L., Pittman, S., and Gabrielson, T. B.: Monitoring coarse bedload transport with passive acoustic instrumentation: A field study, US Geol. Surv. Sci. Investig., Rep., 5091, 38–51, ISNB: 978-1-4113-2848-8, 2010.
Brandstein, M. and Ward, D. (Eds.): Microphone arrays: signal processing techniques and applications, Springer Science & Business Media, ISBN: 3-540-41953-5, 2001.
Brooks, T. F. and Humphreys, W. M.: A deconvolution approach for the mapping of acoustic sources (DAMAS) determined from phased microphone arrays, J. Sound Vib., 294, 856–879, https://doi.org/10.1016/j.jsv.2005.12.046, 2006.
Burtin, A., Cattin, R., Bollinger, L., Vergne, J., Steer, P., Robert, A., Findling, N., and Tiberi, C.: Towards the hydrologic and bed load monitoring from high–frequency seismic noise in a braided river: The “torrent de St Pierre”, French Alps, J. Hydrol., 408, 43–53, https://doi.org/10.1016/j.jhydrol.2011.07.014, 2011.
Camenen, B., Jaballah, M., Geay, T., Belleudy, P., Laronne, J. B., and Laskowski, J. P.: Tentative measurements of bedload transport in an energetic alpine gravel bed river, in: River flow, September 2012, 379–386, https://hal.inrae.fr/hal-02597879 (last access: 29 October 2025), 2012.
Cassel, M., Lavé, J., Recking, A., Malavoi, J. R., and Piégay, H.: Bedload transport in rivers, size matters but so does shape, Sci. Rep., 11, 508, https://doi.org/10.1038/s41598-020-79930-7, 2021.
Chen, Z., He, S., Nicollier, T., Ammann, L., Badoux, A., and Rickenmann, D.: Finite element modelling of the Swiss plate geophone bedload monitoring system, J. Hydraul. Res., 60, 792–810, https://doi.org/10.1080/00221686.2022.2059585, 2022a.
Chen, Z., He, S., Nicollier, T., Ammann, L., Badoux, A., and Rickenmann, D.: Signal response of the Swiss plate geophone monitoring system impacted by bedload particles with different transport modes, Earth Surf. Dynam., 10, 279–300, https://doi.org/10.5194/esurf-10-279-2022, 2022b.
Chen, Z., Badoux, A., and Rickenmann, D.: Acoustic Data from the PMA Bedload Monitoring System, EnviDat [data set], https://doi.org/10.16904/envidat.711, 2025.
Flanagan, J. L.: Beamwidth and Useable Bandwidth of Delay-Steered Microphone Arrays. AT&T Technical Journal, 64, 983–995, https://doi.org/10.1002/j.1538-7305.1985.tb00023.x, 1985.
Geay, T., Belleudy, P., Gervaise, C., Habersack, H., Aigner, J., Kreisler, A., Seiz, H., and Laronne, J. B.: Passive acoustic monitoring of bed load discharge in a large gravel bed river, J. Geophys. Res. Earth Surface, 122, 528–545, https://doi.org/10.1002/2016JF004112, 2017.
Gimbert, F., Fuller, B. M., Lamb, M. P., Tsai, V. C., and Johnson, J. P.: Particle transport mechanics and induced seismic noise in steep flume experiments with accelerometer-embedded tracers, Earth. Surf. Process. Landf., 44, 219–241, https://doi.org/10.1002/esp.4495, 2019.
Govi, M., Maraga, F., and Moia, F.: Seismic detectors for continuous bed load monitoring in a gravel stream, Hydrol. Sci. J., 38, 123–132, https://doi.org/10.1080/02626669309492650, 1993.
Habersack, H. M. and Laronne, J. B.: Evaluation and improvement of bed load discharge formulas based on Helley–Smith sampling in an alpine gravel bed river, J. Hydraul. Eng., 128, 484–499, https://doi.org/10.1061/(ASCE)0733-9429(2002)128:5(484), 2002.
Halfi, E., Paz, D., Stark, K., Yogev, U., Reid, I., Dorman, M., and Laronne, J. B.: Novel mass-aggregation-based calibration of an acoustic method of monitoring bedload flux by infrequent desert flash floods, Earth. Surf. Process. Landf., 45, 3510–3524, https://doi.org/10.1002/esp.4988, 2020.
Hsu, L., Finnegan, N. J., and Brodsky, E. E.: A seismic signature of river bedload transport during storm events, Geophys. Res. Lett., 38, 1–6, https://doi.org/10.1029/2011GL047759, 2011.
Johnson, K. L.: Contact mechanics, Cambridge University Press, UK, ISBN: 0-521-34796-3, 1985.
Krein, A., Klinck, H., Eiden, M., Symader, W., Bierl, R., Hoffmann, L., and Pfister, L.: Investigating the transport dynamics and the properties of bedload material with a hydro-acoustic measuring system, Earth. Surf. Process. Landf., 33, 152–163, https://doi.org/10.1002/esp.1576, 2008.
Lagarde, S., Dietze, M., Gimbert, F., Laronne, J. B., Turowski, J. M., and Halfi, E.: Grain-size distribution and propagation effects on seismic signals generated by bedload transport, Water Resour. Res., 57, e2020WR028700, https://doi.org/10.1029/2020WR028700, 2021.
Merino-Martínez, R., Sijtsma, P., Snellen, M., Ahlefeldt, T., Antoni, J., Bahr, C. J., Blacodon, D., Ernst, D., Finez, A., Funke, S., Geyer, T. F., Haxter, S., Herold, G., Huang, X., Humphreys, W. M., Leclère, Q., Malgoezar, A., Michel, U., Padois, T., Pereira, A., Picard, C., Sarradj, E., Siller, H., Simons, D. G., and Spehr, C.: A review of acoustic imaging methods using phased microphone arrays: Part of the “Aircraft Noise Generation and Assessment” Special Issue, CEAS Aeronaut. J., 10, 197–230, https://doi.org/10.1007/s13272-019-00383-4, 2019.
Mizuyama, T., Oda, A., Laronne, J. B., Nonaka, M., and Matsuoka, M.: Laboratory tests of a Japanese pipe geophone for continuous acoustic monitoring of coarse bedload, US Geol. Surv. Sci. Investig., Rep., 5091, 319–335, ISBN: 978-1-4113-2848-8, 2010.
Nicollier, T., Rickenmann, D., and Hartlieb, A.: Field and flume measurements with the impact plate: Effect of bedload grain-size distribution on signal response, Earth. Surf. Process. Landf., 46, 1504–1520, https://doi.org/10.1002/esp.5117, 2021.
Nicollier, T., Antoniazza, G., Ammann, L., Rickenmann, D., and Kirchner, J. W.: Toward a general calibration of the Swiss plate geophone system for fractional bedload transport, Earth Surf. Dynam., 10, 929–951, https://doi.org/10.5194/esurf-10-929-2022, 2022.
Piantini, M., Gimbert, F., Bakker, M., Recking, A., and Nanni, U.: Using a dense seismic array to study fluvial processes in a braided river reach under flood conditions, LHB: Hydroscience Journal, 108, 2053314, https://doi.org/10.1080/27678490.2022.2053314, 2022.
Recking, A.: A comparison between flume and field bed load transport data and consequences for surface-based bed load transport prediction, Water Resour. Res., 46, W03518, https://doi.org/10.1029/2009WR008007, 2010.
Rickenmann, D.: Bed–load transport measurements with geophones and other passive acoustic methods, J. Hydraul. Eng., 143, 03117004, https://doi.org/10.1061/(ASCE)HY.1943-7900.0001300, 2017.
Rickenmann, D.: Variability of bed load transport during six summers of continuous measurements in two Austrian mountain streams (Fischbach and Ruetz), Water Resour. Res., 54, 107–131, https://doi.org/10.1002/2017WR021376, 2018.
Rickenmann, D.: Bedload transport fluctuations, flow conditions, and disequilibrium ratio at the Swiss Erlenbach stream: results from 27 years of high-resolution temporal measurements, Earth Surf. Dynam., 12, 11–34, https://doi.org/10.5194/esurf-12-11-2024, 2024.
Rickenmann, D. and Fritschi, B.: Bedload transport measurements with impact plate geophones in two Austrian mountain streams (Fischbach and Ruetz): system calibration, grain size estimation, and environmental signal pick-up, Earth Surf. Dynam., 5, 669–687, https://doi.org/10.5194/esurf-5-669-2017, 2017.
Rickenmann, D. and McArdell, B. W.: Continuous measurement of sediment transport in the Erlenbach stream using piezoelectric bedload impact sensors, Earth. Surf. Process. Landf., 32, 1362–1378, https://doi.org/10.1002/esp.1478, 2007.
Rickenmann, D., Turowski, J. M., Fritschi, B., Wyss, C., Laronne, J., Barzilai, R., Reid, I., Kreisler, A., Aigner, J., Seitz, H., and Habersack, H.: Bedload transport measurements with impact plate geophones: comparison of sensor calibration in different gravel-bed streams, Earth. Surf. Process. Landf., 39, 928–942, https://doi.org/10.1002/esp.3499, 2014.
Rickenmann, D., Ammann, L., Nicollier, T., Boss, S., Fritschi, B., Antoniazza, G., Steeb, N., Chen, Z., Wyss, C., and Badoux, A.: Comparison of calibration characteristics of different acoustic impact systems for measuring bedload transport in mountain streams, Earth Surf. Dynam., 10, 1165–1183, https://doi.org/10.5194/esurf-10-1165-2022, 2022.
Rigby, J. R., Wren, D. G., and Kuhnle, R. A.: Passive acoustic monitoring of bed load for fluvial applications, J. Hydraul. Eng., 142, 02516003, https://doi.org/10.1061/(ASCE)HY.1943-7900.0001122, 2016.
Rindler, R., Schwarz, S., Liedermann, M., Shire-Peterlechner, D., Kreisler, A., Aigner, J., Tritthart, M., and Habersack, H.: Effective transport width – A methodology to describe the spatial variability of bedload transport, Int. J. Sediment Res., 38, 294–301, https://doi.org/10.1016/j.ijsrc.2022.09.007, 2023.
Roth, D. L., Brodsky, E. E., Finnegan, N. J., Rickenmann, D., Turowski, J. M., and Badoux, A.: Bed load sediment transport inferred from seismic signals near a river, J. Geophys. Res. Earth Surface, 121, 725–747, https://doi.org/10.1002/2015JF003782, 2016.
Schmidt, R. O.: A signal subspace approach to multiple emitter location and spectral estimation, PhD thesis, Stanford University, USA, 201 pp., 1982.
Sijtsma, P.: Phased array beamforming applied to wind tunnel and fly-over tests, National Aerospace Laboratory NLR, Rep., 1–48, Report no: NLR-TP-2010-549, 2010.
Stark, K., Cadol, D., Varyu, D., Halfi, E., and Laronne, J. B.: Strengths and weaknesses of acoustic pipe microphone systems in ephemeral, sandy, gravel-bed rivers, Earth. Surf. Process. Landf., 49, 1383–1396, https://doi.org/10.1002/esp.5774, 2024.
Thorne, P. D.: Laboratory and marine measurements on the acoustic detection of sediment transport, J. Acoust. Soc., 80, 899–910, https://doi.org/10.1121/1.393913, 1986.
Thorne, P. D.: An overview of underwater sound generated by interparticle collisions and its application to the measurements of coarse sediment bedload transport, Earth Surf. Dynam., 2, 531–543, https://doi.org/10.5194/esurf-2-531-2014, 2014.
Tsai, V. C., Minchew, B., Lamb, M. P., and Ampuero, J. P.: A physical model for seismic noise generation from sediment transport in rivers, Geophys. Res. Lett., 39, L02404, https://doi.org/10.1029/2011GL050255, 2012.
Tsakiris, A. G., Papanicolaou, A. T. N., and Lauth, T. J.: Signature of bedload particle transport mode in the acoustic signal of a geophone, J. Hydraul. Res., 52, 185–204, https://doi.org/10.1080/00221686.2013.876454, 2014.
Turowski, J. M., Böckli, M., Rickenmann, D., and Beer, A. R.: Field measurements of the energy delivered to the channel bed by moving bed load and links to bedrock erosion, J. Geophys. Res. Earth Surface, 118, 2438–2450, https://doi.org/10.1002/2013JF002765, 2013.
Turowski, J. M., Wyss, C. R., and Beer, A. R.: Grain size effects on energy delivery to the streambed and links to bedrock erosion, Geophys. Res. Lett., 42, 1775–1780, https://doi.org/10.1002/2015GL063159, 2015.
Vasile, G.: Vibration data processing for bedload monitoring in underwater environments, Remote Sens., 12, 2797, https://doi.org/10.3390/rs12172797, 2020.
Wyss, C. R., Rickenmann, D., Fritschi, B., Turowski, J. M., Weitbrecht, V., and Boes, R. M.: Laboratory flume experiments with the Swiss plate geophone bed load monitoring system: 1. Impulse counts and particle size identification, Water Resour. Res., 52, 7744–7759, https://doi.org/10.1002/2015WR018555, 2016a.
Wyss, C. R., Rickenmann, D., Fritschi, B., Turowski, J. M., Weitbrecht, V., and Boes, R. M.: Measuring bed load transport rates by grain–size fraction using the Swiss plate geophone signal at the Erlenbach, J. Hydraul. Eng., 142, 04016003, https://doi.org/10.1061/(ASCE)HY.1943-7900.0001090, 2016b.
Wyss, C. R., Rickenmann, D., Fritschi, B., Turowski, J. M., Weitbrecht, V., Travaglini, E., Bardou, E., and Boes, R. M.: Laboratory flume experiments with the Swiss plate geophone bed load monitoring system: 2. Application to field sites with direct bed load samples, Water Resour. Res., 52, 7760–7778, https://doi.org/10.1002/2016WR019283, 2016c.
- Abstract
- Introduction
- Methods
- Results
- Discussion
- Conclusion
- Appendix A: Microphone element arrangements
- Appendix B: Reconstructed acoustic image for multipole simultaneous sources
- Appendix C: Notations
- Data availability
- Author contributions
- Competing interests
- Disclaimer
- Acknowledgements
- Financial support
- Review statement
- References