the Creative Commons Attribution 4.0 License.
the Creative Commons Attribution 4.0 License.
 | 14 May 2025
Influence of alluvial slope on avulsion in river deltas
Octria A. Prasojo
Trevor B. Hoey
Amanda Owen
Richard D. Williams
Changing hydrological regimes, sea-level rise, and accelerated subsidence are all putting river deltas at risk across the globe. One mechanism by which deltas may respond to these stressors is that of avulsion. Decades of delta avulsion studies have resulted in conflicting hypotheses as to whether avulsion timing and location are primarily controlled by upstream (water and sediment discharge) or downstream (backwater and sea-level rise) drivers. Here we use Delft3D morphodynamic simulations to test the upstream-influence hypothesis by varying the initial alluvial slopes upstream of a self-formed delta plain within a range ( to m m−1) that is representative of global deltas, while leaving all other parameters constant. Avulsion timing and location were recorded in six scenarios modelled over a 400-year period. We measured independent morphometric variables including avulsion length, delta lobe width, bankfull depth, channel width at avulsion, delta topset slope, and sediment load and compare these to natural and laboratory deltas. We find that larger deltas take more time to avulse, as avulsion timing scales with avulsion length, delta lobe width, and bankfull depth. More importantly, we find strong negative correlations between sediment load avulsion timescale and sediment load initial alluvial slope. Sediment load is directly dependent on the upstream alluvial slope, and increases in this slope raise transport capacity and introduce more sediment into a delta plain, leading to higher aggradation rates and, consequently, more frequent avulsions. These results introduce further debate over the role of downstream controls on delta avulsion.
- Article
(7644 KB) - Full-text XML
-
Supplement
(1037 KB) - BibTeX
- EndNote


River deltas are home to ∼ 339 million people worldwide, are hotspots for biodiversity, and are crucial carbon sinks (Ericson et al., 2006; Hackney et al., 2020; Loucks, 2019; Shields et al., 2017; Syvitski and Saito, 2007). However, the geomorphic dynamism of river deltas has been, and continues to be, altered by amplifying stressors such as changing hydrological regimes, sea-level rise, and accelerated subsidence, putting human and other systems that rely on river deltas at considerable risk (Giosan et al., 2014; Syvitski et al., 2009; Tessler et al., 2015; Wallace et al., 2014). A frequently observed and geologically rapid mechanism by which deltas respond to these stressors is by river flow avulsing from one distributary channel into another. Delta avulsion location correlates with backwater length, slope break, and valley exit location measured from the shoreline (Ganti et al., 2016a; Hartley et al., 2017; Prasojo et al., 2022). Many studies have proposed different hypotheses for the main controls of delta avulsion frequency (e.g. Aslan et al., 2005; Brooke et al., 2020; Edmonds et al., 2009; Kleinhans and Hardy, 2013; Nijhuis et al., 2015; Slingerland and Smith, 2004), but there is currently no consensus over the conditions under which the various driving factors control this frequency.
During avulsion, flow is abruptly diverted out of an established river channel into a new course on the adjacent floodplain or delta plain (Jones and Schumm, 2009; Slingerland and Smith, 2004). When a delta channel avulses, the population, infrastructure, and economic activities on the delta plain may be at risk. Delta-lobe-scale avulsions may be considered rare, but this is partly due to anthropogenic controls on many delta channels preventing avulsion (e.g. built riverbanks), and unmodified systems can exhibit avulsion over decadal or shorter timescales, for example, once every 12 years in the Yellow River Delta (Jerolmack, 2009) or once every 4 years in the Sulengguole River, China (Li et al., 2022). Avulsions may be full, where the flow following a new course completely abandons its parent channel, or partial, in which only a portion of the flow is diverted (Slingerland and Smith, 2004). Avulsion is often effectively instantaneous but may also be gradual, as in the Rhine–Meuse delta, where one documented avulsion event took 1250 years to complete (Stouthamer and Berendsen, 2001). There are also several styles of avulsion: annexation, in which a pre-existing channel is reoccupied; incision, where a new channel is scoured into the floodplain surface as a direct result of the avulsion; and progradation, where extensive sediment deposition, such as a mouth bar, causes flow bifurcation and formation of a multi-channelled distributive network (Slingerland and Smith, 2004).
River deltas are initiated through repeated mouth bar deposition due to sudden expansion and deceleration of a sediment-laden jet of water entering relatively still water, usually a sea or lake (Bates, 1953; Edmonds et al., 2011; Kleinhans et al., 2013; Wright, 1977). Mouth bars grow in both upstream and downstream directions from the point of initiation. Once a mouth bar's aggradation reaches 40 %–60 % of the initial flow depth, it will stop growing because the sediment is advected around the bar rather than accelerated over it (Edmonds and Slingerland, 2007; Fagherazzi et al., 2015; Kleinhans et al., 2013). This cessation of bar growth is the point where avulsion by progradation or bifurcation starts in a river delta. Simultaneously, avulsion by incision takes place in the proximal parts of a delta plain when mouth bar deposition and stagnation induce parent channel backfilling or in-channel aggradation, triggering an avulsion to create a smaller distributive channel network by breaching the channel levee (Ganti et al., 2016a). The location of the point furthest upstream where a delta channel starts to avulse correlates with the location of a break (i.e. decrease) in bed slope (Prasojo et al., 2022; Ratliff et al., 2021), the limit of the backwater zone (Brooke et al., 2022; Ganti et al., 2016a), and the exit point from the river valley (Hartley et al., 2017).
A study of 105 global river deltas found that the strongest correlation is between the locations of avulsion nodes and the locations of the decreases in slope at the transition from an alluvial to a delta slope (Prasojo et al., 2022). Consequently, it is hypothesized that the slope of the alluvial river upstream of a delta controls the frequency of avulsion on delta plains, with steeper alluvial slopes leading to more frequent avulsions. This control is due to greater sediment transport capacity on steeper slopes (Bagnold, 1966) such that, subject to sediment availability, more sediment per unit width will be delivered to a delta plain where alluvial slopes are steeper. Assuming constant channel width and no subsidence, any reduction in stream power across the delta plain leads to aggradation, the rate of which will be greater when upstream sediment supply is higher, which in turn leads to increased avulsion frequency (Jerolmack and Mohrig, 2007; Mohrig et al., 2000). Alternatively, lower alluvial slopes are associated with lower sediment input flux and hence less frequent avulsion.
To test if the alluvial slope upstream of a delta controls the timing of avulsion on delta plains, we use Delft3D morphodynamic simulation software to (1) assess the effect of varying alluvial slopes upstream of a delta slope break on the avulsion timescale and to (2) investigate the primary controls over delta avulsion. Morphometric variables (delta lobe width, channel width at avulsion, avulsion length, topset slope, bankfull depth, and sediment supply) were measured at every time step during delta growth. These morphometric properties are measured as independent variables expected to covary with avulsion timescales. This investigation aims to (1) identify the role of alluvial slope upstream of delta plains on avulsion timescales, (2) explain the mechanisms by which the controlling variables determine avulsion timescale, and (3) compare avulsion timescales from this numerical model with an analytical solution and also with observations from natural and physical experimental river deltas. A robust understanding of these processes has practical implications due to their direct impact on coastal and inland flood risk in highly populated river deltas and contributes to a fundamental understanding of natural delta-building processes.
We designed a set of numerical experiments to model a natural-scale river delta (7.5×7.5 km, 300 by 300 computational cells, each 625 m2) using Delft3D (v.4.04.02) software. For comparability with previous studies, we adopted physical parameters used in similar Delft3D river delta models by Edmonds and Slingerland (2010) and Caldwell and Edmonds (2014). Model bathymetry was designed to accommodate the six alluvial slopes defined below as our model scenarios.
2.1 Scenario definition
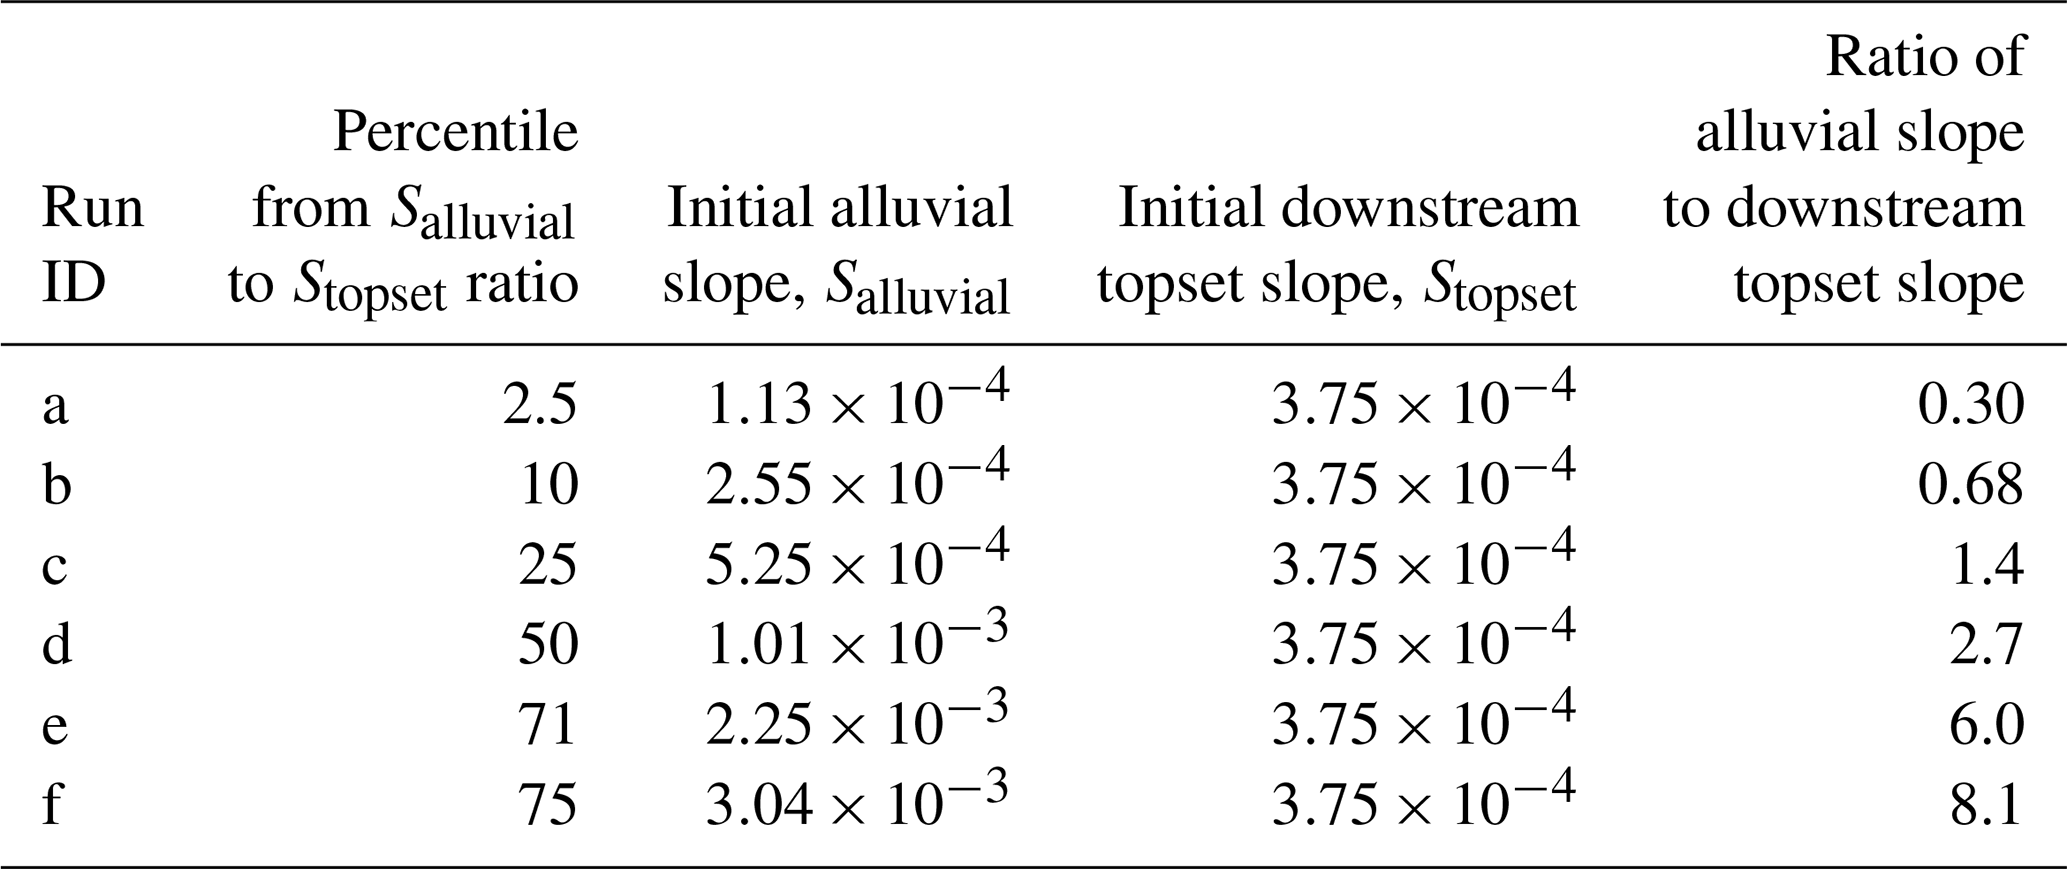
The model used a range of alluvial slopes upstream of the delta's slope break (Salluvial) (Fig. 1a), which are considered to be representative of natural river deltas (Fig. 1b). Representative percentiles of the ratio between Salluvial and downstream delta topset slope (Stopset) were determined from 105 global river deltas measured by Prasojo et al. (2022) (Fig. 1b; Table 1). Percentiles of the ratio of 2.5, 10, 25, 50, 71, and 75 were used to define model scenarios. Model alluvial slopes were calculated from these ratios using a constant downstream slope (Sdownstream=0.000375) similar to that of the Atchafalaya Basin, Mississippi Delta, Louisiana (Edmonds and Slingerland, 2010). During the simulation, both alluvial (Salluvial) and downstream (Sdownstream) slopes evolved and created delta plains with varying topset slope values (Stopset), as aggradation occurred (Video S1 in the Supplement). We defined equilibrium to have been reached when there was constant sediment discharge and channel depth at the model inlet after ∼ 3–6 d of simulation time.
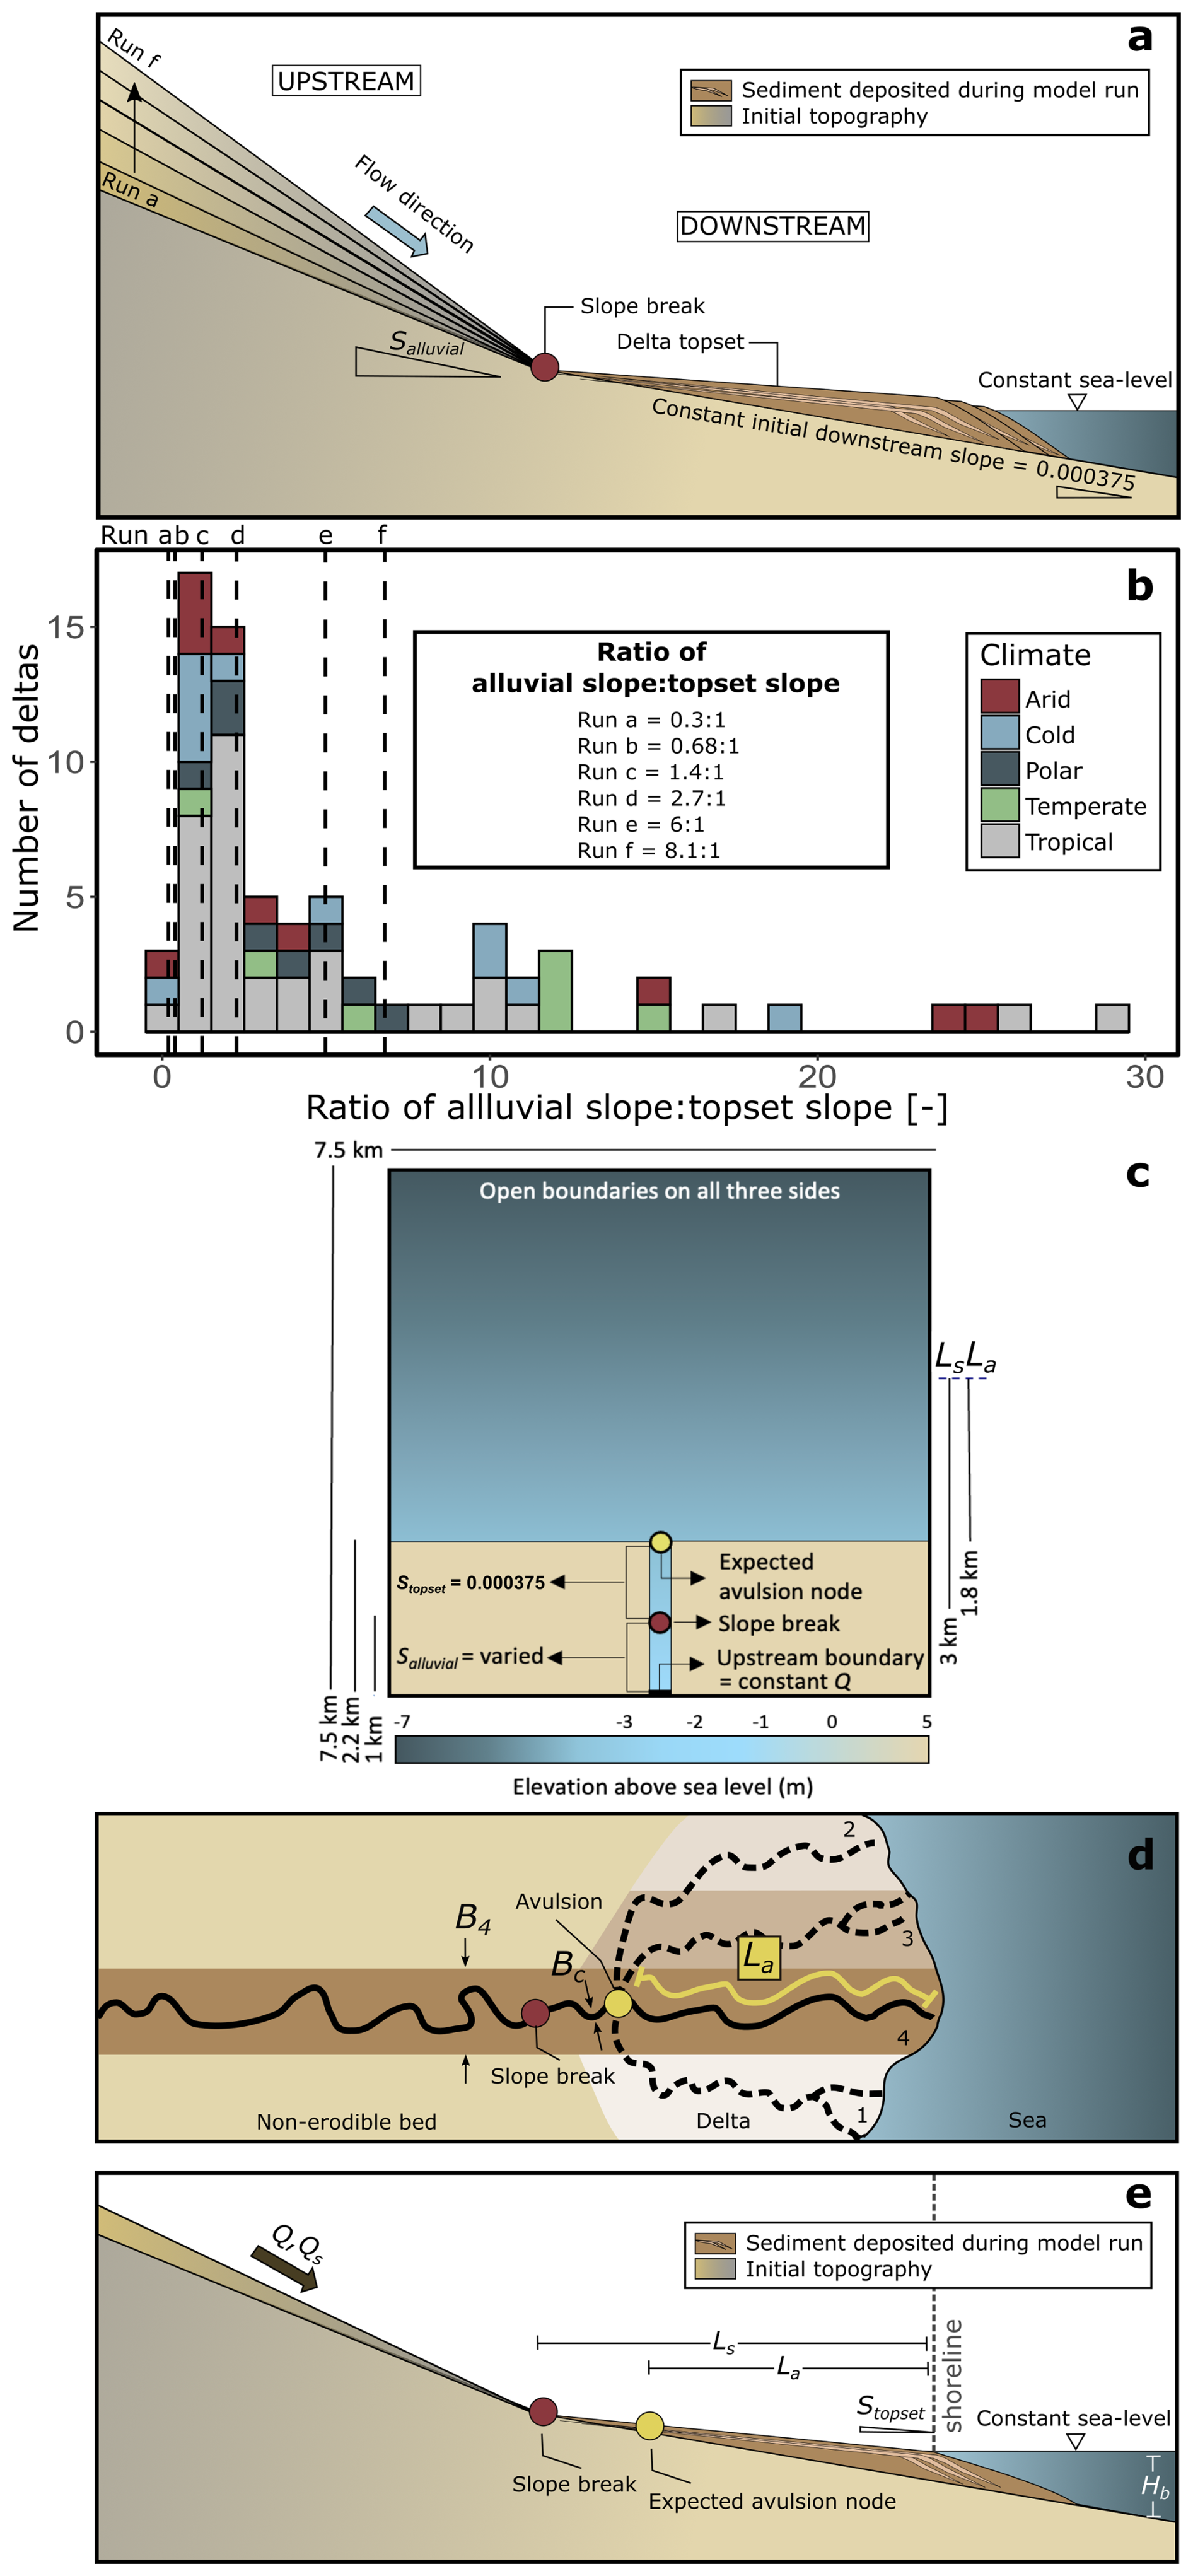
Figure 1(a) Schematic diagram of the model design. The alluvial slope of each run was calculated from six percentiles from the alluvial slope–topset slope ratios of modern river deltas shown in Fig. 1b. Initial downstream slope is kept constant at 0.000375, adopted from the downstream slope of the modern Mississippi Delta (Edmonds and Slingerland, 2010). (b) Distribution of the ratio between alluvial (Salluvial) and topset (Stopset) slopes from 105 modern river deltas distributed across five climate regions. Ratios used for numerical model runs are indicated by dashed vertical lines. (c) Plan view of the model design. Ls and La are slope break and avulsion lengths, respectively. The non-erodible bed at 5 m above sea level represents non-erodible bedrock. (d) Schematic diagram of a river delta showing avulsion location, inlet sediment supply (Qs), lobe width of each avulsion (B), avulsion length (La), and channel widths measured at avulsion (Bc), modified from Chadwick et al. (2020). Numbers near the shoreline represent the number of delta lobes that were used to measure B; e.g. B4 in panel (d) represents the width of the fourth lobe built. (e) Schematic cross-section showing basin depth (Hb) and topset slope (Stopset). Parameters shown in Fig. 1d–e are measured at each time step during delta growth.
2.2 Model setup
We used Delft3D software to model six scenarios. Delft3D is a physics-based model that simulates hydro-morphodynamics and has been validated for a wide range of environments, including reach-scale meandering and braided rivers, estuaries, and self-formed river deltas (Edmonds and Slingerland, 2007, 2008; Geleynse et al., 2011; Leuven et al., 2023; Morgan et al., 2020; Nienhuis et al., 2018a; Nijhuis et al., 2015; Rossi et al., 2016; Williams et al., 2016). Delft3D solves the shallow-water equation and is integrated with the D-Morphology sediment transport and morphology module (Deltares, 2021). Delft3D calculates the flow velocity, sediment entrainment, transport, and deposition, and it updates bed levels at each computational time step by calculating bed sediment mass for each cell as the results of suspended and bedload transport divergence (Deltares, 2021).
The alluvial slope was the only controlled variable in our study, with all other setup and parameters the same as “scenario o” of Edmonds and Slingerland (2010) and Caldwell and Edmonds (2014) (Fig. 1c). The model domain was rectangular with four boundaries, the incoming river discharge being located at the “South” boundary of the model and the other three boundaries set to 0 m elevation above sea level (Fig. 1c). The constant incoming river discharge, set at 1050 m3 s−1, was uniformly distributed across the 250 m wide inlet channel, and inlet sediment discharge was in equilibrium with transport capacity. Various alluvial slopes were achieved by changing the inlet channel elevation in each run while maintaining the receiving basin's depth. Consequently, sediment discharge varied in each run because of the varied alluvial slope as the main controlled variable in the experiments. Our modelled deltas closely represented natural deltas because the discharge ratio and the differences in bed heights between bifurcating distributary channels follow ranges similar to those reported for natural deltas (Edmonds and Slingerland, 2010). Sea level remained constant within the model, and no subsidence, tide, or wave effects were considered.
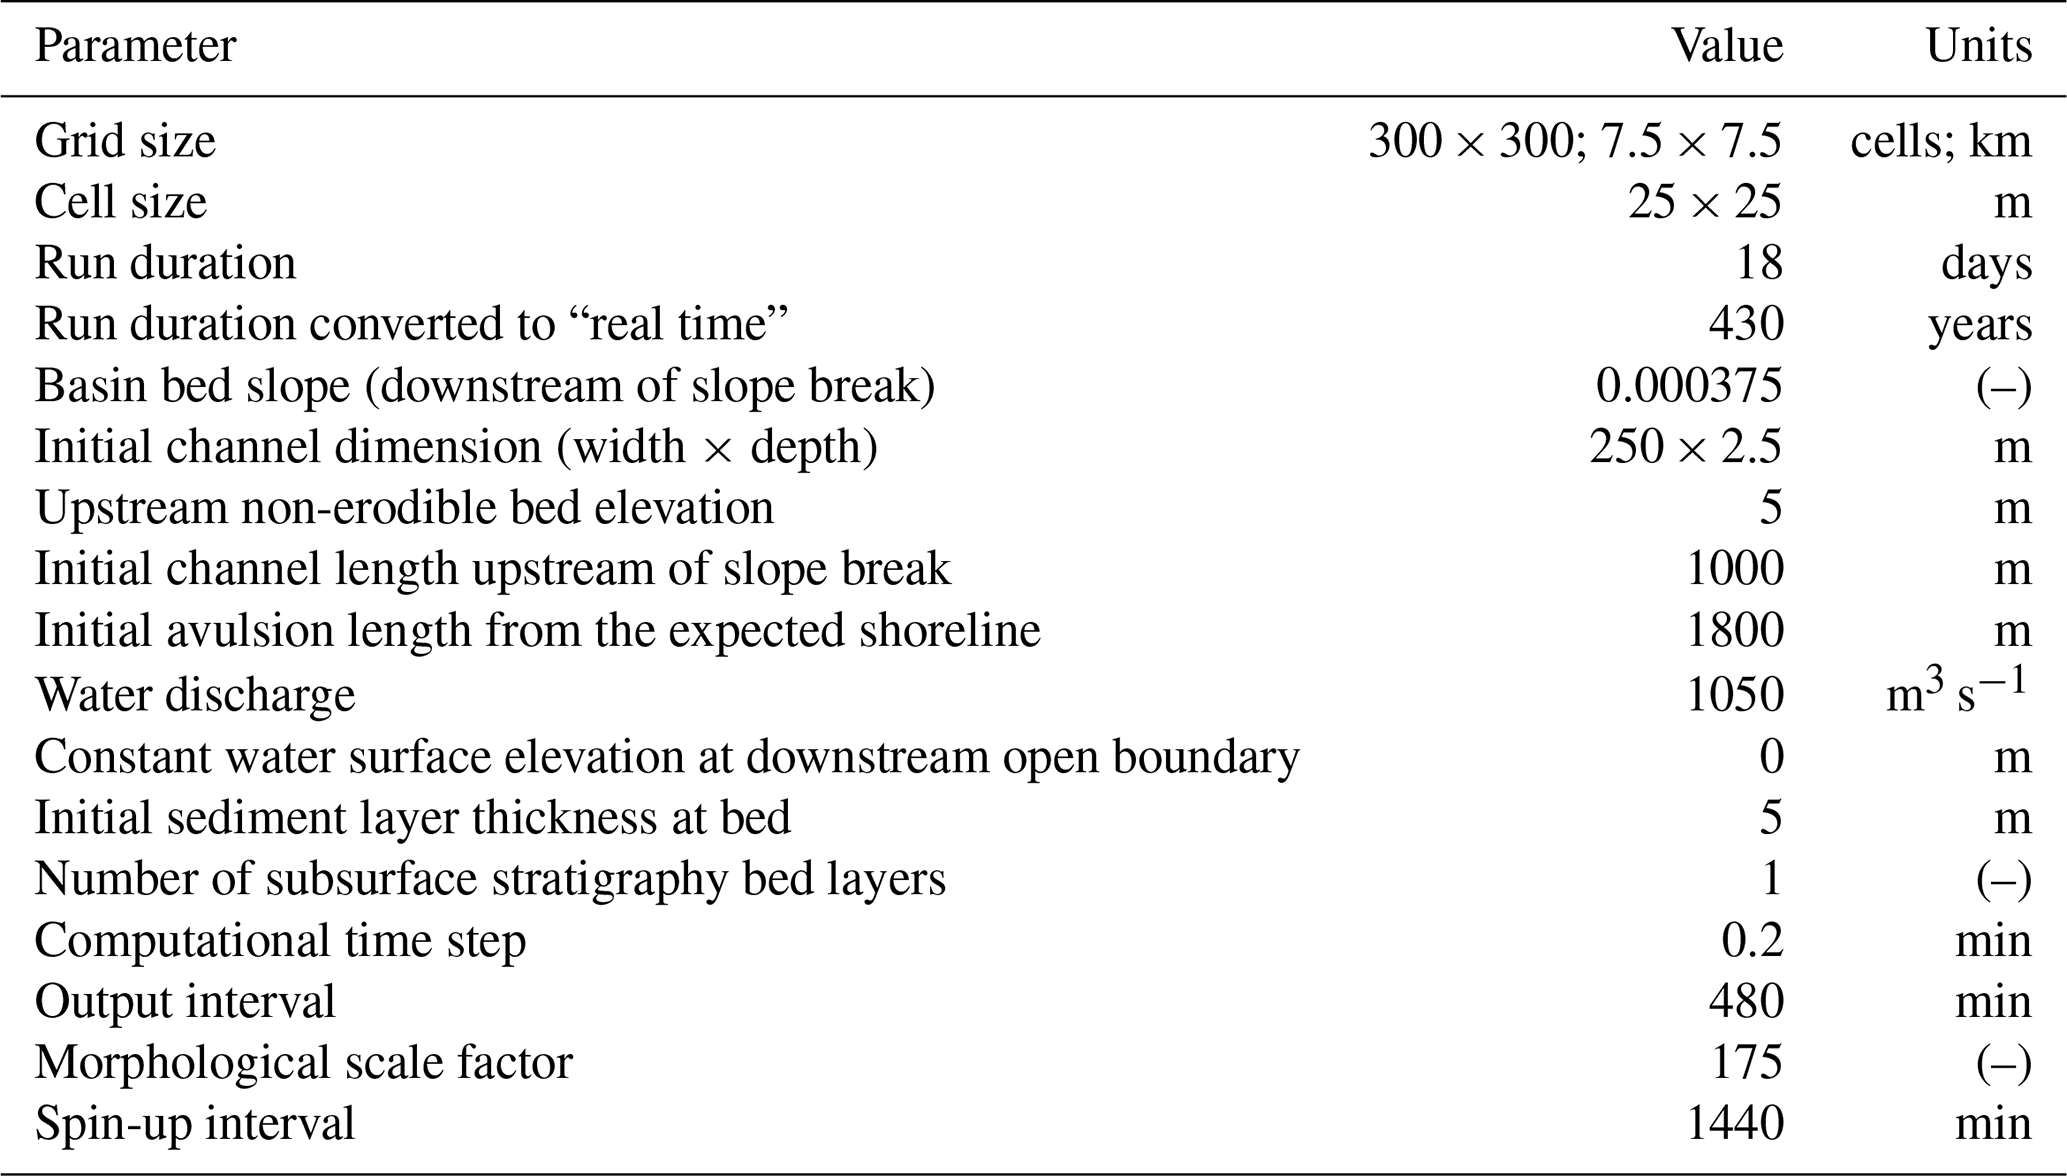
The model domain was 7.5 km × 7.5 km to avoid the delta plain extending across the model boundaries. Constant sediment grain size distributions were used throughout the model. Fine sand was introduced as non-cohesive sediment (D50=125 µm with a Gaussian distribution), and medium-grained silt was introduced as cohesive sediment (D50=30 µm). The critical bed shear stress for erosion was 0.10 N m−2, and the model initially contained 5 m of fully mixed sediments. We introduced a slope break 1 km from the inlet boundary to drive delta formation in the model's initial bathymetry. Using the slope break and avulsion length scaling identified from measured global river deltas (Prasojo et al., 2022), the expected first avulsion node location should emerge in each scenario at around 2.2 km from the inlet (Fig. 1c). Other physical and numerical parameters were held constant across all scenarios (Table 2).
For 18 d simulation, the model produced one output every 480 min, resulting in 52 visualization outputs (i.e. maps) at the end of the simulations. Using a morphological scale factor (morfac) of 175, these 52 maps represented 3150 d (8.6 years) of prototype time. Because bankfull discharge occurs for ∼ 2 % of the time on average (Dunne and Leopold, 1978), 18 d of simulation thus represent around 430 years of “real” time (i.e. 8.6 years divided by 0.02).
Table 2User-defined model parameters (adopted from Edmonds and Slingerland, 2010; Caldwell and Edmonds, 2014).
2.3 Surface morphological metrics
The model reached equilibrium after ∼ 3–6 d of simulation time when we began measurements of morphometric variables and avulsion timescale. Avulsion timescale, defined as the time in between successive avulsions, was empirically measured throughout all experiments after equilibrium was attained. Avulsions were defined when a distributary channel produced during delta formation changed its course and commenced deposition of a new delta lobe. We only considered avulsions caused by progradation or incision that are common in river deltas (Slingerland and Smith, 2004). The timing of each avulsion in the model was noted and converted to a “real” time as Ta empirical.
Numerous morphological surface metrics can be used to describe delta form. The surface metrics used here followed those used in an analytical solution for avulsion timescale (Eq. 4 from Chadwick et al., 2020), which utilized delta lobe width (B), channel width at avulsion (Bc), avulsion length (La), basin depth (Hb), magnitude of relative sea-level rise (RSLR; z), topset slope (Stopset), bankfull depth (hc), and sediment supply (Qs). Avulsion length, delta lobe width, channel width at avulsion, and delta topset slope were measured on all maps after equilibrium was reached. The delta lobe width, channel width at each avulsion node, and avulsion length were measured in QGIS from the georeferenced images produced by Delft3D (Fig. 1d, Table S1). Delta lobe width was measured as the maximum width of each lobe, while avulsion length was measured along the longest channel from the shoreline to the most upstream avulsion node every time new avulsion occurred in our models. Topset slope (Stopset) was calculated as the average slope of a delta plain. To measure Stopset, digital elevation models (DEMs) for each time step were first extracted from Delft3D and then cropped to only cover the delta plain. We then filtered the DEM to only include elevation, z between 0–5 m (), to cover the part of the delta plain that is exposed above sea level (i.e. z=0 m) but below the non-erodible bed (i.e. z=5 m; Fig. 1d). After cropping and filtering, the DEM was then transformed to a slope raster defined as the change in elevation for each DEM cell in x and y directions with . The mean topset slope for each time step was then extracted from the slope raster as the slope values for each scenario showed unimodal distributions (Table S1; Fig. S1). Lastly, the sediment load (Qs) at the channel inlet was obtained from the QUICKPLOT (v2.60.65942) Delft3D visualization software.
Bankfull depth (hc) was calculated using Eq. (1) (Parker et al., 2007):
where Cf is a bed friction coefficient (–) equal to 0.002 for large lowland rivers (Parker et al., 2007), Q is bankfull discharge (m3 s−1) equal to 1050 m3 s−1, and g is gravitational acceleration (m s−2) equal to 9.81 m s−2.
The avulsion timescale was calculated between each successive pair of avulsions observed in the model (Ta empirical) and was correlated with all the measured morphometric variables (e.g. Qs, La, Bc, B, Stopset, Salluvial, and hc) from all post-equilibrium maps. Scatter plots and Pearson correlation coefficients (r) were used to assess the shape of relationships and potential dependencies between all variables.
2.4 Comparing numerical models to analytical solutions and natural deltas
We used the mass-balance-based analytical solution of Chadwick et al. (2020) to calculate expected avulsion timescales for our model conditions (Eqs. 2–5, Table S1). Measured independent surface morphological metrics were used in Eqs. (2)–(5) to calculate avulsion frequency (fa) and timescale (Ta).
where fa is the avulsion frequency (year−1), Qs is the sediment load (m3 s−1), λp is the sediment porosity (–), La is the avulsion length (m), D is the delta lobe progradation distance (km), B is the delta lobe width of each avulsion (m), H is the aggradation thickness necessary for avulsion (m), Hb is the basin depth (m), z is the magnitude of sea-level rise during an interavulsion period (m), Stopset is the topset slope (–), H* is the avulsion threshold (–), and hc is the bankfull depth (m) calculated using Eq. (1).
In calculating these analytical avulsion timescales, sensitivity analyses were undertaken using avulsion thresholds (H*) of 0.2, 0.5, and 1.4, which are realistic for lowland deltas (Ganti et al., 2019), and D>0, since there is no allogenic forcing that would make the delta regress. The analytical avulsion timescales for , 0.5, and 1.4 are , , and , respectively (Table S1). Since sea level is constant in this study, the sea-level rise (z) is 0. Sediment porosity (λp) is assumed to be 0.4 (Jerolmack, 2009; Paola et al., 2011), the bed friction coefficient (Cf) is 0.002 for lowland rivers (Parker et al., 2007), and the constant bankfull discharge (Q) is 1050 m3 s−1. Analytical avulsion timescales were then compared to avulsion timescales observed from 19 natural river deltas, 2 fan deltas, and 1 downscaled physical laboratory fan delta documented in Chadwick et al. (2020) and Jerolmack and Mohrig (2007), using topset slope values from Prasojo et al. (2022) (Table S2).
Figure 2 shows the morphology of the deltas in each scenario at the final time step. Overall, the different alluvial slopes are associated with delta plains that exhibit different shoreline configurations, different numbers of active distributary channels, and slightly different delta plain sizes. One delta plain reached the model boundary (Run f, Fig. S2), and this scenario was repeated with a larger domain size, and the avulsion timescales and morphological metrics were observed from this larger domain.
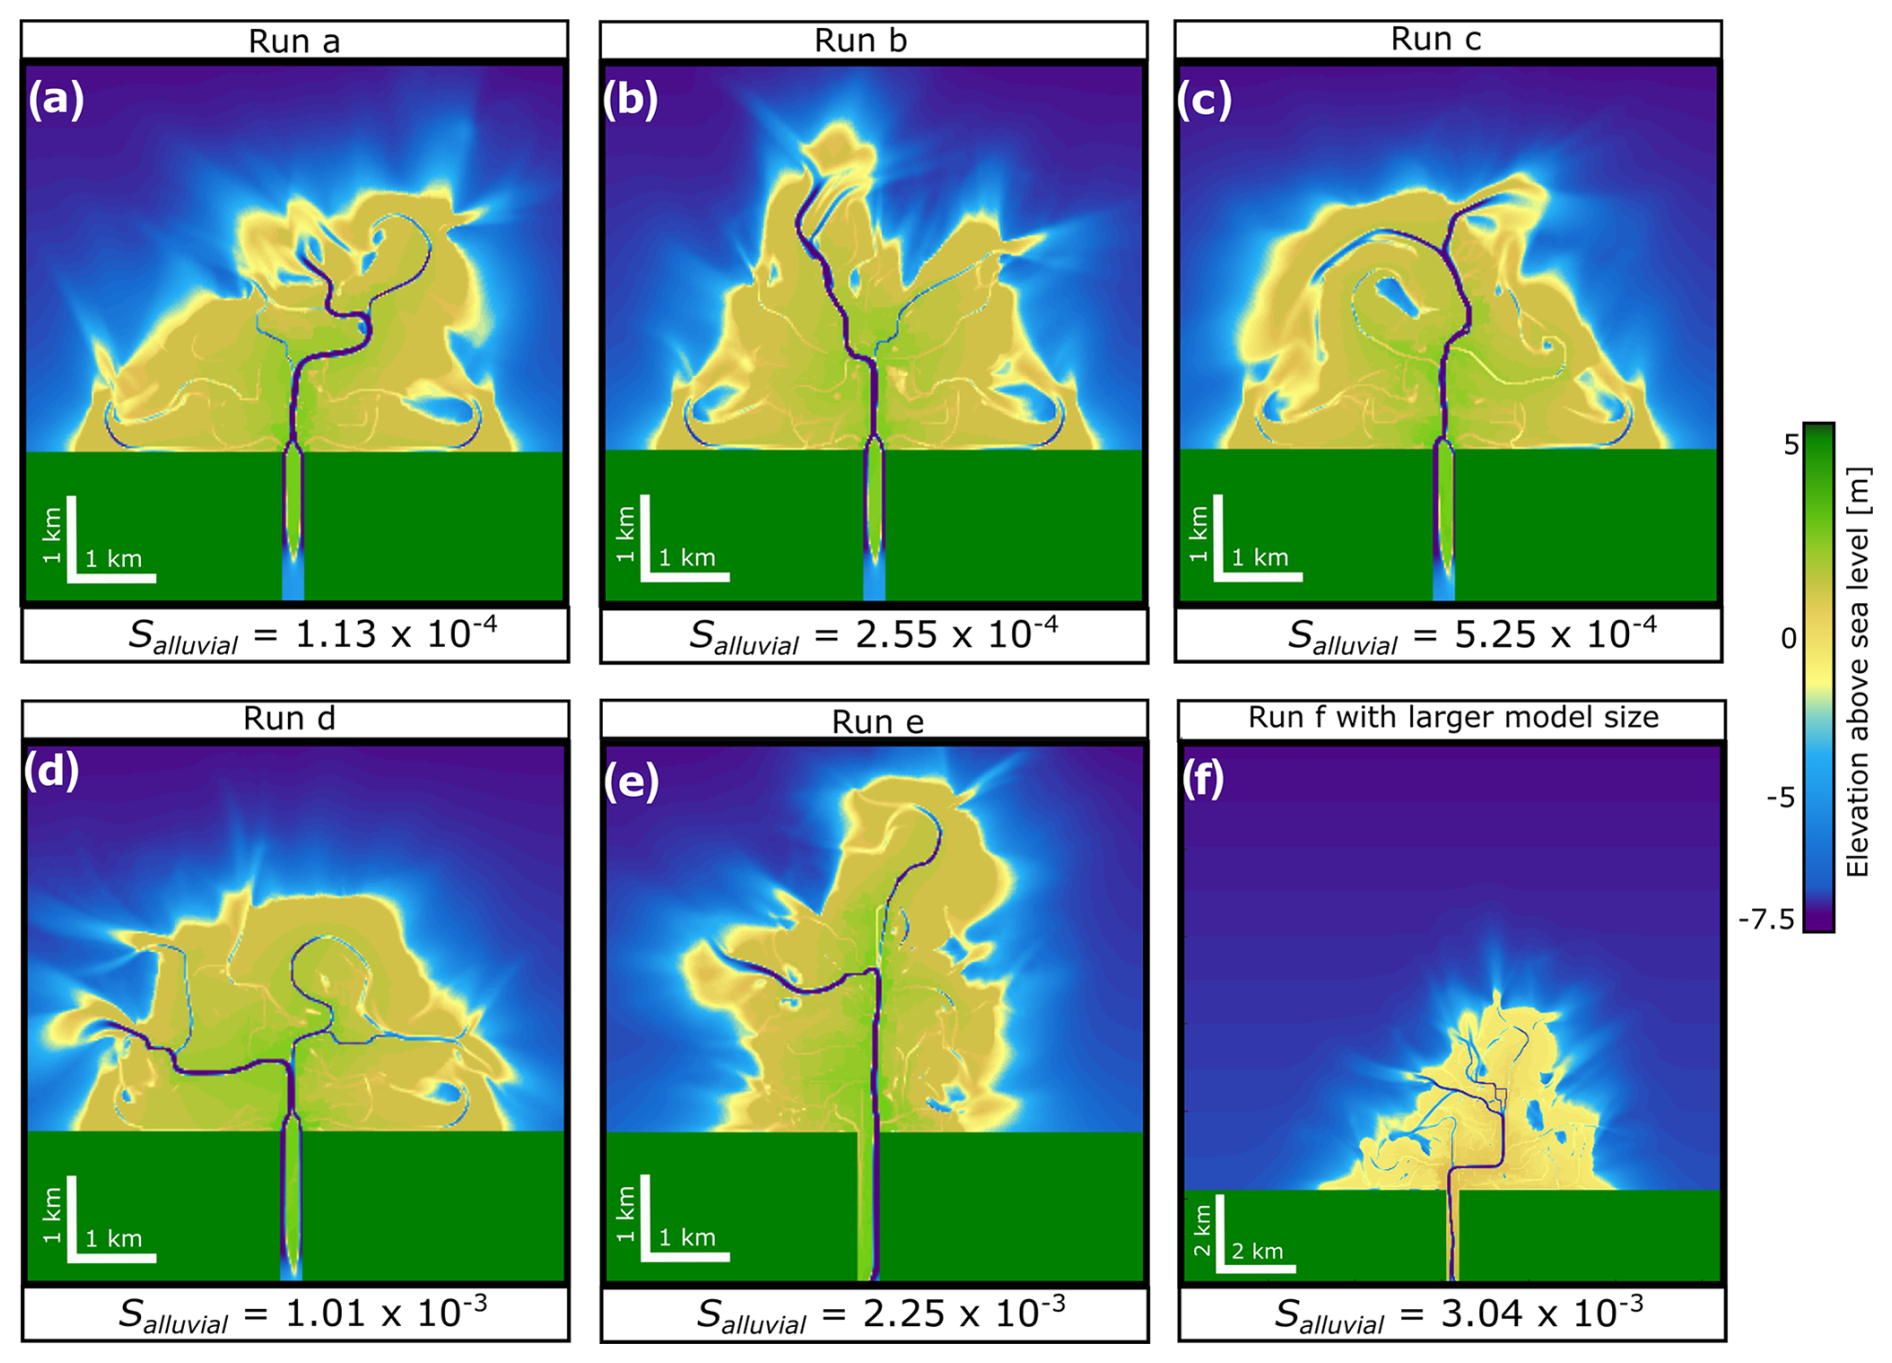
Figure 2(a–f) River deltas for each run at the final simulation time step. Run f uses a larger (12.5×12.5 km) model domain to avoid the delta plain reaching the model's boundary. Morphometric measurements for Run f were made on this larger domain.
As an example of avulsion in the model, Fig. 3 shows one avulsion that was initiated by an increase in in-channel deposition in a distributary channel around the avulsion node (Fig. 3a–g). In-channel aggradation sets up an avulsion to occur by increasing the likelihood of overbank flows because it elevates the water level and distributary channel bed above the surrounding floodplain (Fig. 3g). Aggradation continues until the levee is breached through erosion because the surrounding delta plain provides a lower path for a distributary channel to flow (Fig. 3b). This newly avulsed channel then distributes more water and sediment away from the initial distributary channel path (Fig. 3c–f). Note also that bifurcation at the delta shoreline occurred at the same time as the avulsion developed ∼ 1 km upstream (Fig. 3a). Bifurcation is initiated by a mouth bar deposition in a more distal part of the delta plain (Fig. 3a). The distributary channel feeding this mouth bar bifurcates once the depth of the mouth bar is ∼ 40 % of the initial basin depth, consistent with findings from Edmonds and Slingerland (2007). However, we are uncertain if the mouth bar deposition forces an upstream wave of in-channel deposition that leads to the channel being unstable enough to trigger an avulsion (Fig. 3a–g).
Avulsion occurs as often as every 8.27 years in all scenarios, with the maximum time between successive avulsions being 148.9 years (Run d). At the upper limit, avulsions occurred 14 times (runs a and f), and they occurred 6 times at the lower limits (Run c). A right-skewed distribution of avulsion interval was observed in most scenarios (Fig. S3), with medians from 8.3–16.5 years and means from 14.8–33.1 years. The median timing of avulsions remains unchanged over runs a–f (Kruskal–Wallis, p>0.05) (Fig. S3).
Figure 4 shows Pearson's correlations between observed avulsion timescales in the model (Ta empirical) and the independent morphometric variables measured in each time step. Ta empirical has a weak negative correlation with sediment load, . The initial alluvial slope (Salluvial; Table 1, Fig. 1), defined independently in our approach, controls the sediment load (Qs; r=0.86) and is responsible in defining the delta avulsion length, La (r=0.58; Fig. 4), suggesting that higher transport capacity on a steeper alluvial slope may produce a longer (i.e. more protruding) delta, consistent with the findings from global river deltas (Prasojo et al., 2022). Ta empirical is also weakly and negatively correlated with bankfull depth, hc (), suggesting that bankfull depth may not be a good indicator of avulsion timescale. Sediment load (Qs) influences the delta topset slope (Stopset; r=0.37) so higher riverine sediment loads produce steeper delta plains when the basin configuration is similar. Avulsion timescale (Ta empirical) shows no correlation with the delta size represented as delta avulsion length, La (); delta lobe width, B (); and channel width at avulsion node, Bc (r=0.04). Note that there are high degrees of autocorrelation within the morphometric parameters used here, for example, between bankfull depth (hc) with channel width at avulsion, Bc (), and with topset slope, Stopset ().
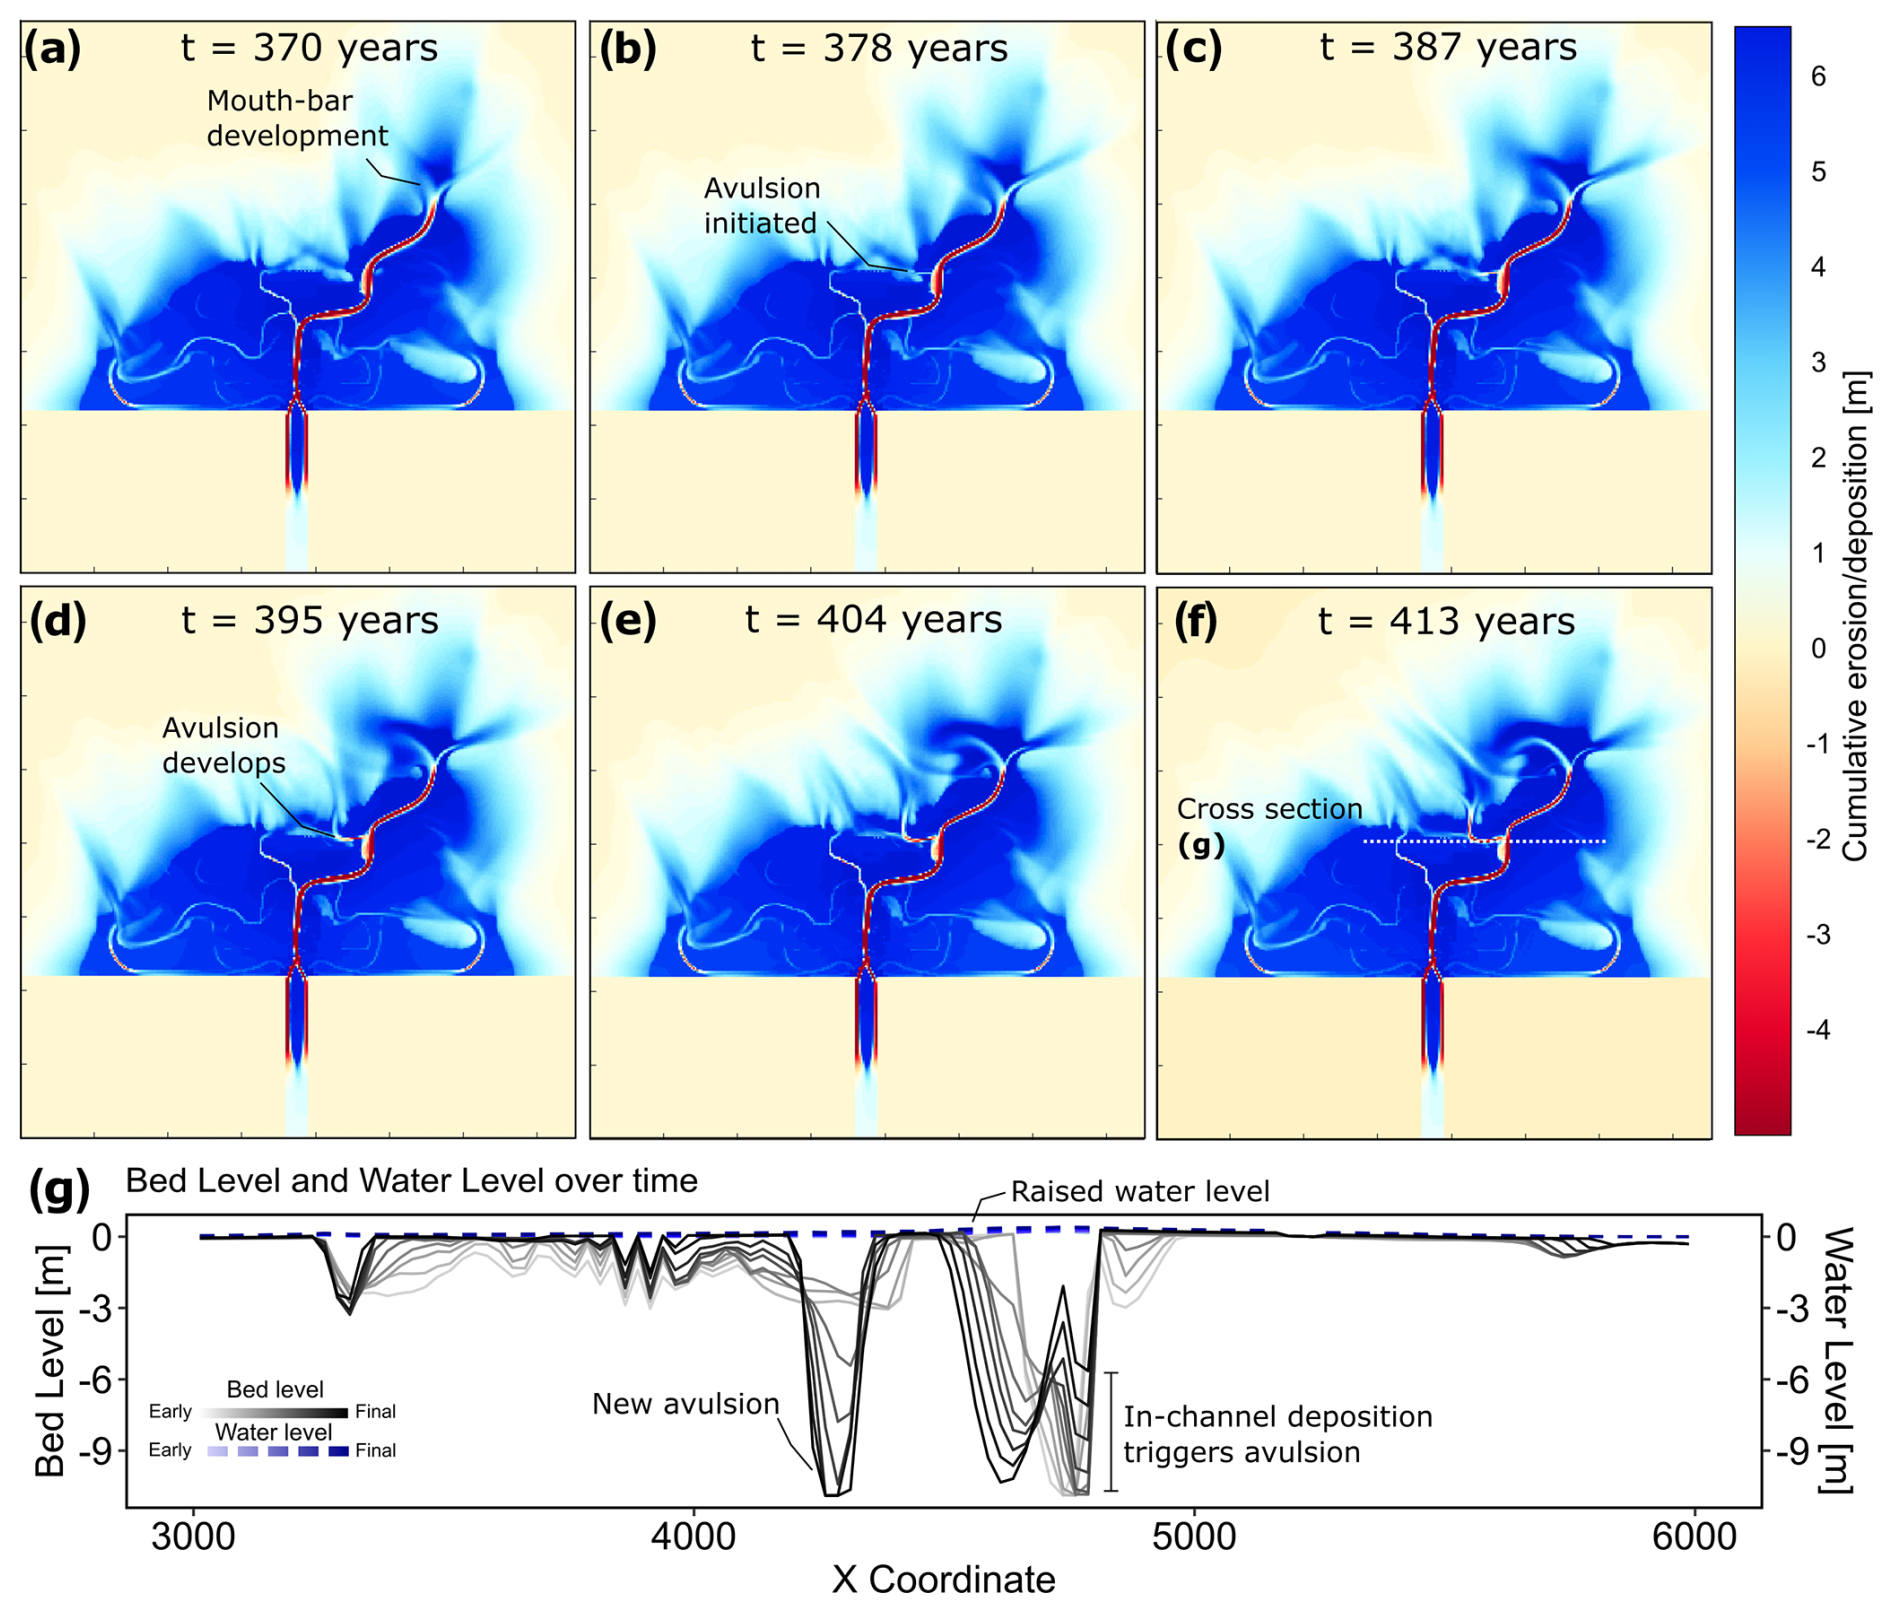
Figure 3Time series images from Run a showing the details of an avulsion process (a–f). Cross-section showing the evolution of bed and water level during the avulsion process (g).
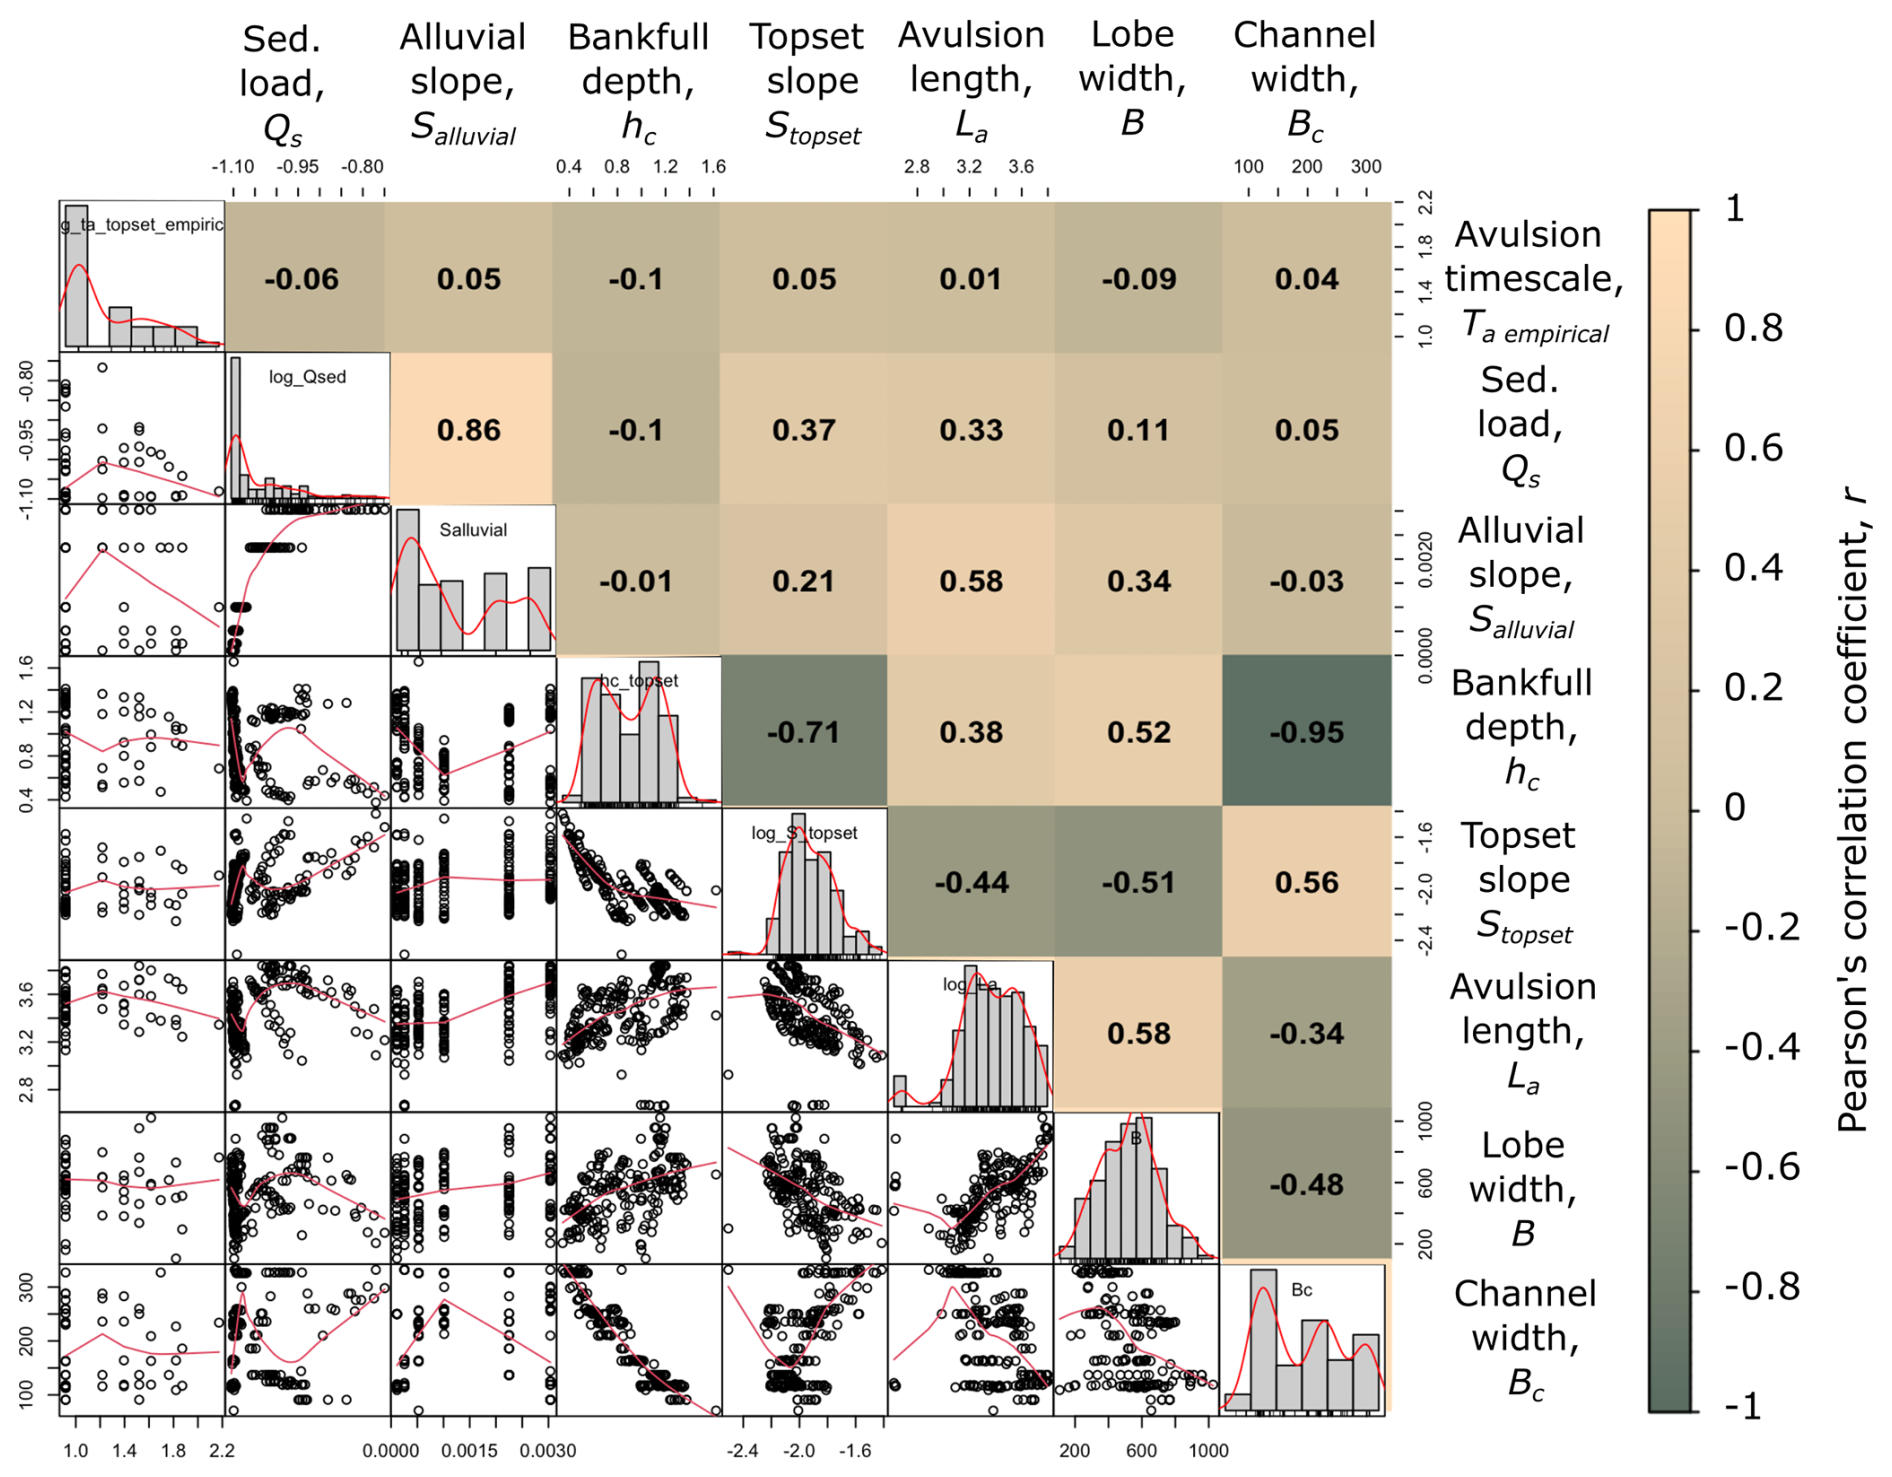
Figure 4Pearson correlations (upper-right panels) between avulsion timescale (Ta empirical) and independent morphometric variables, along with their distributions (diagonal panels) and correlations (lower-left panels). Units in this figure are years for Ta empirical; cubic metres per second (m3 s−1) for Qs; and metres (m) for Bc, hc, and La. Stopset and Salluvial are dimensionless. Note that hc is autocorrelated with Stopset and Bc as shown in Eq. (1) and that Salluvial is the initial alluvial slope available in Table 1 as the independent variable used to define the six experimental scenarios. Red lines on the correlation plots are LOWESS curves. Red lines on the histograms aid visualizing the distributions. Also note that Ta empirical, Qs, Stopset, and La are on log scales.
As Fig. 4 groups the results together, Fig. 5 shows ordinary least-squares regressions between sediment load (Qs), avulsion timescale (Ta empirical), initial alluvial slope (Salluvial), and bankfull depth (hc) produced from each scenario. Avulsion timescale is inversely and non-linearly correlated with sediment load (see R2 values for each scenario and overall dataset at the bottom of Fig. 5), showing the influence of sediment load in defining avulsion timescale observed in our model (Fig. 5a). The higher the riverine sediment load brought into a delta plain, the faster avulsions occur, as shown in Fig. 5a. Conversely, the riverine sediment load is positively correlated with initial alluvial slope (Fig. 5b), showing how initial alluvial slope upstream of a delta plain defines how much riverine sediment is being transported to the delta plain. As we maintain the channel width upstream of a delta plain to be constant (Fig. 1c), a higher transport capacity in a steeper alluvial slope is able to bring more sediment load (Fig. 5b). Lastly, Fig. 5c shows a weak negative correlation between bankfull depth and sediment load. Negative correlation is expected, as, the higher the riverine sediment load, the more sediment is deposited on a delta plain, making a steeper delta plain (Fig. 4) and shallower bankfull depth (Fig. 5c).
Since avulsion is infrequent and often beyond human monitoring timescales, it is difficult to acquire datasets on avulsion frequency from field studies, except for a few well-documented cases (Moodie et al., 2019; Chamberlain et al., 2018; Pierik et al., 2018; Jerolmack, 2009; Li et al., 2022). The six scenarios modelled in this study have merit in providing a large dataset from which to infer the process controls over avulsion timescales.
4.1 Investigating variables controlling avulsion timescales
In this study, to assess the impact of sediment input from the delta's catchment, only the initial alluvial slope (Salluvial) was varied. All the other measured variables are from these experiments, in which deltas were allowed to self-form. Our experimental setup determines that initial alluvial upstream slope controls how much sediment enters the delta plain (r=0.8; Fig. 4, Table 3). A steeper initial alluvial slope (Salluvial) has a higher transport capacity and so transports a greater sediment load (Qs), which is then deposited on the delta plain. Higher sediment load results in a higher vertical aggradation rate (va) in the distributary channel (Chadwick et al., 2020), which elevates the distributary channel floor above its surrounding floodplain. The higher the distributary channel floor relative to the floodplain, the easier it is for an avulsion to occur (Jerolmack and Mohrig, 2007; Mohrig et al., 2000). While sediment load is controlled by the steepness of the initial alluvial slope transporting the sediment, we propose that the avulsion timescale in our model is influenced by the amount of sediment deposited in a delta plain. Other investigations that have also found that sediment mass balance is the primary control on avulsion timescales, including a radially averaged model (Muto, 2001; Muto and Steel, 1997), a channel-averaged model (Reitz et al., 2010), and backwater-scaled models (Chadwick et al., 2019; Moodie et al., 2019).
4.2 Comparison with analytical solutions and natural deltas
Figure 6 shows avulsion-timescale scaling relationships observed from our model compared to natural deltas, a physical laboratory fan delta, and analytical solutions. Generally, the pattern and magnitude observed in our numerical model are in good agreement with natural and physical laboratory deltas. By bringing natural and physical laboratory deltas that have a larger range of measured variables (e.g. Stopset, hc, B, Qs), clearer correlations between measured variables and avulsion timescale can now be observed. Topset slope negatively correlates with avulsion timescale, showing a steeper delta plain will experience a faster avulsion (Fig. 6a). Positive correlations between bankfull depth, delta lobe width, avulsion length, and avulsion timescale are also consistent between our model and the natural and physical laboratory deltas (Fig. 6b–d). This demonstrates that avulsion takes longer in larger deltas. However, channel width at avulsion, sediment load, and avulsion timescale do not show clear patterns (Fig. 6e, f). Additionally, analytical solutions indicate underestimation of avulsion timescale by several orders of magnitude in comparison to our model and to natural and physical laboratory deltas.
A strong negative correlation between avulsion timescale (Ta empirical) and delta topset slope (Stopset) shown in Fig. 6a allows a parallel comparison to be made with avulsion controls in comparable alluvial sedimentary environments (e.g. alluvial fans and fan deltas). Diverse alluvial fan and fan delta experiments have shown that avulsion timescale is influenced by fan-channel gradient (equivalent to delta topset slope in our model) (Schumm et al., 1987; Whipple et al., 1998; Van Dijk et al., 2012; Leenman and Eaton, 2021). Fan-channel slope is dependent on sediment flux (Whipple et al., 1998; Bagnold, 1966) and sediment flux also influences the avulsion timescale as shown earlier in our model. Consequently, avulsion timescale also has a strong correlation with the fan-channel slope or delta topset slope. However, we propose that delta topset slope is a causal effect of the amount of sediment fed into a delta plain in our model. As the initial alluvial slope (Salluvial) controls the sediment load (Qs) feeding a delta plain which in turn determines Stopset, we argue that Salluvial plays a more fundamental role than Stopset in influencing the avulsion timescale (Ta empirical) observed in our model.
Table 3Average sediment load and initial alluvial slope for each scenario.
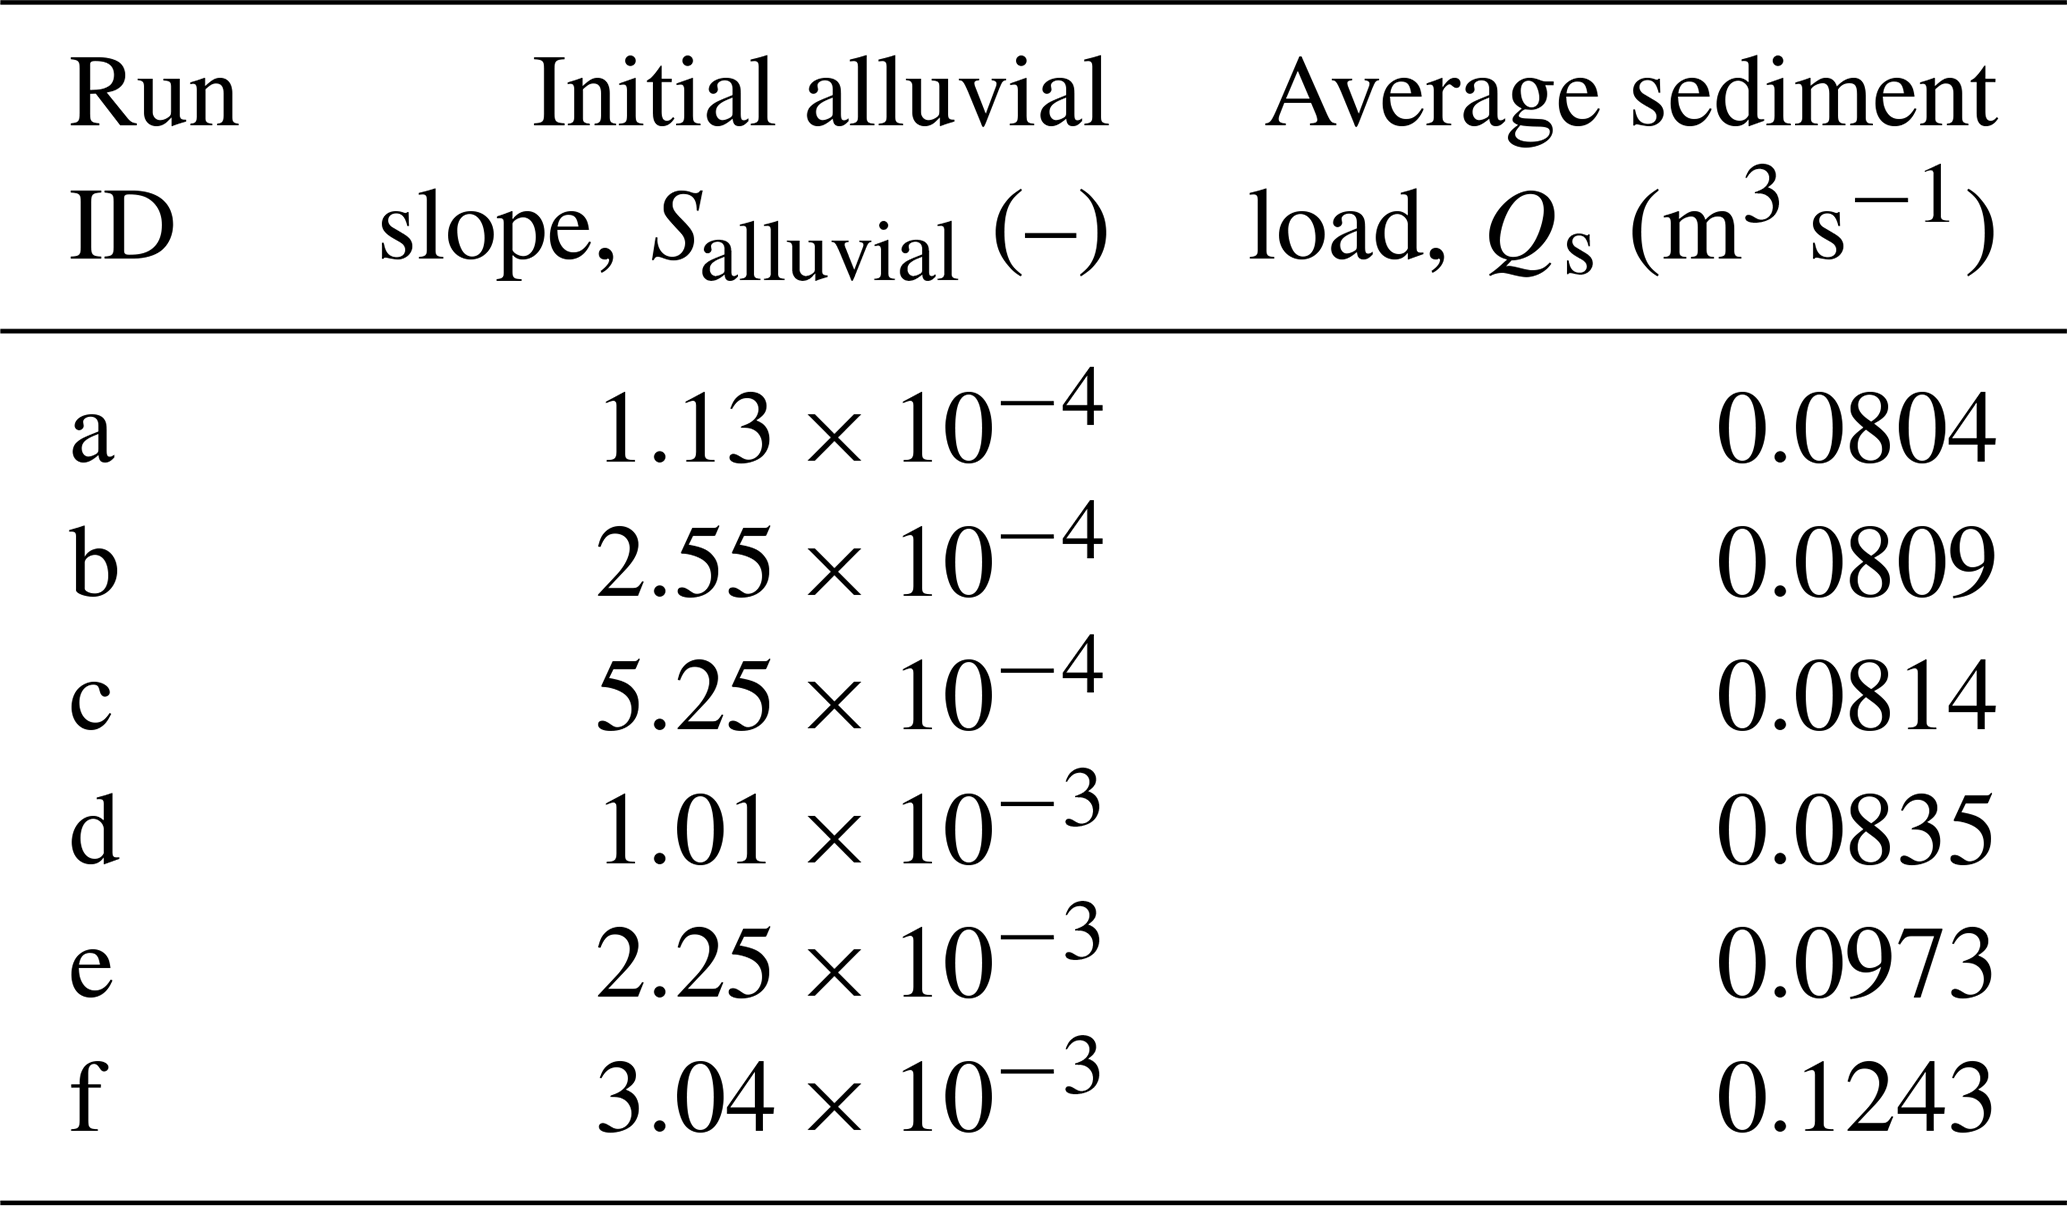
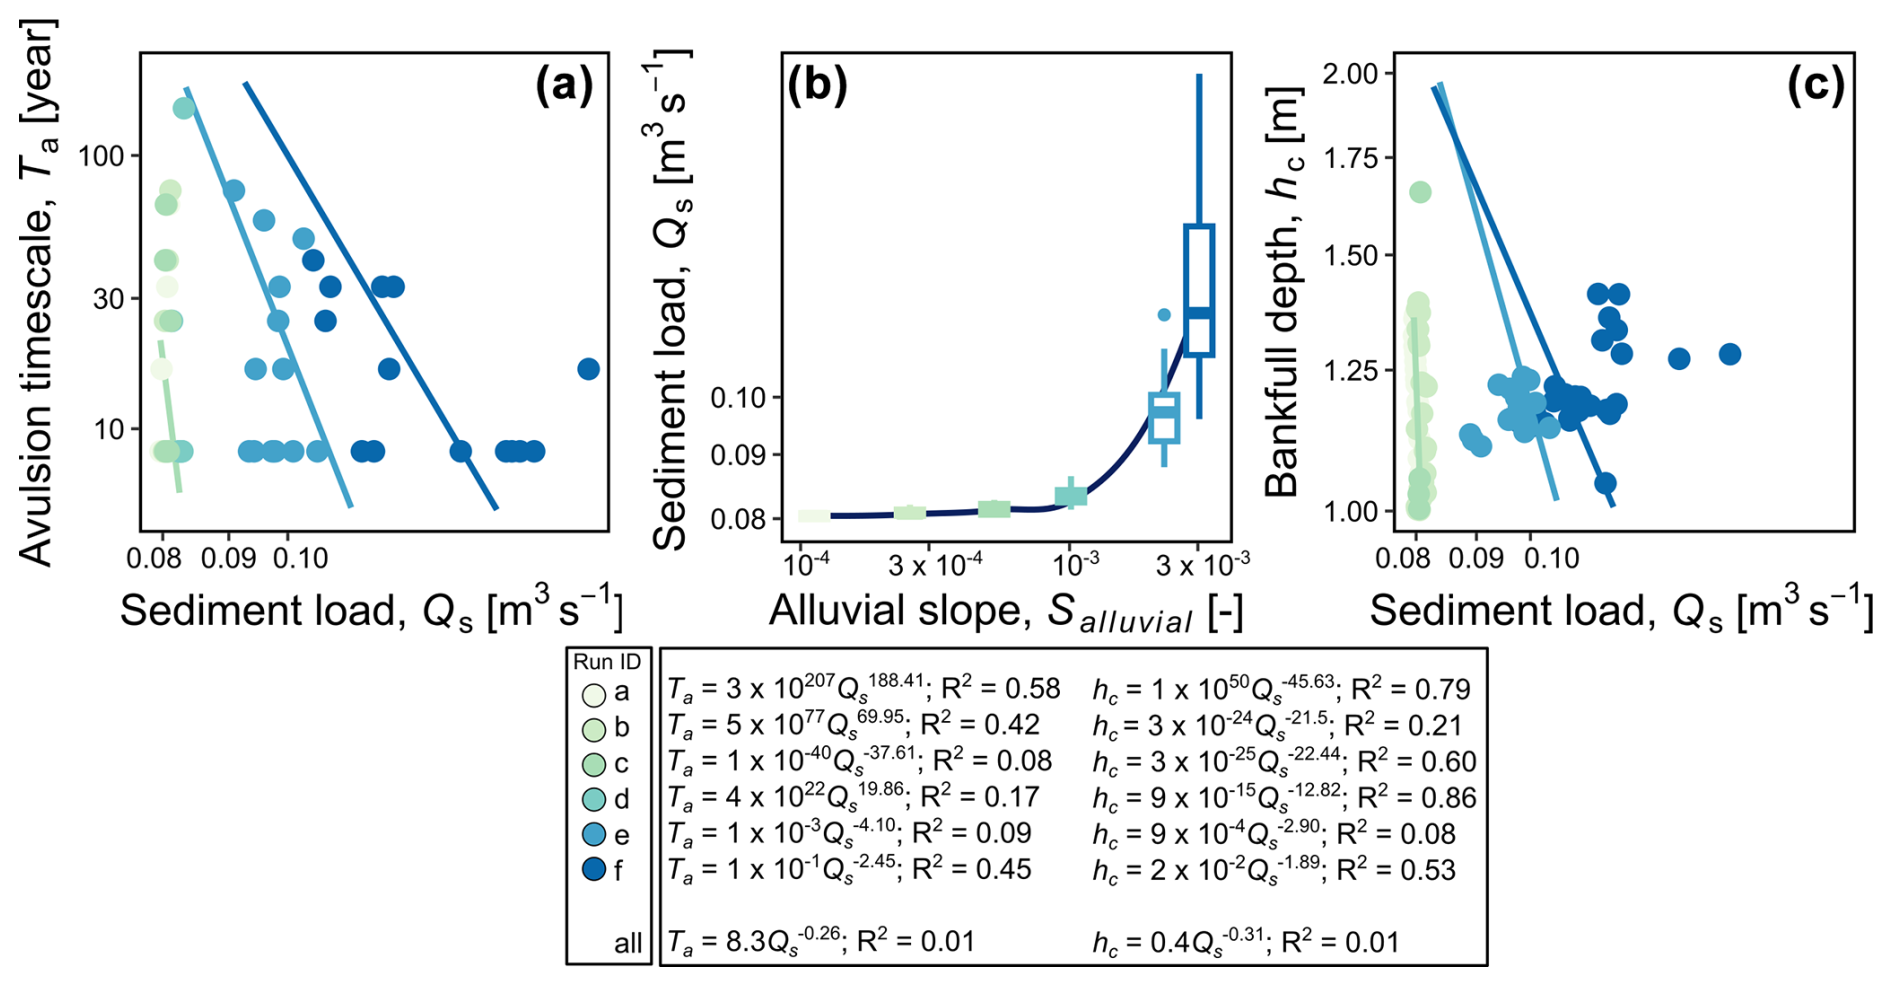
Figure 5Ordinary least-squares log–log regressions and power function equations between avulsion timescale and sediment load (a), sediment load and initial alluvial slope (b), and bankfull depth and sediment load (c) measured from the model (N=62) plotted on a log–log scale.
We consider that results from our analytical–numerical model and natural–physical laboratory deltas are directly comparable, but care is needed in their interpretation. The analytical calculations are for fixed values of input variables, and field data are snapshots assumed to represent equilibria. Conditions change during our numerical model runs, and topset slopes reduce through time (Fig. S4a), which would be expected to lead to an increase in avulsion timescale as the delta grows. This results from gentler topset slopes having reduced transport capacities, which reduces the sediment flux, so reducing the in-channel aggradation rate as explained before (Fig. 6a). Similarly, as bankfull depth is also calculated based on the topset slope value (Eq. 1), disagreement between analytical and numerical model results is expected (Fig. 6b). Moreover, delta lobe width (B) and avulsion length (La) in the original analytical solution are assumed to be constant with B=40Bc and (Chadwick et al., 2020). As we found that delta lobe width (B) and avulsion length (La) grow through time (Fig. S4b, c) in our numerical model, analytical model assumptions lead to this disagreement (Fig. 6c, d). Compilation of our numerical model with natural and physical laboratory deltas shows that avulsion becomes less frequent in a larger delta (Fig. 6c, d).
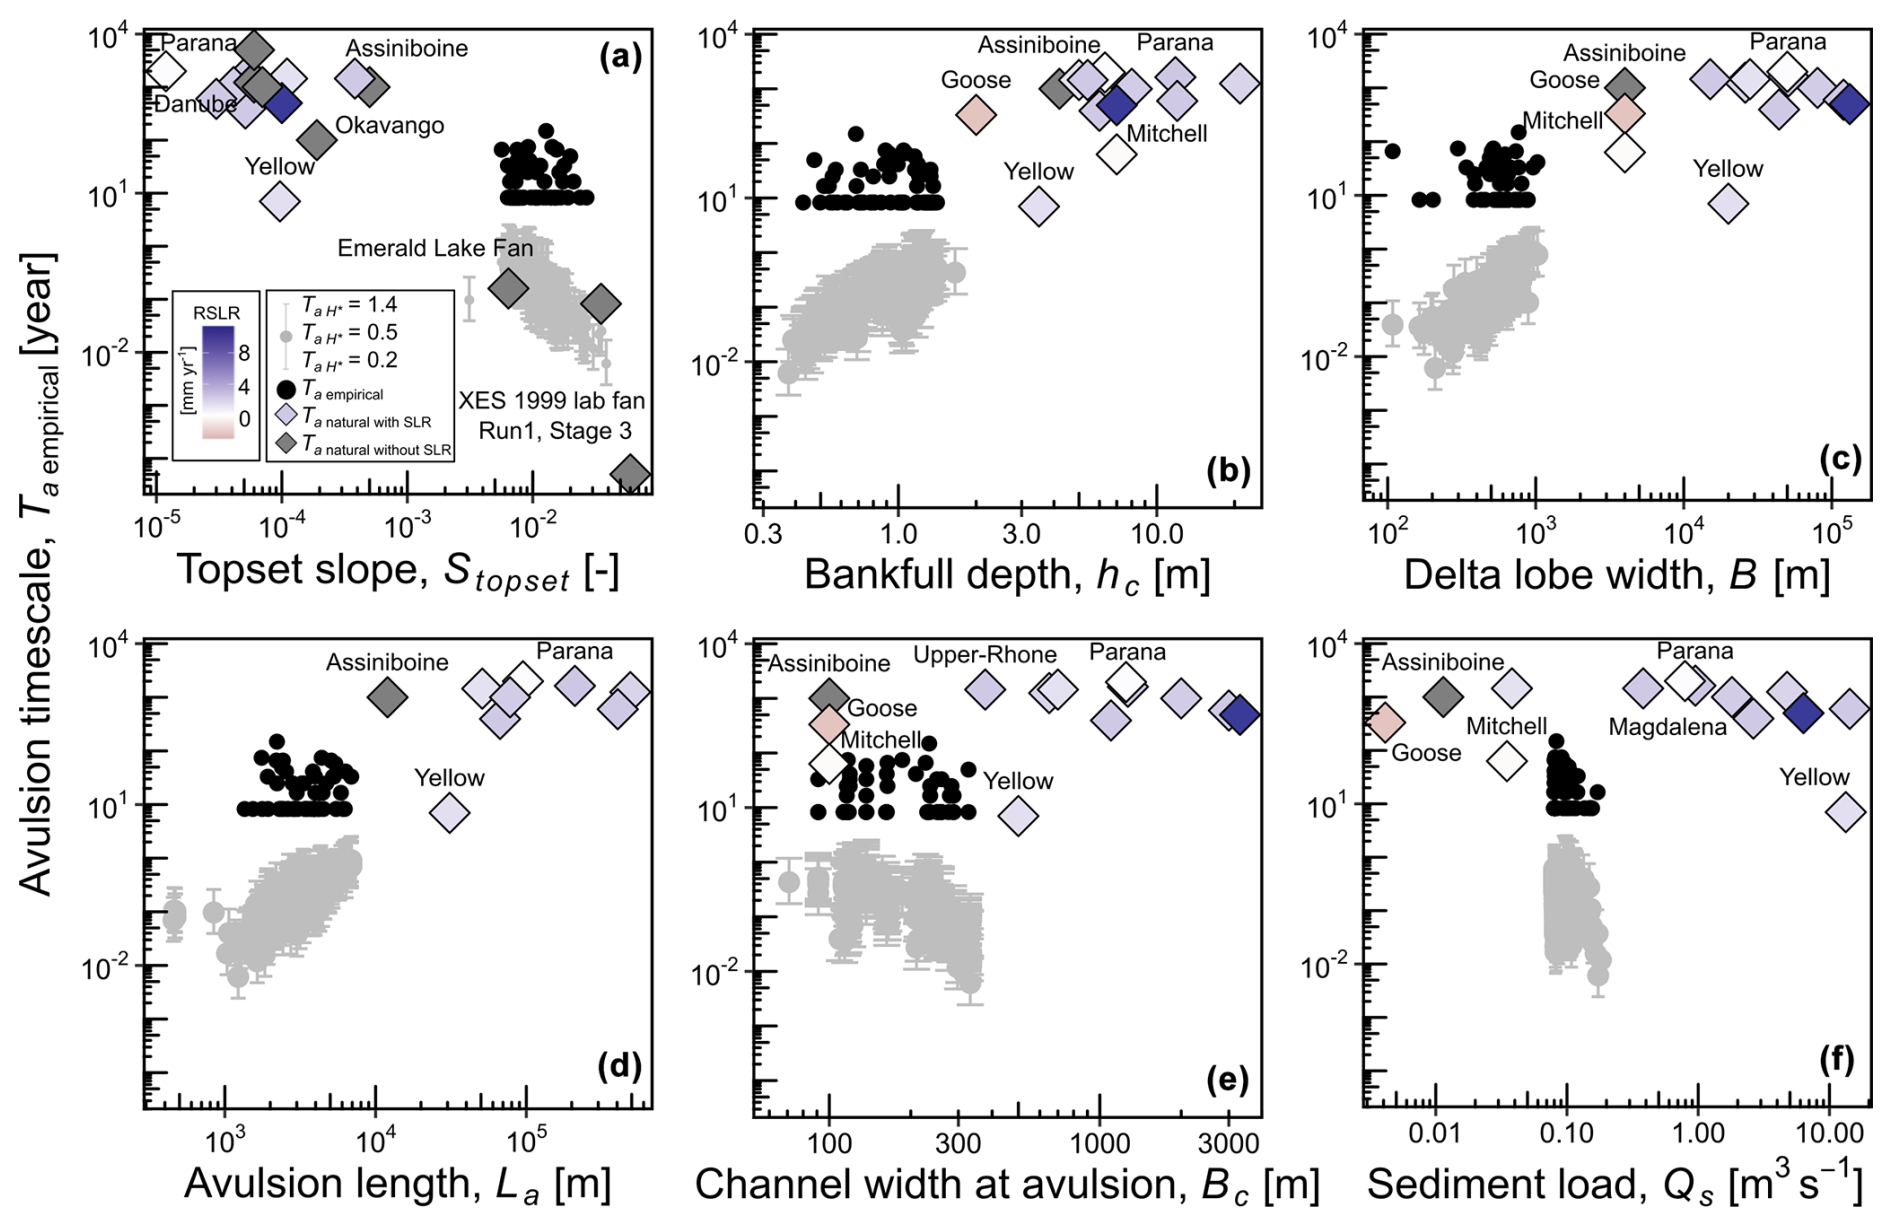
Figure 6Relationships between avulsion timescales and independent variables: (a) topset slope, (b) bankfull depth, (c) delta lobe width, (d) avulsion length, (e) channel width at avulsion, and (f) sediment load. The plots show model values (Ta empirical) as solid black circles. Grey dots and bars are results from the analytical equations using three avulsion threshold H* values (, , . Diamonds are results from natural and laboratory deltas: grey diamonds indicate examples for which no information about their relative sea-level changes is available; purple diamonds are for deltas with relative sea-level rise (RSLR; mm yr−1) colour-coded as shown. Data from natural deltas and the laboratory experiment are available in Table S2.
The negative correlation between Qs and Ta from our numerical model (Fig. 5a) deviates from empirical data gathered from natural deltas (Fig. 6f). Natural deltas have relatively larger delta plain sizes than our numerical models represented by avulsion length, bankfull depth, and delta lobe width values (Fig. 6b–d). Assuming no sediment bypass, we normalized sediment discharge to delta size by dividing Qs by (La.B/2) to obtain a vertical aggradation rate, η (m s−1). Vertical aggradation rate is then normalized by dividing it by shear velocity, (m s−1), as we are looking at a vertical aggradation rate related to transport capacity of flow, taken as a measure of the ability to remove sediment from a delta plain with no subsidence, η* (–). Using this dimensionless aggradation rate, Fig. 7a shows a non-linear negative correlation between Ta empirical and η* from both natural deltas and our models, supporting our argument on sediment discharge influence on avulsion timescale. The best-fit equation for this relationship is ln( (R2=0.71; p<0.05). At , the avulsion timescale becomes 0 (Fig. 7a), implying that, at very high aggradation rates with correspondingly high sediment loads, avulsion will effectively occur instantaneously on a delta plain, as the sediment will keep accumulating with very little being removed. Consequently, the flow becomes a random sheet of constant deposition, channel switching, and instantaneous avulsion.
On the other hand, the range of initial alluvial slopes used in the model, although based on observed slopes from 105 global deltas, does not cover the entire range of Qs inputs to natural deltas (Fig. 6f). Figure 7b shows that a significant increase in Qs (and a resultant decrease in avulsion timescale) would require the initial alluvial slope to be 6 times the initial downstream slope (Tables 1, 3). Further simulations, using a different initial downstream slope value or more varied slope ratios, could enable a larger range of Qs to be covered and hypothetically enable a closer agreement between natural deltas and numerical models (Fig. 6f).
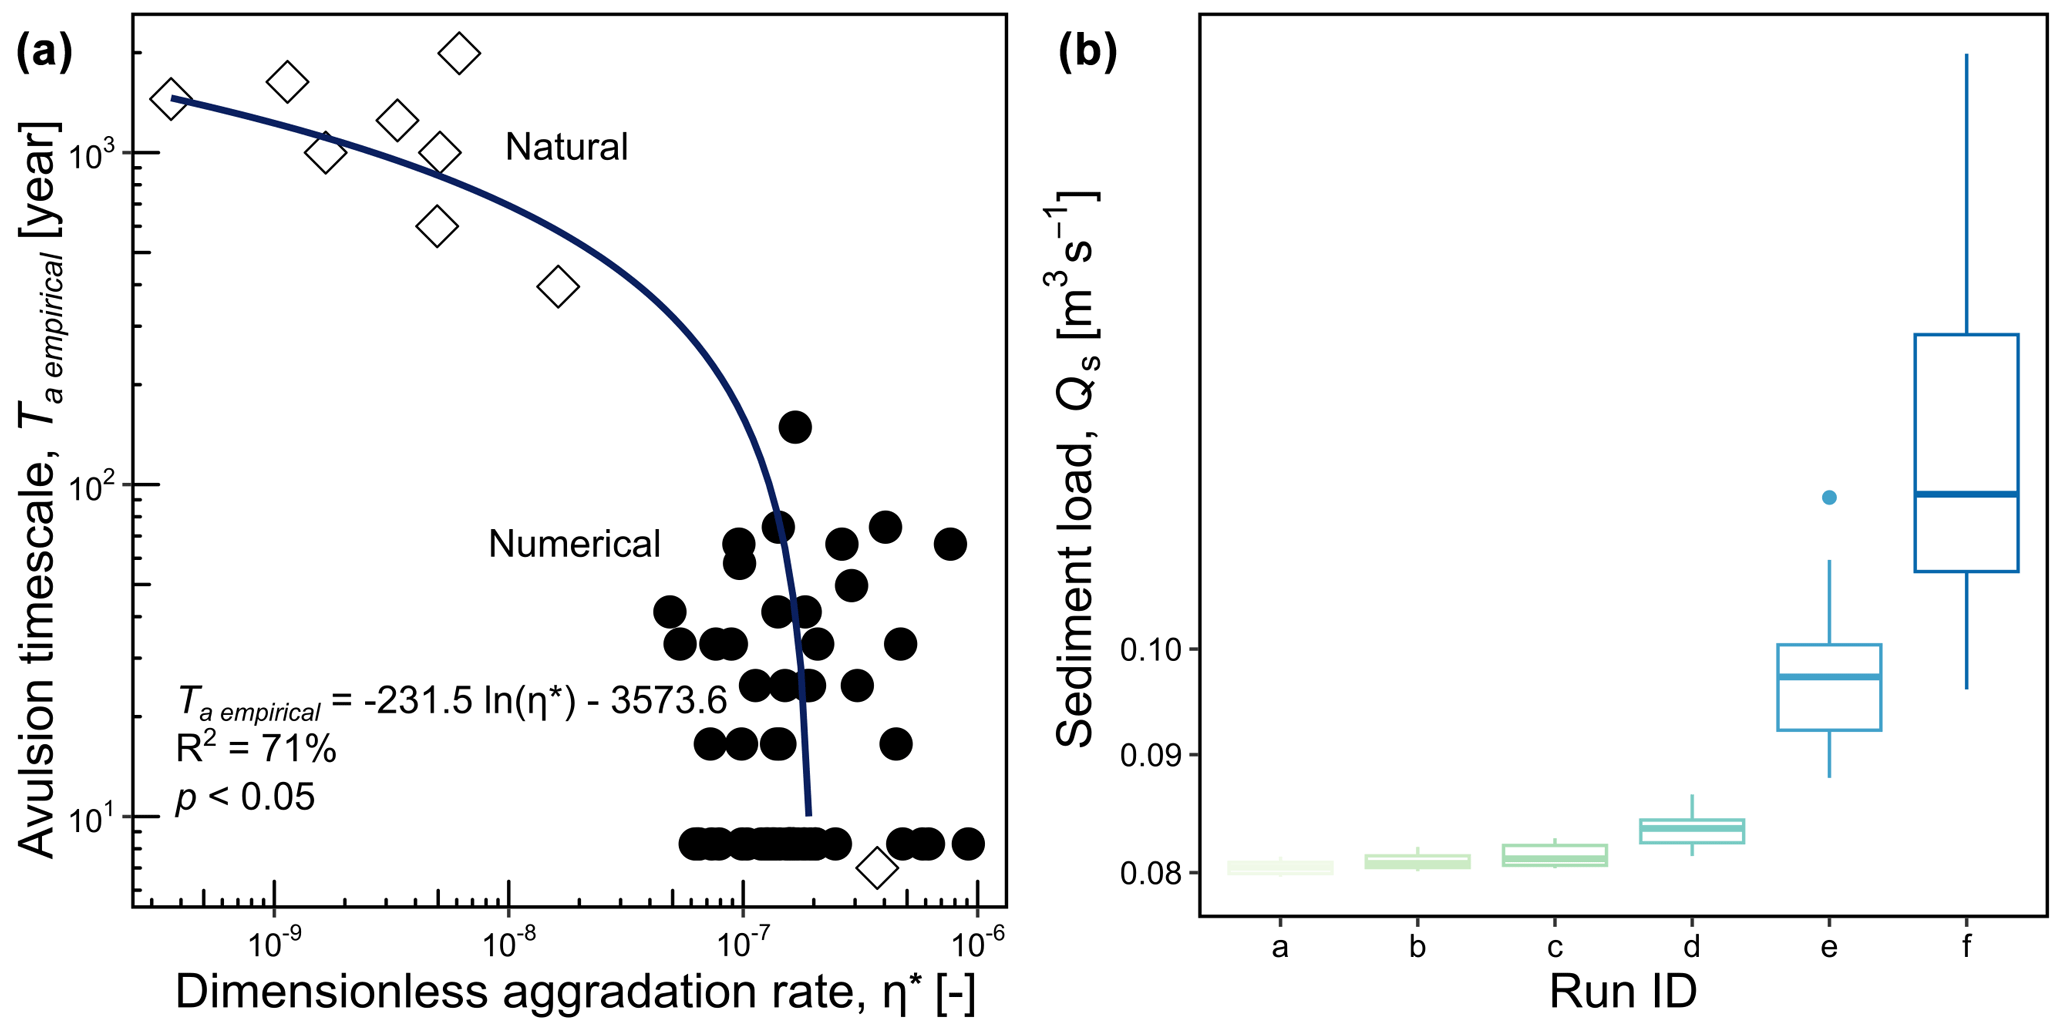
Figure 7(a) Relationship between avulsion timescale (Ta) and dimensionless aggradation rate (η*) observed from our natural deltas and our models. Regression lines are shown in blue. (b) Boxplots showing distribution of sediment load (Qs) for each scenario.
The bathymetry of the basin is defined at the beginning of our model runs (Fig. 1). The bathymetry adjusts during a model run to reach an equilibrium profile at a simulation time step > 3–6 d (Video S1). In comparison to other models, in which “reference profiles” and their evolution are defined by making assumptions (e.g. floodplain deposition is assumed to be equal to riverbed aggradation) (Chadwick et al., 2019; Moodie et al., 2019; Moran et al., 2017; Ratliff et al., 2018; Edmonds et al., 2022), our approach directly evaluates avulsion frequency and location that emerge from the physics of self-forming delta lobes. Avulsions in our models consistently arise from channel superelevation (Fig. 1c), consistent with our previous global empirical study (Prasojo et al., 2022).
The ratios between alluvial and topset slope gathered from natural deltas (Table 1) are assumed to be in dynamic equilibrium with the environmental conditions in our study. Even though most modern global deltas have developed since the early Holocene, inevitable natural and anthropogenic changes in boundary conditions, such as changes in sediment or water discharge and local sea-level rise, will have happened, and remain ongoing, during this period (Stanley and Warne, 1994). The slope data derived from remote sensing only represent a single snapshot of a slope that is constantly evolving towards equilibrium with boundary conditions. Consequently, our measured topset slopes from natural deltas may represent a transient condition rather than being equilibrium values. Repeating the work with different initial topset slope presents an opportunity for further investigation.
The avulsion timescales calculated for natural deltas (Ta natural) do not correlate well with the rate of relative sea-level rise (RSLR) (Figs. 6a–f and S5) (Chadwick et al., 2020). As our deltas are self-formed and evolve throughout the simulations, avulsion and backwater lengths (as a function of topset slope; Eq. 1) also grow linearly, and each scenario has a unique avulsion–backwater length ratio (Fig. S6), rather than being constant as previously observed (Ganti et al., 2016b; Chatanantavet et al., 2012). Despite downstream control (e.g. sea-level rise (SLR), backwater length) not being systematically tested in our modelling, empirical correlations between avulsion timescale–SLR (Fig. S5) and avulsion–backwater length (Fig. S6) observed from our numerical models and natural deltas may support our upstream control on delta avulsion hypothesis. We observe that the frequency of avulsions may be unaffected by sea-level rise, as also found in an earlier numerical model study (Ratliff et al., 2021) and a global empirical study (Colombera and Mountney, 2023). Consequently, we propose that avulsion frequency and location are dominated by upstream forcing (i.e. alluvial slope or catchment sediment supply; Figs. 4–7a) (Prasojo et al., 2022) rather than downstream forcing by sea-level rise or backwater effects (Fig. S6) (Chadwick et al., 2020; Chatanantavet et al., 2012; Ganti et al., 2016b). Avulsions in the proximal parts of deltas are controlled by upstream forcing, with RSLR and backwater hydraulics determining avulsion frequency only in distal zones.
Previous literature on the relationship between the frequency of avulsion and sea-level rise is somewhat equivocal. A field study conducted on the Mitchell River delta, Australia, found that avulsion frequency increases with sea-level fall (Lane et al., 2017). Numerical model results suggest that avulsions on the Mississippi (faster) and Trinity (slower) rivers showed different responses to Holocene sea-level rise even though they are geographically adjacent (Chatanantavet et al., 2012; Moran et al., 2017). An example during sea-level fall from the Goose River delta, Canada, shows that avulsion frequency remained constant during this base-level adjustment (Nijhuis et al., 2015). In contrast, avulsion frequency in the Rhine–Meuse delta, the Netherlands, increased during the Holocene sea-level rise period (Törnqvist, 1994), possibly due to aggradation rate (va) being controlled by RSLR. Our experiments do not address this issue, and we propose that further investigations combining numerical and flume experiments that are based on observations from natural deltas may aid the resolution of this debate.
4.3 Implications for delta management
Our modelling results advance our understanding of how sediment input from the catchment regulates the timing of avulsions in river deltas. The complex hydraulic and sediment transport processes that lead to the correlation between alluvial slope and avulsion timescale are linked to sediment load, the rate of in-channel aggradation, and how rapidly channels become perched. Consequently, with the increase in anthropogenic forcing both directly within river deltas and throughout upstream catchment areas (Best, 2019; Darby et al., 2015; Dunn et al., 2019; Hackney et al., 2020), river delta managers can use sediment load management to reduce the risk of avulsion-driven flooding.
However, finding a perfect balance between reducing avulsion frequency, maintaining the sediment load required to nourish delta environments and to hinder deltas' risk from subsidence and coastal erosion, is challenging. In some locations, deforestation that increases sediment supply is responsible for ∼ 25 % of net land gain on global deltas, which may also hasten future avulsions (Nienhuis et al., 2020). Conversely, river impoundment is responsible for a more than 50 % reduction in sediment delivery to the global ocean since 1950, collectively leading to a loss in delta land of 127±8.3 km2 annually over the 30 years from 1980–2010 (Nienhuis et al., 2020). This declining sediment input not only poses threats to the long-term sustainability of deltas but also renders them susceptible to adverse effects from rising sea levels and ecological degradation due to sediment starvation and saltwater ingress (Jordan et al., 2019). Therefore, gaining insights into the distribution patterns and quantities of sediments in deltas is imperative to ensure their continued sustainability.
4.4 Next steps
An important extension of this modelling work is to have more varied Stopset : Salluvial ratios, water discharge (Q), and sediment load (Qs), as variability in these may affect the geomorphic processes controlling avulsion timescale. Moreover, investigation using scenarios based on sets of geological variables that control slopes, rather than varying the slopes themselves, will be regarded as valuable. Multi-temporal observation of well-studied natural river deltas, such as the Yellow (Moodie et al., 2019), Mississippi (Chamberlain et al., 2018), or Rhine–Meuse (Pierik et al., 2018) deltas, could then be used to validate model results. On the other hand, incorporating other variables, such as grain size and sediment cohesion, forcing through sea-level rise and subsidence, varying basin geometry, and adding vegetation that controls crevassing and consequently increases avulsion timescale in future numerical modelling, should be considered and are already in other studies (Nienhuis et al., 2018a; Pierik et al., 2023; Sanks et al., 2022; Wolinsky et al., 2010). In particular, considering the importance of projected global sea-level changes and the variability in results reported in the literature, a better understanding of sea-level rise impacts on delta avulsion is needed.
We have used a simplified modelling approach and have isolated one predictor variable while holding other factors constant. Observations of the processes and evolution in the numerical deltas show the complexity of hydraulic and morphodynamic processes across delta plains. Future work will need to address this complexity by answering the following questions. (a) How does the forcing studied here (alluvial slope and consequent sediment input) interact with a combination of other factors (e.g. sea level, wave and tidal regimes, and anthropogenic effects)? (b) How do the other controls (e.g. Qs, Q, riverbank material, vegetation) in river deltas influence avulsion timescales? (c) How might these avulsion signals be preserved or shredded in the rock record?
We conducted a suite of numerical morphodynamic modelling experiments with variable river alluvial slopes (from to ) to understand the controls over avulsion location and timescale in a river delta. Sediment load, which in this study was controlled by the imposed alluvial slope upstream of a delta plain, controls the avulsion timescale. Mechanistically, when channel width is constant, a steeper alluvial slope has a greater sediment transport capacity. Consequently, a steeper alluvial slope may transport a larger sediment load to be delivered to a delta plain. This induces accelerated vertical aggradation that causes more frequent avulsion in our model. Integrating our numerical modelling results with analytical, natural, and physical laboratory deltas supports the hypothesis of upstream forcing influencing delta avulsion timescale and location, rather than downstream influence by backwater length or sea-level rise. However, our model has several limitations, such as dynamic equilibrium assumption from our alluvial–topset slope ratios, homogeneous initial topset slope adopted from Mississippi Delta, and constant discharge applied in the model, along with factors that were ignored (e.g. tectonics). Alluvial slope exerts a strong control on the timing of avulsion in river deltas and thus directly impacts (i) coastal and inland hazards on highly populated river deltas and (ii) the interpretation of deltaic sedimentary deposits.
The morphometric variables and avulsion timescales observed from our models are available in Table S1. The datasets from natural and laboratory river deltas used in this study (Table S2) and model scenarios (Run a–f) are available on the Figshare repository (https://doi.org/10.6084/m9.figshare.20654037.v3, https://doi.org/10.6084/m9.figshare.23912625.v2; Prasojo et al., 2023a, b).
Video S1 showing bed-level change as well as non-cohesive and cohesive sediment concentration distributions from Run a is available in the Figshare repository (Prasojo et al., 2024).
The supplement related to this article is available online at https://doi.org/10.5194/esurf-13-349-2025-supplement.
OAP, TBH, AO, and RDW conceptualized the study. OAP and TBH designed the Delft3D simulation. OAP collected the morphometrics from numerical models and natural deltas. OAP wrote the paper, and TBH, AO, and RDW reviewed it. All authors discussed the results and contributed to the final article.
The contact author has declared that none of the authors has any competing interests.
Publisher's note: Copernicus Publications remains neutral with regard to jurisdictional claims made in the text, published maps, institutional affiliations, or any other geographical representation in this paper. While Copernicus Publications makes every effort to include appropriate place names, the final responsibility lies with the authors.
We thank A.J.F. (Ton) Hoitink, Andrew Moodie, and the two referees (Luca Colombera and Stephan Toby), who contributed significantly to improving the quality of this article. For the purpose of open access, the authors have applied a Creative Commons Attribution (CC-BY) licence to any author accepted manuscript version arising from this submission.
This study was funded by an Indonesia Endowment Fund for Education (LPDP) awarded to Octria A. Prasojo (grant no. 201902220213875).
This paper was edited by Anne Baar and reviewed by Luca Colombera and Stephan Toby.
Aslan, A., Autin, W. J., and Blum, M. D.: Causes of river avulsion: Insights from the late Holocene avulsion history of the Mississippi River, U.S.A, J. Sediment. Res., 75, 650–664, https://doi.org/10.2110/jsr.2005.053, 2005.
Bagnold, R. A.: An Approach to the Sediment Transport Problem From General Physics, USGS Professional Paper 422-I, https://doi.org/10.3133/pp422i, 1966.
Bates, C. C.: Rational Theory of Delta Formation, AAPG Bulletin, 37, 2119–2162, https://doi.org/10.1306/5ceadd76-16bb-11d7-8645000102c1865d, 1953.
Best, J.: Anthropogenic stresses on the world's big rivers, Nat. Geosci., 12, 7–21, https://doi.org/10.1038/s41561-018-0262-x, 2019.
Brooke, S., Ganti, V., Chadwick, A. J., and Lamb, M. P.: Flood Variability Determines the Location of Lobe-Scale Avulsions on Deltas: Madagascar, Geophys. Res. Lett., 47, e2020GL088797, https://doi.org/10.1029/2020GL088797, 2020.
Brooke, S., Chadwick, A. J., Silvestre, J., Lamb, M. P., Edmonds, D. A., and Ganti, V.: Where rivers jump course, Science, 376, 987–990, https://doi.org10.1126/science.abm1215, 2022.
Caldwell, R. L. and Edmonds, D. A.: The effects of sediment properties on deltaic processes and morphologies: A numerical modeling study, J. Geophys. Res.-Earth Surf., 119, 961–982, https://doi.org/10.1002/2013JF002965, 2014.
Chadwick, A. J., Lamb, M. P., Moodie, A. J., Parker, G., and Nittrouer, J. A.: Origin of a Preferential Avulsion Node on Lowland River Deltas, Geophys. Res. Lett., 46, 4267–4277, https://doi.org/10.1029/2019GL082491, 2019.
Chadwick, A. J., Lamb, M. P., and Ganti, V.: Accelerated river avulsion frequency on lowland deltas due to sea-level rise, P. Natl. Acad. Sci. USA, 117, 17584–17590, https://doi.org/10.1073/pnas.1912351117, 2020.
Chamberlain, E. L., Törnqvist, T. E., Shen, Z., Mauz, B., and Wallinga, J.: Anatomy of Mississippi Delta growth and its implications for coastal restoration, Sci. Adv., 4, eaar4740, https://doi.org/10.1126/sciadv.aar4740, 2018.
Chatanantavet, P., Lamb, M. P., and Nittrouer, J. A.: Backwater controls of avulsion location on deltas, Geophys. Res. Lett., 39, 2–7, https://doi.org/10.1029/2011GL050197, 2012.
Colombera, L. and Mountney, N. P.: Downstream controls on coastal-plain river avulsions: A global study, J. Geophys. Res.-Earth Surf., 128, e2022JF006772, https://doi.org/10.1029/2022JF006772, 2023.
Darby, S. E., Dunn, F. E., Nicholls, R. J., Rahman, M., and Riddy, L.: A first look at the influence of anthropogenic climate change on the future delivery of fluvial sediment to the Ganges–Brahmaputra–Meghna delta, Environ. Sci. Process. Imp., 17, 1587–1600, https://doi.org/10.1039/C5EM00252D, 2015.
Dunn, F. E., Darby, S. E., Nicholls, R. J., Cohen, S., Zarfl, C., and Fekete, B. M.: Projections of declining fluvial sediment delivery to major deltas worldwide in response to climate change and anthropogenic stress, Environ. Res. Lett., 14, 084034, https://doi.org/10.1088/1748-9326/AB304E, 2019.
Dunne, T. and Leopold, L. B.: Water in Environmental Planning, W.H. Freeman and Company, San Francisco, California, https://www.osti.gov/biblio/5645848 (last access: 9 May 2025), 1978.
Deltares: Delft3D – User Manual, 3.15., Deltares, 1–695 pp., https://content.oss.deltares.nl/delft3d4/Delft3D-FLOW_User_Manual.pdf (last access: 3 May 2025), 2021.
Edmonds, D. A. and Slingerland, R. L.: Mechanics of river mouth bar formation: Implications for the morphodynamics of delta distributary networks, J. Geophys. Res.-Earth Surf., 112, F02034, https://doi.org/10.1029/2006JF000574, 2007.
Edmonds, D. A. and Slingerland, R. L.: Stability of delta distributary networks and their bifurcations, Water Resour. Res., 44, 9426, https://doi.org/10.1029/2008WR006992, 2008.
Edmonds, D. A. and Slingerland, R. L.: Significant effect of sediment cohesion on delta morphology, Nat. Geosci., 3, 105–109, https://doi.org/10.1038/ngeo730, 2010.
Edmonds, D. A., Hoyal, D. C. J. D., Sheets, B. A., and Slingerland, R. L.: Predicting delta avulsions: Implications for coastal wetland restoration, Geology, 37, 759–762, https://doi.org/10.1130/G25743A.1, 2009.
Edmonds, D. A., Paola, C., Hoyal, D. C. J. D., and Sheets, B. A.: Quantitative metrics that describe river deltas and their channel networks, J. Geophys. Res.-Earth Surf., 116, 1–15, https://doi.org/10.1029/2010JF001955, 2011.
Edmonds, D. A., Chadwick, A. J., Lamb, M. P., Lorenzo-Trueba, J., Murray, A. B., Nardin, W., Salter, G., and Shaw, J. B.: Morphodynamic Modeling of River-Dominated Deltas: A Review and Future Perspectives, Treatise on Geomorphology, 10, 110–140, https://doi.org/10.1016/B978-0-12-818234-5.00076-6, 2022.
Ericson, J. P., Vörösmarty, C. J., Dingman, S. L., Ward, L. G., and Meybeck, M.: Effective sea-level rise and deltas: Causes of change and human dimension implications, Glob/ Planet Change, 50, 63–82, https://doi.org/10.1016/j.gloplacha.2005.07.004, 2006.
Fagherazzi, S., Edmonds, D. A., Nardin, W., Leonardi, N., Canestrelli, A., Falcini, F., Jerolmack, D. J., Mariotti, G., Rowland, J. C., and Slingerland, R. L.: Dynamics of river mouth deposits, Rev. Geophys., 53, 642–672, https://doi.org/10.1002/2014RG000451, 2015.
Ganti, V., Chadwick, A. J., Hassenruck-Gudipati, H. J., and Lamb, M. P.: Avulsion cycles and their stratigraphic signature on an experimental backwater-controlled delta, J. Geophys. Res.-Earth Surf., 121, 1651–1675, https://doi.org/10.1002/2016JF003915, 2016a.
Ganti, V., Chadwick, A. J., Hassenruck-Gudipati, H. J., Fuller, B. M., and Lamb, M. P.: Experimental river delta size set by multiple floods and backwater hydrodynamics, Sci. Adv., 2, e1501768, https://doi.org/10.1126/sciadv.1501768, 2016b.
Ganti, V., Lamb, M. P., and Chadwick, A. J.: Autogenic Erosional Surfaces in Fluvio-deltaic Stratigraphy from Floods, Avulsions, and Backwater Hydrodynamics, J. Sediment. Res., 89, 815–832, https://doi.org/10.2110/jsr.2019.40, 2019.
Geleynse, N., Storms, J. E. A., Walstra, D. J. R., Jagers, H. R. A., Wang, Z. B., and Stive, M. J. F.: Controls on river delta formation; insights from numerical modelling, Earth Planet Sci. Lett., 302, 217–226, https://doi.org/10.1016/j.epsl.2010.12.013, 2011.
Giosan, L., Syvitski, J., Constantinescu, S., and Day, J.: Climate change: Protect the world's deltas, Nature, 516, 31–33, https://doi.org/10.1038/516031a, 2014.
Hackney, C. R., Darby, S. E., Parsons, D. R., Leyland, J., Best, J. L., Aalto, R., Nicholas, A. P., and Houseago, R. C.: River bank instability from unsustainable sand mining in the lower Mekong River, Nat. Sustain., 3, 217–225, https://doi.org/10.1038/s41893-019-0455-3, 2020.
Hartley, A. J., Weissmann, G. S., and Scuderi, L.: Controls on the apex location of large deltas, J. Geol. Soc. London, 174, 10–13, https://doi.org/10.1144/jgs2015-154, 2017.
Jerolmack, D. J.: Conceptual framework for assessing the response of delta channel networks to Holocene sea level rise, Quaternary Sci. Rev., 28, 1786–1800, https://doi.org/10.1016/j.quascirev.2009.02.015, 2009.
Jerolmack, D. J. and Mohrig, D.: Conditions for branching in depositional rives, Geology, 35, 463–466, https://doi.org/10.1130/G23308A.1, 2007.
Jones, L. S. and Schumm, S. A.: Causes of Avulsion: An Overview, Int. As. Sed., 169–178, https://doi.org/10.1002/9781444304213.CH13, 2009.
Jordan, C., Tiede, J., Lojek, O., Visscher, J., Apel, H., Nguyen, H. Q., Quang, C. N. X., and Schlurmann, T.: Sand mining in the Mekong Delta revisited – current scales of local sediment deficits, Sci. Rep., 9, 1–14, https://doi.org/10.1038/s41598-019-53804-z, 2019.
Kleinhans, M. G. and Hardy, R. J.: River bifurcations and avulsion, https://doi.org/10.1002/esp.3354, 15 March 2013.
Kleinhans, M. G., Ferguson, R. I., Lane, S. N., and Hardy, R. J.: Splitting rivers at their seams: bifurcations and avulsion, Earth Surf. Process. Landf., 38, 47–61, https://doi.org/10.1002/esp.3268, 2013.
Lane, T. I., Nanson, R. A., Vakarelov, B. K., Ainsworth, R. B., and Dashtgard, S. E.: Evolution and architectural styles of a forced-regressive Holocene delta and megafan, Mitchell River, Gulf of Carpentaria, Australia, Geol. Soc. Spec. Publ., 444, 305–334, https://doi.org/10.1144/SP444.9, 2017.
Leenman, A. and Eaton, B.: Mechanisms for avulsion on alluvial fans: Insights from high-frequency topographic data, Earth Surf. Process. Landf., 46, 1111–1127, https://doi.org/10.1002/esp.5059, 2021.
Leuven, J. R. F. W., Niesten, I., Huismans, Y., Cox, J. R., Hulsen, L., van der Kaaij, T., and Hoitink, A. J. F.: Peak Water Levels Rise Less Than Mean Sea Level in Tidal Channels Subject to Depth Convergence by Deepening, J. Geophys. Res.-Oceans, 128, e2022JC019578, https://doi.org/10.1029/2022JC019578, 2023.
Li, J., Ganti, V., Li, C., and Wei, H.: Upstream migration of avulsion sites on lowland deltas with river-mouth retreat, Earth Planet. Sci. Lett., 577, 117270, https://doi.org/10.1016/J.EPSL.2021.117270, 2022.
Loucks, D. P.: Developed river deltas: are they sustainable?, Environ. Res. Lett., 14, 113004, https://doi.org/10.1088/1748-9326/AB4165, 2019.
Mohrig, D., Heller, P. L., Paola, C., and Lyons, W. J.: Interpreting avulsion process from ancient alluvial sequences: Guadalope-Matarranya system (Northern Spain) and Wasatch formation (Western Colorado), B. Geol. Soc. Ame., 112, 1787–1803, https://doi.org/10.1130/0016-7606(2000)112<1787:IAPFAA>2.0.CO;2, 2000.
Moodie, A. J., Nittrouer, J. A., Ma, H., Carlson, B. N., Chadwick, A. J., Lamb, M. P., and Parker, G.: Modeling Deltaic Lobe-Building Cycles and Channel Avulsions for the Yellow River Delta, China, J. Geophys. Res.-Earth Surf., 124, 2438–2462, https://doi.org/10.1029/2019JF005220, 2019.
Moran, K. E., Nittrouer, J. A., Perillo, M. M., Lorenzo-Trueba, J., and Anderson, J. B.: Morphodynamic modeling of fluvial channel fill and avulsion time scales during early Holocene transgression, as substantiated by the incised valley stratigraphy of the Trinity River, Texas, J. Geophys. Res.-Earth Surf., 122, 215–234, https://doi.org/10.1002/2015JF003778, 2017.
Morgan, J. A., Kumar, N., Horner-Devine, A. R., Ahrendt, S., Istanbullouglu, E., and Bandaragoda, C.: The use of a morphological acceleration factor in the simulation of large-scale fluvial morphodynamics, Geomorphology, 356, 107088, https://doi.org/10.1016/J.GEOMORPH.2020.107088, 2020.
Muto, T.: Shoreline Autoretreat Substantiated in Flume Experiments, J. Sediment. Res., 71, 246–254, https://doi.org/10.1306/091400710246, 2001.
Muto, T. and Steel, R. J.: Principles of regression and transgression; the nature of the interplay between accommodation and sediment supply, J. Sediment. Res., 67, 994–1000, https://doi.org/10.1306/D42686A8-2B26-11D7-8648000102C1865D, 1997.
Nienhuis, J. H., Törnqvist, T. E., and Esposito, C. R.: Crevasse Splays Versus Avulsions: A Recipe for Land Building With Levee Breaches, Geophys. Res. Lett., 45, 4058–4067, https://doi.org/10.1029/2018GL077933, 2018a.
Nienhuis, J. H., Hoitink, A. J. F., and Törnqvist, T. E.: Future Change to Tide-Influenced Deltas, Geophys. Res. Lett., 45, 3499–3507, https://doi.org/doi.org/10.1029/2018GL077638, 2018b.
Nienhuis, J. H., Ashton, A. D., Edmonds, D. A., Hoitink, A. J. F., Kettner, A. J., Rowland, J. C., and Törnqvist, T. E.: Global-scale human impact on delta morphology has led to net land area gain, Nature, 577, 514–518, https://doi.org/10.1038/s41586-019-1905-9, 2020.
Nijhuis, A. G., Edmonds, D. A., Caldwell, R. L., Cederberg, J. A., Slingerland, R. L., Best, J. L., Parsons, D. R., and Robinson, R. A. J.: Fluvio-deltaic avulsions during relative sea-level fall, Geology, 43, 719–722, https://doi.org/10.1130/G36788.1, 2015.
Paola, C., Twilley, R. R., Edmonds, D. A., Kim, W., Mohrig, D., Parker, G., Viparelli, E., and Voller, V. R.: Natural Processes in Delta Restoration: Application to the Mississippi Delta, Annu. Rev. Mar. Sci., 3, 67–91, https://doi.org/10.1146/annurev-marine-120709-142856, 2011.
Parker, G., Wilcock, P. R., Paola, C., Dietrich, W. E., and Pitlick, J.: Physical basis for quasi-universal relations describing bankfull hydraulic geometry of single-thread gravel bed rivers, J. Geophys. Res.-Earth Surf., 112, F04005, https://doi.org/10.1029/2006JF000549, 2007.
Pierik, H. J., Stouthamer, E., Schuring, T., and Cohen, K. M.: Human-caused avulsion in the Rhine-Meuse delta before historic embankment (The Netherlands), Geology, 46, 935–938, https://doi.org/10.1130/G45188.1, 2018.
Pierik, H. J., Moree, J. I. M., van der Werf, K. M., Roelofs, L., Albernaz, M. B., Wilbers, A., van der Valk, B., van Dinter, M., Hoek, W. Z., de Haas, T., and Kleinhans, M. G.: Vegetation and peat accumulation steer Holocene tidal–fluvial basin filling and overbank sedimentation along the Old Rhine River, The Netherlands, Sedimentology, 70, 179–213, https://doi.org/10.1111/SED.13038, 2023.
Prasojo, O. A., Hoey, T. B., Owen, A., and Williams, R. D.: Slope break and avulsion locations scale consistently in global deltas, Geophys. Res. Lett., 49, e2021GL093656, https://doi.org/10.1029/2021GL093656, 2022.
Prasojo, O. A., Hoey, T. B., Owen, A., and Williams, R. D.: Supporting Information Table S2: First order controls of avulsion in river deltas, Figshare [data set], https://doi.org/10.6084/m9.figshare.20654037.v3, 2023a.
Prasojo, O. A., Hoey, T. B., Owen, A., and Williams, R. D.: Model runs: Influence of alluvial slope on avulsion in river deltas, Figshare [data set], https://doi.org/10.6084/m9.figshare.23912625.v2, 2023b.
Prasojo, O. A., Hoey, T. B., Owen, A., and Williams, R. D.: Alluvial slope influence on avulsion in river deltas – Run a simulation videos, Figshare [video], https://doi.org/10.6084/m9.figshare.25470505.v1, 2024.
Ratliff, K. M., Hutton, E. H. W., and Murray, A. B.: Exploring Wave and Sea-Level Rise Effects on Delta Morphodynamics With a Coupled River-Ocean Model, J. Geophys. Res.-Earth Surf., 123, 2887–2900, https://doi.org/10.1029/2018JF004757, 2018.
Ratliff, K. M., Hutton, E. W. H., and Murray, A. B.: Modeling long-term delta dynamics reveals persistent geometric river avulsion locations, Earth Planet. Sci. Lett., 559, 116786, https://doi.org/10.1016/j.epsl.2021.116786, 2021.
Reitz, M. D., Jerolmack, D. J., and Swenson, J. B.: Flooding and flow path selection on alluvial fans and deltas, Geophys. Res. Lett., 37, L06401, https://doi.org/10.1029/2009GL041985, 2010.
Rossi, V. M., Kim, W., López, J. L., Edmonds, D., Geleynse, N., Olariu, C., Steel, R. J., Hiatt, M., and Passalacqua, P.: Impact of tidal currents on delta-channel deepening, stratigraphic architecture, and sediment bypass beyond the shoreline, Geology, 44, 927–930, https://doi.org/10.1130/G38334.1, 2016.
Sanks, K. M., Zapp, S. M., Silvestre, J. R., Shaw, J. B., Dutt, R., and Straub, K. M.: Marsh Sedimentation Controls Delta Top Morphology, Slope, and Mass Balance, Geophys. Res. Lett., 49, e2022GL098513, https://doi.org/10.1029/2022GL098513, 2022.
Schumm, S., Mosley, M. P., and Weaver, W.: Experimental fluvial geomorphology, New York: John Wiley and Sons Inc., 431 pp., ISBN 0471830771, 1987.
Shields, M. R., Bianchi, T. S., Mohrig, D., Hutchings, J. A., Kenney, W. F., Kolker, A. S., and Curtis, J. H.: Carbon storage in the Mississippi River delta enhanced by environmental engineering, Nat. Geosci., 10, 846–851, https://doi.org/10.1038/ngeo3044, 2017.
Slingerland, R. and Smith, N. D.: River Avulsions and Their Deposits, Annu. Rev. Earth Planet Sci., 32, 257–285, https://doi.org/10.1146/annurev.earth.32.101802.120201, 2004.
Stanley, D. J. and Warne, A. G.: Worldwide initiation of Holocene marine deltas by deceleration of sea-level rise, Science, 265, 228–231, https://doi.org/10.1126/science.265.5169.228, 1994.
Stouthamer, E. and Berendsen, H. J. A.: Avulsion Frequency, Avulsion Duration, and Interavulsion Period of Holocene Channel Belts in the Rhine-Meuse Delta, The Netherlands, J. Sediment. Res., 71, 589–598, https://doi.org/10.1306/112100710589, 2001.
Syvitski, J. P. M. and Saito, Y.: Morphodynamics of deltas under the influence of humans, Glob. Planet Change, 57, 261–282, https://doi.org/10.1016/j.gloplacha.2006.12.001, 2007.
Syvitski, J. P. M., Kettner, A. J., Overeem, I., Hutton, E. W. H., Hannon, M. T., Brakenridge, G. R., Day, J., Vörösmarty, C., Saito, Y., Giosan, L., and Nicholls, R. J.: Sinking deltas due to human activities, Nat. Geosci., 2, 681–686, https://doi.org/10.1038/ngeo629, 2009.
Tessler, Z. D., Vorosmarty, C. J., Grossberg, M., Gladkova, I., Aizenman, H., Syvitski, J. P. M., and Foufoula-Georgiou, E.: Profiling risk and sustainability in coastal deltas of the world, Science, 349, 638–643, https://doi.org/10.1126/science.aab3574, 2015.
Törnqvist, T. E.: Middle and late Holocene avulsion history of the River Rhine (Rhine-Meuse delta, Netherlands), Geology, 22, 711–714, 1994.
Van Dijk, M., Kleinhans, M., Postma, G., and Kraal, E.: Contrasting morphodynamics in alluvial fans and fan deltas: effect of the downstream boundary, Sedimentology, 59, 2125–2145, https://doi.org/10.1111/j.1365-3091.2012.01337.x, 2012.
Wallace, D. J., Storms, J. E. A., Wallinga, J., Dam, R. L. V. A. N., Blaauw, M., Derksen, M. S., Klerks, C. J. W., Meijneken, C., Snijders, E. L. S. M. A., Fung, G., Mathematics, A., Talbot, N. L. C., Mcsherry, F., Nissim, K., Smith, A., Syvitski, J. P. M., Kettner, A. J., Overeem, I., Hutton, E. W. H., Hannon, M. T., Brakenridge, G. R., Day, J. W., Vörösmarty, C., Saito, Y., Giosan, L., Nicholls, R. J., Stanley, D., Imminent, A. N., To, T., Popul, C., Syvitski, J. P. M., Fabris, M., Achilli, V., Menin, A., Erban, L. E., Gorelick, S. M., Zebker, H. A., Sea, E., Rise, L., Cavalié, O., Sladen, A., Kelner, M., Nice, U. De, Antipolis, S., De, O., Einstein, A., Reed, D. J., and Day, J. W.: Shrinking and Sinking Deltas: Major role of Dams in delta subsidence and Effective Sea Level Rise, Nat. Geosci., 123, 1973–1984, https://doi.org/10.1038/ngeo129, 2014.
Whipple, K. X., Parker, G., Paola, C., and Mohrig, D.: Channel dynamics, sediment transport, and the slope of alluvial fans: Experimental study, J. Geol., 106, 677–693, https://doi.org/10.1086/516053, 1998.
Williams, R. D., Measures, R., Hicks, D. M., and Brasington, J.: Assessment of a numerical model to reproduce event-scale erosion and deposition distributions in a braided river, Water Resour. Res., 52, 6621–6642, https://doi.org/10.1002/2015WR018491, 2016.
Wolinsky, M. A., Edmonds, D. A., Martin, J., and Paola, C.: Delta allometry: Growth laws for river deltas, Geophys. Res. Lett., 37, L21403, https://doi.org/10.1029/2010GL044592, 2010.
Wright, L. D.: Sediment transport and deposition at river mouths: A synthesis, B. Geol. Soc. Am., 88, 857–868, https://doi.org/10.1130/0016-7606(1977)88<857:STADAR>2.0.CO;2, 1977.