the Creative Commons Attribution 4.0 License.
the Creative Commons Attribution 4.0 License.
 | 15 May 2025
Sub-surface processes and heat fluxes at coarse blocky Murtèl rock glacier (Engadine, eastern Swiss Alps): seasonal ice and convective cooling render rock glaciers climate-robust
Dominik Amschwand
Jonas Wicky
Martin Scherler
Martin Hoelzle
Bernhard Krummenacher
Anna Haberkorn
Christian Kienholz
Hansueli Gubler
We measured sub-surface heat fluxes and calculated the energy budget of the coarse blocky active layer (AL) of Murtèl rock glacier, a seasonally snow-covered permafrost landform located in the eastern Swiss Alps. In the highly permeable AL, conductive/diffusive heat transfer, including thermal radiation, non-conductive heat transfer by air circulation (convection), and heat storage changes from seasonal build-up and melting of ground ice, shapes the ground thermal regime. Individual heat fluxes are quantified based on a novel in situ sensor array in the AL (operational from 2020–2023) and direct observations of the ground ice melt (in thaw seasons 2022–2024). The AL energy budget yields the first field-data-based quantitative estimate of the climate sensitivity of rock glaciers. The total Murtèl AL heat uptake during the thaw season has been increasing by 4–10 MJ m−2 per decade (4 %–11 % of the 2022 heat uptake of 94 MJ m−2), driven by earlier snow melt-out in June and increasingly hot and dry July–September periods. Two thaw-season processes render Murtèl rock glacier comparatively climate-robust. First, the AL intercepts ∼70 % (55–85 MJ m−2) of the thaw-season ground heat flux by melting ground ice that runs off as meltwater, ∼20 % (10–20 MJ m−2) is spent on heating the blocks, and only ∼10 % (7–13 MJ m−2) is transferred into the permafrost body beneath and causes slow permafrost degradation. Second, the effective thermal conductivity in the ventilated AL increases from under strongly stable temperature gradients (weak warming) to episodically over under unstable temperature gradients (strong cooling), favouring convective cooling by buoyancy-driven Rayleigh ventilation (thermal semiconductor effect). In winter, radiatively cooled air infiltrating through a discontinuous, semi-closed snow cover leads to strong AL cooling. The two characteristic parameters (effective thermal conductivity and intrinsic permeability) are sensitive to debris texture; hence the two undercooling processes are specific to highly permeable coarse blocky material.
- Article
(14758 KB) - Full-text XML
- BibTeX
- EndNote


The deglaciating high mountains under climate change are now entering a transient phase characterised by strong disequilibria between cryospheric landscape components of differing climate sensitivity and adjustment timescales (Haeberli et al., 2017). Declining seasonal snowpacks (Gottlieb and Mankin, 2024) and vanishing glaciers (Hugonnet et al., 2021) react sensitively and rapidly to the ongoing climatic changes, while shifting vegetation patterns (Körner and Hiltbrunner, 2024) and permafrost warming and degradation (Biskaborn et al., 2019) lag behind. Emerging hazard chains and an altered high-mountain water cycle put ecosystems and communities in mountain areas and downstream lowlands under pressure to adapt (and perhaps to mitigate) (Hock et al., 2022; Hayashi, 2020). In the mountain cryosphere, ice-rich permafrost landforms overlain by a thick, coarse blocky debris layer stand out as the least sensitive, i.e. most robust, landforms, appearing as rock glaciers (Haeberli et al., 2006) and frozen talus slopes (Delaloye and Lambiel, 2005) that have been responding slowly to climate change. Note that we use the term “robust” in the sense of “climate-insensitive” (Schaffer and MacDonell, 2022) or “resistant to changes”, which is one aspect of resilience (Walker et al., 2004; Jorgenson et al., 2010).
Coarse blocky landforms benefit from specific processes that occur in the clast-supported coarse debris (decimetre-sized blocks, sparse fine material), collectively known as undercooling processes (Wakonigg, 1996; Rist et al., 2003). Undercooling locally creates a stable ground thermal regime (microclimate) that is typically 1–5 °C colder than the surrounding fine-grained or bedrock terrain (Gorbunov et al., 2004; Harris et al., 1998) and can preserve permafrost conditions under otherwise unfavourable topo-climatic conditions (azonal permafrost) (Morard et al., 2010; Wicky and Hauck, 2020; Wicky et al., 2024). The effect of undercooling has been known for a long time from field investigations (Bächler, 1930; Wakonigg, 1996; Harris and Pedersen, 1998; Kneisel et al., 2000; Gorbunov et al., 2004; Delaloye and Lambiel, 2005; Sawada et al., 2003; Delaloye and Lambiel, 2005; Herz, 2006; Millar et al., 2014; Popescu et al., 2017b; Wagner et al., 2019) and arises from an interplay of several heat transfer and storage processes in a permeable buffer layer between the ground and atmosphere or seasonal snow cover (Johansen, 1975; Wakonigg, 1996). Exact processes have long remained elusive. Undercooling is specific to coarse blocky landforms that exhibit a high permeability, pointing at the key role of non-conductive heat transfer by airflow and ice build-up. Climate change has brought these “cold spots”, once known as local curiosities (Balch, 1900; Bächler, 1930; Trüssel, 2013), to the attention of scientists (e.g. hydrologists (Schaffer et al., 2019; Schaffer and MacDonell, 2022; Navarro et al., 2023) and ecologists (Růžička et al., 2012)) and engineers (e.g. artificial passive ground cooling, Guodong, 2005). By storing frozen and liquid water at seasonal timescales (Jones et al., 2019; Wagner et al., 2021), the hydrological buffer capacity of undercooled permafrost landforms will increasingly contribute to reliable baseflow during droughts, sustaining “icy seeps” (Tronstad et al., 2016) and wet meadows (Reato et al., 2021), which are refugia for cold-adapted species (Millar et al., 2015; Brighenti et al., 2021). Nonetheless, despite the cold microclimate within their active layer (AL), even these robust undercooled permafrost landforms are not exempt from slow degradation, as exemplarily shown by the Alpine-wide warming (Noetzli and Pellet, 2023), ice loss (Morard et al., 2024), synchronous acceleration (Delaloye et al., 2010; Kellerer-Pirklbauer and Kaufmann, 2012), and in some cases destabilisation (Roer et al., 2008; Marcer et al., 2021; Hartl et al., 2023) of rock glaciers. As our mountains enter uncharted territory, site-specific empirical relations might become invalid. We need quantitative process understanding to anticipate the changes.
On Murtèl rock glacier (Engadine, south-eastern Swiss Alps), undercooling heat transfer processes have been investigated for decades. Large seasonal deviations of the estimated surface energy balance (SEB) were attributed to unmeasured and insufficiently represented non-conductive sub-surface heat transfer processes in the AL (Hoelzle et al., 1999, 2001; Mittaz et al., 2000). The first field studies dedicated to the sub-surface (AL) heat transfer processes have been published by Hanson and Hoelzle (2004, 2005) based on their temperature measurements in the uppermost 90 cm of the AL and previous works (Oswald, 2004; Naguel, 1998). Important insights into the near-surface AL heat transfer processes and interaction with the snow cover have been gained, but the quantitative understanding was insufficient to reliably estimate heat fluxes. The thermal characterisation of the coarse blocky material with geophysical methods (electrical resistivity tomography, refraction seismic tomography) has been another important step towards AL heat transfer modelling (Schneider et al., 2012, 2013) and has been carried out by Scherler et al. (2014). Air circulation and convective heat transfer, long suspected to be the primary heat transfer process to shape the thermal regime in highly permeable coarse blocky debris, have been investigated in the field by Oswald (2004), Panz (2008), and Schneider (2014) and studied numerically by Wicky and Hauck (2017, 2020). In parallel, another important field study on the micro-climate of coarse blocky scree has been carried out by Herz et al. (2003a, b) and Herz (2006) in the Matter Valley (western Swiss Alps). They have described the heat transfer processes in detail and estimated heat fluxes and the thermal diffusivity but due to the lack of appropriate measurements could not verify them. One of the few comprehensive data sets beyond ground temperatures in mountain permafrost has been gathered by Rist and Phillips (2005) and Rist (2007). They deployed a heat flux plate, ultrasound probes, conductometers, vapour traps, and reflectometer probes to characterise the ground hydro-thermal regime of a steep, permafrost-underlain scree slope. To summarise, several heat transfer processes have been successfully simulated separately, for example buoyancy-driven air circulation (Wicky and Hauck, 2017, 2020), purely conductive processes from the interplay between a low-conductivity ground and snow cover (Gruber and Hoelzle, 2008), or the interplay between sensible and latent heat storage (Renette et al., 2023). However, few microclimatological studies have attempted to simultaneously parametrise all heat fluxes (Mittaz et al., 2000; Hoelzle et al., 2001, 2003; Stocker-Mittaz et al., 2002; Hoelzle and Gruber, 2008; Scherler et al., 2014), and few comprehensive sub-surface hydro-thermal measurements beyond ground temperatures exist in blocky mountain permafrost (Rist et al., 2003; Rist and Phillips, 2005). Also, AL properties like the thermal conductivity are poorly investigated for such coarse blocky material as that on Murtèl, where individual blocks have volumes of ∼0.1 m3 (up to 1–10 m3). Lacking better knowledge, empirical engineering relations developed for sand or gravel have often been extrapolated to such large blocks. Without in situ data, it is unclear whether such extrapolations are valid.
This work, a follow-up study of Amschwand et al. (2024), where we estimated the SEB, contributes to the quantitative process understanding of heat transfer in the AL of an undercooled, ventilated coarse blocky permafrost landform by presenting a unique data set gained from in situ measurements on Murtèl rock glacier. Our virtually unparalleled sub-surface measurements (except Rist and Phillips, 2005, to our knowledge) in the natural openings between the coarse blocks go beyond common ground temperature recordings and include humidity, airflow speed, thermal radiation, direct heat flux measurements, and stake measurements of the seasonally falling and rising ground ice table in the coarse blocky AL. We quantitatively describe the two main processes that give rise to the undercooling effect of permeable coarse blocky landforms, namely (i) seasonal build-up and melt of ground ice (seasonal ice turnover) and (ii) convective heat transfer (thermal semiconductor effect; Guodong et al., 2007). We constrain heat fluxes and heat transfer parameters (effective thermal conductivity) that can be carried into numerical permafrost models. Hence, this work provides insights into the capability and limits of the undercooling effect and the climate robustness of coarse blocky landforms.
The studied Murtèl rock glacier (WGS 84: 46°25′47′′ N, 9°49′15′′ E; CH1903+/LV95: 2 783 080, 1 144 820; 2620–2700 m a.s.l.; Fig. 1) is located in a north-facing periglacial area of Piz Corvatsch in the upper Engadine, a continental, rain-shadowed high valley in the eastern Swiss Alps. The mean annual air temperature (MAAT) is −1.7 °C, and the mean annual precipitation is ∼900 mm (Scherler et al., 2014). The tongue-shaped, single-unit (monomorphic sensu; Frauenfelder and Kääb, 2000), active rock glacier is surrounded by steep rock faces and is in direct connection with a talus slope (2700–2850 m a.s.l.) that is ∼250 m long and ∼150 m wide and advances slowly onto a permafrost-free, vegetated forefield thinly covered by glacial sediments (till veneer, few large boulders) (Schneider et al., 2013). Murtèl is located at the lower permafrost margin. Crescent-shaped furrows (∼3–5 m deep) and ridges with steep, in places near-vertical slopes dissect the overall gently north-north-westward-dipping surface (∼10–12°, <15°; Guodong et al., 2007) and create a pronounced furrow-and-ridge microtopography in the lowermost part of the rock glacier (Kääb et al., 1998). The snow cover is thicker and lasts longer in furrows than on ridges, influencing the ground thermal regime on a small scale (Bernhard et al., 1998; Keller and Gubler, 1993; Hoelzle et al., 2003). In the colder furrows, the otherwise 3–5 m thick, coarse-grained and clast-supported debris mantle is only ∼2 m thick. The ground ice table is accessible in a few places.
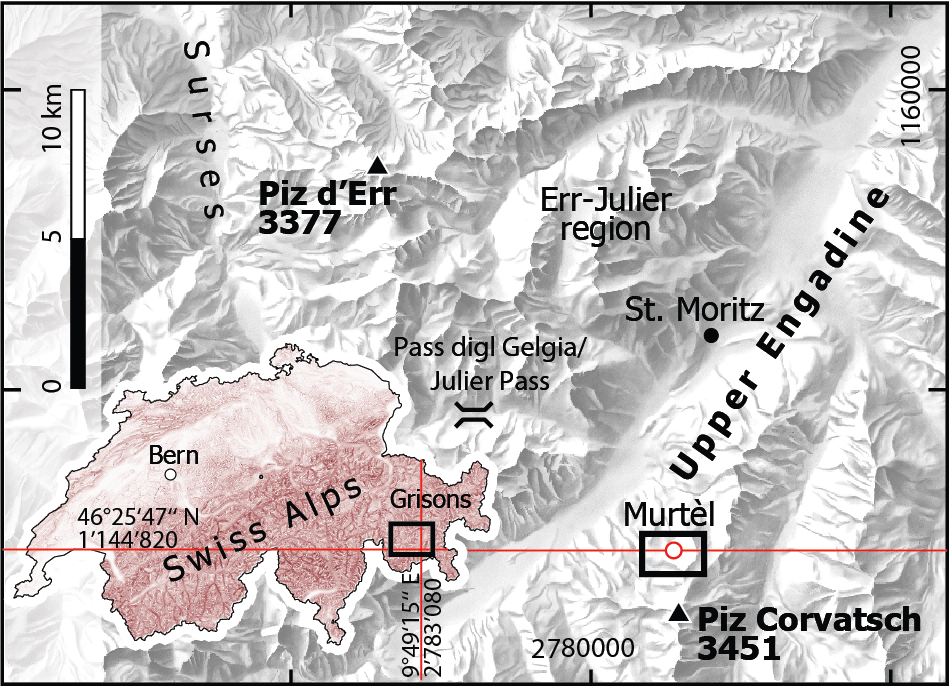
Figure 1Location of Murtèl rock glacier in the upper Engadine, a high valley in the eastern Swiss Alps (projection: LV95 Swiss coordinate system). Inset map: location and extent (black rectangle) of regional map within Switzerland (source: Swiss Federal Office of Topography swisstopo). Red northing and latitude lines correspond to the main and inset map, respectively.
The stratigraphy to a depth of 60 m is known from several boreholes (Vonder Mühll and Haeberli, 1990; Vonder Mühll, 1996; Arenson et al., 2002, 2010). The coarse blocky AL is 3 m thick on average (2–5 m) and consists of large blocks typically with edge lengths of 0.1 to 2 m (Scherler et al., 2014). A few boulders reach dimensions of ∼3–5 m. Fine material (≤ sand) is sparse near the surface, but its volume fraction varies laterally and increases with depth (inverse grading; Haeberli et al., 2006). The AL has a poor water retention capacity. Supra-permafrost water drains within hours to days at the AL base (Tenthorey and Gerber, 1991) and is not considered to significantly modify the ground thermal properties. The vast, connected pores create a high intrinsic permeability (Wicky and Hauck, 2020). Beneath the coarse blocky debris mantle, roughly coinciding with the thermally defined AL, lies the perennially frozen ice-supersaturated rock glacier core. Drill cores have revealed sand- and silt-bearing massive ice (3–28 m depth, ice content over 90 % vol.), although boreholes drilled within ∼30 m distance suggest some lateral small-scale heterogeneity (Vonder Mühll and Haeberli, 1990; Arenson et al., 2010).
3.1 Field observations and instrumentation
We use measurements from the PERMA-XT sensor cluster presented in Amschwand et al. (2024), where the above-surface sensors are described. Most of the below-surface sensors were installed in one natural cavity of the coarse blocky AL that was large enough for a human to enter and deep enough to come close to the AL base (Figs. 2, 3). This instrumented main cavity was completely destroyed by rockfall on 20 September 2023. A narrow passage covered by a large block (“lid”) leads into a spacious “main chamber”, with its “floor” at 2 m depth. A narrow extension reached a depth of 3 m. Its base was covered by wet, fine material (gravel, sand). The cavity in the clast-supported coarse blocky AL was enclosed by large blocks with voids in between, allowing air circulation. In August 2020, this comparatively large cavity (dimensions m) was instrumented with sensors to measure the temperature, humidity, thermal radiation, heat flux, and AL airflow speed at several depths down to 3 m. Detailed sensor specifications of the sub-surface sensors are given in Table 1, and the locations are shown in Fig. 3 and Table 2. One thermistor string was suspended in air (TK1), and another one (TK6) had its five thermistors drilled 5 cm into the blocks at depths corresponding to the TK1 thermistors. Relative humidity was measured at two levels, 0.7 (HV5/1) and 2.0 m (HV5/2) beneath the surface. Three thermo-anemometers recorded wind speed at three levels: close to the surface (WS/3 at −0.35 m), mid-cavity (WS/2 at −1.5 m), and in a narrow extension at depth (WS/1 at −2.1 m). A back-to-back pair of pyrgeometers mounted at mid-cavity level (CGR3 at −1.55 m) measured the upward and downward thermal radiation in the cavity. Two heat flux plates were cemented onto the rock surface, one at the underside of a near-surface block (HFP/2 at −1.1 m), another one on the cavity “floor” (HFP/1 at −2.0 m). Since accurate distances are required for the calculation of vertical gradients and fluxes, we triangulated the relative height of the sensors in the instrumented cavity with a Leica DISTO X310 laser distance meter and goniometer.
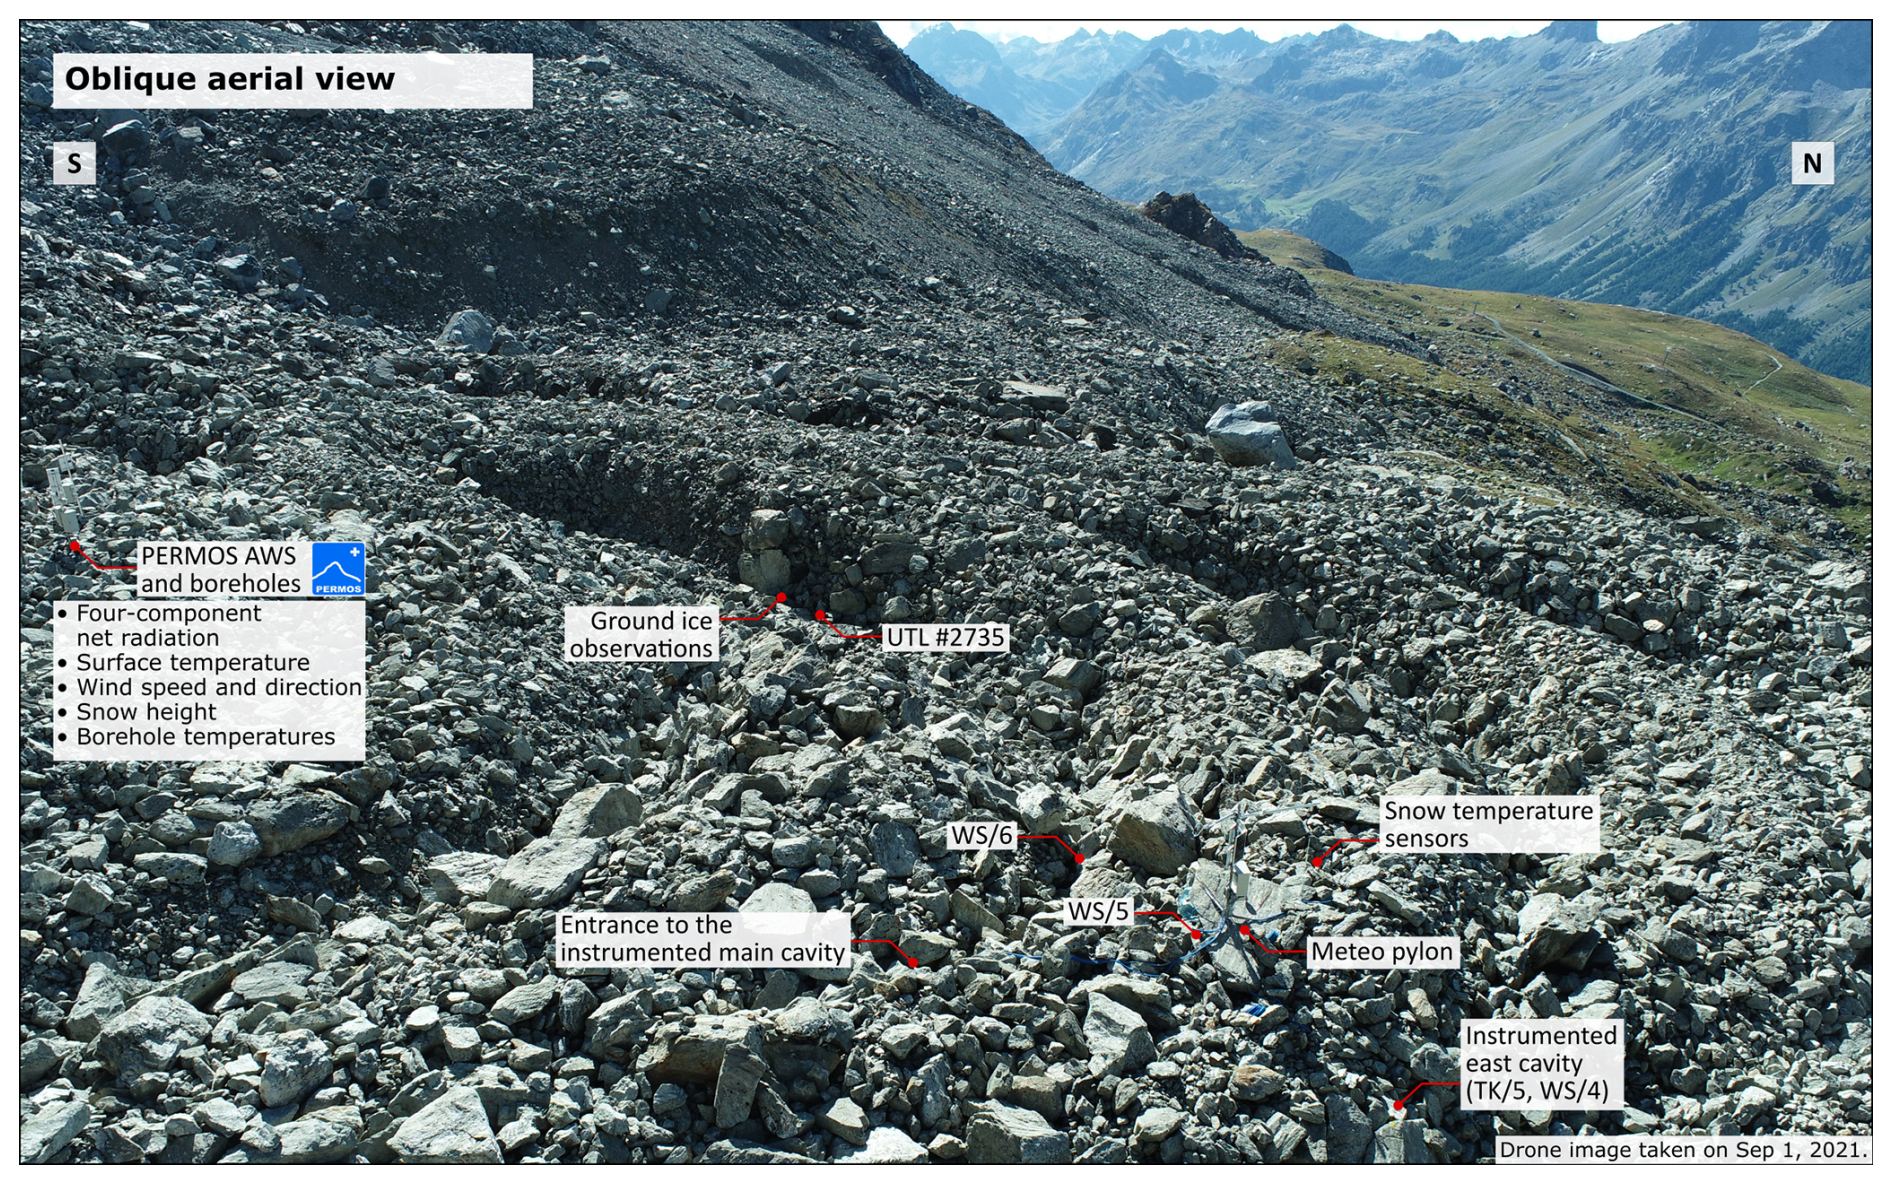
Figure 2Oblique aerial view of the Murtèl rock glacier (foreground) and location of the above-surface sensors and the ground ice observations in the rock glacier furrow.
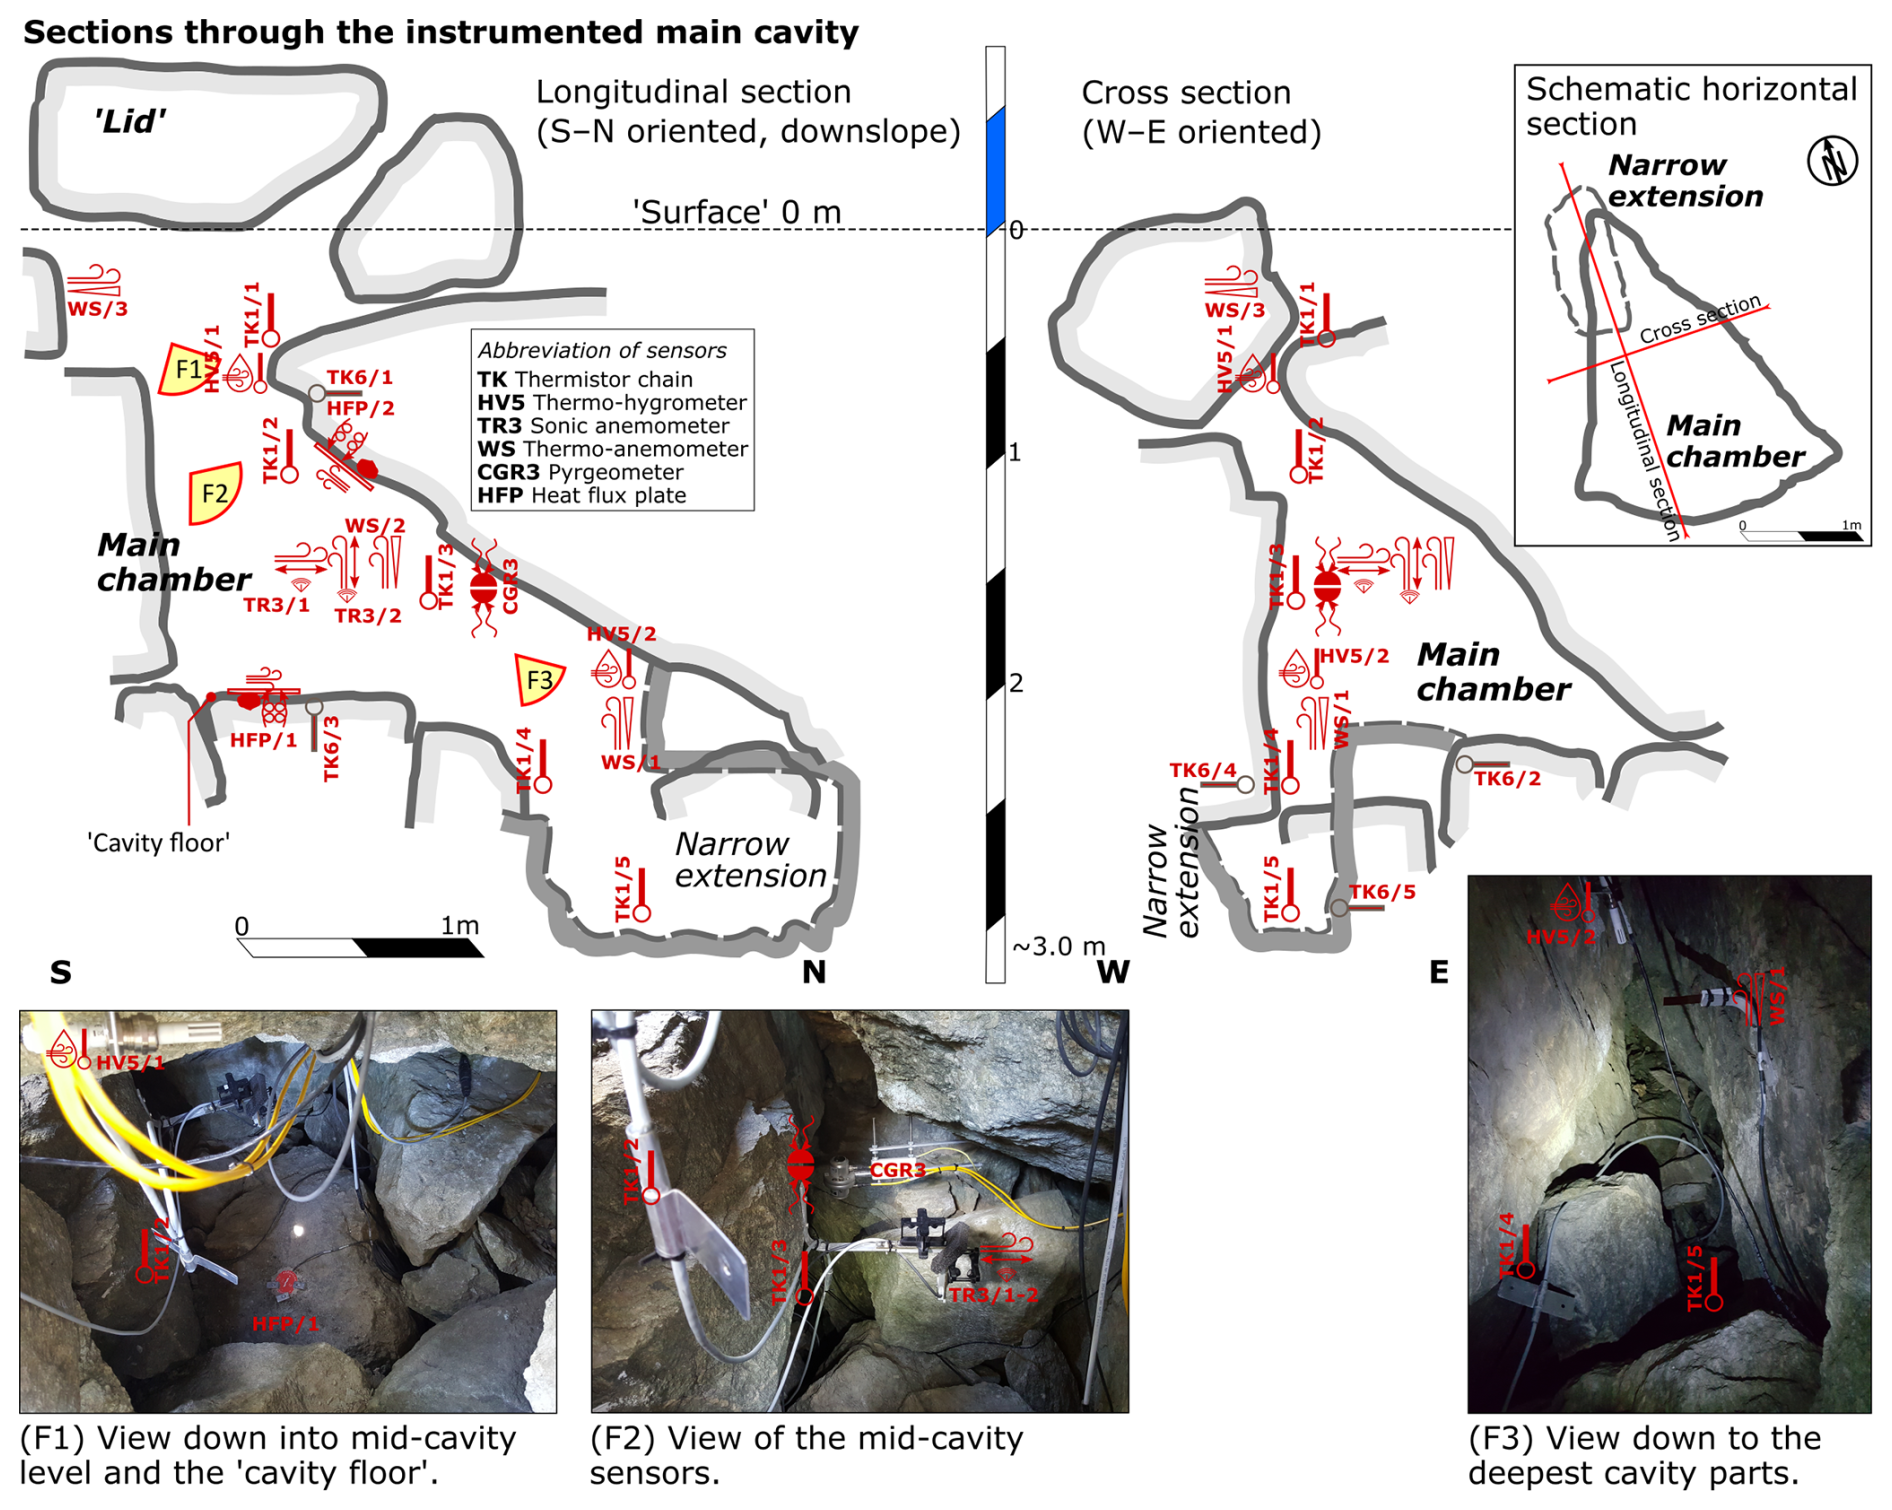
Figure 3Schematic sections and images of the instrumented main cavity with locations of the sensors.
Table 1PERMA-XT sub-surface sensor specifications.Measurement range and accuracy by manufacturer/vendor. The specifications of the PERMOS sensor are given in Scherler et al. (2014) and Hoelzle et al. (2022).
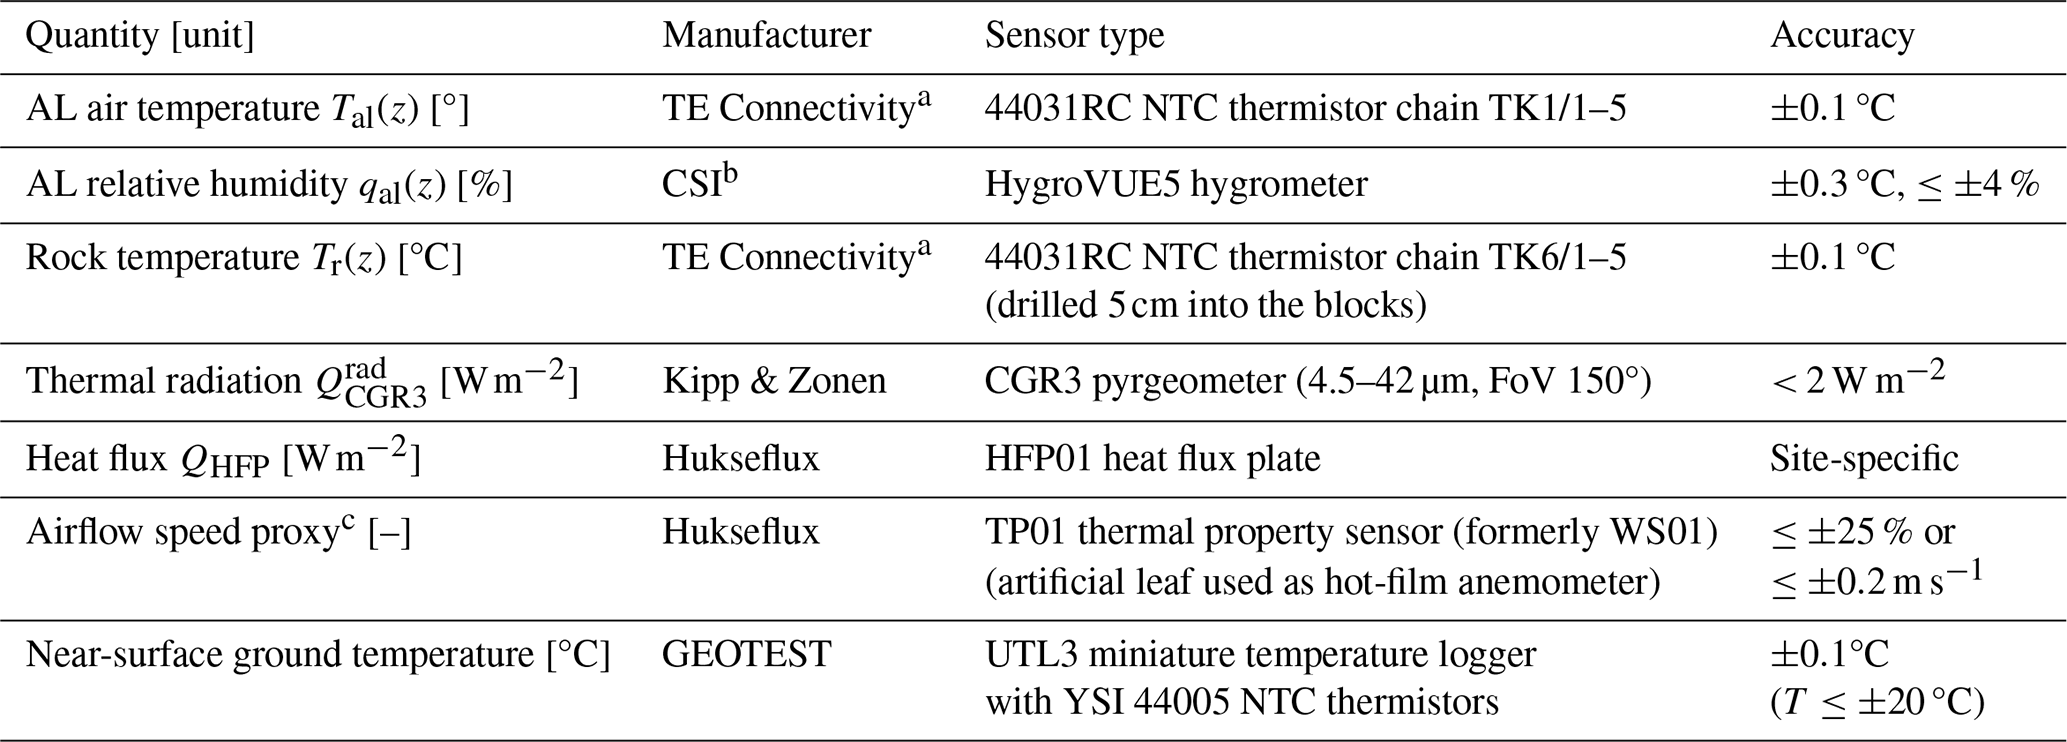
a Thermistor strings manufactured by Waljag GmbH. b CSI: Campbell Scientific, Inc.
Table 2PERMA-XT sub-surface sensor locations and approximate depth beneath the surface.
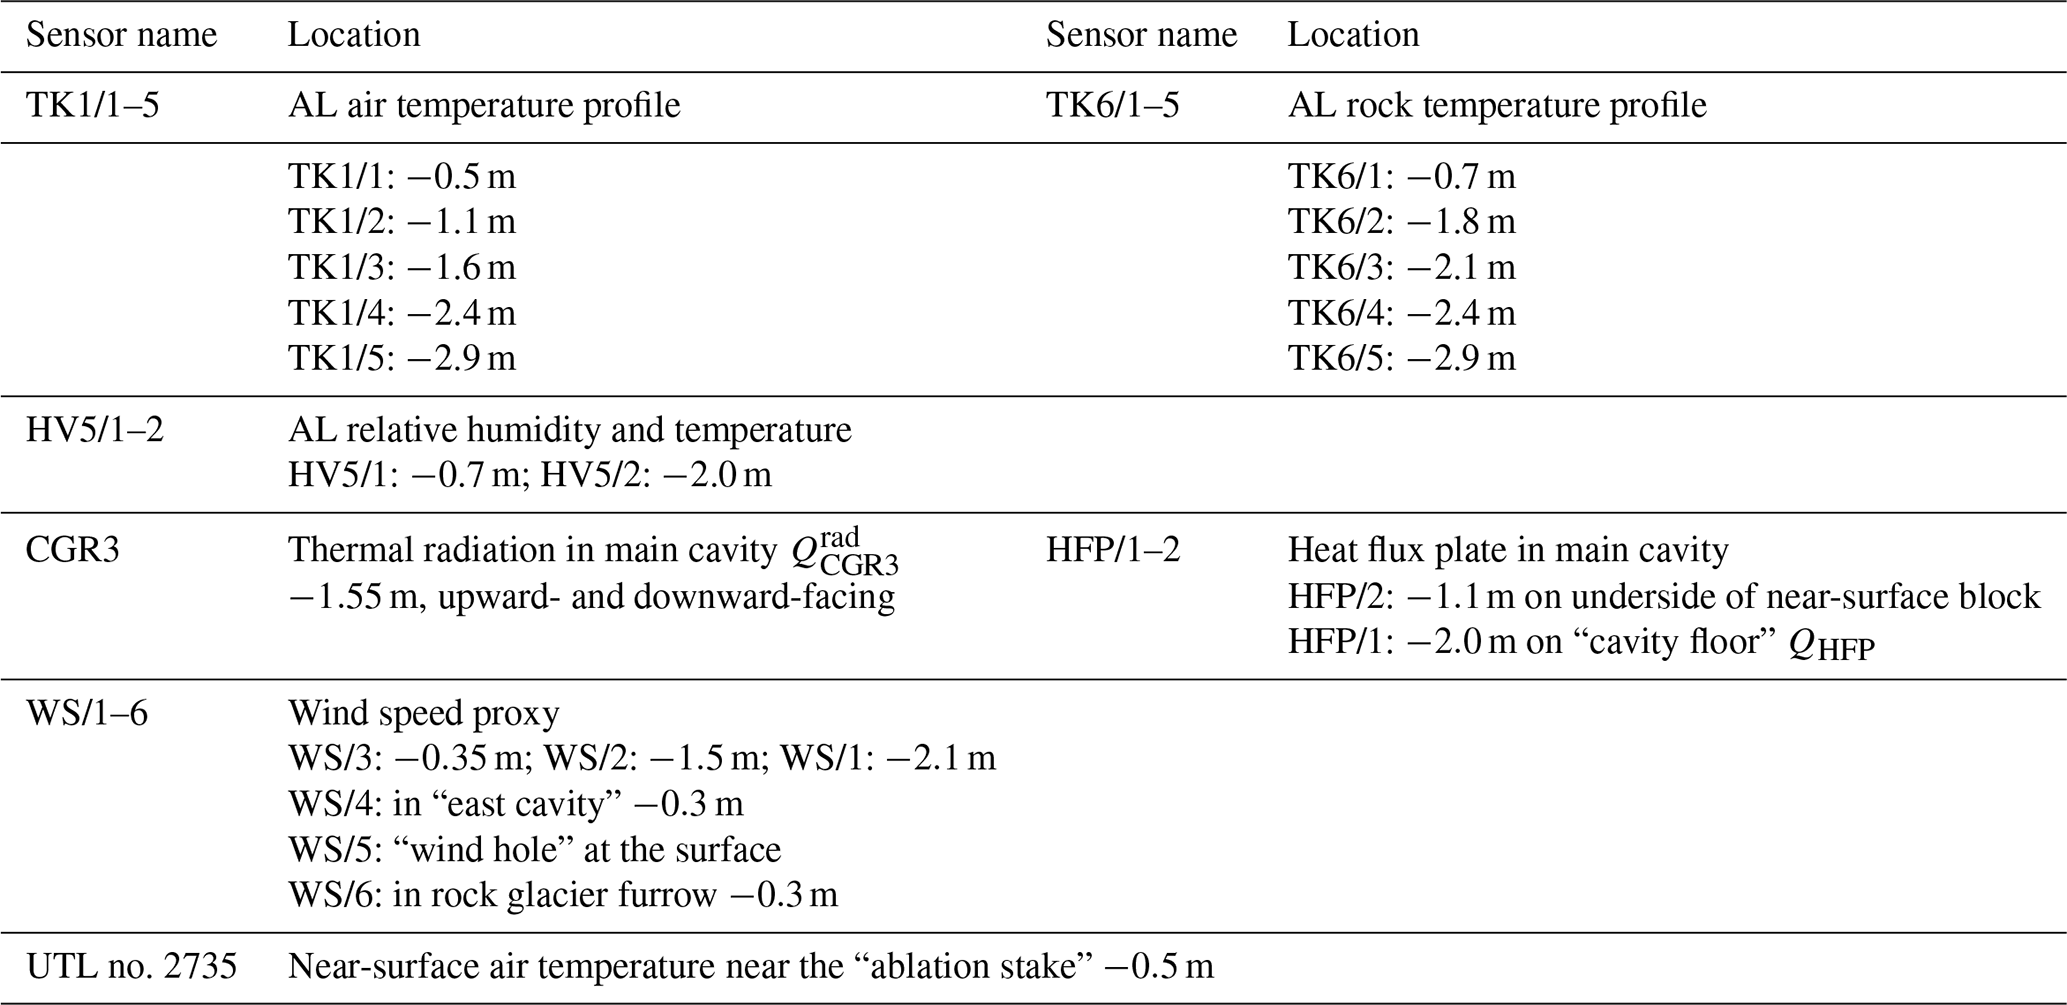
The abbreviations correspond to Fig. 3.
Additional thermistor strings and thermo-anemometers were installed in the vicinity at different micro-topographical locations to reveal the spatial pattern of temperature and airflow. One additional thermo-anemometer was installed in a similar cavity 20 m away (WS/4), together with another air-suspended thermistor string (TK5), one near the surface beneath a wind-swept large block on a ridge (WS/5, “wind hole”) and one near the surface in a nearby rock glacier furrow (WS/6). The sub-surface sensor array is completed by 10 autonomous miniature temperature loggers (UTL; Table 1) distributed on the rock glacier to determine the variability in the near-surface ground temperature.
We measured the seasonal ice turnover directly with stake measurements inside the coarse blocky AL. The ground ice is accessible at a few spots at shallow depths of 1–2 m b.g.l. (below ground level), all located in furrows where the AL is thinner. In one spot, a plastic tube was drilled ca. 120 cm into the ice in August 2009 but subsequently abandoned (Christin Hilbich, personal communication, 2022). We made serendipitous use of it as an “ablation stake”, manually measuring the height of the ground ice table at each field visit in summer 2022. One nearby autonomous miniature temperature logger (UTL no. 2735; Fig. 2) measures a near-surface ground temperature ∼0.5 m b.g.l.
Additionally, we use borehole temperature data provided by the Swiss Permafrost Monitoring Network (PERMOS) for basal conductive heat flux from the rock glacier core and point-wise surface radiation data from the PERMOS automatic weather station (Noetzli et al., 2019).
3.2 Data processing
We analyse the data of 2 years, from 1 September 2020 to 30 September 2022. The above-surface sensors and the corresponding data processing (air temperature, relative humidity, precipitation, snow height) are described in Amschwand et al. (2024). The (measurement or meteorological) variables, parameters, and constants used are tabulated in Table G1.
3.2.1 Sub-surface thermal radiation
The net radiative flux in the AL is calculated from the thermal (long-wave/thermal infrared) radiation of a back-to-back pyrgeometer pair installed in the instrumented cavity (Amschwand et al., 2024),
as the difference between the upwards and downwards thermal radiation components. The raw outputs of the two pyrgeometers in the instrumented cavity are corrected by accounting for the thermal radiation emitted by the instruments themselves (Kipp & Zonen CGR3 manual, 2014) as in Amschwand et al. (2024):
with the pyrgeometers' housing temperature TCGR3. Large (>0.5 °C) or rapid changes in the housing temperature differences between the back-to-back-mounted pyrgeometers hint at dust or water deposition on the upward-facing pyrgeometer window. Such disturbed measurements showed up in the high-resolution (10 min) data but did not significantly affect the daily thermal net radiation balance in the sheltered cavity.
3.2.2 Sub-surface airflow speed
We refer to the sub-surface “wind” in the permeable AL as “airflow” to differentiate it from the atmospheric wind. Measurements of an airflow speed proxy in the AL pore space were performed with six Hukseflux TP01 sensors (formerly WS01; Table 1) consisting of a heated foil that measures the cooling rate, expressed as a heat transfer coefficient hWS []. One measurement cycle takes 1 min and consists of three measurements to detect any offset: one initial measurement before heating, one at 30 s, and a final one after cool-down at 60 s. The heat transfer coefficient hWS is related to airflow speed via . This empirical linearised relation is valid with reasonable accuracy for airflow speeds in the range of 0.1–2 m s−1 (Hukseflux WS01 manual, 2006). The TP01 sensor does not resolve the direction of the airflow. The deviation of the linearised relation from the common engineering relation Re0.5 (Schuepp, 1993) is within 0.2 m s−1 for uWS<0.6 m s−1. Hence, the measurements are qualitative rather than absolute. Although the foils were oriented parallel to the dominant airflow direction that can be expected from the local cavity geometry, any airflow perpendicular to the foil creates turbulence that affects the heat transfer efficiency. At very low wind speeds or if the sensor is much warmer than the surrounding air, buoyancy effects become important relative to forced convection and disturb the airflow speed measurement (increases hWS). Also, deposition and evaporation of liquid water can disturb the measurements (increases hWS), as was revealed by wrapping the heated foils in moist tissues. WS measurements during precipitation events at shallow levels, where water may infiltrate, are discarded. Repeated zero-point checks were performed throughout the snow-free season by enclosing the heated foil in small and dry plastic bags for a few hours, ensuring stagnant conditions with zero airflow speed. Neither a drift nor a temperature dependency beyond the measurement uncertainty was detected.
3.2.3 Heat flux plates
Unlike the CGR3 that measures only thermal radiation, the HFP measures the heat flux across the disc-shaped sensor without discriminating between different heat transfer processes. A limitation is that the small-scale local HFP measurements (sensing area of m2) might not be as representative of the average vertical AL fluxes as the CGR3 measurements that hemispherically integrate over the inner cavity surface (“REV uncertainty”). Furthermore, the heat flux plate (HFP) itself adds additional resistance to the heat flow from the rock slab interior to the cavity (“resistance error”, Hukseflux HFP manual, 2016), which is within 20 % and sufficient in our context, given the field conditions and the REV uncertainty. The heat flux plates are cemented onto the block surface to avoid air gaps and to minimise the contact resistance. We assess the resistance error by conceptualising the heat flow through the block and the HFP into the open cavity as resistances in series. The total resistance Rtot is the sum of the conductive resistance in the rock slab within a “zone of influence” of the HFP given by the sensor diameter dHFP, m/2.5 W m−1 K−1; the HFP resistance K m2 W−1; and the interfacial radiative–convective resistance Rs between the rock surface and the cavity, i.e. . An upper bound for Rs is the stagnant (no convection), radiation-only inverse heat transfer coefficient K m2 W−1 (ε≈1). Hence, the HFP is the least resistive link of the heat transfer chain.
4.1 Heat transfer and air circulation
Heat is transferred by three basic modes – convection/advection by moving fluid parcels (air/water), the emission/absorption of electromagnetic (thermal infrared) radiation, and thermal conduction by molecular interaction – whose dominance in unfrozen (excluding latent heat effects) porous materials such as soils under field conditions is controlled by debris texture (characteristic particle size) and water content (degree of saturation) (Johansen, 1975). These heat transfer modes combined result in the ground heat flux QG (Eq. 4). In coarse debris far from water saturation, the most important heat transfer modes are air convection, heat carried by air circulation, and thermal radiation (Qr), radiative heat transfer between blocks of different temperatures by electromagnetic waves that travel across the pore space (Fillion et al., 2011). Heat advection by intercepted rainfall that percolates to the ground ice table results in a small rain heat flux QPr (part of QG in Eq. 4). Heat conduction alone compared to radiation is considered negligible in the coarse blocky AL because the contact areas between the blocks are too small in the clast-supported debris (see Esence et al., 2017) but transfers the heat within the blocks and also in the permafrost body beneath the AL, QPF (Scherler et al., 2014; Schneider, 2014). Hence, we conceptualise conductive heat transfer within the blocks and radiative heat transfer between the blocks as a heat transfer chain in series and denote it as conductive–radiative. We outline a simple heat transfer model in terms of a thermal resistance circuit in Appendix A.
Furthermore, it is useful to differentiate two types/modes of air convection according to the driving force: (i) buoyancy-driven and (ii) forced convection (Nield and Bejan, 2017). Buoyancy-driven convection refers to air set in motion by air density instabilities within the coarse blocky AL, i.e. when denser (∼colder, drier) air is on top of lighter (∼warmer, more moist) air and is driven by gravity. The entire unstable air column is set in motion. It exerts a cooling effect: comparatively colder air sinks into the coarse blocky AL, displaces the warmer air, and subsequently impedes the penetration of warmer air. Warmer air is evacuated rapidly (Balch effect or thermal semiconductor effect). The vigour of buoyancy-driven convection in a porous medium is a function of the Rayleigh–Darcy number Ra defined as (Nield and Bejan, 2017; Johansen, 1975; Kane et al., 2001; Herz, 2006; Côté et al., 2011; Wicky and Hauck, 2020)
where ρa is the air density [kg m−3], Cp the isobaric specific heat capacity [], the stagnant (absence of convection) bulk thermal conductivity of the AL [], the thermal expansion coefficient (273 K)−1, K the intrinsic AL permeability estimated with the Kozeny–Carman equation (; Eq. D1; Herz, 2006; Côté et al., 2011; Wicky and Hauck, 2020), hal the AL layer thickness [m], ΔT the temperature difference across the AL [K or °C], μa the air dynamic viscosity [Pa s], and g the gravitational acceleration (9.81 m s−2). Buoyancy-driven convection can be expected when Ra exceeds a threshold value (critical Rayleigh number Rac), commonly given as 27 in open voids or 40 beneath a snow cover. Wind-forced convection or continuous air exchange with the atmosphere (Humlum, 1997; Harris and Pedersen, 1998; Kane et al., 2001; Juliussen and Humlum, 2008) refers to air set in motion by external wind, i.e. at the ground surface. Wind gusts propagating into the permeable AL (shear flow, momentum diffusion by rough surface) lead to forced mechanical mixing. It can rapidly cool or warm the ground, depending on the air temperature relative to the ground temperature. Mixing is strongest near the surface and decreases with depth as a function of permeability and AL air density gradient. Low permeability and stable air density gradients oppose forced mixing, limiting its reach to a near-surface sub-layer of the AL. In contrast, high permeability and a labile, (near-)isothermal air column favour mixing to greater AL depths (Evatt et al., 2015). A labile, (near-)isothermal air column is most easily mixed.
4.2 Energy budget of the Murtèl coarse blocky active layer (AL)
The ground heat flux QG and the rain heat flux QPr [W m−2] from the ground surface downwards into the coarse blocky AL are spent on warming the debris (sensible heat storage changes), melting ground ice in the AL Qm (latent heat storage changes), and conducted into the permafrost body beneath QPF (“permafrost heat flux”) (see Hayashi et al., 2007; Woo and Xia, 1996),
The fluxes are counted as positive if they provide energy to the reference volume, the AL. We use different approaches to independently estimate each term in Eq. (4) (Sect. 4.3) and compare with direct measurements (Sect. 3.2.1, 3.2.3).
4.3 Heat flux estimations
4.3.1 Ground surface heat flux QG
The ground heat flux at the surface, QG, is estimated using the measured thermal net radiation extrapolated to the surface by the transient heat storage in the layer between the surface and pyrgeometers' depth. Details are in Amschwand et al. (2024).
4.3.2 Rain heat flux QPr
The flux of infiltrating rainwater r [] is the intercepted rainwater (from the rain gauge data) that rapidly percolates to the ground ice table and is cooled from the initial precipitation temperature TPr to 0 °C (at the most) (Sakai et al., 2004; Hayashi et al., 2007). It releases a sensible heat flux
with the volumetric heat capacity Cw=ρwcw [] and snow height hS [m]. As a conservative estimate, the rainwater is assumed to be cooled from surface temperature TPr:=Ts to the freezing point. Precipitation data are taken from the on-site rain gauge, assuming that precipitation is liquid based on a threshold air temperature of Twb=2 °C (Amschwand et al., 2024). Upslope-flowing water contributions to the rock glacier and liquid precipitation falling into the snowpack are not accounted for (no reliable precipitation measurements from snow-covered rain gauge).
4.3.3 Sensible heat storage changes
The sensible heat stored/released by temperature changes in the blocks are estimated using the calorimetric method based on AL temperatures via (Amschwand et al., 2024)
with hal=3 m the AL thickness; ρr the rock density (2690 kg m−3; Corvatsch granodiorite, Schneider, 2014); cr the specific heat capacity (); AL porosity ϕal=0.4 (Scherler et al., 2014); and Tr(z) and Ta(z) the vertical rock and in-cavity air temperature profile [°C], respectively. In practice, we use the AL temperature Tal [°C] as measured by the thermistor string TK1 hanging in air (Tables 1 and 2) and integrate over timescales where local thermal equilibrium (LTE) holds (discussed in Appendix A). In the discretised formulation, the temperatures are layer-wise averages in the ith layer with thickness Δzi (denoted by 〈⋅〉), derived from the thermistor string TK1/1 and the radiometric surface temperature Ts. Since AL water contents are always low enough not to significantly influence the heat capacity, is a time-invariant, fixed AL thermal property (Scherler et al., 2014).
4.3.4 Ground ice melt heat flux deval, Qm
The latent heat consumed by melting ground ice is estimated from the deviation of the AL budget (Eq. 4), i.e. the residual , as well as using the stake measurements (denoted as Qm) via
where ζ is the observed depth of the ground ice table [m]; fi [−], Lm (), and ρi [kg m−3] are the volumetric ice content, latent heat of melting, and ice density, respectively.
4.3.5 AL base flux through permafrost body QPF
The heat flux across the permafrost table QPF is estimated with the gradient method from PERMOS borehole temperature data via Fourier's heat conduction equation:
where the borehole temperatures are measured at 4 and 5 m depth in the permafrost body beneath the AL. We take a constant thermal conductivity kPF value of (Vonder Mühll and Haeberli, 1990; Scherler et al., 2014).
4.4 Stefan parameterisation of ground ice melt
If the ground heat flux is mostly spent on melting ground ice (discussed in Sect. 6.1), the rate of lowering the thaw front/ground ice table [m s−1] can be approximated with a linearised heat conduction equation (Hayashi et al., 2007),
whose solution is the Stefan equation of the form (Hayashi et al., 2007)
where keff is the effective thermal conductivity of the (unfrozen) AL above the thaw front/ground ice table [] located at depth ζ [m] beneath the ground surface (Fig. 4) and I(t) the surface thaw index [°C ×d] (defined below). Two modifications are necessary to account for the AL stratigraphy on Murtèl (Fig. 4). First, the seasonal lowering of the ground ice table (assumed to coincide with the thaw front) is modelled with a modified Stefan equation for a two-layered AL (Nixon and McRoberts, 1973; Kurylyk, 2015). In Eq. (10), the frozen ground is initially (at the onset of thaw season) uniform. However, on Murtèl, the ice does not fill the AL pore space up to the ground surface. Rather, a layer (with thickness h1) on top of the ice-saturated AL remains nearly ice-free year-round. This ice-poor overburden dampens ground ice melt rates/thaw rates from the onset of the thaw season. Apart from the different ground ice content, the two layers share the same properties (porosity). The second modification is a correction factor λ5 for sensible heat storage changes in the thawed AL. λ5 is derived from the Stefan number Ste, Ste + 0.038 Ste2 (Kurylyk and Hayashi, 2016). The depth-averaged dimensionless Stefan number Ste is proportional to the ratio of sensible heat to latent heat absorbed during thawing (Kurylyk and Hayashi, 2016),
with the bulk volumetric heat capacity [] of the (unfrozen, ice-free) AL (identical for both layers), the average surface temperature for the time t elapsed since onset of the thaw season, and the latent heat consumed by the melting of the ground ice Lm〈f〉ρi (different in each layer, with the depth-averaged value denoted by 〈⋅〉; details in Kurylyk and Hayashi, 2016). In other words, the Murtèl AL stratigraphy calls for a multi-layer Stefan equation accounting for sensible heat storage. We use the extension of Eq. (10) developed by Kurylyk (2015) and Aldrich and Paynter (1953) to predict the thaw depth ζ, which for our purpose reduces to (because of in Eq. 23 in Kurylyk, 2015)
with the effective thermal conductivity keff [] of the (thawed/unfrozen) AL above the thaw front/ground ice table, the volumetric pore ice content f of each layer (maximum at saturation, f≤ϕal), and the pore ice density ρi (900 kg m−3). The total surface thaw index It(t) [] is defined as
and the thaw index of the ice-poor AL overburden I1 is defined as
Equation (12) can be reduced if we assume that the ice-poor overburden has a negligible ice content, f1≪f2, and approximates the thaw depth late in the thaw season when It(t)≫I1. Then, Eq. (12) reduces to
Equation (15) is a useful approximation when the overburden is thick and ice poor; i.e. the effect of f1 is small compared to the effect of h1. Without the damping effect of the overburden (h1→0), Eq. (15) reduces further to the “classic” Stefan solution (Eq. 10).
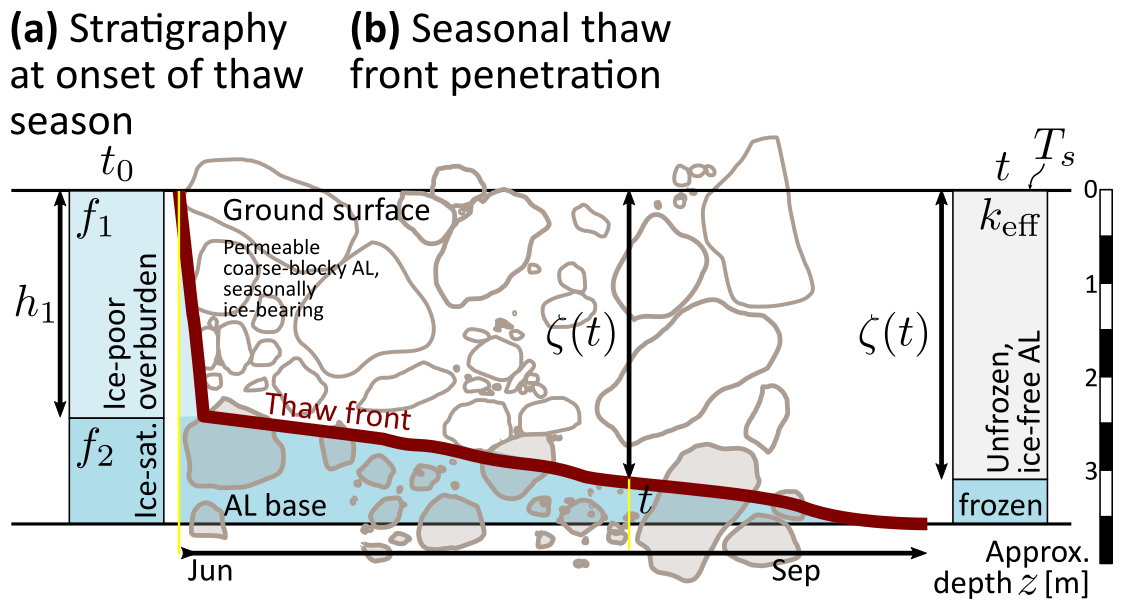
Figure 4Ground ice thaw and the Stefan equation. (a) Initial stratigraphy at the onset of the thaw season with ice-poor overburden and ice-saturated layer. (b) Seasonal thaw front penetration.
In discretised form with daily average surface temperatures, It(ti)=86 , summed over the ith day since onset of the thaw season (Hayashi et al., 2007). Equation (12) is premised on the assumption of (i) initial uniform temperature at the freezing point throughout the AL and uniform temperature beneath the thaw front (zero heat flux from the permafrost body beneath; Sect. 6.1), (ii) layer-wise homogeneous and time-invariant thermal properties and ground ice content, and (iii) quasi-steady-state conditions (Kurylyk and Hayashi, 2016).
4.5 Estimation of AL heat transfer parameters (keff, κa)
We derive the heat transfer parameters of the AL, the effective thermal conductivity keff, and the apparent thermal diffusivity κa from in situ measurements using two different approaches based on different measurements; keff and κa are related via the volumetric heat capacity Cv (Vonder Mühll and Haeberli, 1990),
Values for the porosity ϕal, rock density ρr, and the heat capacity cr given in Sect. 4.3.3 yield .
4.5.1 Effective thermal conductivity keff estimation
The effective thermal conductivity keff [] is derived from the measured AL thermal radiation and vertical AL temperature gradient using a diffusive flux-gradient relation of the form
This approach yields a thaw-season-averaged effective thermal conductivity keff [], which we denote by for precision. It might seem odd to use Eq. (17), a diffusion equation formally identical to Fourier's heat conduction equation (see Eq. 8) since heat conduction is considered insignificant in the coarse blocky AL (Sect. 4.1; discussed in Sect. 6.3.2). However, radiative heat transfer in a porous medium with opaque particles (rock) and transparent fluid (air) can be expressed as diffusive (Fillion et al., 2011; Lebeau and Konrad, 2016); is an effective thermal conductivity that lumps conductive/radiative and non-conductive (convective) heat transfer in the highly permeable blocky material (Herz, 2006).
Table 3Typical temperature profiles, heat fluxes and airflow patterns during different seasons, characteristic weather patterns, and snowpack conditions on Murtèl rock glacier (ciphers ➀–➅ are referred to in the text and figures).
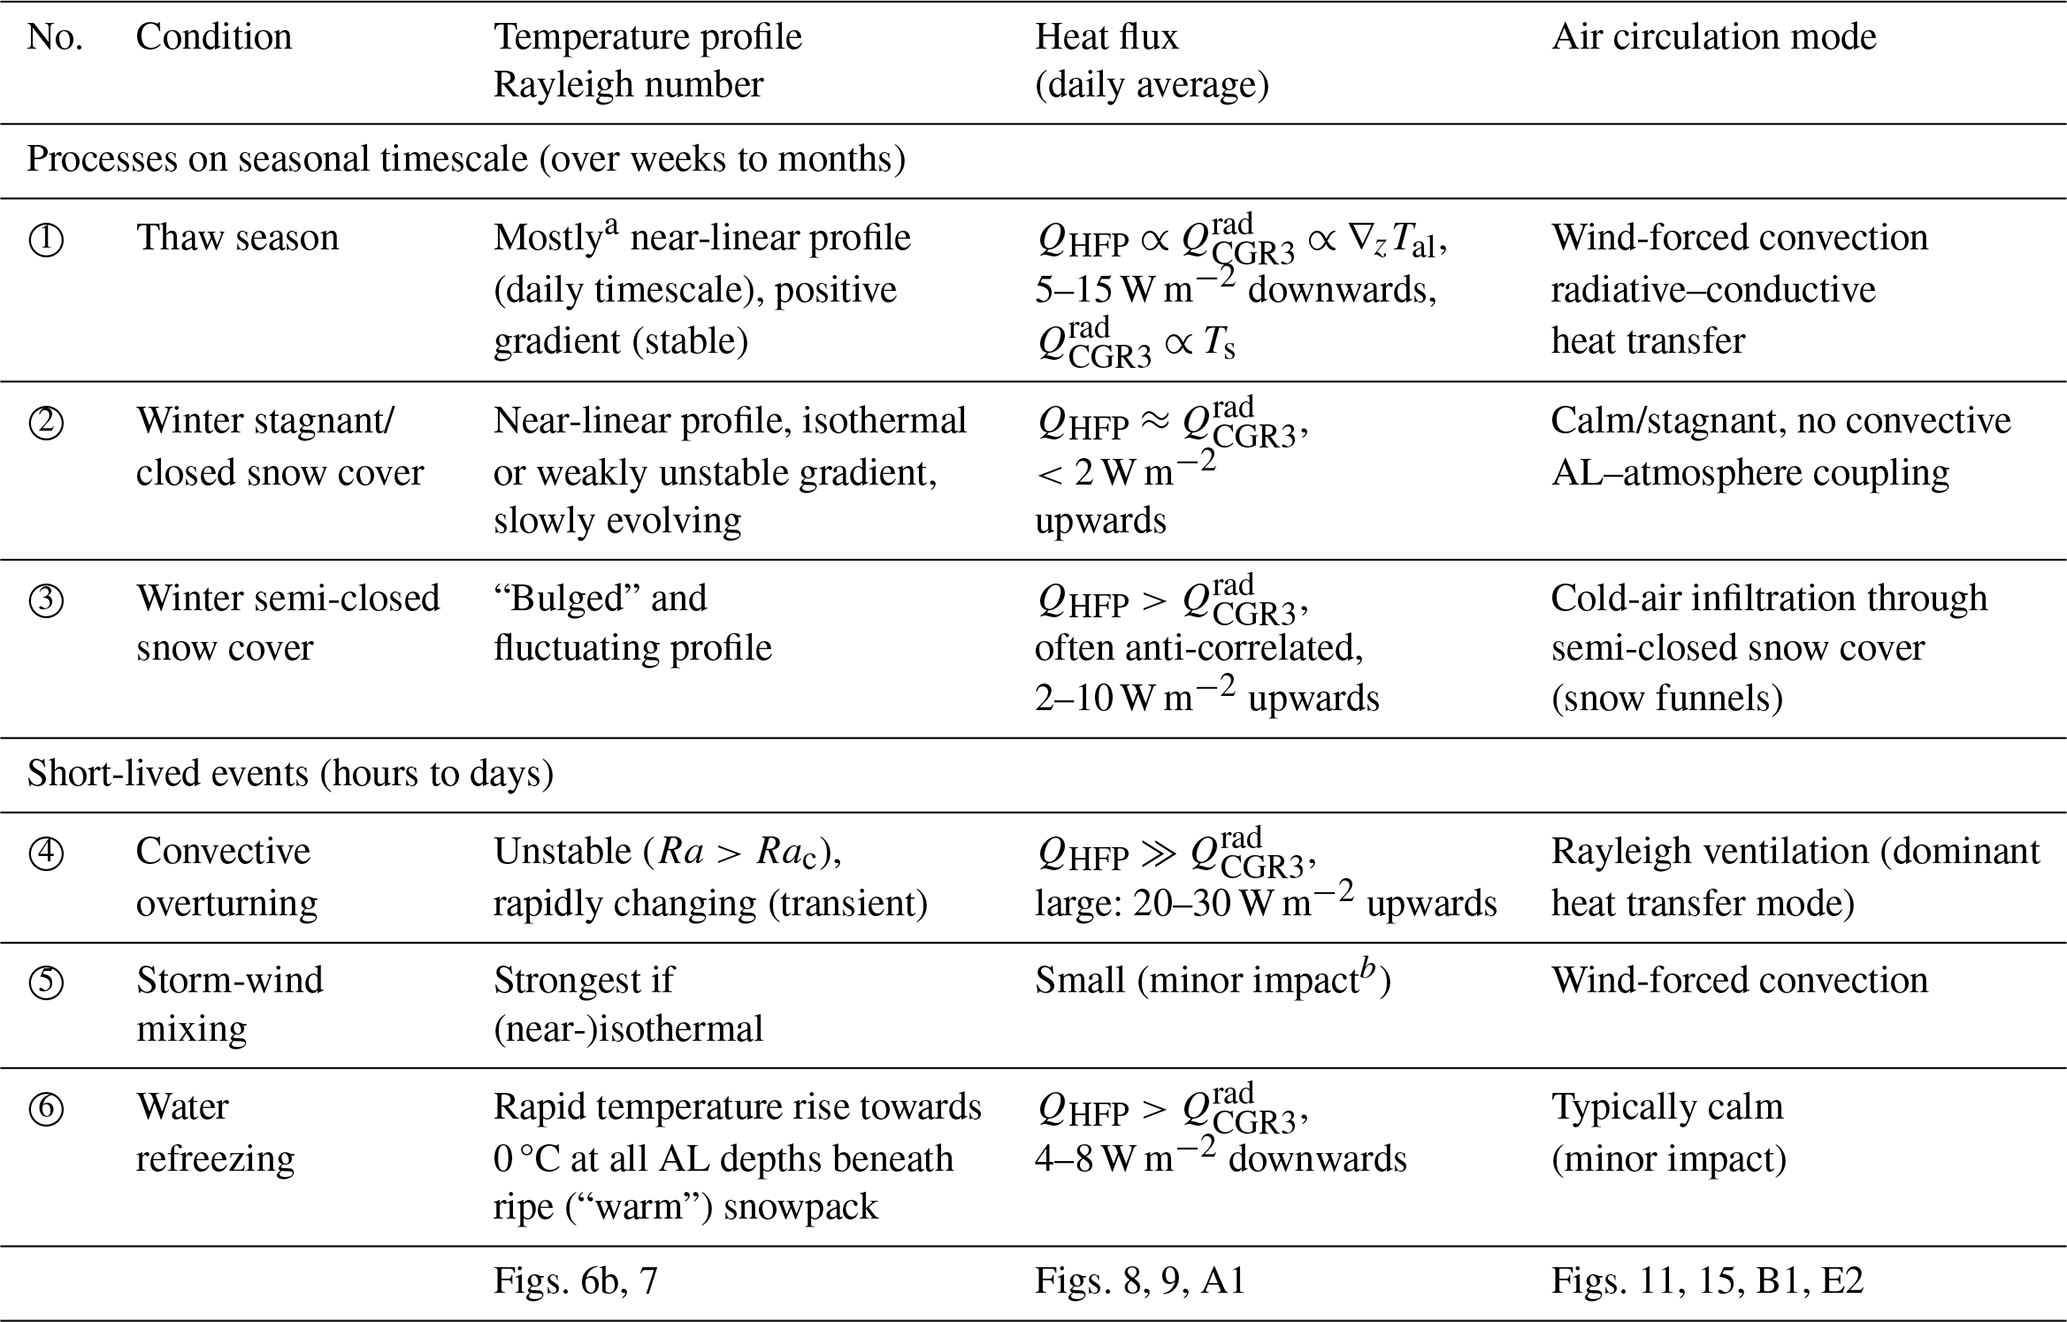
a Exceptions are dry-hot weather spells (Fig. 7a) or during the passage of weather fronts (Rayleigh ventilation). b In wind-sheltered Murtèl cirque.
4.5.2 Apparent thermal diffusivity κa estimation
The apparent thermal diffusivity κa [m2 s−1] is derived from measured AL temperatures Tal using the derivative method based on the one-dimensional transient thermal diffusion equation (Biot–Fourier equation) (Hinkel et al., 1990; Conway and Rasmussen, 2000),
where t [s] is the time, and z is the AL depth [m]. Analogous to , κa is an apparent thermal diffusivity that lumps conductive/radiative and non-conductive (convective) heat transfer. Only the latent effects of freezing/thawing are minimised by using values from the unfrozen AL (Tal>0.5 °C). Day-to-day temperature change and the second derivative are calculated using the Petersen et al. (2022) algorithm from daily average AL temperature data (TK1/2–4). To avoid spurious κa values, no κa is calculated for near-isothermal conditions (unstable numerics; Hinkel et al., 1990).
5.1 Meteorological conditions
The weather in each season differed markedly in the 2 years 2020–2022, which is reflected by air temperature and snow at the surface (Fig. 5) and the AL temperatures at depth (Fig. 6a). Winter 2020–2021 was colder (−6.2 °C November–April average) and more snow-rich (120 cm February peak measured on a windswept ridge) and lasted longer than the unusually snow-poor (two 80 cm peaks in December and April), short winter 2021–2022, with snow disappearance in May–June, 1 month earlier than the usual melt-out in July. AL temperatures fluctuated more and attained lower values ( °C) in the less cold (−5.3 °C) winter 2021–2022. Summer 2021 was cool and wet compared to the hot and dry summer 2022; temperatures were lower (July–August average: 6.9 °C vs. 9.3 °C), with a frequent passage of weather fronts, often bringing cold air (≤3 °C; minimum daily average temperature: 0.7 °C vs. 5.6 °C) and mixed precipitation (sleet). A few snow patches survived in the Murtèl catchment, which has rarely occurred in the last ∼15 years (Martin Hoelzle and Christian Hauck, personal communication, 2021). In contrast, summer 2022 was marked by heat waves (Tal>10 °C in June and July) co-occurring with dry spells. The surface meteorological conditions are described in more detail in Amschwand et al. (2024).
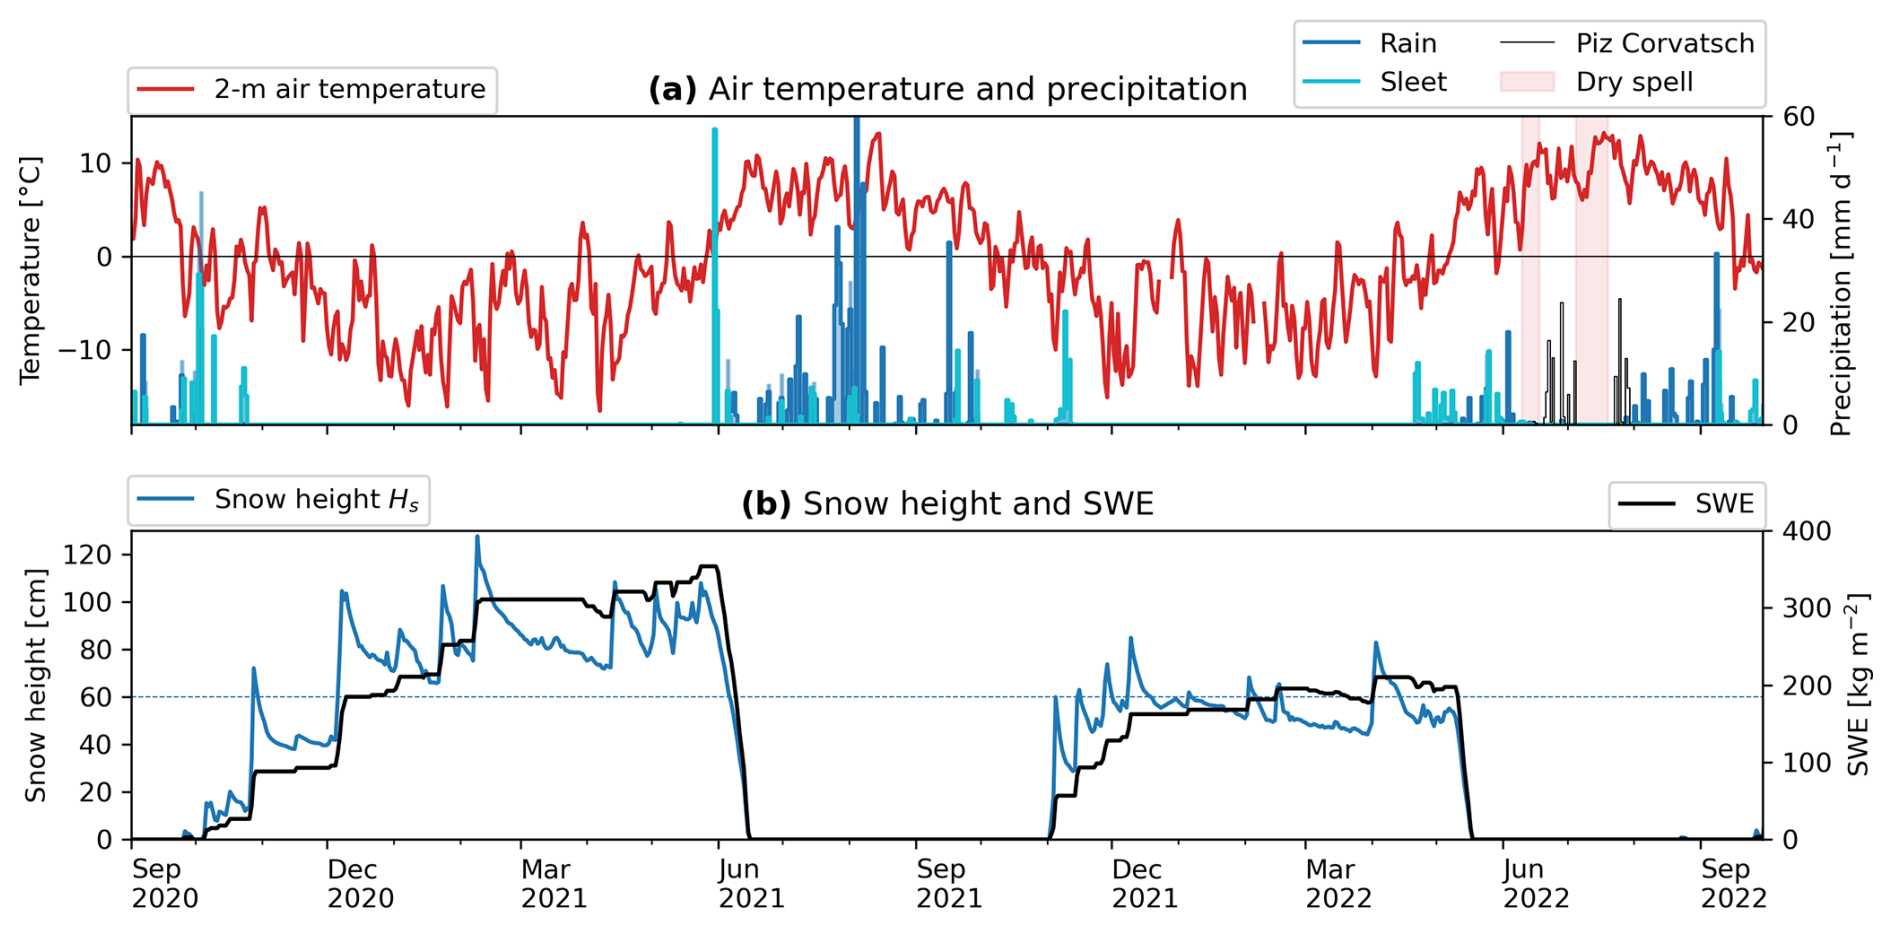
Figure 5Meteorological conditions. (a) Air temperature (daily mean) and precipitation (daily sum). (b) Snow height and snow water equivalent (SWE). Rain and sleet (mixed precipitation) separated based on a wet-bulb temperature threshold of 2 °C (Amschwand et al., 2024). A snow height of hS=60 cm (measured on a windswept ridge) discriminates between a semi-closed and a closed/insulating snowpack (see Fig. 8). Precipitation data at the Piz Corvatsch station from MeteoSuisse.
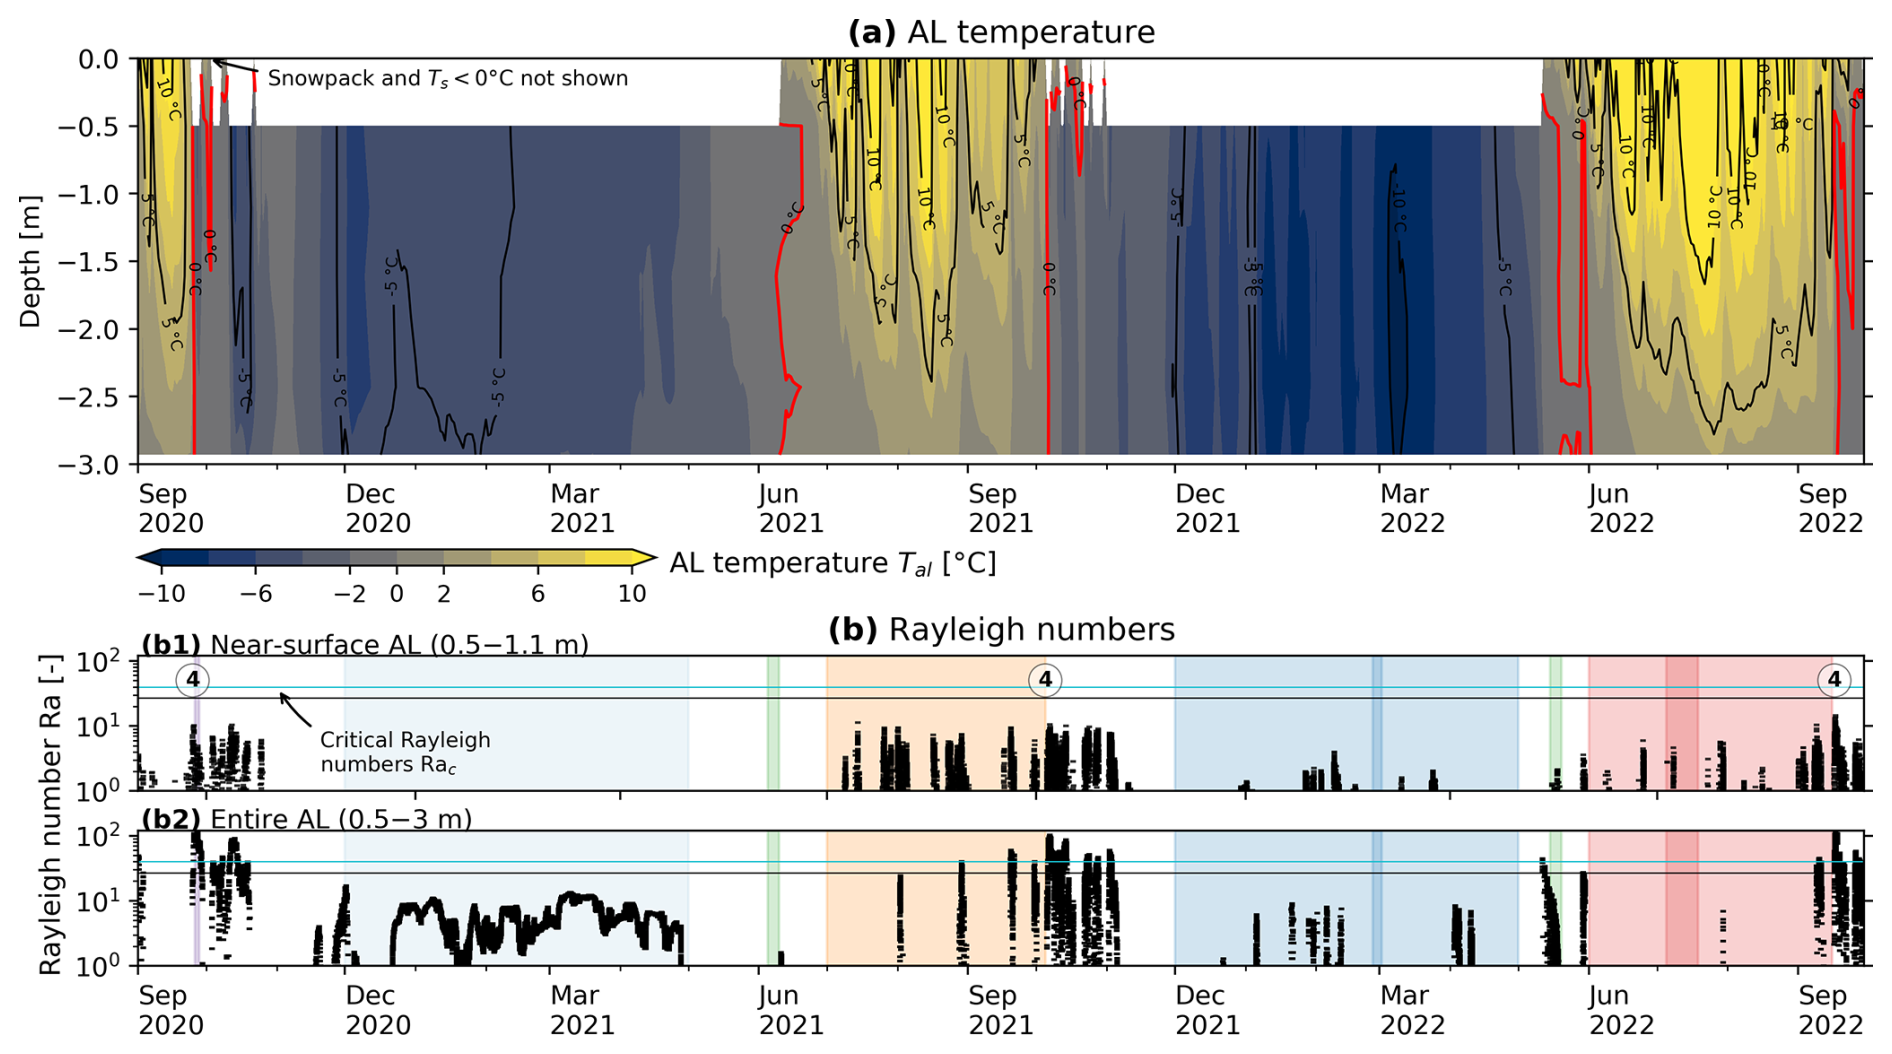
Figure 6(a) AL temperatures Tal in the instrumented main cavity (contour plot from TK1 data). Selected isotherms shown as contour lines. (b) Rayleigh numbers Ra indicate the air column stability in the near-surface AL (b1) and entire AL (b2) (Eq. 3, 10 min resolution). Coloured periods are those shown in Fig. 7. The circled number ④ refers to Table 3.
5.2 Ground thermal and moisture regime
We characterise the ground thermal regime in terms of the Rayleigh–Darcy number Ra (Eq. 3). Ra numbers indicate the stability of the AL air column in a shallow sub-layer (0.5–1.1 m; Fig. 6b1) and the entire AL (0.5–3 m; Fig. 6b2). Onset of buoyancy-driven convection is potentially at Ra≥Rac of 27 under snow-free and 40 under snow-covered conditions. Autumn 2020 starts at the end of September with rapid cooling at high, super-critical Rayleigh numbers. Cooling continues more slowly throughout November, until a thick, “closed” snow cover stalled winter cooling in December 2020, when the snow height exceeded a threshold (60 cm on a rock glacier ridge; Fig. 5b). The AL remained near-isothermal and near-isohume at sub-critical Ra numbers until May 2022. Summer 2022 was characterised by frequent shallow instabilities, i.e. super-critical Ra numbers in the uppermost 1 m of the AL. The deep AL remained stably stratified. The instabilities became more frequent and encompassed the entire AL in October 2021. In the snow-poor winter 2021–2022, the snow cover remained “open” as the snow height only rarely exceeded the threshold. The AL temperature kept fluctuating at occasionally sub-critical Ra numbers. In summer 2022, shallow instabilities occurred less frequently than in summer 2021 (Fig. 6b1).
The temperature profiles are specific to certain conditions that we mark with circled numbers ①–④ and use throughout this work. An overview is given in Table 3, which shows how the heat transfer processes are reflected by the below-ground temperature and airflow measurements. The thaw-season temperature profiles (Fig. 7a, number ①) are near-linear down to the daily timescale, but not on sub-diurnal timescales or on days with rapid cooling (Rayleigh ventilation, Fig. 7a, number ④, e.g. during the passage of cold fronts). The thaw-season-average temperature gradients are 2.0 K m−1 for 2021 (R2=0.995) and 2.8 K m−1 for 2022 (R2=0.998). The near-surface AL is often warmer and therefore unstable with respect to the atmosphere despite stable air stratification inside the AL (nonlocal static stability sensu; Stull, 1991). The winter averages (December–April) are near-isothermal in winter 2020–2021 (Fig. 7a, number ②). In winter 2021–2022, occasional temperature minima at roughly 2 m depth (“bulges”) hint at lateral cold airflow (Sect. 6.4, Fig. 7a, number ③). The locally (near-)stable AL air is nonlocally unstable compared to the radiatively cooled snow surface with average surface temperature Ts of −10 °C (but can go as low as −30 °C). Note the striking asymmetry between near-isothermal winter and steep (2.0–2.8 K m−1) thaw-season temperature profiles (asymmetric envelopes).
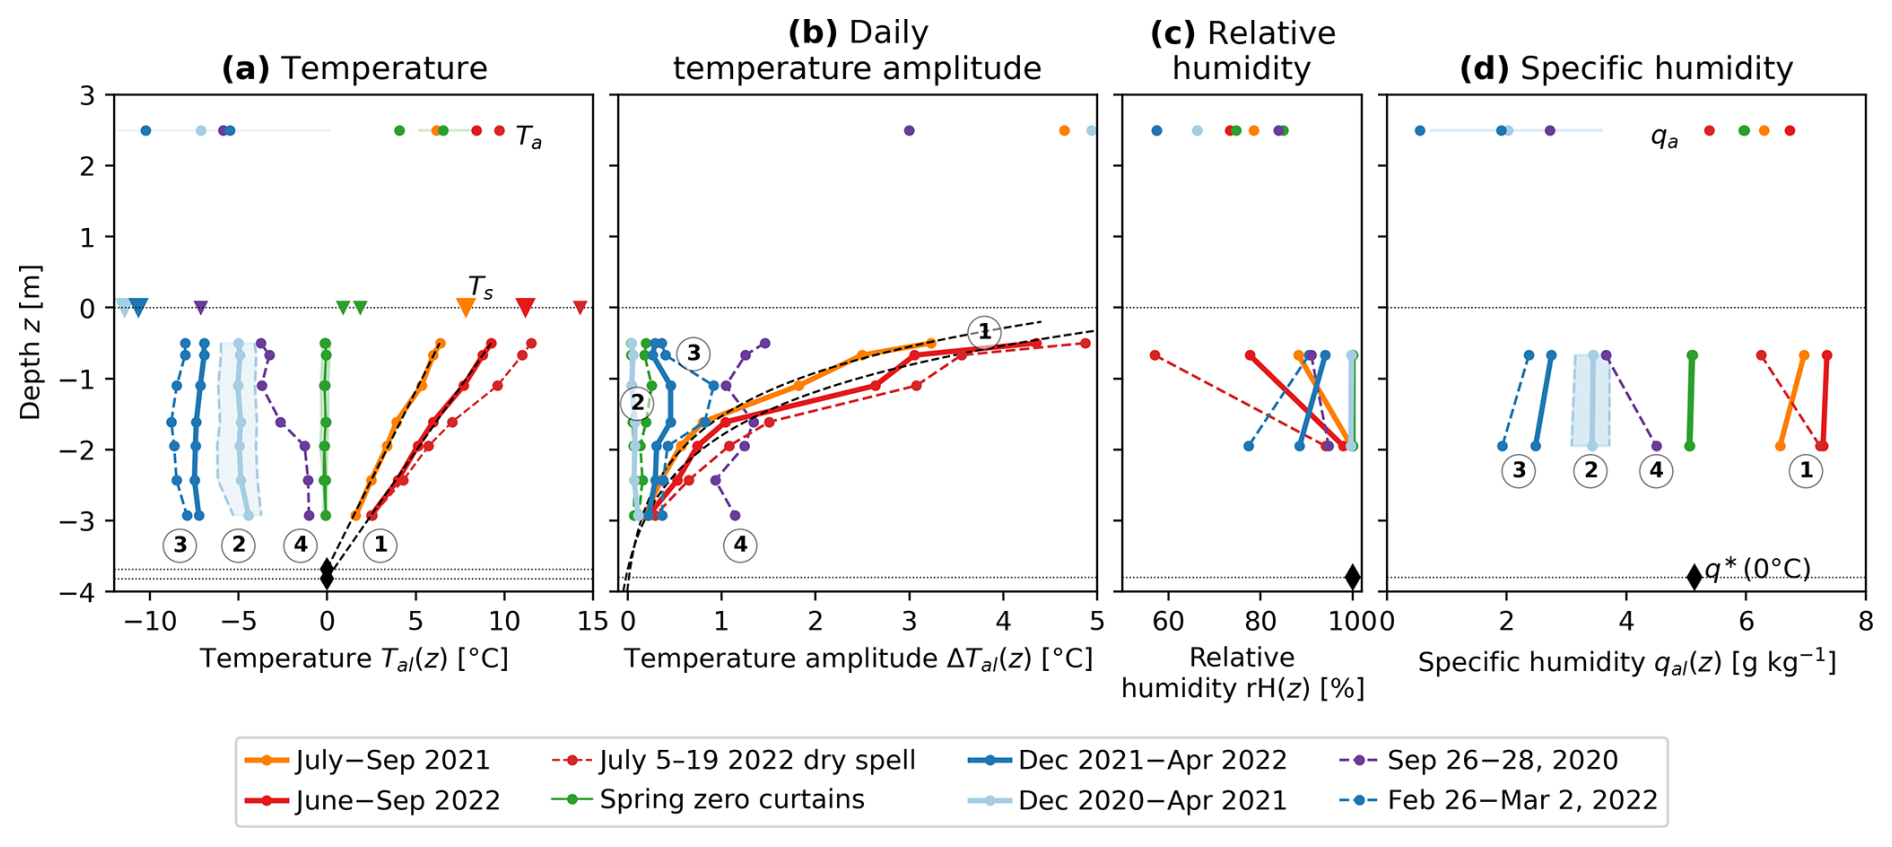
Figure 7Characteristic temperature and humidity profiles. (a) Vertical temperature profiles (“trumpet curves”) during selected periods (the circled numbers ①–④ refer to Table 3): ① summer/thaw season, ② stagnant winter conditions (December 2020–April 2021), ③ wintertime cold-air infiltration (winter average December 2021–April 2022, infiltration period 26 February–2 March), ④ convective overturning by Rayleigh ventilation (event of 26–28 September 2020). (b) Amplitude of daily temperature variation (max–min). On a timescale of 1 d or longer, the thaw-season temperature profiles are near-linear, and daily amplitude decays exponentially with depth, even in the comparatively large instrumented cavity. (c, d) Vertical relative humidity (rH) and specific qal humidity profiles.
The temperature amplitude ΔT is attenuated exponentially with depth z (Fig. 7b) proportional to exp {−1.083z}. Looking at sub-daily resolution, the AL temperature showed a daily course without a time lag down to −2.9 m, only with attenuated amplitudes (Fig. B1a–b). Specific humidity gradients (Fig. 7d) averaged over days to weeks were parallel to the temperature gradients because the AL is most often close to saturation (Fig. 7c). Exceptions were the summer 2022 dry spells that dried out the AL.
5.3 Heat flux plate and pyrgeometer measurements
The direct heat flux plate QHFP and pyrgeometer (thermal infrared radiation) measurements give an overview of flux magnitudes and seasonality (Fig. 8). For clarity, we describe the heat fluxes at seasonal down to daily resolution. Sub-daily (hourly) resolution data provide additional insights discussed in Appendix B. The measured heat fluxes vary seasonally primarily according to the snow conditions and the AL temperature gradient ∇zTal (characteristic temperature profiles are shown in Fig. 7). The circled numbers ①–⑥ refer to the characteristic weather conditions introduced in Fig. 7 and are marked in Figs. 6b, 8, and 11 (Table 3).
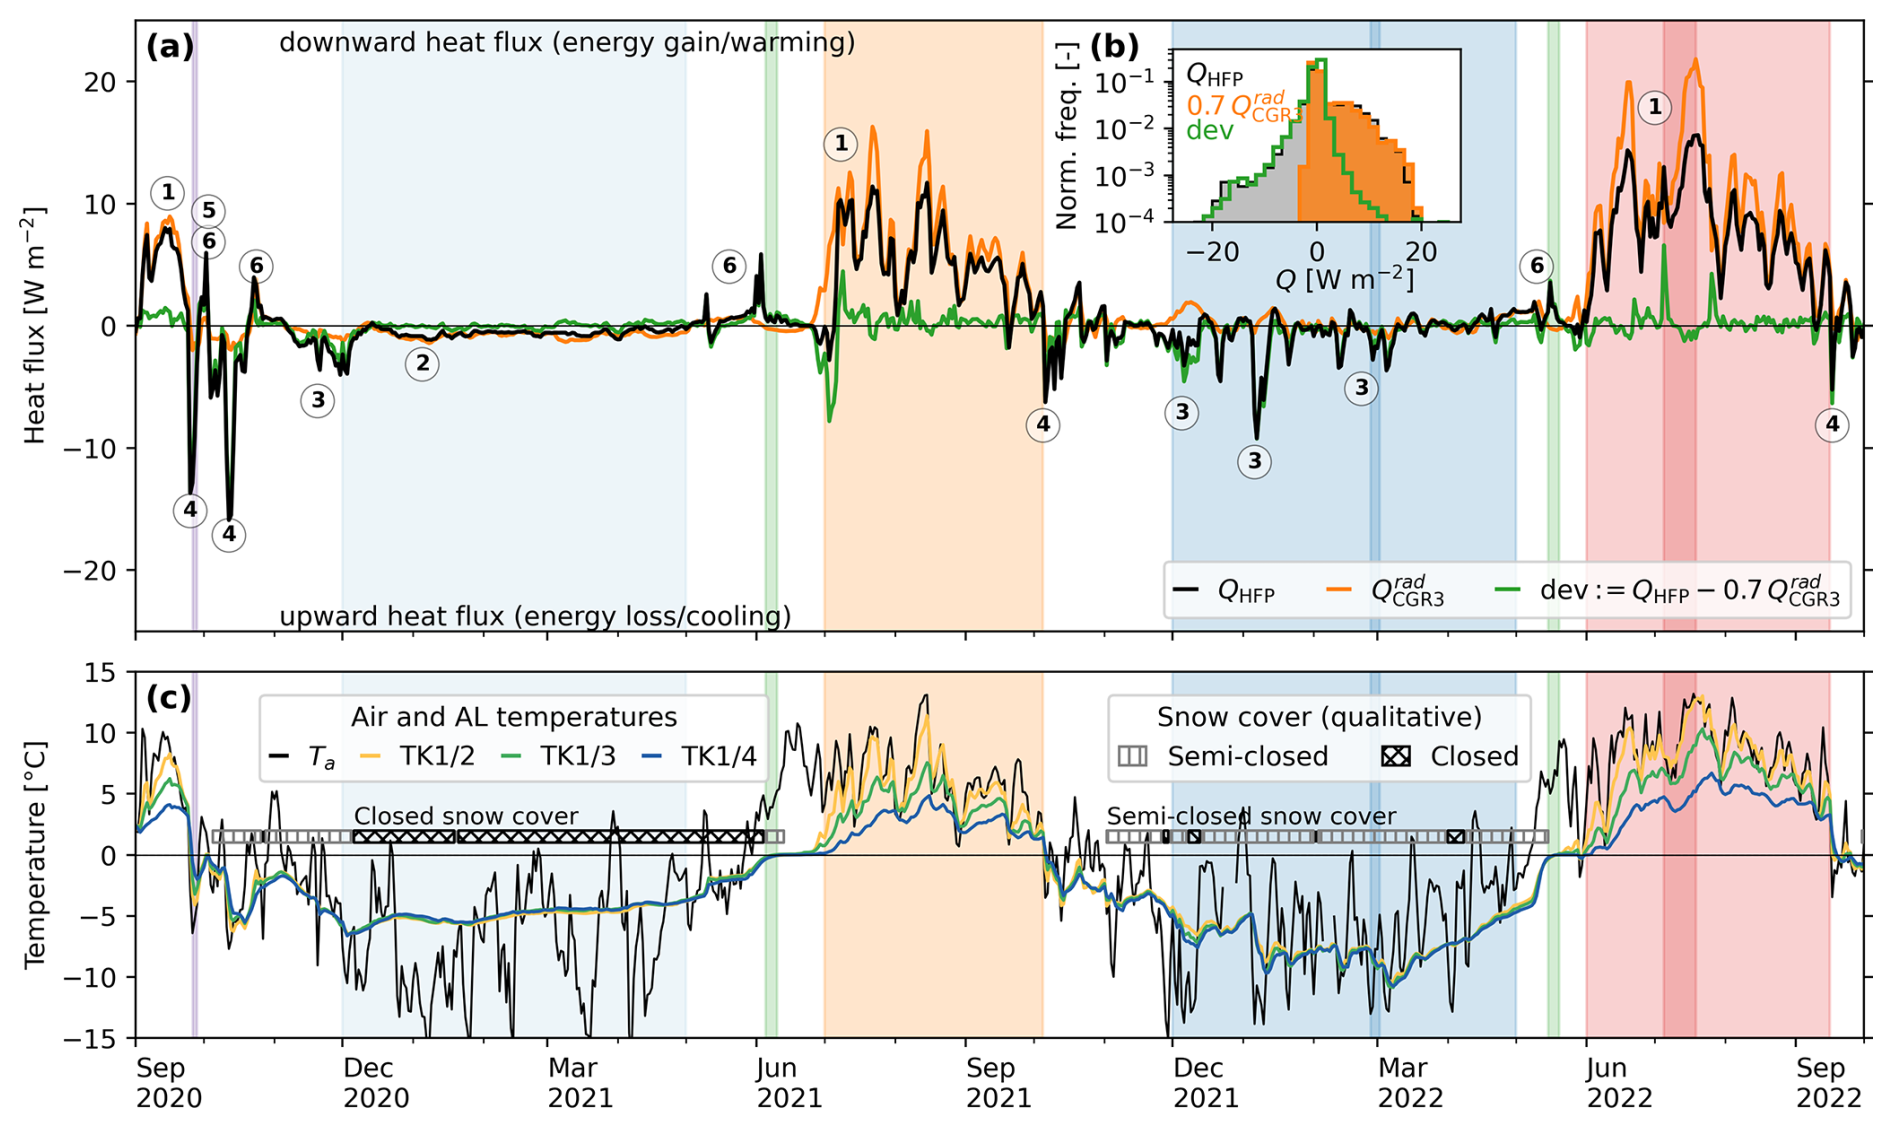
Figure 8(a) Heat flux measured by the heat flux plate HFP/1 at the cavity floor QHFP, AL thermal net radiation measured by the pyrgeometer pair , and the deviation (daily averages). Positive flux is downwards into the rock slab. The circled numbers ①–⑥ refer to Table 3 and are detailed in the text. The snow cover is classified as “semi-closed” (convective exchange through snow funnels) or “closed” (no convective AL–atmosphere exchange; Fig. 5b) (Amschwand et al., 2024, Fig. 4 therein). (b) Normalised histogram of the daily average fluxes. Downward fluxes (positive) are mainly conductive/radiative (QHFP>0 is congruent with ; Fig. A1a), upward fluxes (negative) are mainly non-conductive/convective (QHFP<0 is congruent with the deviation). (c) Air and AL temperatures and snow cover status (closed/semi-closed). Coloured periods are those shown in Fig. 7.
During the thaw season (Tal>0 °C), when temperature gradients are most often stable (), measured daily average heat fluxes QHFP and are 5–20 W m−2 downwards ①). The downward (QHFP>0) flux into the block on which the HFP/1 is placed (warming, positive sign) is strongly correlated (R2=0.9) with the net downward radiation in the instrumented cavity (Fig. 8, number ①), with (Fig. A1). In other words, QHFP>0 is congruent with (histogram in Fig. 8b). The remaining deviation defined as is generally insignificant (within ±2 W m−2) during the thaw season, suggesting that radiative–conductive heat transfer dominates: explains the total heat transfer QHFP measured by the heat flux plate, . The different scaling of the QHFP and measurements can be explained by (i) the instrumental uncertainty (notably the QHFP resistance error of up to 20 %) and (ii) the REV uncertainty: the HFP/1 measures the heat flux locally, whereas each pyrgeometer integrates hemispherically (with a cosine response) over the cavity surface.
In contrast, non-radiative heat fluxes dominate the upward QHFP<0 W m−2 fluxes (cooling) in autumn and winter. QHFP<0 is congruent with the deviation (histogram in Fig. 8b) but is unrelated to , . Unlike , upward QHFP fluxes rapidly increase with unstable (negative) AL air temperature gradients (shown by the colours in Fig. A1a), pointing to air convection as the dominant heat transfer process. Additionally, the snowpack modulates the wintertime heat transfer: in winter 2021–2022, heat fluxes were small (; ②) beneath a closed snow cover when the snow height hS exceeded 60 cm (measured on a windswept rock glacier ridge). In the snow-poor winter 2021–2022, QHFP and were episodically anti-correlated; i.e. the downward net radiation increased with rapid cooling (December 2021–February 2022; ③). Strong cooling occurred in summer and in autumn (September–October 2020, October 2021, September 2022; ④) during the passage of cold weather fronts.
In spring (before the onset of the zero curtain) and occasionally also during winter (e.g. November 2020), brief events of heat input lead to rapid AL warming towards (but not exceeding) 0 °C. These “warming spikes” ⑥ often occur during winter/spring “heat waves” (Ta > 0 °C), pointing to AL warming by the refreezing of snowmelt via the released latent heat. The attribution is most reliable in the event of a closed/insulating snow cover (e.g. in June 2021), when (storm) wind pumping ⑤ can be excluded.
5.4 AL heat transfer parameters (keff,κa)
5.4.1 Thaw-season-average keff
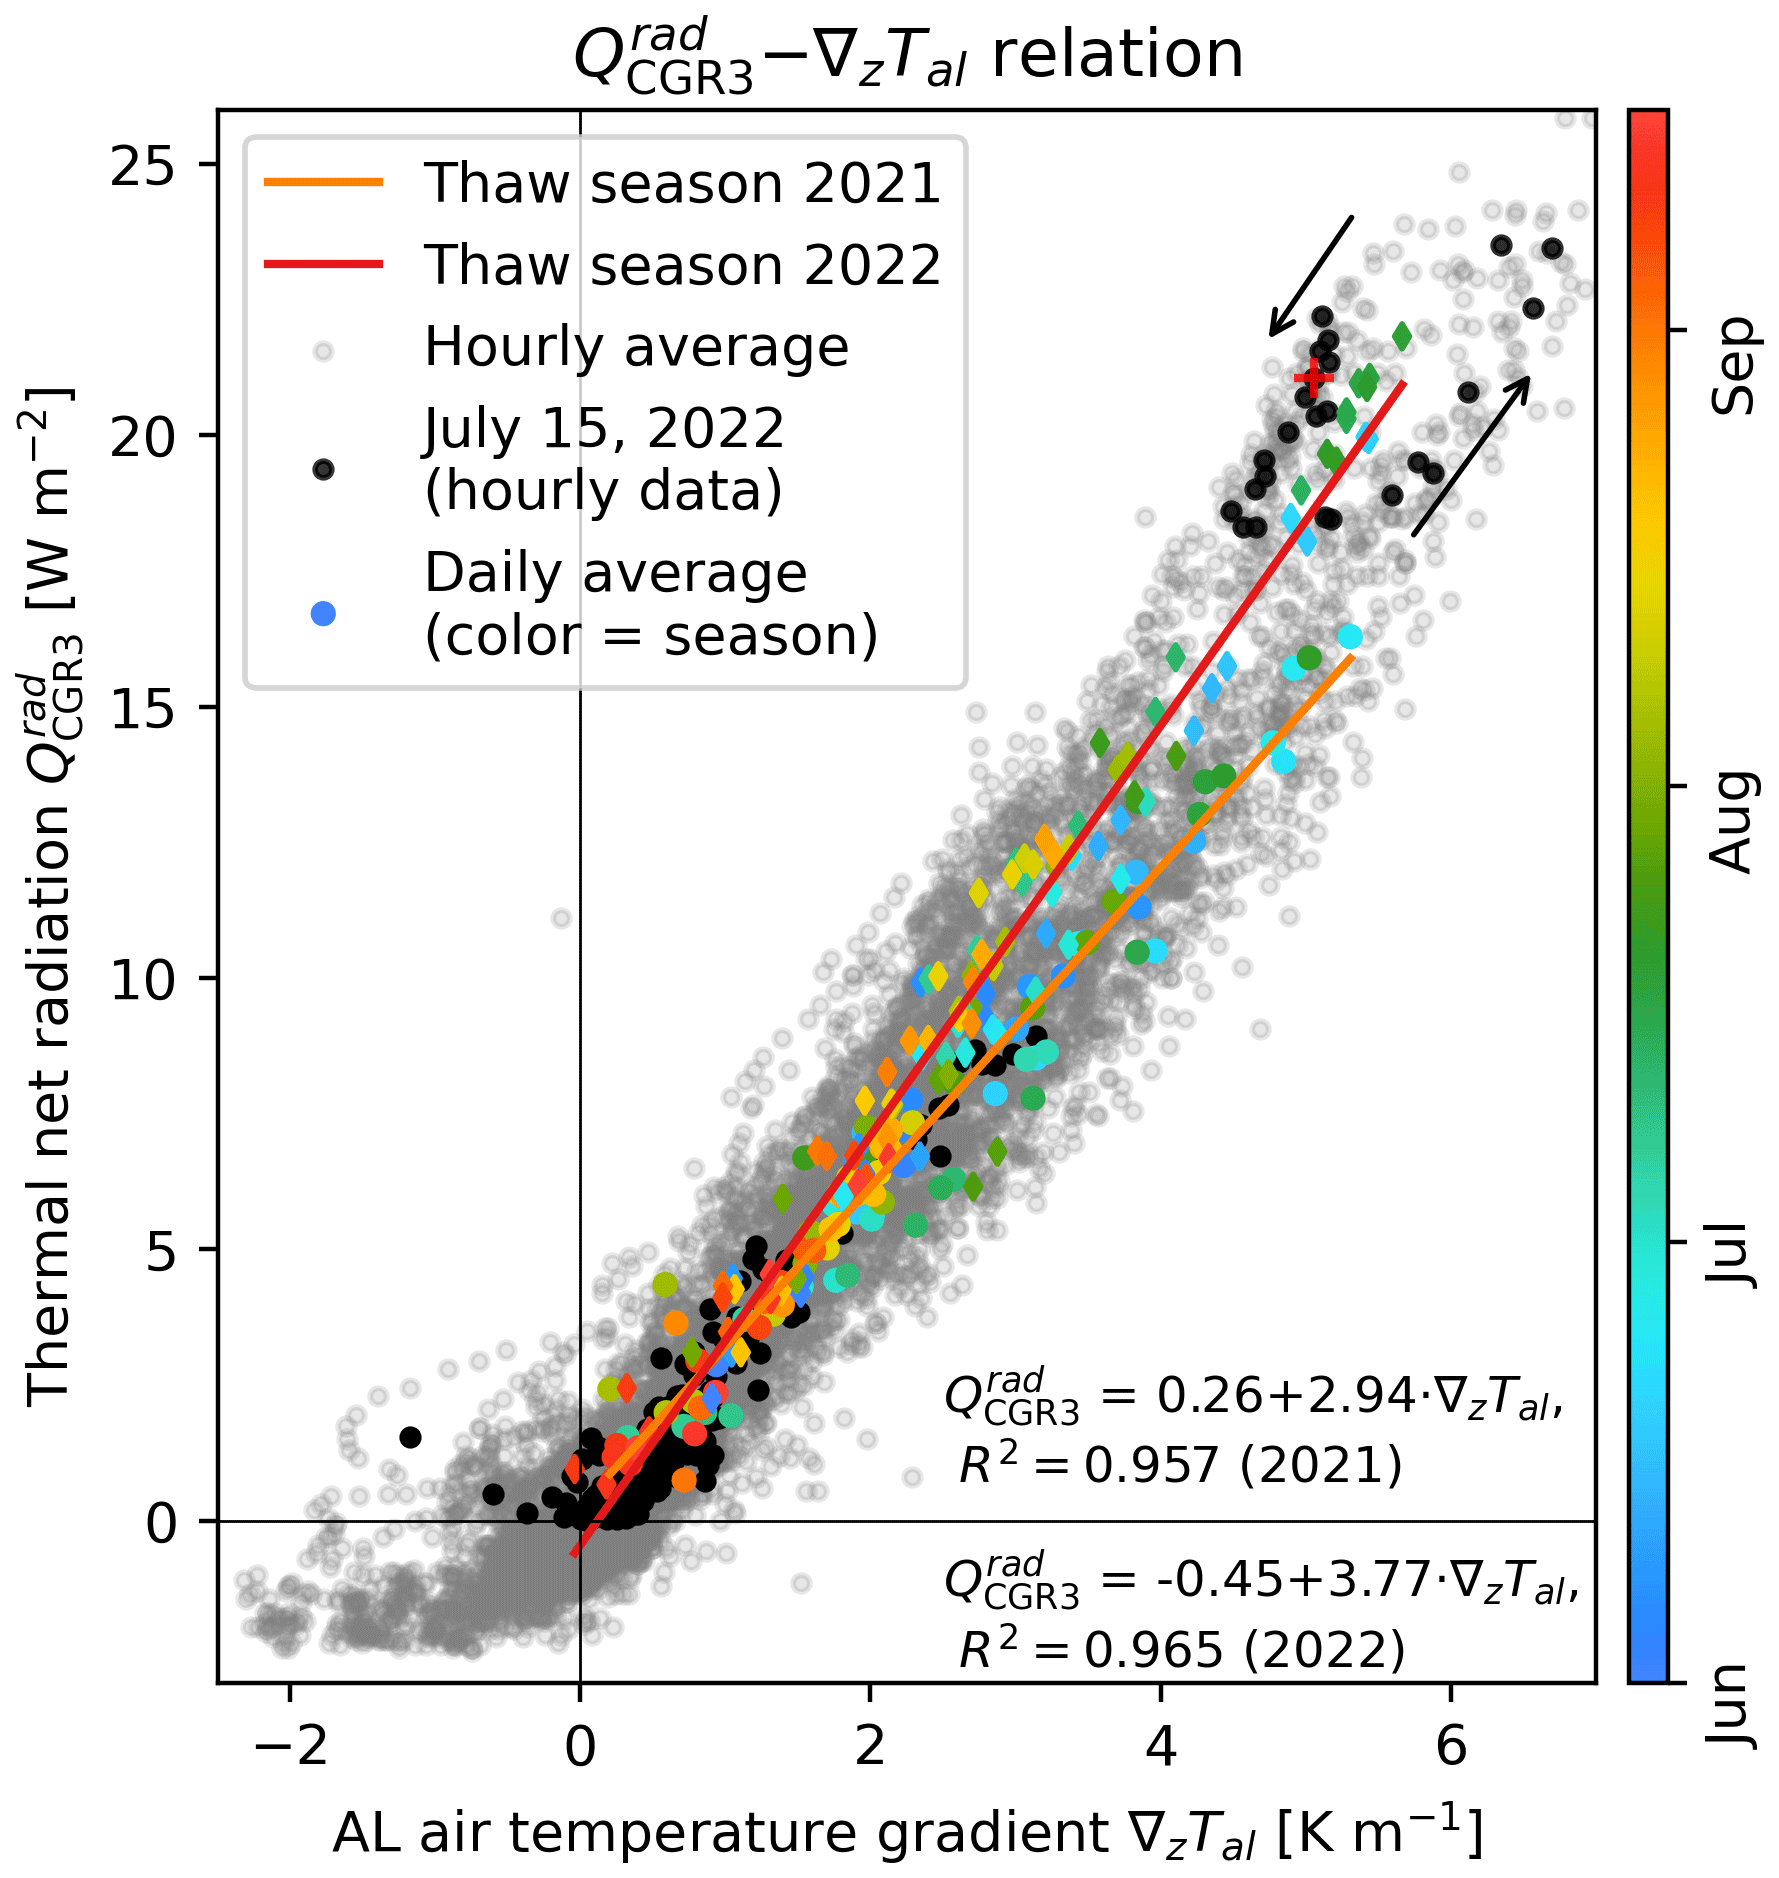
During the thaw seasons, daily average thermal net radiation is strongly correlated with the vertical AL air temperature gradient ∇zTal in the cavity, although the cavity is small enough that the air in the cavity is transparent to thermal radiation and does not participate in the radiative heat transfer (discussed in Appendix A). Linear regressions of daily average values of and ∇zTal yield (R2=0.957) for summer 2021 and (R2=0.965) for summer 2022 (Fig. 9), suggesting (for 2021) and (for 2022). These values refer to the timescale of an entire thaw season (hence the overbar in ). At that timescale, radiative–conductive heat transfer dominates, but it does not exclude convective heat transfer altogether. In fact, convection does occur and appears in the measurements when zooming in to sub-daily resolution. Plotting hourly values of a clear summer day (15 July 2022, as an example in Fig. 9) reveals clockwise “loops” caused by diurnal cycles of out of phase with ∇zTal (black points, midnight value marked by the red cross). AL air temperature leads, and thermal net radiation follows (discussed in Appendix A). Convection that contributes to the total heat transfer to a different extent likely explains the slightly different –∇zTal relation for the two thaw seasons 2021 and 2022. The independently calculated κa shows the influence of convection on the AL heat transfer parameter more clearly (Sect. 5.4.2).
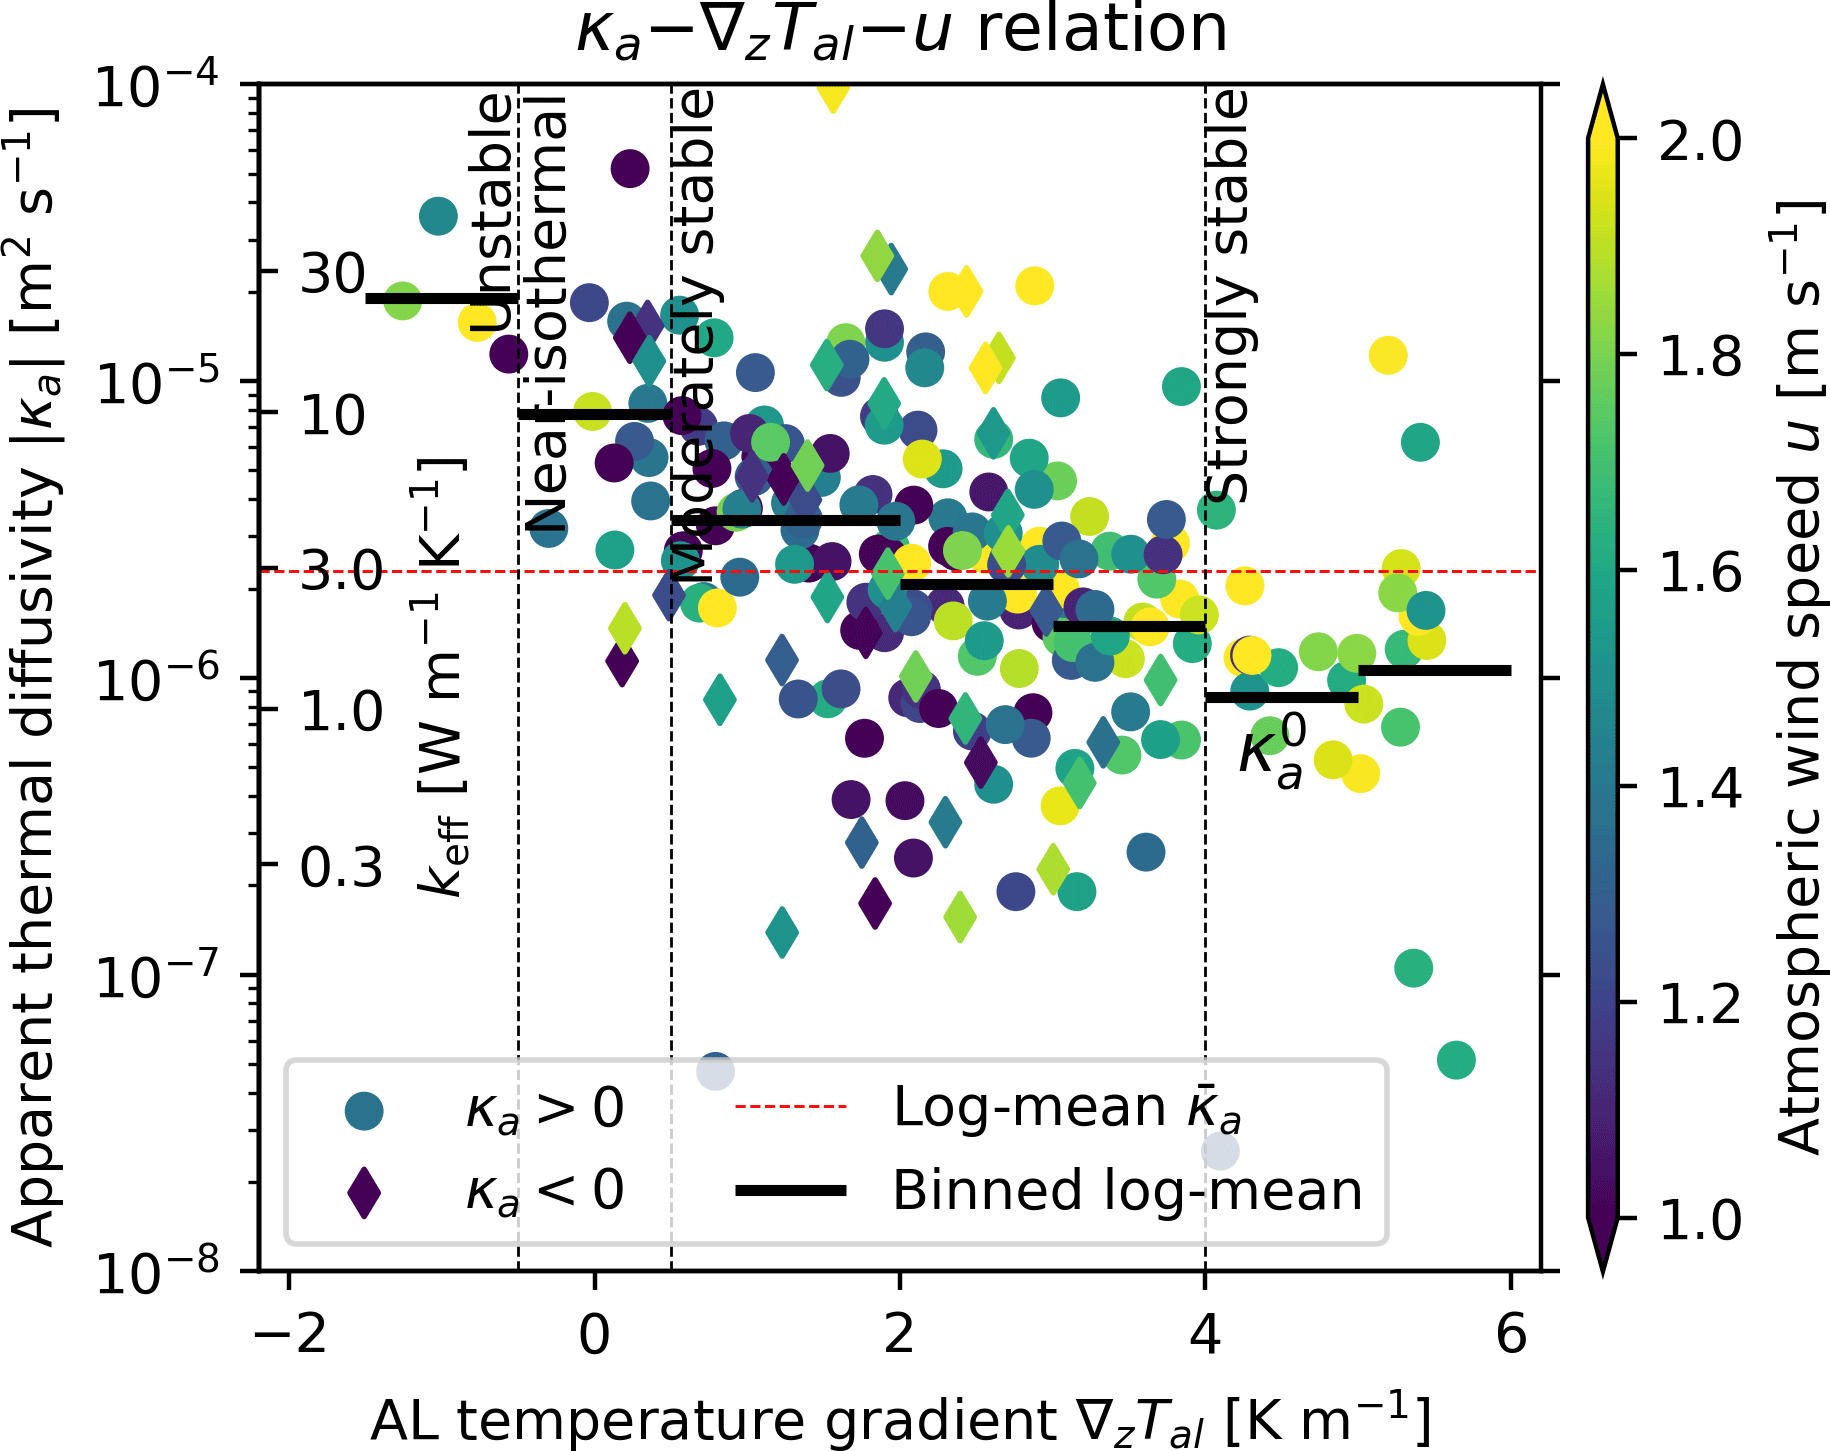
5.4.2 Daily apparent thermal diffusivity κa
The apparent thermal diffusivity κa (calculated from daily AL temperatures as outlined in Sect. 4.5.2, Eq. 18) during the 2021 and 2022 thaw seasons varies over 2 orders of magnitude between and and includes negative values (Fig. 10); κa systematically varies primarily with the AL temperature gradient ∇zTal and secondarily with the atmospheric wind speed u. On daily timescale, the impact of convective heat transfer on the heat transfer parameters appears; κa is largest at unstable or near-isothermal air stratification ( at ), has the largest scatter under weakly to moderately stable conditions (), and approaches at strongly stable air stratification (), where turbulence is suppressed, and convective heat transfer is minimal. The thaw-season log-mean is , which, converted to keff via Eq. (16), yields , in agreement with the independently estimated . Importantly, the simple explanation of an “insulating” AL in the literal sense of a low thermal conductivity falls short on Murtèl rock glacier: is that of the local bedrock (Schneider et al., 2012) or the underlying permafrost body (Weber and Cicoira, 2024) and roughly 10 times higher than that of the snowpack (Amschwand et al., 2024).
5.5 Sub-surface airflow
The same three variables that control κa (Fig. 10) – the snow cover, AL temperature gradient ∇zTal, and atmospheric wind speed u – also control the below-ground airflow speeds. Airflow speeds increase with negative ∇zTal and increasing u (Fig. E2a), as does κa (Fig. 10). Hence, the independent airflow speed measurements attest to the importance of convection. Airflow speeds (Fig. E1) differ seasonally in terms of (i) vertical airflow speed profile (depth of maximum speed) and (ii) temporal pattern (timing of diurnal oscillations). Figure 11 shows a data illustration of three characteristic air circulation modes that occurred on the days around the transition from thaw season to autumn 2020: (i) wind-forced shallow ventilation of the stably stratified AL air column; (ii) buoyancy-driven Rayleigh ventilation; and (iii) wind-forced mixing of the isothermal, labilised air column (“storm-wind mixing”). First, during the snow-free thaw season with unresisted AL–atmosphere connectivity, below-ground airflow follows a strong, regular diurnal cycle with an afternoon speed peak and calm nights (Fig. 11b), in phase with insolation, the surface temperature Ts, and the thermally driven (anabatic) local slope winds (Amschwand et al., 2024) (Fig. B1). This diurnal pattern is shared by all wind speed sensors. Airflow speeds are always highest near the surface (up to 20 cm s−1) and decrease with depth (see Evatt et al., 2015), except in the deeper parts of the instrumented main cavity. There, the lowermost WS/1 mounted in a narrow constriction (Fig. 3, Table 2) showed higher wind speeds and responded more sensitively than the WS/2 in the more spacious mid-cavity. However, this is due to the Venturi effect and does not detract from the general observation that wind-forced ventilation under stable temperature gradients decays with depth. At typical depths of the ground ice table (3–5 m), airflow speeds were low (close to the resolution limit of a few centimetres per second) but tended to be higher under strong atmospheric winds. Hence, the effect of wind-forced convection under stable AL temperature gradients is weak but detectable down to 3 m depth in the spacious instrumented cavity (Fig. E2a). Second, wind most efficiently mixes an isothermal, labilised AL air column like that, for example, in October 2020 (Fig. 11). This storm-wind mixing had little impact on Murtèl's ground thermal regime because the AL is rarely isothermal under snow-free conditions. Third, typically in autumn, Rayleigh ventilation under unstable temperature gradients sets the entire air column in motion and leads to rapid cooling of the entire AL within hours to days, for example in late September 2020 (Figs. 6b, 11).
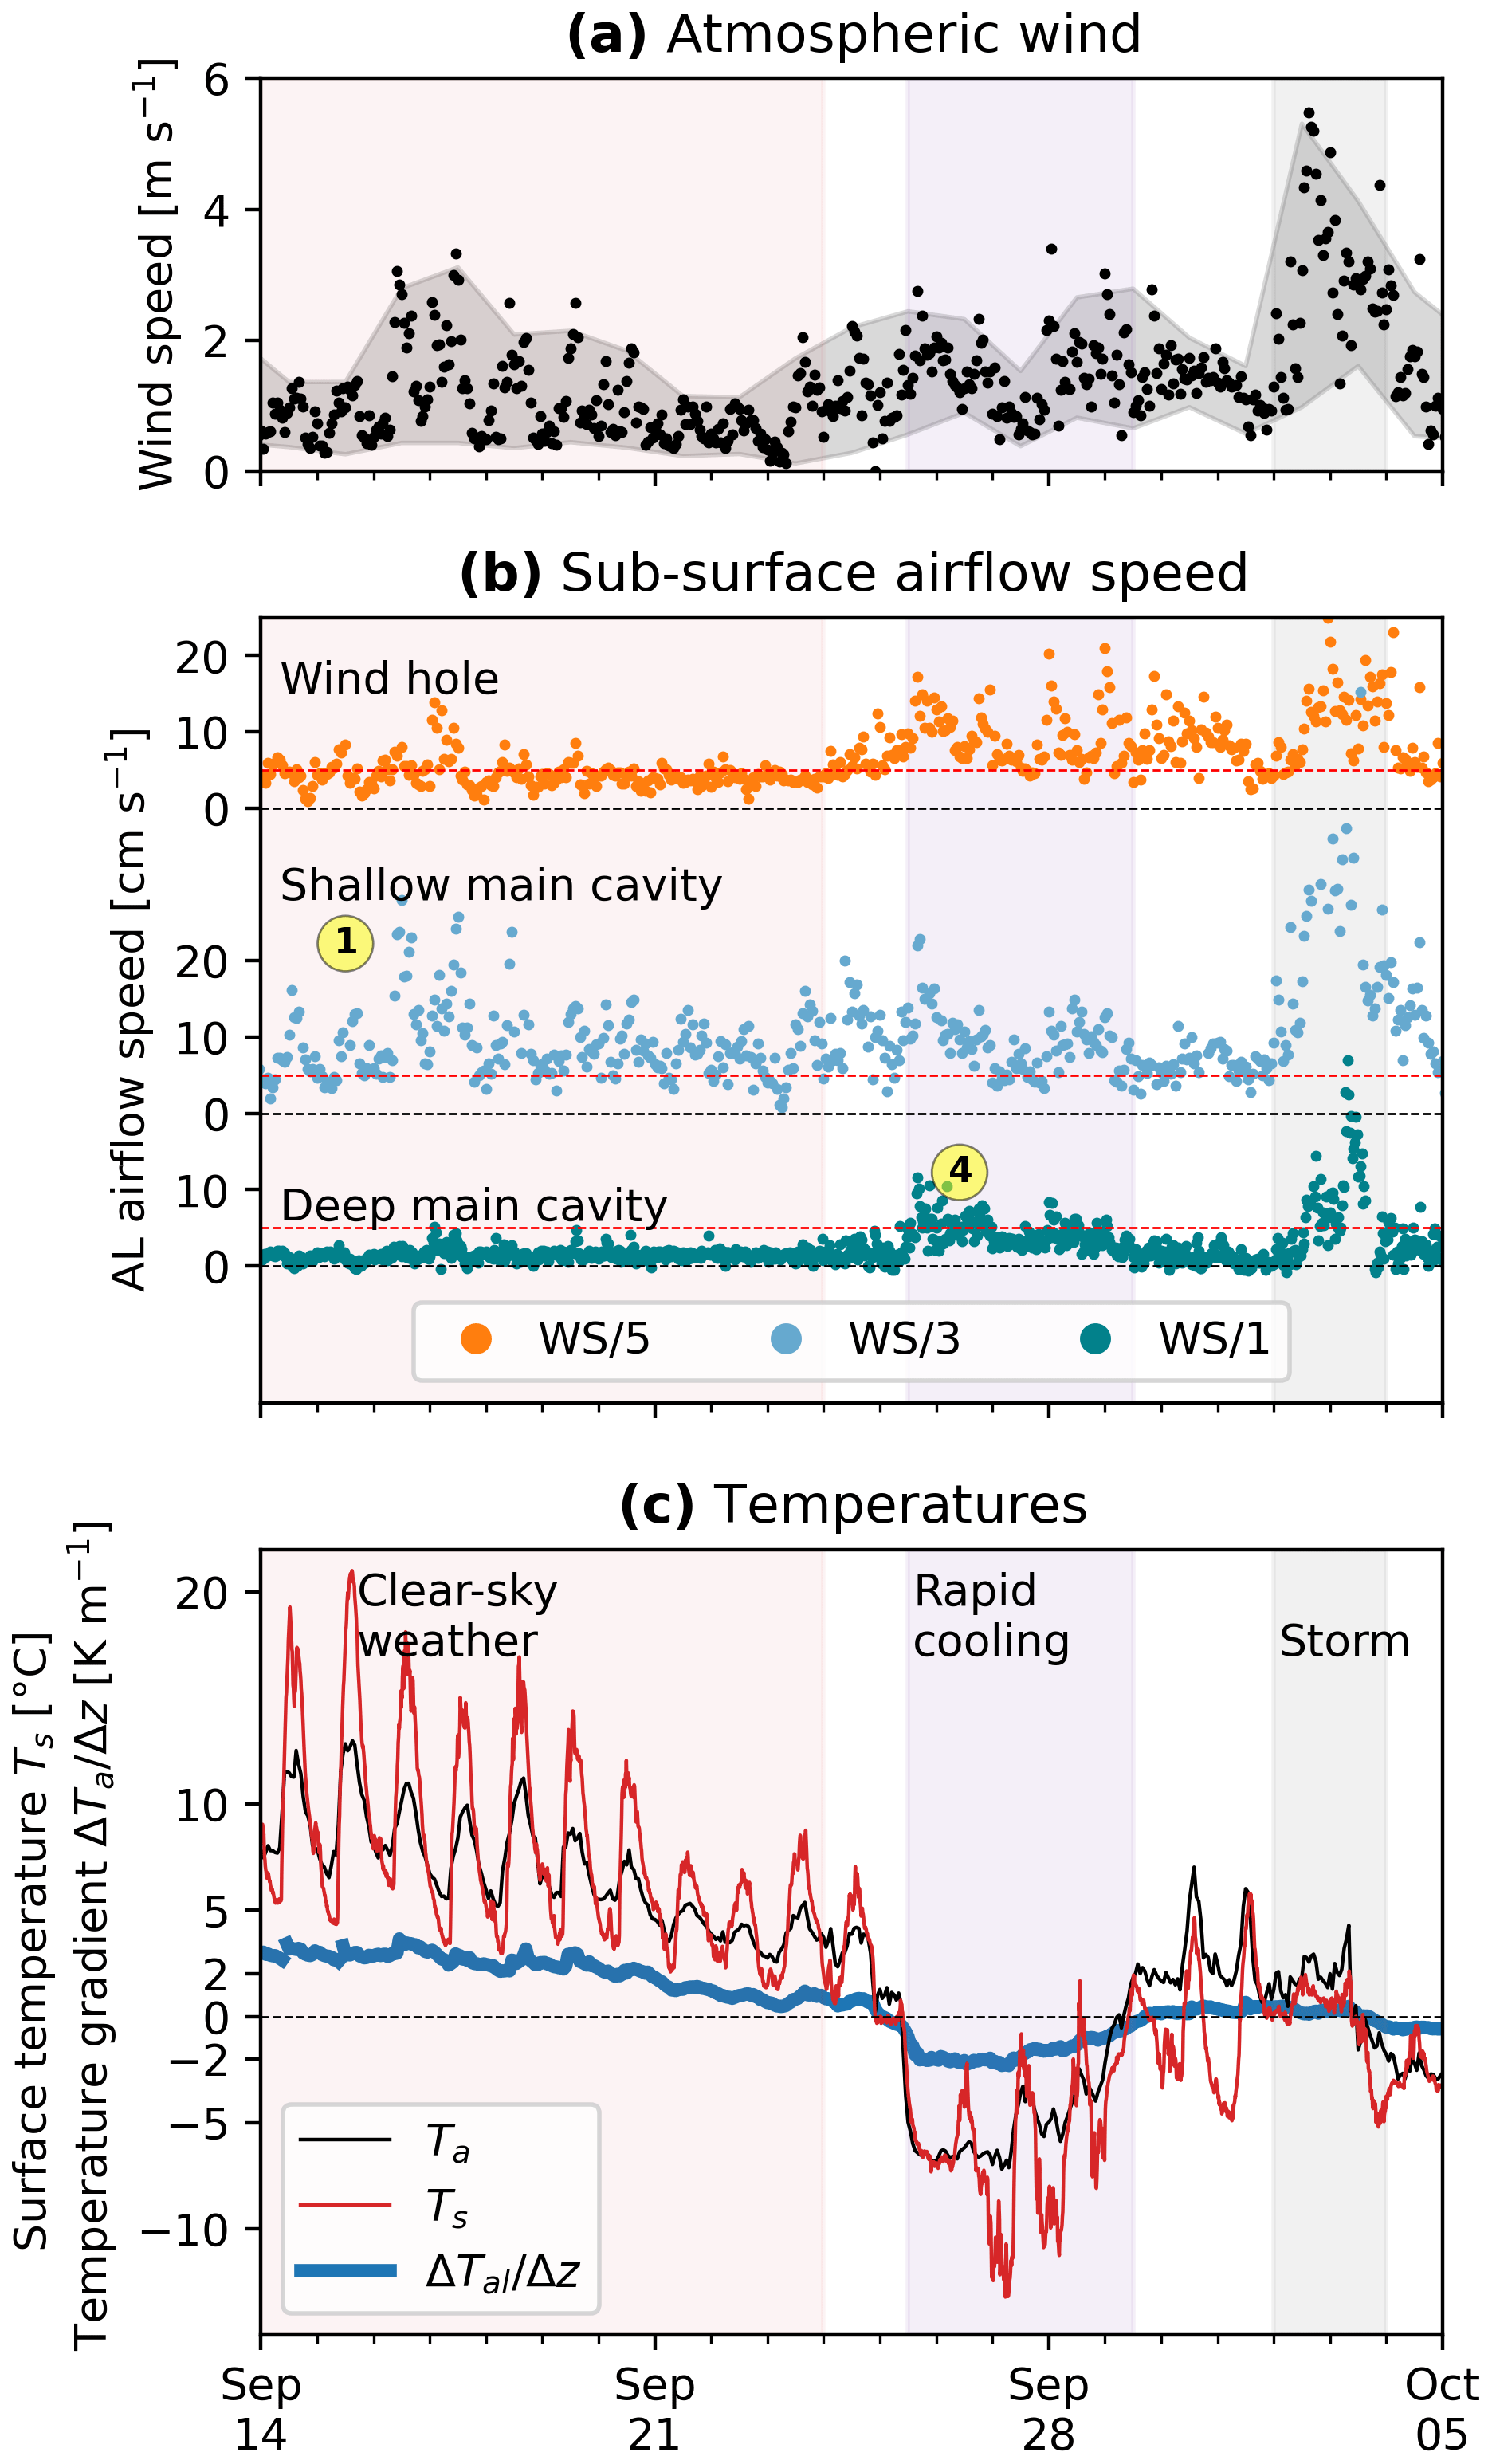
Figure 11Close-up of the autumnal cooling in 2020 that illustrates the different air circulation modes in the coarse blocky AL. Above-surface meteorological conditions (insolation and surface temperature, wind speed) and the ground thermal regime (vertical temperature gradient) interact to produce characteristic air circulation modes. (a) Atmospheric wind speed. (b) Strong diurnal surface heating with shallow wind-forced ventilation (WS/3) is characteristic of clear summer days ①. Stable air stratification allows only weak circulation in the deep cavity (WS/1) despite occasionally strong winds. Rapid surface cooling destabilises the air column and produces buoyancy-driven circulation (Rayleigh ventilation ④). Vigorous mechanical mixing of the isothermal, labile air column by strong winds rarely occurs because it requires an isothermal air column under snow-free conditions. (c) Temperatures. (The circled numbers ① and ④ refer to Table 3).
In winter (Fig. E1; not shown in Fig. 11), the amount of snow controls the strength of the air circulation and possibly also the pathways. The thicker the snow cover and the stronger the decoupling between AL and atmosphere (AL–atmosphere coupling in Amschwand et al., 2024), the more important density contrasts become to drive the air circulation (buoyancy-driven ventilation), however at overall lower airflow speeds (Fig. E2b–c). Under a thick snow cover in winter 2020–2021, AL airflow is weak and beneath the level of detection at all sensors and depths. For example, the wind hole instrumented with the WS/5 was completely snowed up and closed. In the snow-poor winter 2021–2022, AL circulation resumed in December 2021, 1 month after the onset of the snow cover. Measured air circulation is most vigorous and persistent in a rock glacier furrow, a topographic depression (WS/6 in Fig. E1), and tends to increase with depth. The airflow follows a regular diurnal cycle with nocturnal speed peaks and calm days, in phase with thermally driven (katabatic) local slope winds (Amschwand et al., 2024). The timing and vertical speed profile of wintertime diurnal oscillation are opposite to the “summer mode”, however much weaker and not as regular as in summer.
5.6 Seasonal AL ice turnover
5.6.1 Stake measurements
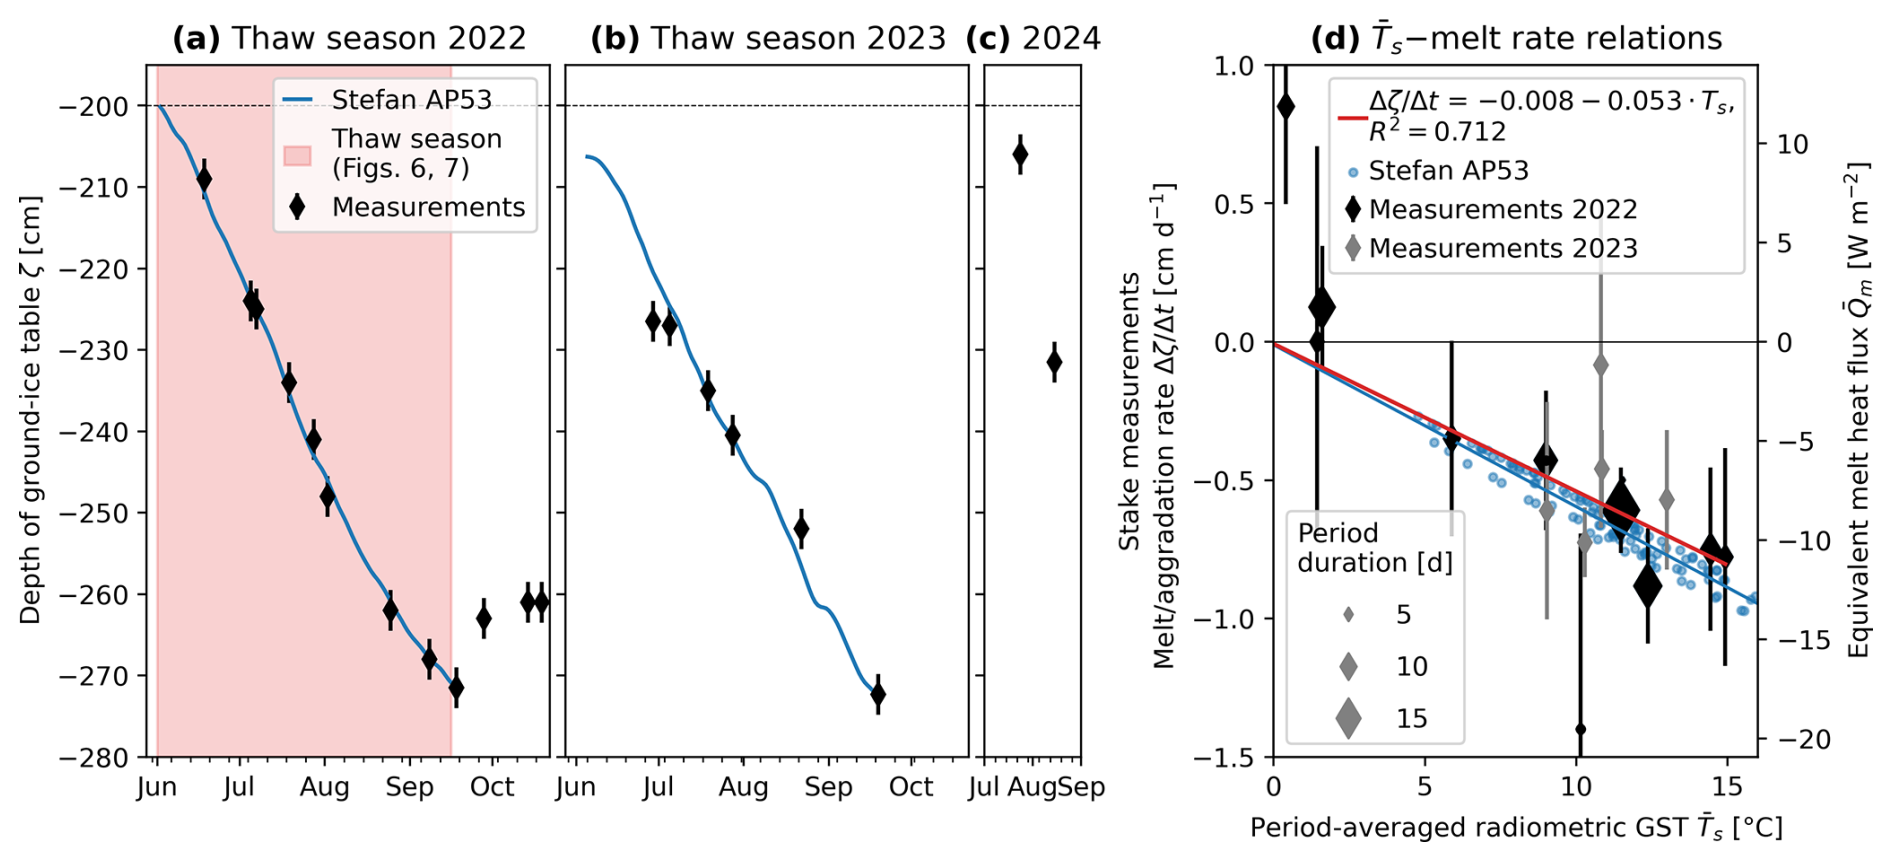
The ground ice is rarely accessible in coarse blocky landforms. Here, we present one of few (to our knowledge) in situ measurements of the seasonal turnover of superimposed AL ice in rock glaciers and periglacial landforms like block fields (Sawada et al., 2003; Marchenko et al., 2012, 2024). The ground ice table as measured at the stake in a rock glacier furrow deepened by 60 cm during the thaw season June–September 2022 rose by (at least) 40 cm in winter 2022–2023, deepened again by 40 cm in July–September 2023, and rose by 60 cm in winter 2023–2024 (Fig. 12a–c). The stake measurements show no local AL thickening for the years 2022–2024. At least locally in the rock glacier furrow, the ground ice that melted during each thaw season was regenerated by trapping in-blown snow and refreezing snowmelt in the following winter and spring, resulting in a substantial turnover (build-up and melt) of within the coarse blocky AL (equivalent to Δζ ϕal ρi=220 mm water equivalent, w.e.). Note that the lowering of the ground ice table is observed within the blocky AL, i.e. needs to be multiplied by the AL porosity ϕal and ice density ρi to obtain an ablation in the glaciological sense (in water equivalent).
The amount of ice lost due to melt is equivalent to a heat flux of on average during the 2022 thaw season (porosity in Eq. 7; Fig. 12d), in good agreement with (Fig. 8). The melt/thaw rates accelerate and decelerate, with a peak in mid-July, proportional to the ground surface temperature (within their uncertainty) throughout the thaw season (Fig. 12d). Measured melt rates are independent of the time elapsed since onset of the thaw season. This justifies the two-layer Stefan equation (Eq. 12) because the one-layer Stefan equation (Eq. 10) predicts , with thaw rates rapidly slowing down as the thaw front recedes away from the surface.
5.6.2 Stefan parameterisation
With a priori derived from our measurements (Sect. 5.4) and (saturation), the best-fit parameters for Eq. 12 are and (Fig. 12a). This relation based on 2022 data predicts the 2023 ablation rates well (Fig. 12b). The estimated is 50 % thicker than the actual distance to the initial ground ice table (∼2 m), but still plausible given the rough terrain and input data uncertainties: the “excess” overburden/insulation might compensate for the likely too-high forcing thaw index It(Ts) in the shaded furrow, as It(Ts) is derived from the PERMOS outgoing long-wave radiation on a sun-exposed plateau.
6.1 AL energy budget: thaw-season heat uptake and partitioning
6.1.1 Heat uptake driven by earlier snow melt-out and hot and dry summer weather
During the thaw season, the AL is a net heat sink. Figure 14 shows the cumulative heat uptake during the two thaw seasons 2021 and 2022. At the onset of the thaw season, which coincides with the disappearance of the snow cover, the AL exits the zero-curtain-phase isothermal at 0 °C (Fig. 7a). This is the thermodynamic zero level 0 MJ m−2 in Fig. 14. The sensible heat content is zero at the onset and end of the thaw season. During the thaw season, the AL is a heat sink that absorbs roughly 10 % of the surface net radiation Q∗ (not to be confused with the below-ground long-wave/thermal net radiation ; Fig. 14), hence (Amschwand et al., 2024), in both thaw seasons until the middle/end of August. Roughly 90 % of Q∗ is exported back into the atmosphere via sensible and latent turbulent fluxes (Fig. 13 in Amschwand et al., 2024), but the rock glacier is vulnerable to hot and dry weather spells.
The total heat uptake during the thaw season is first controlled by the date of the thaw-season onset, that is, the snow melt-out date, in turn controlled by winter precipitation and spring weather. A warm autumn also extends the thaw season, and September heat waves can bring in heat almost at August rates (August–September 2023; Table 4), but the impact is presumably less severe than an earlier onset in spring because solar radiation is less intense then. After the snow-poor winter 2021–2022, the thaw season 2022 started 1 month earlier than in 2021 and received almost twice the amount of heat, 93.7 MJ m−2 instead of 52.1 MJ m−2, although the thaw season lasted only 15 d longer (Table 5). A 1-month-earlier snow melt-out at the beginning of June instead of the beginning of July caused a heat uptake of , amounting to ∼40 % of the entire 2022 heat uptake. A snow-free June alone brings in over 70 % of the entire 2021 heat uptake. Weather conditions during the thaw season also matter: hot and dry weather spells deplete the water and ice stores in the AL, decrease its latent buffer capacity (Sect. 6.2), and enhance the downward heat transfer (heat uptake ratio by ; Fig. 14b2) (Amschwand et al., 2024). Based on , the 1 July–15 September heat uptake (a period common to both thaw seasons) in 2022 was 16.8 MJ m−2 higher than in the 2.3 °C cooler summer 2021 (Table 4), an increase of 33 %, roughly corresponding to 10 d worth of heat uptake in June. Importantly, proportionally more heat from the surface net radiation Q∗ was also transferred to deeper AL levels, 8.9 % (of 748 MJ m−2) in 2022 compared to 7.5 % (of 664 MJ m−2) in 2021. Thaw season 2023 was overall similar to 2022, except for a warmer September.
Table 4Monthly average air temperatures [°C], cumulative heat uptake ΣtQr [MJ m−2], and average daily heat uptake rate [] for the thaw seasons 2021–2023. Heat uptake into the AL is most intense in July.
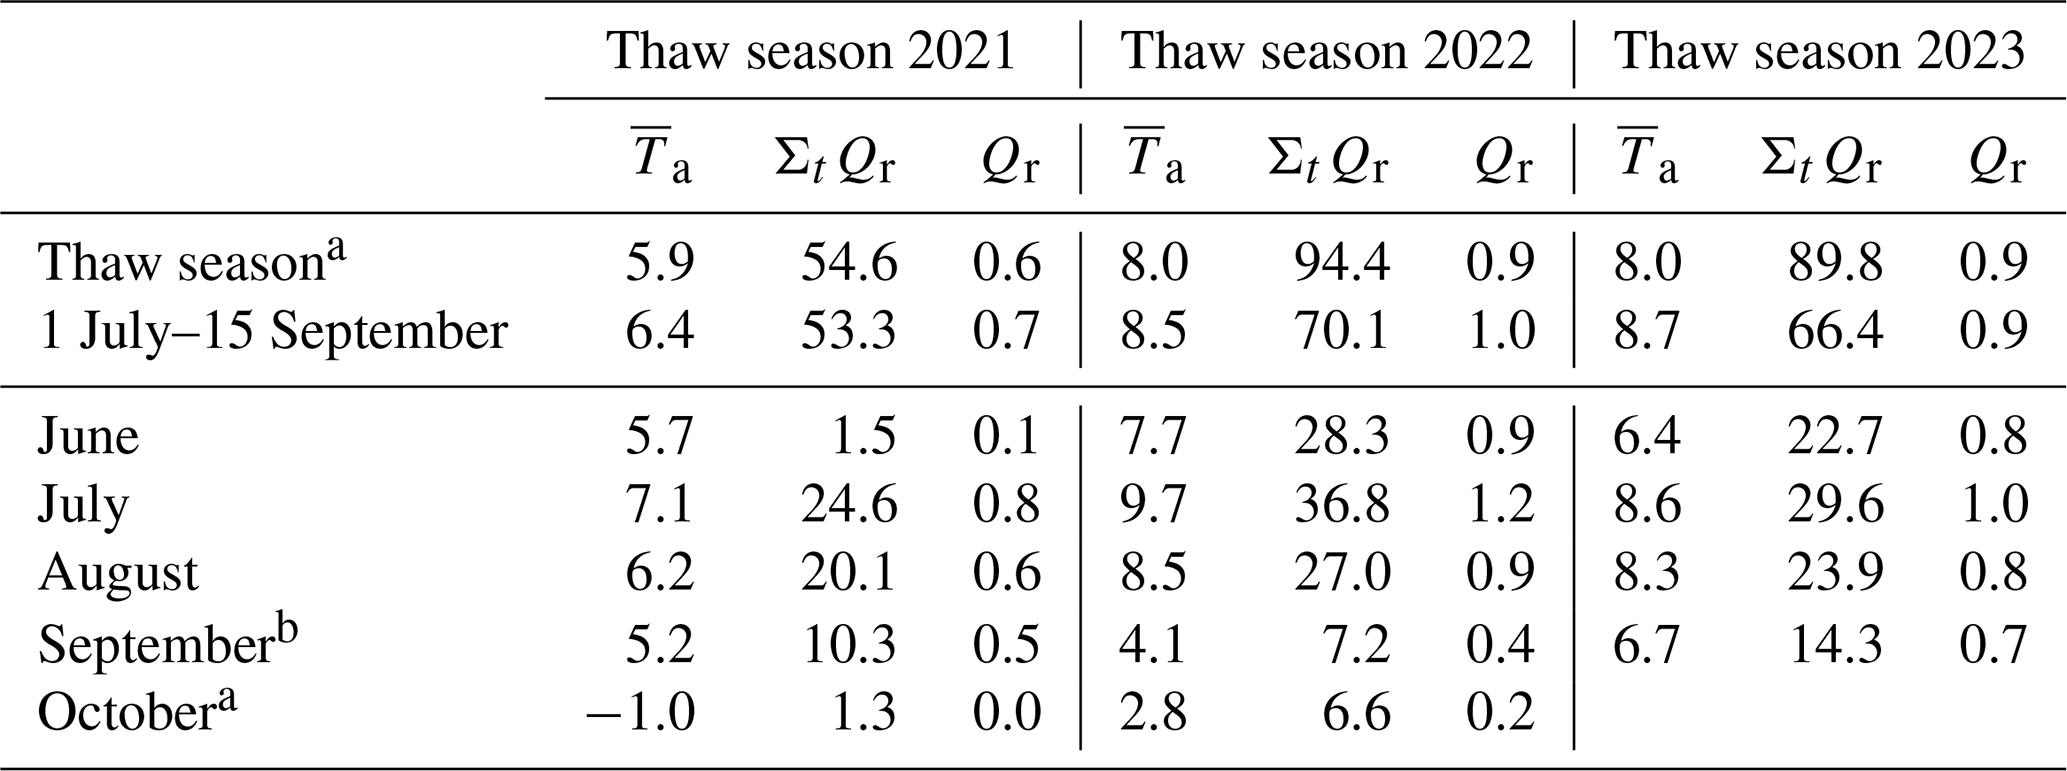
a In 2023: data until 20 September (rockfall). b Period 1–20 September, limited by 2023 data.
Hence, two forcings mainly control the total heat uptake of the AL during the thaw season, (i) its date of onset and (ii) weather conditions. With our quantitative data, we can attempt to estimate how strongly each of these forcings impacts Murtèl by unravelling how much heat is taken up by the AL in response to (i) the trend towards earlier melt-out and (ii) the warming trend (Table 4). First, the June heat uptake scales with 0.9 times the number of snow-free June days (Fig. 13b), i.e. has a sensitivity of 1.1 MJ m−2 per snow-free June day. Second, the 1 July–15 September heat uptake scales with 6.6 times the air temperature increase with respect to the 2021 average (Fig. 13c), i.e. a sensitivity of 6.6 MJ m−2 per degree Celsius of summer warming. Translating these sensitivities to trends should be interpreted with utmost caution because the snowmelt (Matiu et al., 2021) and warming trends have a spatio-temporal variability and have accelerated in the recent decades, and the climate sensitivity is itself sensitive to the evolving AL properties (e.g. negative feedback by AL thickening (Haeberli et al., 2024), altered SEB). First, Hoelzle et al. (2022) (for Murtèl 1997–2018; Fig. 13a), Klein et al. (2016), and Matiu et al. (2021) report trends of earlier snowmelt of 1–5 d per decade × 1.1 MJ m−2 d−1 = 1.1–5.5 MJ m−2 per decade. Second, a warming trend (Hoelzle et al., 2022) of 0.4–0.7 °C per decade ×6.6 MJ m−2 (°C)−1 = 2.6–4.6 MJ m−2 per decade. The total AL heat uptake has likely been increasing by 4–10 MJ m−2 per decade (4 %–11 % of the 2022 heat uptake of 94 MJ m−2). This calculation is (to our knowledge) the first quantitative attempt to express the climate sensitivity of a rock glacier in numbers based on in situ heat flux measurements instead of modelling.
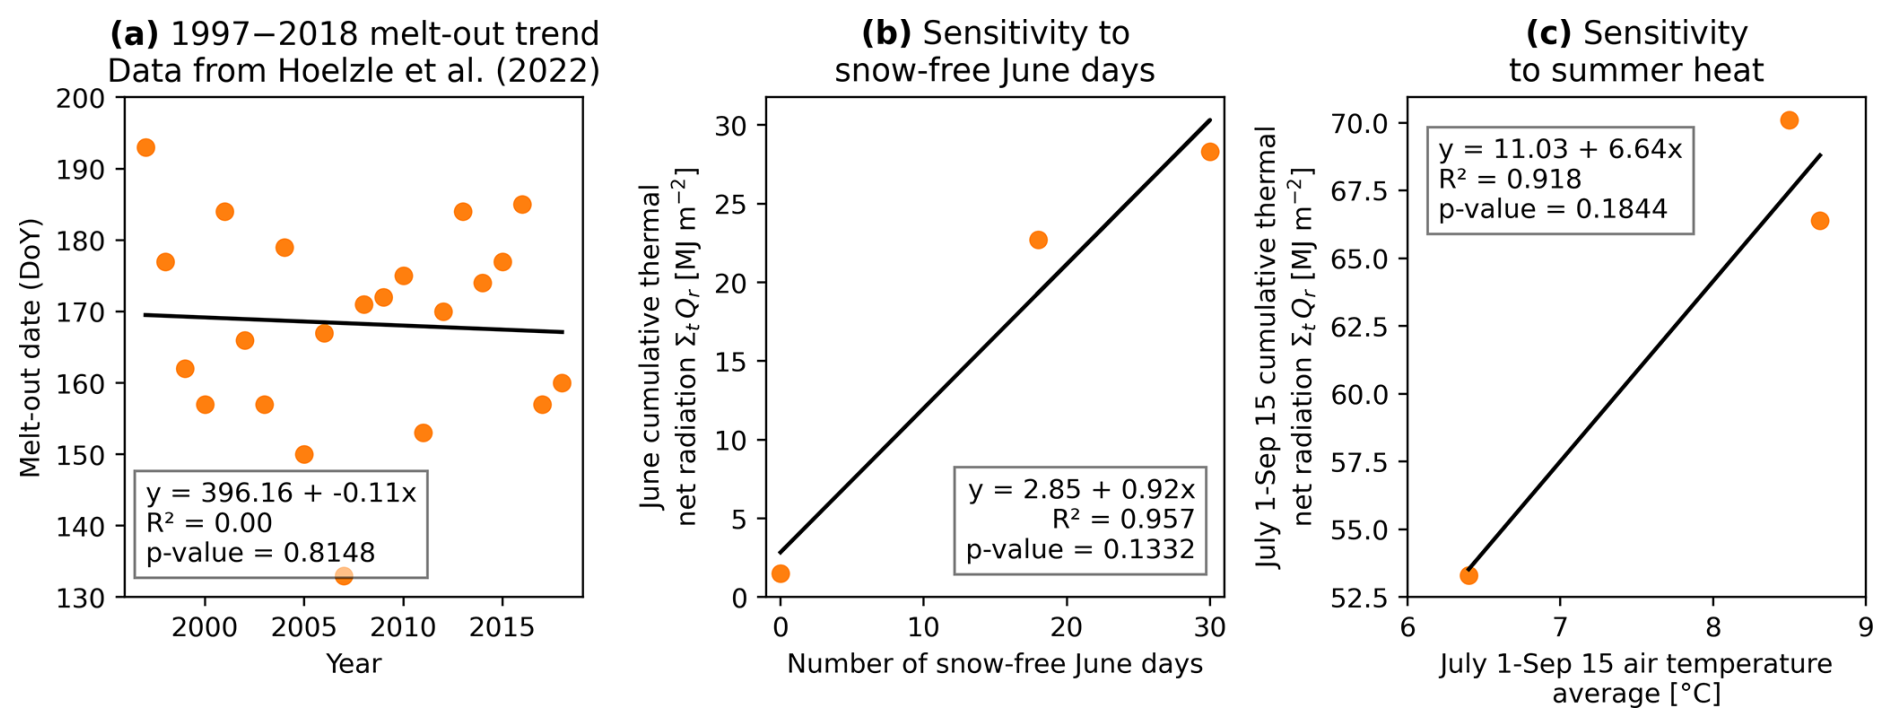
Figure 13(a) Melt-out trend at Murtèl (data from Hoelzle et al., 2022). The trend of −0.1 d yr−1 is not statistically significant because the time series is short compared to the inter-annual variability but is likely to continue with ongoing climate change. (a–b) The 2021–2023 sensitivity of the AL heat uptake: (b) the more snow-free days in June and (c) the warmer the July–September period, the larger the heat uptake.
The above calculation refers only to the thaw-season heat uptake. However, to fully assess the impact of climate change on Murtèl rock glacier (Scherler et al., 2013), the winter cooling needs to be accounted for as well, for both the AL and the permafrost body beneath. In a coarse blocky AL, only the amount of cold content that is converted to ground ice contributes to offsetting the heat uptake during the thaw season. No sensible cold content (Tal<0 °C) can be retained in the highly permeable AL flushed by snowmelt and warmed to 0 °C in spring (isothermal entering the zero curtain; Fig. 7). AL ice build-up is discussed in Sect. 6.2. The second process is building cold content of the permafrost body (rock glacier core) beneath by (preferentially convective) heat export through the AL and the snowpack (Luetschg et al., 2008). We discuss wintertime heat transfer in Sect. 6.4, while the year-round energy budget of the entire rock glacier (AL and permafrost body) is beyond the scope of this study.
6.1.2 Heat partitioning
The available heat from the surface ground heat flux QG is partitioned into sensible heat storage changes and latent heat storage changes (ice melt) Qm and conducted into the permafrost body beneath the AL QPF (Eq. 4, Table 5). On thaw-season average, QG is largely (∼70 %) spent on melting ground ice. Hence, latent heat effects contribute substantially to the thermal buffering. This is one process that renders rock glaciers climate-robust, as long as seasonal build-up of superimposed ice compensates for its melt (discussed in Sect. 6.2). Roughly ∼20 % of QG is absorbed by the coarse blocky AL as sensible heat storage . The heat conducted into the permafrost body beneath the AL QPF amounts to (∼10 % of QG), about 1 % of the available net radiation Q∗ at the surface ( in Table 5). The cumulative rain heat flux QPr (Eq. 5) is 11 MJ m−2 in the cool and wet summer 2021. QPr is a small flux compared to QG in 2022 (5 %–10 % considering the rainfall undercatch), but not in 2021 (20 %), and is in any case similar to QPF. Hence, the rain heat flux QPr has a weak cooling effect near the surface (), but potentially an important warming effect at depth (QPr≈QPF).
Table 5Thaw-season-average (avg) and cumulative total (cum) heat partitioning.
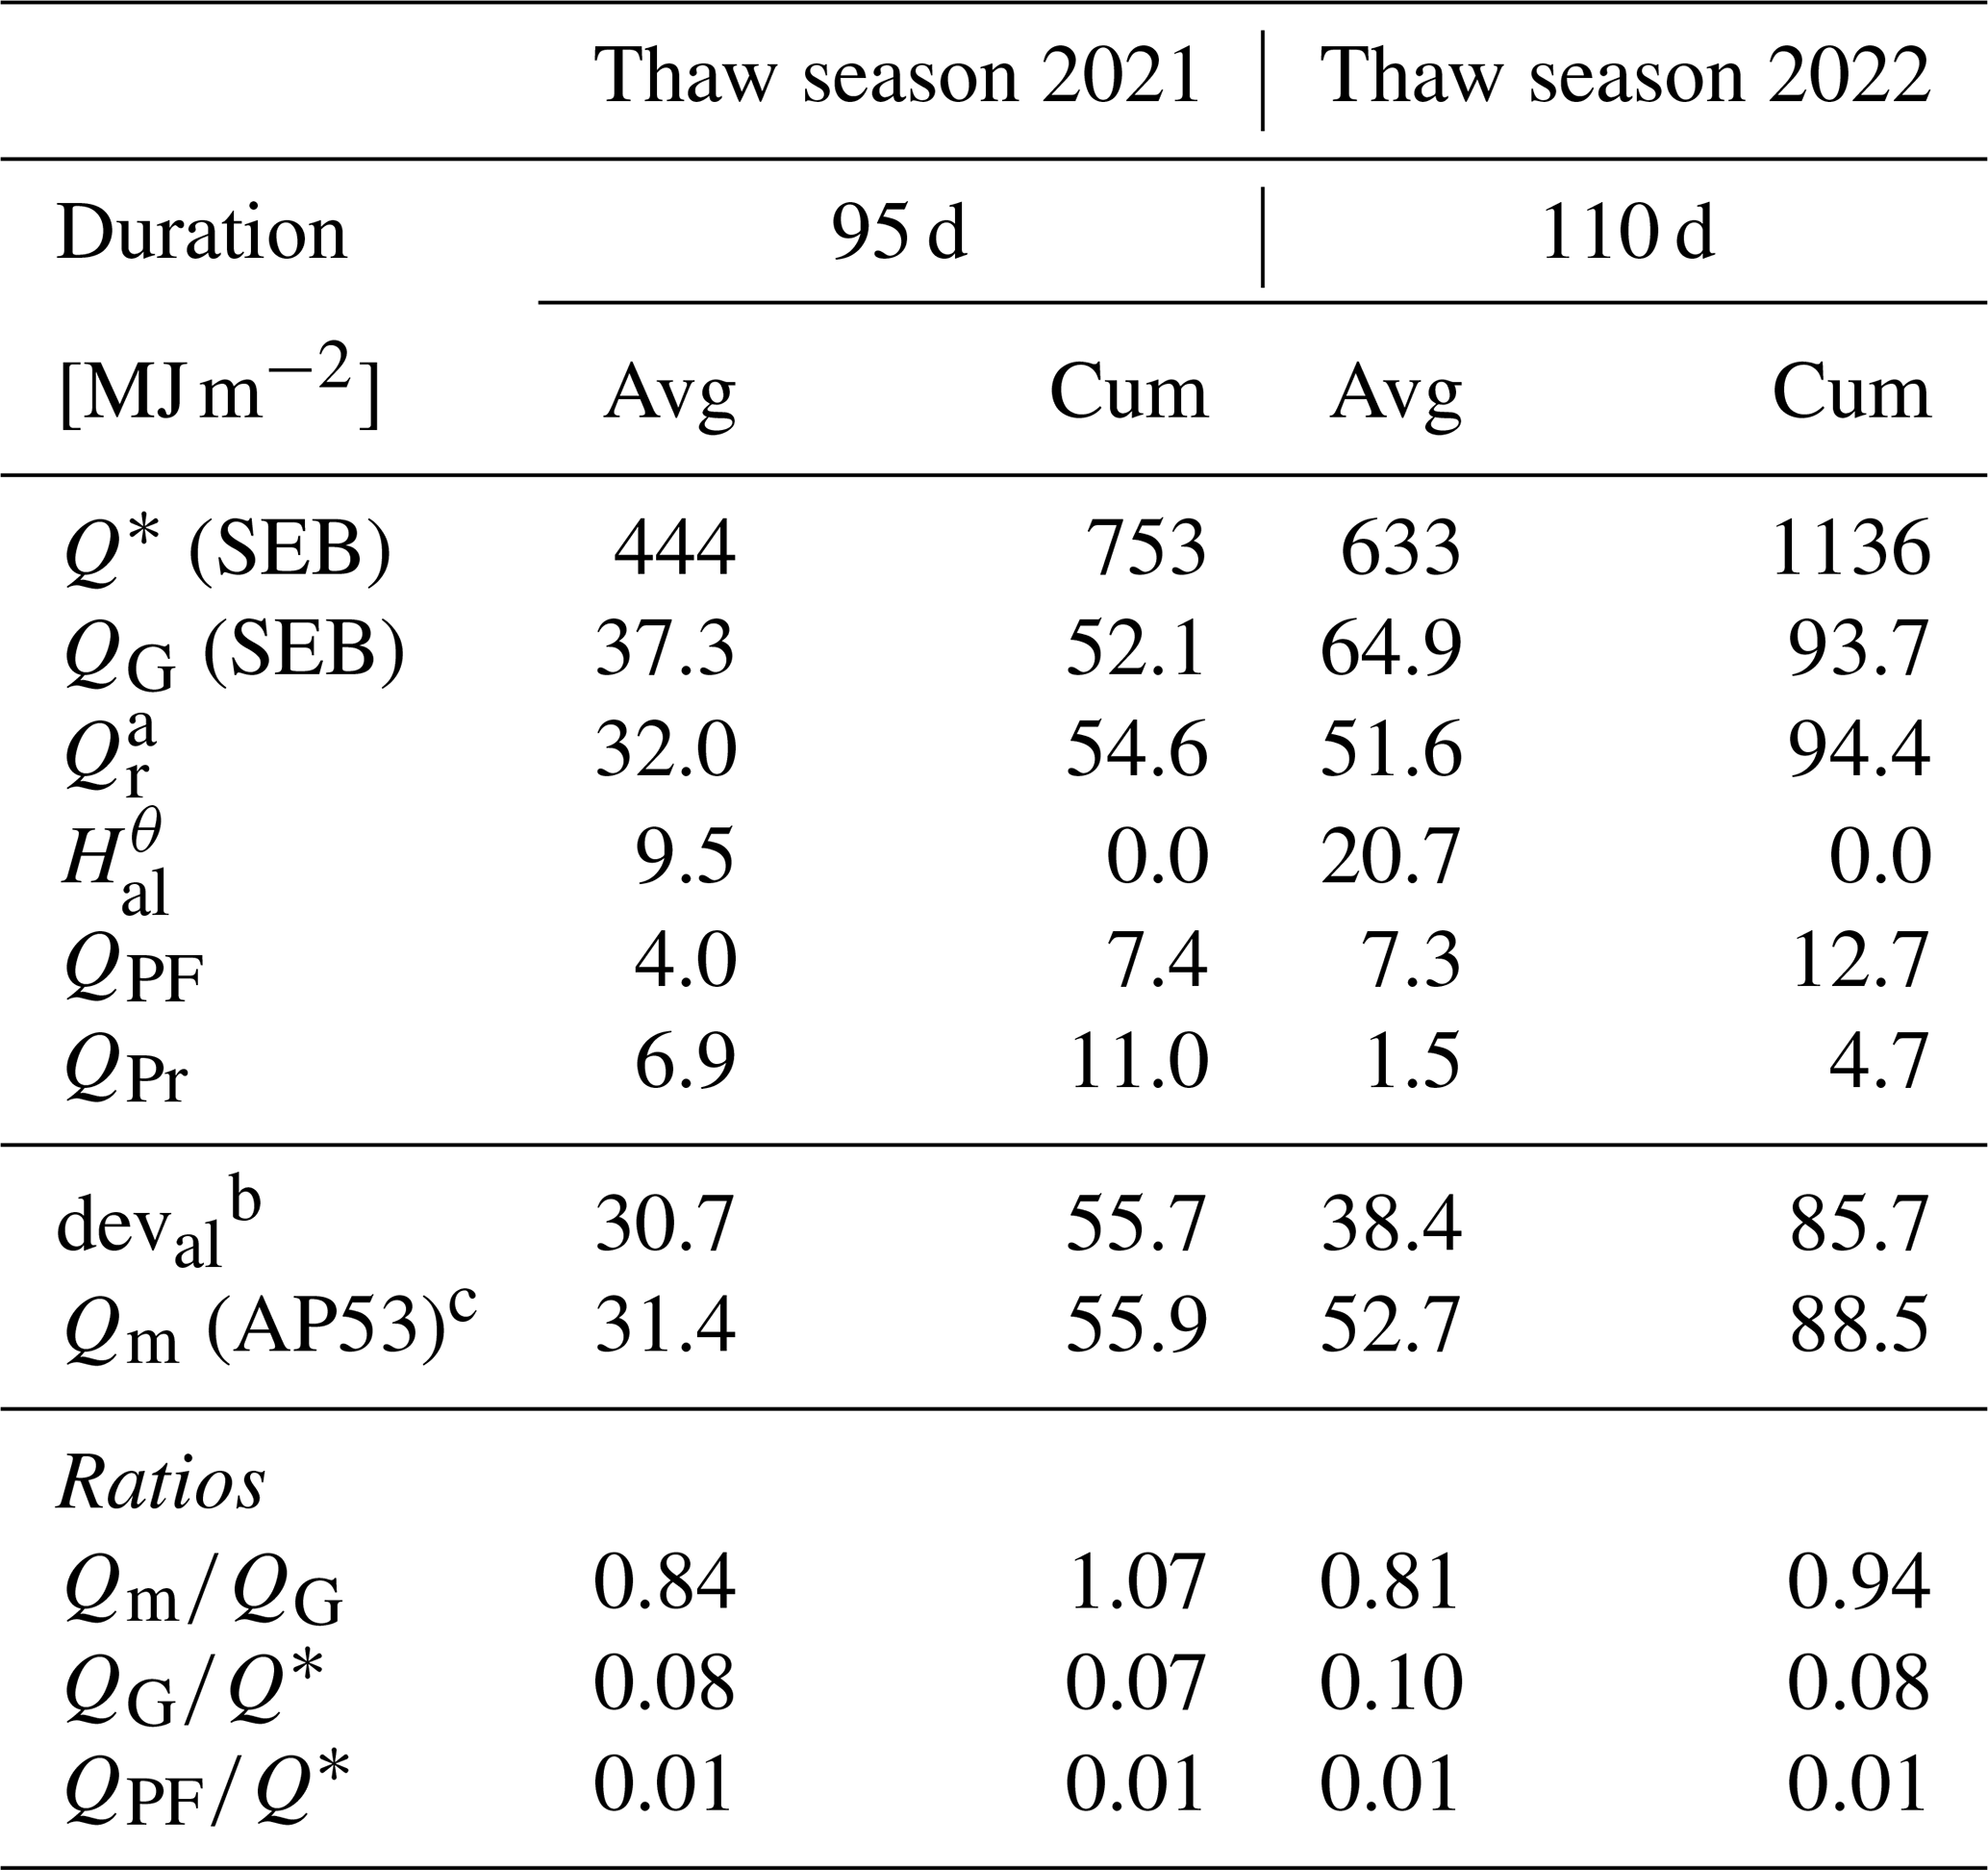
The thaw season is divided into two phases, an AL heating and a ground ice melting phase (Fig. 14a2, b2). Initially, the ice-poor shallow AL is heated from the surface downwards. During the first phase, the uptake of sensible heat takes 2–3 weeks to saturate at an average , after which the sensible heat storage changes little (and even slowly loses heat in late summer), and the heat goes mainly into ice melt. Due to the shallow AL and steep temperature gradients shortly after the thaw-season onset, is relatively large compared to (Fig. 14a2, b2). In the second phase, the near-surface AL does still warm and cool in response to the atmospheric forcing, but the sensible heat storage changes are small compared to the cumulative heat uptake.
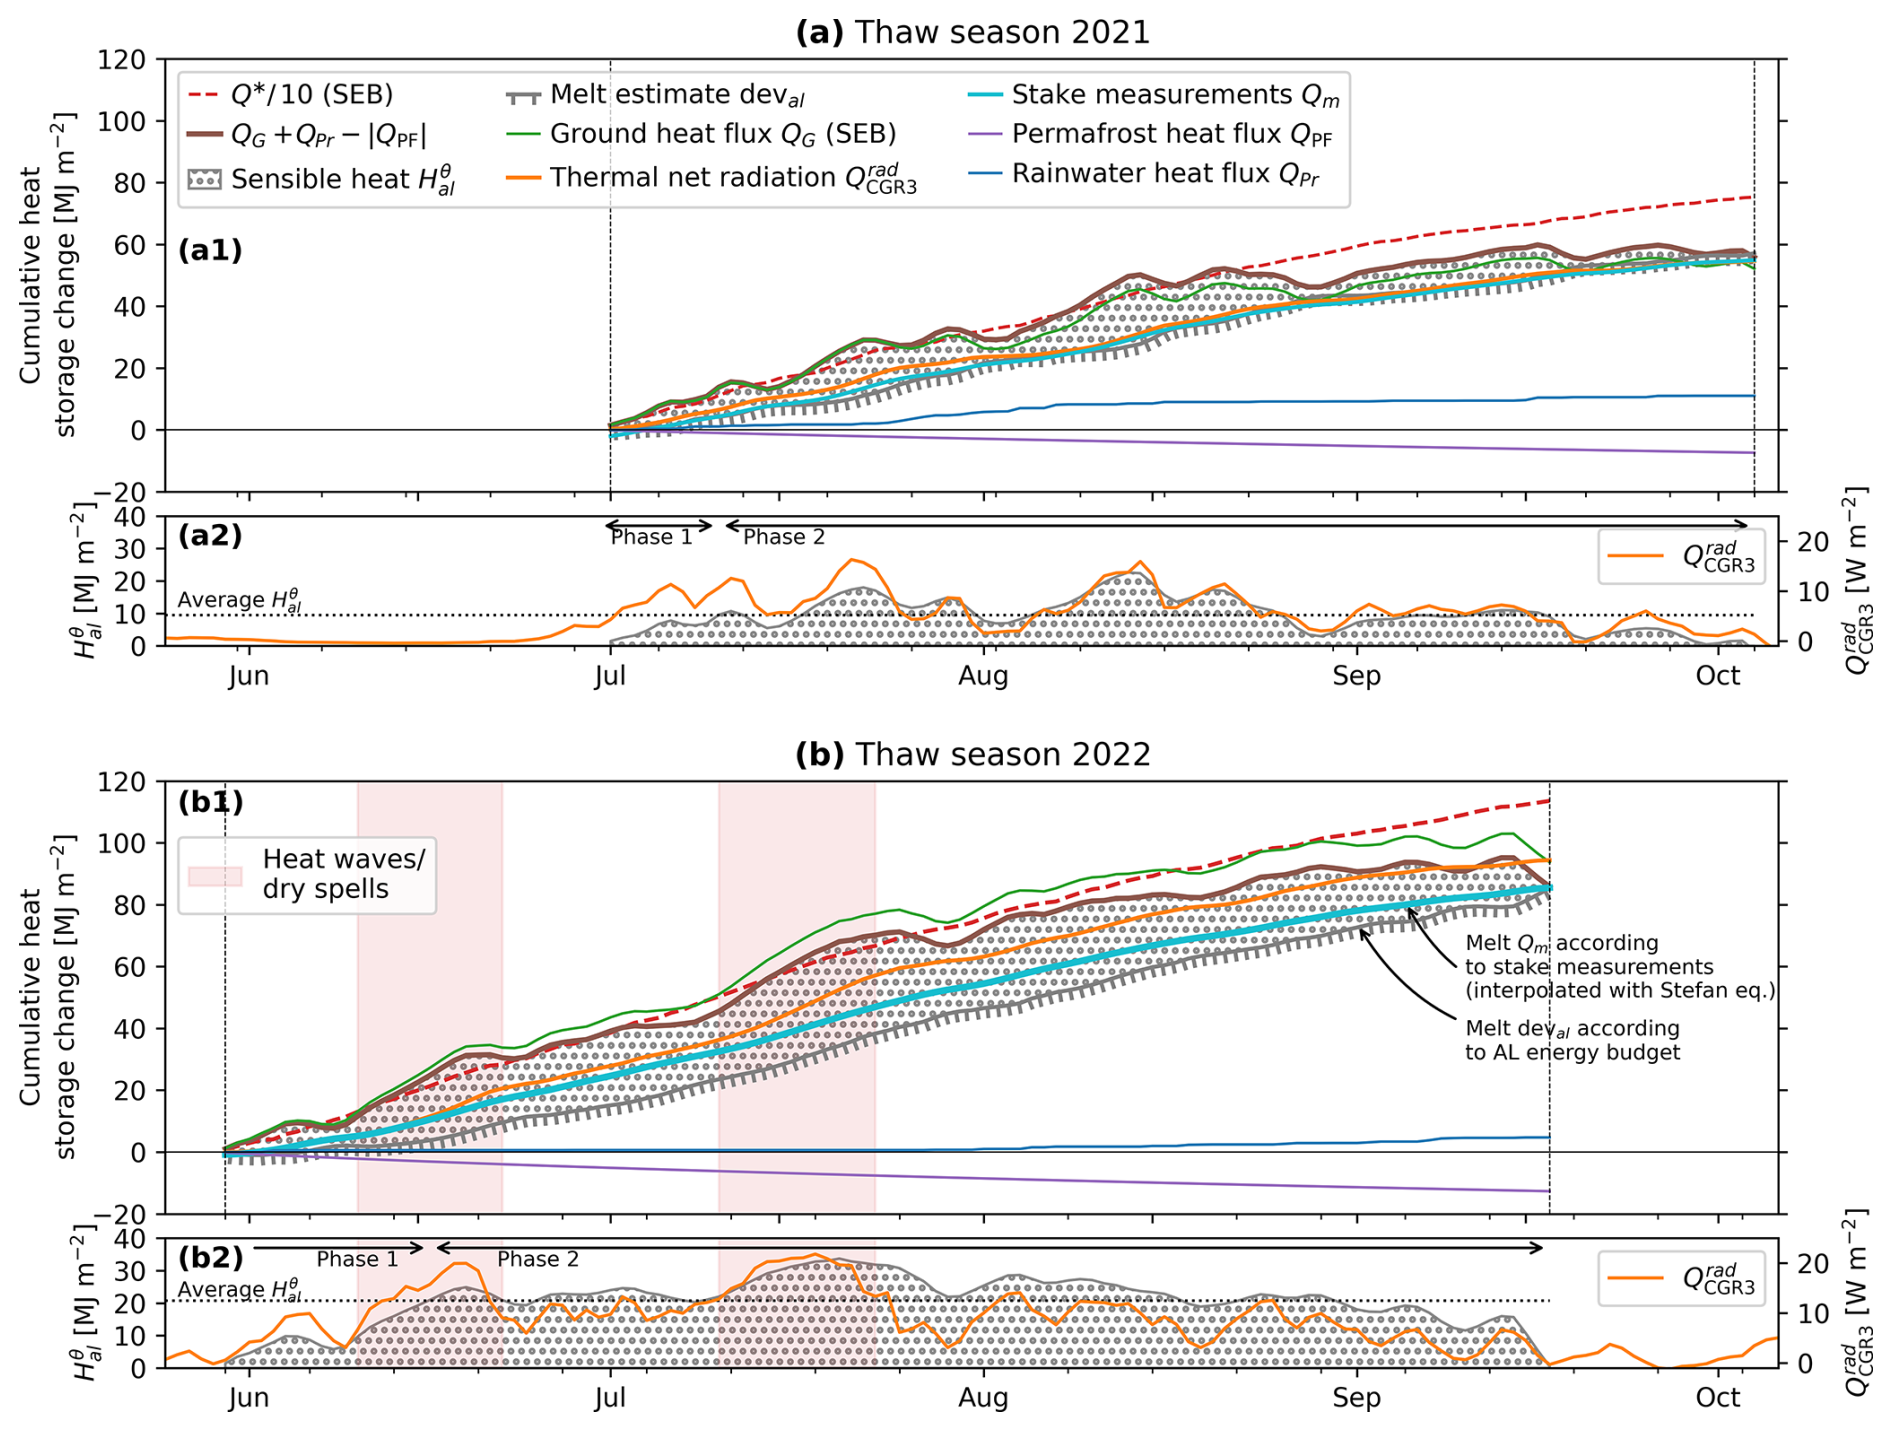
Figure 14Heat uptake and partitioning during the (a) 2021 and (b) 2022 thaw seasons. Most of the heat supplied to the AL is intercepted by melting ground ice. SEB refers to the Amschwand et al. (2024) surface energy balance. (a2, b2) Sensible heat storage and thermal net radiation are correlated. Phases 1 and 2 are explained in the text. The marked 2022 heat waves are also shown in Fig. 5.
6.2 The seasonal ice turnover in the AL: ice protects the underlying permafrost
The 2022 stake measurements (Fig. 12a–c) in the rock glacier furrow (interpolated and converted to Qm using Eqs. 12 and 7, respectively) agree within 10 MJ m−2 with the melt deval calculated from the AL energy budget in the nearby instrumented cavity (Eq. 4, Fig. 14b, Table 5). The AL budget, estimated in a broad ridge with thicker AL, predicted more sensible storage gains and less ice melt deval than the stake measurements Qm show for the narrow rock glacier furrow (see Fig. 2). The discrepancy relative to the total heat uptake decreases during the thaw season; end-of-thaw-season estimates match. Although our plot-scale observations do point to some differential melt beneath furrows and ridges (a micro-topographic variability mentioned by Kääb et al., 1998, and Halla et al., 2021), the agreement suggests that our estimates of end-of-thaw-season ice storage changes are fairly representative over the landform within an uncertainty that we estimate as ±30 %. No systematic stake measurements were taken in 2021; Qm is estimated with the 2022 parameters forced by the 2021 Ts (Fig. 14a). Differential heat storage effects are smaller in the cooler thaw season 2021.
The AL ice was fully regenerated, and no net ice loss occurred between September 2020–September 2024, at least locally in the furrow. While this is not exactly true for the entire Murtèl rock glacier, where slow permafrost degradation and AL have been measured (Noetzli and Pellet, 2023), Murtèl's slow response attests to the important latent buffer effect of the AL ice (Sect. 6.1), a feature common to ice-rich permafrost landforms (Scherler et al., 2013). The regeneration of ground ice in the AL partly explains the climate robustness of coarse blocky landforms (Scherler et al., 2013). If the lost ground ice is not regenerated, the permafrost landform is preconditioned towards AL thickening and irreversible degradation (Hilbich et al., 2008; Hauck and Hilbich, 2024). Moreover, the modelling study by Renette et al. (2023) suggests that dry cooling in early winter and ice build-up in spring, a timing specific to permeable and well-drained (sloped) permafrost landforms, are themselves an undercooling process, in addition to convective undercooling (Sect. 6.3.1). This dry undercooling effect is most pronounced in deeply snow-covered landforms where the autumn–early winter “window of opportunity” for cooling before the onset of an insulating snow cover is shorter. The intricate relations between hydraulic and ground thermal regimes in coarse blocky permafrost landforms and the AL ice as a meltwater “source” in hot and dry summer periods are discussed further in Amschwand et al. (2025).
6.3 Thaw-season heat transfer
6.3.1 The thermal semi-conductor effect: air convection selectively enhances the apparent thermal diffusivity during cooling events
The sensitivity of the apparent thermal diffusivity κa to AL temperature gradients reflects how efficient convective heat transfer operates compared to radiation–conduction in the coarse blocky AL; κa is primarily controlled by the AL air column stability (vertical temperature gradient ∇zTal) that induces buoyancy-driven convection and secondarily by the atmospheric wind speed u that induces wind-forced convection (Fig. 10) (Herz, 2006). Hence, the convection-enhanced apparent κa is as much determined by the time-variable meteorological conditions as by the debris texture and is thus variable in time. Note that in such permeable material, water content does not affect heat transfer properties; κa is higher for cooling (upwards heat transfer) at unstable temperature gradients than for warming (downwards heat transfer) at stable temperature gradients. This feedback between AL temperature gradient and thermal diffusivity profoundly impacts the ground thermal regime of permeable, ventilated landforms: frequent, but less efficient radiative–conductive warming (suppressed convection) is countered by only occasionally occurring, but highly efficient convective cooling (enhanced convection; Figs. 8, 10). Ventilation leads to locally lower ground temperatures in coarse blocky, permeable terrain, an observation known as undercooling (Wakonigg, 1996), and is another process that renders rock glaciers climate-robust. This effect has long been qualitatively known as “Balch ventilation” (Balch, 1900) or the “thermal semi-conductor effect” (Guodong et al., 2007) (see Johansen, 1975; Herz, 2006). Our study is the first one (to our knowledge) that quantifies the effect based on field data and calculates a convection-enhanced apparent thermal diffusivity κa. Table 3 provides an overview on how the seasonally varying dominant heat transfer processes are shown by our data. The impact of air convection is visible in the temperature, airflow speed, and heat flux plate measurements at sub-diurnal resolution (Appendix B).
Our κa values agree with published values for ventilated coarse blocky material but are generally 2−6 times higher than for finer material of supra-glacial debris (Rowan et al., 2021) or cryic regosol (Table F1). The important contribution of forced air convection to the total heat transfer even at stable air stratification is characteristic of highly permeable and dry materials, i.e. is specific to coarse blocky landforms, and most pronounced in the strongly ventilated, wind-exposed near-surface layer (Yoshikawa et al., 2023). With smaller grain size or increasing fine-material content that clogs the pore space (typically near the AL base), convective and radiative heat transfer (Sect. 6.3.2) becomes less important in favour of conductive heat transfer. We estimate the key parameter intrinsic permeability K using the Kozeny–Carman relation in Appendix D.
6.3.2 Radiative heat transfer and stagnant effective thermal diffusivity
Above a temperature gradient of 4 K m−1, turbulence is suppressed to the point where the effective thermal diffusivity κa becomes independent of ∇zTal (Fig. 10). The thermal stratification inside the AL becomes too stable to be mixed by the wind, and wind-forced convection is “switched off” at a temperature gradient threshold, slowing down an “overheating” of the AL. This “non-linear heating of the AL with air temperature” has been reported by Hanson and Hoelzle (2004) and Herz (2006). Our threshold temperature of 8–10 °C (ca. 2 m above the AL base at 0 °C) is higher than the 6 °C threshold reported by Hanson and Hoelzle (2004) for a less coarse blocky measurement spot on Murtèl. Perhaps the higher permeability around our instrumented cavity imposed less resistance to wind-forced mixing for a given temperature gradient.
Moreover, this κa under strongly stable air stratification is our best-available field estimate of the stagnant effective thermal diffusivity (), i.e. a radiative–conductive thermal diffusivity without convection. This is ∼3 times higher than what would be expected from the geometric mean or empirical engineering parameterisations that ignore radiation, for example the of Johansen (1975) for dry crushed rock (Côté and Konrad, 2005). A relatively large κa uncertainty of ∼30 % (mainly due to variable block sizes) does not detract from this finding. Hence, an important insight for modellers is that the stagnant thermal diffusivity of coarse blocky material is underestimated if radiative heat transfer is ignored. Our measurements confirm previous investigations on Murtèl in that respect (Scherler et al., 2014; Schneider, 2014) and are further supported by the cold-region engineering study by Fillion et al. (2011). The radiative thermal diffusivity increases linearly with block/pore size (actually: the effective length for radiation in the air-filled gaps between particles) and mean temperature cubed (Lebeau and Konrad, 2016); i.e. it tends to counteract undercooling (quantitative details in Appendix D). Laboratory tests using crushed rock beds showed that radiative heat transfer begins to dominate over conduction at effective particle sizes (d10 diameter) exceeding 9 cm (cobbles) (Fillion et al., 2011; Rieksts et al., 2019), corroborating an earlier work by Johansen (1975).
6.4 Autumn and wintertime heat transfer
The early winter snow cover determines the ground thermal regime in winter and spring by controlling the magnitude of the heat fluxes and convective air exchange across the snow cover via snow funnels. In terms of qualitative process understanding, this is established knowledge (Haeberli et al., 2006; Wagner et al., 2019) and is shown on Murtèl by the permafrost temperature time series since 1987 (Noetzli and Pellet, 2023): strong ground cooling during snow-poor winters can offset the warming of the preceding years in the permafrost body to more than 20 m depth. The degree of snow cover insulation is shown in our data by the two contrasting winters 2020–2021 (average snow conditions, weak air circulation beneath a closed snow cover) and 2021–2022 (snow-poor winter, strong air circulation beneath a semi-closed snow cover). Although the air column in the somewhat insulated AL and in a thin, strongly cooled layer above the snow surface was typically nonlocally unstable (i.e. near-surface ; Fig. 7a) and the potential for buoyancy-driven convection was available, different air circulation patterns emerged depending on snow height: (i) Rayleigh ventilation (Marchenko, 2001; Millar et al., 2014) prevailed in unresisted circulation, (ii) cold-air infiltration (Herz, 2006) occurred beneath a moderately thick/semi-closed snow cover, and (iii) stagnant–conductive conditions without air circulation occurred beneath a thick/closed snow cover. The circulation patterns differ in terms of persistence in time, heat flux magnitude, vertical temperature profile, and Rayleigh numbers (local instability). Hence in addition to the temperature profile, the AL–atmosphere connectivity through the snow cover (“effective aeraulic resistance”) co-controlled which type of air circulation occurred and ultimately how strong the winter cooling was.
6.4.1 Rayleigh circulation under snow-free conditions or beneath a thin/open snow cover
Rayleigh ventilation events typically occurred in autumn before the onset of a thick snow cover, for example in October 2020 (Fig. 6b, Table 3, number ④). With unresisted AL–atmosphere exchange, it is an efficient (20–30 W m−2; Fig. 8) top-down cooling process associated with the characteristic negative AL temperature gradients (locally unstable air stratification; Fig. 7a, Table 3, number ④) and is diagnosed by super-critical Rayleigh numbers (Ra>Rac). Rayleigh ventilation events as a response to rapid atmospheric cooling are a short-lived, but efficient heat transfer process. Thermal equilibrium was reached rapidly within hours to days, for example in September 2020 or 2022. It contributed to the rapid end of the 2022 thaw season, where the entire AL was cooled from 5 to 0 °C within 1 d.
6.4.2 Cold-air infiltration beneath a semi-closed snow cover
During extended cold-air infiltration phases with a semi-closed (patchy) snow cover (hS<60 cm; Fig. 5b; Amschwand et al., 2024), the AL cooled slowly from the bottom up and persistently over longer periods (days to weeks) at moderate fluxes (, ; Fig. 8, Table 3, number ③). Cold-air infiltration shaped the ground thermal regime in November 2020 and throughout the snow-poor winter 2021–2022. It caused 5 °C lower AL temperature minima compared to winter 2020–2021, although winter 2021–2022 was 0.4∘C warmer (November–March average). Convective exchange with the atmosphere is shown by fluctuating AL temperatures and characteristic concave temperature profiles with a minimum at mid-cavity level (“bulges”; Fig. 7a–b, Table 3, number ③; Herz et al., 2003b) whose depth coincides with increased daily temperature amplitudes (Fig. 7b). Cooling at depth stabilised the AL air column, shown as sub-critical Rayleigh numbers (Ra<Rac), and led to a net downward radiative transfer like during the thaw season (although much smaller), opposite to the measured HFP/1 heat flux QHFP (Fig. 8). Modelling convective heat exchange with the Rayleigh number alone would miss this type of air circulation. The bottom-up cooling was accompanied by a bottom-up drying, since ventilation brought in “fresh”, dry outside air into the otherwise saturated AL (Fig. 15, Fig. 7c–d, number ③), opposite to the summertime evaporative top-down drying. In-phase diurnal oscillations of AL relative humidity, temperature differences between AL and surface temperatures (), and strong nighttime ventilation recorded in the rock glacier furrow (WS/6 in a topographic depression; Fig. E1) suggest that cold-air infiltration occurred on clear-sky nights. Radiatively cooled air on the snow surface, produced by the nocturnal negative radiation balance (Amschwand et al., 2024), infiltrated into the coarse blocky AL (Herz, 2006). Cold-air infiltration is an effect of nonlocal static instability (Stull, 1991) that arises from interactions between AL and a semi-closed snow cover. The process is analogous to the summertime nocturnal near-surface air circulation that switches on when the near-surface atmosphere cools below the near-surface AL (nocturnal Balch ventilation; Amschwand et al., 2024). Although our isolated point-wise measurements could not reveal the lateral extent and connectivity of the airflow, and we did not perform gas tracer tests (Popescu et al., 2017a), the cold-air infiltration likely corresponds to the landform-scale cold-air drainage described in the literature (Wakonigg, 1996; Delaloye and Lambiel, 2005; Millar et al., 2014), where the infiltrating cold air flows laterally downslope in the permeable AL beneath the snow cover (convection–advection), analogous to the katabatic drainage flows on the snow cover (Amschwand et al., 2024).
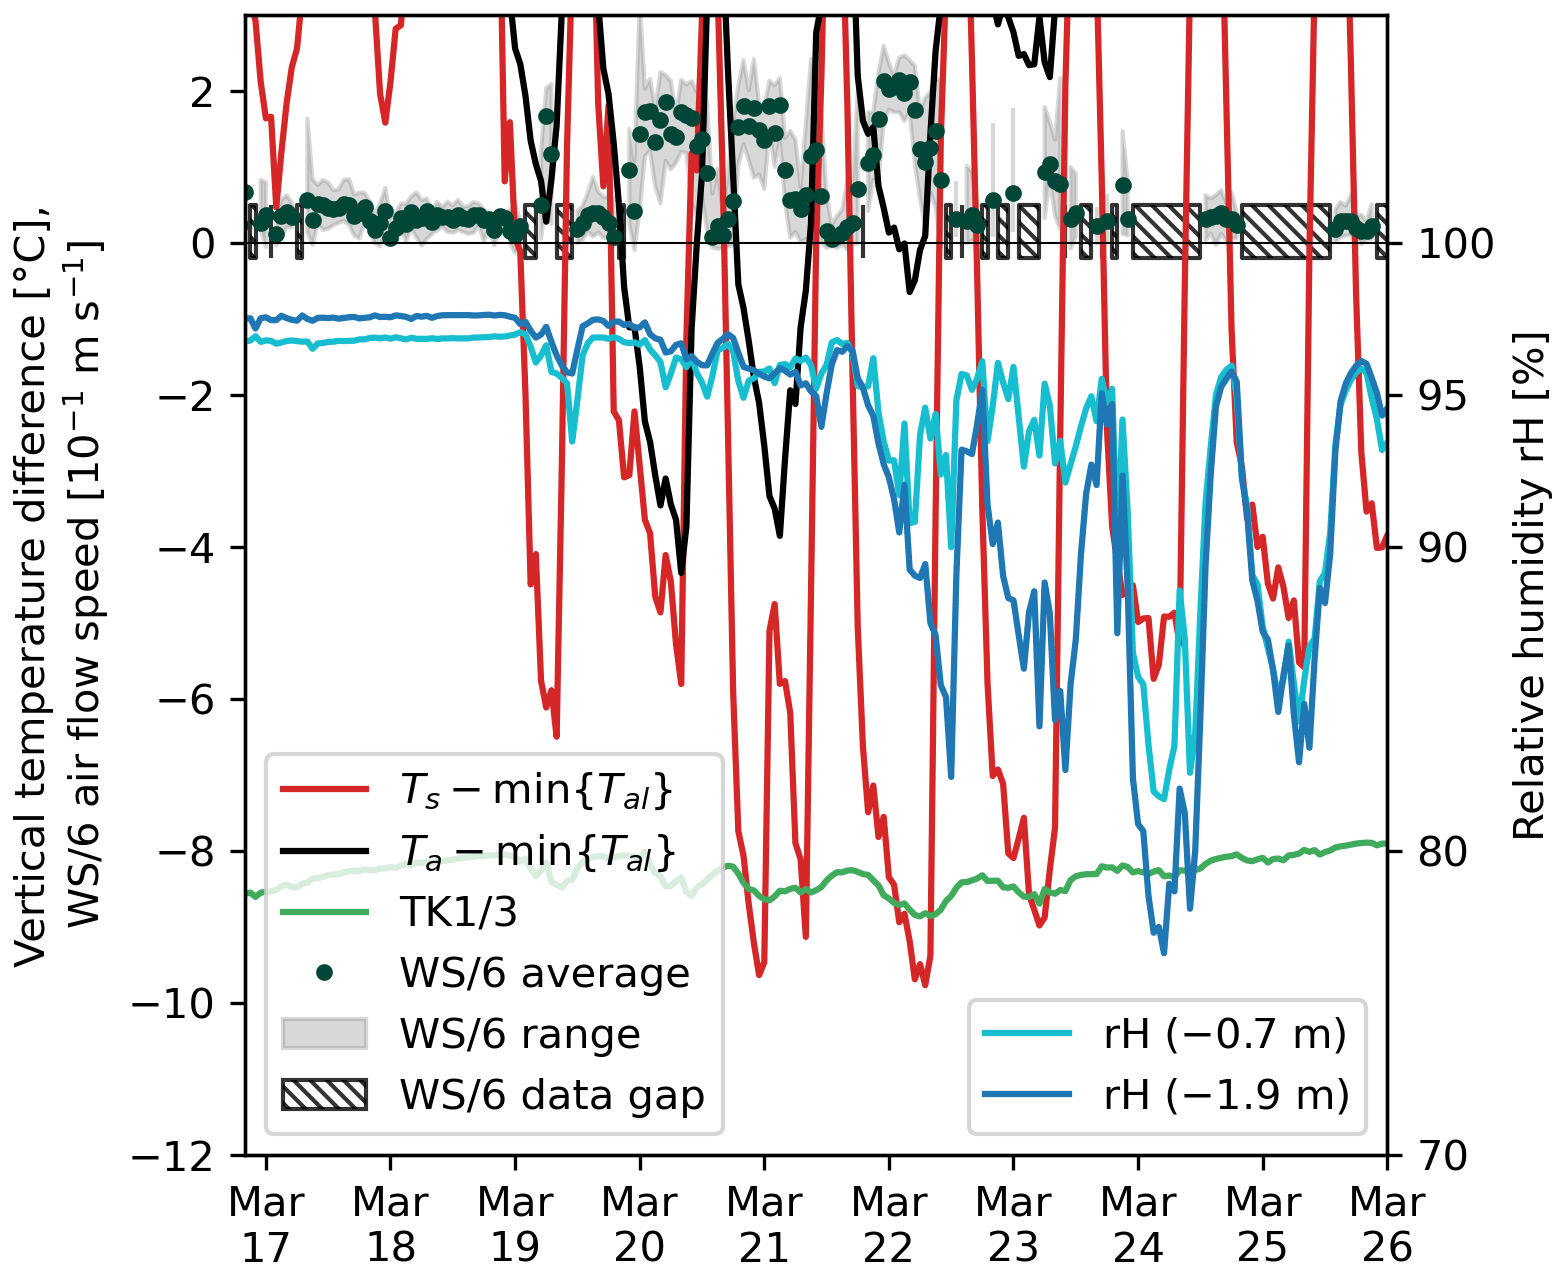
Figure 15Nocturnal cold-air infiltration episodes in March 2022 as indicated by airflow speed measurement (WS/6) and a simultaneous drop in AL relative humidity (HV5/1–2) and temperature (TK1/3) due to the ventilation with fresh, dry–cold outside air. As soon as the ventilation stops, the AL air approaches saturation within hours. Higher WS/6 airflow speeds always coincide with negative . Using air temperature Ta instead of snow surface temperature Ts would underestimate the occurrence of cold-air infiltration episodes. Note the WS/6 data gaps due to power shortage.
6.4.3 Stagnant conduction beneath a thick/closed snow cover
In the more snow-rich winter 2020–2021, after closing of the snow cover in December (hS>60 cm; Fig. 5b), heat fluxes were small (<2 W m−2) and upwards (Fig. 8, Table 3, number ②; “closed/insulating snow cover” sensu; Amschwand et al., 2024). Heat transfer on a daily timescale appeared diffusive (). The AL heat flux was not larger than the conductive heat flux QS across the snow cover as calculated in Amschwand et al. (2024). The AL air column was near-isothermal (Fig. 7a, Table 3, number ③) and weakly unstable (sub-critical Rayleigh numbers in Fig. 6b). The measurements of heat fluxes and airflow speed were close to their instrumental accuracy.
6.5 Scope and transferability of Murtèl findings
The findings of this detailed single-site case study are transferable to other sites to varying degrees, which is a key consideration for upscaling. Caution is necessary because convective and radiative heat transfer and the ice build-up are specific to a high permeability, large pore dimensions, and dry conditions, which are in turn characteristic of a coarse blocky debris texture. First, the SEB and the AL energy budget (i.e. the total heat uptake) that more strongly reflect topo-climatic and snow conditions are most transferable in the sense that they are the least sensitive to the debris texture (Amschwand et al., 2024). The effects of earlier spring melt-out and warmer summers, exacerbated by dry periods, strongly impact the AL energy budget primarily via the surface net radiation and sensible turbulent fluxes (Amschwand et al., 2024). However, moisture storage, transfer, and evaporation (latent turbulent fluxes) are more sensitive to debris texture. Second, the two undercooling processes – heat interception by the AL ice turnover and convective thermal semi-conductor effect – are characteristic features of all coarse blocky permafrost landforms and shape the ground thermal regime in different debris permafrost landforms, including rock glaciers, frozen talus slopes, and block fields, as long as their AL is permeable and dry. Hence, the detailed process understanding gained on Murtèl qualitatively applies to widespread mountain permafrost landforms located in various topo-climatic conditions and gives a process-oriented, field-data-based explanation for the climate robustness of undercooled “cold rocky landforms” (Brighenti et al., 2021). Only the spatial pattern of air circulation differs in sloped landforms such as talus slopes (Caltagirone and Bories, 1985; Guodong et al., 2007): convective heat transfer is then no longer dominantly vertical as on Murtèl. Surface-parallel (lateral) advective heat transfer leads to an undercooled foot and an “overwarmed” top of the slope (“chimney effect”) (Delaloye and Lambiel, 2005; Morard et al., 2010; Růžička et al., 2012; Wicky, 2022; Zegers et al., 2024). Third, the least transferable are the exact values of the heat transfer parameters (keff, κa), which are so sensitive to the debris texture that they typically vary even on the landform itself (Appendix D). The numbers are only valid for landforms similar to Murtèl in terms of debris texture.
We investigated heat transfer and storage processes in the ventilated coarse blocky active layer (AL) of the seasonally snow-covered Murtèl rock glacier situated in a cirque in the upper Engadine (eastern Swiss Alps). In the highly permeable AL, conductive/diffusive heat transfer, including thermal radiation, non-conductive heat transfer by air circulation, and heat storage changes from seasonal build-up and melting of ground ice, create a cool and stable ground thermal regime known as undercooling, rendering these permafrost landforms comparatively robust against climate change. While the undercooling effects have long been known qualitatively, this study resolves different processes quantitatively, providing insights into the capability and limits of the undercooling effect and the climate robustness of coarse blocky landforms. We provided estimates of sub-surface heat flux and storage changes for the 2-year period 2020–2022 based on a novel in situ sensor array in the AL and stake measurements of the seasonal progression of the ground ice table, i.e. ground ice build-up and melt. The measurements included thermistor strings, hygrometers, heat flux plates, and thermal radiation sensors. Airflow speed sensors (thermo-anemometers) distributed in the AL revealed air circulation patterns. We parameterised the seasonal ground ice melt using a modified Stefan equation, whose key parameter, the effective thermal conductivity, was derived from the in situ measurements.
This study unravels the two thaw-season processes that render Murtèl rock glacier climate-robust, the seasonal ground ice turnover and convective cooling. First, the coarse blocky AL intercepts ∼90 % of the thaw-season ground heat flux of ∼5–15 W m−2 by melting ground ice (∼70 %, latent storage change that leaves the system as meltwater) and by heating the rock mass (∼20 %, sensible storage change). A smaller fraction (∼10 %) is transferred into the permafrost body beneath and causes slow permafrost degradation. The cumulative heat uptake of ∼50–90 MJ m−2 during the thaw season is primarily controlled by the date of its onset, i.e. the date of snow melt-out, and secondarily by the weather throughout the thaw season. Second, convective heat transfer selectively enhances cooling over warming (thermal semi-conductor effect), as shown by time-varying effective thermal conductivity that increases from under strongly stable AL temperature gradients (weak warming) to episodically over under unstable AL temperature gradients (strong cooling). The snow cover controls whether and which type of buoyancy-driven cooling convection takes place: first, Rayleigh ventilation typically occurs in autumn, when the atmosphere cools faster than the AL, and air density instabilities induce convective overturning. It is the most efficient cooling process, with episodically large, but short-lived upward fluxes up to under snow-free or snow-poor conditions. Second, beneath a semi-closed snow cover perforated by snow funnels, radiatively cooled air infiltrates into the AL. Cold-air infiltration/drainage leads to moderate, but persistent fluxes of ∼2–5 W m−2 that result in strong convective winter cooling in snow-poor winters. This cooling process is not diagnosed by Rayleigh numbers as the cold, dense air pools near the AL base but should not be overlooked in future heat transfer modelling. Third, no convection occurred beneath a closed/insulating snow cover; small heat fluxes (within 2 W m−2) prevent a strong winter cooling.
Our field-based heat flux measurement and estimates of effective thermal conductivity keff are valuable for thermal numerical modelling. A thaw-season under stagnant (no convection) conditions indicates that radiative heat exchange is an important heat transfer process in coarse blocky material. This finding, which agrees with geotechnical laboratory experiments with crushed-rock beds, has often been overlooked in the geomorphological literature, although it tends to counteract undercooling. In the strongly ventilated near-surface AL, atmospheric wind and penetrating warm air tend to enhance mechanical turbulence and increase keff (wind-forced convection), leading to a thaw-season-averaged . A Stefan parametrisation with this field-measured keff successfully simulated the seasonal ground ice melt as measured in a nearby rock glacier furrow. Our measurement experience could guide future quantitative research, and our derived values could calibrate or validate numerical modelling studies like Renette et al. (2023) or Zegers et al. (2024). Mountain permafrost is entering uncharted territory where empirical relations based on past experience might no longer apply. Our study is a step towards process-based numerical modelling of coarse blocky landforms needed to anticipate their response to climate change.
A question that arose (Fig. 9) is why the heat flux is correlated with daily average AL air temperature gradients, even though the thermal radiation is emitted by the rock surfaces, not by the air, and why the correlation deteriorates when taking hourly or 10 min data (Fig. A1a) or when taking near-surface HFP/2 data (Fig. A1b). After all, even moist air is virtually transparent to thermal radiation at length scales encountered in the AL pore space. The question is of practical relevance because AL temperatures are more conveniently measured in the pore space rather than inside the blocks. This perhaps puzzling observation can be explained by a thermal resistance circuit (an electrical analogue to the heat transfer) and local thermal (non-)equilibrium (LTE/LTNE), which is important to understand the measurements in porous media consisting of constituents with diverging thermal inertia, here rock particles and air.
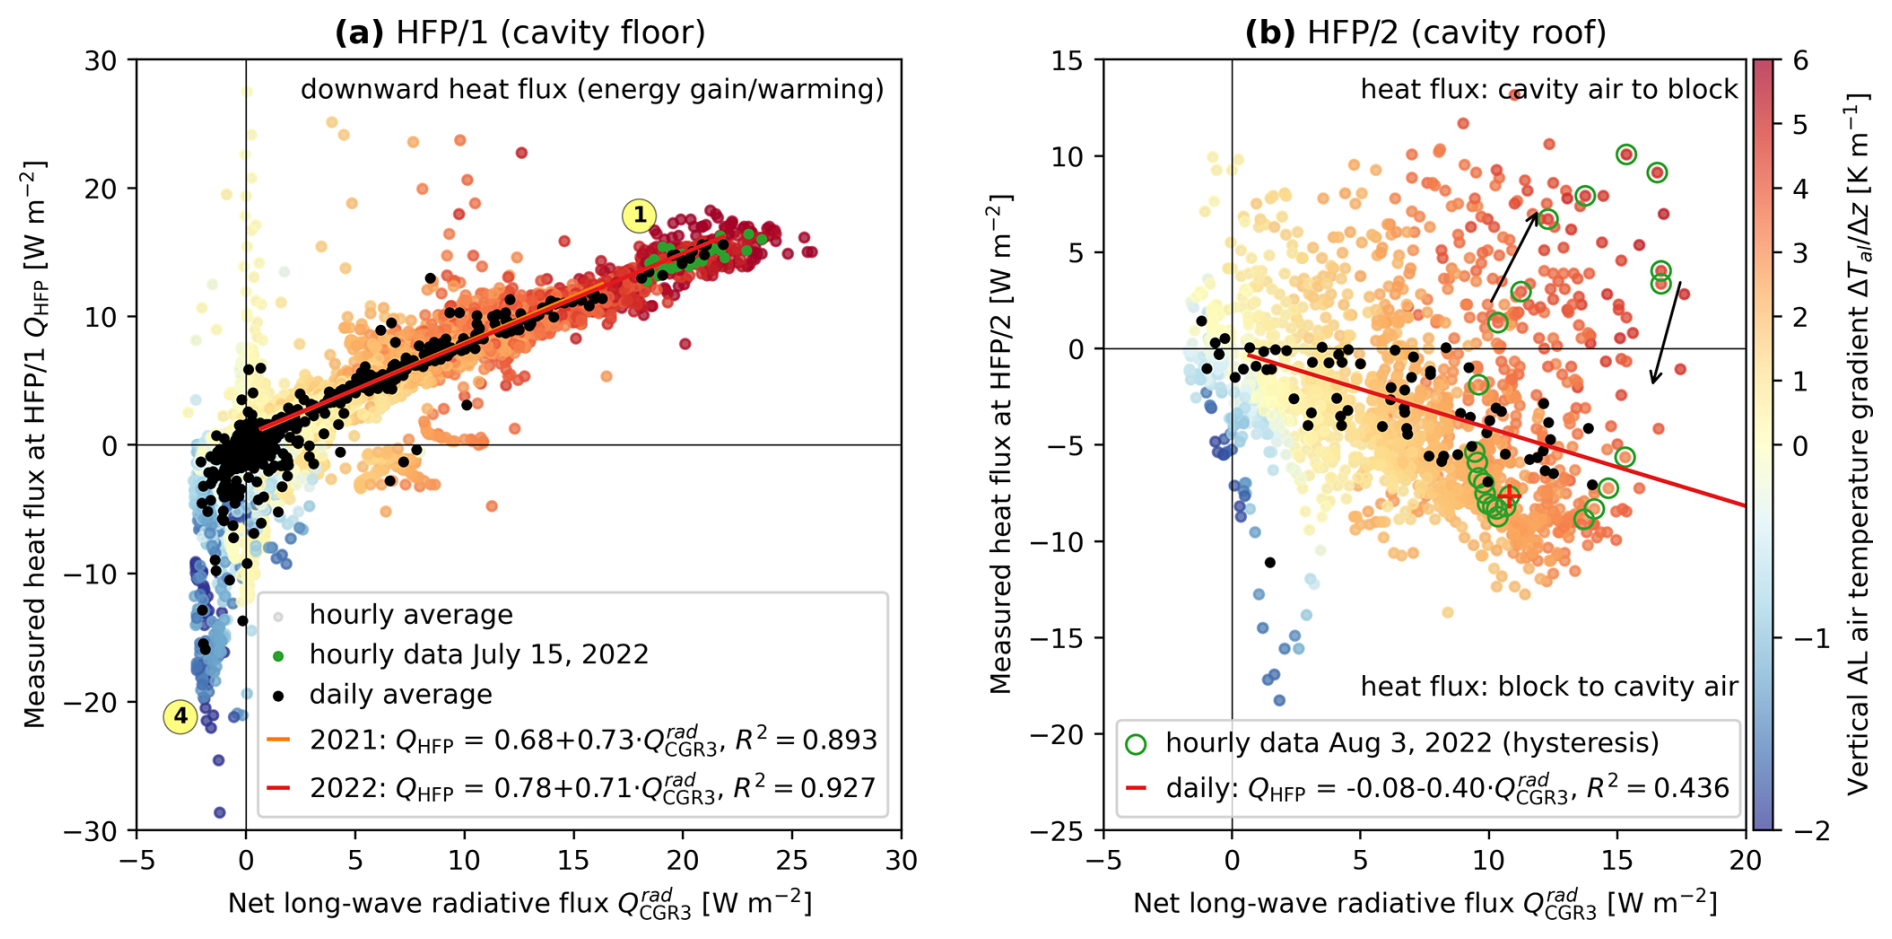
Figure A1The heat flux plate measurements of HFP/1 (QHFP) and HFP/2 (not discussed in main text) are correlated with the thermal net radiation , but only for stable temperature gradients ∇zTal (). Diurnal loops are stronger in the (b) HFP/2 data closer to the surface (at −1.1 m) because transient effects of the daily solar cycle are more intense than at (a) HFP/1 depth (at −2.0 m). At HFP/2, hourly heat fluxes shift direction, with heat moving upwards from the cavity into the block during warm afternoons in the thaw season, opposite to the downward daily average heat fluxes (black dots). Sign convention: positive means into the block (downward for HFP/1, upwards for HFP/2; Fig. 3). Note the different y axis. HFP/2 measurement available only after 26 July 2022.
In the unfrozen coarse blocky AL, the total heat transfer is composed of two “chains”, air convection (turbulent fluxes Qh+Qle) in the pore space parallel to the heat transfer by the blocky matrix (Fig. A2). Heat transfer in the blocky matrix is composed of the heat conduction within the blocks Qc and radiative heat transfer Qr between blocks across the air-filled pore space (air is transparent to thermal radiation on the pore length scale). Since the blocks barely touch (clast-supported/open-framework), particle-to-particle conduction is negligible, and thermal radiation is the only heat transfer that links the blocks. Conduction and radiation operate in series (implying that Qr=Qc). Over timescales where a local thermal equilibrium (LTE) between air and blocks is reached (∼1 d) and in periods where convection does not dominate the heat transfer, locally uniform temperatures in the blocks and the air can be assumed. The different phases are no longer distinguished, and the entire coarse blocky AL is treated as an effective medium with a single temperature profile represented by the below-ground air temperature Tal, which is more conveniently measured in the pore space (TK1) than inside the blocks (TK6). The overall heat transfer is treated as diffusive, which is true for conduction and applicable for thermal radiation in porous media (Fillion et al., 2011) but questionable for convection and described by the effective thermal conductivity keff, which lumps together all three conductive, radiative, and convective processes in both “chains”. Hence, such a keff is only meaningful at LTE timescales. As indicated by the relation between QHFP≈QG, QCGR3 ≈ Qr, and ∇zTal that is valid for daily average values (minimum LTE timescale), the total heat flux QG during most of the thaw season is represented by radiation Qr and the measured QCGR3, Qr≈QG. At sub-daily timescales or during strong convection events, LTE is no longer a valid assumption. This is shown by diverging AL air (TK1) and rock (TK6) temperatures and the different hourly pattern of the QHFP and QCGR3 measurements (QHFP≉QCGR3; Appendix B). Due to the thermal inertia of the blocks, rock temperatures and radiative heat transfer QCGR3 lag behind AL air temperature and heat flux QHFP. The total heat transfer is then adequately described by the local thermal non-equilibrium (LTNE) approach with phase-specific energy equations that account for the air–rock interface heat transfer (Marchenko, 2001; Zegers et al., 2024). The closer we look at the measurements gathered in the pore space of the AL, the more convective LTNE processes appear in the data.
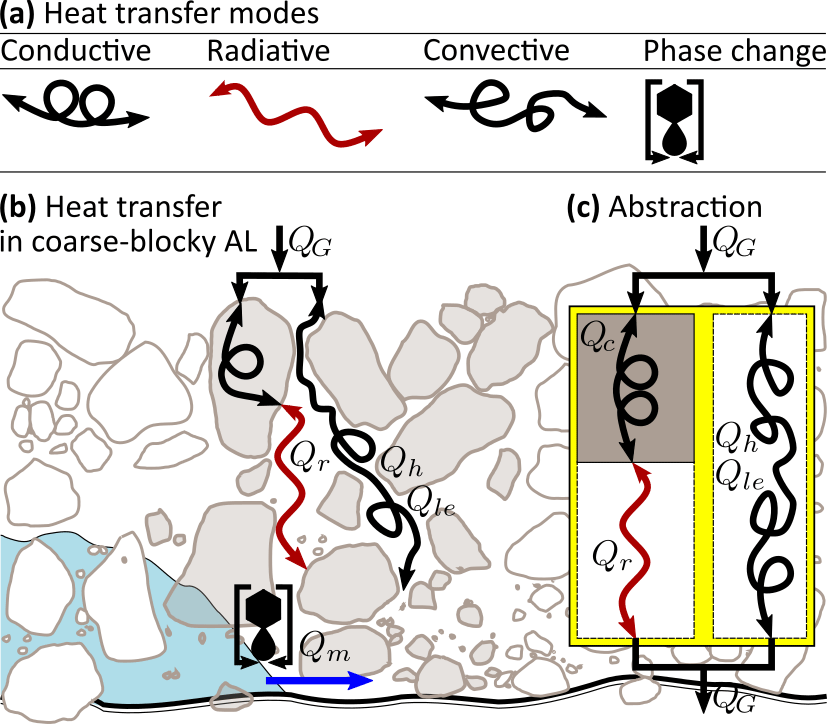
Figure A2Schematic heat transfer in a dry, unfrozen, coarse, blocky AL conceptualised as a resistance circuit. (a) Heat transfer modes (Sect. 4.1). (b, c) The total heat transfer QG arises from convection Qh+Qle (in the pore space) in parallel with radiation–conduction, . Radiation–conduction is radiation Qr in pore space and conduction Qc in blocks in series. Figure inspired by Schneider (2014).
In the large and highly permeable instrumented main cavity, wind-forced convection transfers some heat to large AL depths ∼2 m even under stable air stratification and increases the heat transfer rate compared to radiation–conduction alone (Sect. 6.3.1). Sub-daily data show the processes (Fig. B1) and show the link between above- and below-ground conditions: driven by the anabatic atmospheric wind (a thermal upslope wind that develops in the wind-sheltered cirque), AL airflow speeds are highest in the afternoon (Fig. B1b), precisely when the near-surface AL is most strongly heated, and temperature gradients are largest (Fig. B1a). The (comparatively) strong afternoon winds counteract the stabilising positive temperature gradients. Warm air masses penetrate the permeable coarse blocky AL (shown by the afternoon HFP/2 measurements that indicate a heat flux upwards into the block; Fig. A1b). Forced convection transfers the heat downwards in the late morning–afternoon parallel (electrical analogue in Appendix A) to the radiative–conductive “background flux” (as shown by the TK1 and HFP/1 QHFP data; Fig. B1a, d), to which AL rock temperatures and the AL thermal net radiation respond with some time lag (TK6/2 and peak in the evening; Fig. B1a, d). This pattern of atmospheric wind speed, AL airflow speed, and AL air temperature gradients that co-vary in phase is in turn an effect of the low-albedo debris surface (micro-topography) in the sheltered cirque (macro-topography) that gives rise to insolation-driven diurnal cycles. Such daily oscillations of the AL air and rock temperatures without time lag down to 2.9 m that indicate non-conductive heat transfer were also observed by Herz (2006) in the Ritigraben block slope.
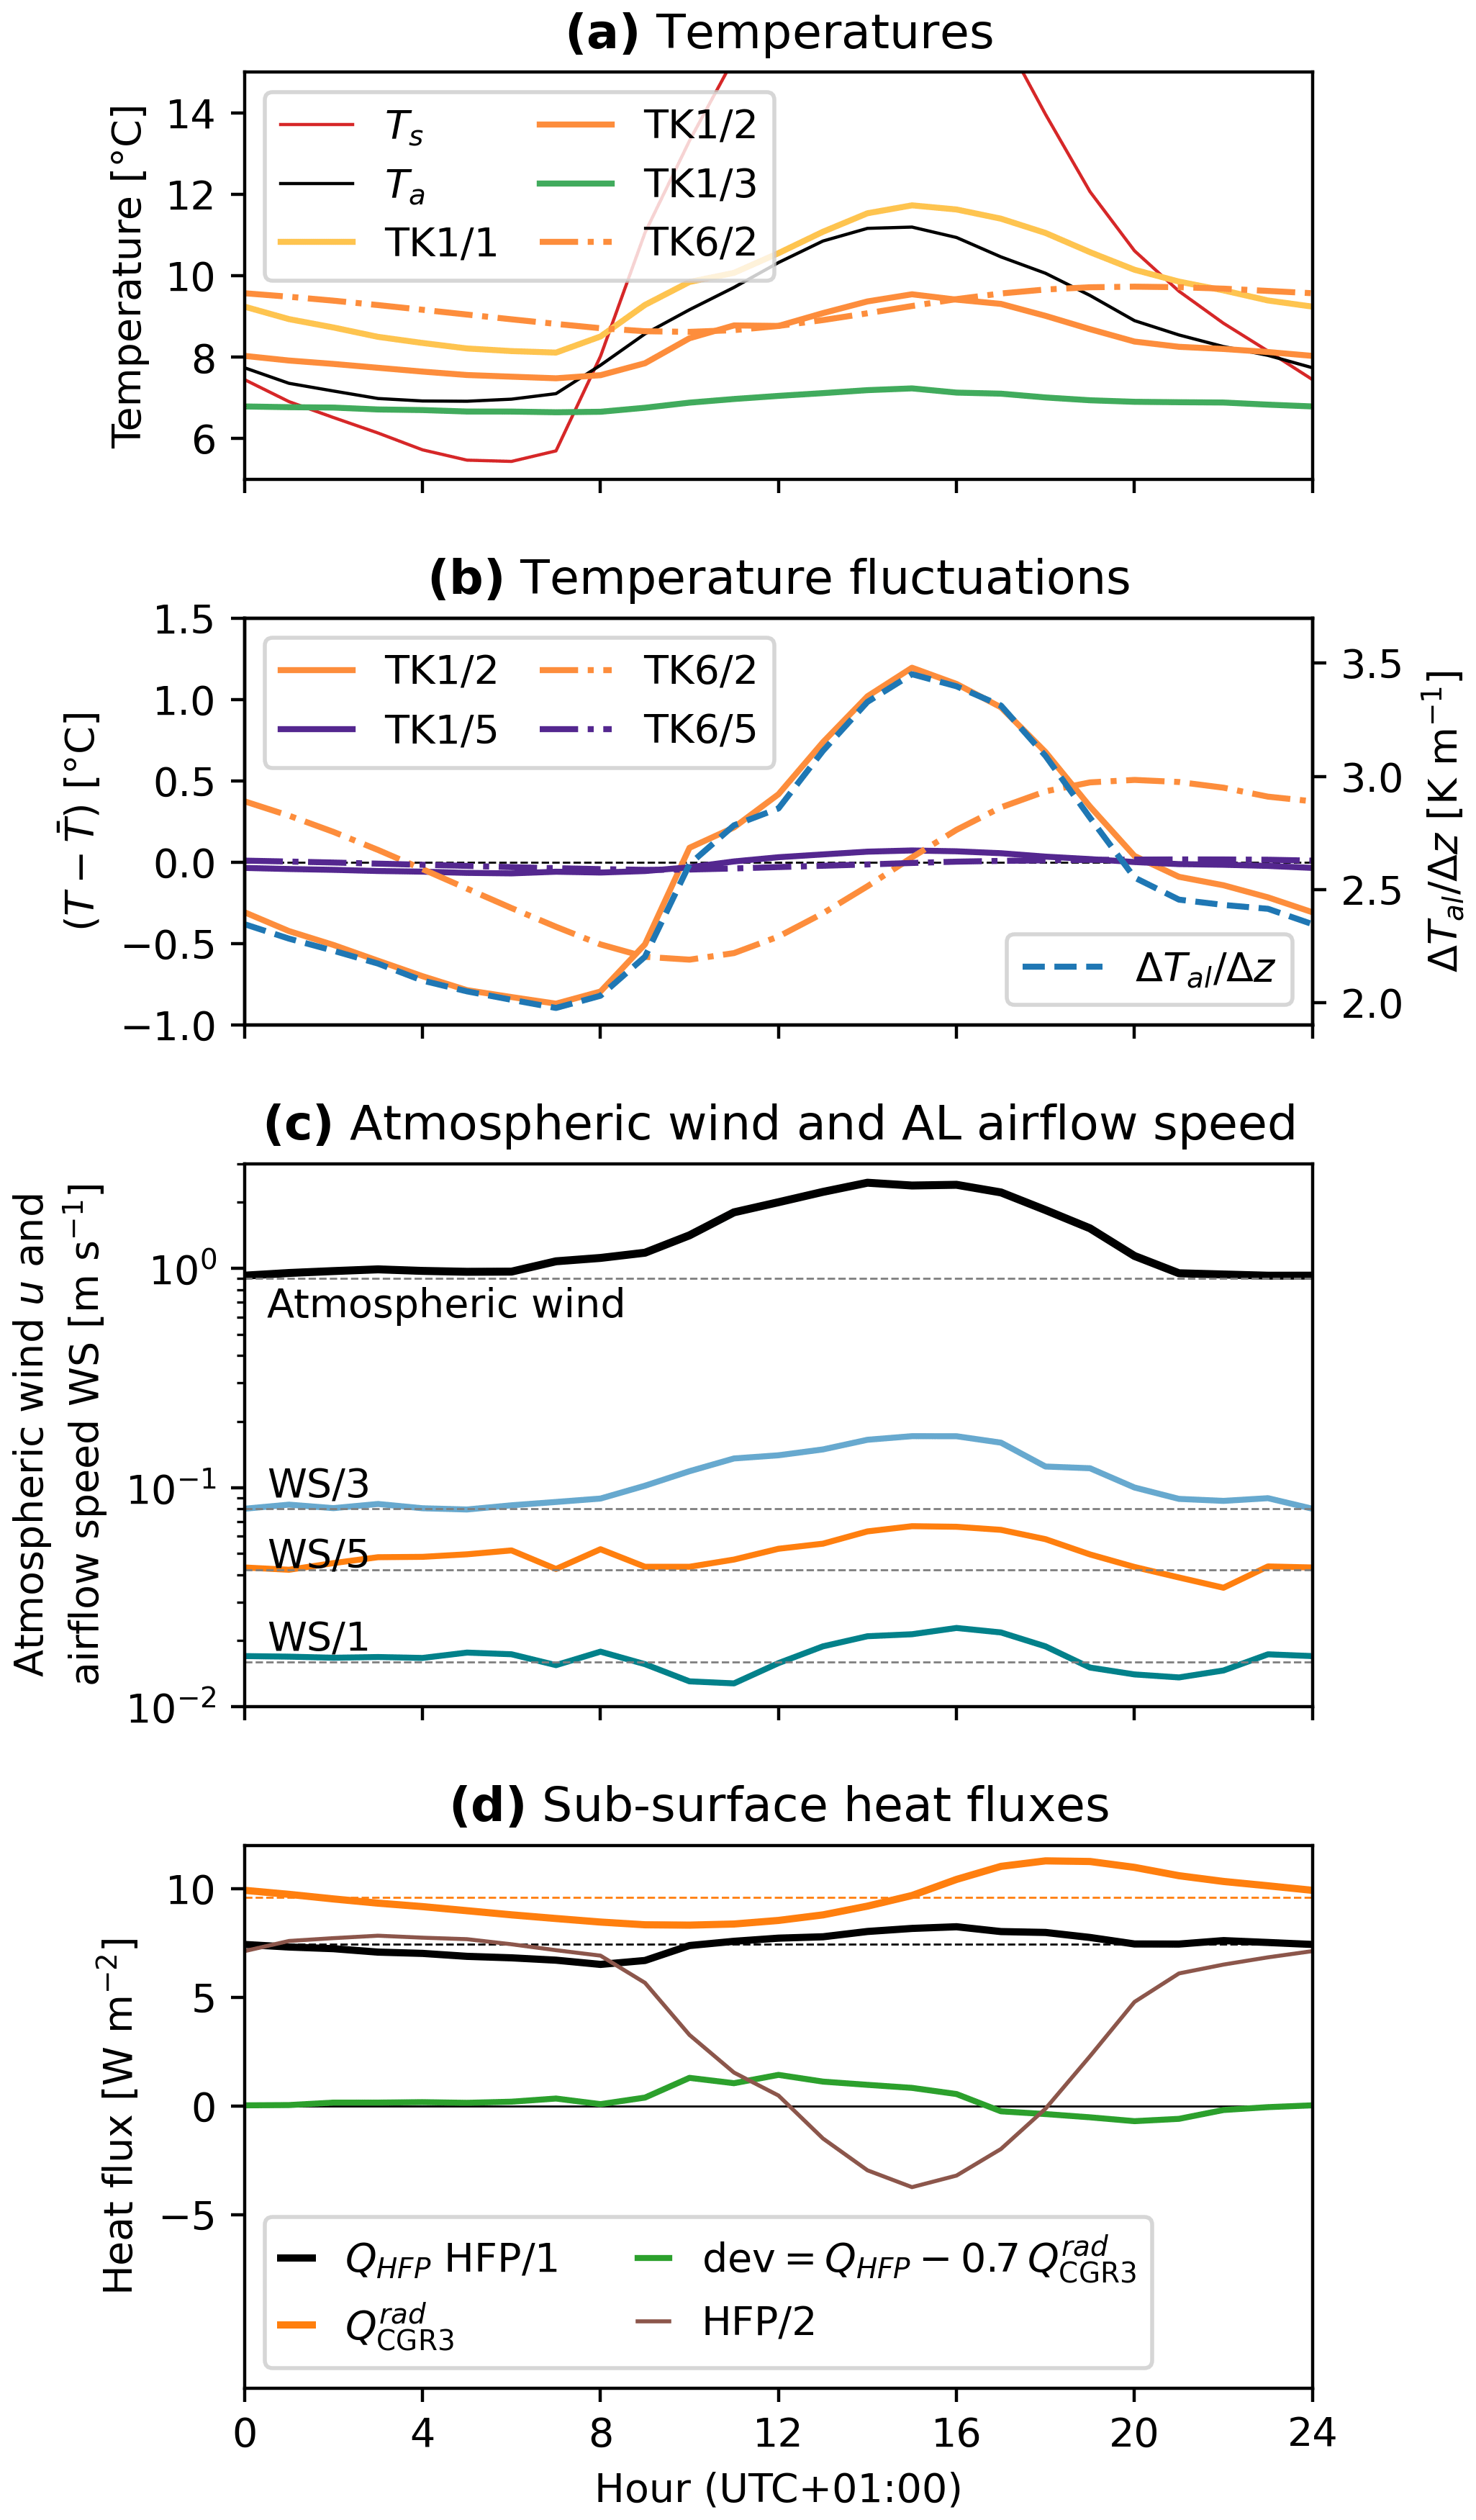
Figure B1Evidence for wind-forced convection from sub-daily data: August 2022 hourly averages of (a) temperatures (Ts, Ta, AL air TK1, AL blocks TK6), (b) temperature fluctuations (24 h running mean subtracted) and gradient , (c) AL airflow and wind speeds, and (d) measured AL heat fluxes. (a, b) AL air temperatures (TK1, solid lines) and (c) AL airflow speeds down to 2.9 m (WS/1) show a daily course without time lag, only attenuated in amplitude. Rock temperatures (TK6, dash-dotted lines) lag behind AL air temperatures. (d) QHFP HFP/1 is in phase with airflow speed and AL air temperature gradient, whereas is in phase with the lagging rock temperatures TK6/2.
We found simple relations between the below-ground radiative heat transfer and ice melt rates during the thaw season and the (remotely measurable) ground surface temperature. The numbers are site-specific, slightly differ between the thaw seasons 2021 and 2022, and are far from exact. The relations should be used with caution and are certainly not valid on timescales shorter than a few days. We nonetheless report them here because they suffice for rough order-of-magnitude estimates and potentially lead to simple tools useful for remote sensing and modelling applications.
First, the radiative–conductive downwards heat transfer can be related to the surface temperature Ts on snow-free ground. Daily average in-cavity thermal net radiation is correlated with the 2 m air Ta (R2=0.738 and 0.614 for 2021 and 2022, respectively; plot not shown) and the radiometric ground surface temperature Ts (derived from the PERMOS outgoing long-wave radiation; Amschwand et al., 2024) as long as Ts is above the freezing point (Fig. C1). The correlation slightly improves for Ts of the previous day rather than Ts of the same day (2022 R2 increases from 0.723 to 0.786). Like , the –Ts relation also differs for the two thaw seasons 2021 and 2022, possibly due to the differing impact of convection that affects Ts and ∇zTal (note that the QHFP– relation is identical for both thaw seasons; Fig. A1a). Below 0 °C and beneath snow-covered ground, the –Ts relation breaks down, and radiative fluxes remain small, within , with magnitude and direction independent of the outside air or surface temperatures.
Second, a parameter used for modelling sub-debris melt rates on debris-covered glaciers is the thermal resistance. Assuming steady-state conditions, an effective thermal resistance Reff [K m2 W−1] of the AL can be derived from the observed linear temperature profile (Fig. 9) and the linear –Ts relation (Fig. C1; e.g. Nakawo and Young, 1981, 1982; Kayastha et al., 2000; Mihalcea et al., 2006; Fujita and Sakai, 2014; Rounce and McKinney, 2014),
where hal is the AL thickness (∼4 m, extrapolated from the linear temperature profiles). The inverse thermal resistance corresponds to thermal conductivity normalised by AL thickness. Both formulations yield similar values of .
Third, the linear regression of the stake measurements (converted to melt heat flux Qm using Eq. 7) with the ground surface temperature Ts also yields [W m−2] (Fig. 12d), which is consistent with the above Reff derived from the radiation measurements (Eq. C1, taking Qm=Qr).
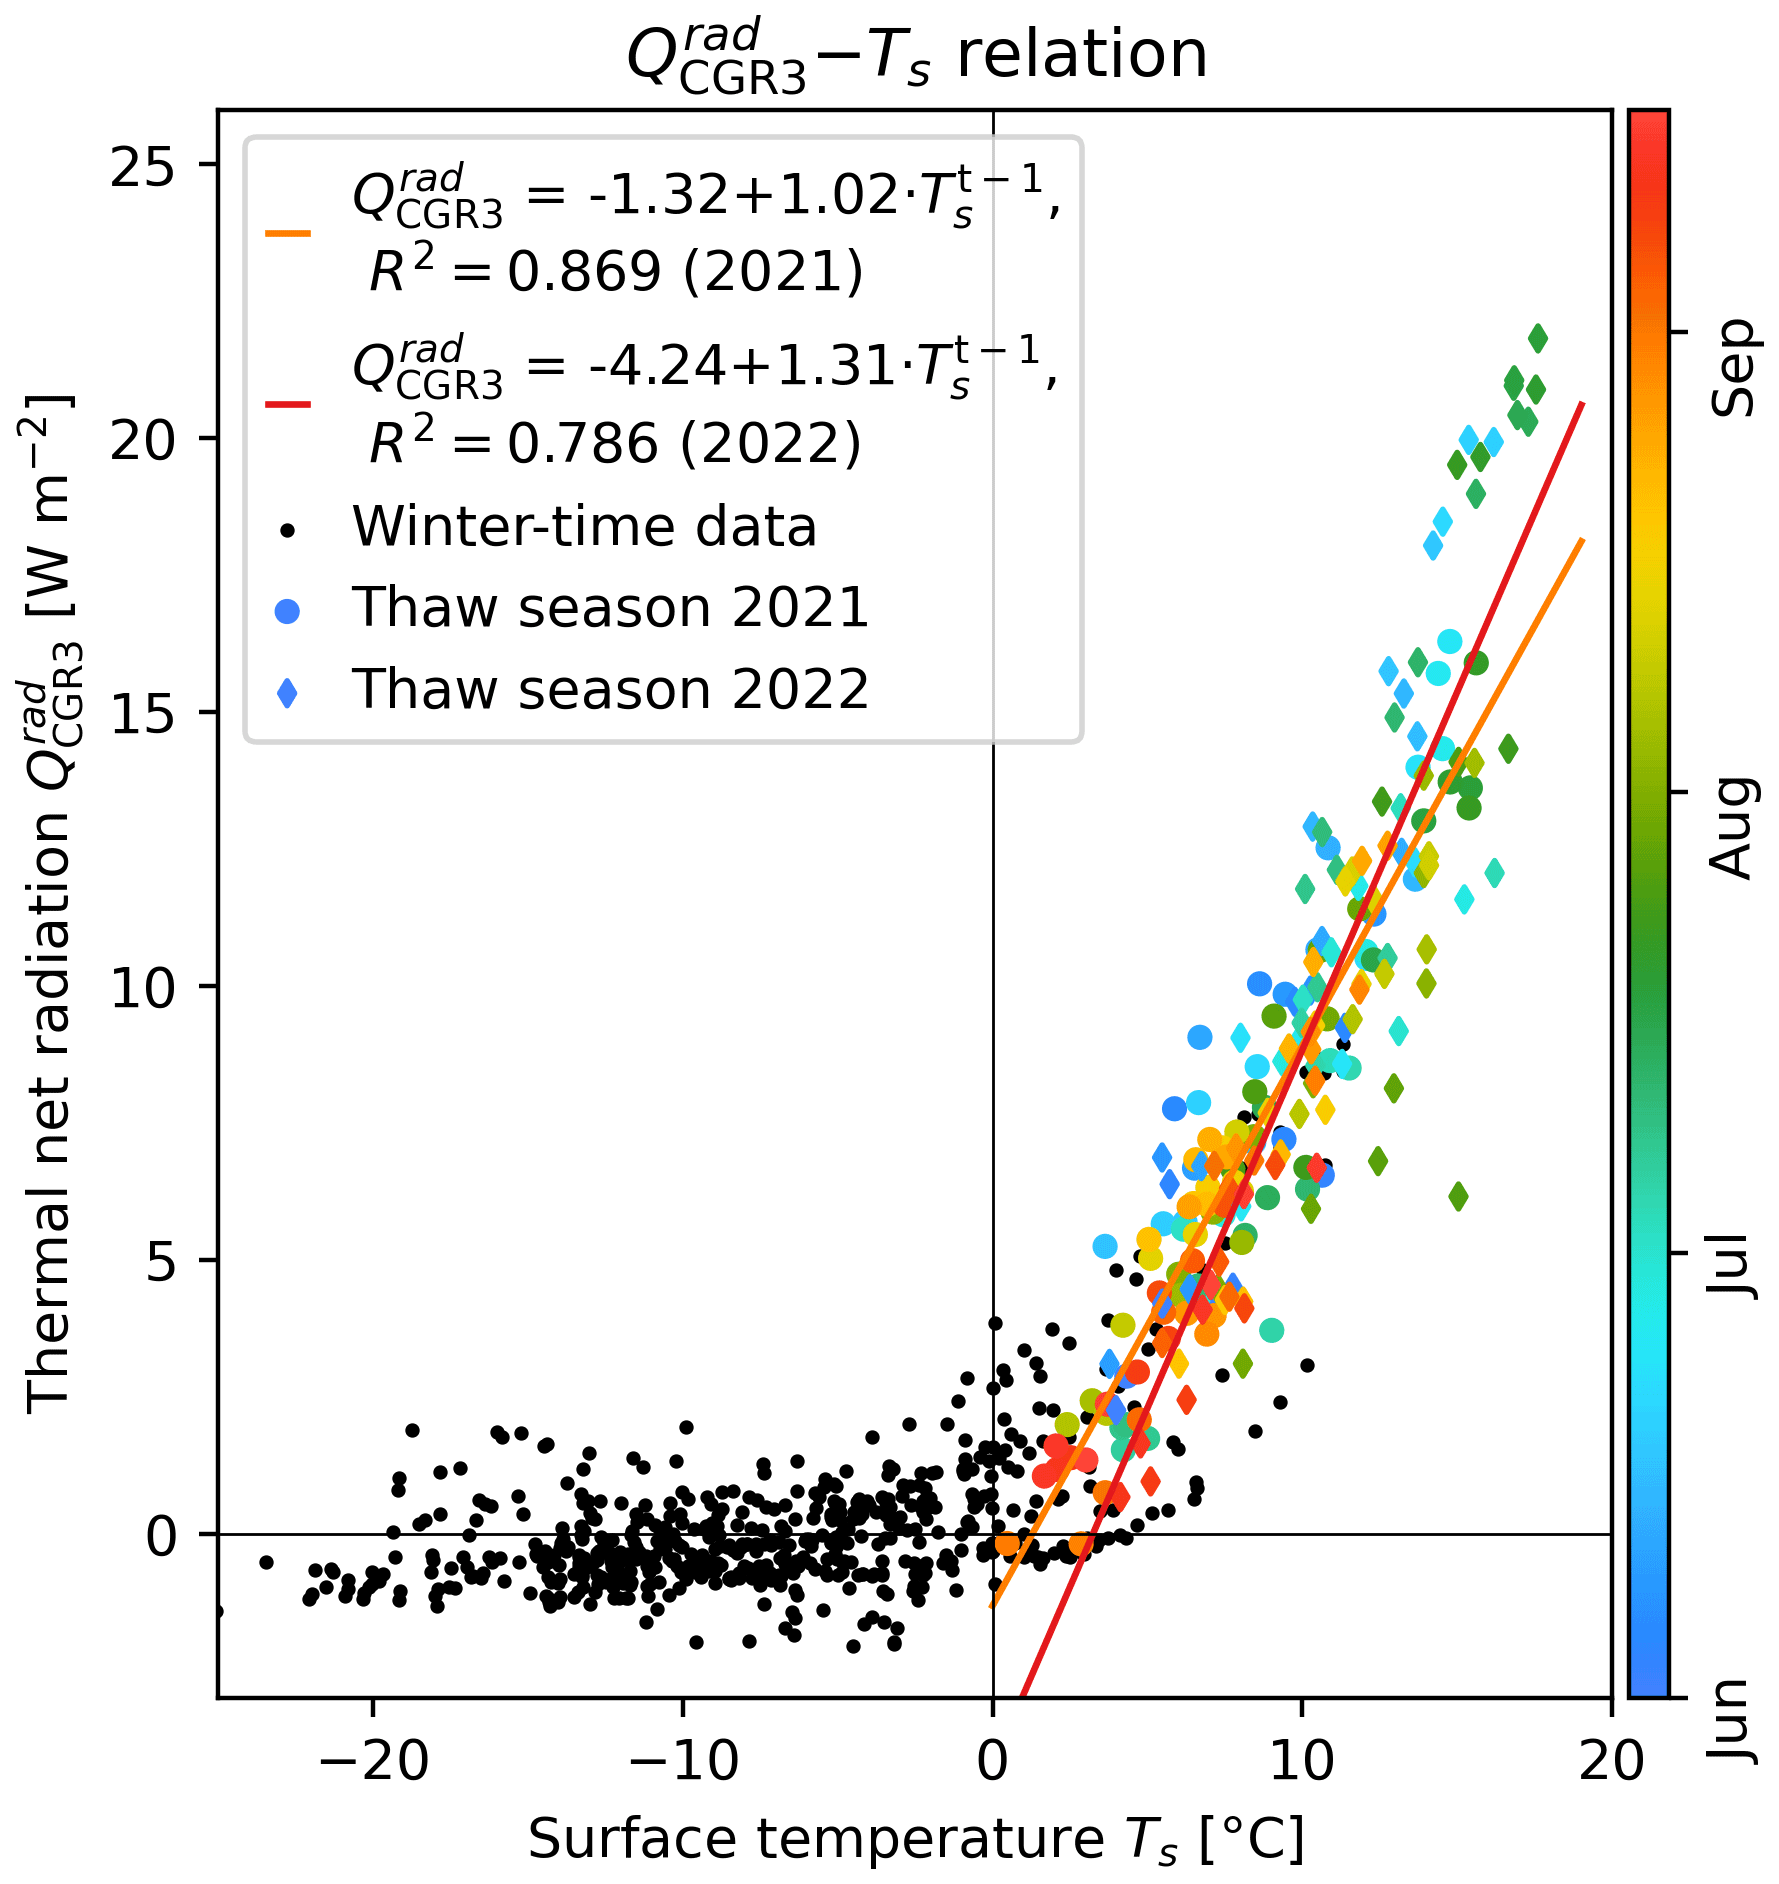
Figure C1Thermal net radiation and ground surface temperature of the previous day are correlated beneath snow-free ground.
The contribution of non-conductive heat transfer by air convection and thermal radiation is conditioned by the intrinsic permeability K that generally increases with block/pore size. Here, we give quantitative formulae for how the two related key parameters, the intrinsic permeability K and the radiative thermal conductivity kr, increase with effective particle size. The strong sensitivity of K and to debris texture at the landform scale needs be kept in mind when attempting to upscale from plot-scale measurements.
D1 Intrinsic permeability KKC
The intrinsic permeability K, an indication of the ability for fluids to pass through the porous medium, is commonly estimated via the Kozeny–Carman relation (Wicky and Hauck, 2020)
where ϕal=0.4 is the porosity, d10 a characteristic grain diameter such that 10 % of the particles are smaller than d10, and is the empirical Côté et al. (2011) correction factor for coarse material. For a characteristic block diameter d10=0.3 m, Eq. (D1) predicts , reasonably agreeing with the estimated by Wicky and Hauck (2020) inferred from thermal numerical modelling. Although the Kozeny–Carman relation has not been rigorously tested for Murtèl-sized debris composed of non-spherical blocks, estimates from different studies are consistent (Herz, 2006; Wicky and Hauck, 2020; Côté et al., 2011), and the Kozeny–Carman relation has proven useful even in turbulent airflow regimes far from Darcian. The Kozeny–Carman relation implies that the permeability K scales with , suggesting lateral and vertical variability even on the same landform, as fine material is typically more abundant near the AL base.
D2 Radiative thermal conductivity kr
Radiative thermal conductivity increases with block/pore size (actually the effective length for radiation between particles) and mean temperature cubed, . The larger the pores and the distance between particles, the larger the surface temperature differences across the pore space and the radiative thermal conductivity kr since the resulting radiative flux
is independent of the inter-particle distance (Fillion et al., 2011; Lebeau and Konrad, 2016). Radiative heat transfer bridges the pore space by bypassing the high conductive contact resistance between the blocks, whereas conduction transfers the heat within the blocks (Vortmeyer, 1979). Radiative heat transfer in porous media with opaque particles is effectively diffusive and along the temperature gradient, analogous to heat conduction. Hence, a radiative thermal conductivity kr analogous to a (conductive) thermal conductivity can be defined. The radiative conductivity is obtained from linearisation of Eq. (D2) to recast it as a flux–gradient relation (diffusion equation) of the form Qr:=kr(∇zTal) (using ; approximation valid for ) (Kaviany, 1995; Lebeau and Konrad, 2016; Esence et al., 2017; Rieksts et al., 2019),
E is a semi-empirical exchange factor (that absorbs the surface emissivity ε and the rock thermal conductivity kr and accounts for the particle arrangement), d10 the effective particle diameter (10 % of the whole material mass has particles smaller than d10; Fillion et al., 2011), σ the Stefan–Boltzmann constant, and a characteristic mean temperature. Note that radiative heat transfer counteracts undercooling because kr increases with temperature; i.e. at higher temperatures (during the thaw season), more heat is transferred under the same absolute temperature gradient (Fillion et al., 2011). This “radiative asymmetry” is opposite to the convective thermal semi-conductor effect. Using the semi-empirical Eq. (D3) (Eq. 11 in Fillion et al., 2011) yields for (, ε=0.8, °C, ). As for KKC, beware of extrapolation: due to the increasing thermal resistance, kr no longer scales linearly for large blocks (“particle non-isothermality effect”; Singh and Kaviany, 1994; Ryan et al., 2020).
The seasonal airflow speed pattern controlled by the snow cover is shown in Fig. E1. At large AL depth (deepest WS/1 at −2.1 m; Fig. E2a), airflow speed was highest either with unstable air density stratification (Rayleigh ventilation) or with an isothermal cavity at high outside wind speeds (wind-forced convection). Atmospheric wind set the labilised air column down to the cavity base in motion. At stable AL air temperature gradients, airflow speed was overall low, but even then, airflow speeds tended to be higher under high atmospheric wind speed. The effect of wind-forced convection was weak, but detectable in the wide instrumented cavity down to 2 m depth. Note the striking similarity with Fig. A1a. Near the surface (WS/6 in Fig. E2b–c), airflow speed was overall higher under snow-free conditions, increased with atmospheric wind speed (wind-forced ventilation), and was insensitive to the (at least mostly stable) vertical temperature gradient. The thicker the snow cover and the stronger the decoupling between the AL and atmosphere (AL–atmosphere coupling in Amschwand et al., 2024), the more important density contrasts became to drive the air circulation (buoyancy-driven ventilation), however at overall lower airflow speeds (Fig. E2b).
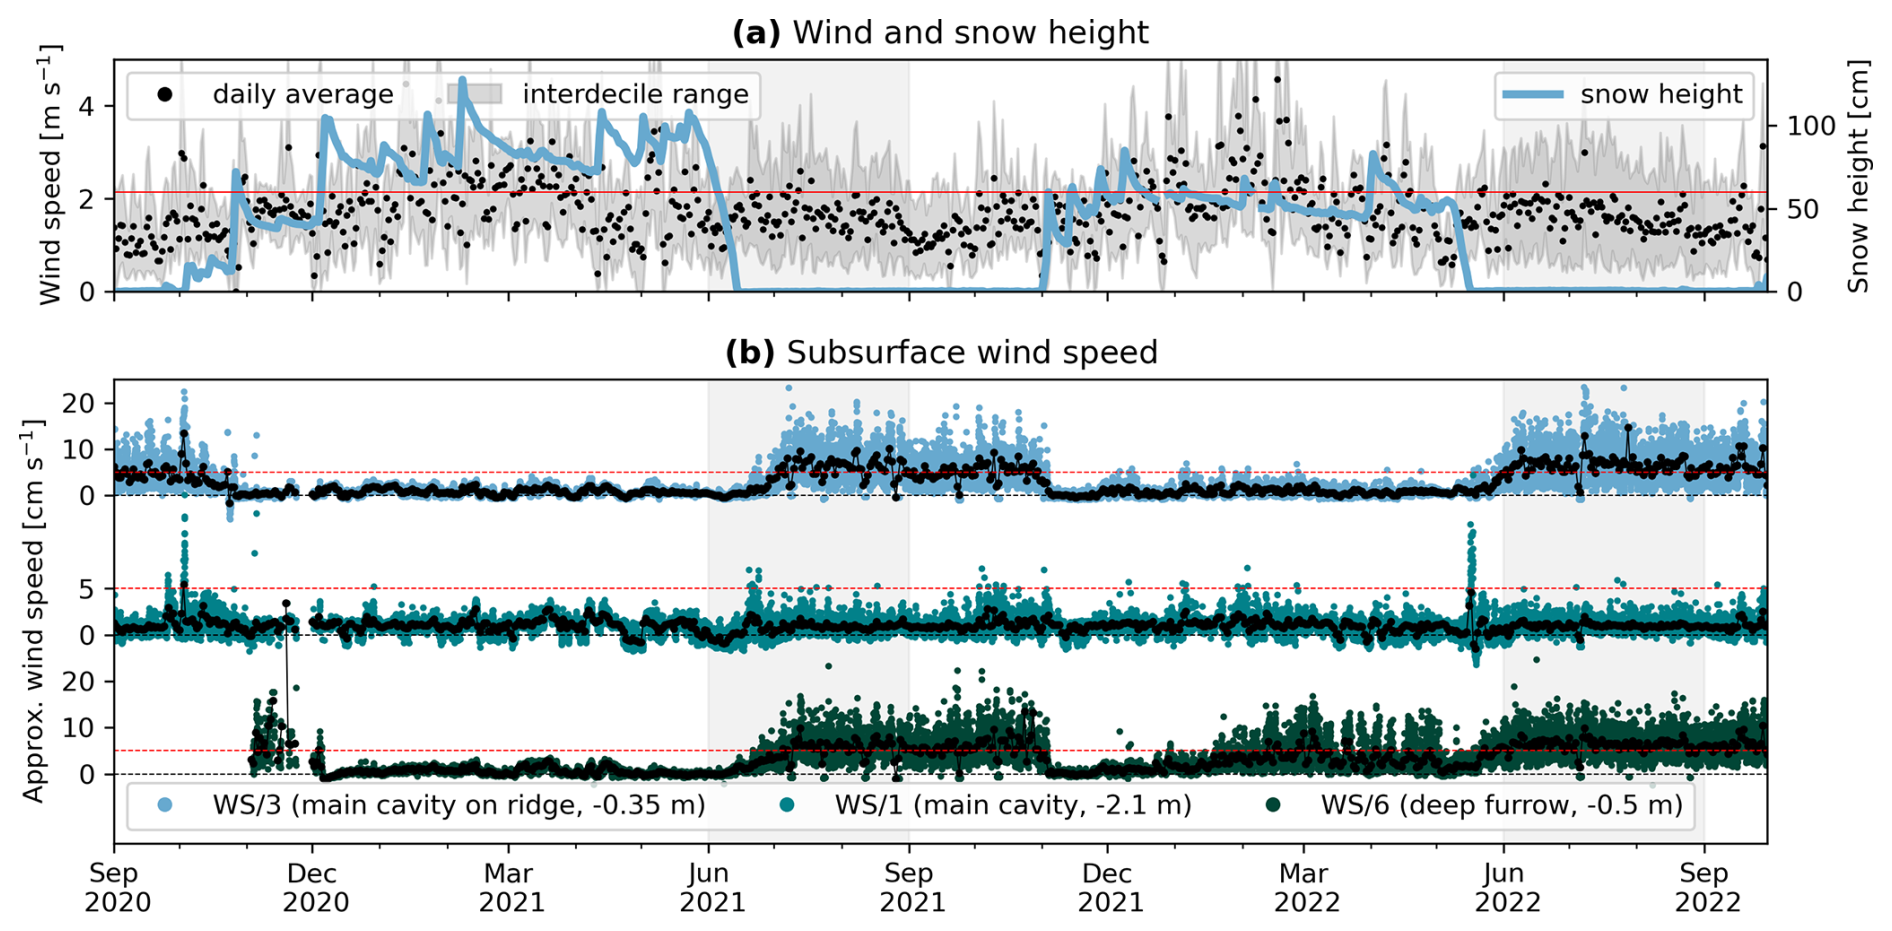
Figure E1(b) Sub-surface airflow speed (WS) measurements with (a) wind speed and snow for context.
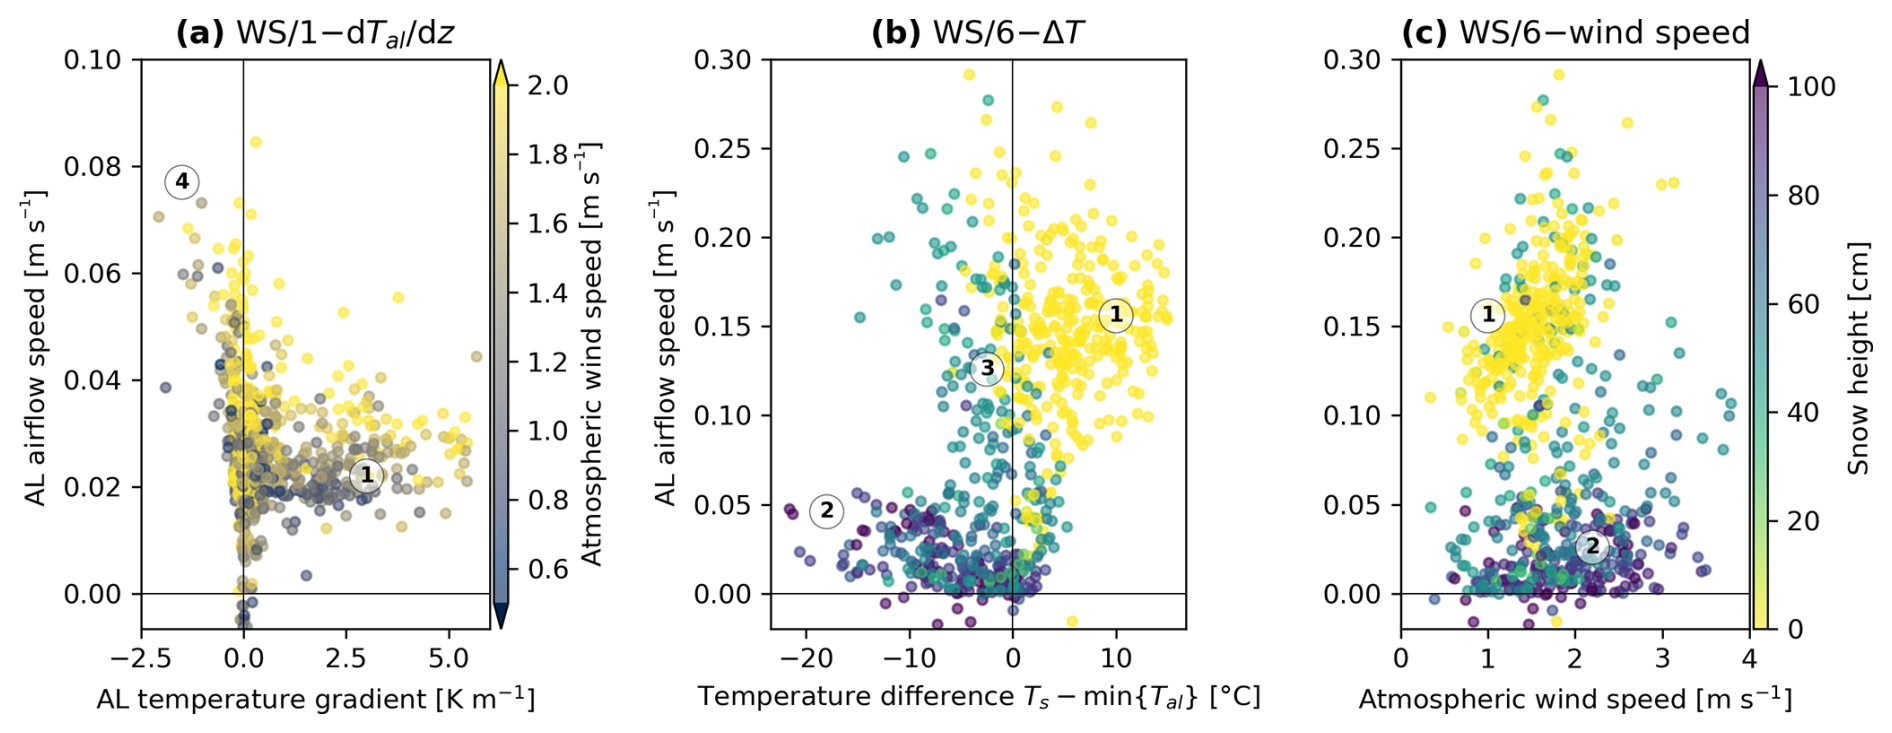
Figure E2Drivers of ventilation. (a) Ventilation at depth (WS/1) is primarily buoyancy-driven (④). At stable stratification (positive temperature gradients), airflow speeds are low but enhanced by the atmospheric wind ①. (b, c) The near-surface ventilation (WS/6) transitions from mainly wind-driven (①) to buoyancy-driven circulation with increasing snow height (②, ③). The circled numbers ①–④ refer to Table 3.
Literature values for the apparent thermal diffusivity κa in periglacial landforms, supraglacial debris, and cryic regosol are listed in Table F1.
Hanson and Hoelzle (2005)Schneider et al. (2012)Schneider et al. (2012)Schneider et al. (2012)Herz (2006)Isaksen et al. (2003)Juliussen and Humlum (2008)Juliussen and Humlum (2008)Conway and Rasmussen (2000)Nicholson and Benn (2013)Steiner et al. (2021)Mendoza López et al. (2023)Table F1Literature values for the apparent thermal diffusivity κa.
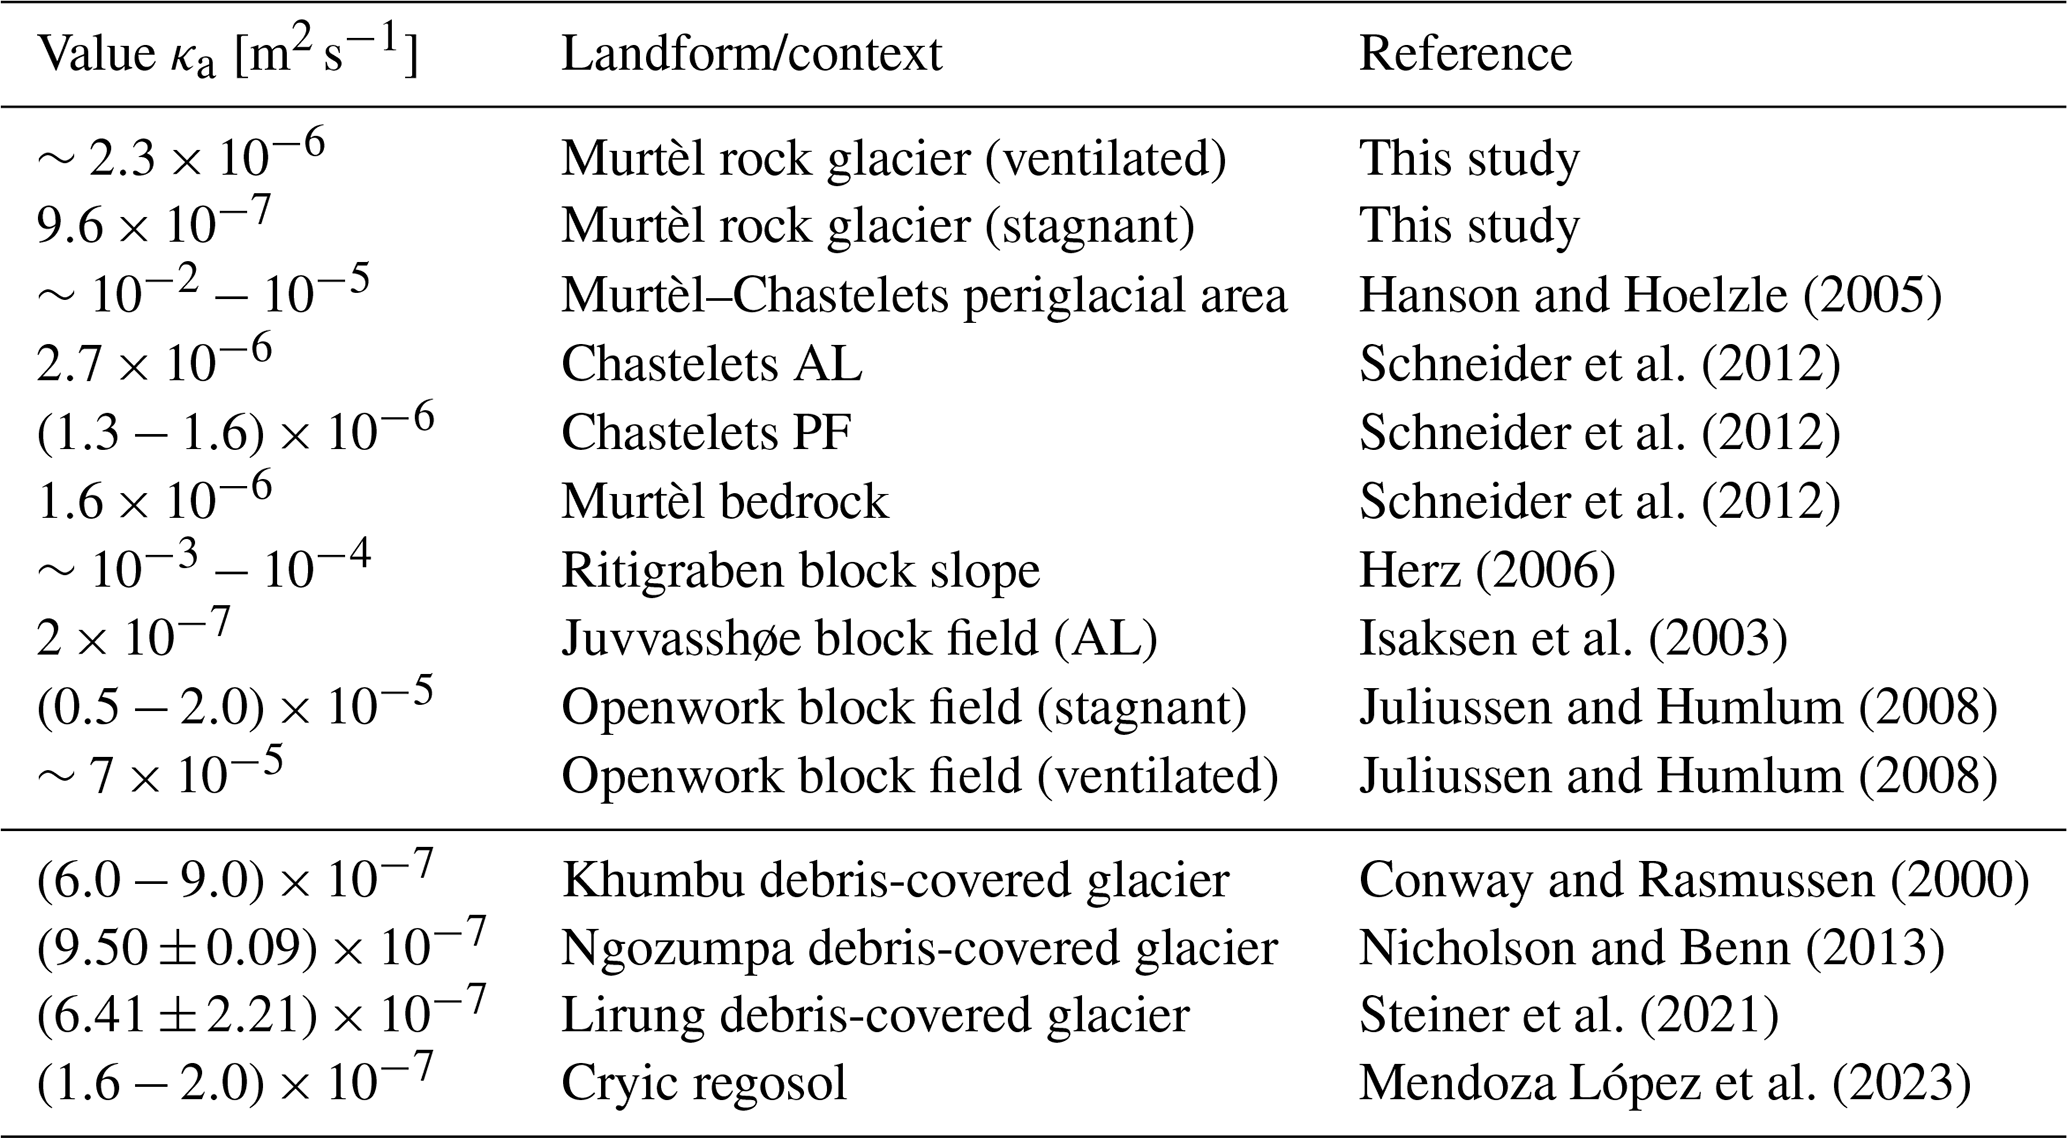
AL: active layer; PF: permafrost body. See keff for supraglacial debris tabulated in Rowan et al. (2021).
Variables, parameters, and constants used in this study are tabulated in Table G1.
Table G1Nomenclature: measurement variables, parameters, dimensionless numbers, and constants.
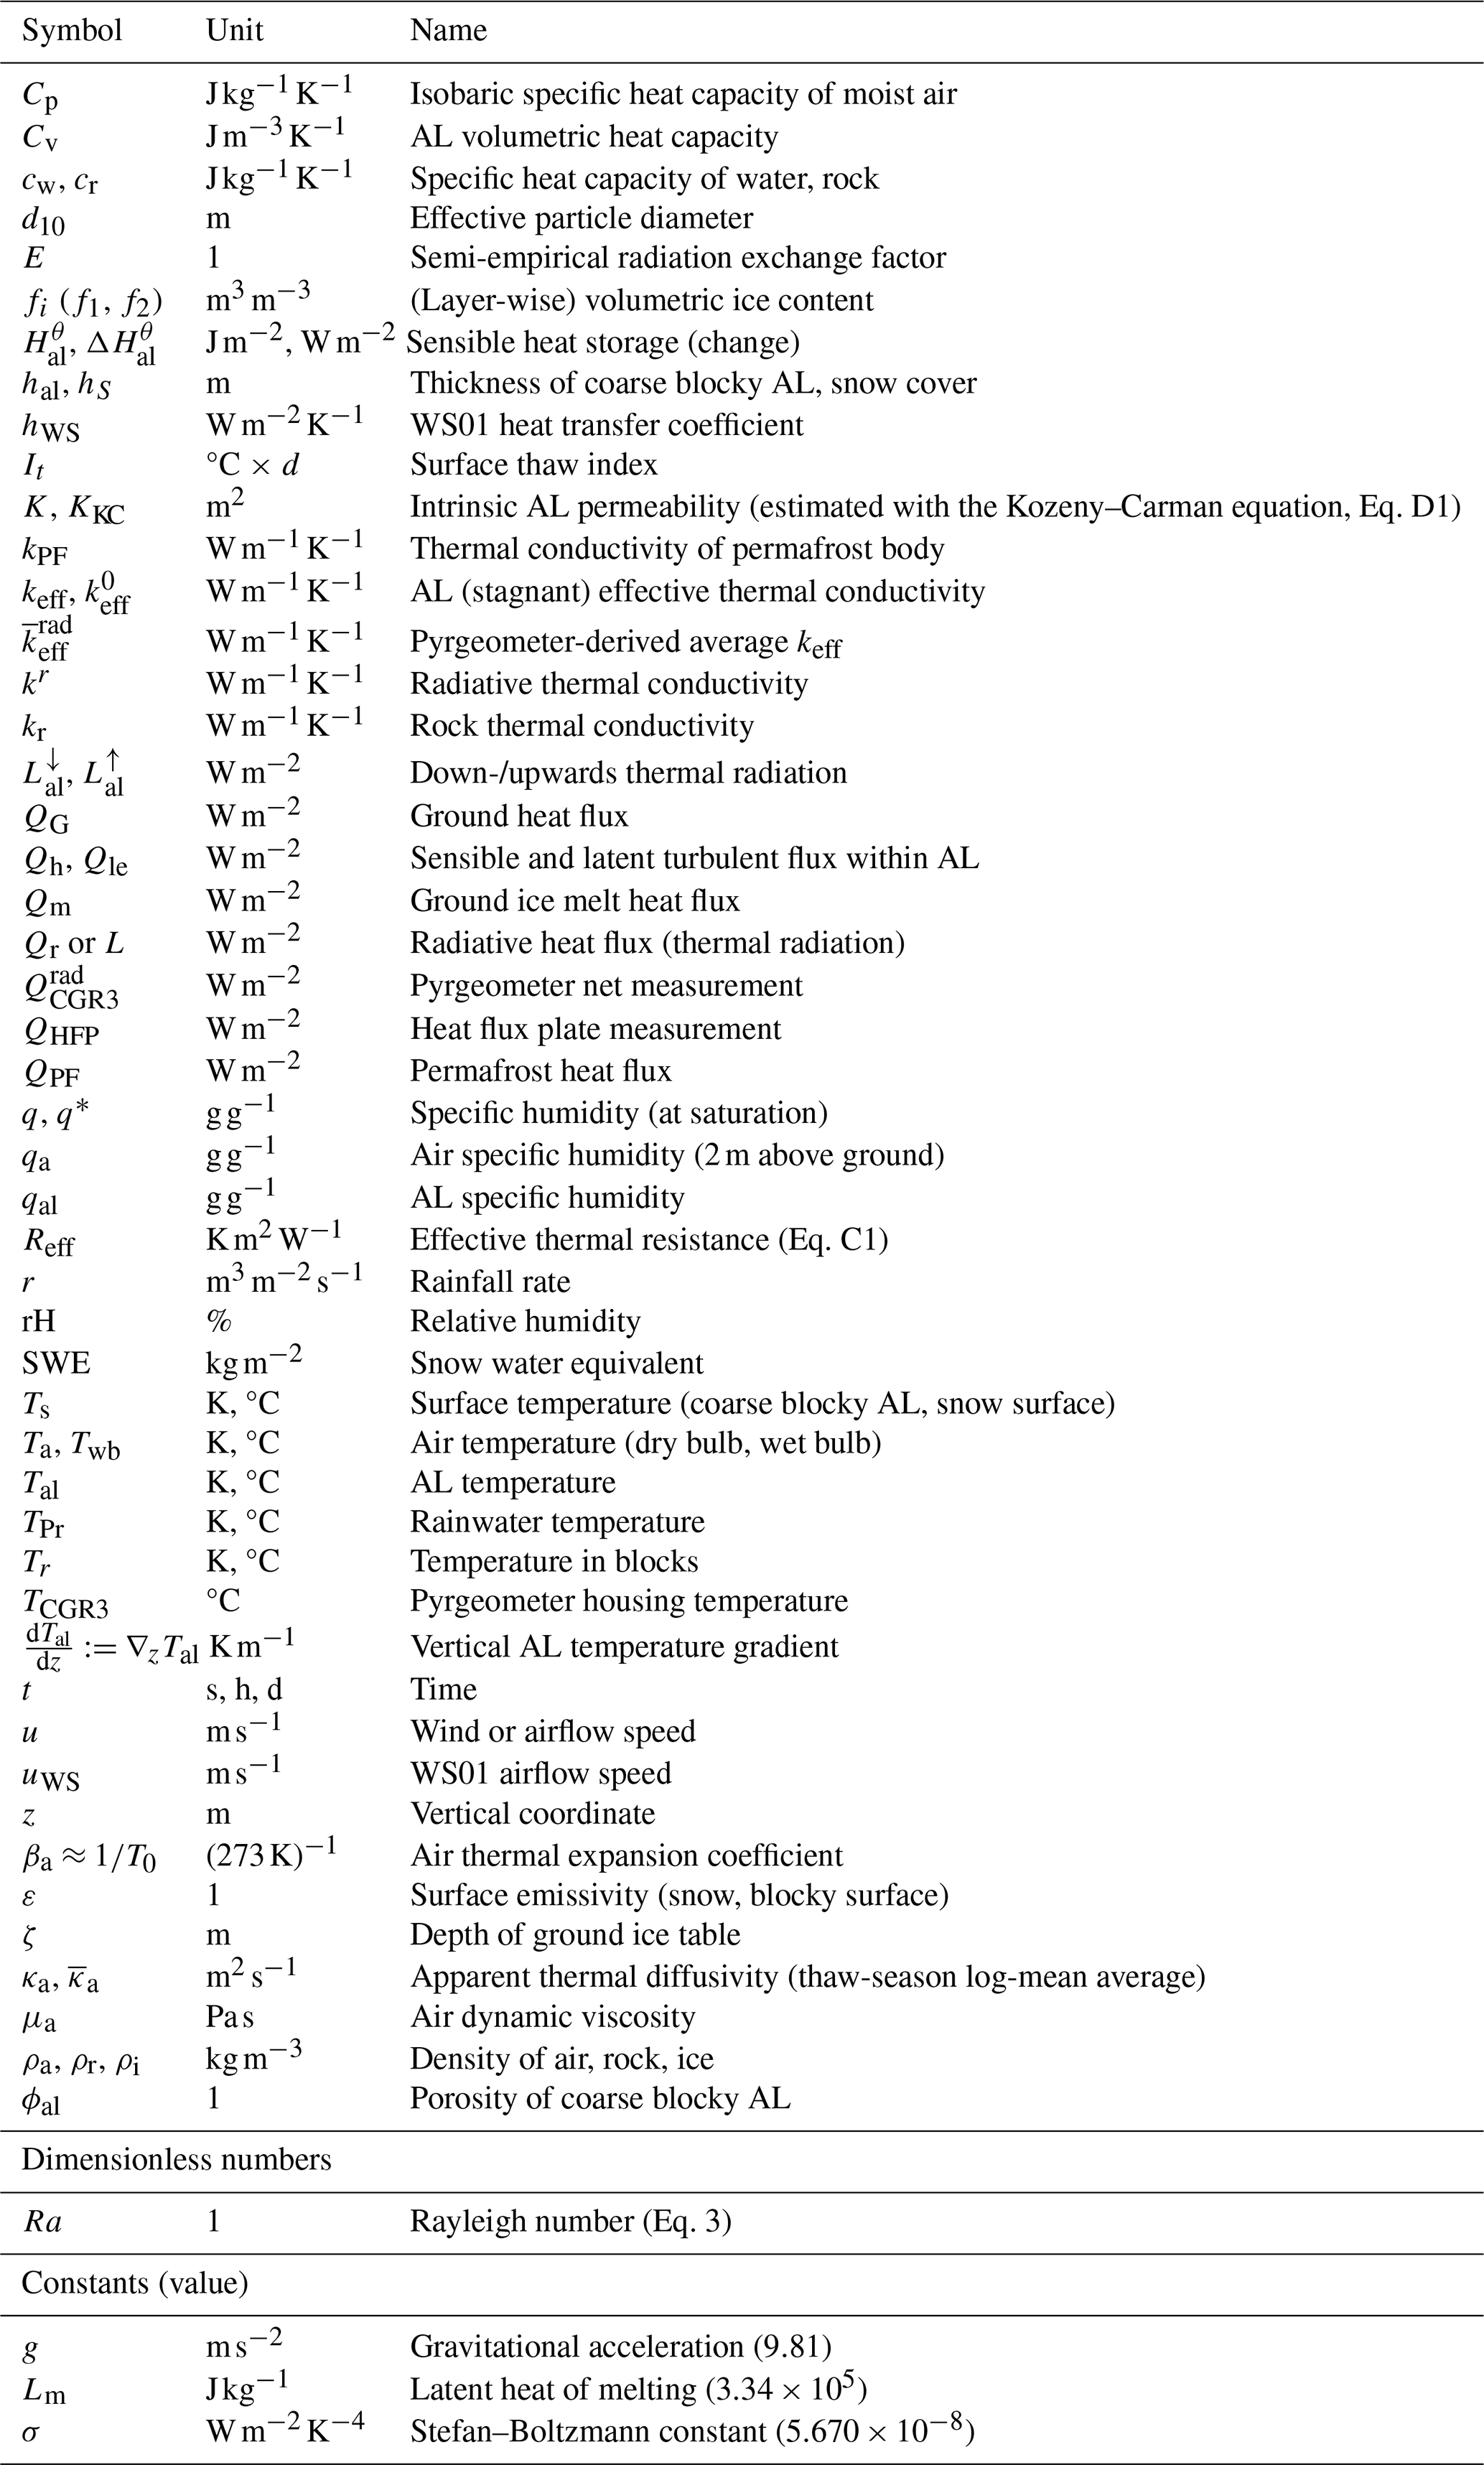
The PERMOS data can be obtained from the PERMOS network (https://doi.org/10.13093/permos-meteo-2021-01, Hoelzle et al., 2021) and the PERMA-XT measurement data from https://www.permos.ch/doi/permos-spec-2023-1 (last access: 8 April 2025; https://doi.org/10.13093/permos-spec-2023-01, Amschwand et al., 2023).
DA performed the fieldwork, model development, and analyses for the study and wrote the manuscript. MS, MH, and BK supervised the study, provided financial and field support, and contributed to the manuscript preparation. AH and CK provided logistical support and editorial suggestions for the manuscript. HG designed the novel sensor array, regularly checked data quality, contributed to the analyses, and provided editorial suggestions for the manuscript.
The contact author has declared that none of the authors has any competing interests.
Publisher’s note: Copernicus Publications remains neutral with regard to jurisdictional claims made in the text, published maps, institutional affiliations, or any other geographical representation in this paper. While Copernicus Publications makes every effort to include appropriate place names, the final responsibility lies with the authors.
This work is a collaboration between the University of Fribourg and GEOTEST. The authors wish to thank Walter Jäger (Waljag GmbH, Malans) and Thomas Sarbach (Sarbach Mechanik, St. Niklaus) for the technical support, the Corvatsch cable car company for logistical support, and Marc Lütscher (SISKA, La Chaux-de-Fonds) for the discussions.
This research has been funded by the Innosuisse – Schweizerische Agentur für Innovationsförderung (grant no. 36242.1 IP-EE, “Permafrost Meltwater Assessment eXpert Tool PERMA-XT”).
This paper was edited by Jens Turowski and reviewed by two anonymous referees.
Aldrich, H. P. and Paynter, H. M.: First Interim Report: Analytical Studies of Freezing and Thawing of Soils (ACFEL Technical Report No. 42), Tech. rep., US Corps of Engineers, Boston (MA), Arctic Construction and Frost Effects Laboratory (ACFEL), http://hdl.handle.net/11681/6526 (last access: 8 April 2025), 1953. a
Amschwand, D., Scherler, M., Hoelzle, M., Krummenacher, B., Tschan, S., Aschwanden, L., and Gubler, H.: Murtèl rock glacier PERMA-XT data set (2020–2023), University of Fribourg/GEOTEST Zollikofen [data set], https://doi.org/10.13093/permos-spec-2023-01, 2023. a
Amschwand, D., Scherler, M., Hoelzle, M., Krummenacher, B., Haberkorn, A., Kienholz, C., and Gubler, H.: Surface heat fluxes at coarse blocky Murtèl rock glacier (Engadine, eastern Swiss Alps), The Cryosphere, 18, 2103–2139, https://doi.org/10.5194/tc-18-2103-2024, 2024. a, b, c, d, e, f, g, h, i, j, k, l, m, n, o, p, q, r, s, t, u, v, w, x, y, z, aa, ab, ac
Amschwand, D., Tschan, S., Scherler, M., Hoelzle, M., Krummenacher, B., Haberkorn, A., Kienholz, C., Aschwanden, L., and Gubler, H.: Seasonal ice storage changes and meltwater generation at Murtèl rock glacier (Engadine, eastern Swiss Alps): estimates from measurements and energy budgets in the coarse blocky active layer, Hydrol. Earth Syst. Sci., 29, 2219–2253, https://doi.org/10.5194/hess-29-2219-2025, 2025. a
Arenson, L., Hoelzle, M., and Springman, S.: Borehole deformation measurements and internal structure of some rock glaciers in Switzerland, Permafrost Periglac., 13, 117–135, https://doi.org/10.1002/ppp.414, 2002. a
Arenson, L. U., Hauck, C., Hilbich, C., Seward, L., Yamamoto, Y., and Springman, S. M.: Sub-surface heterogeneities in the Murtèl-Corvatsch rock glacier, Switzerland, in: Proceedings of the joint 63rd Canadian Geotechnical Conference and the 6th Canadian Permafrost Conference (GEO2010), 12–15 September 2010, Calgary (Alberta), Canada, Canadian Geotechnical Society, CNC-IPA/NRCan, Calgary, AB, Canada, 1494–1500, https://members.cgs.ca/documents/conference2010/GEO2010/pdfs/GEO2010_199.pdf (last access: 8 April 2025), 2010. a, b
Bächler, E.: Der verwünschte oder verhexte Wald im Brüeltobel, Appenzellerkalender, 209, https://doi.org/10.5169/seals-374836, 1930. a, b
Balch, E. S.: Glacières or Freezing Caverns, Allen, Lane & Scott, Philadelphia, 337 pp., https://www.gutenberg.org/ebooks/52216 (last access: 8 April 2025), 1900. a, b
Bernhard, L., Sutter, F., Haeberli, W., and Keller, F.: Processes of snow/permafrost-interactions at a high mountain site, Murtèl/Corvatsch, eastern Swiss Alps, in: Proceedings of the 7th International Conference on Permafrost, 23–27 June 1998, Yellowknife, Northwest Territories, Canada, edited by: Lewkowicz, A. G. and Allard, M., Centre d'Études Nordiques, Université Laval (Québec), Canada, 35–41, https://www.arlis.org/docs/vol1/ICOP/40770716/CD-ROM/Proceedings/PDF001189/007221.pdf (last access: 8 April 2025), 1998. a
Biskaborn, B. K., Smith, S. L., Noetzli, J., Matthes, H., Vieira, G., Streletskiy, D. A., Schoeneich, P., Romanovsky, V. E., Lewkowicz, A. G., Abramov, A., Allard, M., Boike, J., Cable, W. L., Christiansen, H. H., Delaloye, R., Diekmann, B., Drozdov, D., Etzelmüller, B., Grosse, G., Guglielmin, M., Ingeman-Nielsen, T., Isaksen, K., Ishikawa, M., Johansson, M., Johannsson, H., Joo, A., Kaverin, D., Kholodov, A., Konstantinov, P., Kröger, T., Lambiel, C., Lanckman, J.-P., Luo, D., Malkova, G., Meiklejohn, I., Moskalenko, N., Oliva, M., Phillips, M., Ramos, M., Sannel, A. B. K., Sergeev, D., Seybold, C., Skryabin, P., Vasiliev, A., Wu, Q., Yoshikawa, K., Zheleznyak, M., and Lantuit, H.: Permafrost is warming at a global scale, Nat. Commun., 10, 264, https://doi.org/10.1038/s41467-018-08240-4, 2019. a
Brighenti, S., Hotaling, S., Finn, D. S., Fountain, A. G., Hayashi, M., Herbst, D., Saros, J. E., Tronstad, L. M., and Millar, C. I.: Rock glaciers and related cold rocky landforms: Overlooked climate refugia for mountain biodiversity, Global Change Biol., 27, 1504–1517, https://doi.org/10.1111/gcb.15510, 2021. a, b
Caltagirone, J. P. and Bories, S.: Solutions and stability criteria of natural convective flow in an inclined porous layer, J. Fluid Mechan., 155, 267–287, https://doi.org/10.1017/S002211208500180X, 1985. a
Conway, H. and Rasmussen, L. A.: Summer temperature profiles within supraglacial debris on Khumbu Glacier, Nepal, in: Debris-covered Glaciers: Proceedings of an International Workshop Held at the University of Washington in Seattle, Washington, USA, 13–15 September 2000, edited by: Fountain, A., Raymond, C. F., and Nakao, M., vol. 264 of IAHS Proc. N. 264, 89–97 pp., 2000. a, b
Côté, J. and Konrad, J.-M.: Thermal conductivity of base-course materials, Can. Geotech. J., 42, 61–78, https://doi.org/10.1139/t04-081, 2005. a
Côté, J., Fillion, M.-H., and Konrad, J.-M.: Intrinsic permeability of materials ranging from sand to rock-fill using natural air convection tests, Can. Geotech. J., 48, 679–690, https://doi.org/10.1139/t10-097, 2011. a, b, c, d
Delaloye, R. and Lambiel, C.: Evidence of winter ascending air circulation throughout talus slopes and rock glaciers situated in the lower belt of alpine discontinuous permafrost (Swiss Alps), Norsk Geogr. Tidsskr., 59, 194–203, https://doi.org/10.1080/00291950510020673, 2005. a, b, c, d
Delaloye, R., Lambiel, C., and Gärtner-Roer, I.: Overview of rock glacier kinematics research in the Swiss Alps, Geographica Helvetica, 65, 135–145, https://doi.org/10.5194/gh-65-135-2010, 2010. a
Esence, T., Bruch, A., Molina, S., Stutz, B., and Fourmigué, J.-F.: A review on experience feedback and numerical modeling of packed-bed thermal energy storage systems, Solar Energy, 153, 628–654, https://doi.org/10.1016/j.solener.2017.03.032, 2017. a, b
Evatt, G. W., Abrahams, I. D., Heil, M., Mayer, C., Kingslake, J., Mitchell, S. L., Fowler, A. C., and Clark, C. D.: Glacial melt under a porous debris layer, J. Glaciol., 61, 825–836, https://doi.org/10.3189/2015JoG14J235, 2015. a, b
Fillion, M.-H., Côté, J., and Konrad, J.-M.: Thermal radiation and conduction properties of materials ranging from sand to rock-fill, Can. Geotech. J., 48, 532–542, https://doi.org/10.1139/t10-093, 2011. a, b, c, d, e, f, g, h, i
Frauenfelder, R. and Kääb, A.: Towards a palaeoclimatic model of rock-glacier formation in the Swiss Alps, Ann. Glaciol., 31, 281–286, https://doi.org/10.3189/172756400781820264, 2000. a
Fujita, K. and Sakai, A.: Modelling runoff from a Himalayan debris-covered glacier, Hydrol. Earth Syst. Sci., 18, 2679–2694, https://doi.org/10.5194/hess-18-2679-2014, 2014. a
Gorbunov, A. P., Marchenko, S. S., and Seversky, E. V.: The thermal environment of blocky materials in the mountains of Central Asia, Permafrost Periglac., 15, 95–98, https://doi.org/10.1002/ppp.478, 2004. a, b
Gottlieb, A. R. and Mankin, J. S.: Evidence of human influence on Northern Hemisphere snow loss, Nature, 625, 293–300, https://doi.org/10.1038/s41586-023-06794-y, 2024. a
Gruber, S. and Hoelzle, M.: The cooling effect of coarse blocks revisited: a modeling study of a purely conductive mechanism, in: Proceedings of the 9th International Conference on Permafrost, 29 June–3 July 2008, Fairbanks, Alaska, edited by: Kane, D. and Hinkel, K., 557–561 pp., Institute of Northern Engineering, University of Alaska, Fairbanks, Alaska, 2008. a
Guodong, C.: A roadbed cooling approach for the construction of Qinghai–Tibet Railway, Cold Reg. Sci. Technol., 42, 169–176, https://doi.org/10.1016/j.coldregions.2005.01.002, 2005. a
Guodong, C., Yuanming, L., Zhizhong, S., and Fan, J.: The `thermal semi-conductor' effect of crushed rocks, Permafrost Periglac., 18, 151–160, https://doi.org/10.1002/ppp.575, 2007. a, b, c, d
Haeberli, W., Hallet, B., Arenson, L., Elconin, R., Humlum, O., Kääb, A., Kaufmann, V., Ladanyi, B., Matsuoka, N., Springman, S., and Mühll, D. V.: Permafrost creep and rock glacier dynamics, Permafrost Periglac., 17, 189–214, https://doi.org/10.1002/ppp.561, 2006. a, b, c
Haeberli, W., Schaub, Y., and Huggel, C.: Increasing risks related to landslides from degrading permafrost into new lakes in de-glaciating mountain ranges, Geomorphology, 293, 405–417, https://doi.org/10.1016/j.geomorph.2016.02.009, 2017. a
Haeberli, W., Arenson, L. U., Wee, J., Hauck, C., and Mölg, N.: Discriminating viscous-creep features (rock glaciers) in mountain permafrost from debris-covered glaciers – a commented test at the Gruben and Yerba Loca sites, Swiss Alps and Chilean Andes, The Cryosphere, 18, 1669–1683, https://doi.org/10.5194/tc-18-1669-2024, 2024. a
Halla, C., Blöthe, J. H., Tapia Baldis, C., Trombotto Liaudat, D., Hilbich, C., Hauck, C., and Schrott, L.: Ice content and interannual water storage changes of an active rock glacier in the dry Andes of Argentina, The Cryosphere, 15, 1187–1213, https://doi.org/10.5194/tc-15-1187-2021, 2021. a
Hanson, S. and Hoelzle, M.: The thermal regime of the active layer at the Murtèl rock glacier based on data from 2002, Permafrost Periglac., 15, 273–282, https://doi.org/10.1002/ppp.499, 2004. a, b, c
Hanson, S. and Hoelzle, M.: Installation of a shallow borehole network and monitoring of the ground thermal regime of a high alpine discontinuous permafrost environment, Eastern Swiss Alps, Norsk Geogr. Tidsskr., 59, 84–93, https://doi.org/10.1080/00291950510020664, 2005. a, b
Harris, S., Cheng, G., Zhao, X., and Yongqin, D.: Nature and dynamics of an active block stream, Kunlun Pass, Qinghai Province, People's Republic of China, Geogr. Ann. A, 80, 123–133, https://doi.org/10.1111/j.0435-3676.1998.00031.x, 1998. a
Harris, S. A. and Pedersen, D. E.: Thermal regimes beneath coarse blocky materials, Permafr. Periglac., 9, 107–120, https://doi.org/10.1002/(SICI)1099-1530(199804/06)9:2<107::AID-PPP277>3.0.CO;2-G, 1998. a, b
Hartl, L., Zieher, T., Bremer, M., Stocker-Waldhuber, M., Zahs, V., Höfle, B., Klug, C., and Cicoira, A.: Multi-sensor monitoring and data integration reveal cyclical destabilization of the Äußeres Hochebenkar rock glacier, Earth Surf. Dynam., 11, 117–147, https://doi.org/10.5194/esurf-11-117-2023, 2023. a
Hauck, C. and Hilbich, C.: Preconditioning of mountain permafrost towards degradation detected by electrical resistivity, Environ. Res. Lett., 19, 064010, https://doi.org/10.1088/1748-9326/ad3c55, 2024. a
Hayashi, M.: Alpine hydrogeology: The critical role of groundwater in sourcing the headwaters of the world, Groundwater, 58, 498–510, https://doi.org/10.1111/gwat.12965, 2020. a
Hayashi, M., Goeller, N., Quinton, W. L., and Wright, N.: A simple heat-conduction method for simulating the frost-table depth in hydrological models, Hydrol. Process., 21, 2610–2622, https://doi.org/10.1002/hyp.6792, 2007. a, b, c, d, e
Herz, T.: Das Mikroklima grobblockiger Schutthalden der alpinen Periglazialstufe und seine Auswirkungen auf Energieaustauschprozesse zwischen Atmosphäre und Lithosphäre [The microclimate of coarse debris covers in the periglacial belt of high mountains and its effects on the energy exchange between atmosphere and lithosphere], PhD thesis, Justus-Liebig-Universität Gießen, Gießen, https://doi.org/10.22029/jlupub-9548, 2006. a, b, c, d, e, f, g, h, i, j, k, l, m
Herz, T., King, L., and Gubler, H.: Microclimate within coarse debris of talus slopes in the alpine periglacial belt and its effect on permafrost, in: Proceedings of the 8th International Conference on Permafrost, 21–25 July 2003, Zurich, Switzerland, edited by: Phillips, M., Springman, S. M., and Arenson, L. U., 383–387 pp., Swets & Zeitlinger, Lisse, Zürich, 2003a. a
Herz, T., King, L., and Gubler, H.: Thermal regime of coarse debris layers in the Ritigraben catchment, Matter Valley, Swiss Alps, in: Extended abstracts of the 8th International Conference on Permafrost, 21–25 July 2003, Zurich, Switzerland, edited by: Haeberli, W. and Brandová, D., 61–62 pp., Swets & Zeitlinger, Lisse, Zürich, 2003b. a, b
Hilbich, C., Hauck, C., Hoelzle, M., Scherler, M., Schudel, L., Völksch, I., Vonder Mühll, D., and Mäusbacher, R.: Monitoring mountain permafrost evolution using electrical resistivity tomography: A 7-year study of seasonal, annual, and long-term variations at Schilthorn, Swiss Alps, J. Geophys. Res.-Earth Surface, 113, F01S90, https://doi.org/10.1029/2007JF000799, 2008. a
Hinkel, K. M., Outcalt, S. I., and Nelson, F. E.: Temperature variation and apparent thermal diffusivity in the refreezing active layer, Toolik Lake, Alaska, Permafrost Periglac., 1, 265–274, https://doi.org/10.1002/ppp.3430010306, 1990. a, b
Hock, R., Rasul, G., Adler, C., Cáceres, B., Gruber, S., Hirabayashi, Y., Jackson, M., Kääb, A., Kang, S., Kutuzov, S., Milner, A., Molau, U., Morin, S., Orlove, B., and Steltzer, H.: IPCC Special Report on the Ocean and Cryosphere in a Changing Climate, edited by: Pörtner, H.–O., Roberts, D. C., Masson-Delmotte, V., Zhai, P., Tignor, M., Poloczanska, E., Mintenbeck, K., Alegrìa, A., Nicolai, M., Okem, A., Petzold, J., Rama, B., and Weyer, N. M., Chap. 4: High Mountain Areas, 131–202 pp., Cambridge University Press (Cambridge, UK and New York, NY, USA), https://doi.org/10.1017/9781009157964.004, 2022. a
Hoelzle, M. and Gruber, S.: Borehole and ground surface temperatures and their relationship to meteorological conditions in the Swiss Alps, in: Proceedings of the 9th International Conference on Permafrost, June 29–July 3 2008, Fairbanks, Alaska, edited by: Kane, D. and Hinkel, K., 723–728 pp., Institute of Northern Engineering, University of Alaska, Fairbanks, Alaska, ISBN 978-0-9800179-2-2, https://doi.org/10.5167/uzh-2825, 2008. a
Hoelzle, M., Wegmann, M., and Krummenacher, B.: Miniature temperature dataloggers for mapping and monitoring of permafrost in high mountain areas: first experience from the Swiss Alps, Permafrost Periglac., 10, 113–124, https://doi.org/10.1002/(SICI)1099-1530(199904/06)10:2<113::AID-PPP317>3.0.CO;2-A, 1999. a
Hoelzle, M., Mittaz, C., Etzelmüller, B., and Haeberli, W.: Surface energy fluxes and distribution models of permafrost in European mountain areas: an overview of current developments, Permafrost Periglac., 12, 53–68, https://doi.org/10.1002/ppp.385, 2001. a, b
Hoelzle, M., Haeberli, W., and Stocker-Mittaz, C.: Miniature ground temperature data logger measurements 2000–2002 in the Murtèl-Corvatsch area, Eastern Swiss Alps, in: Proceedings of the 8th International Conference on Permafrost, 21–25 July 2003, Zurich, Switzerland, edited by: Phillips, M., Springman, S. M., and Arenson, L. U., 419–424 pp., Swets & Zeitlinger, Lisse, Zürich, 2003. a, b
Hoelzle, M., Hauck, C., Mathys, T., Noetzli, J., Pellet, C., and Scherler, M.: : Energy balance measurements at three PERMOS sites: Corvatsch, Schilthorn, Stockhorn, PERMOS [data set], https://doi.org/10.13093/permos-meteo-2021-01, 2021. a
Hoelzle, M., Hauck, C., Mathys, T., Noetzli, J., Pellet, C., and Scherler, M.: Long-term energy balance measurements at three different mountain permafrost sites in the Swiss Alps, Earth Syst. Sci. Data, 14, 1531–1547, https://doi.org/10.5194/essd-14-1531-2022, 2022. a, b, c, d
Hugonnet, R., McNabb, R., Berthier, E., Menounos, B., Nuth, C., Girod, L., Farinotti, D., Huss, M., Dussaillant, I., Brun, F., and Kääb, A.: Accelerated global glacier mass loss in the early twenty-first century, Nature, 592, 726–731, https://doi.org/10.1038/s41586-021-03436-z, 2021. a
Hukseflux HFP manual: Manual for the Hukseflux HFP01 & HFP03 sensors heat flux plate/heat flux sensor (HFP manual v1721), Tech. rep., Hukseflux Thermal Sensors, Delft, 45 pp., https://www.hukseflux.com/uploads/product-documents/HFP01_HFP03_manual_v2326.pdf (last access: 8 April 2025), 2016. a
Hukseflux WS01 manual: Manual for the Hukseflux WS01 sensor for ultra low wind speeds and boundary layer conductance (WS01 manual v0608), Tech. rep., Hukseflux Thermal Sensors, Delft, 35 pp., https://www.hukseflux.com/uploads/product-documents/TP01_manual_v2028.pdf (last access: 8 April 2025), 2006. a
Humlum, O.: Active layer thermal regime at three rock glaciers in Greenland, Permafrost Periglac., 8, 383–408, https://doi.org/10.1002/(SICI)1099-1530(199710/12)8:4<383::AID-PPP265>3.0.CO;2-V, 1997. a
Isaksen, K., Heggem, E., Bakkehøi, S., Ødegård, R., Eiken, T., Etzelmüller, B., and Sollid, J.: Mountain permafrost and energy balance on Juvvasshøe, southern Norway, in: Proceedings of the 8th International Conference on Permafrost, 21–25 July 2003, Zurich, Switzerland, edited by: Phillips, M., Springman, S., and Arenson, L., 467–472 pp., Swets & Zeitlinger, Lisse, Zürich, 2003. a
Johansen, Ø.: Thermal conductivity of soils (CRREL Draft Translation 637, 1977), Tech. rep., 1975. a, b, c, d, e, f
Jones, D. B., Harrison, S., Anderson, K., and Whalley, W. B.: Rock glaciers and mountain hydrology: A review, Earth-Sci. Rev., 193, 66–90, https://doi.org/10.1016/j.earscirev.2019.04.001, 2019. a
Jorgenson, M. T., Romanovsky, V., Harden, J., Shur, Y., O’Donnell, J., Schuur, E. A. G., Kanevskiy, M., and Marchenko, S.: Resilience and vulnerability of permafrost to climate change, Can. J. Forest Rese., 40, 1219–1236, https://doi.org/10.1139/X10-060, 2010. a
Juliussen, H. and Humlum, O.: Thermal regime of openwork block fields on the mountains Elgåhogna and Sølen, central-eastern Norway, Permafrost Periglac., 19, 1–18, https://doi.org/10.1002/ppp.607, 2008. a, b, c
Kääb, A., Gudmundsson, G. H., and Hoelzle, M.: Surface deformation of creeping mountain permafrost. Photogrammetric investigations on Murtèl rock glacier, Swiss Alps, in: Proceedings of the 7th International Conference on Permafrost, 23–27 June 1998, Yellowknife, Northwest Territories, Canada, edited by: Lewkowicz, A. G. and Allard, M., Centre d'Études Nordiques, Université Laval (Québec), Canada, 531–537, 1998. a, b
Kane, D. L., Hinkel, K. M., Goering, D. J., Hinzman, L. D., and Outcalt, S. I.: Non-conductive heat transfer associated with frozen soils, Global Planet. Change, 29, 275–292, https://doi.org/10.1016/S0921-8181(01)00095-9, 2001. a, b
Kaviany, M.: Principles of Heat Transfer in Porous Media, Springer New York, 2nd edn., ISBN 9781461242543, https://doi.org/10.1007/978-1-4612-4254-3, 1995. a
Kayastha, R. B., Takeuchi, Y., Nakawo, M., and Ageta, Y.: Practical prediction of ice melting beneath various thickness of debris cover on Khumbu Glacier, Nepal, using a positive degree-day factor, in: Debris-covered Glaciers: Proceedings of an International Workshop Held at the University of Washington in Seattle, Washington, USA, 13–15 September 2000, edited by: Fountain, A., Raymond, C. F., and Nakao, M., vol. 264 of IAHS Proc. N. 264, pp. 71–81, 2000. a
Keller, F. and Gubler, H.: Interaction between snow cover and high mountain permafrost: Murtèl/Corvatsch, Swiss Alps, in: Proceedings of the 6th International Conference on Permafrost, 5–9 July 1993, Beijing, China, edited by: Guodong, C., vol. 1, 332–337 pp., Lanzhou Institute of Glaciology and Geocryology, Chinese Academy of Sciences & Chinese Society of Glaciology and Geocryology, South China University of Technology Press, 332–337, https://www.permafrost.org/conference-proceedings/ (last access: 8 April 2025), 1993. a
Kellerer-Pirklbauer, A. and Kaufmann, V.: About the relationship between rock glacier velocity and climate parameters in central Austria, Aust. J. Earth Sci., 105/2, 94–112, https://ajes.at/images/AJES/archive/Band 105_2/kellerer_kaufmann_ajes_105_2.pdf (last access: 8 April 2025), 2012. a
Kipp & Zonen CGR3 manual: Manual for the Kipp & Zonen CGR 4 pyrgeometer (v1401), Tech. rep., Kipp & Zonen, Delft, 35 pp., https://www.kippzonen.com/Download/38/Manual-CGR4-Pyrgeometer (last access: 8 April 2025), 2014. a
Klein, G., Vitasse, Y., Rixen, C., Marty, C., and Rebetez, M.: Shorter snow cover duration since 1970 in the Swiss Alps due to earlier snowmelt more than to later snow onset, Clim. Change, 139, 637–649, https://doi.org/10.1007/s10584-016-1806-y, 2016. a
Kneisel, C., Hauck, C., and Vonder Mühll, D.: Permafrost below the timberline confirmed and characterized by geoelectrical resistivity measurements, Bever Valley, Eastern Swiss Alps, Permafrost Periglac., 11, 295–304, https://doi.org/10.1002/1099-1530(200012)11:4<295::AID-PPP353>3.0.CO;2-L, 2000. a
Körner, C. and Hiltbrunner, E.: Rapid advance of climatic tree limits in the Eastern Alps explained by on-site temperatures, Reg. Environ. Change, 24, 98, https://doi.org/10.1007/s10113-024-02259-8, 2024. a
Kurylyk, B. L.: Discussion of ‘A simple thaw-freeze algorithm for a multi-layered soil using the Stefan equation’ by Xie and Gough (2013), Permafrost Periglac., 26, 200–206, https://doi.org/10.1002/ppp.1834, 2015. a, b, c
Kurylyk, B. L. and Hayashi, M.: Improved Stefan equation correction factors to accommodate sensible heat storage during soil freezing or thawing, Permafrost Periglac., 27, 189–203, https://doi.org/10.1002/ppp.1865, 2016. a, b, c, d
Lebeau, M. and Konrad, J.-M.: Non-Darcy flow and thermal radiation in convective embankment modeling, Comput, Geotech,, 73, 91–99, https://doi.org/10.1016/j.compgeo.2015.11.016, 2016. a, b, c, d
Luetschg, M., Lehning, M., and Haeberli, W.: A sensitivity study of factors influencing warm/thin permafrost in the Swiss Alps, J, Glaciol,, 54, 696–704, https://doi.org/10.3189/002214308786570881, 2008. a
Marcer, M., Cicoira, A., Cusicanqui, D., Bodin, X., Echelard, T., Obregon, R., and Schoeneich, P.: Rock glaciers throughout the French Alps accelerated and destabilised since 1990 as air temperatures increased, Commun. Earth Environ., 2, 81, https://doi.org/10.1038/s43247-021-00150-6, 2021. a
Marchenko, S., Romanovsky, V., and Gorbunov, A.: Hydrologic and thermal regimes of coarse blocky materials in Tien Shan Mountains, Central Asia, in: Extended abstracts of the 10th International Conference on Permafrost, 25–29 June 2012, Salekhard (Yamal-Nenets Autonomous District), Russia, edited by: Hinkel, K. M. and Melnikov, V. P., vol. 4, 361–362 pp., Fort Dialog-Iset: Ekaterinburg, Russia, 2012. a
Marchenko, S., Jin, H., Hoelzle, M., Lentschke, J., Kasatkin, N., and Saks, T.: Thermal and hydrologic regimes of blocky materials in Tianshan Mountains, Central Asia, in: Proceedings vol. II (Extendend Abstracts) of the 12th International Conference on Permafrost, 16–20 June 2024, Whitehorse (Yukon), Canada, edited by: Beddoe, R. and Karunaratne, K., 455–456 pp., International Permafrost Association, 2024. a
Marchenko, S. S.: A model of permafrost formation and occurrences in the intracontinental mountains, Norsk Geograf. Tidsskr., 55, 230–234, https://doi.org/10.1080/00291950152746577, 2001. a, b
Matiu, M., Crespi, A., Bertoldi, G., Carmagnola, C. M., Marty, C., Morin, S., Schöner, W., Cat Berro, D., Chiogna, G., De Gregorio, L., Kotlarski, S., Majone, B., Resch, G., Terzago, S., Valt, M., Beozzo, W., Cianfarra, P., Gouttevin, I., Marcolini, G., Notarnicola, C., Petitta, M., Scherrer, S. C., Strasser, U., Winkler, M., Zebisch, M., Cicogna, A., Cremonini, R., Debernardi, A., Faletto, M., Gaddo, M., Giovannini, L., Mercalli, L., Soubeyroux, J.-M., Sušnik, A., Trenti, A., Urbani, S., and Weilguni, V.: Observed snow depth trends in the European Alps: 1971 to 2019, The Cryosphere, 15, 1343–1382, https://doi.org/10.5194/tc-15-1343-2021, 2021. a, b
Mendoza López, M., Tapia Baldis, C., Trombotto Liaudat, D., and Sileo, N.: Thermal simulations on periglacial soils of the Central Andes, Argentina, Permafrost Periglac., 34, 296–316, https://doi.org/10.1002/ppp.2189, 2023. a
Mihalcea, C., Mayer, C., Diolaiuti, G., Lambrecht, A., Smiraglia, C., and Tartari, G.: Ice ablation and meteorological conditions on the debris-covered area of Baltoro glacier, Karakoram, Pakistan, Ann. Glaciol., 43, 292–300, https://doi.org/10.3189/172756406781812104, 2006. a
Millar, C. I., Westfall, R. D., and Delany, D. L.: Thermal regimes and snowpack relations of periglacial talus slopes, Sierra Nevada, California, U.S.A., Arct. Antarct. Alp. Res., 46, 483–504, https://doi.org/10.1657/1938-4246-46.2.483, 2014. a, b, c
Millar, C. I., Westfall, R. D., Evenden, A., Holmquist, J. G., Schmidt-Gengenbach, J., Franklin, R. S., Nachlinger, J., and Delany, D. L.: Potential climatic refugia in semi-arid, temperate mountains: Plant and arthropod assemblages associated with rock glaciers, talus slopes, and their forefield wetlands, Sierra Nevada, California, USA, Quaternary Int., 387, 106–121, https://doi.org/10.1016/j.quaint.2013.11.003, 2015. a
Mittaz, C., Hoelzle, M., and Haeberli, W.: First results and interpretation of energy-flux measurements over Alpine permafrost, Ann. Glaciol., 31, 275–280, https://doi.org/10.3189/172756400781820363, 2000. a, b
Morard, S., Delaloye, R., and Lambiel, C.: Pluriannual thermal behavior of low elevation cold talus slopes in western Switzerland, Geogr. Helv., 65, 124–134, https://doi.org/10.5194/gh-65-124-2010, 2010. a, b
Morard, S., Hilbich, C., Mollaret, C., Pellet, C., and Hauck, C.: 20-year permafrost evolution documented through petrophysical joint inversion, thermal and soil moisture data, Environ. Res. Lett., 19, 074074, https://doi.org/10.1088/1748-9326/ad5571, 2024. a
Naguel, C.: Permafrostvorkommen in der Frontpartie und räumliche und zeitliche Repräsentativität von BTS-Messungen: Untersuchungen an zwei Blockgletschem im Oberengadin, Master's thesis, Geographisches Institut der Universität Zürich, 130 pp., 1998. a
Nakawo, M. and Young, G.: Field Experiments to Determine the Effect of a Debris Layer on Ablation of Glacier Ice, Ann. Glaciol., 2, 85–91, https://doi.org/10.3189/172756481794352432, 1981. a
Nakawo, M. and Young, G.: Estimate of Glacier Ablation under a Debris Layer from Surface Temperature and Meteorological Variables, J. Glaciol., 28, 29–34, https://doi.org/10.3189/S002214300001176X, 1982. a
Navarro, G., MacDonell, S., and Valois, R.: A conceptual hydrological model of semiarid Andean headwater systems in Chile, Prog. Phys. Geogr., 47, 668–686, https://doi.org/10.1177/03091333221147649, 2023. a
Nicholson, L. and Benn, D. I.: Properties of natural supraglacial debris in relation to modelling sub-debris ice ablation, Earth Surf. Process. Landf., 38, 490–501, https://doi.org/10.1002/esp.3299, 2013. a
Nield, D. A. and Bejan, A.: Convection in Porous Media, Springer, New York, 5 edn., https://doi.org/10.1007/978-3-319-49562-0, 2017. a, b
Nixon, J. F. and McRoberts, E. C.: A Study of Some Factors Affecting the Thawing of Frozen Soils, Can. Geotech. J., 10, 439–452, https://doi.org/10.1139/t73-037, 1973. a
Noetzli, J. and Pellet, C. (Eds.): PERMOS 2023. Swiss Permafrost Bulletin 2022 (Annual report No. 4 on permafrost observation in the Swiss Alps), Cryospheric Commission of the Swiss Academy of Sciences, https://doi.org/10.13093/permos-bull-2023, 2023. a, b, c
Noetzli, J., Pellet, C., and Staub, B. (Eds.): Permafrost in Switzerland 2014/2015 to 2017/2018, Glaciological Report Permafrost No. 16–19 (PERMOS Report 2019), Fribourg: Cryospheric Commission of the Swiss Academy of Sciences, https://doi.org/10.13093/permos-rep-2019-16-19, 2019. a
Oswald, M.: Luftzirkulation in der Auftauschicht des Blockgletschers Chastelets, Master's thesis, Geographisches Institut der Universität Zürich, 77 pp., 2004. a, b
Panz, M.: Analyse von Austauschprozessen in der Auftauschicht des Blockgletschers Murtèl, Corvatsch, Oberengadin, Master's thesis, Geographisches Institut der Ruhr-Universität Bochum, 141 pp., 2008. a
Petersen, E., Hock, R., Fochesatto, G. J., and Anderson, L. S.: The significance of convection in supraglacial debris revealed through novel analysis of thermistor profiles, J. Geophys. Res.-Earth Surf., 127, e2021JF006520, https://doi.org/10.1029/2021JF006520, 2022. a
Popescu, R., Onaca, A., Urdea, P., and Vespremeanu-Stroe, A.: Landform Dynamics and Evolution in Romania, chap. Spatial Distribution and Main Characteristics of Alpine Permafrost from Southern Carpathians, Romania, 117–146 pp., Springer International Publishing, Cham, ISBN 978-3-319-32589-7, https://doi.org/10.1007/978-3-319-32589-7_6, 2017a. a
Popescu, R., Vespremeanu-Stroe, A., Onaca, A., Vasile, M., Cruceru, N., and Pop, O.: Low-altitude permafrost research in an overcooled talus slope–rock glacier system in the Romanian Carpathians (Detunata Goală, Apuseni Mountains), Geomorphology, 295, 840–854, https://doi.org/10.1016/j.geomorph.2017.07.029, 2017b. a
Reato, A., Silvina Carol, E., Cottescu, A., and Alfredo Martínez, O.: Hydrological significance of rock glaciers and other periglacial landforms as sustenance of wet meadows in the Patagonian Andes, J. South Am. Earth Sci., 111, 103471, https://doi.org/10.1016/j.jsames.2021.103471, 2021. a
Renette, C., Aalstad, K., Aga, J., Zweigel, R. B., Etzelmüller, B., Lilleøren, K. S., Isaksen, K., and Westermann, S.: Simulating the effect of subsurface drainage on the thermal regime and ground ice in blocky terrain in Norway, Earth Surf. Dynam., 11, 33–50, https://doi.org/10.5194/esurf-11-33-2023, 2023. a, b, c
Rieksts, K., Hoff, I., Scibilia, E., and Côté, J.: Laboratory investigations into convective heat transfer in road construction materials, Can. Geotech. J., 57, 959–973, https://doi.org/10.1139/cgj-2018-0530, 2019. a, b
Rist, A.: Hydrothermal processes within the active layer above alpine permafrost in steep scree slopes and their influence on slope stability, PhD thesis, University of Zurich, Zürich, https://doi.org/10.5167/uzh-163579, 2007. a
Rist, A. and Phillips, M.: First results of investigations on hydrothermal processes within the active layer above alpine permafrost in steep terrain, Norsk Geogr. Tidsskr., 59, 177–183, https://doi.org/10.1080/00291950510020574, 2005. a, b, c
Rist, A., Phillips, M., and Auerswald, K.: Undercooled scree slopes covered with stunted dwarf trees in Switzerland – abiotic factors to characterize the phenomenon, in: Extended Abstracts of the 8th International Conference on Permafrost, 21–25 July 2003, Zurich, Switzerland, edited by: Haeberli, W. and Brandová, D., 135–136 pp., Swets & Zeitlinger, Lisse, Zürich, 2003. a, b
Roer, I., Haeberli, W., Avian, M., Kaufmann, V., Delaloye, R., Lambiel, C., and Kääb, A.: Observations and considerations on destabilizing active rock glaciers in the European Alps, in: Proceedings of the 9th International Conference on Permafrost, 29 June–3 July 2008, Fairbanks, Alaska, edited by: Kane, D. L. and Hinkel, K. M., 1505–1510 pp., Institute of Northern Engineering, University of Alaska, Fairbanks, Alaska, 2008. a
Rounce, D. R. and McKinney, D. C.: Debris thickness of glaciers in the Everest area (Nepal Himalaya) derived from satellite imagery using a nonlinear energy balance model, The Cryosphere, 8, 1317–1329, https://doi.org/10.5194/tc-8-1317-2014, 2014. a
Rowan, A. V., Nicholson, L. I., Quincey, D. J., Gibson, M. J., Irvine-Fynn, T. D., Watson, C. S., Wagnon, P., Rounce, D. R., Thompson, S. S., Porter, P. R., and Glasser, Neil F.: Seasonally stable temperature gradients through supraglacial debris in the Everest region of Nepal, Central Himalaya, J. Glaciol., 67, 170–181, https://doi.org/10.1017/jog.2020.100, 2021. a, b
Ryan, A. J., Pino Muñoz, D., Bernacki, M., and Delbo, M.: Full-Field Modeling of Heat Transfer in Asteroid Regolith: 1. Radiative Thermal Conductivity of Polydisperse Particulates, J. Geophys. Res.-Planets, 125, e2019JE006100, https://doi.org/10.1029/2019JE006100, 2020. a
Růžička, V., Zacharda, M., Němcová, L., Šmilauer, P., and Nekola, J. C.: Periglacial microclimate in low-altitude scree slopes supports relict biodiversity, J. Nat. History, 46, 2145–2157, https://doi.org/10.1080/00222933.2012.707248, 2012. a, b
Sakai, A., Fujita, K., and Kubota, J.: Evaporation and percolation effect on melting at debris-covered Lirung Glacier, Nepal Himalayas, 1996, B. Glaciol. Res., 21, 9–15, 2004. a
Sawada, Y., Ishikawa, M., and Ono, Y.: Thermal regime of sporadic permafrost in a block slope on Mt. Nishi-Nupukaushinupuri, Hokkaido Island, Northern Japan, Geomorphology, 52, 121–130, https://doi.org/10.1016/S0169-555X(02)00252-0, 2003. a, b
Schaffer, N. and MacDonell, S.: Brief communication: A framework to classify glaciers for water resource evaluation and management in the Southern Andes, The Cryosphere, 16, 1779–1791, https://doi.org/10.5194/tc-16-1779-2022, 2022. a, b
Schaffer, N., MacDonell, S., Réveillet, M., Yáñez, E., and Valois, R.: Rock glaciers as a water resource in a changing climate in the semiarid Chilean Andes, Reg. Environ. Change, 19, 1263–1279, https://doi.org/10.1007/s10113-018-01459-3, 2019. a
Scherler, M., Hauck, C., Hoelzle, M., and Salzmann, N.: Modeled sensitivity of two alpine permafrost sites to RCM-based climate scenarios, J. Geophys. Res.-Earth Surf., 118, 780–794, https://doi.org/10.1002/jgrf.20069, 2013. a, b, c
Scherler, M., Schneider, S., Hoelzle, M., and Hauck, C.: A two-sided approach to estimate heat transfer processes within the active layer of the Murtèl–Corvatsch rock glacier, Earth Surf. Dynam., 2, 141–154, https://doi.org/10.5194/esurf-2-141-2014, 2014. a, b, c, d, e, f, g, h, i, j
Schneider, S.: The heterogeneity of mountain permafrost – A field-based analysis of different periglacial materials, PhD thesis, University of Fribourg, Switzerland, 184 pp., 2014. a, b, c, d, e
Schneider, S., Hoelzle, M., and Hauck, C.: Influence of surface and subsurface heterogeneity on observed borehole temperatures at a mountain permafrost site in the Upper Engadine, Swiss Alps, The Cryosphere, 6, 517–531, https://doi.org/10.5194/tc-6-517-2012, 2012. a, b, c, d, e
Schneider, S., Daengeli, S., Hauck, C., and Hoelzle, M.: A spatial and temporal analysis of different periglacial materials by using geoelectrical, seismic and borehole temperature data at Murtèl–Corvatsch, Upper Engadin, Swiss Alps, Geogr. Helv., 68, 265–280, https://doi.org/10.5194/gh-68-265-2013, 2013. a, b
Schuepp, P. H.: Tansley review No. 59. Leaf boundary layers, New Phytologist, 477–507 pp., 1993. a
Singh, B. and Kaviany, M.: Effect of solid conductivity on radiative heat transfer in packed beds, Int. J. Heat Mass Tran., 37, 2579–2583, https://doi.org/10.1016/0017-9310(94)90295-x, 1994. a
Steiner, J. F., Kraaijenbrink, P. D. A., and Immerzeel, W. W.: Distributed melt on a debris-covered glacier: Field observations and melt modeling on the Lirung glacier in the Himalaya, Front. Earth Sci., 9, 1–21, https://doi.org/10.3389/feart.2021.678375, 2021. a
Stocker-Mittaz, C., Hoelzle, M., and Haeberli, W.: Modelling alpine permafrost distribution based on energy-balance data: a first step, Permafrost Periglac. Process., 13, 271–282, https://doi.org/10.1002/ppp.426, 2002. a
Stull, R. B.: Static stability–an update, B. Am. Meteorol. Soc., 72, 1521–1529, https://doi.org/10.1175/1520-0477(1991)072<1521:SSU>2.0.CO;2, 1991. a, b
Tenthorey, G. and Gerber, E.: Hydrologie du glacier rocheux de Murtèl (Grisons). Description et interprétation de traçages d'eau, in: Modèles en Géomorphologie – exemples Suisses. Session scientfique de la Société suisse de Géomorphologie. Fribourg, 22/23 juin 1990., edited by Monbaron, M. and Haeberli, W., Vol. 3 of Rapport et recherches, Institut de Géographie Fribourg, 1991. a
Tronstad, L. M., Giersch, J. J., Hotaling, S., Finn, D. S., Zeglin, L., Wilmot, O. J., and Bixby, R. J.: A unique “icy seep” aquatic habitat in the high Teton Range: Potential refuge for biological assemblages imperiled by climate change, The UW National Parks Service Research Station Annual Reports, 39, 64–72, https://doi.org/10.13001/uwnpsrc.2016.5289, 2016. a
Trüssel, M.: Vom Fuchsloch zur Schrattenhöhle (Band 4), chap. Eisiger Wind aus dem Untergrund – das Kühlhäuschen-Inventar in Obwalden, Nidwalden und Seelisberg UR, 980–984 pp., HGT Verlag, Alpnach, 2013. a
Vonder Mühll, D. S.: Drilling in Alpine permafrost, Norsk Geogr. Tidsskr., 50, 17–24, https://doi.org/10.1080/00291959608552348, 1996. a
Vonder Mühll, D. and Haeberli, W.: Thermal characteristics of the permafrost within an active rock glacier (Murtèl/Corvatsch, Grisons, Swiss Alps), J. Glaciol., 36, 151–158, https://doi.org/10.3189/S0022143000009382, 1990. a, b, c, d
Vortmeyer, D.: Wärmestrahlung in dispersen Feststoffsystemen [Heat radiation in packed solids], Chemie Ingenieur Technik, 51, 839–851, https://doi.org/10.1002/cite.330510904, 1979. a
Wagner, T., Pauritsch, M., Mayaud, C., Kellerer-Pirklbauer, A., Thalheim, F., and Winkler, G.: Controlling factors of microclimate in blocky surface layers of two nearby relict rock glaciers (Niedere Tauern Range, Austria), Geogr. Ann. A, 101, 310–333, https://doi.org/10.1080/04353676.2019.1670950, 2019. a, b
Wagner, T., Kainz, S., Helfricht, K., Fischer, A., Avian, M., Krainer, K., and Winkler, G.: Assessment of liquid and solid water storage in rock glaciers versus glacier ice in the Austrian Alps, Sci. Total Environ., 800, 149593, https://doi.org/10.1016/j.scitotenv.2021.149593, 2021. a
Wakonigg, H.: Unterkühlte Schutthalden [Undercooled talus], Arbeiten aus dem Institut für Geographie der Karl-Franzens Universität Graz, 33, 209–223, https://www.zobodat.at/pdf/Arb-Inst-Geographie-Uni-Graz_33_1996_0209-0223.pdf (last access: 8 April 2025), 1996. a, b, c, d, e
Walker, B., Holling, C. S., Carpenter, S. R., and Kinzig, A.: Resilience, adaptability and transformability in social–ecological systems, Ecol. Soc., 9, 5, http://www.ecologyandsociety.org/vol9/iss2/art5/ (last access: 8 April 2025), 2004. a
Weber, S. and Cicoira, A.: Thermal diffusivity of permafrost in the Swiss Alps determined from borehole temperature data, EGUsphere [preprint], https://doi.org/10.5194/egusphere-2024-2652, 2024. a
Wicky, J.: Air convection in coarse blocky permafrost: A numerical modelling approach to improve the understanding of the ground thermal regime, PhD thesis, University of Fribourg, Switzerland, https://doi.org/10.51363/unifr.sth.2022.006, 2022. a
Wicky, J. and Hauck, C.: Numerical modelling of convective heat transport by air flow in permafrost talus slopes, The Cryosphere, 11, 1311–1325, https://doi.org/10.5194/tc-11-1311-2017, 2017. a, b
Wicky, J. and Hauck, C.: Air convection in the active layer of rock glaciers, Front. Earth Sci., 8, 335, https://doi.org/10.3389/feart.2020.00335, 2020. a, b, c, d, e, f, g, h, i
Wicky, J., Hilbich, C., Delaloye, R., and Hauck, C.: Modeling the link between air convection and the occurrence of short‐term permafrost in a low‐altitude cold talus slope, Permafrost Periglac., 35, 202–217, https://doi.org/10.1002/ppp.2224, 2024. a
Woo, M.-K. and Xia, Z.: Effects of hydrology on the thermal conditions of the active layer: Paper presented at the 10th Northern Res. Basin Symposium (Svalbard, Norway – 28 Aug./3 Sept. 1994), Hydrol. Res. (Nordic Hydrology), 27, 129–142, https://doi.org/10.2166/nh.1996.0024, 1996. a
Yoshikawa, K., Schorghofer, N., and Klasner, F.: Permafrost and seasonal frost thermal dynamics over fifty years on tropical Maunakea volcano, Hawai‘i, Arct. Antarct. Alp. Res., 55, 2186485, https://doi.org/10.1080/15230430.2023.2186485, 2023. a
Zegers, G., Hayashi, M., and Pérez-Illanes, R.: Improved permafrost modeling in mountain environments by including air convection in a hydrological model, EGUsphere [preprint], https://doi.org/10.5194/egusphere-2024-2575, 2024. a, b, c
- Abstract
- Introduction
- Study site
- Measurements and data processing
- Parameterisations and heat flux modelling
- Measurement results
- Discussion
- Conclusions
- Appendix A: Electrical heat transfer analogy and local thermal (non-)equilibrium (LTE, LTNE)
- Appendix B: Sub-daily measurements reveal wind-forced convection
- Appendix C: Simple relations for modellers
- Appendix D: Notes on upscaling: variability in intrinsic permeability K and radiative thermal conductivity kr
- Appendix E: Seasonal patterns and drivers of air circulation
- Appendix F: Literature values for apparent thermal diffusivity κa
- Appendix G: Nomenclature
- Data availability
- Author contributions
- Competing interests
- Disclaimer
- Acknowledgements
- Financial support
- Review statement
- References