the Creative Commons Attribution 4.0 License.
the Creative Commons Attribution 4.0 License.
 | 28 Jul 2025
Late Pleistocene–Holocene denudation, uplift, and morphology evolution of the Armorican Massif (western Europe)
Oswald Malcles
Stéphane Mazzotti
Philippe Vernant
Vincent Godard
Elevated Plio-Pleistocene coastal and marine markers in stable continental regions are commonly explained by a combination of eustatic sea-level variations and large-scale geological processes (e.g., crustal or mantle dynamics). In this study, we test the role of erosion rates on the Late Pleistocene uplift and landform evolution of the Armorican Massif, western France. Denudation rates are estimated for 19 drainage basins using terrestrial cosmogenic nuclide (10Be) measurements in quartz. They range between ca. 5 and 25 m Ma−1, with a factor of 2 difference between the western highland region and the central lowland region (13±6 m Ma−1 vs. 7±4 m Ma−1). Assuming a thin elastic plate model, the lithosphere flexural isostatic response to these denudation rates produces an overall uplift rate of the Armorican Peninsula from 4–8 m Ma−1 in the central lowland region and along the coast to 8–14 m Ma−1 in the western peninsula. We show that these erosion-driven uplift rates can explain the uplifted Late Pleistocene marine terraces along the Armorican Peninsula coastline and the elevated Quaternary marine deposits in the central lowland region, without necessitating additional geodynamic processes such as regional compression or local active faults. Our results suggest that, in stable continental regions, long-term erosion should be taken into account as a driver of uplift and deformation before trying to derive global or regional geodynamic or tectonic conclusions.
- Article
(12103 KB) - Full-text XML
-
Supplement
(385 KB) - BibTeX
- EndNote


Plio-Pleistocene uplift rates ca. 10–100 m Ma−1 are observed in numerous stable continental regions, i.e., in areas unaffected by direct plate boundary processes (e.g., Australia, South Africa, northwestern Europe). Most of these uplift rates are derived from elevated coastal or alluvial landforms, such as marine terraces, planation surfaces (rasas), or river terraces, and from sedimentary records, such as raised beaches or endo-karstic infilling. The origins of these slow uplift rates are debated (e.g., Erlanger et al., 2012) and have been attributed to a large variety of geodynamic processes: global mantle dynamics (Gurnis et al., 2000) and plate tectonics (Pedoja et al., 2011), regional dynamic topography (Pedersen et al., 2016), regional lower crustal flow triggered by glaciation cycles (Westaway et al., 2002), local fault reactivation (Bonnet et al., 2000), and local volcanism (Murray-Wallace et al., 1996). Surprisingly, none of these studies consider the role of long-term erosion as a potential driver of uplift through simple isostatic adjustment.
Here, we address the relationship between long-term erosion rates, uplift rates, and landform evolution of the Armorican Massif, western France (Fig. 1), during the Late Pleistocene–Holocene epochs. This region comprises several coastal landforms and marine deposits that witness recent uplift of the whole area, including indications of spatial uplift variations that may reflect local fault reactivation (see Sect. 2). In addition to numerous uplift rate data, the Armorican Massif offers several specific advantages for testing the role of erosion in local and regional uplift: due to its geography, the impact of mass removal in the studied area is almost isolated from external mass transfer processes (erosion and sedimentation). No onshore mass transfer is possible from the neighboring regions due to the radial structure of the hydrographical network. All the eroded material is either stocked locally or exported to the sea. Offshore areas associated with long-term mass transfers are either located far from the shoreline (continental talus) or associated with low long-term deposit rates (continental plateau, see Sect. 4). This situation thus results in a low to negligible impact of offshore mass redistribution (see Sect. 4). The Armorican Massif erosion pattern can be estimated by quantifying erosion rates at a spatial scale of a few tens of kilometers owing to the relatively small watersheds while assuming homogeneous morphology, lithology, or climates, hence production rates and processes acting on the morphogenesis. Finally, its geology consists primarily of quartz-rich basement and metasediment formations, which allow estimations of denudation rates at the scale of drainage basins using terrestrial cosmogenic nuclide (10Be) measurements in quartz.
In the following, after a short description of the regional geological and geomorphological setting and evolution, we detail the sampling strategy and processing methodology to derive new denudation rates in 19 watersheds covering the Armorican Massif. These new data are then integrated within a regional western European database to construct denudation rate models for the whole Armorican Massif and neighboring areas, which then serve as inputs for models of uplift rates driven by flexural isostatic adjustment. Given the magnitudes and uncertainties in denudation rates, apparent uplift rates, and eustatic sea-level corrections, our analyses show that Pleistocene–Holocene absolute uplift rates in the Armorican Massif can be explained by the flexural isostatic response to local denudation rates (at wavelengths of 50–100 km), without the need for additional processes such as dynamic topography, lithosphere bulging, or local fault activity. These additional processes cannot be ruled out but, if present, must be significantly slower than previously proposed.
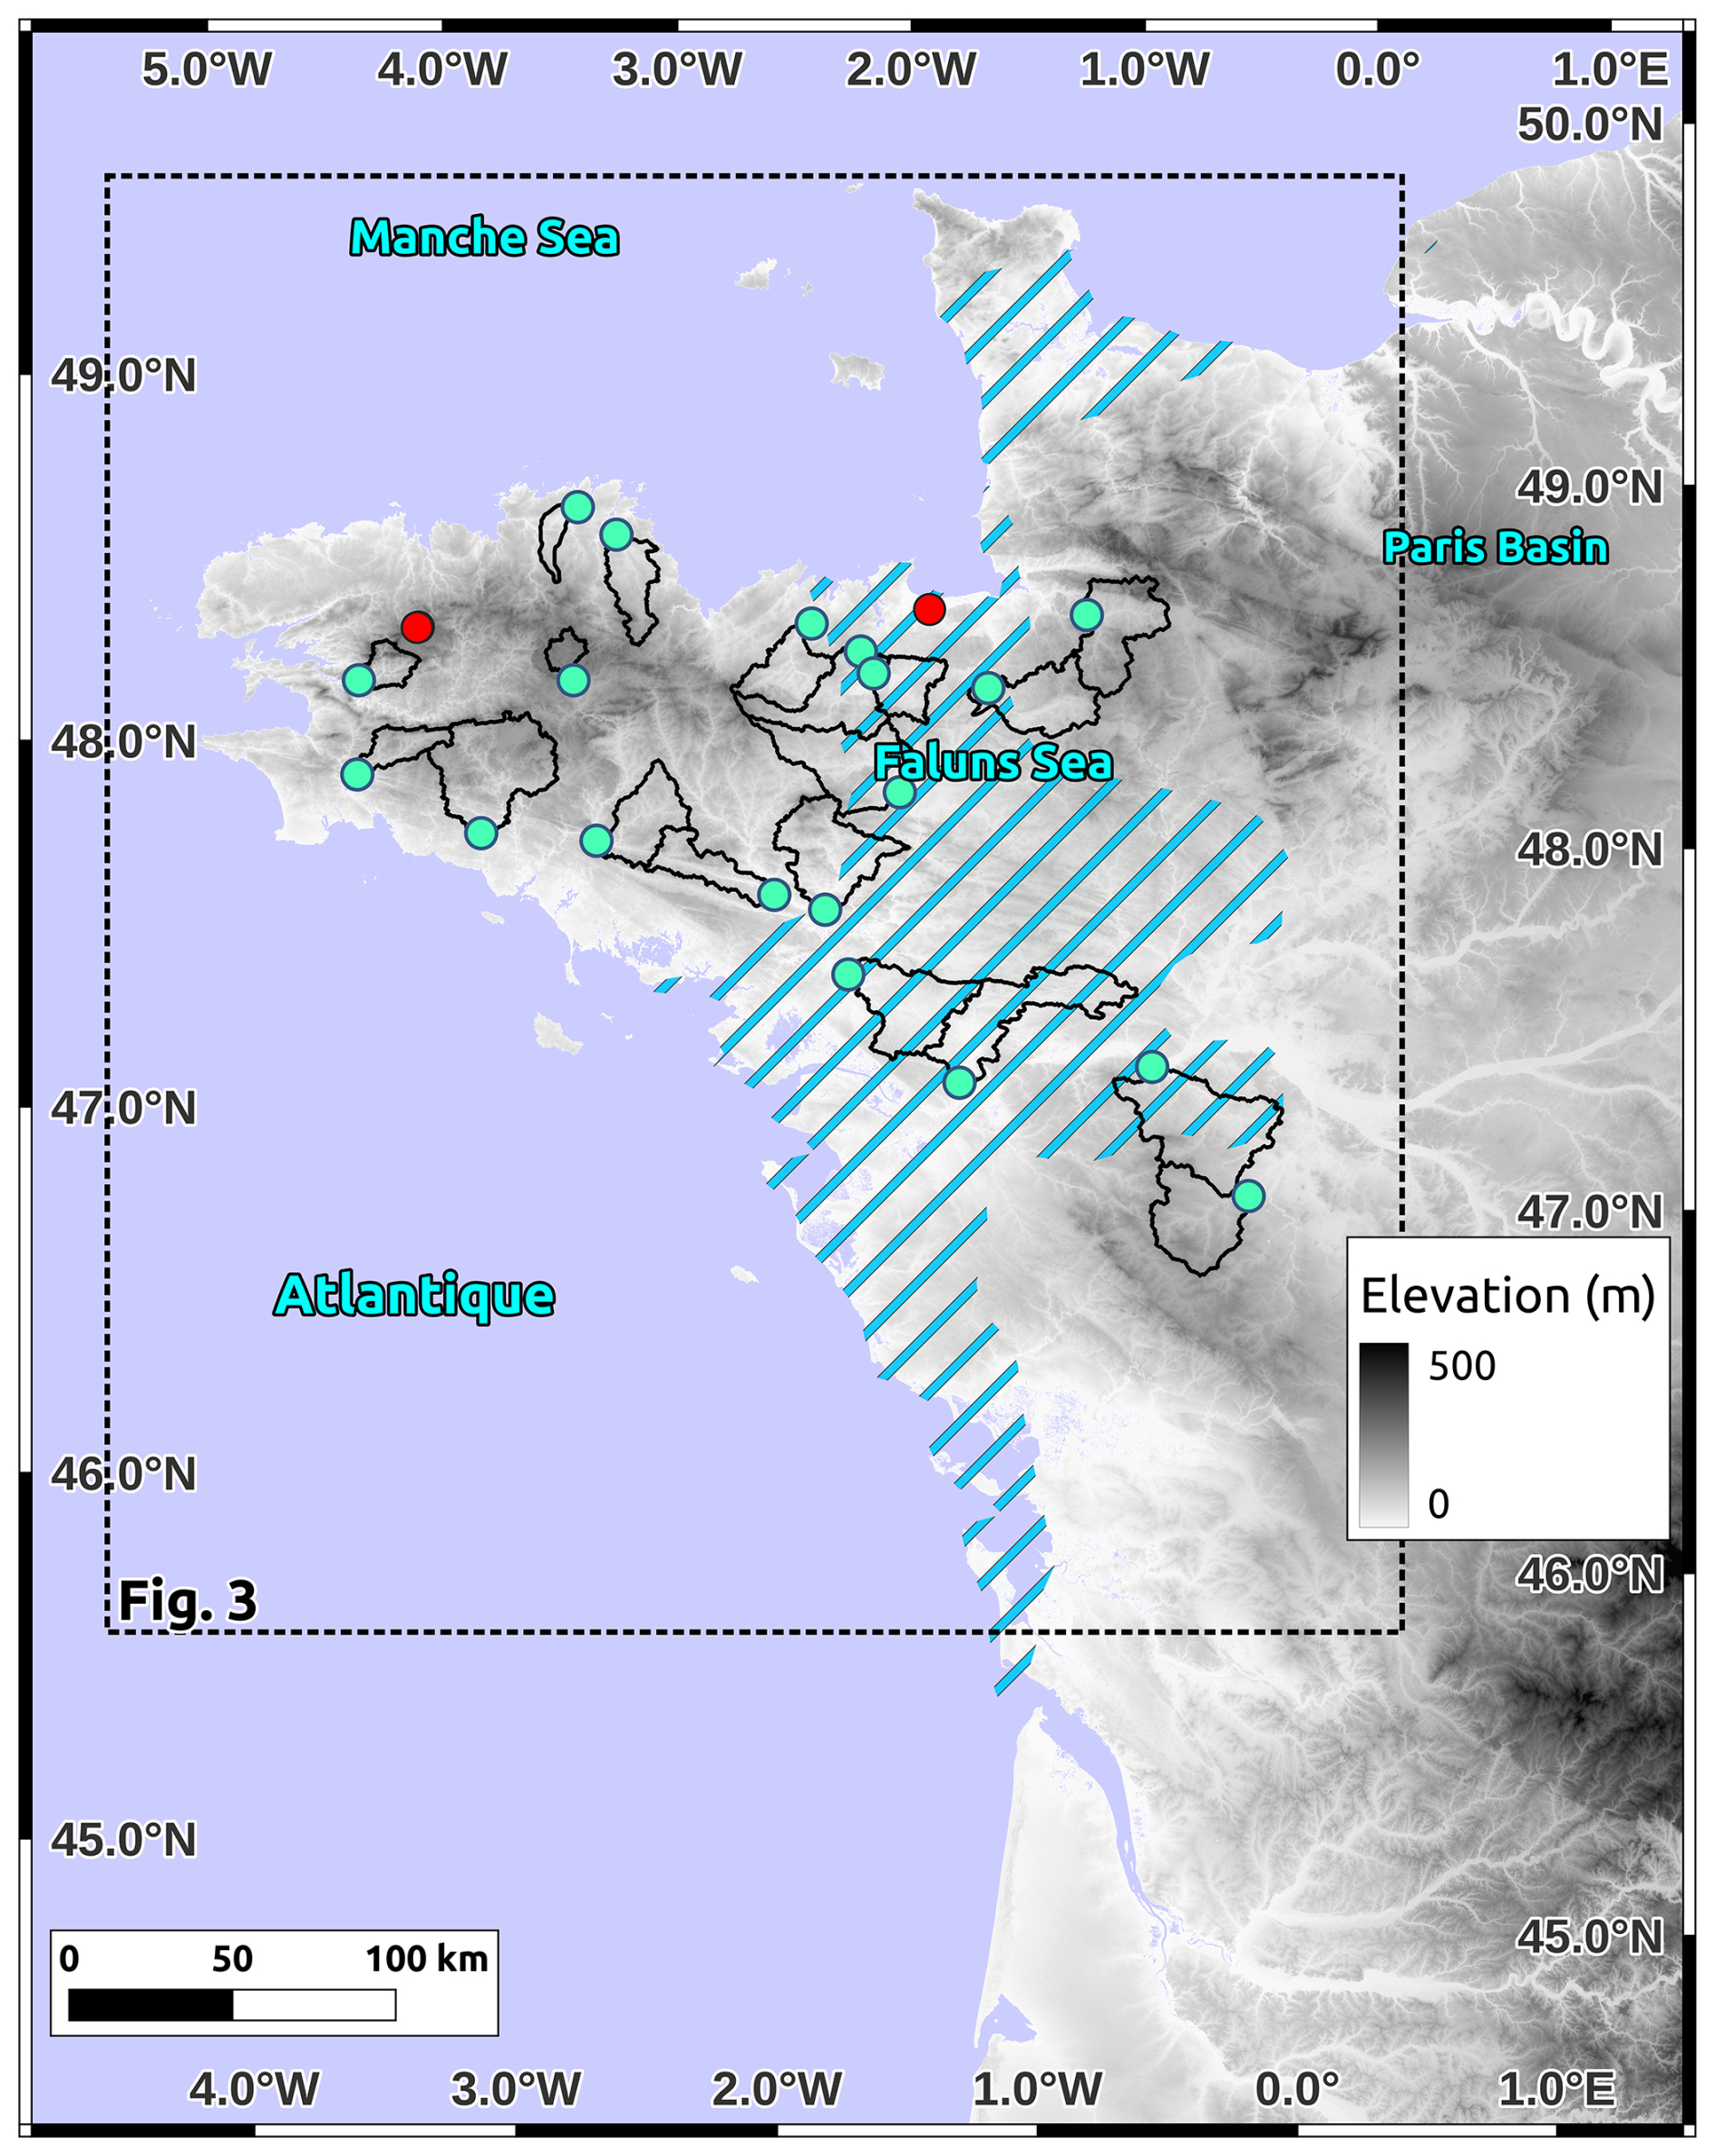
Figure 1Armorican Massif topography. DEM from JAXA-ALOS W3D30. The studied watersheds are delimited by the black polygons with the sampling sites identified by blue points. Outcrop sampling sites are marked by red points. Blue stripes: approximate onshore extent of the Mio-Pliocene “Faluns Sea” (limits modified after Néraudeau et al., 2010).
The Armorican Massif, western France, corresponds mostly to the remnant basement and structures of the Cadomian (650–540 Ma) and Variscan (370–300 Ma) orogens (Ballèvre et al., 2009). It comprises four main tectonic domains separated by major crustal-scale faults and shear zones (North Armorican and South Armorican Shear Zone systems), with other major fault systems also noticeable (e.g., Quessoy-Nort-sur-Erdre Fault, QNEF; Fig. 2). Its Meso-Cenozoic geological history is marked by minor fault reactivations associated with far-field tectonic events (e.g., North Atlantic Ocean opening, Pyrenean orogeny) up to the present-day moderate background seismicity indicating small ongoing deformation (Beucler et al., 2021). Overall, the Armorican Massif is primarily composed of Proterozoic and Paleozoic crystalline basement and metasediment formations, with limited remnants of Meso-Cenozoic sedimentary deposits. Studies of planation surfaces and stratigraphic constraints indicate at least two major phases of burial and exhumation during the mid-Mesozoic and the Late Cretaceous–early Eocene (Bessin et al., 2014). The thicknesses of the associated sedimentary covers (and thus the eroded thicknesses) are poorly constrained but were probably limited to several hundred meters, based on the remaining deposits. Several later episodes of minor marine transgressions and sediment deposits occurred during the Cenozoic, up to the most recent Red Sands and Faluns formations associated with the Faluns Sea (Fig. 1) during the Upper Miocene–Pliocene (Guillocheau et al., 2003).
These Red Sands and Faluns formations correspond to two cycles of marine transgressions/regressions during the Upper Miocene (5–8 Ma) and the Upper Pliocene (2–3 Ma), with marine flooding limited to the present-day low-elevation regions of central Brittany and Normandy (Fig. 1). While the Faluns deposits are good markers for estimations of long-term uplift rates owing to their shallow-depth open-marine fauna, the Red Sands formations provide less robust uplift markers due to their complex nature of continental sheetflood, fluvial, and estuarine deposits (Néraudeau et al., 2003; Brault et al., 2004). Their sedimentary and stratigraphic characteristics point to a system of shallow-water marine transgressions between elevated continental domains, with an overall smooth topography and large braided rivers directly connected to numerous estuaries (Guillocheau et al., 2003; Brault et al., 2004). They also indicate a relatively high clastic discharge from two continental domains on both sides of the main north–south divide (i.e., “West Armorican and North Cotentin islands” scenario). This Mio-Pliocene configuration changes during the mid-Pleistocene (ca. 1–1.5 Ma), with the disappearance of marine deposits and the formation of the present-day drainage network that incises into the Red Sands and Faluns formations. In contrast with the Mio-Pliocene system, the current (Pleistocene–Holocene) drainage network is characterized by incised valleys and jagged topography with a main east–west divide. The rivers tend to be spatially associated with tectonic scarps and structures (e.g., following the major NW–SE exhumed shear zones in southern Brittany), indicating either differential erosion along weaker inherited faults and shear zones or a control by a potential recent reactivation of these structures (Bonnet et al., 1998, 2000).
These various Cenozoic marine deposits and landforms provide detailed information on the topographic evolution of different sectors of the Armorican Massif. Hereafter, we refer to “apparent uplift” when considering the elevation of paleomarine markers relative to the present-day sea level due to a combination of eustatic sea-level variation and vertical land movement, in contrast with “uplift”, which is used to refer to vertical land motion (i.e., corrected for eustatic variations).
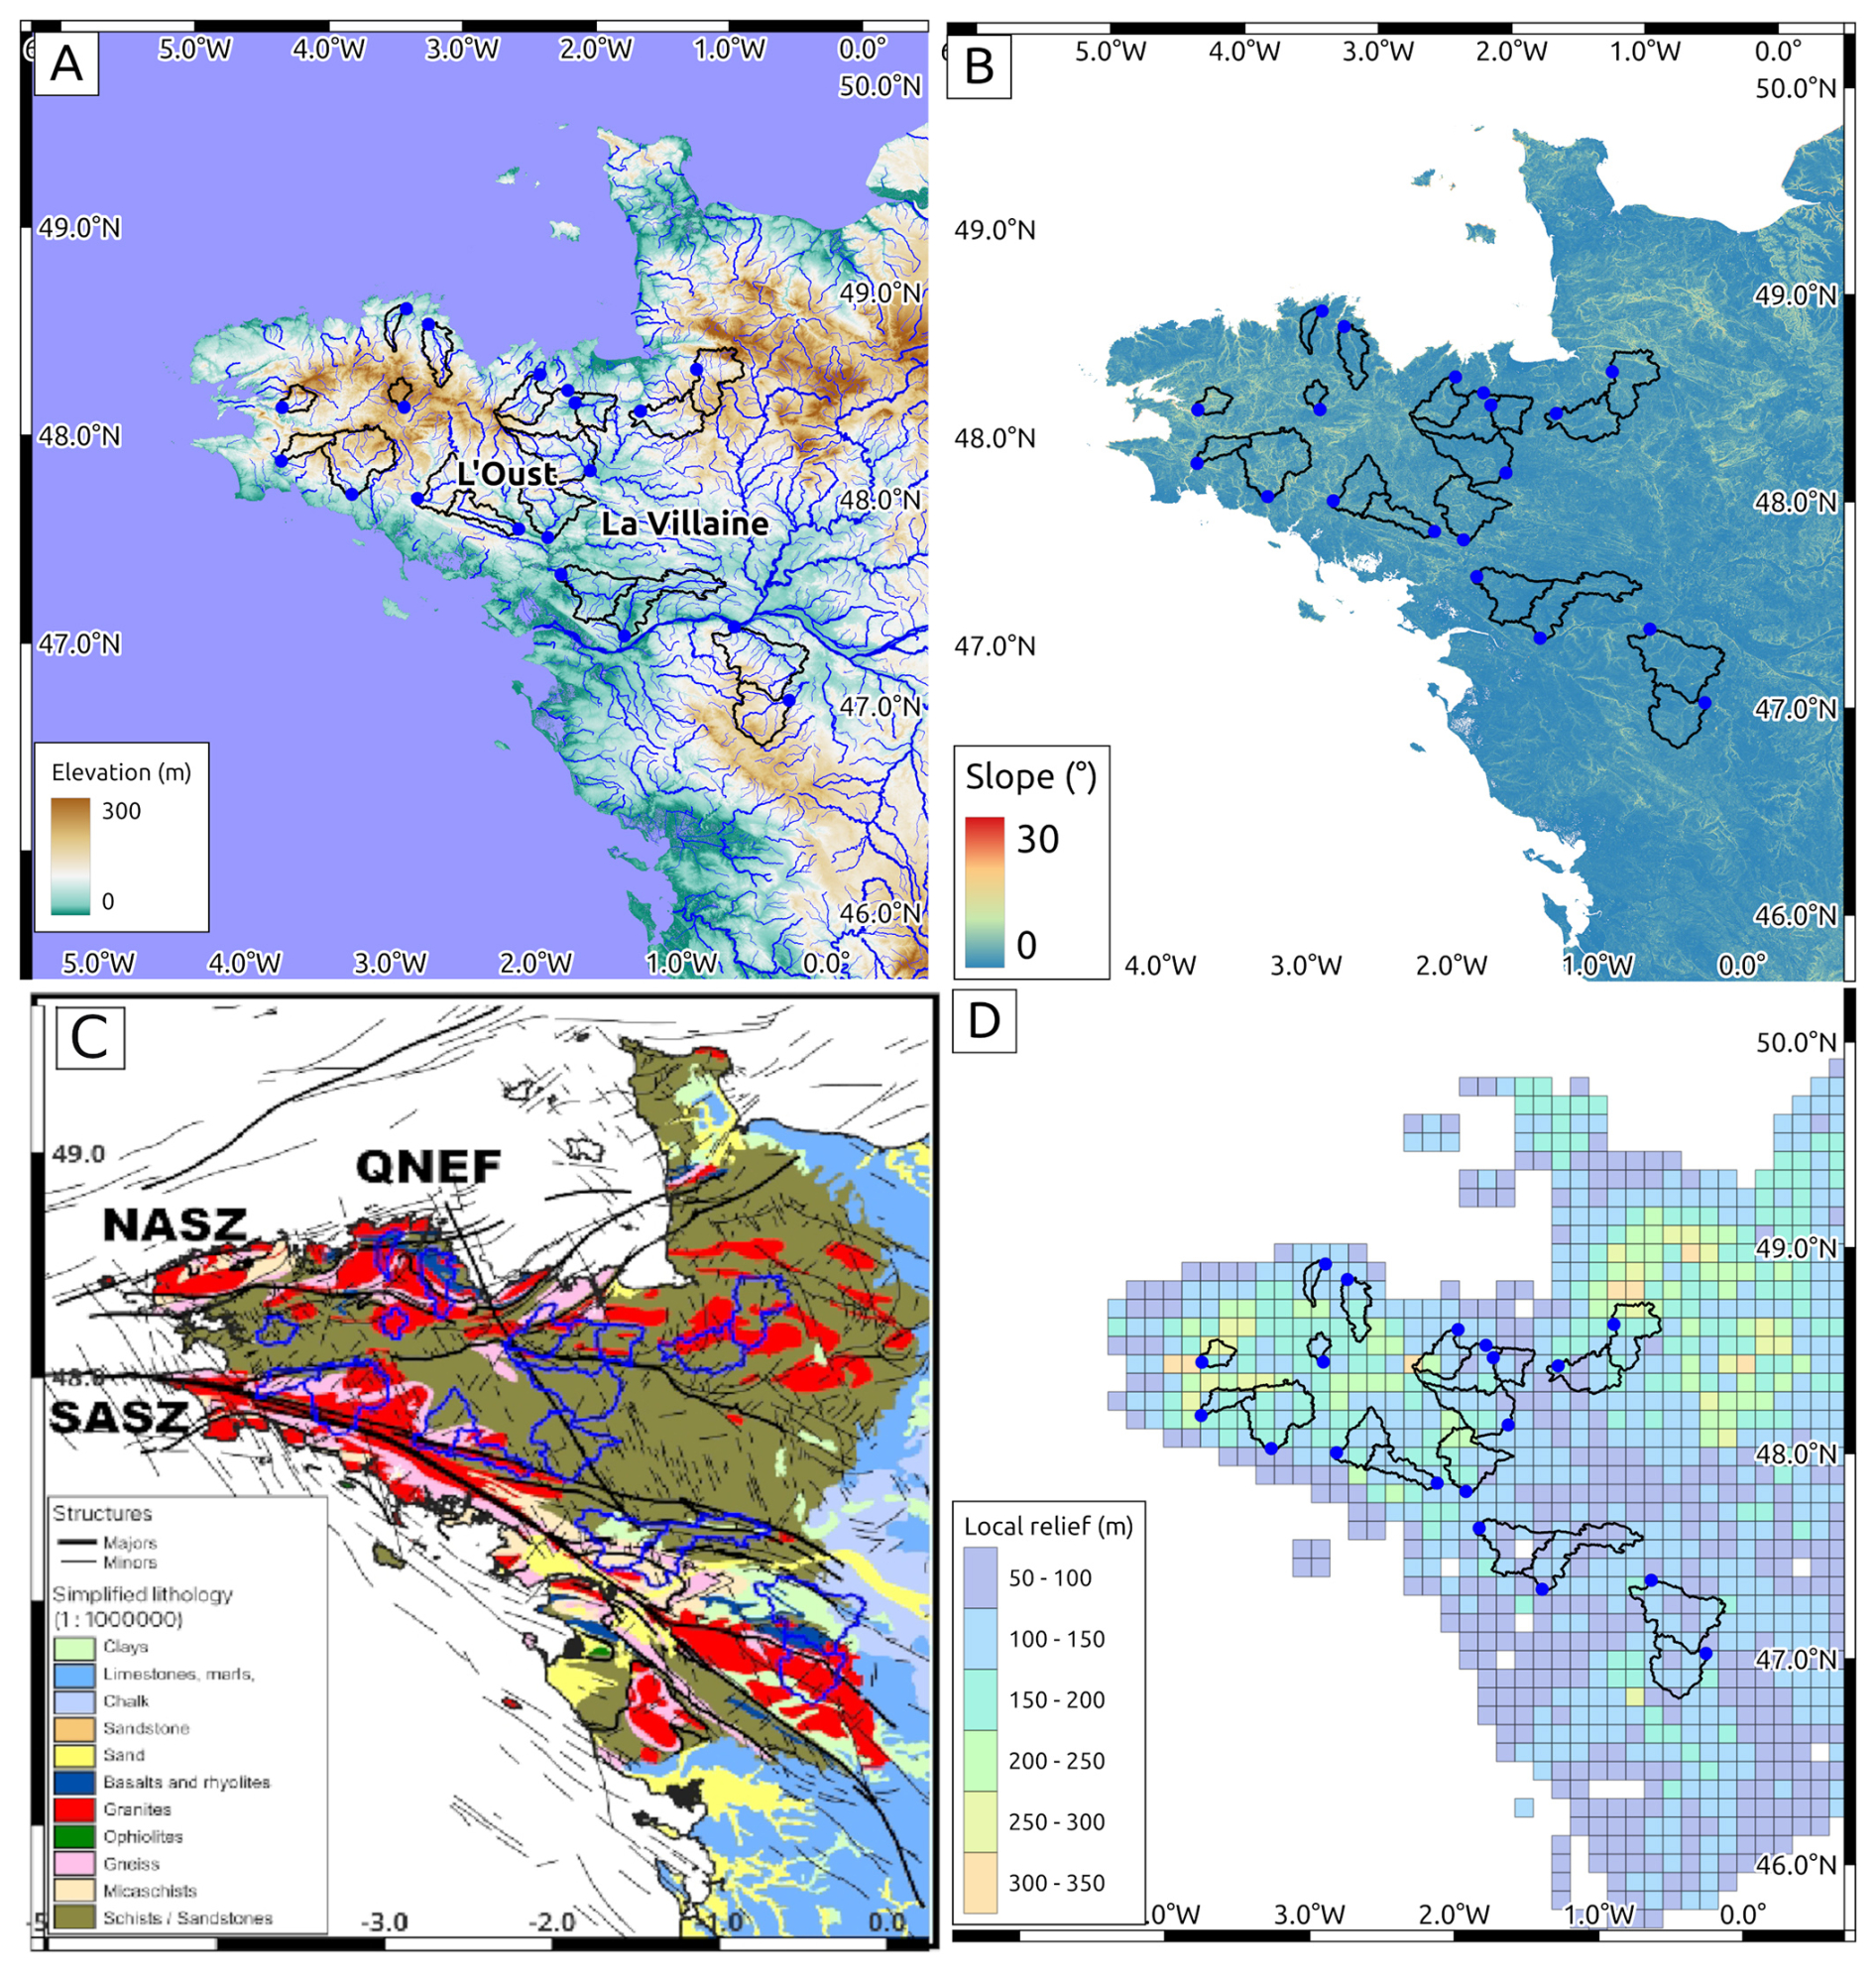
Figure 2Morphology of the Armorican Massif and neighboring areas. Studied watersheds are delimited by the black polygons with the sampling sites identified by blue points. (a) Elevation (DEM data from JAXA) and river (BD TOPO® from the IGN) networks. The basins of the Oust and Vilaine rivers are located. (b) Slope. (c) Simplified geology (BRGM; http://geoservices.brgm.fr/geologie, last access: 3 July 2025). Main tectonic structures shown in black (SASZ: South Armorican Shear Zone; NASZ: North Armorican Shear Zone; QNEF: Quessoy-Nort-sur-Erdre Fault). (d) Relief calculated for a 100 km2 grid.
The marine Mio-Pliocene Faluns are found at present-day elevations between ca. 20 to 90 m. Assuming a eustatic sea-level highstand of 60 m during the Upper Pliocene (relative to present-day sea level) and based on Electron Spin Resonance (ESR) dating, Brault et al. (2004) estimate an uplift of 12–40 m of the second maximum flooding surface situated in the central low-elevation region of the Armorican Massif. This would correspond to an average uplift rate in this area of 4–13 m Ma−1 since ca. 3 Ma. This estimation is in rough agreement with those by Bessin et al. (2017) based on a reanalysis of marine deposits and sea-level curves, which yields average Pleistocene uplift rates of 16±2 and 29±2 m Ma−1 for the low-elevation regions of Brittany and Normandy. No uplift estimations exist for the high-elevation domains.
More recent estimations can be derived from the numerous Pleistocene marine terraces and rasas (wave-cut platforms) that mark the coastline of Brittany and Normandy. Using the compilation of Pedoja et al. (2018), we estimate an average apparent uplift since MIS 5e (Last Interglacial, ca. 130 ka) of 6 m for western Brittany (31 terraces), 5 m for western Cotentin (7 terraces), and 8 m for the Channel Islands (4 terraces). These values are associated with an accuracy of 1–3 m based on the margin of error defined in Pedoja et al. (2018) and on the data standard deviations. The eustatic sea-level highstand during MIS 5e was located between ca. 3 m (Siddall et al., 2007) and ca. 7.5 m (Dutton and Lambeck, 2012) above present-day sea level, leading to an uplift between −1.5 and 3 m for western Brittany, −2.5 and 2 m for western Cotentin, and 0.5 and 5 m for the Channel Islands (negative uplift values indicate subsidence). Thus, the Late Pleistocene regional trend may correspond to a period of slow uplift rate (15–40 m Ma−1) assuming a low eustatic highstand of 3 m or a period of slow subsidence rate (−20–0 m Ma−1) for a high eustatic highstand of 7.5 m. For the penultimate interglacial (MIS 11, ca. 400 ka), Pedoja et al. (2018) estimate an average apparent uplift of 20 m of western Europe marine terraces and rasas. Combined with a eustatic sea-level highstand of 6–13 m (Muhs et al., 2012; Raymo and Mitrovica, 2012), this yields an average uplift rate of 18–35 m Ma−1 since 400 ka.
A few studies provide information on recent relative or absolute uplift rates in the Armorican Massif. Geomorphic analyses of river incisions and watershed morphologies indicate a differential uplift of ca. 30 m between western Brittany (Oust watershed) and central Brittany (Vilaine watershed) (Bonnet et al., 1998). A similar differential uplift of western Brittany relative to the central low-elevation area is deduced from numerical analyses of the topography and slope–drainage relationships (Lague et al., 2000). Assuming that this morphological difference is inherited from a differential uplift since the Pleistocene, these studies indicate a relative west/center uplift rate of ca. 10–15 m Ma−1. Bonnet et al. (1998) propose a faster relative rate of 40–60 m Ma−1 based on archeological finds in one terrace on the northern coastline of the Oust watershed (lithic industry from the Cromerian stage, 0.7–0.5 Ma; Monnier et al., 1981). The leveling data analysis of Lenôtre et al. (1999) supports the relative west vs. center uplift, albeit at a differential rate of 1000 m Ma−1 (1 mm a−1) or more. Recent results using global navigation satellite system (GNSS) data show that this differential rate is likely overestimated, due to biases inherent to old leveling data, and that present-day vertical rates in the Armorican Massif are below the resolution of geodetic data, i.e., lower than ca. 500 m Ma−1 (0.5 mm a−1) (Masson et al., 2019).
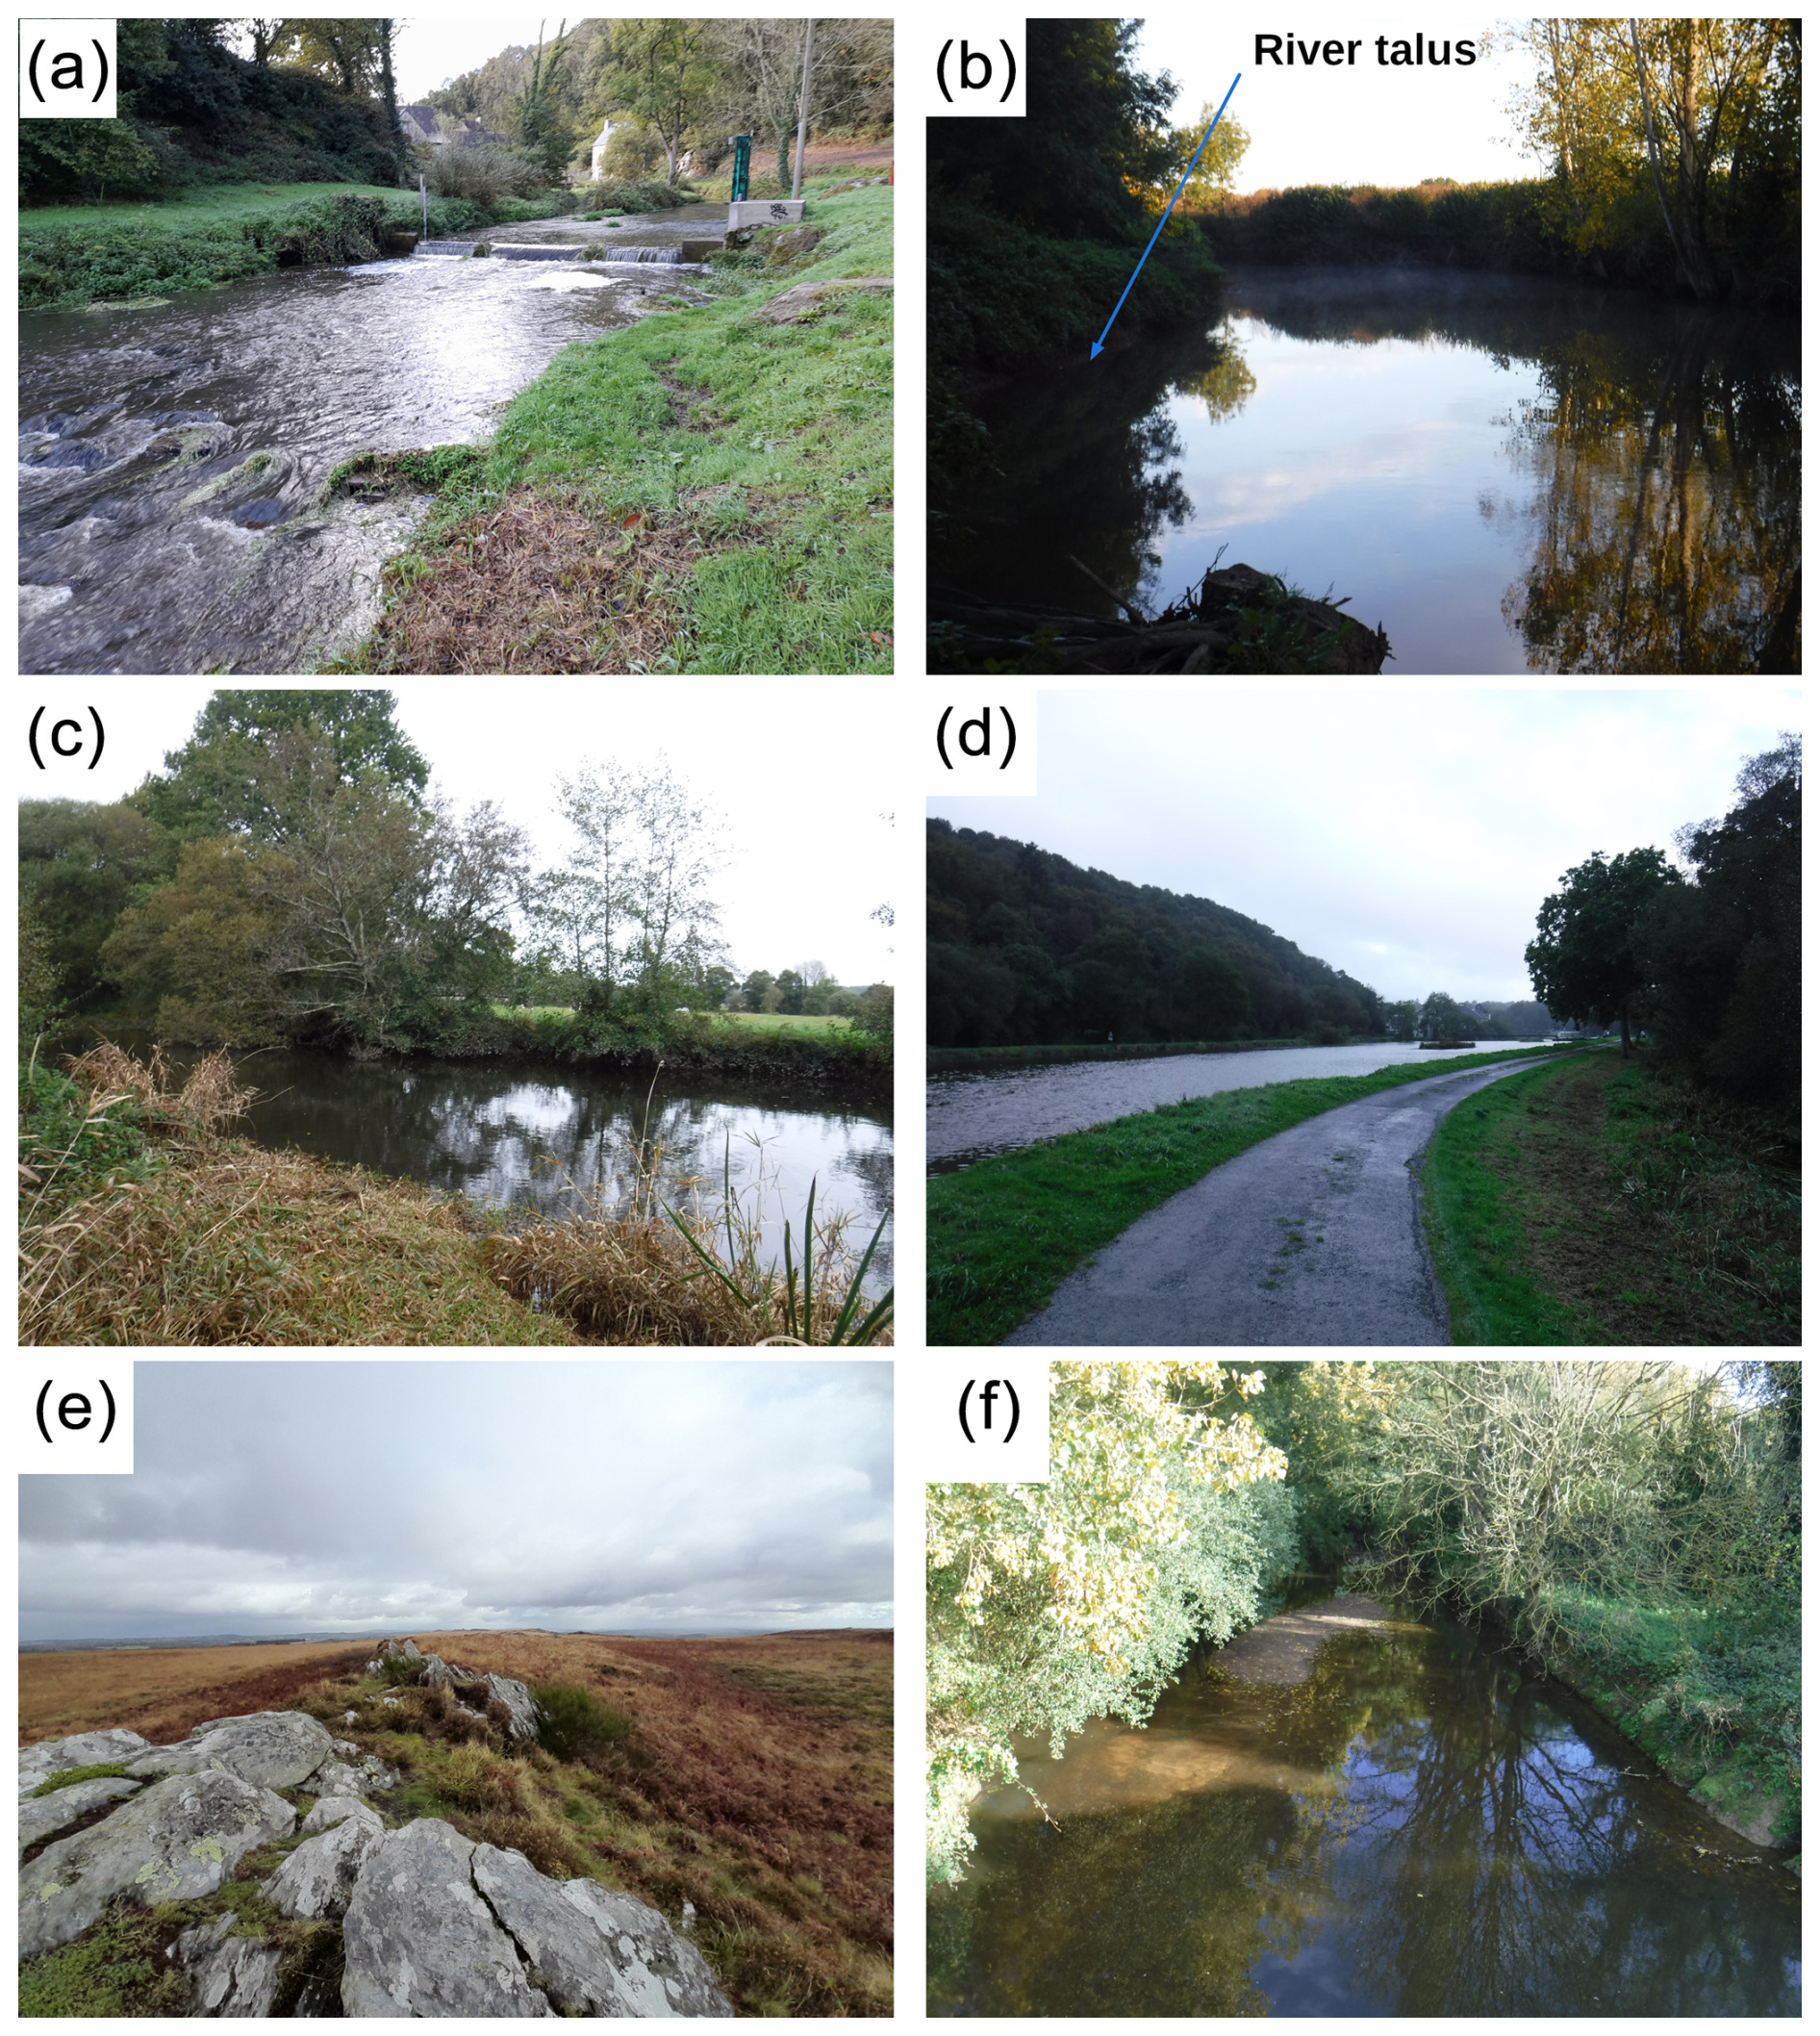
Figure 3Photographs of common landscape and sampling site types. (a) Guindy River sampling site. Example of minor anthropic disturbances. (b) Meu River sampling site. Example of surrounding flat topography with local river talus and generalized tree-covered flanks. (c) Claie River sampling site. Example of surrounding flat topography with local river talus and crop/bocage landscape. (d) Example of localized relief, southern Brittany. (e) Roc'h-Ruiz. Example of sampled outcrop in shrubland areas. (f) Arguenon sample site. Example of sampled central sandbar. Photos: O. Malcles.
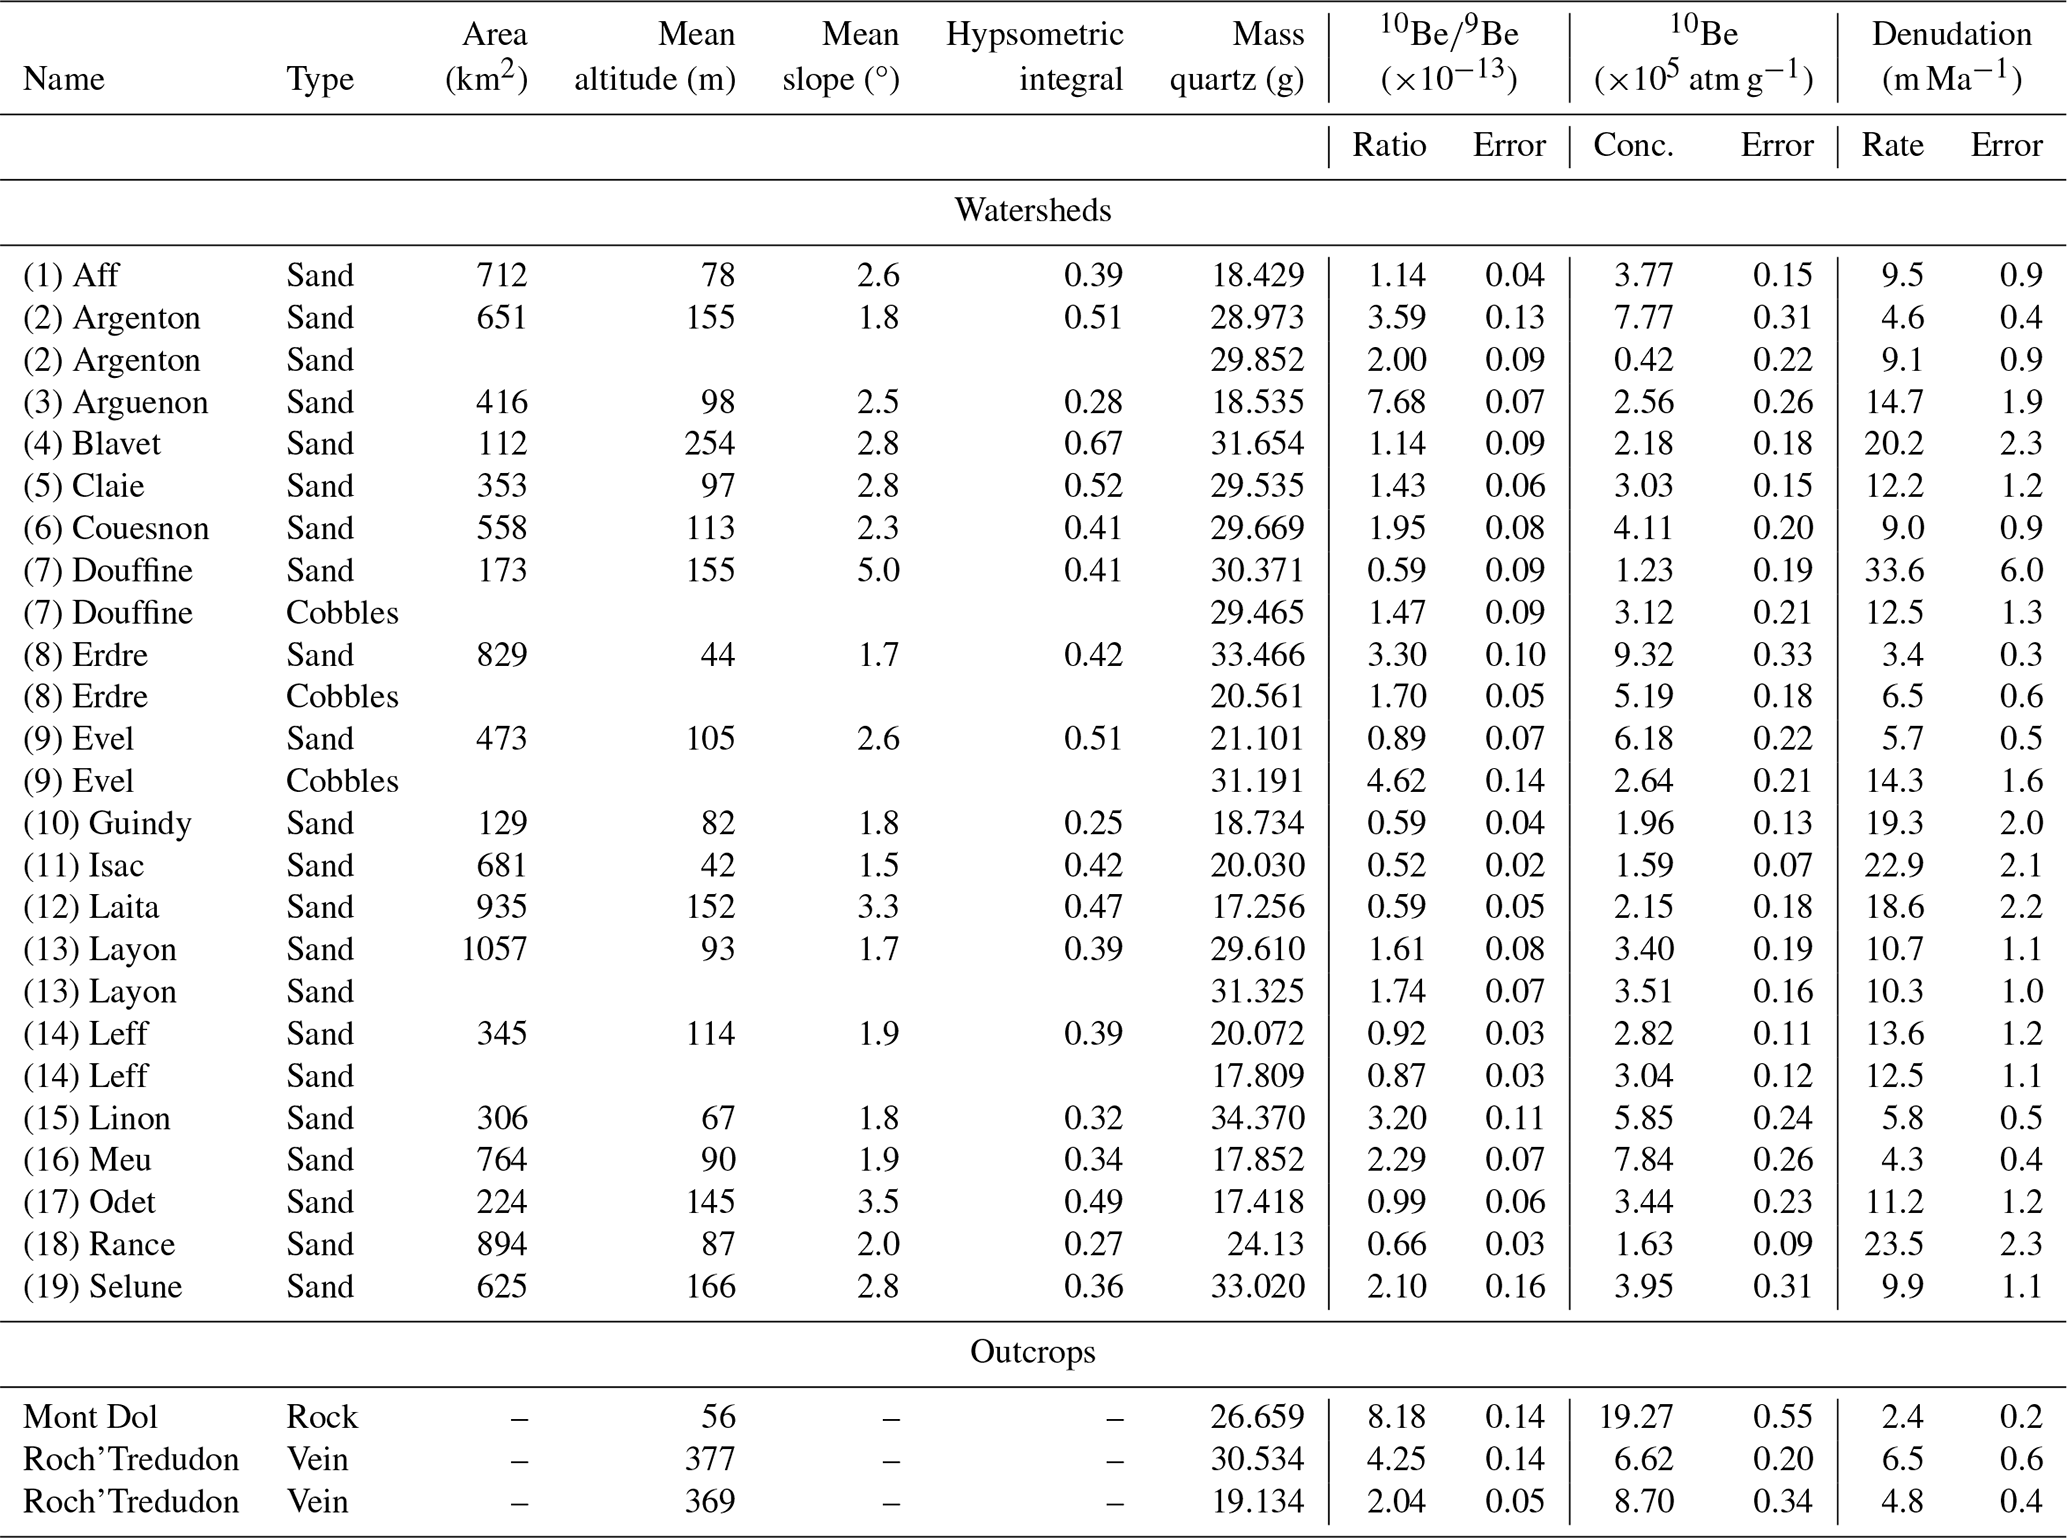
Table 1Armorican Massif TCN denudation rates and morphology parameters.
3.1 Drainage basin sampling and 10Be measurements
To estimate denudation rates at the scale of drainage basins, we sampled quartz-rich river sands (plus three gravel–cobble samples) and measured their concentrations in cosmogenic beryllium 10 (10Be), which is produced in quartz grains within the first few meters below the surface. This concentration is a function of the local surface production and denudation rates (e.g., Granger et al., 1996; Von Blanckenburg, 2005). Thus, 10Be measurements in river sands provide an estimation of the mean upstream denudation rate above the sampling point, as long as the main hypotheses of this method are respected (e.g., nearly homogeneous quartz content in the watershed). We collected samples in exposed sand pockets along riverbanks and on sandbars, avoiding accumulation spots due to anthropic structures and alterations of the river channel as much as possible. This constraint, and the fact that downstream river sections close to the coast are often filled with mud, limited our sampling to upstream sites. In total, we sampled 19 watersheds (Table 1; Figs. 1, 2, 3), three of which were sampled twice (a few meters apart) to estimate the repeatability between sand samples (Argenton, Layon, Leff). Three others were sampled with both sands and gravel–cobble sediment for comparison (Erdre, Douffine, Evel).
The samples followed a standard preparation procedure via crushing, sieving (retaining the 250–1000 µm fraction), leaching with HCl + HNO3 acids, magnetic separation, suppression of non-quartz grains using multiple H2SiF6 baths, and final removal of the atmospheric 10Be by multiple HF etchings. From the purified quartz, Be was separated following Ruszkiczay-Rüdiger et al. (2021) via multiple ion exchange chromatography and selective pH precipitation following total dissolution and the addition of 150±2 mL of known 9Be concentration solution with a concentration of 3025 µg g−1. Measured ratios were blank-corrected (mean of 5 blanks 10−15). After separation, Be was oxidized at 800 °C and mixed with Nb (volumetric ratio ) prior to measurement. The ratio was measured by accelerator mass spectrometry at the ASTER AMS national facility in Aix-en-Provence, France (Arnold et al., 2010). The ratios were calibrated using ASTER standards (Braucher et al., 2015) to derive 10Be concentrations.
10Be concentrations in three outcrop samples were measured following the same procedure. These three sites (Fig. 3e, Fig. 4b) are located at the top of locally prominent monadnocks (no topographic mask) and are therefore expected to provide lower-bound erosion rates (i.e., rates mostly controlled by local weathering processes, with little influence of longer-wavelength slope-dependent hillslope or fluvial processes). The estimated erosion rate for the outcrops is regarded as being at steady state (hence considering an “infinite exposure” and providing a maximal denudation rate), as there is no evidence in the field for other surface evolutions such as abrupt exposure or partial burial. The samples were taken using a chisel and sledgehammer, taking samples a few centimeters thick.
Drainage basin average denudation rates were derived from 10Be concentrations (see Table S1 in the Supplement) using the online CRONUS-Earth system (Balco et al., 2008) (https://hess.ess.washington.edu/, last access: 3 July 2025). We provide the denudation rate outputs using a sea-level high-latitude 10Be production rate of 4.11±0.19 at g−1 yr−1 and the Stone scaling scheme (Stone, 2000), which does not take into account variations in the Earth's magnetic field. The use of other scaling models including this time variation would lead to higher denudation rates of the order of 3 %. The CRONUS-Earth calculator comprises some simplifications and assumptions that we consider reasonable given our study context. Some are stated here, while a more comprehensive view can be found in Balco et al. (2008) or Dunai (2010). Amongst the common TCN hypotheses are a constant flux of cosmic particles from extra-solar origins or an independence of the attenuation length with elevation or latitude variations. It is also assumed that steady state was achieved for the TCN concentration in the sampled material. Application of this model is expected to hold as long as the geomorphological evolution is in agreement with a simple model where denudation rates are at steady state, providing a constant sand-like granulometry sediment supply with fast transport through the river network. No catastrophic events, such as landslides providing deep-seated material to the river network, are known, and the sediment sources are regarded as being free of complex history, including burial in river terraces. The model also uses a single muon attenuation length and assumes a constant density throughout the entire eroded column. We use the mean watershed slopes and latitudes for computation of the production rate scaling factors. Given the regional morphology (small elevation span), the homogeneous climate, and the small size of the sampled watersheds, we consider that adding more complexity in our denudation rate estimations (e.g., spatial and temporal evolution of the tree cover) is not required.
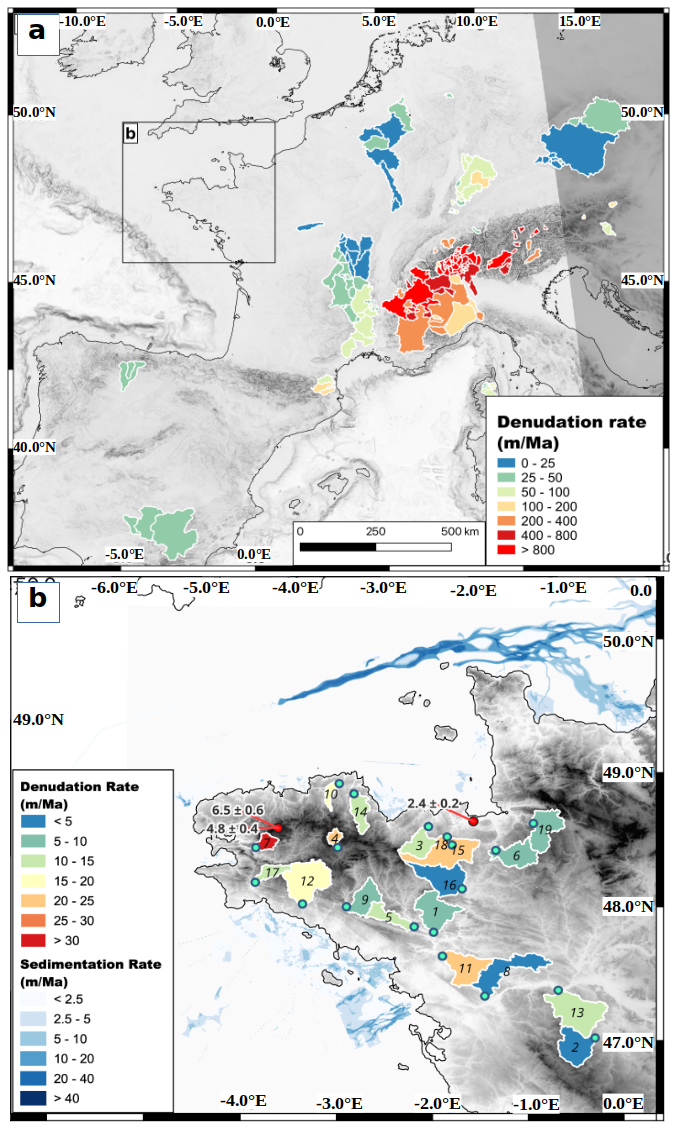
Figure 4Drainage basin data used in the denudation rate model. (a) Data from the Octopus drainage basin denudation database (Codilean et al., 2018) used for denudation rate modeling. (b) Armorican Massif data from this study. Blue dots: sampling locations of drainage basin, with basin number in each polygon (see Table 1). Red dots: sampling locations of outcrops with estimated denudation rate. Quaternary sedimentation rates around the Armorican Peninsula from Augris et al. (2013c, a, b).
3.2 Denudation rates
The denudation rates measured in the 19 drainage basins of the Armorican Massif (Table 1) vary between 3 and 34 m Ma−1, for an average rate of 13±6 m Ma −1 (mean ± standard deviation). These denudation rates are associated with an integration time between ca. 20 and 200 kyr (average 45 kyr) (Von Blanckenburg, 2005). Thus, they are representative of the Late Pleistocene period but are also sensitive to the Late Pleistocene–Holocene climate transition and its impact on denudation rates (e.g., Schaller et al., 2002). Because of the integration times, we consider that our rates are mostly indicative of Late Pleistocene average conditions, with only the fastest denudation rates (>30 m Ma−1) potentially biased by the Holocene climate warming. Individual measurement uncertainties are ca. 1–2 m Ma−1. Sand sample duplicates were collected at the same location for three rivers. Differences in denudation rates between the pairs of measurements for the Layon and Leff rivers are within their respective uncertainties. The two measurements of the Argenton site are 4.6±0.4 and 9.1±0.9 m Ma−1. This 4.5 m Ma−1 difference cannot be explained by individual measurement uncertainties, even at the 99 % confidence level. Among the possible explanations, contamination by anthropic activity and sediment of artificial low concentrations cannot be excluded. In any case, the Argenton results remain within the general low erosion rate pattern. Differences in the sand–sand comparisons have no clear explanation and may simply reflect the internal variability in the erosion and sediment transport system.
The comparison of denudation rates computed for the different granulometries (sand vs. cobbles) for the same sampling site at the Erdre, Douffine, and Evel yields larger differences of −3.1, 21.1, and −8.6 m Ma−1, the largest difference being associated with a sand denudation rate with a large uncertainty (Douffine, σ=5 m Ma−1). This grain-size effect has been studied systematically in other places (e.g., Carretier et al., 2009; van Dongen et al., 2019) and is not the primary focus of our study. Given the relatively small erosion rate difference and mostly because of the small size of the dataset (n=3) and no systematic in our results, we do not explore these questions further in this article. This also justifies using large-scale databases to filter out such variability when deriving erosion laws (see Sect. 4.1). Hereafter, the denudation rate used for sites with sand–sand or sand–coarser samples is the average of both measurements.
The three outcropping bedrock sites show an average erosion rate of 4.6±1.6 m Ma−1, roughly one-third of the average denudation rate measured in the watersheds. This low value agrees with the reported lower erosion rates for ridges and residual reliefs compared to the erosion rate of the watershed where they are located (e.g., Bierman and Portenga, 2011; Dirks et al., 2016) and provides a lower bound for the local long-term erosion rate.
In order to assess the amplitudes and spatial variations in uplift rates due isostatic response to surface unloading and loading processes, we construct a set of regional models of erosion and sedimentation rates that cover the whole Armorican Massif and neighboring areas up to a few hundred kilometers.
4.1 Denudation rate models
Denudation rates at the watershed scale (over 100 km2) are controlled by a combination of the drainage basin morphology (e.g., slope, curvature), its lithology (e.g., soil cover, bedrock nature), its hydrology and dynamics (e.g., runoff, drainage migration), and its local climate (e.g., temperature, precipitation). Several global studies have attempted to define relationships between measured denudation rates and various combinations of statistically predictive parameters (Harrison, 2000; Summerfield and Hulton, 1994; Von Blanckenburg, 2005; Portenga and Bierman, 2011; Harel et al., 2016; Codilean et al., 2018). While their application domains and their results vary, these studies all point out that any single parameters or multi-parameter combinations do not predict denudation rates better than within a factor of roughly 2 or 3. Many studies also suggest that the mean basin slope (or an equivalent proxy), which is very easy to compute from a DEM, is often regarded as the most powerful explanatory parameter even if other geometrical parameters such as the ridge curvatures, which are more sensitive to the DEM resolution, can also be used successfully (Hurst et al., 2012). However, the linear relationship between denudation rates and mean slopes breaks down for slope values above 25–30° due to the nonlinearity of the sediment flux–slope relationship when slopes get closer to stability threshold (Binnie et al., 2007; Montgomery and Brandon, 2002).
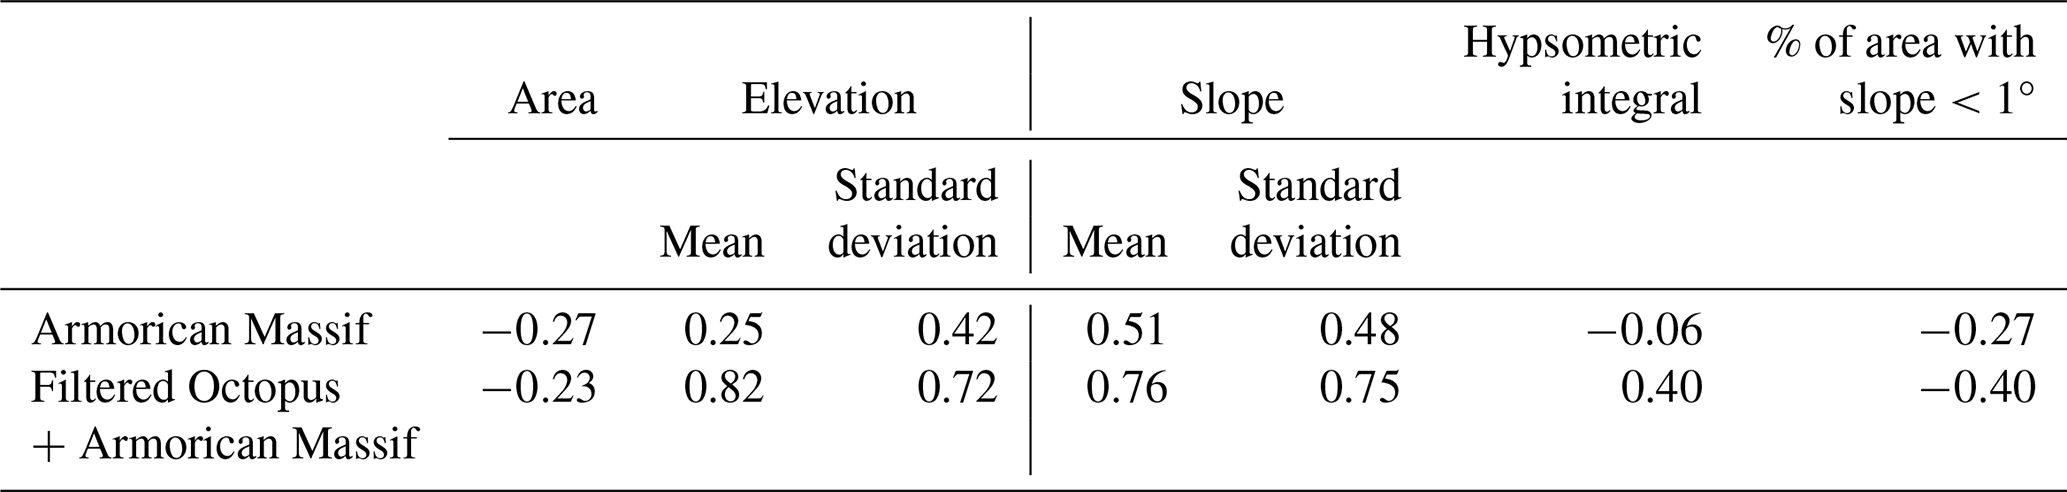
In order to build our regional denudation rate models, we analyze denudation rate data for drainage basins from the Octopus database (Codilean et al., 2018) over the non-tectonic areas of western Europe (Fig. 4a). This database is further filtered to exclude data considered not representative of our study's spatial and temporal scales: we exclude denudation rates higher than 1500 m Ma−1 (integration times smaller than a few hundred years), those associated with watershed areas larger than 30 000 km2 (integration surface too large for regional modeling), and those associated with areas smaller than 100 km2 (integration surface too sensitive to local transient processes). The final dataset comprises 220 denudation rates and morphology parameters, whose correlation is indicated in Table 2. The mean basin slopes and mean basin elevations show the highest correlations with denudation rates, in agreement with global studies. For the Armorican Massif data alone, the correlations are significantly lower, especially for the mean elevation, due to the low spread of denudation rates and morphology parameters.
Table 2Pearson coefficient of correlations between denudation rate and basin morphological parameters.
Our regionally continuous erosion models are built using the mean slope parameter on a rectangular 10×10 km grid (roughly the minimal area of our Octopus + Armorican Massif database). We do not attempt to fit a process-based relationship for the prediction of erosion; rather, we derive an empirical relationship to produce a continuous erosion map from our isolated observations. The relationship between mean slope (s in °) and denudation rate (d in m Ma−1) is based on an exponential function in order to account for the nonlinearity for slope–denudation relation (Fig. 5). The best-fit function (d=12.3 exp(0.142 s)) is associated with a root-mean-square (RMS) misfit of 22 m Ma−1, strongly controlled by the high denudation rate values (Fig. 5). For the Armorican Massif dataset alone (s<5°), it yields a much smaller RMS misfit of 2 m Ma−1. Because this function yields results that are slightly too high in the very low-slope area, with a predicted erosion rate for a null slope of 12.3 m Ma−1, we add a corrective term (−7.7 m Ma−1) to constrain the intercept to the average value obtained from the outcrops (regarded as a good proxy for the minimal denudation rate).
In order to account for the variability in denudation rates for a given slope value, we also estimate two upper- and lower-bound functions that comprise 90 % of the data (dmax = 41 exp(0.153 s) and dmin = 3 exp(0.140 s)). These two functions are adjusted manually to each exclude 5 % of the data over the whole range of denudation rates (Fig. 5). These two boundary functions are corrected for the intercept by using the lower (−2.4 m Ma−1) and higher (−6.5 m Ma−1) denudation obtained from the outcrops. Adding this corrective term leads to a decrease in the root-mean-square error (RMSE) of the Brittany data (from 7.24 to 6.64 m Ma−1) but an increased RMSE for all the data from 331.2 to 332.6 m Ma−1.
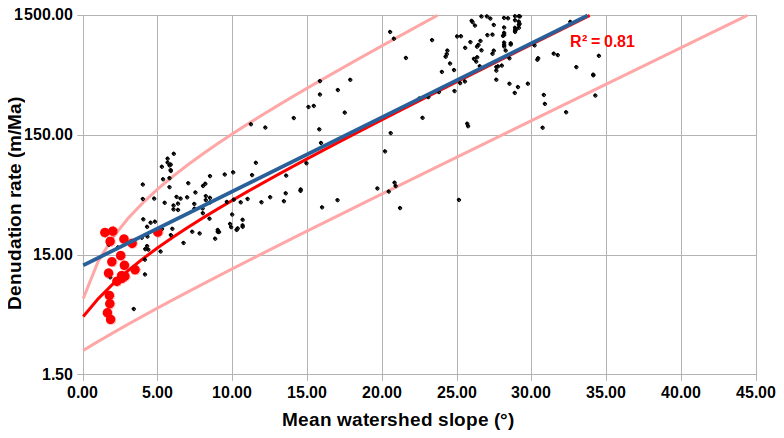
Figure 5Model of denudation rates (m Ma−1) vs. mean basin slopes (°). Red and black dots are the data for the Brittany area (this study) and from the Octopus database, respectively. The best-fit exponential function is in blue. The final, upper, and lower models are in red. The uncertainties of individual values are not represented but are typically of the order of 10 %.
We use these slope–denudation functions to define two denudation rate models (Fig. 6):
-
A mean model based on the best-fit function for all grid cells. Its denudation rates are strongly correlated with the topography and altitude on a regional scale (ca. 100 km), with relatively high rates ca. 15–25 m Ma−1 in the high-altitude zones of western Brittany and northeastern Brittany–southern Cotentin and the lowest rates ca. 5–15 m Ma−1 in the low-altitude central region.
-
A random model in which each grid cell is associated with a denudation rate randomly selected from the lower-bound, best-fit, or upper-bound function. This alternative model will be used to test the sensibility and potential biases of the predicted uplift rates (see Sect. 5). This model results in an average denudation rate slightly larger than that of the best model by a factor of 1.1 due to the asymmetry of the upper- and lower-bound functions relative to the best-fit one. In order to have the same total effect, we normalize the random model by a factor of 1.1. The random model is not correlated with topography and comprises areas of concentrations of high (ca. 50 m Ma−1) and low (ca. 5 m Ma−1) denudation rates over distances of 30–50 km interspersed between a smaller-wavelength random distribution (ca. 10 km, about the grid node spacing).
The studied area is also partly associated with non-quartz-bearing rocks, especially in the eastern part of the region (the Paris Basin, Fig. 2c). This area is mainly composed of carbonates where the main erosional process is dissolution (Roy et al., 1999). This process being mostly located in the upper few meters (epikarst), the slope-based relationship cannot be applied. Thus, for the Paris Basin and non-quartz-bearing areas, we use mean regional values with a best estimation and associated upper and lower values of 18, 25, and 10 m Ma−1, respectively (Roy et al., 1999; Laignel et al., 2006). We point out that this leads to artificially homogeneous erosion rates over the carbonaceous region, which is not representative of the true spatialization of erosion but is mostly used as a proxy to circumvent possible boundary effects (see Sect. 5.1).
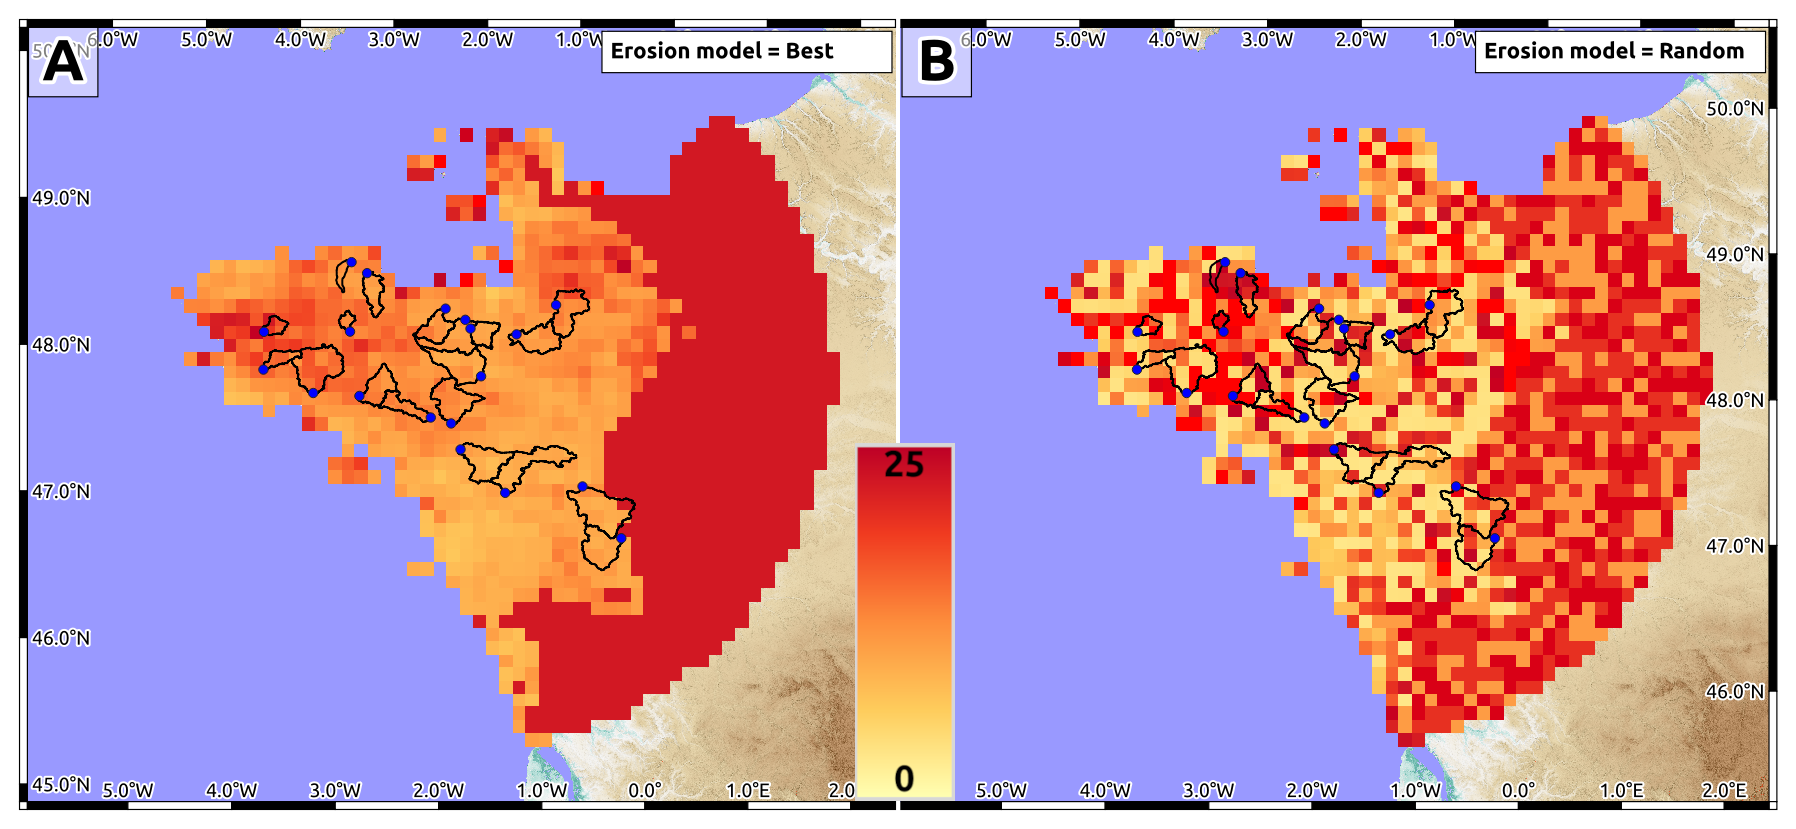
Figure 6Best-fit and random denudation rate models. Denudation rates modeled on 10×10 km rectangular grid using the best-fit (a) and random (b) prediction models (see Sect. 4.1). Sampled drainage basins and sampling locations are shown by the black outlines and blue dots.
4.2 Sedimentation rates
The Pleistocene–Holocene offshore sedimentation around the Armorican Massif is characterized by two main phases: (1) near-field sedimentation along the present-day coastline during the sea-level highstands (interglacial periods) and (2) far-field sedimentation on the continental slope and rise during the sea-level lowstands (glacial periods). The first phase corresponds to limited terrigenous sedimentation on the continental shelf, primarily at the outlet of the local rivers. Sediment types and thicknesses have been mapped using marine geophysical and coring surveys (Augris et al., 2013a, b, c), indicating a Quaternary cover of a few meters up to a few tens of meters in some very localized pockets at the main river mouths (Fig. 4). The English Channel (La Manche) is a clear exception to this general pattern, with Quaternary sediment thicknesses up to ca. 50 m localized in the channel of the paleo-Manche river. These deposits are not dated but are assumed to be the accumulation of Quaternary highstand sedimentation owing to their geological and geophysical signature (Laura Simplet, personal communication, 5 October 2022). These 1–5 m sediment thicknesses correspond to an average sedimentation rate of ca. 0.5–2.5 m Ma−1 over the last 2.5 Ma, with peaks up to 10–20 m Ma−1 in the localized high-sedimentation zones. These sedimentation rates, representing minimum values based on their Quaternary deposition timing, are too low (1 order of magnitude smaller than land denudation rates) and too localized to produce significant effects on land (subsidence rates of 0–2 m Ma−1, Fig. 7). However, constraints on their deposition timing and sequence are limited, and these sedimentation zones could be associated with more recent highstands and thus with faster sedimentation rates. This remains a source of uncertainty in our models, especially for uplift rates along the coast near high-sedimentation areas (Fig. 4). The second phase of sedimentation corresponds to large deposits on the continental slope and rise and in the oceanic basin during the Pleistocene lowstands. These large turbidite deposits correspond to the combined discharge of the main northwestern European rivers through the “River Manche” during the glaciation periods (Toucanne et al., 2009, 2010). The average sedimentation rates may reach a few tens of meters per million years (m Ma−1) at distances of 150–250 km from the Armorican Peninsula.
5.1 Methods and limitations
The mechanical response of the lithosphere to surface mass redistribution (erosion or sedimentation) can be modeled with different assumptions, depending primarily on the timescale. For short pulses, the response can be assumed to follow that of a semi-infinite elastic body (e.g., Steer et al., 2014). At the other end of the spectrum, standard Airy or Pratt isostatic response can be considered over very long timescales of tens of millions of years (Haxby and Turcotte, 1976). For timescales of thousands of years to millions of years, the response to erosion and sedimentation is commonly modeled using a thin elastic plate overlying a low-viscosity fluid (Champagnac et al., 2007; Stephenson and Lambeck, 1985) or using more complex elasto-viscoplastic rheologies (Vernant et al., 2013; Mazzotti et al., 2023). For domains with standard or low continental geotherm or strong rheology, the response of an elasto-viscoplastic lithosphere is close to that of an elastic plate, whereas it may differ significantly in domains with high geotherm or weak rheology (Mazzotti et al., 2023). Here we model the vertical deformation due to Late Pleistocene–Holocene erosion and sedimentation rates following the common assumption of a thin elastic plate, representing the flexural rigidity of the lithosphere. We use two approaches under this assumption, the first following a 2D formalism to study the effect of onshore erosion rates and the second based on a simpler 1D approach to test the impact of offshore sedimentation rates.
The response to erosion rates is computed using gFlex (Wickert, 2016) using the SAS scheme and “NoOutsideLoads” boundary conditions to produce maps of vertical velocities for our two denudation rate models coupled with a range of elastic plate thicknesses derived from rheology and gravity–topography coherence analyses over western Europe (Tesauro et al., 2009; Kaban et al., 2018). For the Armorican Massif and neighboring regions, these studies indicate elastic plate thicknesses varying between ca. 15–20 km and ca. 35–40 km. Lateral variations are poorly constrained and show either an eastward increase (Kaban et al., 2018) or a small decrease (Tesauro et al., 2009). Thus, we test three cases of uniform elastic thicknesses of 15, 25, and 35 km to cover the observed range. Additional model parameters include the elastic plate rigidity (10 GPa), the Poisson ratio (0.25), and the crust and mantle densities (2700 and 3200 kg m−3, respectively).
In order to determine the spatial extent of the area where erosion and sedimentation rates are required, we test several models with no erosion in the study area and 25 m Ma−1 of erosion in the far field (Fig. 7a), combined with a uniform elastic thickness of 35 km, corresponding to the broadest wavelength. These tests allow us to define the areas where a loading/unloading of 25 m Ma−1 (highest values in our models) results in a vertical velocity of 1 m Ma−1 or less in our study area (Fig. 7b) and which can thus be not considered in this study. The modeling code gFlex only considers the finite response of the elastic plate to a finite surface load (i.e., not a loading rate). In order to estimate uplift rates due to erosion rates, we simply assume that the flexural response to a loading rate is equivalent to that of the rate integrated over its reference time (i.e., the uplift rate in meters per million years (m Ma−1) due to 10 m Ma−1 erosion rate is equivalent to the uplift in meters due to 10 m erosion). If the mantle viscosity were to be accounted for, the two solutions would diverge if the flexure associated with the most recent erosion was not fully reached due to the mantle viscous response. We regard this effect as the upper-mantle relaxation time on the order of 104 a, leading to less than 1 % error in our modeling.
The sedimentation impact is tested using the 1D solution for an infinite elastic plate subjected to a punctual load (Turcotte and Schubert, 2014), using a plate thickness of 25 km associated with three sedimentation profiles, each representative of given sedimentation patterns and periods: (1) a coastal sedimentation rate of 20 m Ma−1 extending 10 km offshore from the coast, as an estimation of the maximum current sedimentation; (2) a continental shelf sedimentation rate of 2 m Ma−1, from the coast to 40 km offshore, representative of the mean Quaternary highstand sedimentation; and (3) a continental slope sedimentation rate of 30 m Ma−1 located 170 to 270 km offshore, representative of the Quaternary lowstand sedimentation. These sedimentation models are compared with an onshore erosion rate of 15 m Ma−1 extending 125 km from the coast (see Sect. 5.2).
A primary assumption of both 1D and 2D models is that erosion and sedimentation rates are constant through time, thus generating an elastic (time-independent) response of the lithosphere. This simplification does not allow us to take into account temporal variations in erosion or sedimentation on timescales of 103–104 years, such as those associated with climate changes during glacial–interglacial transitions. These transient effects would generate a response similar to that of classical postglacial rebound processes, mainly depending on the upper-mantle effective viscosity structure (e.g., Peltier, 2022). However, both the data and modeling framework are lacking at this stage to integrate these types of variations in our study.
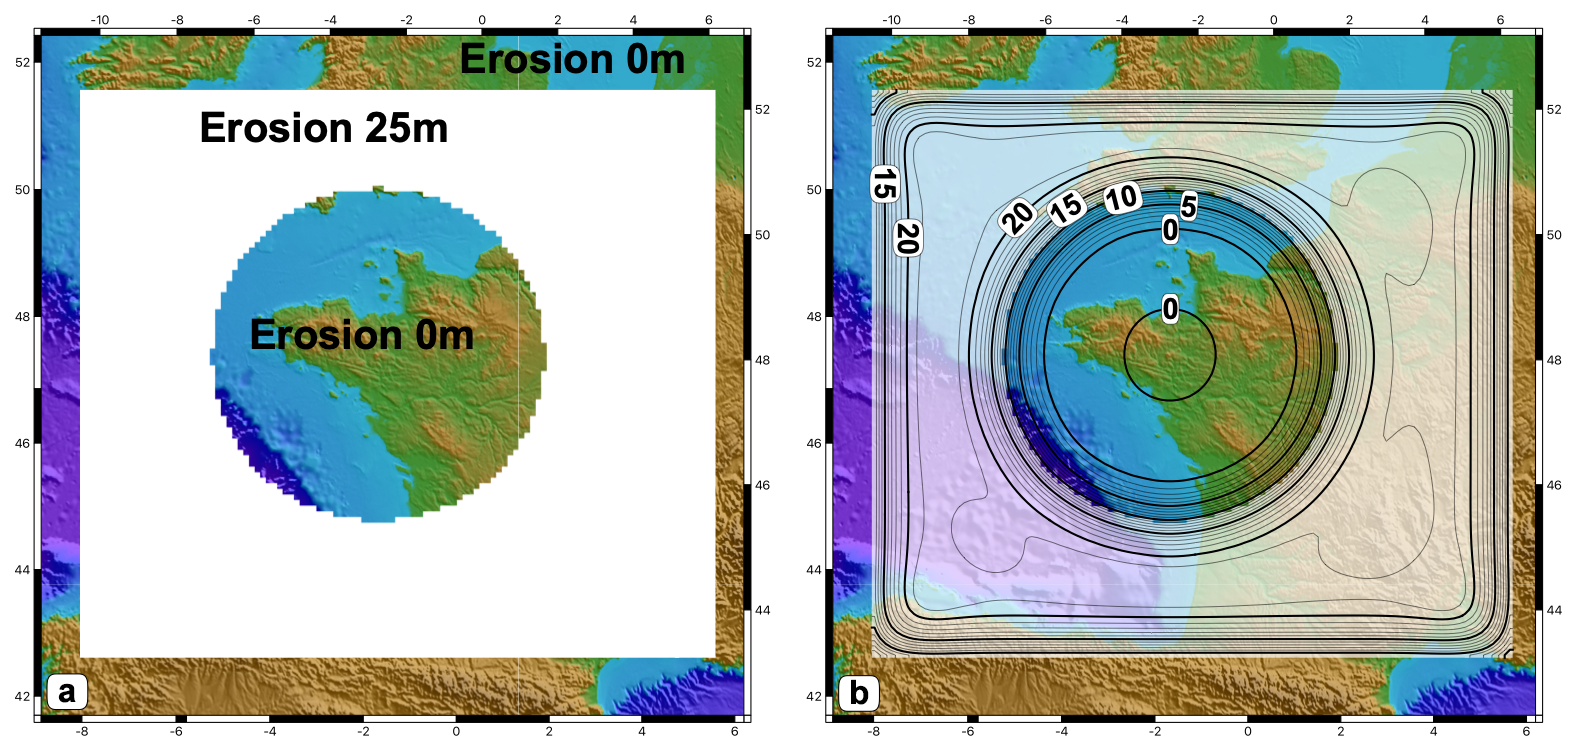
Figure 7Example of modeling sensitivity tests. (a) Input erosion rates. (b) Flexure solution (uplift rates).
5.2 Effect of offshore sedimentation
Based on the 1D model, we estimate that the effect of offshore sedimentation patterns on vertical velocities on land is ca. 0.5–1 m Ma−1 (subsidence rate for near-shore sedimentation or uplift rate for slope sedimentation), about 10 times smaller than the effect of denudation rates (Fig. 8). Due to the very low effects of the sedimentation rates on land vertical motions and to the sparse distribution of sediment thickness mapping, we do not include the sedimentation rates in the following models. Depending on the interaction of the sedimentation patterns, this could lead to a small overestimation of ca. 5 %–15 % of the uplift rates along the coast and less than 5 % further inland (Fig. 8). This effect should be kept in mind when discussing specific model predictions along the coast.
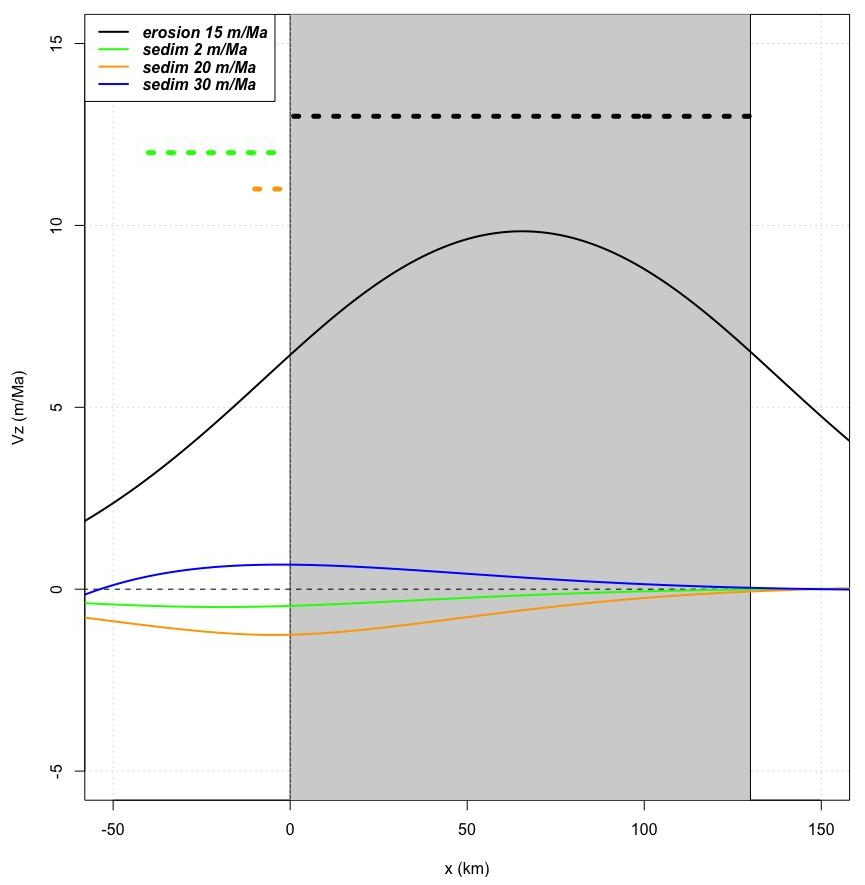
Figure 8Schematic 2D models of uplift rates due to on-land erosion rates and offshore sedimentation rates. Uplift rates (Vz) shown as a function of distance (x) along a schematic 2D south–north profile across the Armorican Peninsula, with the gray area indicating the land section. The black curve shows uplift rates due to an on-land erosion rate of 15 m Ma−1 ( km). The green, orange, and blue curves show uplift rates due to three sedimentation rate scenarios: 2 m Ma−1 on a 40 km wide coastal section ( km), 20 m Ma−1 on a 10 km wide coastal section ( km), and 30 m Ma−1 on a 100 km wide continental slope section ( km). Uplift rates are given for an elastic plate thickness of 25 km (see Sect. 5). Dashed lines above the graph show locations of the erosion/sedimentation zones.
5.3 Effect of onshore erosion
Figure 9a–c show the uplift rates predicted for the mean denudation rate model associated with the three elastic thickness cases. All three models show maximum uplift rates ca. 8–15 m Ma−1 centered on the western Brittany highland. The uplift rates decrease sharply westward down to ∼5 m Ma −1 near the coast, with a decrease gradient controlled by the elastic plate thickness (lower gradient for thicker plate). The central lowland region is associated with an uplift rate of 4–8 m Ma−1. This central value is weakly dependent on the plate thickness, while the east–west gradient strongly depends on the thickness model, with the lowest thickness yielding an uplift rate in the western highlands almost twice as high as the thickest model (Fig. 8a–c). Uplift rates along the Armorican Peninsula coastline are ca. 5–6 m Ma−1 in the northeastern (Saint-Malo, Saint-Brieuc) and southeastern (Lorien, Saint-Nazaire) regions. They diminish to 4–5 m Ma−1 along the western tip of the peninsula (Roscoff, Brest, Concarneau). The smallest plate thickness model (15 km) shows a characteristic elongated pattern of uplift rate ca. 7–12 m Ma−1 along the peninsula east–west axis. This pattern progressively disappears in the thicker plate models due to the low-pass filtering effect of the elastic plate response that smooths out the erosion rate spatial distribution.
The random model allows us to test two effects: (1) the sensitivity of the predicted uplift rates to the spatial distribution of denudation rates and (2) the possible bias of uplift rates due to the nonlinear slope–denudation rate relationship. Figure 9d shows an example of uplift rates associated with a random denudation rate distribution (Fig. 6b) for a plate thickness of 25 km. The uplift rate pattern is similar in shape to that of the mean model, albeit with rates ca. 1.5–1.7 times larger depending on the locations along the peninsula due to the denudation rates being on average 1.6 times larger than those of the mean model (see Sect. 4). This model illustrates two important points:
-
Spatial variations in denudation rates at dimensions of 10–50 km are filtered out by the flexural rigidity of the lithosphere and are not reflected in the uplift rates. This corresponds to a minimum sensitivity length that varies with the elastic plate thickness but in our case (15–35 km) remains ca. 50 km.
-
Considering the uncertainties in denudation rates and the 90 % envelope derived from our analysis of stable western Europe data (Sect. 4), the random model results provide an upper bound for predicted uplift rates at any given point on the map (but not on average).
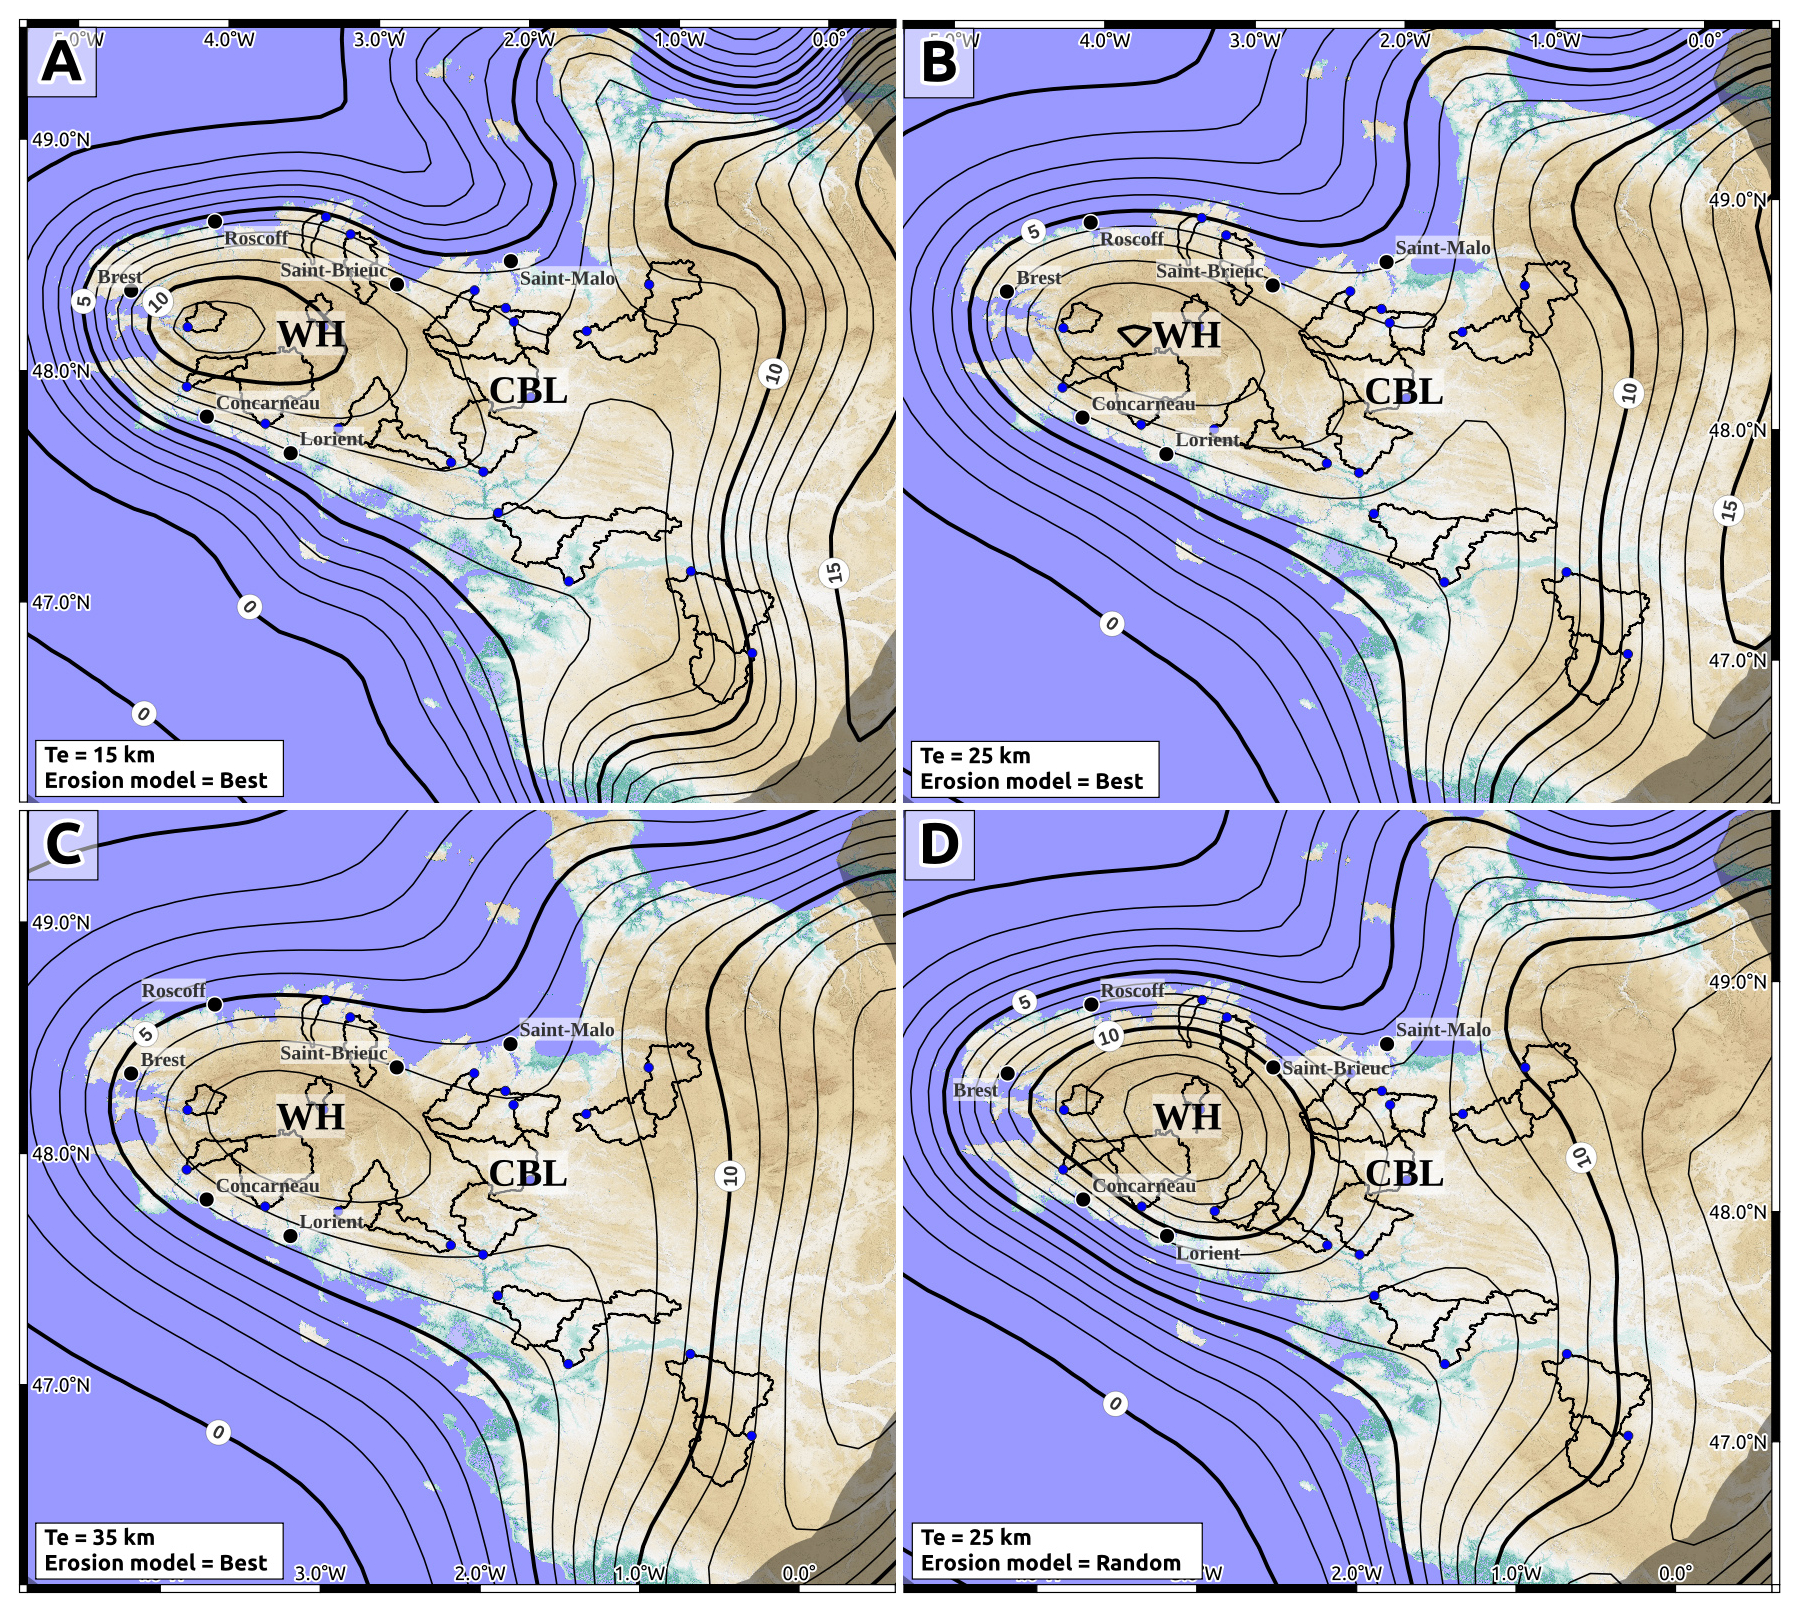
Figure 9Predicted Late Pleistocene–Holocene uplift rates due to denudation rates. Isocontours of uplift rates (in m Ma−1). (a, b, c) Mean erosion model and three elastic plate thicknesses (15, 25, 35 km). (d) Random erosion model and 25 km elastic plate thickness. The gray area on the eastern side shows where uplift rates are biased by model border effects and must not be considered. CBL and WH stand for central Brittany lowland and western highland, respectively.
6.1 Regional denudation and erosion rate variability
Despite the uncertainties on individual denudation rate estimations, we can rely on local and regional averages to identify significant spatial variations. The main signal in the Armorican Massif is the difference between the western highland and central lowland regions. The eight drainage basins fully or primarily eroding the western highland region (Blavet, Claie, Douffine, Evel, Laita, Leff, Odet, and Guindy) show an average denudation rate of 13±6 m Ma−1. In contrast, the nine basins eroding the central lowland (Aff, Argenton, Couesnon, Erdre, Isac, Layon, Linon, Meu, Selune) show an average rate of 7±4 m Ma−1. No other geographical pattern, such as a north–south difference, can be identified. Although its statistical power is low, the difference by a factor of 2 in denudation rates between the western highlands and the central lowlands can easily be explained by the small difference in elevation and in relief between the two areas. This result is in agreement with Bonnet et al. (1998) and Lague et al. (2000), who proposed higher incision and erosion rates by a factor of about 1.5–2 in the western highland compared to the central lowland based on quantitative morphological analyses of the topography.
This spatial variability is also consistent with the estimations of the mean annual sediment export of rivers in these two areas (Delmas et al., 2012). The average export of rivers primarily associated with the western highland is ca. 0.17 Mt yr−1, about twice as large as that of the Vilaine River located in the central lowland (ca. 0.07 Mt yr−1). Considering the respective areas of these two drainage systems and assuming a sediment density of 1400 kg m−3, the equivalent erosion rates of the western and central regions are ca. 10 and 5 m Ma−1, respectively – about 60 % of our average denudation rates. Such a difference is commonly observed in studies comparing cosmogenic denudation rates with sediment fluxes (e.g., Kirchner et al., 2001), possibly due to the different sampling timescales of the two methods or to the fact that denudation rates sample both chemical and mechanical erosion processes, while suspended sediment flux data lack the dissolved load.
A possible source of error in the regional denudation pattern is the presence of the Faluns deposits. As these deposits are relatively young, the absence of inheritance in 10Be concentrations cannot be totally ruled out. If present, this inheritance would diminish the estimated denudation rates (the true current denudation rates being higher). However, we do not believe this inheritance to be of a high impact, if any, for three main reasons. Firstly, the majority of the region, notably the western part, lacks such deposits. Secondly, the Faluns deposits are principally associated with carbonates; therefore the total quartz-bearing mass is expected to be small. Thirdly, a significant part of the finer sediment is actually removed during the sampling and chemical purification.
6.2 Late Pleistocene–Holocene uplift rates, regional sea level, and geodynamics
Based on present-day elevations of MIS 11 and MIS 5e marine terraces, Pedoja et al. (2018) estimate mean mid-Pleistocene and Upper Pleistocene apparent uplift rates of 50±10 m Ma−1 for most western European coastlines, from southern England to Portugal. Using morpho-stratigraphic evidence, they argue that these data cannot be explained solely by eustatic sea-level variations and require a mean uplift rate of ca. 10 m Ma−1, due to an “increasing lithospheric compression that accompanies Cenozoic orogenies”.
Around the Armorican Peninsula, elevated marine terraces of MIS 5e age are found at an average elevation of 6±2 m (full range 4–14 m; data from Pedoja et al., 2018). Glacial isostatic adjustment corrections and fingerprinting effects of past ice sheets render the estimation of regional Late Pleistocene sea levels particularly difficult (Hay et al., 2014). Relative to present-day sea level, MIS 5e eustatic elevations are estimated ca. 2–9 m at 123–125 ka (with a preferred value of 4.5–7.5 m) and ca. −20 m at 113 ka, with a likely intermediate highstand ca. 5 m at 116–188 ka (Kopp et al., 2013; Polyak et al., 2018; Hay et al., 2014). Assuming a regional eustatic sea level of 2, 4.5, 7.5, or 9 m results in an average uplift rate since the Late Pleistocene of −23, −12, 12, or 31 m Ma−1, respectively, for the Armorican Peninsula marine terrace (using an average elevation of 6 m). In comparison, we estimate uplift rates of 4–8 m Ma−1 (upper bound of 6–14 m Ma−1) due to the response to denudation rates (Fig. 9).
Thus, within the uncertainties associated with the eustatic sea-level estimations, erosion-driven uplift can explain the uplifted Upper Pleistocene marine terraces around the Armorican Peninsula without the need for additional geodynamic processes. No study has specifically addressed the Armorican Peninsula, but some have associated the observed Neogene–Quaternary uplift in northwestern Europe with the Quaternary glaciation cycles (Westaway et al., 2002), Cenozoic orogeny (Pedoja et al., 2018), or dynamic topography due to large-scale mantle flow (Cloetingh, 2007; Carminati et al., 2009; Pedersen et al., 2016), with the latter potentially resulting in a very broad wavelength (several hundreds to several thousands of kilometers) uplift rates up to a few tens of meters per million years (m Ma−1), similar to or slightly faster than those due to regional erosion rates. While our results do not rule out the role of dynamic topography (or other geodynamic processes) in driving Neogene–Quaternary uplift of the Armorican Massif and intraplate northwestern Europe, they indicate that, because slow erosion is a continuous process for onshore areas, its associated isostatic response and induced uplift rates must be considered when studying these potential additional processes.
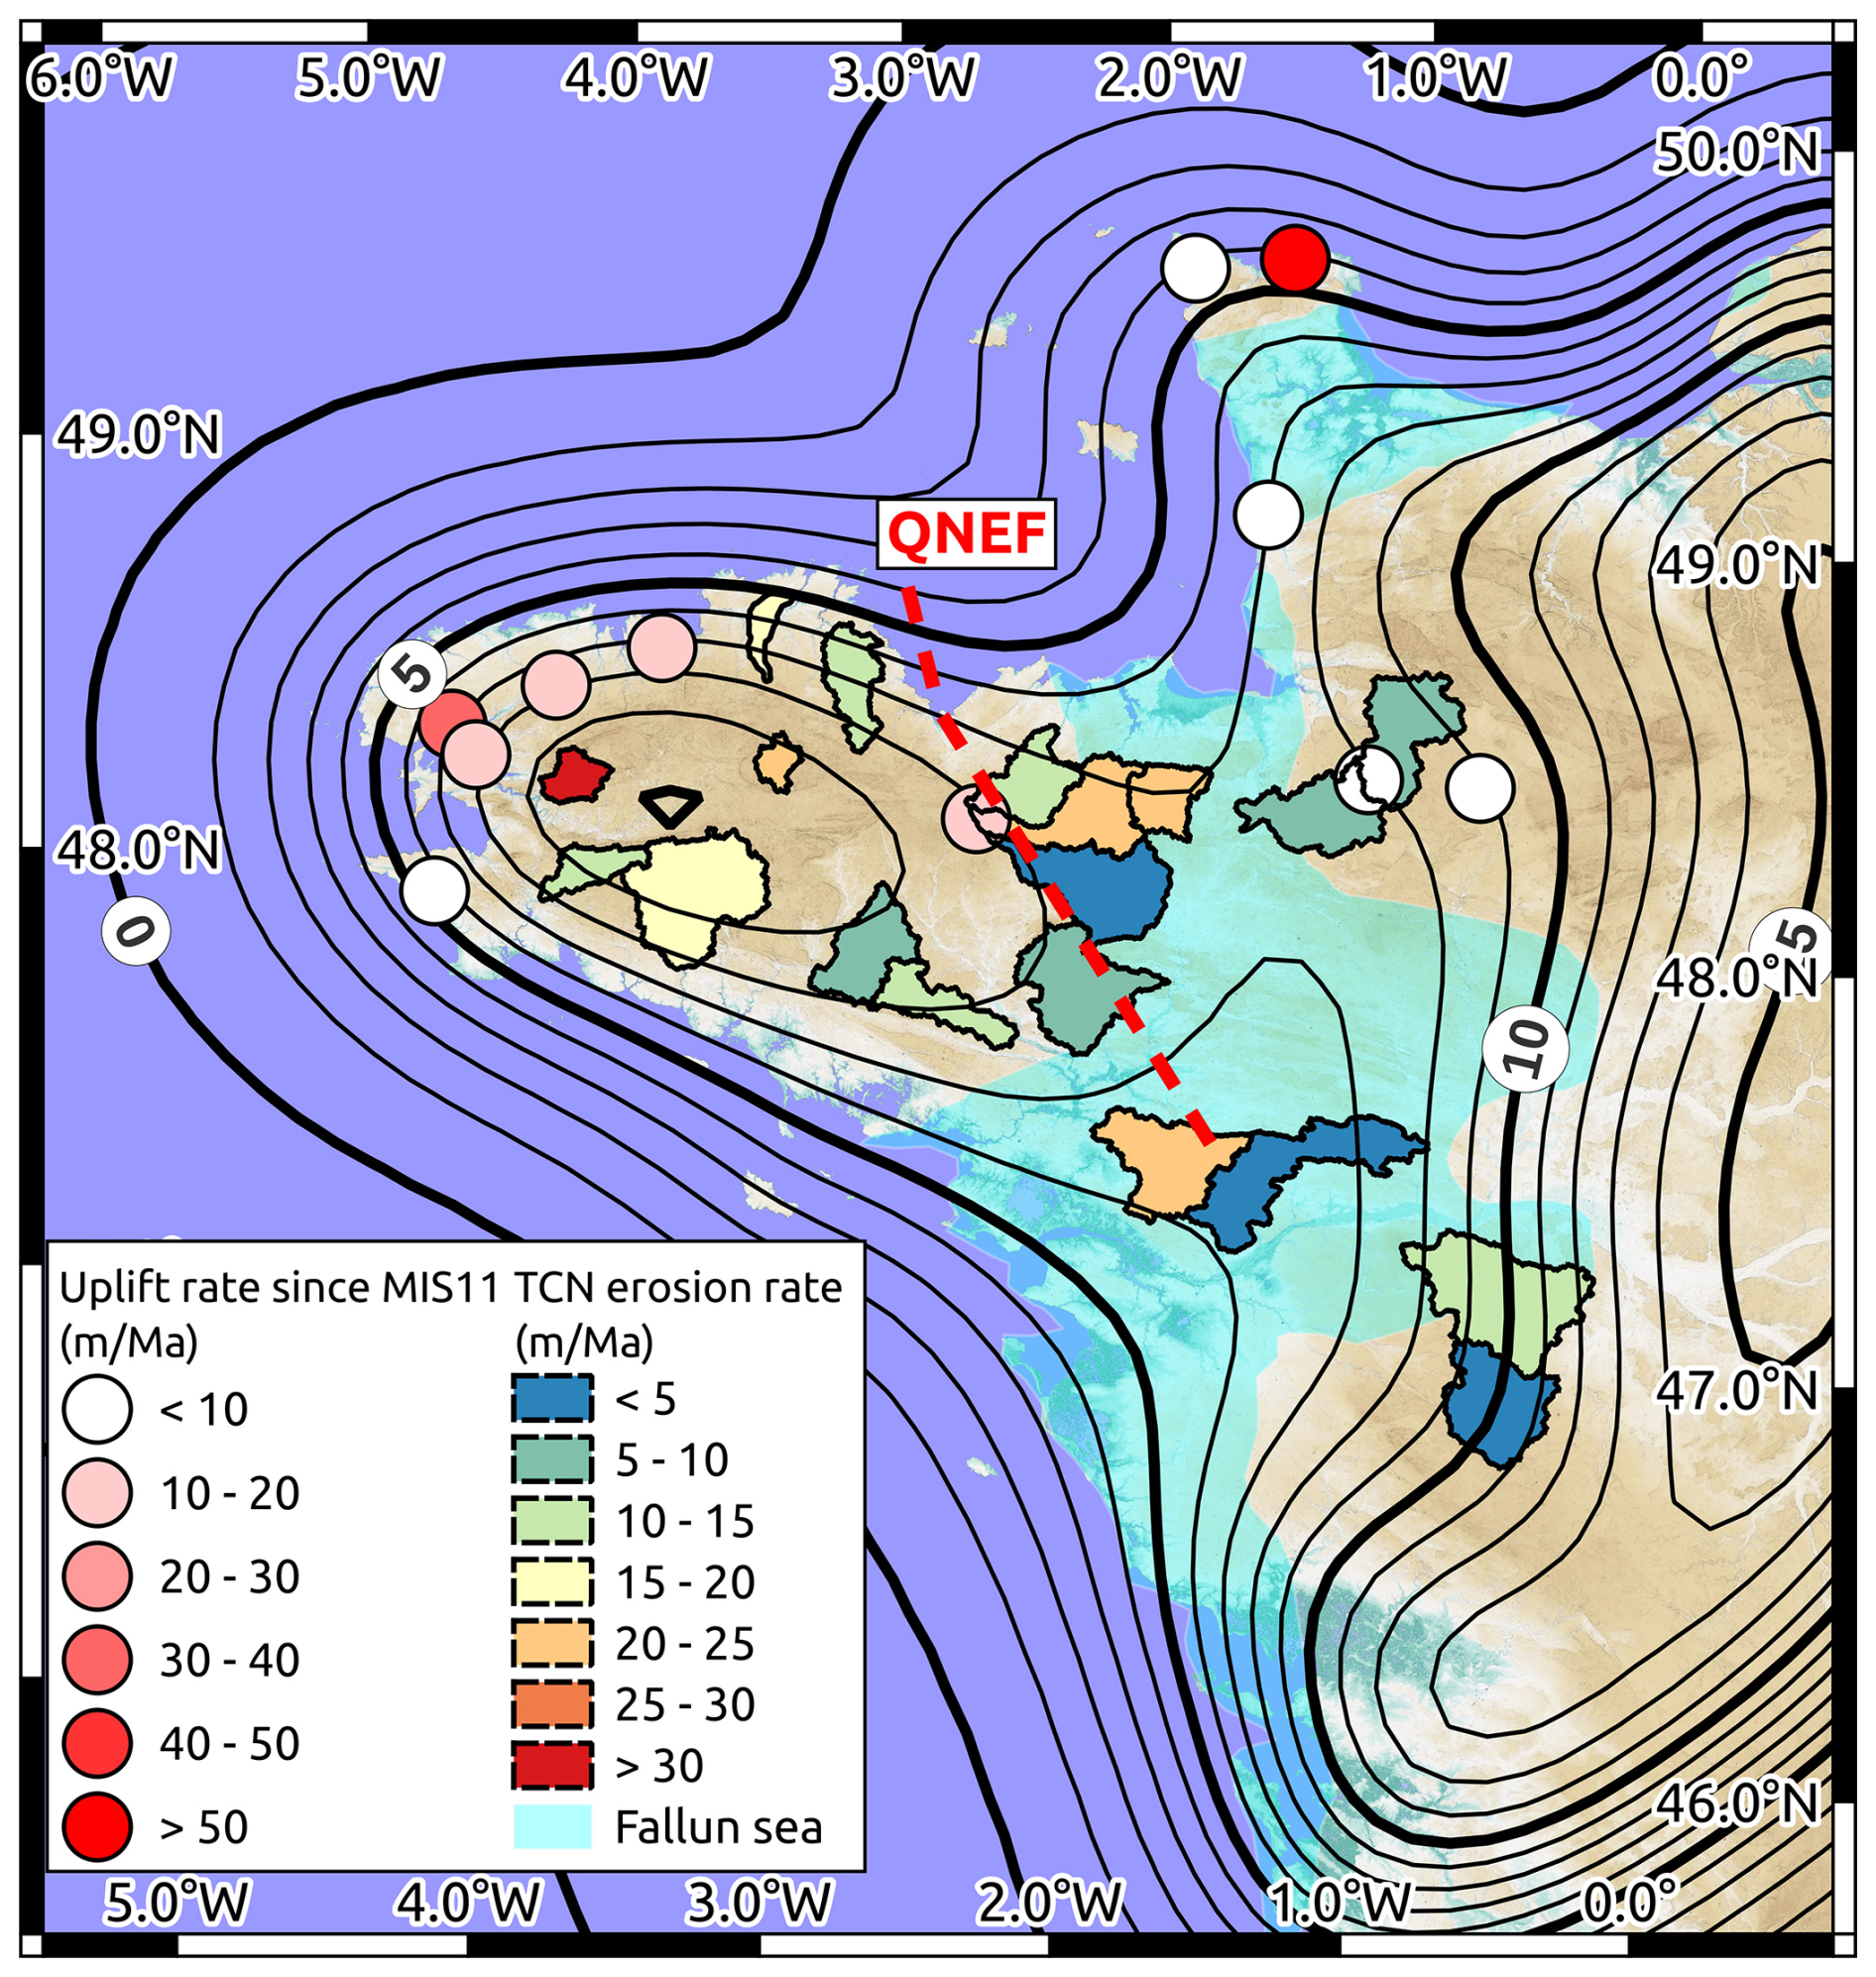
Figure 10Summary of the measured denudation rate, derived uplift rate due to erosional isostatic adjustment, and observed uplifted marine terraces (data from Pedoja et al., 2018). The flexural response to erosion is provided for Te = 25 km and the best synthetic erosional model. QNEF is the Quessoy-Nort-sur-Erdre Fault.
6.3 Quaternary morphology and tectonics
The elevations of marine deposits, corrected for past eustatic sea level, provide first-order estimations of Quaternary uplift rates in the central lowland region of the Armorican Massif (Sect. 2). They indicate an average uplift rate of 4–13 m Ma−1 since ca. 3 Ma (Brault et al., 2004) or 16±2 m Ma−1 average during the Pleistocene (Bessin et al., 2017). If we assume that our denudation rates are representative of the Quaternary period (mix of glacial and interglacial periods), these geological uplift rates are in agreement with those predicted in response to erosion (ca. 12–15 m Ma−1, upper bound ca. 20 m Ma−1; Fig. 9). As for the Upper Pleistocene marine terraces, this comparison suggests that erosion-driven uplift is enough to explain the elevated Quaternary marine markers.
The pattern of uplift rates also shows a minor difference between the western highland (ca. 8–14 m Ma−1) and the central lowland (ca. 6–8 m Ma−1), depending on the assumed lithosphere equivalent elastic thickness (Fig. 9). Combined with the pattern of denudation rates (ca. 16 and 8 m Ma−1 in the western and central regions, respectively; Figs. 4, 6), these results suggest a quasi-stationary surface elevation in the central lowland (close to the landscape equilibrium status), whereas the absolute elevation of the western highland region diminishes by ca. 5–10 m Ma−1. These very low rates of topographic evolution indicate a persistence of the present-day east–west elevation differences throughout the Quaternary, despite the mid-Pleistocene reconfiguration of the drainage network (Guillocheau et al., 2003; Brault et al., 2004). The low-elevation area is associated with an uplift rate of the same amplitude as the denudation rate, hence providing a first indication for landscape equilibrium. In the peninsula itself, the uplift rate is lower than the denudation rate, supporting a probable non-equilibrium of the landscape (this feature is also supported by the morphology with significant, very localized incisions). The discrepancy between the low-elevation and high-elevation areas is not clearly elucidated and can be interpreted, for example, as an initial differential uplift (of an unknown age) or an erodibility contrast, leading to erosion–uplift equilibrium being reached in the central lowland but not yet in the peninsula.
The potential differential uplift rates across the QNEF system, accommodating 10–60 m Ma−1 of east-side-down relative vertical motion, proposed by Bonnet et al. (1998) and Lague et al. (2000), is not in agreement with our results. If erosion alone drives Quaternary uplift, as suggested by the agreement with the Cenozoic marine deposits, the differential uplift rates across the QNEF are very small (a few m Ma−1; Fig. 10). Additional processes such as local tectonics could induce the proposed differential uplift rates and QNEF system motion. However, this would imply differential altitudes of ca. 1.5–8 m of the MIS 5e marine terraces across the QNEF system that are not observed along the northern Armorican Peninsula coast (although the variability in the terrace uplift rates precludes a robust conclusion). An alternative explanation is to consider that the east–west difference in incision rates observed by Bonnet et al. (1998) and Lague et al. (2000) is not due to a major difference in uplift rates but to a difference in erosional efficiency. Catchments on the eastern side of the QNEF are mostly associated with the presence of high-erodibility Faluns formations, which likely resulted in low-relief landscapes (compared to the western highlands). This difference in topographic relief could explain the observed east–west morphology and incision gradient, without differential uplift rates. Overall, the lack of marine deposits in the western highland, the variability in the marine terrace data, and the coarse information from our study preclude distinguishing between the two propositions and the potential activity, or not, of the QNEF system.
In the Armorican Massif, denudation rates measured from terrestrial cosmogenic nuclide concentrations range between ca. 5 and 25 m Ma−1. These rates are representative of the Late Pleistocene (20–200 kyr). On average, the western highland region of the Armorican Massif shows denudation rates about twice those of the central lowland region (ca. 13±6 m Ma−1 vs. ca. 7±4 m Ma−1; Fig. 10), in agreement with previous regional morphology and erosion studies (Bonnet et al., 1998; Lague et al., 2000; Delmas et al., 2012). There is no clear denudation signal associated with large-scale tectonic structures (e.g., South Armorican Shear Zone, Quessoy-Nort-sur-Erdre Fault). The lithosphere flexural isostatic response to these ongoing denudation rates results in an overall uplift of the Armorican Peninsula. Predicted uplift rates range from ca. 6–8 m Ma−1 in the central lowland region to ca. 8–14 m Ma−1 in the western peninsula and ca. 4–8 m Ma−1 along the coast (Fig. 10). Considering the uncertainties in eustatic sea-level corrections, these erosion-driven uplift rates can explain the uplifted Late Pleistocene marine terraces along the Armorican Peninsula coastline (Pedoja et al., 2018) without necessitating additional geodynamic processes such as dynamic topography, regional compression, or local active faults. While our results do not preclude the existence of such other processes, they show that, if present, their effects must be much slower than previously proposed. Finally, assuming that they can be extrapolated over the whole Pleistocene period, the erosion-driven uplift rates in the central lowland region are also sufficient to explain the elevated Quaternary marine deposits on land (Brault et al., 2004; Bessin et al., 2017).
Our results show that long-term erosion over the Holocene and Pleistocene can be a major driver of the observed uplift in the Armorican Peninsula and likely in other stable continental regions. While other geodynamic processes may also contribute to these uplift rates, spatial variations in erosion rates should be taken into account before trying to derive global or regional geodynamic or tectonic conclusions. They also suggest that the role of long-term erosion as a driver or promoter of intraplate seismicity should be considered in the Armorican Peninsula and other stable continental regions (Gallen and Thigpen, 2018; Mazzotti et al., 2023).
Models, data analyses, and figures were done with free open-source software (https://www.python.org/, https://www.qgis.org/, https://github.com/awickert/gFlex, Wickert, 2010, 2016). Model parameters and results are available on demand from the Open Science Framework “EroSeis” project (https://osf.io/yq3bt/, Mazzotti, 2025). Data used for the sedimentation rates are from Augris et al. (2013a, b, and c). Data used for denudation rates are from the OCTOPUS database (Codilean et al., 2018).
The supplement related to this article is available online at https://doi.org/10.5194/esurf-13-629-2025-supplement.
OM and SM performed the field work and sampling. OM and VG performed the sample preparation. OM and SM performed the initial data analysis and drafted the article. All authors discussed the results and the data analysis and commented on the article.
The contact author has declared that none of the authors have any competing interests.
Publisher's note: Copernicus Publications remains neutral with regard to jurisdictional claims made in the text, published maps, institutional affiliations, or any other geographical representation in this paper. While Copernicus Publications makes every effort to include appropriate place names, the final responsibility lies with the authors.
We thank Laure Simplet (Ifremer) for providing the sedimentation databases and information and Samuel Toucanne (Ifremer) for the Fleuve Manche references. ASTER AMS is part of the LN2C national facility (CEREGE, Aix-en-Provence). It is supported by INSU/CNRS, IRD, and AMU and is a member of the REGEF and Plateforme Aix-Marseille networks.
This research has been supported by the Agence Nationale de la Recherche (grant no. ANR-20-CE01-0005).
This paper was edited by Dirk Scherler and reviewed by Anne Duperret, Romano Clementucci, and Andy Wickert.
Arnold, M., Merchel, S., Bourlès, D. L., Braucher, R., Benedetti, L., Finkel, R. C., Aumaître, G., Gottdang, A., and Klein, M.: The French accelerator mass spectrometry facility ASTER: Improved performance and developments, Nucl. Instrum. Methods Phys. Res. Sect. B Beam Interact. Mater. At., 268, 1954–1959, https://doi.org/10.1016/j.nimb.2010.02.107, 2010.
Augris, C., Simplet, L., and Gautier, E.: Isopaques de bancs sableux en Mer du Nord, Manche et Atlantique, IFREMER [data set], https://doi.org/10.12770/75AD486F-9D03-4FEB-B742-BE6C6F791345, 2013a.
Augris, C., Simplet, L., and Gautier, E.: Isopaques de couverture indifférenciée en Mer du Nord, Manche et Atlantique, IFREMER [data set], https://doi.org/10.12770/C841CA37-B414-4C51-AD6A-16BC34E8CF6F, 2013b.
Augris, C., Simplet, L., and Gautier, E.: Isopaques de nappes alluviales en Mer du Nord, Manche et Atlantique, IFREMER [data set], https://doi.org/10.12770/6C4CCD44-71B1-411D-91D1-ECCD1B2A46F1, 2013c.
Balco, G., Stone, J. O., Lifton, N. A., and Dunai, T. J.: A complete and easily accessible means of calculating surface exposure ages or erosion rates from 10Be and 26Al measurements, Quat. Geochronol., 3, 174–195, https://doi.org/10.1016/j.quageo.2007.12.001, 2008.
Ballèvre, M., Bosse, V., Ducassou, C., and Pitra, P.: Palaeozoic history of the Armorican Massif: Models for the tectonic evolution of the suture zones, Comptes Rendus Geosci., 341, 174–201, https://doi.org/10.1016/j.crte.2008.11.009, 2009.
Bessin, P., Guillocheau, F., Robin, C., Schroëtter, J.-M., and Bauer, H.: Planation surfaces of the Armorican Massif (western France): Denudation chronology of a Mesozoic land surface twice exhumed in response to relative crustal movements between Iberia and Eurasia, Geomorphology, 233, 75–91, https://doi.org/10.1016/j.geomorph.2014.09.026, 2014.
Bessin, P., Guillocheau, F., Robin, C., Braun, J., Bauer, H., and Schroëtter, J.-M.: Quantification of vertical movement of low elevation topography combining a new compilation of global sea-level curves and scattered marine deposits (Armorican Massif, western France), Earth Planet. Sci. Lett., 470, 25–36, https://doi.org/10.1016/j.epsl.2017.04.018, 2017.
Beucler, É., Bonnin, M., Hourcade, C., Van Vliet-Lanoë, B., Perrin, C., Provost, L., Mocquet, A., Battaglia, J., Geoffroy, L., Steer, P., Le Gall, B., Douchain, J.-M., Fligiel, D., Gernigon, P., Delouis, B., Perrot, J., Mazzotti, S., Mazet-Roux, G., Lambotte, S., Grunberg, M., Vergne, J., Clément, C., Calais, É., Deverchère, J., Longuevergne, L., Duperret, A., Roques, C., Kaci, T., and Authemayou, C.: Characteristics and possible origins of the seismicity in northwestern France, Comptes Rendus Géoscience, 353, 53–77, https://doi.org/10.5802/crgeos.86, 2021.
Binnie, S. A., Phillips, W. M., Summerfield, M. A., and Fifield, L. K.: Tectonic uplift, threshold hillslopes, and denudation rates in a developing mountain range, Geology, 35, 743, https://doi.org/10.1130/G23641A.1, 2007.
Bonnet, S., Guillocheau, F., and Brun, J.-P.: Relative uplift measurement using river incisions: the case of the Armorican basement (France), Comptes Rendus Académie Sci.-Earth Planet. Sci., 327, 245–251, 1998.
Bonnet, S., Guillocheau, F., Brun, J.-P., and Van Den Driessche, J.: Large-scale relief development related to Quaternary tectonic uplift of a Proterozoic-Paleozoic basement: The Armorican Massif, NW France, J. Geophys. Res.-Solid Earth, 105, 19273–19288, https://doi.org/10.1029/2000JB900142, 2000.
Braucher, R., Guillou, V., Bourlès, D. L., Arnold, M., Aumaître, G., Keddadouche, K., and Nottoli, E.: Preparation of ASTER in-house 10Be/9Be standard solutions, Nucl. Instrum. Methods Phys. Res. Sect. B, 361, 335–340, https://doi.org/10.1016/j.nimb.2015.06.012, 2015.
Brault, N., Bourquin, S., Guillocheau, F., Dabard, M.-P., Bonnet, S., Courville, P., Estéoule-Choux, J., and Stepanoff, F.: Mio–Pliocene to Pleistocene paleotopographic evolution of Brittany (France) from a sequence stratigraphic analysis: relative influence of tectonics and climate, Sediment. Geol., 163, 175–210, https://doi.org/10.1016/S0037-0738(03)00193-3, 2004.
Carretier, S., Regard, V., and Soual, C.: Theoretical cosmogenic nuclide concentration in river bed load clasts: Does it depend on clast size?, Quaternary Geochronol., 4, 108–123, 2009.
Champagnac, J.-D., Molnar, P., Anderson, R. S., Sue, C., and Delacou, B.: Quaternary erosion-induced isostatic rebound in the western Alps, Geology, 35, 195–198, https://doi.org/10.1130/G23053A.1, 2007.
Codilean, A. T., Munack, H., Cohen, T. J., Saktura, W. M., Gray, A., and Mudd, S. M.: OCTOPUS: an open cosmogenic isotope and luminescence database, Earth Syst. Sci. Data, 10, 2123–2139, https://doi.org/10.5194/essd-10-2123-2018, 2018.
Delmas, M., Cerdan, O., Cheviron, B., Mouchel, J.-M., and Eyrolle, F.: Sediment export from French rivers to the sea, Earth Surf. Process. Landf., 37, 754–762, https://doi.org/10.1002/esp.3219, 2012.
Dirks, P. H. G. M., Placzek, C. J., Fink, D., Dosseto, A., and Roberts, E.: Using 10Be cosmogenic isotopes to estimate erosion rates and landscape changes during the Plio-Pleistocene in the Cradle of Humankind, South Africa, J. Hum. Evol., 96, 19–34, https://doi.org/10.1016/j.jhevol.2016.03.002, 2016.
Dunai, T. J.: Cosmogenic Nuclides: Principles, Concepts and Applications in the Earth Surface Sciences, Cambridge University Press, https://doi.org/10.1017/CBO9780511804519, 2010.
Dutton, A. and Lambeck, K.: Ice Volume and Sea Level During the Last Interglacial, Science, 337, 216–219, https://doi.org/10.1126/science.1205749, 2012.
Erlanger, E. D., Granger, D. E., and Gibbon, R. J.: Rock uplift rates in South Africa from isochron burial dating of fluvial and marine terraces, Geology, 40, 1019–1022, https://doi.org/10.1130/G33172.1, 2012.
Gallen, S. F. and Thigpen, J. R.: Lithologic Controls on Focused Erosion and Intraplate Earthquakes in the Eastern Tennessee Seismic Zone, Geophys. Res. Lett., 45, 9569–9578, https://doi.org/10.1029/2018GL079157, 2018.
Granger, D. E., Kirchner, J. W., and Finkel, R. C.: Spatially Averaged Long-Term Erosion Rates Measured from In Situ-Produced Cosmogenic Nuclides in Alluvial Sediment, The J. Geol., 104, 249–257, 1996.
Guillocheau, F., Brault, N., Thomas, E., Barbarand, J., Bonnet, S., Bourquin, S., Estéoule-choux, J., Guennoc, P., Menier, D., Néraudeau, D., Proust, J.-N., and Wyns, R.: Histoire géologique du Massif Armoricain depuis 140 Ma (Crétacé-Actuel), Assoc. Géologues Bassin Paris, 40, 13–28, 2003.
Gurnis, M., Mitrovica, J. X., Ritsema, J., and van Heijst, H.-J.: Constraining mantle density structure using geological evidence of surface uplift rates: The case of the African Superplume, Geochem. Geophys. Geosystems, 1, 1, https://doi.org/10.1029/1999GC000035, 2000.
Harel, M.-A., Mudd, S. M., and Attal, M.: Global analysis of the stream power law parameters based on worldwide 10Be denudation rates, Geomorphology, 268, 184–196, https://doi.org/10.1016/j.geomorph.2016.05.035, 2016.
Harrison, C. G. A.: What factors control mechanical erosion rates?, Int. J. Earth Sci., 88, 752–763, https://doi.org/10.1007/s005310050303, 2000.
Haxby, W. F. and Turcotte, D. L.: Stresses induced by the addition or removal of overburden and associated thermal effects, Geology, 4, 181, https://doi.org/10.1130/0091-7613, 1976.
Hay, C., Mitrovica, J. X., Gomez, N., Creveling, J. R., Austermann, J., and E. Kopp, R.: The sea-level fingerprints of ice-sheet collapse during interglacial periods, Quat. Sci. Rev., 87, 60–69, https://doi.org/10.1016/j.quascirev.2013.12.022, 2014.
Hurst, M. D., Mudd, S. M., Walcott, R., Attal, M., and Yoo, K.: Using hilltop curvature to derive the spatial distribution of erosion rates, J. Geophys. Res., 117, F02017, https://doi.org/10/f3tx7m, 2012.
Kaban, M. K., Chen, B., Tesauro, M., Petrunin, A. G., El Khrepy, S., and Al-Arifi, N.: Reconsidering Effective Elastic Thickness Estimates by Incorporating the Effect of Sediments: A Case Study for Europe, Geophys. Res. Lett., 45, 9523–9532, https://doi.org/10.1029/2018GL079732, 2018.
Kirchner, J. W., Finkel, R. C., Riebe, C. S., Granger, D. E., Clayton, J. L., King, J. G., and Megahan, W. F.: Mountain erosion over 10 yr, 10 k.y., and 10 m.y. time scales, Geology, 29, 591, https://doi.org/10.1130/0091-7613(2001)029<0591:MEOYKY>2.0.CO;2, 2001.
Kopp, R. E., Simons, F. J., Mitrovica, J. X., Maloof, A. C., and Oppenheimer, M.: A probabilistic assessment of sea level variations within the last interglacial stage, Geophys. J. Int., 193, 711–716, https://doi.org/10.1093/gji/ggt029, 2013.
Lague, D., Davy, P., and Crave, A.: Estimating uplift rate and erodibility from the area-slope relationship: Examples from Brittany (France) and numerical modelling, Phys. Chem. Earth Part Solid Earth Geod., 25, 543–548, https://doi.org/10.1016/S1464-1895(00)00083-1, 2000.
Lenôtre, N., Thierry, P., Blanchin, R., and Brochard, G.: Current vertical movement demonstrated by comparative levelling in Brittany (northwestern France), Tectonophysics, 301, 333–344, 1999.
Masson, C., Mazzotti, S., Vernant, P., and Doerflinger, E.: Extracting small deformation beyond individual station precision from dense GNSS networks in France and Western Europe, Solid Earth, 10, 1905–1920, https://doi.org/10.5194/se-10-1905-2019, 2019.
Mazzotti, S.: Project EroSeis – Public, OSF, https://osf.io/yq3bt/ (last access: 4 August 2025), 2025.
Mazzotti, S., Vergeron, X., Malcles, O., Grosset, J., and Vernant, P.: Impact of long-term erosion on crustal stresses and seismicity in stable continental regions, Geology, 51, 733–737, https://doi.org/10.1130/G51327.1, 2023.
Monnier, J. L., Jumel, G., and Jumel, A.: Le Paléolithique inférieur de la côte 42 à Saint-Malo-de-Phily (Ille-et-Vilaine). Stratigraphie et industrie, in: Bulletin de la Société préhistorique française, tome 78, no 10–12, Études et Travaux, 317–328 pp., https://doi.org/10.3406/bspf.1981.5285, 1981.
Montgomery, D. R. and Brandon, M. T.: Topographic controls on erosion rates in tectonically active mountain ranges, Earth Planet. Sci. Lett., 201, 481–489, https://doi.org/10.1016/S0012-821X(02)00725-2, 2002.
Muhs, D. R., Pandolfi, J. M., Simmons, K. R., and Schumann, R. R.: Sea-level history of past interglacial periods from uranium-series dating of corals, Curaçao, Leeward Antilles islands, Quaternary Res., 78, 157–169, https://doi.org/10.1016/j.yqres.2012.05.008, 2012.
Murray-Wallace, C. M., Belperio, A. P., Cann, J. H., Huntley, D. J., and Prescott, J. R.: Late Quaternary uplift history, Mount Gambier Region, South Australia, Z. Geomorphol., Suppl.-Bd. 106, 41–56, 1996.
Néraudeau, D., Barbe, S., Mercier, D., and Roman, J.: Signatures paléoclimatiques des échinides du Néogène final atlantique à faciès redonien, Ann. Paléontol., 89, 153–170, https://doi.org/10.1016/S0753-3969(03)00023-5, 2003.
Pedersen, V. K., Huismans, R. S., and Moucha, R.: Isostatic and dynamic support of high topography on a North Atlantic passive margin, Earth Planet. Sci. Lett., 446, 1–9, https://doi.org/10.1016/j.epsl.2016.04.019, 2016.
Pedoja, K., Husson, L., Regard, V., Cobbold, P. R., Ostanciaux, E., Johnson, M. E., Kershaw, S., Saillard, M., Martinod, J., Furgerot, L., Weill, P., and Delcaillau, B.: Relative sea-level fall since the last interglacial stage: Are coasts uplifting worldwide?, Earth-Sci. Rev., 108, 1–15, https://doi.org/10.1016/j.earscirev.2011.05.002, 2011.
Pedoja, K., Jara-Muñoz, J., De Gelder, G., Robertson, J., Meschis, M., Fernandez-Blanco, D., Nexer, M., Poprawski, Y., Dugué, O., Delcaillau, B., Bessin, P., Benabdelouahed, M., Authemayou, C., Husson, L., Regard, V., Menier, D., and Pinel, B.: Neogene-Quaternary slow coastal uplift of Western Europe through the perspective of sequences of strandlines from the Cotentin Peninsula (Normandy, France), Geomorphology, 303, 338–356, https://doi.org/10.1016/j.geomorph.2017.11.021, 2018.
Peltier, W. R.: Glacial isostatic adjustment: physical models and observational constraints, Rep. Prog. Phys., 85, 096801, https://doi.org/10.1088/1361-6633/ac805b, 2022.
Polyak, V. J., Onac, B. P., Fornós, J. J., Hay, C., Asmerom, Y., Dorale, J. A., Ginés, J., Tuccimei, P., and Ginés, A.: A highly resolved record of relative sea level in the western Mediterranean Sea during the last interglacial period, Nat. Geosci., 11, 860–864, https://doi.org/10.1038/s41561-018-0222-5, 2018.
Portenga, E. W. and Bierman, P. R.: Understanding Earth's eroding surface with 10Be, GSA Today, 21, 4–10, https://doi.org/10.1130/G111A.1, 2011.
Raymo, M. E. and Mitrovica, J. X.: Collapse of polar ice sheets during the stage 11 interglacial, Nature, 483, 453–456, https://doi.org/10.1038/nature10891, 2012.
Ruszkiczay-Rüdiger, Z., Neuhuber, S., Braucher, R., Lachner, J., Steier, P., Wieser, A., Braun, M., ASTER Team, Bourlès, D., Aumaître, G., and Keddadouche, K.: Comparison and performance of two cosmogenic nuclide sample preparation procedures of in situ produced 10Be and 26Al, J. Radioanal. Nucl. Chem., 329, 1523–1536, https://doi.org/10.1007/s10967-021-07916-4, 2021.
Schaller, M., Von Blanckenburg, F., Veldkamp, A., Tebbens, L. A., Hovius, N., and Kubik, P. W.: A 30 000 yr record of erosion rates from cosmogenic 10Be in Middle European river terraces, Earth Planet. Sci. Lett., 204, 307–320, https://doi.org/10.1016/S0012-821X(02)00951-2, 2002.
Siddall, M., Chappell, J., and Potter, E.-K.: Eustatic sea level during past interglacials, in: Developments in Quaternary Sciences, Vol. 7, Elsevier, 75–92, https://doi.org/10.1016/S1571-0866(07)80032-7, 2007.
Steer, P., Simoes, M., Cattin, R., and Shyu, J. B. H.: Erosion influences the seismicity of active thrust faults, Nat. Commun., 5, 5564, https://doi.org/10.1038/ncomms6564, 2014.
Stephenson, R. and Lambeck, K.: Erosion-isostatic rebound models for uplift: an application to south-eastern Australia, Geophys. J. Int., 82, 31–55, https://doi.org/10.1111/j.1365-246X.1985.tb05127.x, 1985.
Stone, J. O.: Air pressure and cosmogenic isotope production, J. Geophys. Res.-Solid Earth, 105, 23753–23759, https://doi.org/10.1029/2000JB900181, 2000.
Summerfield, M. A. and Hulton, N. J.: Natural controls of fluvial denudation rates in major world drainage basins, J. Geophys. Res.-Solid Earth, 99, 13871–13883, https://doi.org/10.1029/94JB00715, 1994.
Tesauro, M., Kaban, M. K., and Cloetingh, S. A. P. L.: How rigid is Europe's lithosphere?, Geophys. Res. Lett., 36, 6, https://doi.org/10.1029/2009GL039229, 2009.
Toucanne, S., Zaragosi, S., Bourillet, J. F., Cremer, M., Eynaud, F., Van Vliet-Lanoë, B., Penaud, A., Fontanier, C., Turon, J. L., and Cortijo, E.: Timing of massive `Fleuve Manche' discharges over the last 350 kyr: insights into the European ice-sheet oscillations and the European drainage network from MIS 10 to 2, Quaternary Sci. Rev., 28, 1238–1256, https://doi.org/10.1016/j.quascirev.2009.01.006, 2009.
Toucanne, S., Zaragosi, S., Bourillet, J.-F., Marieu, V., Cremer, M., Kageyama, M., Van Vliet-Lanoë, B., Eynaud, F., Turon, J.-L., and Gibbard, P. L.: The first estimation of Fleuve Manche palaeoriver discharge during the last deglaciation: Evidence for Fennoscandian ice sheet meltwater flow in the English Channel ca 20–18 ka ago, Earth Planet. Sci. Lett., 290, 459–473, https://doi.org/10.1016/j.epsl.2009.12.050, 2010.
van Dongen, R., Scherler, D., Wittmann, H., and von Blanckenburg, F.: Cosmogenic 10Be in river sediment: where grain size matters and why, Earth Surf. Dynam., 7, 393–410, 2019.
Vernant, P., Hivert, F., Chéry, J., Steer, P., Cattin, R., and Rigo, A.: Erosion-induced isostatic rebound triggers extension in low convergent mountain ranges, Geology, 41, 467–470, https://doi.org/10.1130/G33942.1, 2013.
Von Blanckenburg, F.: The control mechanisms of erosion and weathering at basin scale from cosmogenic nuclides in river sediment, Earth Planet. Sci. Lett., 237, 462–479, https://doi.org/10.1016/j.epsl.2005.06.030, 2005.
Westaway, R., Maddy, D., and Bridgland, D.: Flow in the lower continental crust as a mechanism for the Quaternary uplift of south-east England: constraints from the Thames terrace record, Quaternary Sci. Rev., 21, 559–603, https://doi.org/10.1016/S0277-3791(01)00040-3, 2002.
Wickert, A. D.: Open-source modular solutions for flexural isostasy: gFlex v1.0, Geosci. Model Dev., 9, 997–1017, https://doi.org/10.5194/gmd-9-997-2016, 2016 (code available at: https://github.com/awickert/gFlex, last access: 8 January 2024).
- Abstract
- Introduction
- Geological and geomorphological setting
- Denudation rates from terrestrial cosmogenic nuclide
- Regional models of denudation and sedimentation rates
- Uplift rates driven by surface mass mobilization
- Discussion
- Conclusions
- Data availability
- Author contributions
- Competing interests
- Disclaimer
- Acknowledgements
- Financial support
- Review statement
- References
- Supplement