the Creative Commons Attribution 4.0 License.
the Creative Commons Attribution 4.0 License.
 | 30 Jul 2025
Localised geomorphic response to channel-spanning leaky wooden dams
Joshua M. Wolstenholme
Christopher J. Skinner
David Milan
Robert E. Thomas
Daniel R. Parsons
The introduction of leaky wooden dams (or engineered log jams or LDs) into river corridors in low-order steams in upper catchments has recently become a popular form of natural flood management, particularly in NW Europe. LDs are designed to emulate processes such as those of naturally occurring large wood in river systems, aiming to reduce downstream flood risk through the attenuation of water during higher flows, decreasing in-channel velocities and increasing channel–floodplain connectivity. LDs effectively act as channel roughness agents that disrupt the fluvial and hydrological regime and attenuate the peaks in high river flows, thus mitigating downstream flood risk. Despite their widespread installation, there is a paucity of data and understanding concerning the longer-term fluvial geomorphological response to LD installation. Here we present a detailed quantification of both the geomorphic and sedimentary response to the installation of two LDs in a catchment in Dalby Forest (North Yorkshire, UK) using high-resolution terrestrial laser scanning and detailed bathymetric surveys over a 2.5-year period. This period included two major storms with a recurrence interval of 3.9 and 3.4 years, and a further four smaller storm events (1.22–2.3 years). Results show that when LDs are engaged by the river flow, local topographic complexity significantly increases as sediment transport pathways are perturbed. The flow field complexity additionally changes the channel bed grain-size distribution, with trends of fining upstream and coarsening downstream of the structure observed. The LD was also observed to generate scour pools downstream of the structure, and coarsen the armour layer through the winnowing of fines. Monthly observations reveal that channel topography and bed sediment patterns self-organise in response to sustained low flows and are perturbed by higher flow events. The findings highlight how frequent monitoring of different LD designs and structures under various flow conditions is vital to understand their longer-term impacts. Moreover, it is critical that such observations are extended over longer-term periods in order to fully assess the efficacy of the structures as the channels respond to installations and the evolution of the geomorphic response. Finally, additional work is also required to better consider how individual LDs influence local geomorphology and alter sediment transport connectivity throughout the catchment.
- Article
(4171 KB) - Full-text XML
-
Supplement
(1260 KB) - BibTeX
- EndNote


Large wood, commonly defined as > 0.1 m in diameter and > 1 m in length (Comiti et al., 2016), is used globally to manage flood risk through reducing stream velocities (Abbe and Montgomery, 2003; Grabowski et al., 2019; Lo et al., 2021; Wohl, 2015; Wohl et al., 2016; Wohl and Scott, 2017); reintroduction of wood to the river channel is a popular form of natural flood management (NFM), accounting for approximately 20 % of UK projects focused on habitat creation, river engineering, and downstream flood hazard reduction (Cashman et al., 2018; Grabowski et al., 2019; Gurnell, 2012; Ruiz-Villanueva et al., 2019; Wohl, 2019). Large wood can drastically increase fluvial complexity (Wohl et al., 2019) through altering the local hydraulic regime whilst being resistant to erosion and providing storage space for water through decreasing longitudinal connectivity (Gurnell et al., 2018). Large wood can also temporarily store water both within the channel (online) and on the floodplain (offline), and it is through this retardation of the flow that wood can provide a suppression of flood peaks (Dadson et al., 2017; Gurnell et al., 2018). Natural riverine large wood in industrialised countries, especially Britain, is relatively rare, especially in channels wider than 10 m, and others have shown that it is important to emulate and support the recruitment of natural wood where appropriate (Gurnell et al., 2018, 2002). Therefore, instream structures are now often constructed to emulate processes caused by natural wood, and to aid wood recruitment when there is a lack of natural large wood in the system (Addy and Wilkinson, 2016; Dixon et al., 2018).
Large wood causes significant alterations to hydraulics through increasing roughness and obstructing flow (Gippel, 1995), reducing stream velocities (Gallisdorfer et al., 2014; Schalko et al., 2021) and sediment transport both in suspension (Parker et al., 2017; Walsh et al., 2020) and as bedload (Clark et al., 2022; Spreitzer et al., 2021). The formation of underflow and plunge pools is often observed both immediately downstream of natural and introduced large wood (Buffington et al., 2002; Larson et al., 2001; Montgomery et al., 1995; Wohl and Scott, 2017), increasing geomorphic heterogeneity and providing more diverse habitats (Hafs et al., 2014; Klaar et al., 2011). Large wood can also both induce and limit bank erosion, depending on specific interactions, particularly where flow is concentrated to one side of the channel (Buffington et al., 2002). Lateral floodplain connectivity can also be increased by the presence of large wood and its mobility, facilitating the transition from single-thread channels to anastomosing or anabranching systems (Bertoldi et al., 2014; Wohl, 2013), which can lead to improved ecological conditions (Lo et al., 2024; Roni et al., 2015; Wohl, 2019).
Leaky wooden dams (or engineered log jams, herein referred to as LDs) are a type of NFM intervention that are often installed in sequences in upper catchments in permanent or ephemeral streams (Wren et al., 2022) to emulate the potential benefits of large wood. The overarching aim of LDs is to store greater volumes of water in the upper catchment and then slowly release that water over time, extending and flattening the downstream flood peak through increasing flooding locally in the immediate area around the LDs (Roberts et al., 2023). LDs effectively increase channel roughness and reduce flow conveyance, while increasing floodplain connectivity and decreasing longitudinal connectivity, similar to natural wood (Gippel, 1995; Roberts et al., 2023; Wohl and Beckman, 2014; Wren et al., 2022). LDs are often installed with a vertical gap at the river bed to allow base-level flows to pass unimpeded, enabling the movement of wildlife and reducing the likelihood of blockages (Dodd et al., 2016). The presence of a gap also increases flow and habitat diversity, whilst increasing the potential for geomorphic heterogeneity through the development of pool and riffle sequences, as well as sediment storage upstream of the LD (Follett et al., 2021; Lo et al., 2022; Wohl et al., 2016) and overall sediment dis-connectivity (Burgess-Gamble et al., 2017; Grabowski et al., 2019; Poeppl et al., 2023; Wenzel et al., 2014; Wren et al., 2022).
Despite a range of previous research concerned with the impacts of large wood on river systems (e.g. Abbe and Montgomery, 2003; Wohl et al., 2019), there has been little field research into the influence of channel-spanning LDs on local geomorphology, with only one field-based study specifically focusing on LDs and their impacts. Lo et al. (2022) used topographic and bathymetric observations to assess the impact of the LDs on bank erosion, sediment storage, pool formation, and LD instability. Although grain-size distribution (herein GSD) was not reported, the authors stated that D50 was in the cobble range (64–256 mm), but not how this evolved over time. Despite the popularity of installing LDs for flood risk management across the UK, the main limitation of this research (as identified by the authors) is the lack of studies in different contexts (e.g. geology, catchment morphometries, drainage densities, and land use). There is thus a knowledge gap that requires a more robust evidence base, including evaluations of other LD designs in different geological and climate regions, particularly in regard to understanding longer-term impacts and catchment scale responses to installations of LDs over a range of time and space scales.
A key unknown is how the GSD around LD structures evolves through time, and potential controls this may have on channel roughness. Understanding how the GSD evolves is an important component for numerical modelling. Skinner et al. (2018) performed a global sensitivity analysis of the CAESAR-Lisflood model using the Morris (1991) method, and found that GSD is the fourth most influential parameter influencing sediment efflux (out of 15); the top 3 were the choice of sediment transport law, slope for edge cells, and vegetation critical shear stress. Additionally, Durafour et al. (2015, cited by Lepesqueur et al., 2019) identified that modelling with a uniform grain size can lead to an overprediction of fluvial sediment flux. Therefore, GSD is a critical component of numerical modelling and it is imperative that it is correctly quantified and implemented.
In the present paper, we explore the influence of two LD designs on local geomorphological changes over time and build on recent research (Lo et al., 2022) using terrestrial laser scanning and bathymetric surveys to monitor topographic change. Monitoring occurred for 2.5 years and included two storms that had an estimated recurrence interval (herein RI) of 3.9 and 3.4 years, and a further four events where the RI was 1.22–2.3. We additionally examine and monitor changes to GSDs around installed LDs. The objectives of this paper are to understand the influence of two different LD structures on the directionality and magnitude of geomorphic change around a single structure (herein referred to as the unit-scale). Furthermore, we aim to highlight geomorphic variability induced by the structures, as well as the importance of frequent monitoring to accurately assess long-term impacts at the local, unit-scale.
2.1 Study site
Dalby Forest is a commercial woodland located within the North York Moors National Park, UK, maintained by Forestry England. In January 2020, 14 in-channel LDs were installed in Staindale Beck as part of the Derwent Rivers NFM demonstration project (Lavelle et al., 2019). Staindale Beck is a second-order gravel-bed stream with a gradient of 0.011 m m−1 that drains a 12 km2 catchment with elevation ranging from 107–240 mAOD (metres Above Ordnance Datum; Fig. 1b). The upstream geology is composed of a mixture of mudstones and sandstones, with some Holocene alluvium (clays, silts, sands, and gravels).
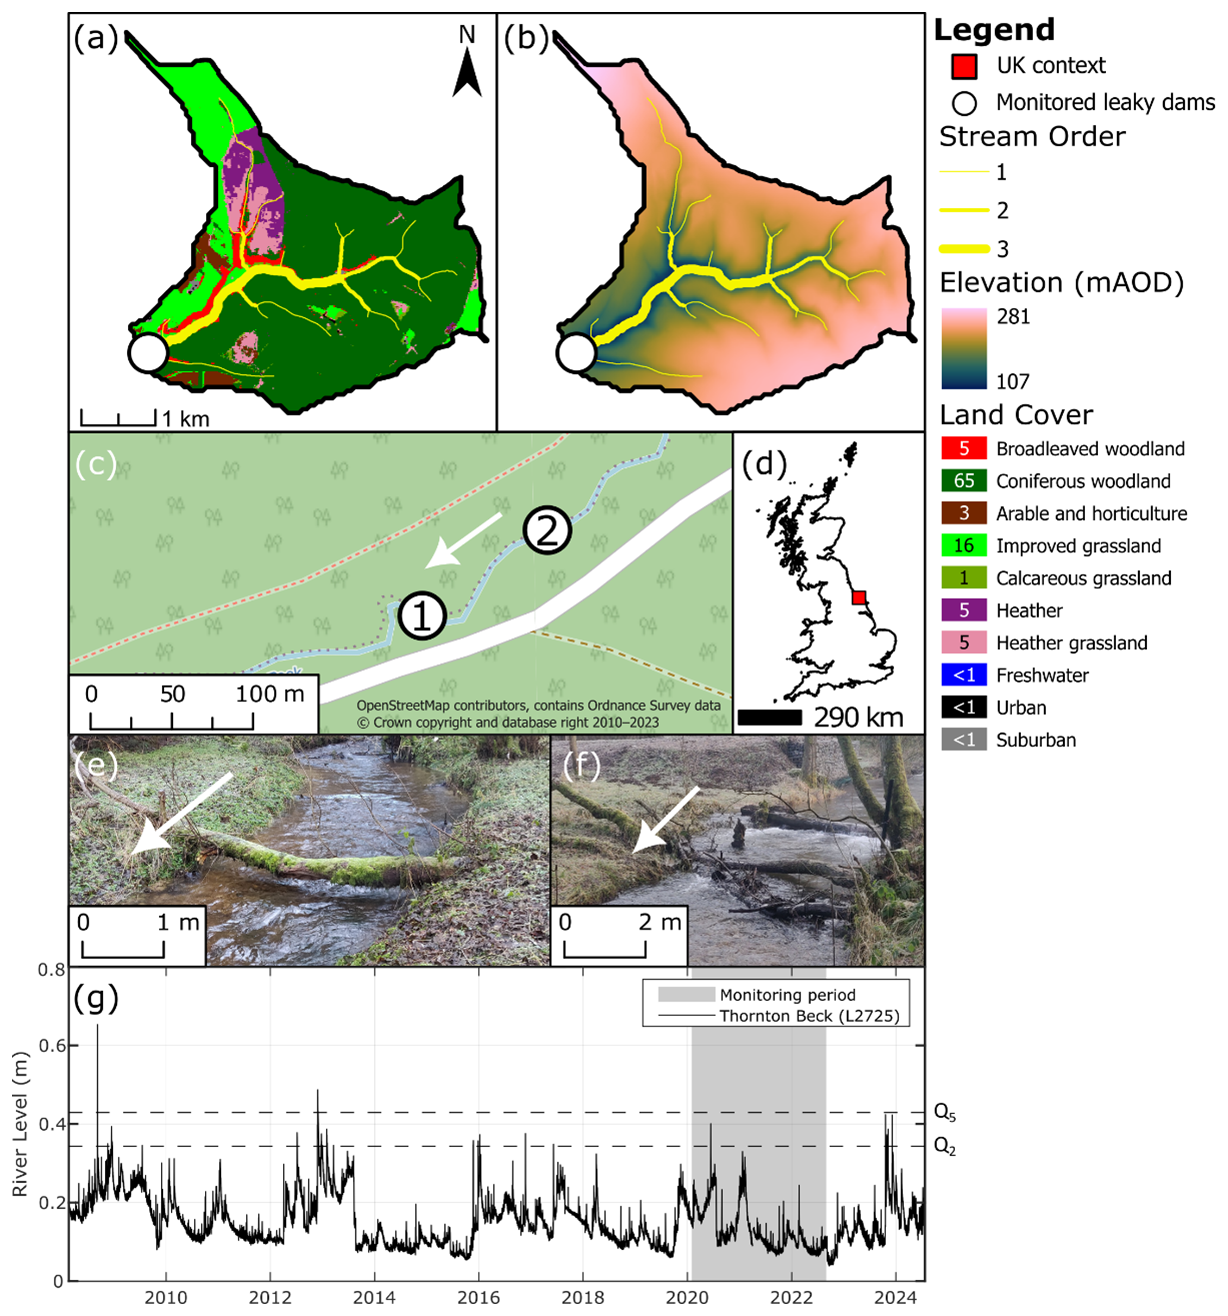
Figure 1Location of the studied LDs in relation to the Dalby Forest catchment. (a) 2021 land cover map with percentage cover shown in the legend (Marston et al., 2022). (b) Stream network generated from terrain data showing Strahler stream order and elevation (Ordnance Survey, 2020). Note the same scale as panel (a). (c) Location of LD1 and LD2, with the flow direction denoted by a white arrow. (d) UK context for the site location. (e, f) LD1 and LD2, respectively, with the flow direction denoted by a white arrow. (g) River-level record 2008–2024 for Thornton Beck, Thornton Le Dale (Grid Reference: SE 83681 83418; Station ID: L2725), approximately 7 km downstream of the study area (from the Environment Agency) including the estimated return period (Qn), as described in the Supplement.
The catchment is characterised by woodland (70 %), with grassland (17 %) and heather (10 %) being the other principal land use types (Marston et al., 2022), as shown in Fig. 1a. It has a mean annual precipitation of 980 mm, with monthly averages ranging from 55.6–118.9 mm (1991–2020 mean, Fylingdales weather station at 262 mAOD, 11.2 km NE; Met Office, 2020). The catchment contains 17 km of river corridor, with a mixture of first- (9.9 km), second- (3.6 km) and third-order (3.5 km) streams, following the Strahler (1957) stream-order notation (Fig. 1a, b). The channels are between 1 and 4 m wide, widening towards the catchment outlet.
2.1.1 Leaky dam structures
LDs were installed in late 2019 through live felling and anchoring, using wooden stakes or embedding into a channel bank and being placed across the full width of the channel. Two of the 14 dams (referred to as LD1 and LD2 herein) were monitored since installation (including a pre-installation baseline survey undertaken in July 2019). Key LD metrics are reported in Table 1.
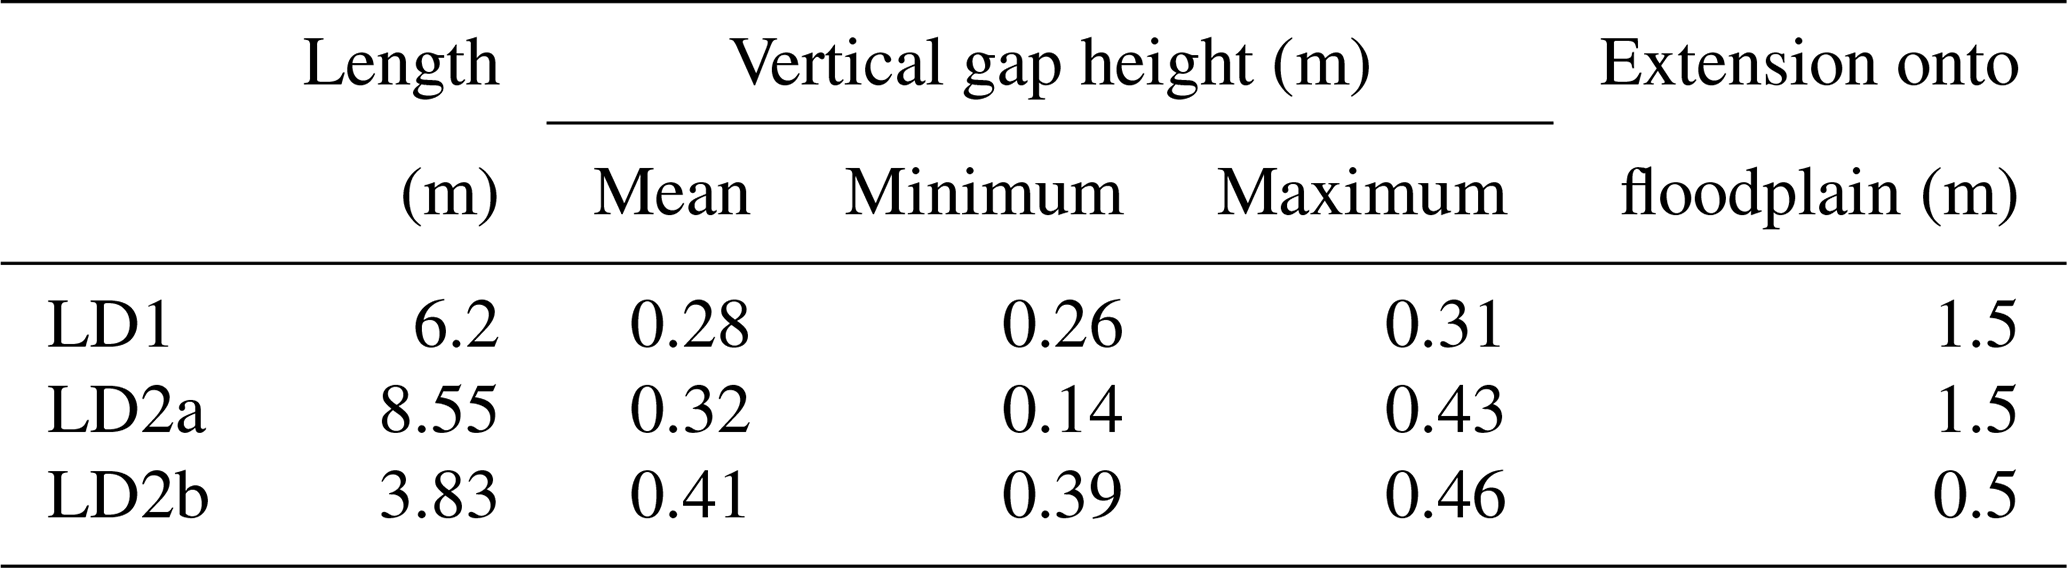
LD1 (Fig. 1e) is a channel-spanning LD anchored in situ with a wooden stake on the true right bank to reduce the likelihood of displacement during high flows; it was embedded into the surface on the true left bank. The channel was 2.7 m wide where the LD was installed. The structure was comprised of a single log which was fully separated from a tree trunk, with some thin branches attached facing upwards. Since this LD is fully channel spanning and thus does not interact with baseflow, it is a “Type 1” LD (fully channel spanning, not interacting with baseflows) following the classification of Lo et al. (2021).
LD2 (Fig. 1f) was felled and left in situ, remaining attached to its stump to enable growth (a “living” LD). The LD itself was composed of two sub-sections, with the furthest downstream (LD2a) spanning a 3.85 m wide channel. The structure was partially submerged at the time of installation. LD2a was classified as a “Type 2” LD (fully channel spanning, interacting with baseflows but not touching the stream bed; Lo et al., 2021). LD2 was more complex than LD1 due to the presence of a pre-existing walkway that formed a secondary sub-structure LD2b that was fixed with wooden anchors. LD2b was a “Type 1” LD (fully channel spanning, not interacting with baseflows at all; Lo et al. (2021)). LD2b was installed above the average water depth and spanned a 3.25 m wide channel.
2.1.2 Hydrological summary
In lieu of long-term flow data, two Environment Agency–managed river-level monitoring stations (L2725 and F25110) that have been recording river levels since February 2008 and July 2003, respectively, were used to perform flow frequency analysis to characterise the hydrological history of the catchment, as described in the Supplement and summarised here. L2725 is located approximately 7 km downstream of the study area on Thornton Beck in Thornton Le Dale (Fig. 1g) and F25110 in an adjacent catchment on Levisham Beck at Levisham Mill (see Fig. S1 in the Supplement).
Table 2Summary of key storm events recorded by L2725 and F25110. The flood of record for each gauge during the monitoring period is denoted by ∗.
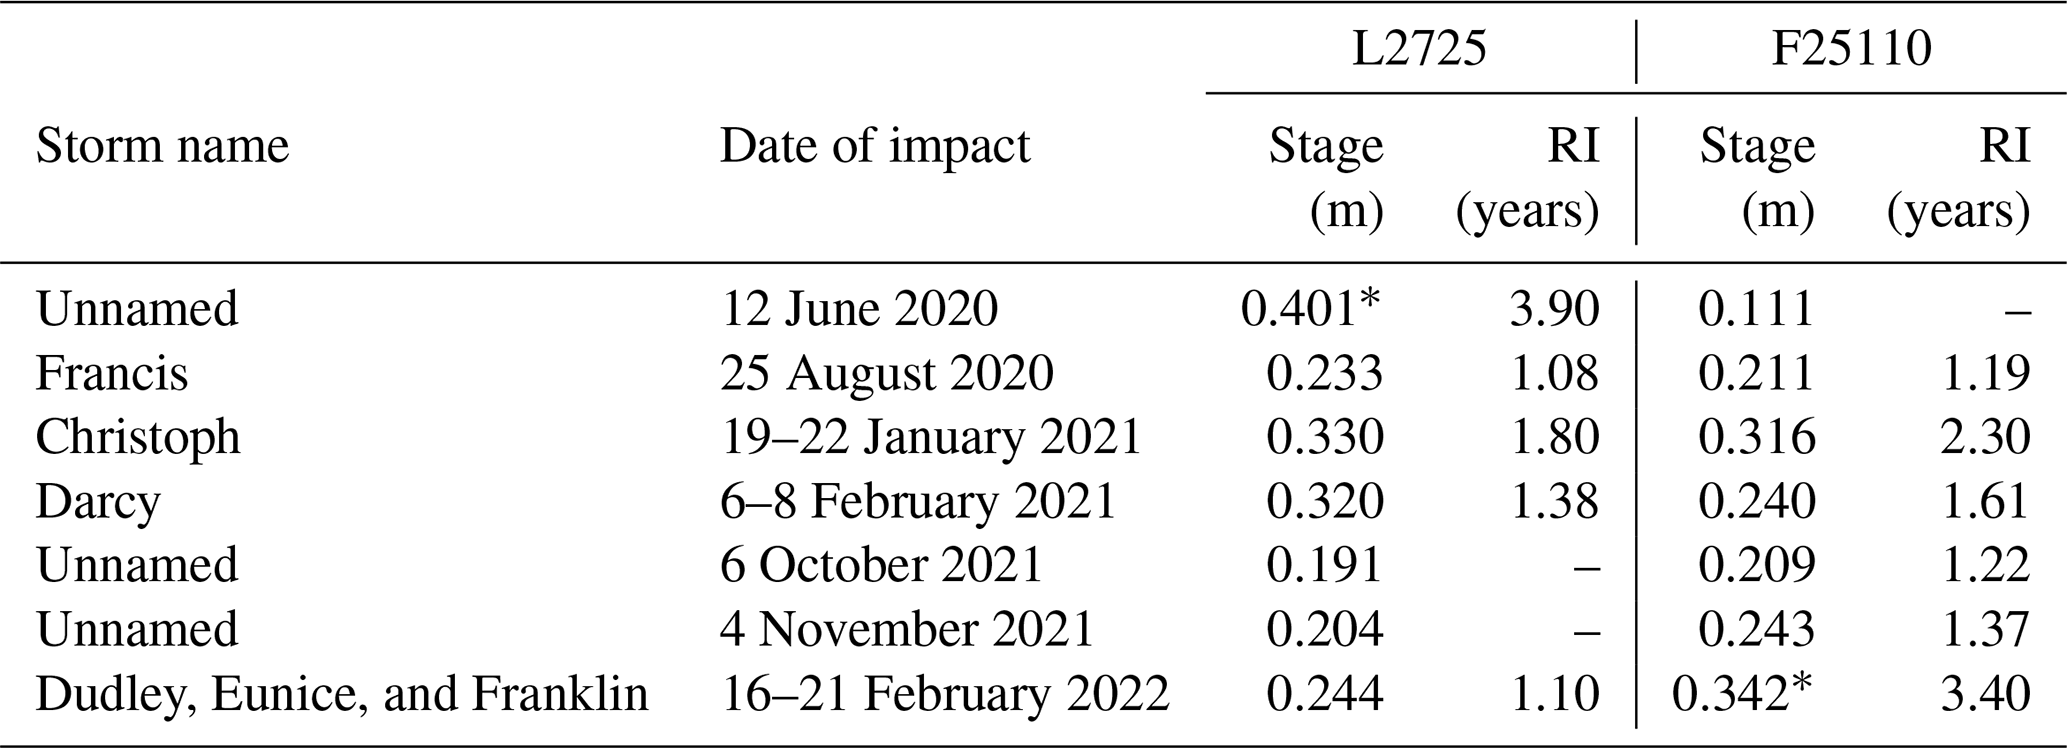
Based on 21 years of stage data, the maximum mean annual stage was 0.358 m for the larger L2725 catchment and 0.305 m for the paired catchment F25110. The flow frequency analysis revealed the approximate Q2 flood requires the stage to reach 0.343 and 0.303 m for L2725 and F25110, respectively, and the Q5 is reached at stages of 0.429 and 0.377 m, respectively (see Fig. S2). Due to uncertainties in the data at F25110 when the stage exceeds 0.4 m, leading to out of bank flows (Hydrology NE Environment Agency, 2024), larger RIs are not reported. The flood of record differs for each catchment; L2725 achieved a level of 0.401 m (RI, = 3.9 years) on 12 June 2020, following 23.6 mm of rain in 24 h (captured at the Brown Howe rain gauge [036225], 7.5 km NE of field site). The flood of record for F25110 on 20 February 2022, following the named storms Dudley, Eunice, and Franklin (16–21 February) peaked with a stage of 0.342 m (RI = 3.4 years). Other peaks in the flow data are reported in Table 2.
Further to individual storm events resulting in peak stages, the rainfall anomaly for the winter of 2020/21 (December 2020–February 2021) was in excess of 170 % compared to the 1991–2020 average for the study area and was one of the top 10 wettest years on record (Kendon et al., 2022).
2.2 Water depth
Water depth was sampled at 5-min intervals using four absolute pressure transducers (Solinst Levelogger Edge M5) distributed approximately 5 m upstream and downstream of LD1 on suitable anchor points. Loggers were installed 5 m downstream of LD2a, with a second pressure transducer located between LD2a and LD2b due to the lack of suitable anchor points. Each pressure transducer was housed in a stilling well to dampen potential noise induced through waves. A Solinst Barologger was also installed to provide atmospheric compensation for the sensors. Data were downloaded approximately every 3 months to ensure a continuous record. The sensors were reinstalled after each download, with manual measurements of the river depth taken to provide any necessary corrections for water surface elevations to be mapped to depth and thus account for changes resultant from bedload transport, wood collapse, or other disturbance. Individual data records were merged in MATLAB and any gaps caused by the download period were filled using linear interpolation to ensure a continuous record. Noise not eliminated by the stilling well was reduced using a wavelet denoising algorithm (after Lockwood et al., 2022) using a fixed “minimax” threshold to minimise possible signal loss without removing peaks in the signal.
2.3 Grain-size distribution
The intermediate axis of, on average, 100 pebbles was measured at each ∼ 3 month visit to provide an unbiased estimate of sediment distribution (Green, 2003; Wolman, 1954). A random walk approach was used within 5 m of the LD to collect two sample sets (upstream and downstream) at both sites. Measurements smaller than 0.5 mm were grouped into a single class in the field. D16, D50, and D84 were extracted by creating a cumulative density function (CDF), where grain size is represented by the average recorded value in each class (except for fine-grained measurements). Using GSD tools in RStudio (Eaton et al., 2019), the estimated grain size and upper and lower uncertainty bounds for each of the grain-size metrics were generated through equal area approximation of the binomial distribution. The final grain sizes were obtained through interpolation of the binned CDF data, generated by normalising the data relative to the number of records. The 95 % confidence interval was used to calculate uncertainty.
2.4 Topography and bathymetry
Topography was captured using a terrestrial laser scanner (Topcon GLS-2000, herein referred to as TLS) referenced in a local coordinate system using a total station (Topcon OS-103, herein referred as TS) to ensure consistency between scans. At each LD, a minimum of two TLS scans were captured with a point density of 6.3 mm at 10 m, recording only the last return pulse to reduce the noise caused by vegetation. To avoid obstructing objects and to reduce the potential of shadowing (Heritage and Hetherington, 2007), the TLS was placed on the channel bank approximately 5 m upstream and 10 m downstream of each LD. Scan positions were registered using a minimum of three target tie points distributed evenly throughout the reach, and then georeferenced to the local coordinate system in the Topcon ScanMaster (v.3.0.7.4) to create a single referenced point cloud for each survey date. Bathymetry was captured using the TS through approximately 1.0 m point sampling broadly equally spaced but favouring breaks in slope and channel edges up- and downstream of the LDs, also in the local coordinate system (Heritage et al., 2009). See the Supplement for detailed information on data processing and error quantification.
2.5 Change analysis
DEMs of difference (DoDs) were created by subtracting a reference DEM, in this case the baseline survey in July 2019, from a subsequent DEM, creating a localised elevation change model. To identify significant change in the DoD, they can be thresholded to identify stable parts of the landscape and remove these from the change analysis without requiring full error propagation, producing a level of detection (LoD) where there is significant elevation change (Wheaton et al., 2010; Milan et al., 2011). Thresholding can be applied globally across the DEM or spatially quantified (Milan et al., 2011; Milan, 2012). The former is more aggressive and likely to remove areas that are unstable, while the latter requires a higher point survey density (Milan et al., 2011). Here, the global method was used due to low point density for the TS data. To calculate the LoD, the critical threshold error, Ucrit, was calculated through propagating survey errors by combining the RMSE of each DEM, as shown in Eq. (1).
where σDEM1 and σDEM2 are the standard deviation of the residuals and t is the critical t value for the chosen confidence level (Milan et al., 2011). The t value was set to the 95 % confidence limit where t≥1.96; 2σ (Brasington et al., 2003; Milan et al., 2011). Anderson (2019) identified that thresholding could introduce bias into net change estimates. Therefore two data sets were generated for analysis: one that had been thresholded to evaluate significant erosion and deposition throughout time and space, and another that had not been thresholded that was used to evaluate net change.
A visual inspection of the TLS point clouds following post-processing revealed that a substantial amount of low-lying vegetation remained after cleaning the point cloud that proved impractical to remove. Cloud-to-cloud analysis and DoDs were therefore inappropriate due to the volume of vegetation present for the TLS derived data. To mitigate the potential loss of valuable information, the planform change was calculated through extracting horizontal profiles at the same elevation for the July 2019 and April 2022 surveys to identify areas of erosion relative to the LD.
Point clouds were detrended by fitting a plane and applying the inverse transformation using CloudCompare. The clouds were then filtered to a local elevation where there was minimum vegetation across both scans. Bank profiles were extracted manually – through point picking – terminating equidistant to one another perpendicular to the flow. The bank profiles were then compared in MATLAB using Gauss's shoelace method (Braden, 1986). The shoelace method returns the area of a polygon through calculating the total of matrix determinants of subsequent coordinates progressing in the same direction (clockwise or anti-clockwise), finishing at the start coordinates, as shown in Eq. (2).
where
is the determinant of the coordinate pairs (xn, xn) and (xn+1, yn+1). Often the formula uses the absolute of the determinant of the coordinate pairs. However, here the sign of the area indicates erosion (negative) and deposition (positive).
3.1 Water depth
The average water depth at site 1 was 0.26 and 0.21 m (up- and downstream, respectively). The bankfull depth was 0.58 m. However, the flow did not engage with LD1 at this site, nor did the channel exceed its banks during the monitoring period. Note that the reported depth values are higher than the LD1 vertical gap size due to their installation locations. The maximum depth was 0.54 m upstream of LD1 and 0.51 m downstream during Storm Christoph (21 January 2021; estimated RI of 2.3 years). In contrast, the average water depth at site 2 was 0.29 and 0.17 m (up- and downstream, respectively). The bankfull depth was 0.44 m and was exceeded upstream for a total of 69 d (7.6 %) of the monitoring period, but not downstream. The true right bank became partially inundated and the flow outflanked LD2b, resulting in increased scour immediately downstream of LD2b, limiting the maximum capacity of the structure during these bankfull periods. The maximum recorded depth was 0.67 m upstream and 0.44 m downstream during Storm Darcy (7 February 2021), with a RI of 1.61 years. Seven storm events occurred during the monitoring period, denoted by red arrows in Fig. 2 linked to key storms identified in Table 1, that resulted in near exceedance or exceedance of the bankfull stage at site 2, in addition to increased average water depth throughout winter 2020/21 observed at both sites.
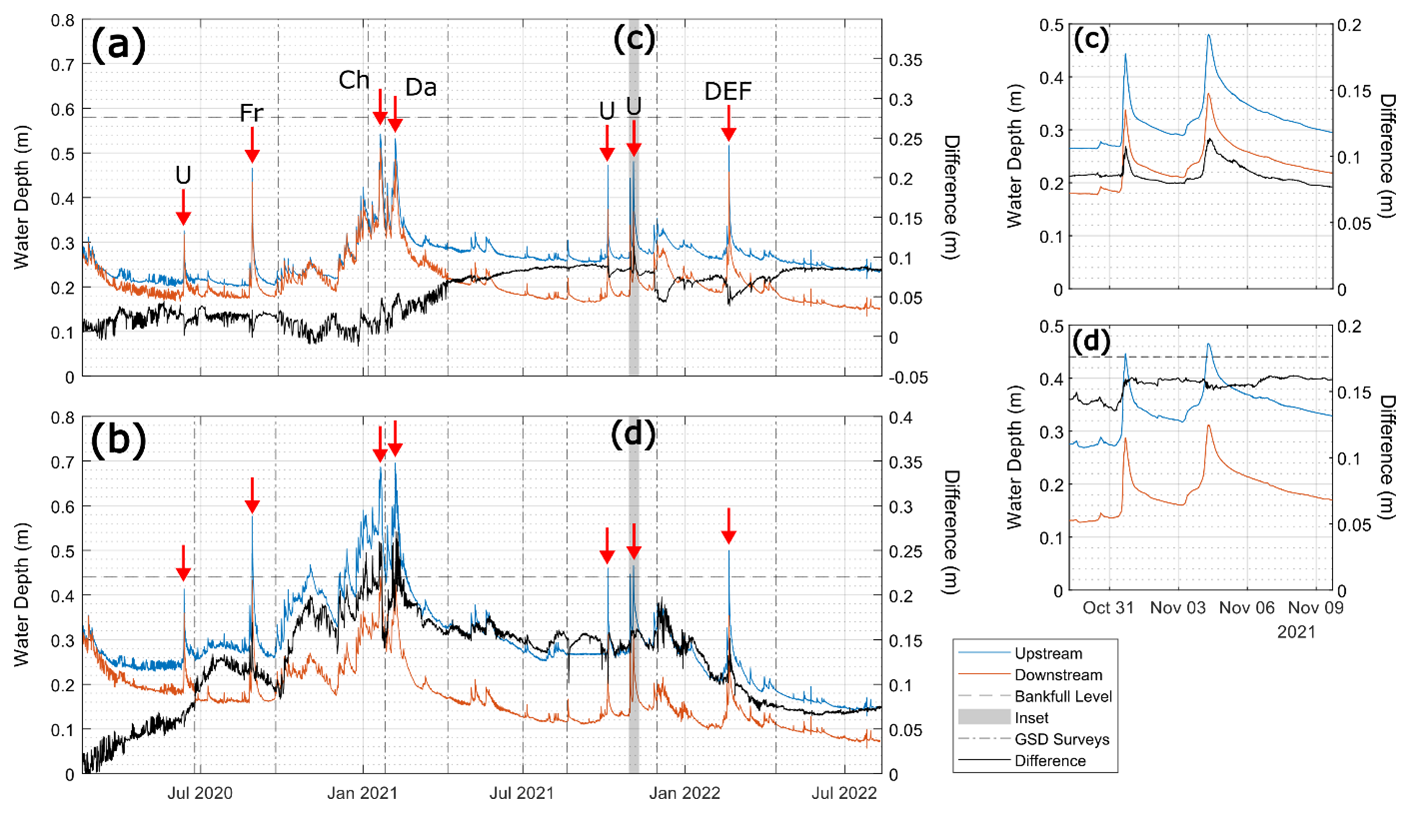
Figure 2Temporal variations of water depth for LD1 (a) and LD2 (b) with differences between upstream and downstream recordings shown, as well as key peaks and storms (U = unnamed, Fr = Francis, Ch = Christoph, Da = Darcy, DEF = Dudley, Eunice, and Franklin). Also shown are the dates of the GSD surveys and bankfull level. Note the different secondary y-axis scale. Panels (c) and (d) show variations in the water depth throughout time between the two sites.
Initially, water depths at LD1 covaried, averaging 0.21 m downstream and 0.22 m upstream between February 2020 and November 2020, increasing to 0.31 and 0.32 m, respectively, until February 2021, when the upstream depth diverged from the downstream. Throughout the monitoring period, there was an average difference of 0.05 m and a maximum difference of 0.11 m between the two depths, with the upstream depth ranging from 0.20 to 0.54 m, and the downstream depth ranging from 0.13 to 0.51 m.
In contrast, the upstream and downstream water depths quickly diverged at LD2, with an average difference of 0.12 m between the upstream and downstream depths. The downstream peaks were generally shorter in duration than the upstream (Fig. 2b) due to water being stored upstream and slowly released, extending the peak. Additionally, once the LD was fully engaged with the river, there was a near constant difference between the downstream and upstream depths of up to 0.27 m. This difference decreased to less than 0.10 m following the last notable storms of the monitoring record in February 2022 (Dudley, Eunice, and Franklin). The upstream and downstream depths ranged from 0.13 to 0.70 m and from 0.06 to 0.44 m, respectively.
3.2 Grain-size distribution
When comparing the upstream and downstream GSDs, except for an initial increase of the sand and fine gravel fractions upstream of the structure immediately following installation and until September 2020, the between-event variability was greater than any consistent change to the GSD at LD1 during the monitoring period, although there is some evidence of slight coarsening over the longer record (Fig. 3a, b). In contrast, fine sediment was deposited upstream and scoured downstream at LD2. This was reflected in a consistent fining trend upstream of the structure post-installation, resulting in a decrease of D50 from 10 to < 1 mm (Fig. 3c) and a consistent coarsening trend downstream of the structure, resulting in an increase of D50 from 5 to 30 mm (Fig. 3d).
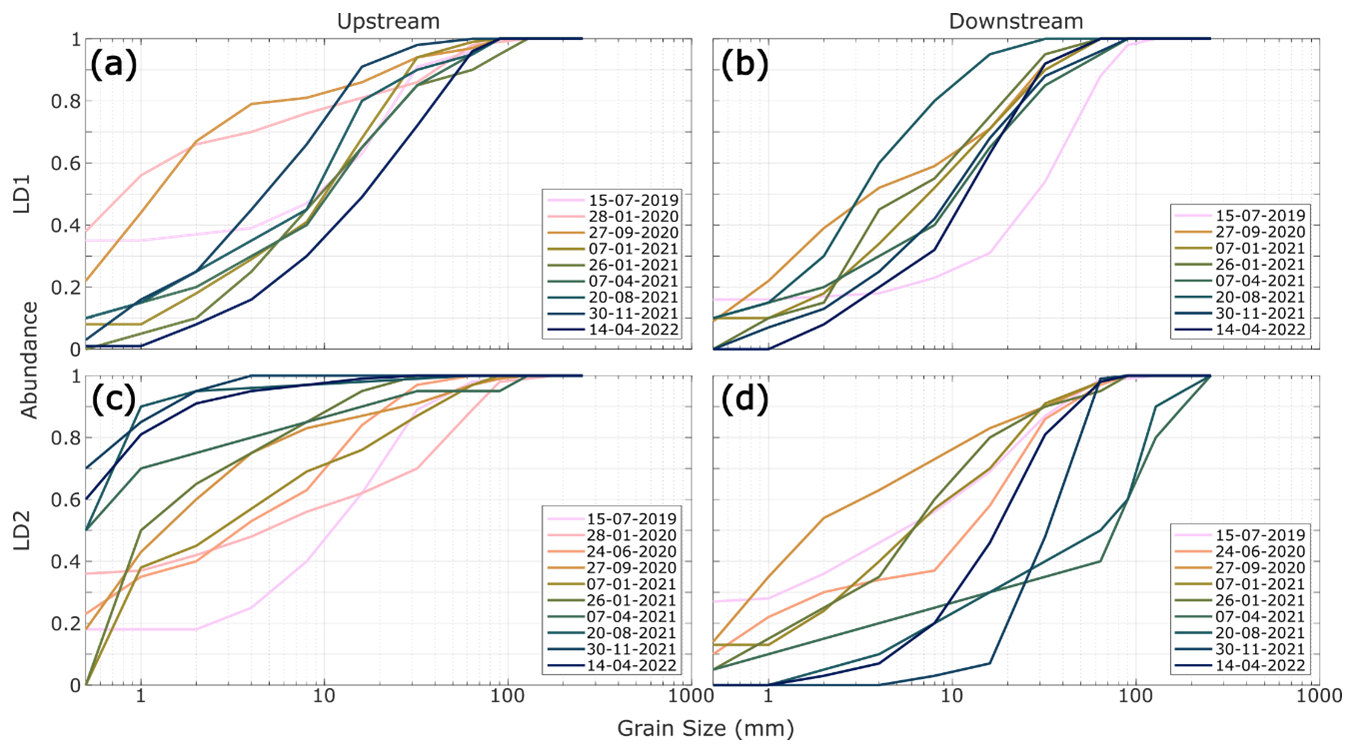
Figure 3Cumulative density functions of the Wolman pebble count data at LD1 (a, b) and LD2 (c, d). The sites are separated into upstream (a, c) and downstream (b, d) observations.
D50 and D84 highlight the variability between the two sites as well as upstream and downstream of the LD structures, as shown in Fig. 4. LD1 showed little difference for all metrics, with upstream and downstream matching closely throughout the monitoring period, often within the calculated 95 % confidence interval of the measurements themselves. As such, this aligns with the more detailed GSD overview presented in Fig. 3. In contrast, the metrics for LD2 diverge notably from January 2021 onwards following the wet 2020/21 winter and storms Christoph (RI = 2.3 years) and Darcy (RI = 1.6 years), with downstream coarsening and upstream fining. There was a maximum range of 59 mm for D50 in April 2021, 98 mm for D84 in August 2021, and 10 mm for D16 in November 2021. At the end of the monitoring period, all the grain-size metrics converged, most notably upstream of LD2, where D84 coarsened to 5.5 mm following winter 2021/22, while D16 and D50 downstream of the LD both fined to < 1 and 5 mm, respectively, from peaks of 10.5 and 60 mm.
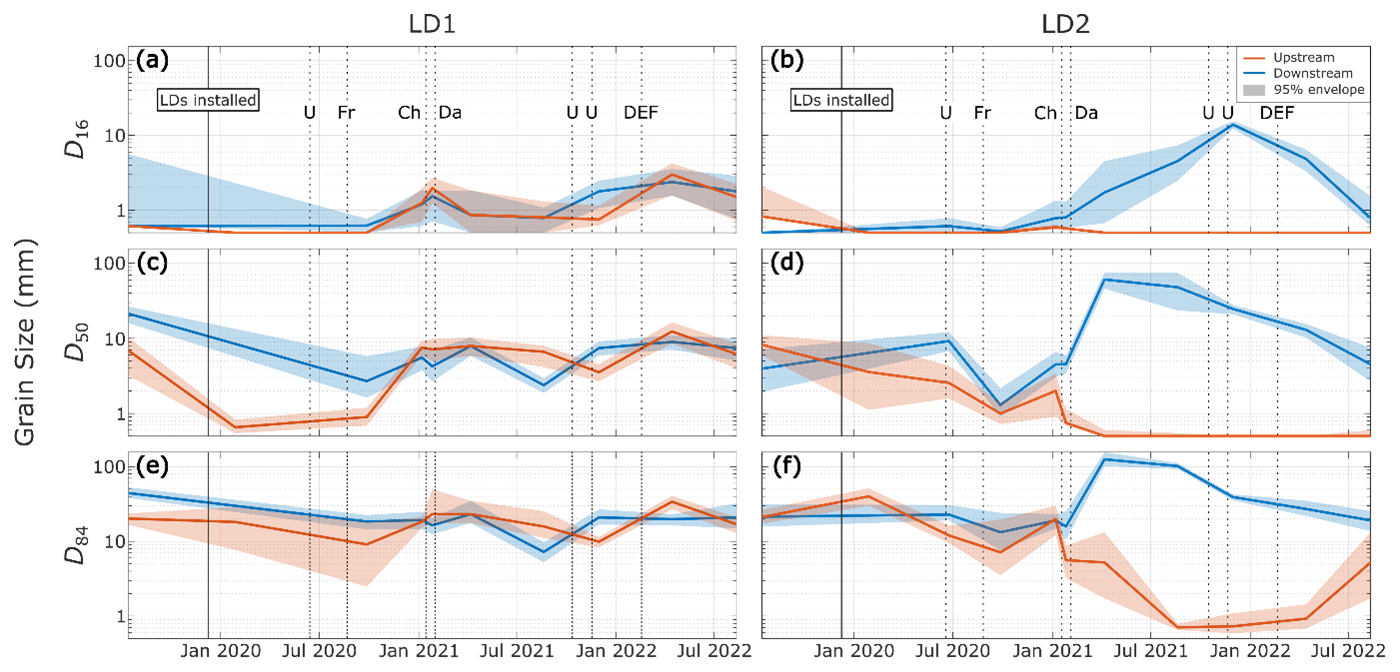
Figure 4GSD metrics for upstream (orange) and downstream (blue) of the LD structures, with the 95 % error envelope shown. Key storms are indicated by dashed vertical lines.
3.3 Topographic variability
The topographic variability across each site was determined by first detrending all the gridded data points in CloudCompare and computing the deviation of each point from the elevation mean. The surface elevations were shown to be normally distributed at both sites (Fig. 5a). LD1 had a minimum bed elevation range of 0.26 m before the installation of the LD in July 2019, and a maximum of 0.36 m in January 2021. The deviation from the elevation mean did not evolve over time and, although the elevation distribution fluctuated between surveys, the range and distribution of deviations remained similar throughout the monitoring period. Kurtosis was used to represent geomorphic variability and skewness the tendency for deposition or erosion. A distribution with a high kurtosis represents a clustering around the mean (i.e. lower variability) and low kurtosis represents more values in the tails of the distribution (higher variability). The skewness and kurtosis for LD1 were shown to vary between −0.2–0.8 and 1.4–2.4, respectively (Fig. 5b), with no clear temporal trend across the surveys, implying that the topographic variability remained unchanged throughout the monitoring period. There was also no generation or removal of existing bedforms, and the bed elevation change was likely not influenced by the LD, as further shown in Fig. 6.
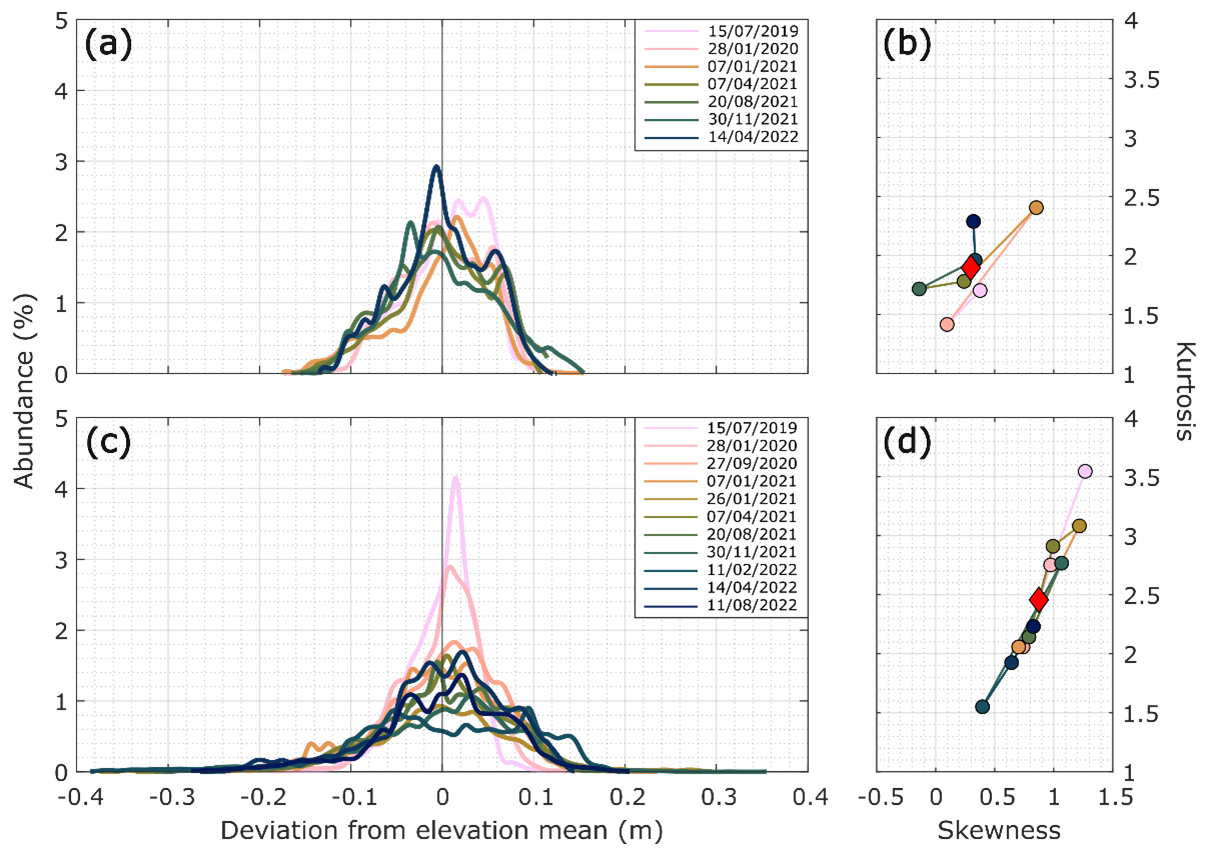
Figure 5Detrended surface elevations relative to the mean for each bathymetric survey for LD1 (a) and LD2 (c). The associated skewness and kurtosis for each date are also shown with the mean shown as a red diamond (b, d).
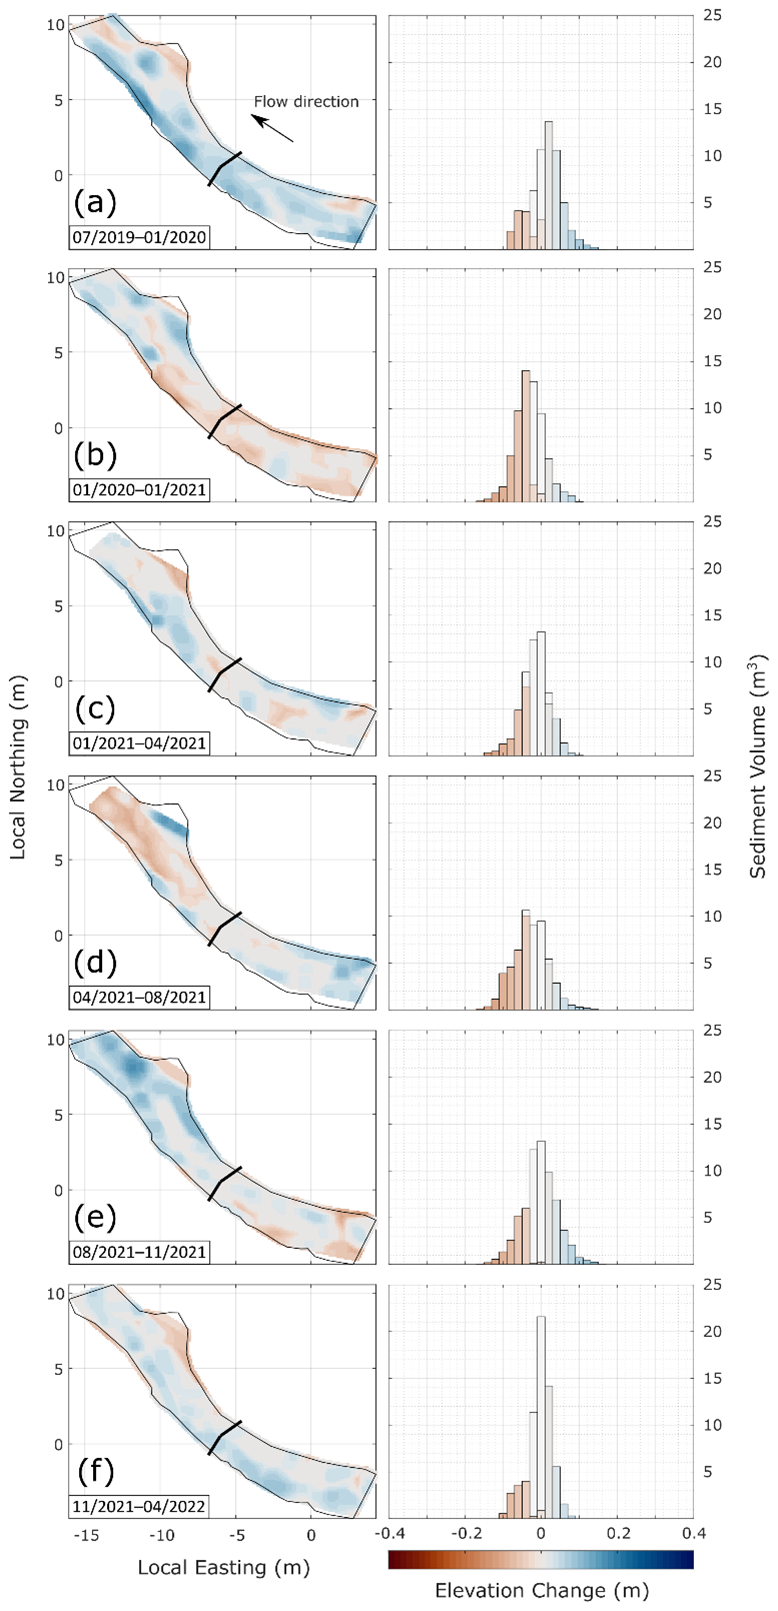
Figure 6DoDs for LD1 (left column) and histograms of elevation change (right column). Significant elevation change (a < 0.05) is denoted by colour (red is erosion, blue is deposition), with insignificant change shown in grey. The channel boundary is shown as a black outline, with the planar view of the LD represented as a thick black line.
In contrast, LD2 (Fig. 5c) exhibited increased topographic variability throughout time, with a minimum bed elevation range of 0.3 m in July 2019 and a maximum of 0.58 m in February 2022 following storms Dudley, Eunice, and Franklin. The distribution evolved temporally from one that was predominately above the elevation mean with little variability (i.e. skewness > 1, kurtosis > 3.5; Fig. 5d) to a flatter, wider distribution with up to 0.38 m of deviation from the mean (February 2022), highlighting the development of plunge and underflow pools beneath LD2 (Fig. 7c, d). There was a clear progression throughout time from the pre-LD survey in July 2019, stabilising following the wet winter in January 2021 and fluctuating between survey dates. There was a clear relationship between skewness and kurtosis with time, with surveys becoming moderately positively skewed (0.5–1) with increasing geomorphic variability (decreasing kurtosis). Both the skewness and kurtosis fell between January and August 2021 when there were no substantial changes to the stage – as shown in Fig. 2 – and no storm events, but increased following storms Dudley, Eunice, and Franklin towards winter 2022. The overall negative trend of the kurtosis indicates that the LD increased internal topographic variability compared to the baseline, while the fluctuating skewness generally identifies periods of erosion and deposition throughout the reach.
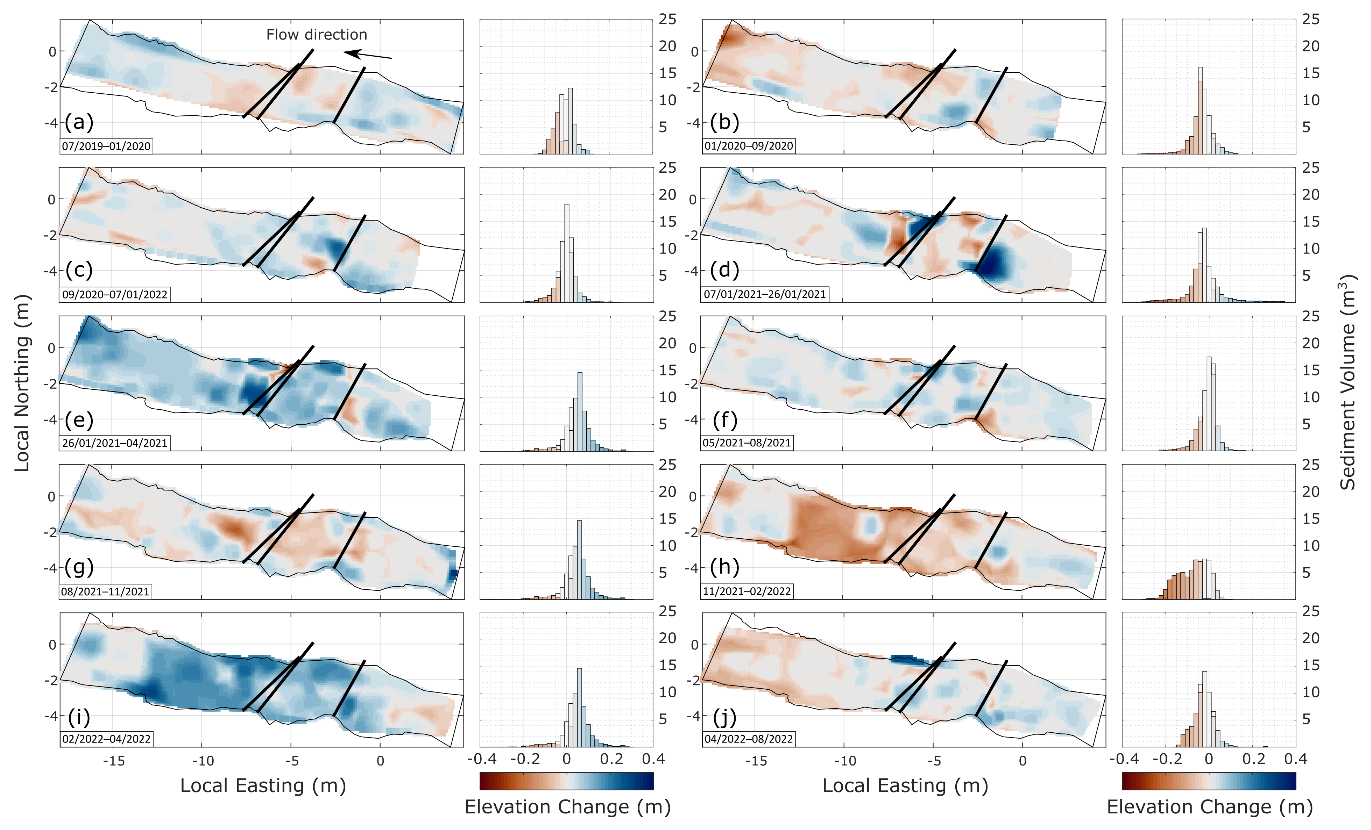
Figure 7DoDs for LD2 (left column) and histograms of elevation change (right column). Significant elevation change (a < 0.05) denoted by colour (red is erosion, blue is deposition), with insignificant change shown in grey. The channel boundary is shown as a black outline, with the planar view of the LD represented as a thick black line. The flow direction is denoted by a black arrow in panel (a).
3.4 Bed elevation change
Bed elevation was analysed using TS data representing the “wet” areas of the reach. LD1 had a maximum Ucrit of 0.0211 m (mean: 0.0180 m) while LD2 had a maximum of 0.0271 m (mean: 0.0184 m). Areas of change lower than the calculated LoD for each DoD are represented in grey in Figs. 6 and 7 for LD1 and LD2, respectively, but their abundance is preserved in each histogram. The DoD histograms for both sites and surveys were normally distributed when preserving the stable areas.
LD1 exhibited a maximum scour depth of 0.16 m between January 2020 and November 2021 (Fig. 6b–e) which was distributed throughout the reach, both upstream and downstream of the LD. There was a maximum deposition depth of 0.14 m between April and November 2021 (Fig. 6d, e), situated approximately 5 m downstream of the LD. The range of elevation change did not fluctuate greater than ±0.04 m throughout time. Spatially, most of the change was situated greater than 5 m from the LD, with the change around the LD being below the LoD threshold.
LD2, which was formed by two linked structures, had a maximum scour depth of 0.38 m between 26 January 2021 and April 2021 (Fig. 7e) and a maximum deposition depth of 0.4 m (7–26 January 2021; Fig. 7d). The range of elevation change fluctuated throughout time from −0.14–0.12 m immediately after LD installation (July 2019–January 2020; Fig. 7a) to reported maximum values. Additionally, the DoDs were highly spatially variable, with evidence of pool formation downstream of the lower LD (Fig. 7a, b), which experienced periodic infilling (Fig. 7c, d) and scour (Fig. 7e, h) throughout the monitoring period. Immediately downstream of the upstream LD2a, a secondary pool formed that exhibited similar scour and fill cycles. The upstream LD2a stored sediment during the monitoring period, most clearly illustrated by Fig. 7d (7 –26 January 2021 following Storm Christoph), where a substantial area of the DoD exhibited change greater than the LoD. The depositional zone also fluctuated over time, infilling and scouring on the true left bank of LD2a.
Upstream of LD1, the volumetric change was highly variable (Fig. 8a), with no greater than 0.6 m3 of deposition immediately after the LD installation and 1.1 m3 of erosion in January 2020. The upstream net change fluctuated throughout the monitoring period, with increased scour following higher flows in winter and increased deposition across summer period lower flows. Downstream of LD1 exhibited a similar pattern (Fig. 8b) but there was increased erosion (a maximum of 1.6 m3 in August 2021) and deposition (up to 1 m3 in November 2021).
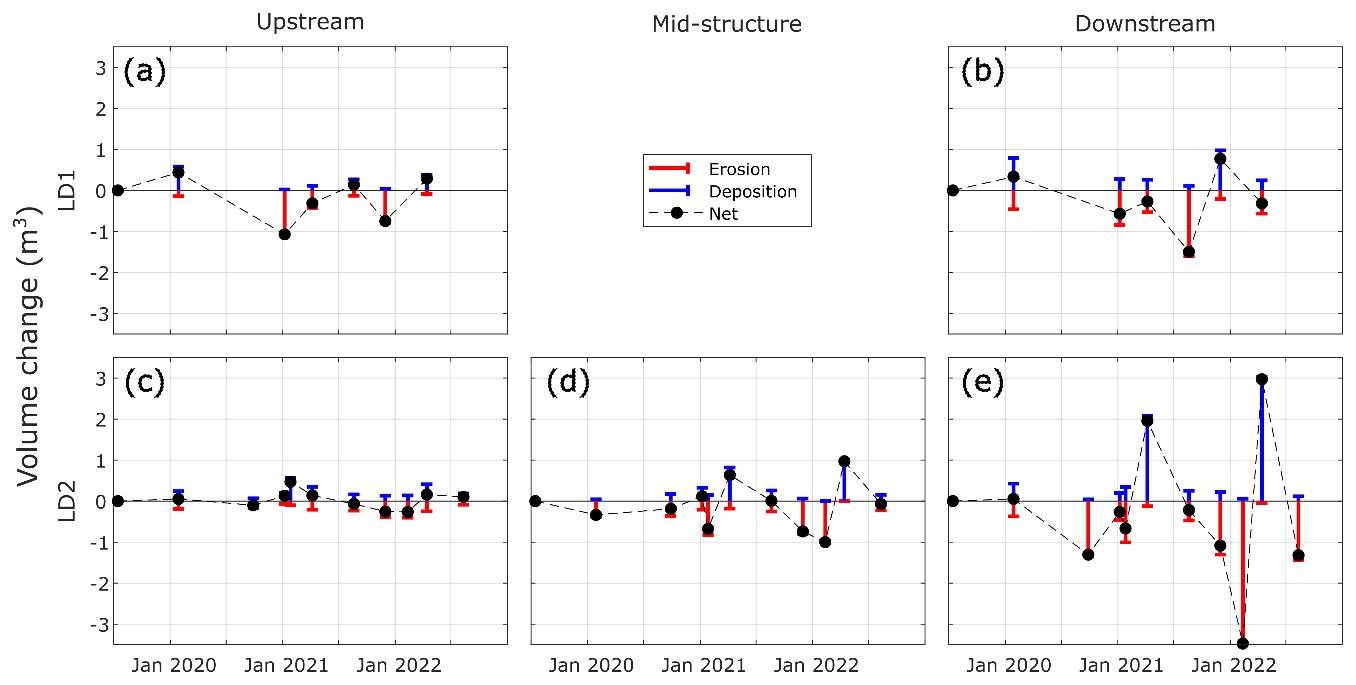
Figure 8The volumetric change split into erosion and deposition for LD1 upstream (a) and downstream (b), and LD2 (c–e), separated into upstream of LD2b (c), mid-structure (i.e. between LD2a and LD2b; (d)) and downstream of LD2a (e).
Upstream of LD2 there was a clearer temporal trend (Fig. 8c). There was a maximum deposition of 0.6 m3 on 26 January 2021 and increased erosion (0.4 m3) following higher flows in February, with a clear progression as less sediment was being stored throughout the year. The LD impounded sediment upstream (Fig. 7d) and scoured over the following year prior to infilling again. Although the range of volume change was smaller than upstream of LD1, there was clearly a progression linked to the presence of the LD. There was more variability mid-structure at LD2, ranging from a maximum of 1 m3 of erosion between January and February 2022 and 1 m3 of deposition between February and April 2022 (Fig. 8d), reflecting pool formation and cyclic scour and infilling between the two LDs (see also Fig. 7a–d). Downstream of the LDs also exhibited similar variability (Fig. 8e), where plunge pools developed immediately downstream of the structure near the true right bank, followed by deposition further downstream. This section had the greatest range of volume change, with up to 3.4 m3 of erosion between February and April 2022 and 3.0 m3 of deposition between January and February 2022. Spatially, these periods were less variable as there was reach-wide erosion and deposition. However, there were localised areas 1 m downstream of the LD that exhibited little elevation change.
3.5 Planform evolution
The banks at LD1 (Fig. 9a) predominantly exhibited erosion upstream of the LD and deposition downstream. The true right bank experienced 2.4 m2 of bank erosion and 4.8 m2 of deposition, with a net areal change of 2.4 m2 (Table 3). In contrast, the true left bank at LD1 predominantly exhibited erosion, experiencing −1.9 m2 of bank loss, 0.41 m2 of deposition, and −1.5 m2 of net areal change. The overall net planform area change at LD1 was 0.90 m2. The channel at the site is relatively straight, and there was no clear influence from LD1 on bank erosion since the true right bank had a similar magnitude of planform change both above and below the LD.
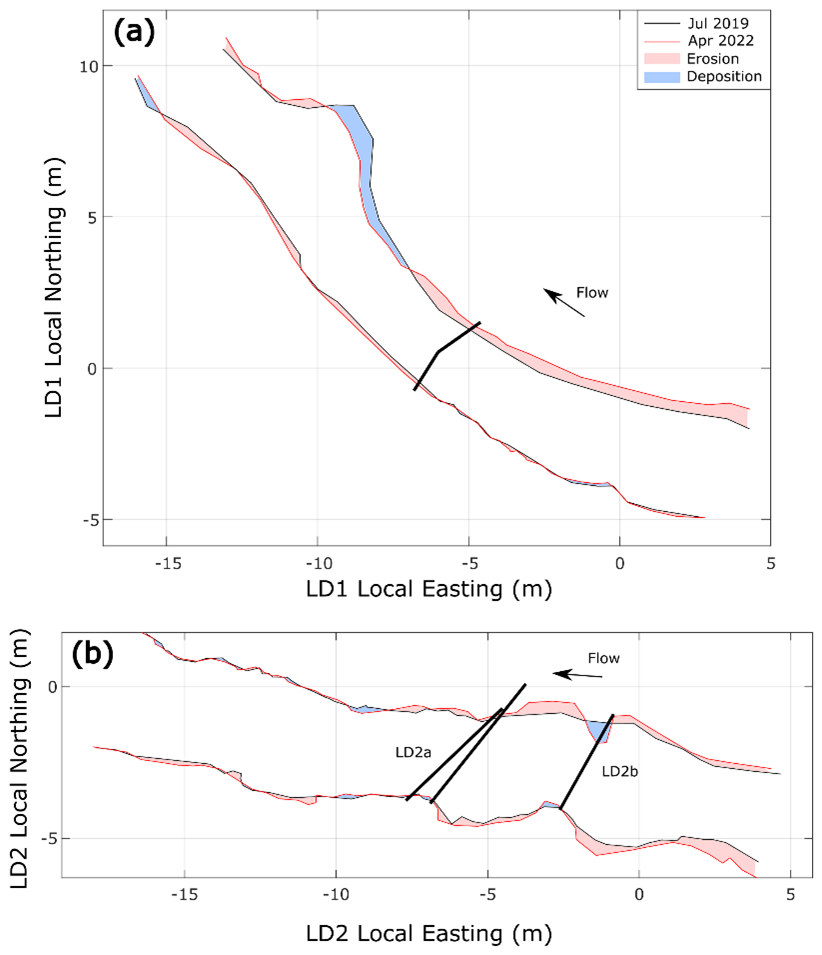
Figure 9Bank erosion and deposition for LD1 (a) and LD2 (b). LDs are represented as thick black lines.
Table 3Planform change for LD1 and LD2 between July 2019 and April 2022.
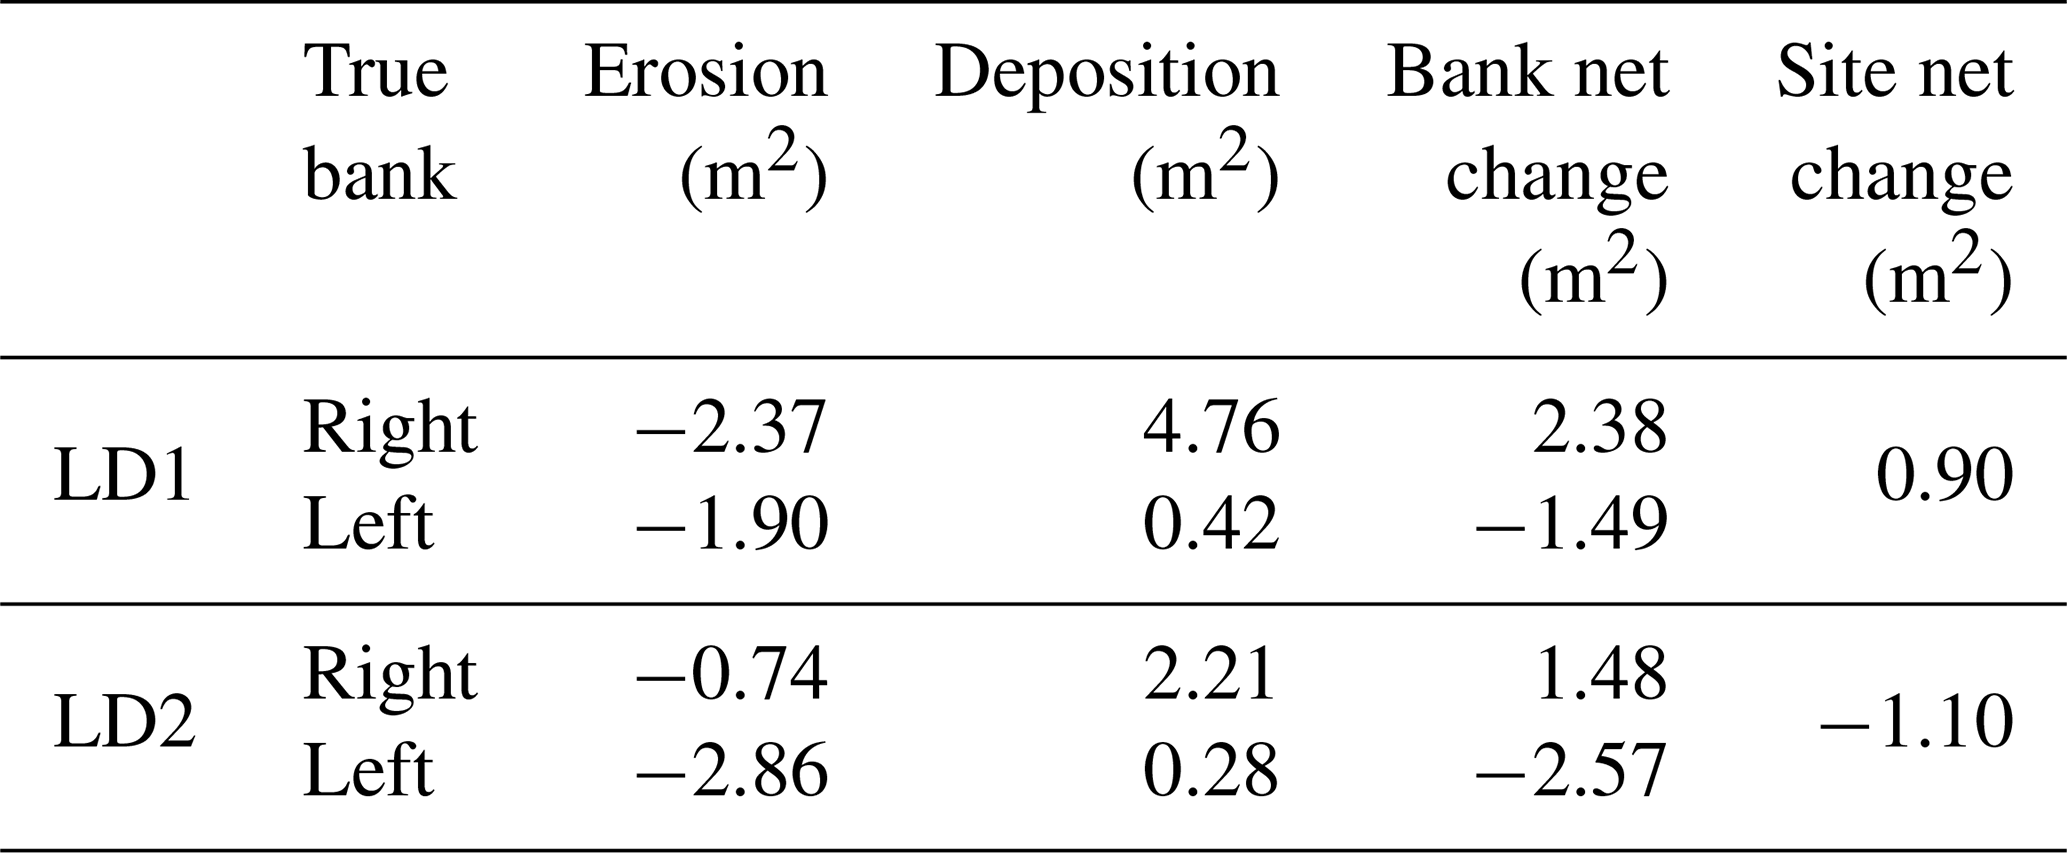
LD2 (Fig. 9b) predominantly exhibited erosion, with a net planform area change of −1.10 m2 but with greater spatial variability near the LD sequence. Immediately downstream of LD2b on the true right bank was an area of deposition, followed by approximately 0.50 m2 of bank erosion, flanking LD2b. A similar pattern was observed on the true left bank, with an area of erosion upstream of LD2b, and a small area of deposition downstream. Often during high flows, the river would exceed the riverbanks – as highlighted above – and flank the true right bank of LD2b. This clearly resulted in localised scour downstream of LD2b on the true right bank. LD2a appeared to have had little impact on the banks, despite retaining water. Deposition mainly occurred in the mid-structure, preceded and succeeded by bank erosion. There was less apparent impact from LD2a downstream (Fig. 9b) as, despite having increased structural complexity, the structure engaged with deeper flows less frequently than LD2b.
This study has presented quantitative measurements of morphological change at two contrasting LD structures in the Dalby Forest, North York Moors, UK. It has shown that the presence of LDs can substantially alter local topographic variability and influence GSDs if the structure is frequently engaged with the river flow and the sediment supply. This discussion aims to highlight the importance of monitoring multiple different facets of the river reach, including monitoring consistently during periods of low flows, to elucidate the drivers for change. It was not possible to access a control reach in the study catchment. However, the data presented herein provide insights for long-term implications and suggestions for practitioners tasked with designing these structures are provided, whilst encouraging the continued collection of geomorphological data to build a database to inform future research.
4.1 Sedimentary response to varying flow conditions
The water depth for LD2 was regulated upon the activation of LD2b, and minorly by LD2a, increasing the depth upstream and decreasing downstream, most notably after the wet winter of 2020/21, where the study catchment experienced over 170 % of winter rainfall compared to 1991–2020 (Kendon et al., 2022). LD2 was more effective at attenuating high flows and sustaining low flows during the monitoring period and consistently maintained a difference between upstream and downstream water depth loggers. As such, the increased structural complexity of LD2 (two LDs in sequence that captured more woody material than LD1) appears to be more effective at attenuating flows than LD1, aligning with Cashman et al. (2021). In response to increased attenuation, it is likely that the relative velocity upstream of the structure reduced in response to the temporary blocking of the structure, allowing fines to settle out of suspension and deposit above the gravel riverbed, increasing the proportion of fines upstream and decreasing them downstream, similar to fully blocked natural wood jams (Welling et al., 2021; Wohl and Scott, 2017). Following this period, few storm events occurred until October 2021, suggesting that low flows winnow finer sediments out of the downstream pool generated by overtopping of the LD.
Large wood in rivers alters grain size and meso-scale bedforms (e.g. pools and riffles) often on the scale of 50 years or less (Montgomery et al., 2003), yet fluctuations in response to the hydrological regime and feedbacks with geomorphology highlight the importance of monitoring the GSD throughout periods of both high and low flows. Sediment response is also controlled by sediment supply upstream; a reduction in sediment supply can increase the proportion of coarse sediment downstream (e.g. Dietrich et al., 1989). Disconnectivity features (i.e. LDs) can emulate and exacerbate this effect by impounding sediment upstream, thus reinforcing the armoured bed in gravel bed rivers and limiting incision depth (Dietrich et al., 1989). LD2 replicates this behaviour when it becomes increasingly more blocked, effectively reducing the sediment supply (especially coarser material) to zero, allowing the downstream bed to armour whilst enacting geomorphic change downstream, similar to naturally formed log jams (Cadol and Wohl, 2011). Although large dams are often reported as substantially altering the sediment supply (e.g. Bednarek, 2001; Kondolf, 1997; Piégay et al., 2019), LDs have the potential to cause disruption to the sediment supply when installed in a catchment system as a part of flood risk management, potentially resulting in unintended impacts downstream.
Equally important is the tendency of the GSD to reorganise towards being more similar both upstream and downstream of the structure, especially D50 and D84. However, the monitoring period ends before they coalesce. This highlights the importance of a long-term study with frequent, detailed observations to ensure that variability in response to the flow regime is being correctly captured. The increased retention of sediments and ultimate flow regulation both up- and downstream induced through disconnectivity may result in increased stream power downstream of the LD intervention, both conceptually, as shown by Kondolf (1997), and in this study through the grain-size disparity (Fig. 4). Check dams, which were historically installed to regulate flow conditions are similar (albeit larger) to LDs by creating static points that induce disconnectivity, have been shown to exacerbate incision downstream due to sediment starvation (Lo et al., 2022; Wohl and Beckman, 2014; Wyżga et al., 2021). There is therefore the potential risk that LDs installed near to critical infrastructure may result in increased erosion (e.g. Nisbet et al., 2015), and careful consideration of placement of these structures is required, especially in a wood-supply poor areas. Additionally, if structures do not provide an effective conduit between the active channel and the floodplain, there is potential for the sediment stored to reduce the efficacy of LDs for flood risk management, although they will likely provide water quality benefits (Quinn et al., 2013). Stored sediment will likely reduce the porosity of the structure (Lo et al., 2022), thereby further increasing longitudinal disconnectivity, similar to that of organic material (Schalko et al., 2018).
4.2 Influence on geomorphic complexity
The design of the LD is pivotal to forcing geomorphic work, and key to emulating and accelerating other natural processes such as large wood recruitment, increased geomorphic heterogeneity, sediment storage, and diverse habitat creation (Lo et al., 2021; Montgomery et al., 2003). Gap size was a key determinant for whether the LD was engaged by the flow or not for the two sites monitored herein. LD1 was largely ineffective at engaging with the channel across a host of conditions and consequently had little to no impact on instream hydraulics and morphology, with any change in the GSD, bed elevation and bank erosion likely within the range of natural variability and not influenced by the LD.
The twin-structured LD2 was shown to have a more substantial impact on channel morphological response than LD1. There was a distinct evolution in the bathymetry of the reach up- and downstream of the LD, with increased deposition upstream and enhanced scour downstream. The LD actively influenced the morphology of the river channel through creating geomorphic heterogeneity, as highlighted by the evolution of the deviation from the elevation means in Fig. 5c, creating important potential habitats for benthic macroinvertebrates as well as increased spatial variability of benthic habitats in surrounding channels (Lo et al., 2021; Pilotto et al., 2016). Interestingly, the deviation from the mean quickly adjusted to the installation of the LD before becoming relatively stable between September 2020 and August 2021, with the largest period of adjustment between November 2021 and February 2022, likely as a result of Storm Barra (5–9 December 2021) where there was a total of 562 mm of precipitation averaged across the catchment (derived from the NIMROD radar system; Met Office, 2003; NB data for 8 December 2021 are missing; therefore the true figure is likely higher). A period of accretion of 4 m3 followed this event (Fig. 8). It is clear from Fig. 7 that sediment was stored behind the upstream LD, but sediment also infilled the downstream pool, likely due to mobilised larger sediment from upstream, reflected in Fig. 4f, where there is a decrease in all downstream grain-size metrics. These observations align with the conceptual model of Faustini and Jones (2003), where large wood detained finer sediment and formed a semi-persistent sediment wedge, as well as observations by others where fine sediment was retained by channel-blocking structures (Parker et al., 2017; Welling et al., 2021), and bedload transport interrupted (e.g. Clark et al., 2022; Spreitzer et al., 2021). The structure had an impact on the channel banks upstream of the sequence during high flows. The floodplain was partially inundated and the LD flanked, creating new flow pathways and resulting in localised planform evolution surrounding the LD, similar to natural wood. There was up to 0.5 m2 of localised bank retreat, and a similar area of deposition immediately downstream of the LD. Change was confined to within 3 m upstream and downstream of the individual LD, likely due to flow velocity reduction as a result of the backwater effect due to being engaged with the flow (Schalko et al., 2023; Wohl and Beckman, 2014). As the wood was relatively small in comparison to the size of the channel, it may be prone to becoming dislodged during high flows in the future if it is not anchored in situ (Dixon and Sear, 2014). However, flanking may scour the anchor out, increasing the likelihood of LD failure and exacerbating flood risk (Hankin et al., 2020).
4.3 Long-term implications
One of the key issues with NFM is scaling from the individual structure to the reach scale, and then to the catchment scale, and understanding how different interventions can be implemented for the maximum overall benefit (Ellis et al., 2021; Wingfield et al., 2021) or benefits to particular locations in the catchment for a given event. Many structures are installed with a gap between the riverbed and the base of the LD (Lo et al., 2022; Wren et al., 2022) but they are often not monitored due to limited funding and being regarded as low-risk interventions. Despite this, monitoring of LDs is vital to understand their effectiveness, including pre- and immediately post-installation topographic and grain-size surveys. Quarterly monitoring supplemented with post-event surveys of the LDs studied herein captured extensive geomorphological change in response to seasonal variability and periods of both high and low flows, including riverbed reorganisation that helped maintain flow depths during periods of low flows and riverbank evolution within 1 m of the structures. To capture seasonal variability, it is recommended that structures are at least checked following high flows or extended periods of low flows over a duration of at least 1 year. However, the selection of an appropriate monitoring frequency and duration is challenging and will be dependent on the local climatic, hydrological, and sedimentary regimes. Identification of an optimal monitoring duration and frequency would help to effectively conserve and distribute monitoring resources.
Leaky wooden dams are large wood structures installed into upland catchments to slow the flow of water, ultimately reducing flood risk downstream, whilst emulating natural processes. This study aimed to quantify the geomorphologic and sedimentary response to the installation of two LDs installed in Dalby Forest, North Yorkshire, UK in December 2019 using high-resolution spatial and temporal observations. When they engage with the river flow, LDs can enact substantial geomorphic change, increasing local topographic and sediment heterogeneity. This study found that GSDs can drastically vary throughout time up- and downstream of LD structures. Additionally, the results show how the local geomorphology and sediment distribution can organise back to a low flow state when sustained by consistent velocities from LD structures. The work herein showed minimal impact on planform evolution at both monitoring sites, but this may be a function of the LD designs and a study limitation of few flow events with a RI greater than 2 years during the monitoring period.
The collection of high-quality, high-resolution topographic and grain-size data is an important step towards addressing the structure-scale data paucity for LDs and the induced changes resulting from their installation, including sedimentary change, and understanding the magnitude and directionality of both geomorphic work and sediment GSD evolution. These are both important to collect throughout the duration of a project and ideally following project completion. This study highlights the importance of considering both the response of LDs to high and low flows and clearly illustrates the degree of topographic variability that can be induced by their installation.
Data used in this study are available from https://doi.org/10.5281/zenodo.13832285 (Wolstenholme et al., 2024), including grain-size distributions, water depths, bathymetric elevations, and bank profiles.
The supplement related to this article is available online at https://doi.org/10.5194/esurf-13-647-2025-supplement.
JMW conceived the study design and performed the monitoring programme with support from CJS and DM. JMW performed the data analysis and writing of the first draft. RET performed the flow frequency analysis. JMW, CJS, DM, RET and DRP equally contributed to discussing and interpreting the results and finalising the draft.
At least one of the (co-)authors is a member of the editorial board of Earth Surface Dynamics. The peer-review process was guided by an independent editor, and the authors also have no other competing interests to declare.
Publisher's note: Copernicus Publications remains neutral with regard to jurisdictional claims made in the text, published maps, institutional affiliations, or any other geographical representation in this paper. While Copernicus Publications makes every effort to include appropriate place names, the final responsibility lies with the authors.
The authors would like to acknowledge Dalby Forest and Forestry England for granting permission to perform the monitoring on their property and Isobel Russell of the Environment Agency's Hydrology NE Team for supplying the level and discharge data for gauges F25110 and L2725. The authors would like to thank all of those from the University of Hull who assisted with fieldwork, particularly Chloe Carter. The authors would also like to thank the two anonymous reviewers, whose comments improved the manuscript, alongside three previous anonymous reviewers of an earlier version of this paper, whose feedback improved the overall article.
This paper was edited by Anastasia Piliouras and reviewed by two anonymous referees.
Abbe, T. B. and Montgomery, D. R.: Patterns and processes of wood debris accumulation in the Queets river basin, Washington, Geomorphology, 51, 81–107, https://doi.org/10.1016/S0169-555X(02)00326-4, 2003.
Addy, S. and Wilkinson, M.: An assessment of engineered log jam structures in response to a flood event in an upland gravel-bed river, Earth Surf. Proc. Land., 41, 1658–1670, https://doi.org/10.1002/esp.3936, 2016.
Anderson, S. W.: Uncertainty in quantitative analyses of topographic change: error propagation and the role of thresholding, Earth Surf. Proc. Land., 44, 1015–1033, https://doi.org/10.1002/esp.4551, 2019.
Bednarek, A. T.: Undamming rivers: A review of the ecological impacts of dam removal, Environ. Manage., 27, 803–814, https://doi.org/10.1007/s002670010189, 2001.
Bertoldi, W., Welber, M., Mao, L., Zanella, S., and Comiti, F.: A flume experiment on wood storage and remobilization in braided river systems, Earth Surf. Proc. Land., 39, 804–813, https://doi.org/10.1002/esp.3537, 2014.
Braden, B.: The Surveyor's Area Formula, Coll. Math. J., 17, 326–337, https://doi.org/10.1080/07468342.1986.11972974, 1986.
Brasington, J., Langham, J., and Rumsby, B.: Methodological sensitivity of morphometric estimates of coarse fluvial sediment transport, Geomorphology, 53, 299–316, https://doi.org/10.1016/s0169-555x(02)00320-3, 2003.
Buffington, J. M., Lisle, T. E., Woodsmith, R. D., and Hilton, S.: Controls on the size and occurrence of pools in coarse-grained forest rivers, River Res. Appl., 18, 507–531, https://doi.org/10.1002/rra.693, 2002.
Burgess-Gamble, L., Ngai, R., Wilkinson, M., Nisbet, T., Pontee, N., Harvey, R., Kipling, K., Addy, S., Rose, S., Maslen, S., Jay, H., Nicholson, A., Page, T., Jonczyk, J., and Quinn, P.: Working with Natural Processes-Evidence Directory SC150005, Environment Agency, https://www.gov.uk/flood-and-coastal-erosion-risk-management-research-reports/working-with-natural-processes-to-reduce-flood-risk (last access: 23 July 2024), 2017.
Cadol, D. and Wohl, E.: Coarse sediment movement in the vicinity of a logjam in a neotropical gravel-bed stream, Geomorphology, 128, 191–198, https://doi.org/10.1016/j.geomorph.2011.01.007, 2011.
Cashman, M. J., Wharton, G., Harvey, G. L., Naura, M., and Bryden, A.: Trends in the use of large wood in UK river restoration projects: insights from the National River Restoration Inventory, Water Environ. J., 33, 318–328, https://doi.org/10.1111/wej.12407, 2018.
Cashman, M. J., Harvey, G. L., and Wharton, G.: Structural complexity influences the ecosystem engineering effects of in-stream large wood, Earth Surf. Proc. Land., 46, 2079–2091, https://doi.org/10.1002/esp.5145, 2021.
Clark, M. J., Bennett, G. L., Ryan-Burkett, S. E., Sear, D. A., and Franco, A. M. A.: Untangling the controls on bedload transport in a wood-loaded river with RFID tracers and linear mixed modelling, Earth Surf. Proc. Land., 47, 2283–2298, https://doi.org/10.1002/esp.5376, 2022.
Comiti, F., Lucía, A., and Rickenmann, D.: Large wood recruitment and transport during large floods: A review, Geomorphology, 269, 23–39, https://doi.org/10.1016/j.geomorph.2016.06.016, 2016.
Dadson, S. J., Hall, J. W., Murgatroyd, A., Acreman, M., Bates, P., Beven, K., Heathwaite, L., Holden, J., Holman, I. P., Lane, S. N., O'Connell, E., Penning-Rowsell, E., Reynard, N., Sear, D., Thorne, C., Wilby, R., Connell, E. O., Reynard, N., and Sear, D.: A restatement of the natural science evidence concerning flood management in the UK Subject Areas, P. Roy. Soc. A, 473, 20160706, https://doi.org/10.1098/rspa.2016.0706, 2017.
Dietrich, W. E., Kirchner, J. W., Ikeda, H., and Iseya, F.: Sediment supply and the development of the coarse surface layer in gravel-bedded rivers, Nature, 340, 215–217, https://doi.org/10.1038/340215a0, 1989.
Dixon, S. J. and Sear, D. A.: The influence of geomorphology on large wood dynamics in a low gradient headwater stream, Water Resour. Res., 50, 9194–9210, https://doi.org/10.1002/2014wr015947, 2014.
Dixon, S. J., Sear, D. A., and Nislow, K. H.: A conceptual model of riparian forest restoration for natural flood management, Water Environ. J., 33, 329–341, https://doi.org/10.1111/wej.12425, 2018.
Dodd, J. A., Newton, M., and Adams, C. E.: The effect of natural flood management in-stream wood placements on fish movement in Scotland, James Hutton Institute, https://www.nfm.scot/sites/www.nfm.scot/files/NFM_fish%20movement%20v2.pdf (last access: 23 July 2024), 2016.
Durafour, M., Jarno, A., Le Bot, S., Lafite, R., and Marin, F.: Bedload transport for heterogeneous sediments, Environ. Fluid Mech., 15, 731–751, https://doi.org/10.1007/s10652-014-9380-1, 2015.
Eaton, B. C., Moore, R. D., and MacKenzie, L. G.: Percentile-based grain size distribution analysis tools (GSDtools) – estimating confidence limits and hypothesis tests for comparing two samples, Earth Surf. Dynam., 7, 789–806, https://doi.org/10.5194/esurf-7-789-2019, 2019.
Ellis, N., Anderson, K., and Brazier, R.: Mainstreaming natural flood management: A proposed research framework derived from a critical evaluation of current knowledge, Prog. Phys. Geog., 45, 819–841, https://doi.org/10.1177/0309133321997299, 2021.
Faustini, J. M. and Jones, J. A.: Influence of large woody debris on channel morphology and dynamics in steep, boulder-rich mountain streams, western Cascades, Oregon, Geomorphology, 51, 187–205, https://doi.org/10.1016/S0169-555X(02)00336-7, 2003.
Follett, E., Schalko, I., and Nepf, H.: Logjams With a Lower Gap: Backwater Rise and Flow Distribution Beneath and Through Logjam Predicted by Two-Box Momentum Balance, Geophys. Res. Lett., 48, e2021GL094279, https://doi.org/10.1029/2021gl094279, 2021.
Gallisdorfer, M. S., Bennett, S. J., Atkinson, J. F., Ghaneeizad, S. M., Brooks, A. P., Simon, A., and Langendoen, E. J.: Physical-scale model designs for engineered log jams in rivers, J. Hydro-Environ. Res., 8, 115–128, https://doi.org/10.1016/j.jher.2013.10.002, 2014.
Gippel, C. J.: Environmental hydraulics of large woody debris in streams and rivers, J. Environ. Eng., 121, 388–395, 1995.
Grabowski, R. C., Gurnell, A. M., Burgess-Gamble, L., England, J., Holland, D., Klaar, M. J., Morrissey, I., Uttley, C., and Wharton, G.: The current state of the use of large wood in river restoration and management, Water Environ. J., 33, 366–377, https://doi.org/10.1111/wej.12465, 2019.
Green, J. C.: The precision of sampling grain-size percentiles using the Wolman method, Earth Surf. Proc. Land., 28, 979–991, https://doi.org/10.1002/esp.513, 2003.
Gurnell, A.: Wood and river landscapes, Nat. Geosci., 5, 93–94, https://doi.org/10.1038/ngeo1382, 2012.
Gurnell, A., England, J., and Burgess-Gamble, L.: Trees and wood: working with natural river processes, Water Environ. J., 33, 342–352, https://doi.org/10.1111/wej.12426, 2018.
Gurnell, A. M., Piégay, H., Swanson, F. J., and Gregory, S. V.: Large wood and fluvial processes, Freshw. Biol., 47, 601–619, https://doi.org/10.1046/j.1365-2427.2002.00916.x, 2002.
Hafs, A. W., Harrison, L. R., Utz, R. M., and Dunne, T.: Quantifying the role of woody debris in providing bioenergetically favorable habitat for juvenile salmon, Ecol. Model., 285, 30–38, https://doi.org/10.1016/j.ecolmodel.2014.04.015, 2014.
Hankin, B., Hewitt, I., Sander, G., Danieli, F., Formetta, G., Kamilova, A., Kretzschmar, A., Kiradjiev, K., Wong, C., Pegler, S., and Lamb, R.: A risk-based network analysis of distributed in-stream leaky barriers for flood risk management, Nat. Hazards Earth Syst. Sci., 20, 2567–2584, https://doi.org/10.5194/nhess-20-2567-2020, 2020.
Heritage, G. and Hetherington, D.: Towards a protocol for laser scanning in fluvial geomorphology, Earth Surf. Proc. Land., 32, 66–74, https://doi.org/10.1002/esp.1375, 2007.
Heritage, G. L., Milan, D. J., Large, A. R. G., and Fuller, I. C.: Influence of survey strategy and interpolation model on DEM quality, Geomorphology, 112, 334–344, https://doi.org/10.1016/j.geomorph.2009.06.024, 2009.
Hydrology NE Environment Agency: Stage data from gauging stations L2725 and F25110, The National Archives, http://nationalarchives.gov.uk (last access: 23 July 2024), 2024.
Kendon, M., McCarthy, M., Jevrejeva, S., Matthews, A., Sparks, T., Garforth, J., and Kennedy, J.: State of the UK Climate 2021, Int. J. Climatol., 42, 1–80, https://doi.org/10.1002/joc.7787, 2022.
Klaar, M. J., Hill, D. F., Maddock, I., and Milner, A. M.: Interactions between instream wood and hydrogeomorphic development within recently deglaciated streams in Glacier Bay National Park, Alaska, Geomorphology, 130, 208–220, https://doi.org/10.1016/j.geomorph.2011.03.017, 2011.
Kondolf, G. M.: Hungry Water: Effects of Dams and Gravel Mining on River Channels, Environ. Manage., 21, 533–551, https://doi.org/10.1007/s002679900048, 1997.
Larson, M. G., Booth, D. B., and Morley, S. A.: Effectiveness of large woody debris in stream rehabilitation projects in urban basins, Ecol. Eng., 18, 211–226, https://doi.org/10.1016/S0925-8574(01)00079-9, 2001.
Lavelle, B., Fyfe, D., and Cross, M.: Yorkshire Derwent Catchment Partnership Annual Report, Yorkshire Derwent Catchment Partnership, https://catchmentbasedapproach.org/wp-content/uploads/2020/07/200716-YDCP-Report_20_FINAL-WEB.pdf (last access: 23 July 2024), 2019.
Lepesqueur, J., Hostache, R., Martínez-Carreras, N., Montargès-Pelletier, E., and Hissler, C.: Sediment transport modelling in riverine environments: on the importance of grain-size distribution, sediment density, and suspended sediment concentrations at the upstream boundary, Hydrol. Earth Syst. Sci., 23, 3901–3915, https://doi.org/10.5194/hess-23-3901-2019, 2019.
Lo, H. W., Smith, M., Klaar, M., and Woulds, C.: Potential secondary effects of in-stream wood structures installed for natural flood management: A conceptual model, WIREs Water, 8, e1546, https://doi.org/10.1002/wat2.1546, 2021.
Lo, H. W., van Leeuwen, Z., Klaar, M., Woulds, C., and Smith, M.: Geomorphic effects of natural flood management woody dams in upland streams, River Res. Appl., 38, 1787–1802, https://doi.org/10.1002/rra.4045, 2022.
Lo, H. W., Klaar, M., Smith, M., and Woulds, C.: Effects of natural flood management woody dams on benthic macroinvertebrates and benthic metabolism in upland streams: Importance of wood-induced geomorphic changes, Ecohydrology, 17, e2654, https://doi.org/10.1002/eco.2654, 2024.
Lockwood, T., Freer, J., Michaelides, K., Brazier, R. E., and Coxon, G.: Assessing the efficacy of offline water storage ponds for Natural Flood Management, Hydrol. Process., 36, e14618, https://doi.org/10.1002/hyp.14618, 2022.
Marston, C., Rowland, C. S., O'Neil, A. W., and Morton, R. D.: Land Cover Map 2021 (10 m classified pixels, GB), NERC EDS Environmental Information Data Centre [data set], https://doi.org/10.5285/a22baa7c-5809-4a02-87e0-3cf87d4e223a, 2022.
Met Office: Met Office Rain Radar Data from the NIMROD System, NCAS British Atmospheric Data Centre, http://catalogue.ceda.ac.uk/uuid/82adec1f896af6169112d09cc1174499 (last access: 23 July 2024), 2003.
Met Office: UK Climate Averages, Met Office, https://www.metoffice.gov.uk/research/climate/maps-and-data/uk-climate-averages/gcxt28mct (last access: 25 July 2022), 2020.
Milan, D. J.: Geomorphic impact and system recovery following an extreme flood in an upland stream: Thinhope Burn, northern England, UK, Geomorphology, 138, 319–328, https://doi.org/10.1016/j.geomorph.2011.09.017, 2012.
Milan, D. J., Heritage, G. L., Large, A. R. G., and Fuller, I. C.: Filtering spatial error from DEMs: Implications for morphological change estimation, Geomorphology, 125, 160–171, https://doi.org/10.1016/j.geomorph.2010.09.012, 2011.
Montgomery, D. R., Buffington, J. M., Smith, R. D., Schmidt, K. M., and Pess, G.: Pool Spacing in Forest Channels, Water Resour. Res., 31, 1097–1105, https://doi.org/10.1029/94WR03285, 1995.
Montgomery, D. R., Massong, T. M., and Hawley, S. C. S.: Influence of debris flows and log jams on the location of pools and alluvial channel reaches, Oregon Coast Range, Bull. Geol. Soc. Am., 115, 78–88, https://doi.org/10.1130/0016-7606(2003)115<0078:IODFAL>2.0.CO;2, 2003.
Morris, M. D.: Factorial sampling plans for preliminary computational experiments, Technometrics, 33, 161–174, 1991.
Nisbet, T., Roe, P., Marrington, S., Thomas, H., Broadmeadow, S., and Valatin, G.: Project RMP5455: Slowing the Flow at Pickering Final Report: Phase II, Department for environment, food and rural affairs, UK, https://cdn.forestresearch.gov.uk/2022/02/fr_stf_pickering_p2_may2015_mwh9jja.pdf (last access: 23 July 2024), 2015.
Ordnance Survey: OS Terrain 5 DTM [ASC geospatial data], Scale 1 : 20 000, Tile(s): Dalby Forest, Ordnance Survey, https://www.data.gov.uk/dataset/f0db0249-f17b-4036-9e65-309148c97ce4/national-lidar-programme (last access: 22 June 2022), 2020.
Parker, C., Henshaw, A. J., Harvey, G. L., and Sayer, C. D.: Reintroduced large wood modifies fine sediment transport and storage in a lowland river channel, Earth Surf. Proc. Land., 42, 1693–1703, https://doi.org/10.1002/esp.4123, 2017.
Piégay, H., Arnaud, F., Belletti, B., Bertrand, M., Bizzi, S., Carbonneau, P., Dufour, S., Liebault, F., Ruiz-Villanueva, V., and Slater, L.: Remotely Sensed Rivers in the Anthropocene: State of the Art and Prospects, Earth Surf. Proc. Land., 188, 157–188, https://doi.org/10.1002/esp.4787, 2019.
Pilotto, F., Harvey, G. L., Wharton, G., and Pusch, M. T.: Simple large wood structures promote hydromorphological heterogeneity and benthic macroinvertebrate diversity in low-gradient rivers, Aquat. Sci., 78, 755–766, https://doi.org/10.1007/s00027-016-0467-2, 2016.
Poeppl, R. E., Perez, J. E., Fergg, H., and Morche, D.: Introducing indices to assess the effects of in-stream large wood on water and sediment connectivity in small streams, Geomorphology, 444, 108936, https://doi.org/10.1016/J.GEOMORPH.2023.108936, 2023.
Quinn, P., O'Donnell, G., Nicholson, A., Wilkinson, M., Owen, G., Jonczyk, J., Barber, N., Hardwick, M., and Davies, G.: Potential Use of Runoff Attenuation Features in Small Rural Catchments for Flood Mitigation, Report, Newcastle University, https://research.ncl.ac.uk/proactive/belford/newcastlenfmrafreport/reportpdf/June%20NFM%20RAF%20Report.pdf (last access: 23 July 2024), 2013.
Roberts, M. T., Geris, J., Hallett, P. D., and Wilkinson, M. E.: Mitigating floods and attenuating surface runoff with temporary storage areas in headwaters, WIREs Water, 10, e1634, https://doi.org/10.1002/wat2.1634, 2023.
Roni, P., Beechie, T., Pess, G., and Hanson, K.: Wood placement in river restoration: fact, fiction, and future direction, Can. J. Fish. Aquat. Sci., 72, 466–478, https://doi.org/10.1139/cjfas-2014-0344, 2015.
Ruiz-Villanueva, V., Mazzorana, B., Bladé, E., Bürkli, L., Iribarren-Anacona, P., Mao, L., Nakamura, F., Ravazzolo, D., Rickenmann, D., Sanz-Ramos, M., Stoffel, M., and Wohl, E.: Characterization of wood-laden flows in rivers, Earth Surf. Proc. Land., 44, 1694–1709, https://doi.org/10.1002/esp.4603, 2019.
Schalko, I., Schmocker, L., Weitbrecht, V., and Boes, R. M.: Backwater Rise due to Large Wood Accumulations, J. Hydraul. Eng., 144, 04018056, https://doi.org/10.1061/(ASCE)HY.1943-7900.0001501, 2018.
Schalko, I., Wohl, E., and Nepf, H. M.: Flow and wake characteristics associated with large wood to inform river restoration, Sci. Rep., 11, 8644, https://doi.org/10.1038/s41598-021-87892-7, 2021.
Schalko, I., Follett, E., and Nepf, H.: Impact of Lateral Gap on Flow Distribution, Backwater Rise, and Turbulence Generated by a Logjam, Water Resour. Res., 59, e2023WR034689, https://doi.org/10.1029/2023WR034689, 2023.
Skinner, C. J., Coulthard, T. J., Schwanghart, W., Van De Wiel, M. J., and Hancock, G.: Global sensitivity analysis of parameter uncertainty in landscape evolution models, Geosci. Model Dev., 11, 4873–4888, https://doi.org/10.5194/gmd-11-4873-2018, 2018.
Spreitzer, G., Tunnicliffe, J., and Friedrich, H.: Effects of large wood (LW) blockage on bedload connectivity in the presence of a hydraulic structure, Ecol. Eng., 161, 106156, https://doi.org/10.1016/j.ecoleng.2021.106156, 2021.
Strahler, A. N.: Quantitative analysis of watershed geomorphology, Eos, 38, 913–920, 1957.
Walsh, P., Jakeman, A., and Thompson, C.: Modelling headwater channel response and suspended sediment yield to in-channel large wood using the Caesar-Lisflood landscape evolution model, Geomorphology, 363, 107209, https://doi.org/10.1016/j.geomorph.2020.107209, 2020.
Welling, R. T., Wilcox, A. C., and Dixon, J. L.: Large wood and sediment storage in a mixed bedrock-alluvial stream, western Montana, USA, Geomorphology, 384, 107703, https://doi.org/10.1016/j.geomorph.2021.107703, 2021.
Wenzel, R., Reinhardt-Imjela, C., Schulte, A., and Bölscher, J.: The potential of in-channel large woody debris in transforming discharge hydrographs in headwater areas (Ore Mountains, Southeastern Germany), Ecol. Eng., 71, 1–9, https://doi.org/10.1016/j.ecoleng.2014.07.004, 2014.
Wheaton, J. M., Brasington, J., Darby, S. E., and Sear, D. A.: Accounting for uncertainty in DEMs from repeat topographic surveys: improved sediment budgets, Earth Surf. Proc. Land., 35, 136–156, https://doi.org/10.1002/esp.1886, 2010.
Wingfield, T., Macdonald, N., Peters, K., and Spees, J.: Barriers to mainstream adoption of catchment-wide natural flood management: a transdisciplinary problem-framing study of delivery practice, Hydrol. Earth Syst. Sci., 25, 6239–6259, https://doi.org/10.5194/hess-25-6239-2021, 2021.
Wohl, E.: Floodplains and wood, Earth-Sci. Rev., 123, 194–212, https://doi.org/10.1016/j.earscirev.2013.04.009, 2013.
Wohl, E.: Of wood and rivers: bridging the perception gap, WIREs Water, 2, 167–176, https://doi.org/10.1002/wat2.1076, 2015.
Wohl, E.: Wood process domains and wood loads on floodplains, Earth Surf. Proc. Land., 45, 144–156, https://doi.org/10.1002/esp.4771, 2019.
Wohl, E. and Beckman, N. D.: Leaky rivers: Implications of the loss of longitudinal fluvial disconnectivity in headwater streams, Geomorphology, 205, 27–35, https://doi.org/10.1016/j.geomorph.2011.10.022, 2014.
Wohl, E. and Scott, D. N.: Wood and sediment storage and dynamics in river corridors, Earth Surf. Proc. Land., 42, 5–23, https://doi.org/10.1002/esp.3909, 2017.
Wohl, E., Bledsoe, B. P., Fausch, K. D., Kramer, N., Bestgen, K. R., and Gooseff, M. N.: Management of Large Wood in Streams: An Overview and Proposed Framework for Hazard Evaluation, JAWRA J. Am. Water Resour. As., 52, 315–335, https://doi.org/10.1111/1752-1688.12388, 2016.
Wohl, E., Kramer, N., Ruiz-Villanueva, V., Scott, D. N., Comiti, F., Gurnell, A. M., Piegay, H., Lininger, K. B., Jaeger, K. L., Walters, D. M., and Fausch, K. D.: The natural wood regime in rivers, BioScience, 69, 259–273, https://doi.org/10.1093/biosci/biz013, 2019.
Wolman, M. G.: A method of sampling coarse river-bed material, Eos, 35, 951–956, https://doi.org/10.1029/TR035i006p00951, 1954.
Wolstenholme, J., Skinner, C., Milan, D., Thomas, R., and Parsons, D.: Localised geomorphic response to channel-spanning leaky wooden dams dataset, Zenodo [data set], https://doi.org/10.5281/zenodo.13832285, 2024.
Wren, E., Barnes, M., Kitchen, A., Nutt, N., Patterson, C., Piggott, M., Ross, M., Timbrell, S., Down, P., Janes, M., Robins, J., Simons, C., Taylor, M., and Turner, D.: The natural flood management manual, CIRIA, London, UK, ISBN 978-0-86017-945-0, 2022.
Wyżga, B., Liro, M., Mikuś, P., Radecki-Pawlik, A., Jeleński, J., Zawiejska, J., and Plesiński, K.: Changes of fluvial processes caused by the restoration of an incised mountain stream, Ecol. Eng., 168, 106286, https://doi.org/10.1016/j.ecoleng.2021.106286, 2021.