the Creative Commons Attribution 4.0 License.
the Creative Commons Attribution 4.0 License.
 | 25 Aug 2025
Effect of grain-sorting waves on alternate bar dynamics: implications of the breakdown of the hydrograph boundary layer
Soichi Tanabe
Toshiki Iwasaki
Understanding the morphological responses of gravel-bed rivers to changes in external forces (e.g. water and sediment supply conditions) is a critical concern in river science and engineering. However, this remains challenging because river responses depend heavily on the distance from the source point where such environmental changes occur. In this study, we focus on the short-term effects of flood-scale non-equilibrium sediment supply on downstream alternate bar dynamics in poorly sorted gravel-bed rivers using a numerical morphodynamic model. Specifically, a two-dimensional morphodynamic calculation was performed using iRIC-Nays2DH in a straight channel under repeated cycles of an unsteady water hydrograph and a constant supply of poorly sorted sediment. In well-sorted sediment cases, the upstream non-equilibrium sediment supply only affects a limited distance from the upstream end (i.e. the hydrograph boundary layer). However, the inclusion of poorly sorted sediment disrupts this concept and leads to the migration of low-amplitude bedload sheets farther downstream. In this context, the upstream water and sediment boundary conditions may affect far-downstream river dynamics through the migration of bedload sheets. The numerical results showed that the migration of bedload sheets and the associated fine sediment transport substantially affected the alternate bar dynamics and changed their texture. However, this effect of bedload sheets on the bars cannot propagate along the entire channel and disappears completely in alternate bars located further downstream. These results suggest that upstream non-equilibrium sediment supply conditions in poorly sorted sediment play a major role in downstream alternate bar dynamics. However, this effect becomes negligible further downstream because bedload sheets gradually disperse during their migration process into larger and more active morphological features, such as alternate bars.
- Article
(9310 KB) - Full-text XML
- BibTeX
- EndNote


Continuous and/or episodic changes in external forces caused by various factors (e.g. climate change, Trenberth, 2011; coseismic mountain collapse, Schuerch et al., 2006; installation and removal of dams, Fields et al., 2021; chute cut-off, Zinger et al., 2011; post-wildfire erosion, Benda et al., 2003; and sediment augmentation, Mörtl and De Cesare, 2021) are critical for controlling the dynamics of rivers. The hydrograph and sediment supply, which are the most common external factors affected by these changes, have a major impact on channel geometry (Venditti et al., 2019), riverbed composition (Nelson et al., 2009), and vegetation (Erskine et al., 1999). River responses are also dependent on the dominant bed material (Gaeuman et al., 2005) and sediment transport mode (Gunsolus and Binns, 2018).
Gravel-bed rivers composed of poorly sorted sediment generally have clear three-dimensional bedform structures, such as fluvial bars. The effects of hydrographs and sediment supply on fluvial bars were investigated through field surveys, laboratory experiments, and numerical calculations, which demonstrated their notable impact on bar dynamics. For example, constant water and equilibrium sediment supply conditions result in a regular pattern of free bars with consistent shape characteristics (i.e. mode, wavelength, and bar height) (Colombini et al., 1987). In contrast, a non-equilibrium sediment supply creates spatially varying bar shape and surface texture patterns, regardless of the upstream water discharge conditions (Lisle and Hilton, 1999; Nelson et al., 2015; Morgan and Nelson, 2021). A reduction in sediment supply suppresses the mobility of the riverbed material, resulting in the formation of coarse patches (Dietrich et al., 1989), coarsening of the corridor (Lisle et al., 1993), and dissipation of the bar structure (Venditti et al., 2012). However, an increase in the sediment supply generally causes greater sediment mobility and associated bed evolution, leading to the formation of shorter ephemeral bars with high migration rates (Podolak and Wilcock, 2013; Bankert and Nelson, 2018; Nelson and Morgan, 2018). Furthermore, the response of fluvial bars under an unsteady flow differs from that under a steady flow (Tubino, 1991; Huang et al., 2023). In addition, some specific hydrograph characteristics cause unique riverbed forms (Waters and Curran, 2015) and grain size compositions (Hassan and Church, 2001) in the rising and falling limbs of a single hydrograph, thus contributing to the nonlinear hysteresis in sediment transport (Gunsolus and Binns, 2017). This hysteresis varies according to hydrograph shape (Bombar et al., 2011), duration (Hassan et al., 2006), and magnitude (Lee et al., 2004). These studies indicate that both sediment supply and hydrographs are critical components in controlling sediment transport and the responses of bars composed of poorly sorted sediment, strongly suggesting the importance of understanding upstream water and sediment supply conditions of river morphodynamics.
One of the difficulties in understanding the relationship between sediment supply conditions and the corresponding riverbed responses is that these responses are dependent on the distance from the source point of sediment supply/reduction, particularly in bedload-dominated river reaches (i.e. gravel-bed rivers composed of poorly sorted sediment). Even in rivers where suspended transport is dominant, the distance from the source point remains an important factor (An et al., 2018); however, suspended material has a longer transport distance than bedload material. This allows the channel to respond farther downstream from the sediment feed point (Andrews, 1986). In bedload-dominated rivers, sediment supply/reduction gradually affects the downstream bed, and the grain size changes over a much longer timescale. We provide a few field-scale examples of bedload-dominated cases. Fields et al. (2021) investigated the temporal transition of the channel geometry for several years after dam removal. They found that channel geometries substantially changed near the removed dam. These changes include channel incision in the upstream reach and bed aggradation with channel widening in the downstream reach. However, there was little change in the channel geometry a few hundred metres downstream, suggesting an effective length scale of the sediment source for downstream morphodynamic changes. A similar example can be found in the debate on the cause of the Mississippi Delta retreat. The Mississippi Delta retreat has been understood to be the result of a reduction in sand supply due to dam construction (Blum and Roberts, 2009). However, Nittrouer and Viparelli (2014) suggested a more direct cause using a one-dimensional morphodynamic model; the effects of the reduction in sand supply did not reach the delta area far from the dams. These examples highlight the importance of understanding the extent to which the effects of external forces, such as changes in sediment supply conditions, on downstream river morphodynamics can propagate over time and space. This is a challenging task, particularly in natural streams, because many other factors, such as bending (Buraas et al., 2014), original riverbed composition (Gaeuman et al., 2005), and vegetation (White et al., 2023), also control channel geometry.
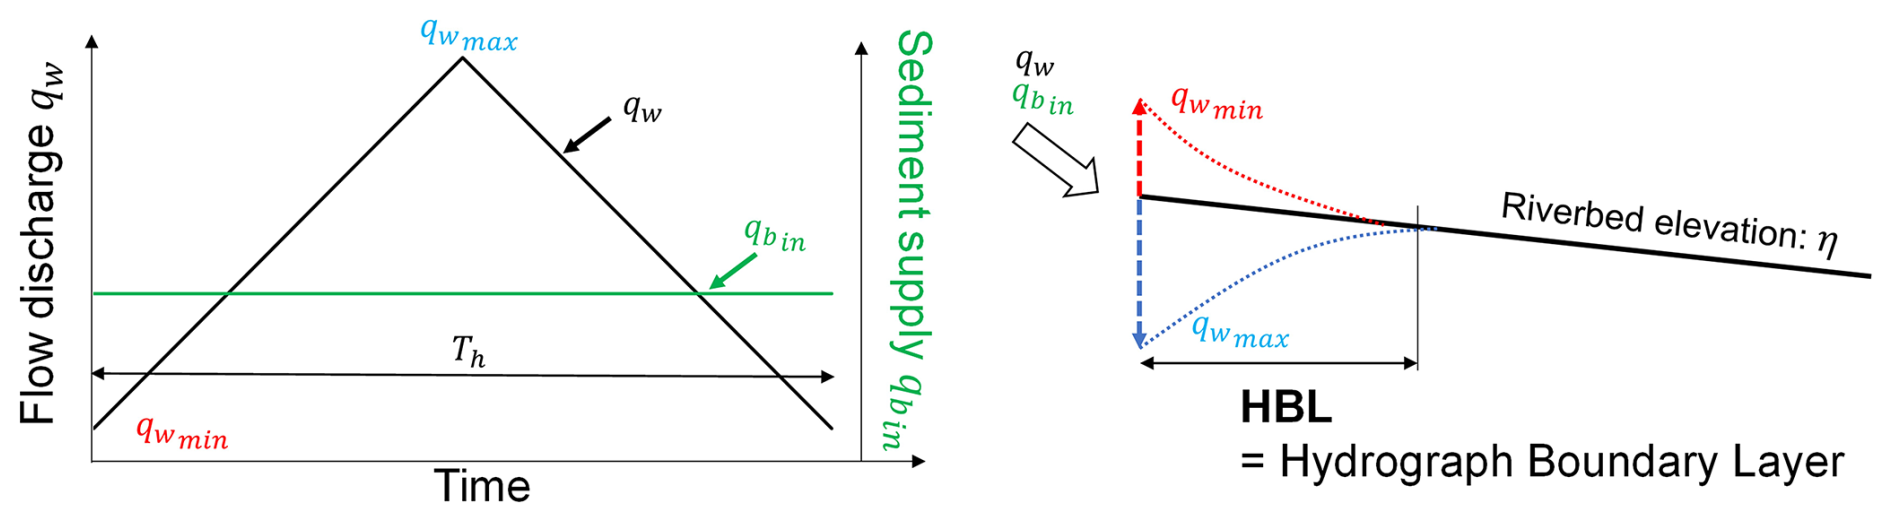
Figure 1Concept of hydrograph boundary layer (HBL). qw is the flow discharge, is the maximum flow discharge, and is the minimum flow discharge, is the sediment supply from the upstream end, Th is the duration of one single hydrograph, and η is the riverbed elevation.
Wong and Parker (2006) quantified the length of a river reach that was strongly affected by non-equilibrium sediment supply within a single hydrograph using simplified experiments. They intentionally set the upstream boundary condition as a non-equilibrium sediment supply condition using a cycled triangular hydrograph and constant sediment supply. This boundary condition led to the cyclic behaviour of bed aggradation at low discharge owing to the oversupply of sediment to the capacity and degradation at high discharge caused by the limited supply condition at the upstream end (Fig. 1). However, this bed fluctuation propagated only limited length downstream, defined as the “hydrograph boundary layer” (referred to as HBL hereafter). Using well-sorted sediment, as in their experiment, the HBL represents a typical length scale of the effect of the sediment source/reduction on the downstream bed evolution of gravel-bed rivers within a single flood event.
In contrast to the well-sorted sediment case, in a poorly sorted sediment bed, grain-sorting waves are generally formed because of a non-equilibrium sediment supply, such as mountain collapse, sediment augmentation (An et al., 2017; Venditti et al., 2010a, b), and repeated sediment release from a dam bypass tunnel (Facchini et al., 2024). An et al. (2017) performed one-dimensional morphodynamic calculations under conditions similar to those of Wong and Parker (2006), except that they targeted poorly sorted sediment. They observed bed fluctuation characteristics similar to those in the well-sorted sediment case. These characteristics were HBL-like, with a limited propagation distance of bed fluctuation due to the non-equilibrium sediment supply. However, they also showed that an advection–diffusion-type grain-sorting wave could migrate far downstream from the upstream end, suggesting a breakdown of the HBL concept in poorly sorted sediment. This grain-sorting wave had similar characteristics to the low-amplitude and long-wavelength bedload sheet found in gravel-bed rivers, with a grain-scale tip containing coarse particles, behind which fine particles fill the interstices between coarse particles (e.g. Whiting et al., 1988). Iseya and Ikeda (1986) and Whiting et al. (1988) reported two distinct reaches of bedload sheets: (1) a “matrix-filled gravel layer”, where fine particles fill the interstices between coarse particles, and (2) an “open-work gravel layer”, which is starved of fine particles. The migrating mechanism of bedload sheets is as follows: (1) in the reach with an open-work gravel layer, coarse particles from upstream are deposited until reaching a critical slope that allows sediment to move downstream; (2) after reaching the critical slope and stabilising the riverbed surface, the interstices between coarse particles are completely filled with fine particles, producing a matrix-filled gravel layer; (3) the fill of fine particles creates a smooth surface, and coarse particles are transported; and (4) coarse particles are separated from fine particles because of the difference in step length, and only coarse particles are transported more downstream from the reach with the open-work gravel layer. Fine particles smooth the surface (Wilcock, 1998; Wilcock et al., 2001), thus increasing the total sediment transport rate associated with bedload sheet migration (Whiting et al., 1988; Nelson et al., 2009). In summary, the migration of bedload sheets causes ephemeral non-equilibrium sediment transport far downstream from the sediment source/reduction point, indicating a possible effect of upstream sediment conditions on the far-downstream bed and grain size dynamics (An et al., 2017). Dai et al. (2021) indicated that, as the concept of the HBL suggests, alternate bars downstream of the HBL are not affected by upstream non-equilibrium conditions under uniform grain size. However, in the case of poorly sorted sediment, fluvial bars that develop far downstream from the upstream sediment supply/reduction point are expected to be affected by bedload sheets. Because fluvial bars composed of heterogeneous sediments are more unstable than those composed of homogeneous sediments (Lanzoni and Tubino, 1999), even low-amplitude grain-sorting waves may have a non-negligible effect on downstream bar dynamics.
Only a few studies have addressed the interactions between sediment waves and bars. Lisle et al. (1997) conducted a field-scale experiment (with a flume length of 160 m) on the dynamics of sediment pulses over migrating alternate bars using well-sorted sediment. The sediment pulse was a combination of small advection and diffusion wave, and its effect did not reach the downstream end of the flume. This implies that the sediment wave generated under well-sorted sediment has a limited effect on the downstream bed morphodynamics. This is consistent with the HBL concept; however, a poorly sorted sediment case may show different downstream sediment behaviours and morphodynamics. Humphries et al. (2012) experimentally investigated sediment pulse dynamics in a channel with a riffle–pool sequence intentionally created to mimic a natural bedform (channel length of 28 m). The effect of the sediment pulse propagating from the pulse feed point to the downstream end of the channel suggests that the sediment pulse can affect a significantly longer distance in the channel. This type of experiment provides important insights into the effective spatiotemporal scale of sediment pulses to the downstream riverbed. However, the limited channel length can be a critical concern in demonstrating sediment wave migration and associated morphodynamics, even in field-scale experiments. Recent advances in numerical morphodynamic models provide sufficient capability to reproduce complex morphodynamic components, such as fluvial bar dynamics (Shimizu et al., 2020) with no limitation of the spatial scale, such as the channel length; therefore, these models have been powerful tools for understanding large-scale sediment transport and morphodynamics, including the breakdown of the HBL and its implications for bedload sheet formation (An et al., 2017).
In this study, a numerical morphodynamic model, iRIC-Nay2DH, was employed to investigate behaviour of rivers with alternate bars and bedload sheets composed of poorly sorted sediment subjected to cyclic triangular hydrographs and a constant sediment supply. Specifically, we focused on (1) the effect of bedload sheets on alternate bars and (2) the behaviour of bedload sheets inside the bars. Our study differs from the previous study by An et al. (2017) in that (1) our study is extended to two-dimensional calculations and considers three-dimensional riverbed morphology, that is alternate bars, and (2) our hydrograph targets a short-term flood (i.e. single flood) repetition, whereas An et al. (2017) explored the repetition of long-term changes in the flow regime. We simplified the channel geometry and upstream conditions (i.e. a straight channel with a wide rectangular cross section, symmetric triangular hydrograph, and constant sediment supply) to provide a simple representation of the morphodynamic responses that can occur when the sediment supply volume and sediment transport capacity do not match under unsteady flow conditions within a single hydrograph.
2.1 Model formulation
In this study, we employed the Nays2DH model (Shimizu et al., 2014) implemented in the iRIC software (Nelson et al., 2016) as a computational morphodynamic model to simulate fluvial bars with poorly sorted sediment, such as in typical gravel-bed rivers, under non-equilibrium sediment supply conditions caused by unsteady flow discharge with a constant sediment supply. This model has been applied to various morphodynamic phenomena in rivers and can sufficiently capture the basic physics of riverbed evolution under mixed-sized sediment conditions (Iwasaki et al., 2011; Harada et al., 2019; Harada and Egashira, 2023). We implemented several functions for the sediment mixture module in the original iRIC-Nays2DH (i.e. calculation of the geometric mean diameter, spatiotemporal variation in Manning's roughness coefficient due to surface grain size changes, bedload transport relation proposed by Wilcock and Crowe, 2003, and boundary conditions for sediment recirculation).
The flow model was an unsteady two-dimensional shallow-water model. The governing equations for this model are written for a generalised coordinate system. For simplicity, we describe these in the Cartesian coordinate system as follows:
where x and y are the downstream and transverse coordinates, respectively; t is the time; h is the water depth; u and v are the depth-averaged flow velocity components in the x and y directions, respectively; V is the composite velocity (); η is the riverbed elevation; g is the gravitational acceleration; and nm is Manning's coefficient. This coefficient is updated as the riverbed texture changes according to the Manning–Strickler roughness formula, as follows:
where ks is the roughness height, and dg is the geometric mean diameter.
We used an active layer formulation (Hirano, 1971) to simulate the evolution of the riverbed and surface grain size distribution in a poorly sorted sediment riverbed. The morphodynamic features considered in this study were characterised by the cyclic behaviour of bed aggradation/degradation caused by a non-equilibrium sediment supply at the upstream end and the migration of free alternate bars in the straight channel. Both components may have led to the formation of a distinct grain-sorting layer in the riverbed. In addition, the surface texture and bar structure exhibit hysteresis under unsteady flow (Hassan and Church, 2001; Mao, 2012; Wang et al., 2019). To capture this stratigraphic record, Nays2DH stores the grain size distribution at the surface and inside the bed using a three-layer approach: an active layer, several deposition layers, and a transition layer between (Ashida et al., 1990). The substrate is divided into a transition layer and several deposition layers. A transition layer is an intermediate layer between an active layer and deposition layers, meaning that it transitions from a deposition layer to an active layer or vice versa. Assuming that bed porosity is constant, the riverbed elevation and surface grain size distribution are updated as follows (Exner, 1925; Parker, 1991):
where and are the bedload transport rate per unit width in the x and y directions, respectively; the subscript i indicates physical quantities of the ith grain size class; Fai is the volumetric fraction of the ith grain size class in the active layer (); fIi is the volumetric fraction of the ith grain size class at the interface between the active layer and substrate (); λ is the porosity of the riverbed; and La is the active layer thickness, which affects the sensitivity of the riverbed evolution in the numerical calculation. In general, the active layer thickness is evaluated as a linear function of the representative diameter, for example, the geometric mean diameter, dg. In this study, we assume that the active layer thickness is constant and set it to twice dg in the initial bed condition as follows:
For fIi, the grain size fraction in the active layer was adopted when the riverbed aggraded, and the grain size fraction in the transition layer was adopted when the riverbed degraded.
In this study, we focused on the morphodynamics of poorly sorted gravel-bed rivers and considered bedload transport to be the only mode of sediment transport. For this purpose, we employed the bedload transport formula proposed by Wilcock and Crowe (2003), which is applicable to a wide range of grain size distributions.
where the superscript s is the local streamwise direction coordinate, R is the submerged specific gravity of the sediment, u∗ is the shear velocity, and Wi is the dimensionless bedload transport rate calculated from the following equation:
where the dimensionless parameter ϕi is defined as the ratio of the bed shear stress, τb, to the reference shear stress for the ith grain size class, τri.
The bed shear stress, τb, is evaluated as follows:
where ρ is the water density, and ie is the energy gradient. The reference shear stress, τri, is given as follows:
where is the dimensionless reference shear stress for the geometric mean size calculated as a function of the fraction of sand in the active layer, Fs, as follows:
The exponent b characterises the hiding effect among different grain sizes and is computed as follows:
The bedload transport rate for the transverse direction is calculated as follows:
where n is the transverse coordinate, τ∗i is the dimensionless shear stress of the ith grain size class, and τ∗ri is the dimensionless reference shear stress of the ith grain size class. μs and μk are the static and dynamic friction coefficients, respectively, and both parameters are taken as 0.7, corresponding to an angle of repose of 35° (Iwasaki et al., 2016). is the flow velocity near the riverbed in the n direction, and Vcb is the composite velocity near the riverbed. These are obtained using Engelund's equilibrium-type secondary flow model as follows (Engelund, 1974):
where is the flow velocity near the riverbed in the s direction, N∗ is the coefficient associated with the secondary flow velocity profile in the vertical direction and is taken as seven in this study, and r is the local streamwise curvature of the depth-averaged flow field. The bedload transport vector in Cartesian coordinates can be calculated from the bedload vector in local streamwise coordinates (, ) based on the depth-averaged flow vector as follows (Iwasaki et al., 2016):
where θs is the angle of the depth-averaged flow along the x axis.
2.2 Model validation
In this section, we validate the iRIC-Nays2DH model for its application to the morphodynamics of fluvial bars in poorly sorted sediment by reproducing the flume experiments of Nelson et al. (2010). Their experiments aimed to explore the bed surface topography and texture over a gravel bed of quasi-steady alternate bars. This flume was located in the St. Anthony Falls Laboratory at the University of Minnesota, Minneapolis, USA. The flume width was 2.75 m, the channel length was 55 m, and the slope was 0.013. Flow discharge was held constant at for approximately 20 h. The sediment used in the experiment was poorly sorted gravel, 2–45 mm in diameter with a geometric mean diameter of 11.2 mm. The sediment was recirculated. A block was installed to cover one-third of the flume entrance to trigger the formation and development of the alternate bars.
During the experiment, the water surface elevation, local flow velocity, and sediment runoff at the downstream end were recorded, and photographs were captured to analyse the surface texture. After the experiment, they investigated the high-resolution riverbed elevation and automated the surface grain size distribution, created a hand-drawn map of the surface patch, and calculated the boundary shear stress. To validate our numerical model, we used high-resolution riverbed elevation, automated surface grain size distribution, and a hand-drawn map of the surface patch.
We set the same channel geometry and sediment grain size distribution as those used in the experiment. The initial channel morphology was flatbed. The channel was discretised into 220 cells in the longitudinal direction and 50 cells in the transverse direction (Δx=0.25 (m), Δy=0.055 (m)). Since the reference study did not mention sediment density, we assumed a density of 2650 kg m−3. The bed porosity was 0.4, computational time was 20 h, flow discharge was fixed at 0.4 m3 s−1, and time step was set to 0.005 s. We also constricted the flow at the upstream end by setting one-third of the cells on the right-bank side as obstacle cells to mimic a concrete block placed upstream during the experiment. To reproduce sediment recirculation, the amount and distribution of the sediment runoff from the downstream end were assigned equally to the cells at the upstream end, except for the obstacle cells, in the next time step. In this experiment, there may have been a time lag in conveying the sediment from the downstream end to the upstream end; however, we did not consider this time lag.
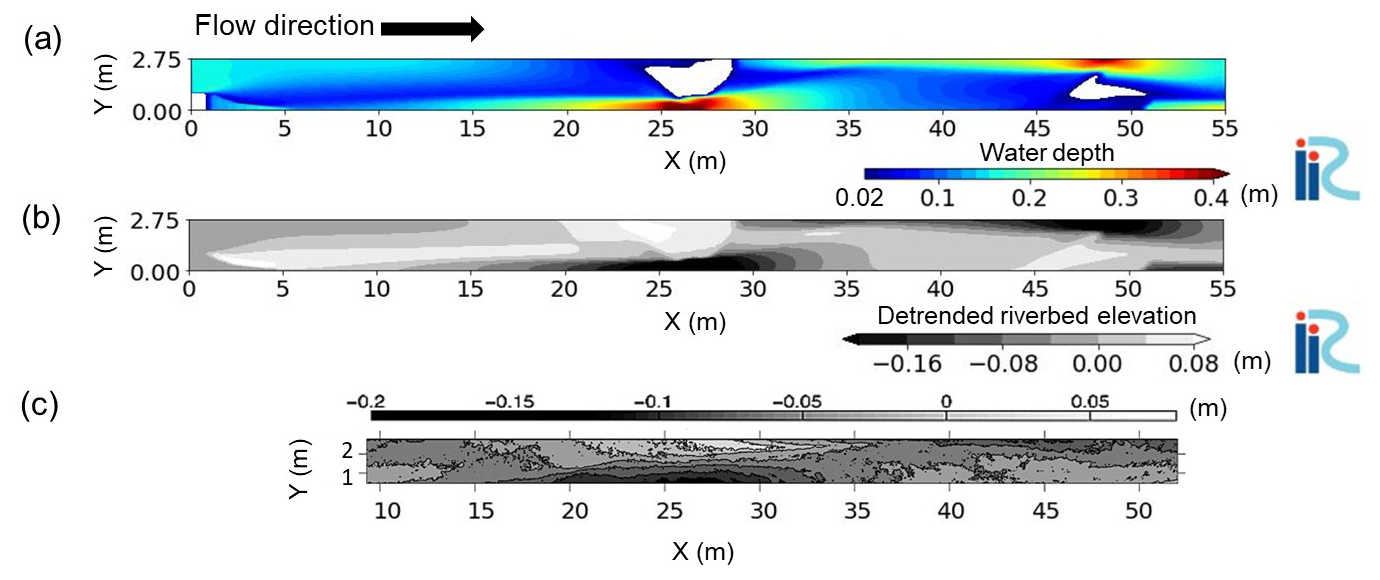
Figure 2(a) The two-dimensional water depth profile from our calculation at the end of the calculation. (b) Our numerical result of the two-dimensional riverbed profile at the end of the calculation, subtracting the channel slope (0.013). (c) The two-dimensional riverbed profile, subtracting the channel slope (0.013), from the experiment by Nelson et al. (2010), which is adapted from Nelson et al. (2010).
Figure 2 shows the two-dimensional water depth profile from our calculation and the detrended riverbed profile at the equilibrium state (i.e. approximately 20 h) obtained from our calculation and the experiment by Nelson et al. (2010). The detrended riverbed elevation was subtracted from the channel slope (0.013). Two large bars were observed: the upstream bar was on the left side of the channel between 20 and 35 m from the upstream end, and the downstream bar was on the right side of the channel between 40 and 55 m from the upstream end. Both bars partially emerged above the water surface (at depths of less than 0.02 m). Deep pools formed on the opposite banks of both bars. Although the model appeared to over-predict the bar height, the numerical result generally replicated the bar shape and wavelengths.
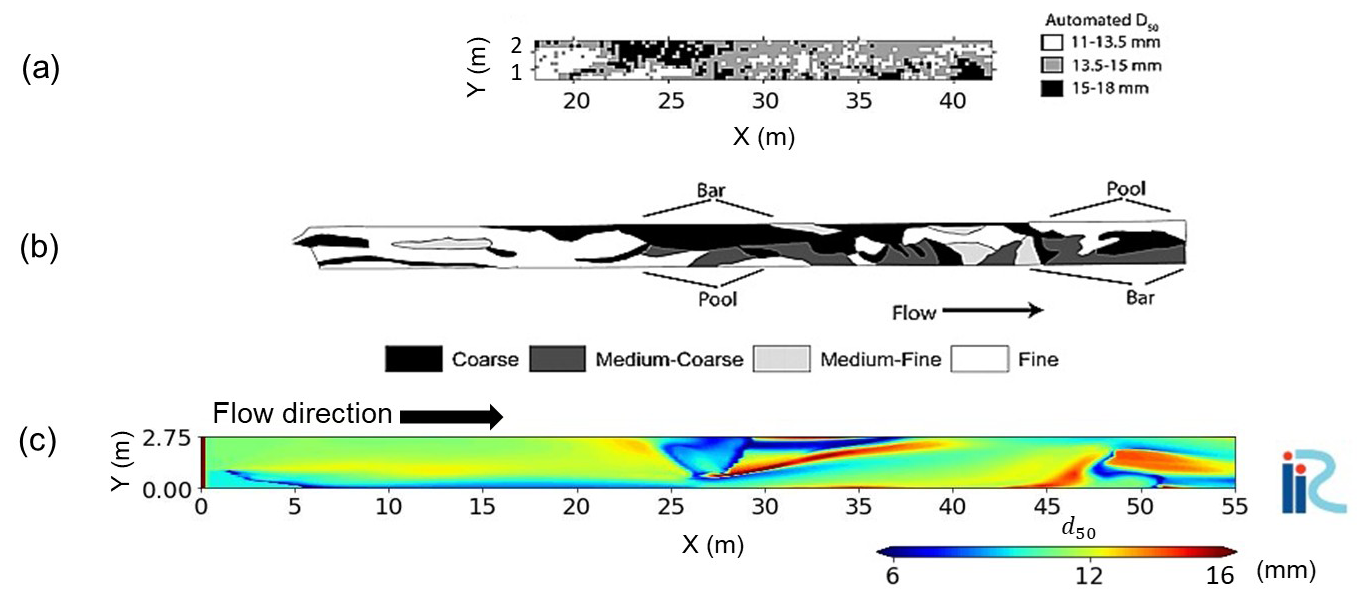
Figure 3(a) The automated map of the local grain size d50 for which 50 % of the grain size distribution is finer from the experiment by Nelson et al. (2010). (b) Hand-drawn surface patch map from the experiment by Nelson et al. (2010). Panels (a) and (b) are adapted from Nelson et al. (2010). (c) The map of d50 from our calculation at the end of the calculation.
Figure 3a and b show the distribution of the surface median grain size and the hand-drawn surface patch map from the experiment, respectively. Both coarse-grained bars and fine-grained pools were developed in this experiment. Several studies have suggested that this surface-sorting pattern is typical for alternate bars developed in a straight channel (Lisle and Hilton, 1999; Recking et al., 2016). Nelson et al. (2010) concluded that this was due to “along a path moving up the bar, the material moving as cross-stream sediment transport became finer, preferentially shuttling fine sediment into the pools”. Figure 3c shows a map of the surface median grain size based on the numerical results. The computational results were generally consistent with the experimental results, particularly the coarse-grained bars and fine-grained pools. One discrepancy between the simulation and the experiment is the formation of an extremely fine-grained bar. This may be because the emerged bar was calculated to have zero sediment transport capacity; thus, fine particles that would normally flow down to the pools were deposited there. This is a limitation of the shallow-water equation and equilibrium sediment transport model used in this study. From the above, the numerical model exhibited sufficient accuracy for simulating the grain size characteristics over the alternate bars observed in the experiment.
2.3 Calculation conditions
Herein, we investigated the effect of grain-sorting waves caused by a non-equilibrium sediment supply on free-migrating alternate bars in a poorly sorted sediment bed using the morphodynamic model iRIC-Nays2DH as validated above. To clearly show the presence of grain-sorting waves and quantify their effect on bar dynamics, we followed the HBL concept proposed by Wong and Parker (2006) and its breakdown in the poorly sorted sediment case noted by An et al. (2017) in the numerical experiments. In other words, the unsteady, symmetrical, triangular water discharge hydrograph and constant sediment supply at the upstream boundary under poorly sorted sediment generated a low-amplitude grain-sorting wave that migrated downstream beyond the typical HBL length scale recognised in well-sorted sediment beds. As an example of a poorly sorted gravel-bed river, we considered the Otofuke River conditions, as in Dai et al. (2021) and Huang et al. (2023). The hydrograph consists of 50 consecutive single triangular hydrographs, each with a duration, Th, of 80 h (total duration of 4000 h), and maximum and minimum discharges of 1200 and 100 m3 s−1, respectively. The channel geometry is 21 km in length and 70 m in width and has a slope of 0.00541. The initial channel morphology is flatbed. This channel is discretised into 600×20 cells (Δx=35 (m), Δy=3.5 (m)). The time step was 0.2 s. The bed porosity was 0.4. As a perturbation to trigger bar formation, a 5 % discharge fluctuation was randomly distributed in the transverse direction at the upstream end.
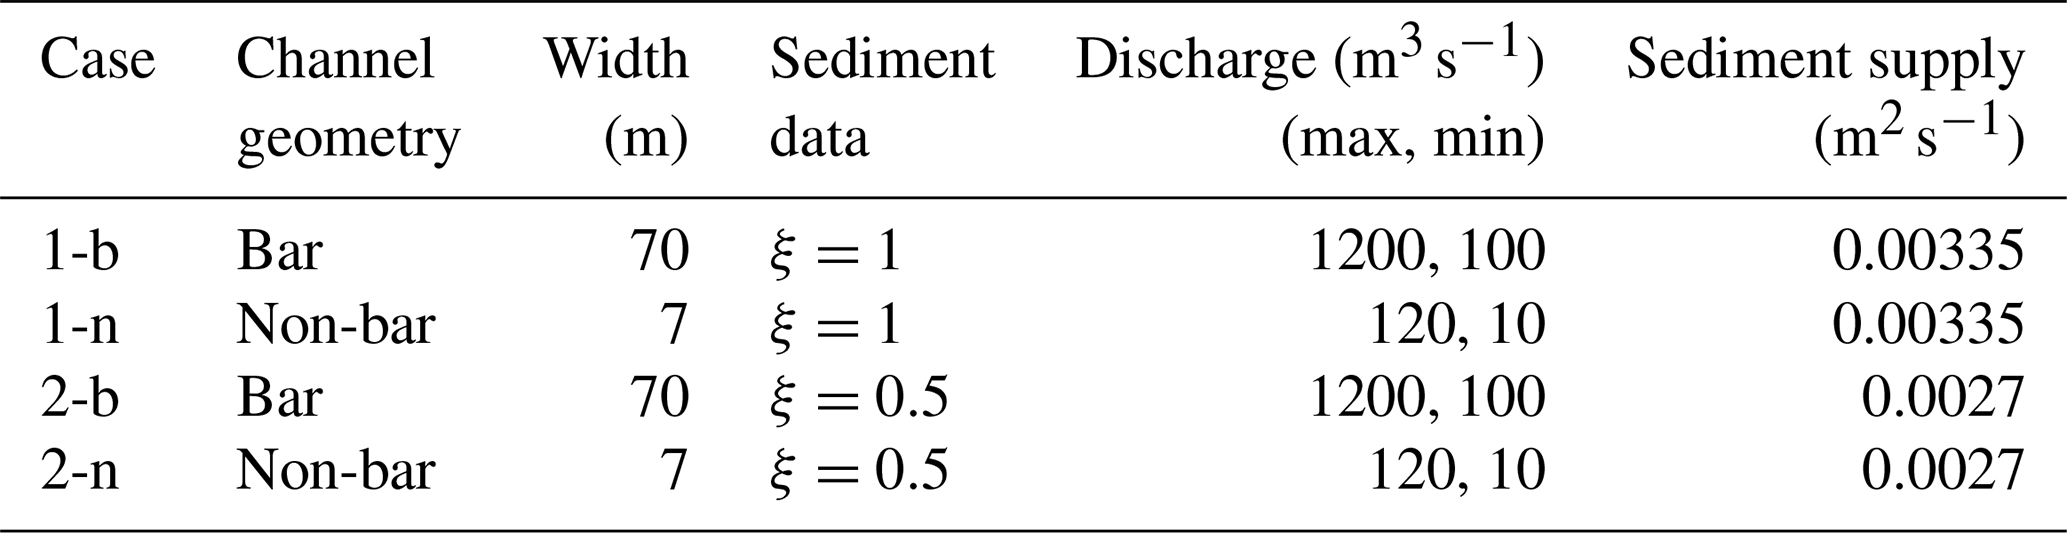
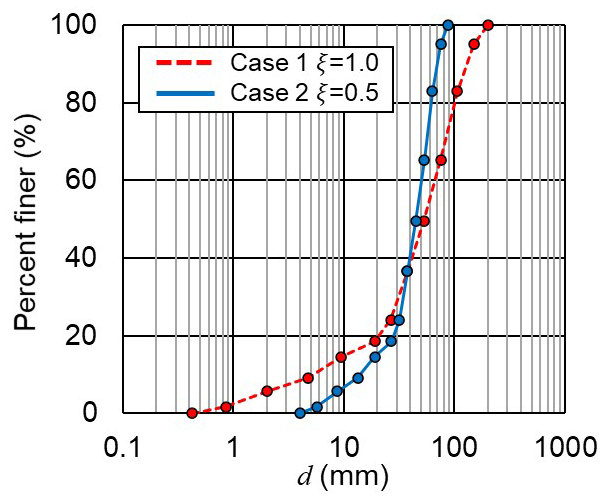
Four calculations were performed under this general computational setting (Table 1), focusing on the grain size distribution range and the presence of alternate bars. We determined the grain size distribution based on field data obtained from the Otofuke River in 2016 (Kyuka et al., 2020). Figure 4 shows a wide grain size distribution range of 0.4 to 200 mm, which is typical of poorly sorted sediment in gravel-bed rivers. We define this as the base case (Case 1). To understand the effect of the size distribution range, we performed an additional morphodynamic calculation using poorly sorted sediment with a narrower grain size range than that in Case 1. Therefore, we employed the method proposed by An et al. (2017). First, we prepare the original grain size distribution and specify grain sizes in the ψ logarithmic scale as follows:
The original grain size distribution is specified as the pairs of (ψi,Pi), where Pi is the fraction by weight of sediment finer than size ψi. We can specify the group of grain size distributions as the pairs of (, where ψm is the arithmetic mean grain size on ψ, and ξ is a user-specified coefficient. We can vary the range of grain size distribution by changing ξ; its value is set to 0.5 (Case 2) in this study (Fig. 4). The original size distribution corresponds to ξ=1. Both distributions have the same geometric mean grain size, dg (=37.66 mm), but they have different standard deviations, σg (); importantly, both are classified as poorly sorted sediment. Note that the case with ξ>1, which is a quite poorly sorted sediment bed, is not tested here because this condition causes the presence of quite large sediments, which are not movable in the hydrograph condition defined in this study, resulting in significantly different bar migration features.
The constant sediment supply rate in the simulation was determined through a trial-and-error approach because there is no straightforward, explicit method. The channel slope, hydrograph shape, and grain size distribution all determine the constant sediment supply rate required to achieve macroscale dynamic equilibrium over a single hydrograph (i.e. the only variations during the hydrograph are upstream bed fluctuation and migration of the grain-sorting wave, while the macroscale bed slope is maintained). With this constraint, we determined the sediment supply rates from the upstream end to be 0.0027 and 0.00335 m2 s−1 for Cases 1 and 2, respectively. The grain size distribution of the supplied sediment was the same as that of the initial riverbed. In addition, we performed the corresponding one-dimensional calculations to demonstrate the fundamental features of grain-sorting wave migration without alternate bars. To simulate this, we used a narrower channel with the same unit discharge and sediment supply rate as in the base cases to suppress bar formation and maintain a flatbed. Note that for this narrower channel case, we still used the two-dimensional morphodynamic model iRIC-Nays2DH for consistency with the alternate bar cases. The calculation conditions of these runs in terms of the grain size distribution and presence of alternate bars are summarised in Table 1. The narrow channel (non-bar case: Cases O-n) is discretised into 200×2 cells (Δx=105 (m), Δy=3.5 (m)). This grid size is larger than that in the base channel (bar case: Case O-b) to reduce the computational time but is sufficiently small to resolve bedload sheet migration.
We first address the results of the non-bar cases (i.e. Cases 1-n and 2-n) to show the fundamental characteristics of the formation and migration of the grain-sorting wave. Figure 5 shows the detrended riverbed elevation (subtracting the actual equilibrium riverbed slope) and geometric mean grain size along the right bank (i.e. Y=0 m) within the final hydrograph for which the macroscopic equilibrium state was satisfied. Note that there is a riverbed change near the downstream end owing to the downstream end conditions (i.e. uniform flow assumption). Although the flow discharge, riverbed slope, and sediment supply rate were prescribed to satisfy the equilibrium conditions, a slight change in slope occurred during the calculation. The actual equilibrium riverbed slope was defined as the mean riverbed slope over 3000–18 000 m at the end of the calculation (4000 h), excluding river reaches close to the upstream and downstream ends, which have large-scale riverbed fluctuations. Case 1-n shows that the large bed elevation change caused by the non-equilibrium sediment supply was limited to within 1 km from the upstream end, similar to the HBL observed in the well-sorted sediment case (Wong and Parker, 2006). In addition to the large-scale riverbed fluctuation within this limited reach, a sediment wave of grain-size order migrated downstream through the entire channel with diffusion. An et al. (2017) suggested that this sediment wave is a grain-sorting wave “bedload sheet”, which is formed by the imbalance between the sediment supply and sediment transport capacity. Figure 5 shows that the geometric mean grain size was relatively small at the centre of bedload sheet. In other words, the effects of the non-equilibrium sediment supply at the upstream end are conveyed over long distances downstream through bedload sheet migration, indicating a breakdown of the HBL concept in rivers with poorly sorted sediment riverbeds (An et al., 2017). Figure 5b shows that the HBL-like upstream river reach in Case 2-n is longer than that in Case 1-n due to a larger sediment supply. This is consistent with the theoretical analysis of Wong and Parker (2006). In contrast to Case 1-n, bedload sheet in Case 2-n migrated a long distance downstream, but its presence was less distinct. That is, the amplitude of this wave and the associated grain size difference were much smaller than those in Case 1-n because of the narrow range of the grain size distribution (Fig. 4). This implies that the grain-sorting wave in Case 1 may have a larger impact on the downstream morphodynamics than that in Case 2. We investigate this in two-dimensional calculations with alternate bars below.
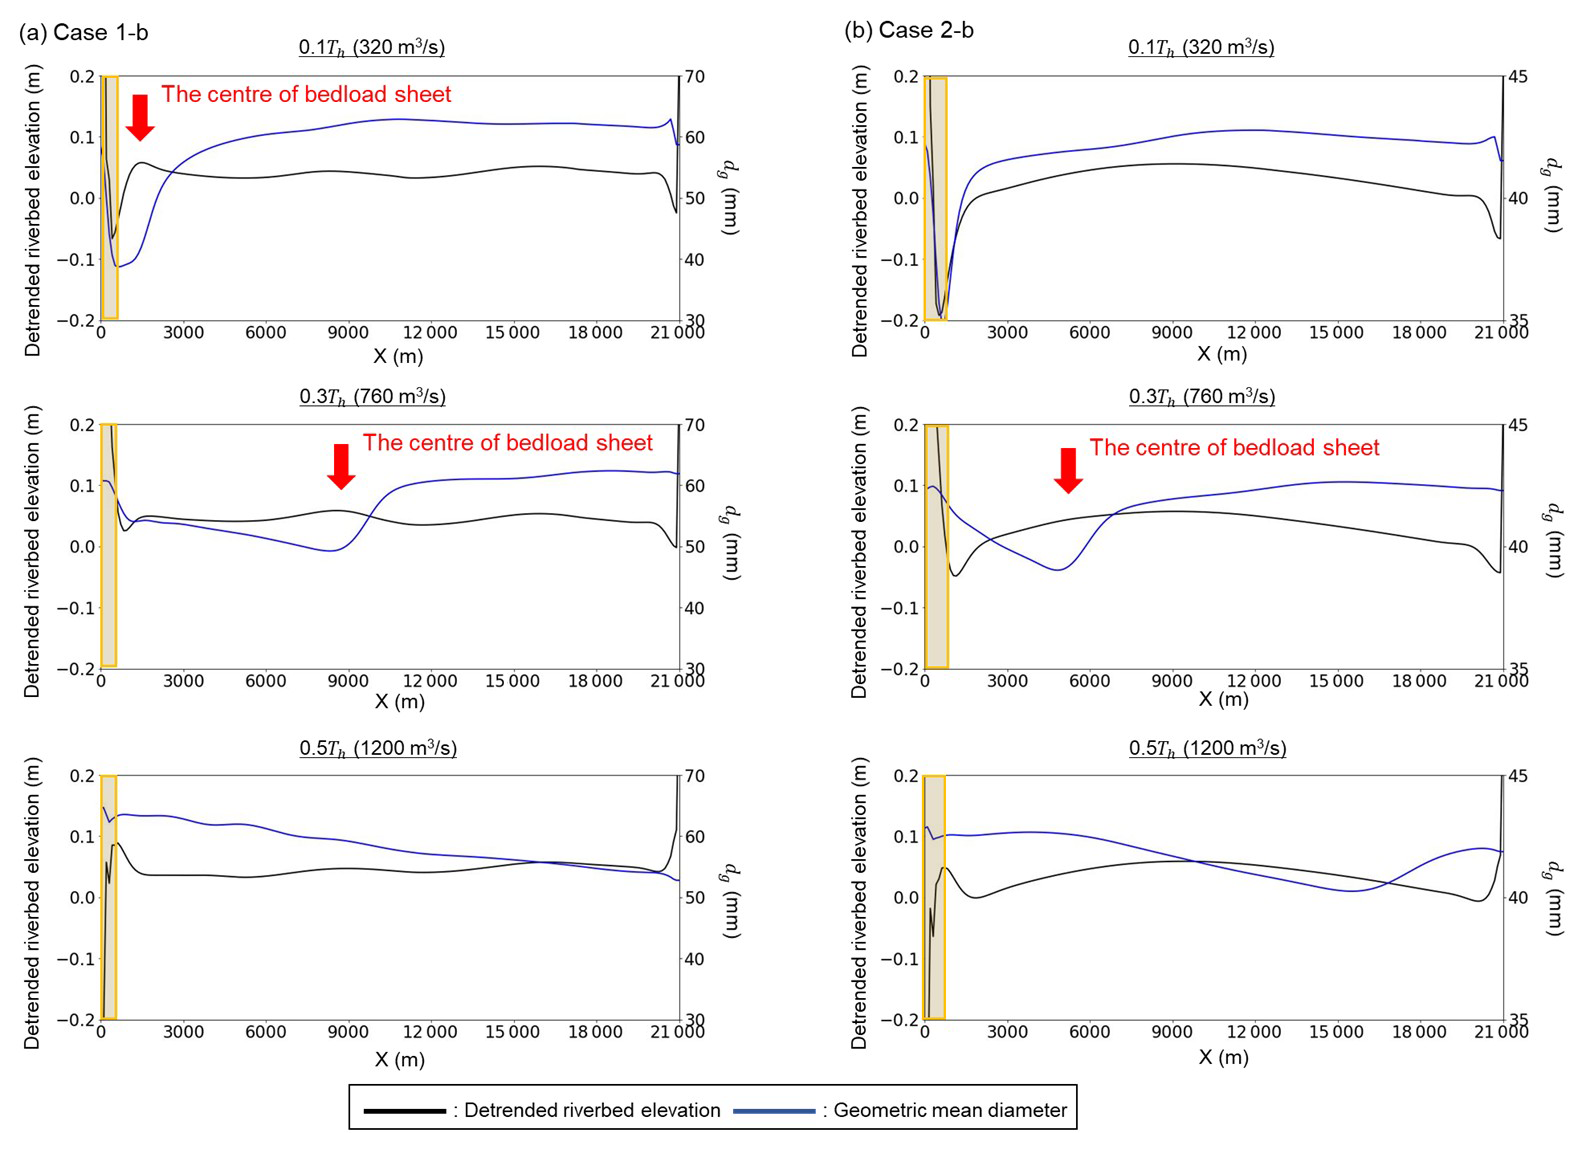
Figure 5The detrended riverbed elevation (subtracting the actual equilibrium riverbed slope) and the geometric mean grain size, dg, along the right bank (Y=0 m) within the final hydrograph: (a) Case 1-n and (b) Case 2-n. The yellow area indicates the HBL-like reach.
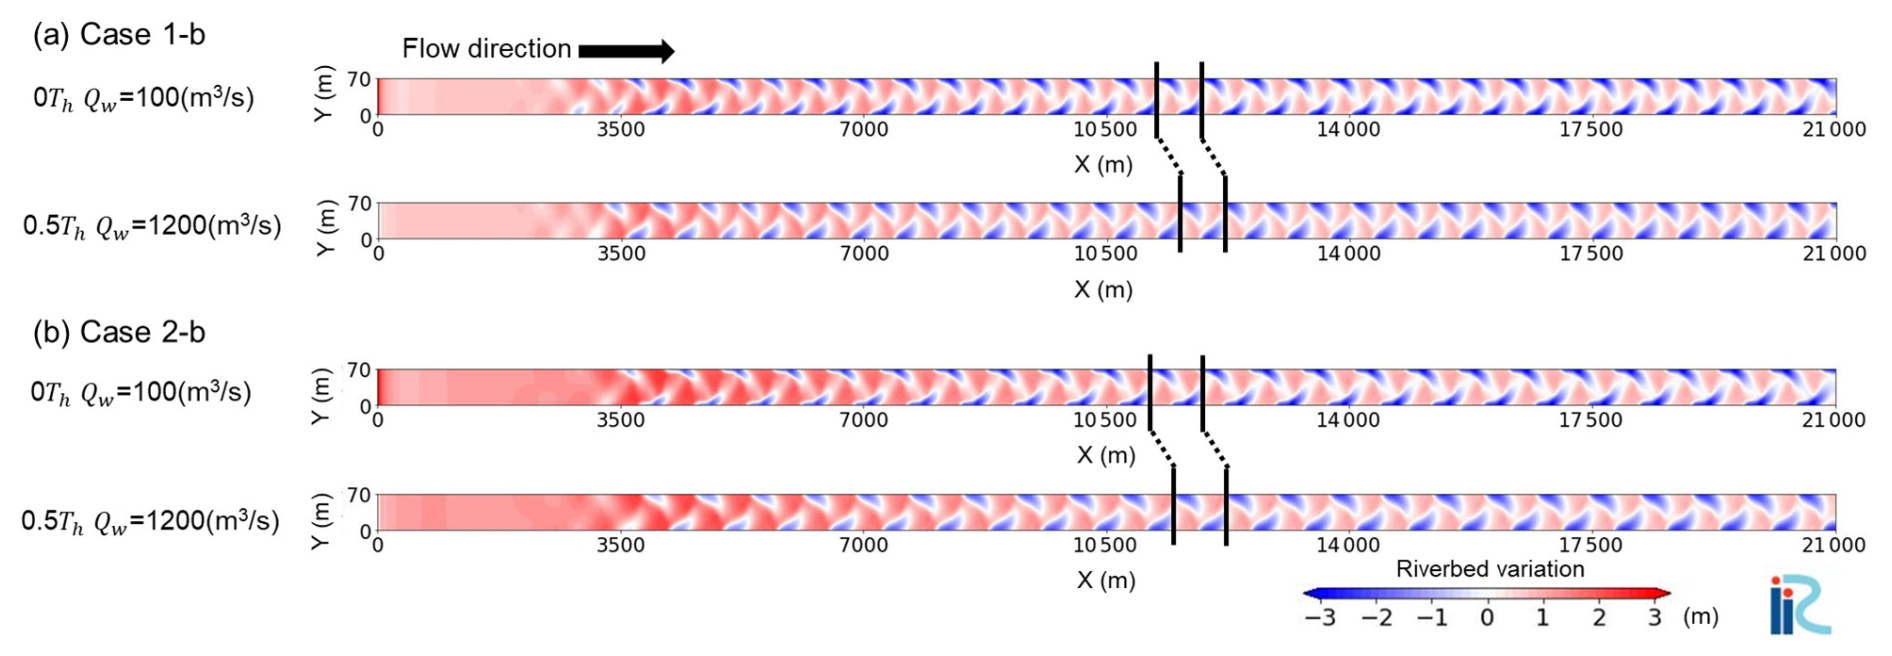
Figure 6The two-dimensional riverbed variation from the initial riverbed elevation at 0Th (upper panel) and 0.5Th (lower panel) within the final hydrograph: (a) Case 1-b and (b) Case 2-b. The black lines across the channel show the migration distance of bars.
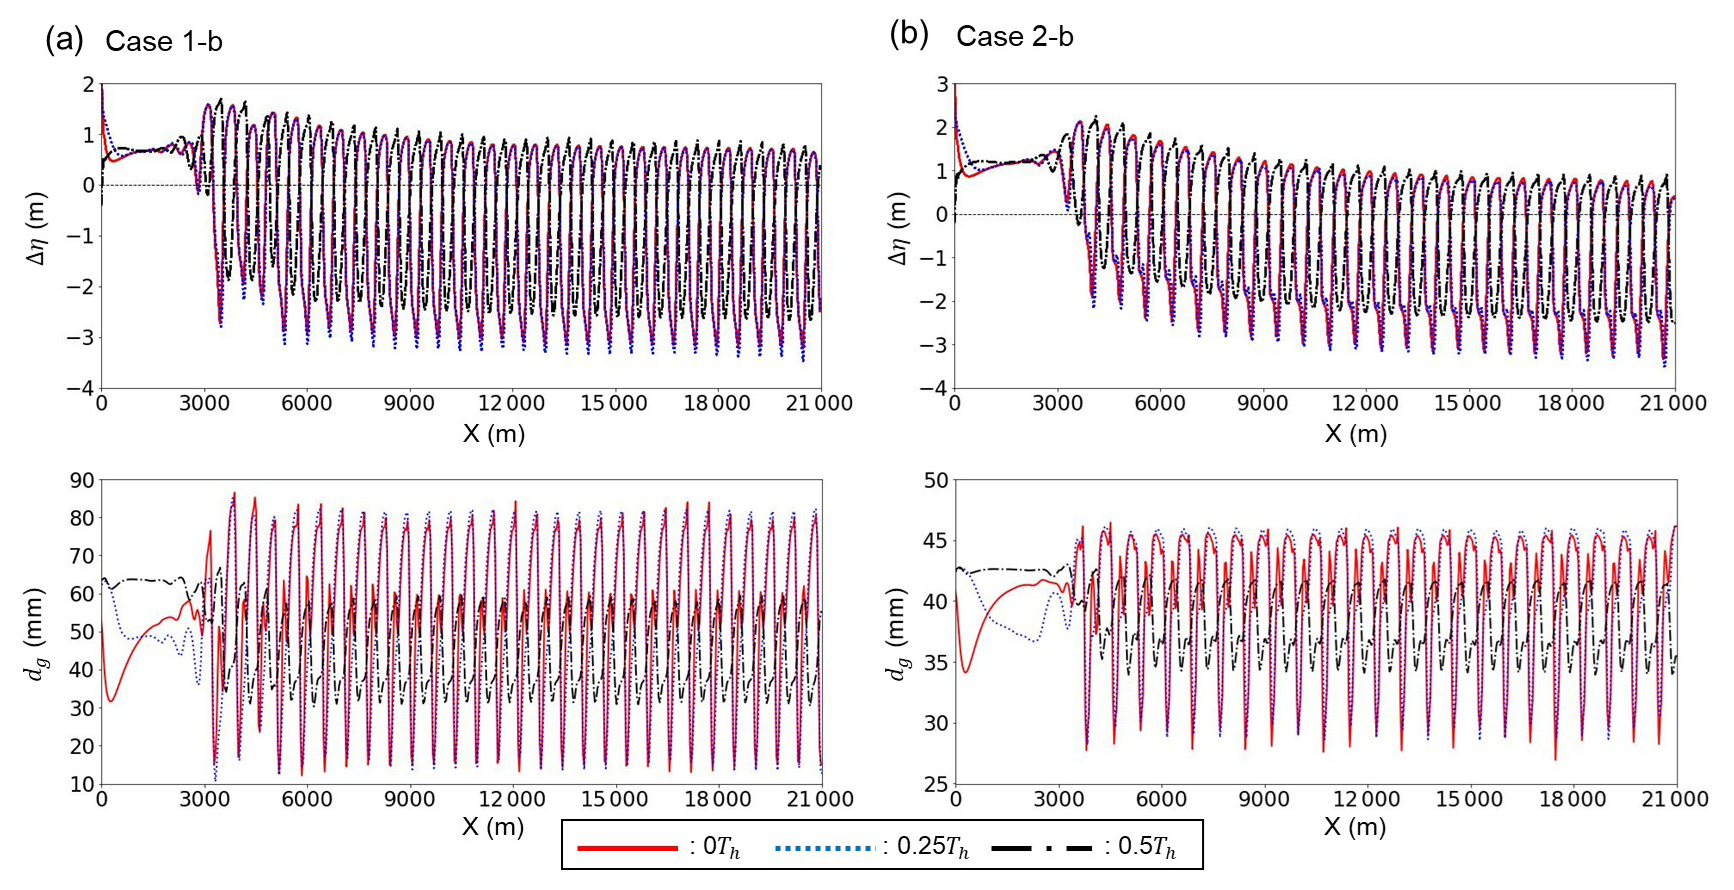
Figure 7Longitudinal riverbed variation from the initial riverbed elevation, Δη, and geometric mean grain size, dg, along the right bank (Y=0 m) within the final hydrograph: (a) Case 1-b and (b) Case 2-b. Each colour (red, blue, and black) corresponds to a specific time (0Th, 0.25Th, and 0.5Th). Note that bedload sheets cannot be visualised in the upper figure (Δη) because this figure is focused on bar configuration.
We then show how this feature differs in two-dimensional cases in the presence of migrating alternate bars; in other words, we investigate how long-migrating grain-sorting waves impact downstream alternate bar dynamics. Figure 6 and Movies S3 and S4 in the Supplement show that, in both cases, alternate bars were formed from X=3 km at the falling limb of the second hydrograph (80–160 h from the start) and migrated downstream. Alternate bars are induced by convective instability of the riverbed, in which the amplitude of perturbation grows as they are advected downstream. This growth requires a certain distance (time) to develop (Federici and Seminara, 2003). In this study, the required development length is 3 km. Figure 7 shows the longitudinal riverbed variation from the initial riverbed elevation and the geometric mean grain size along the right bank (Y=0 m) within the final hydrograph under the macroscopic equilibrium state. It is clear that bedload sheet migrates downstream, as in the non-bar cases; however, bedload sheet behaviour within alternate bars is unclear because the structure of the bars is approximately 2 orders of magnitude larger than that of bedload sheets.
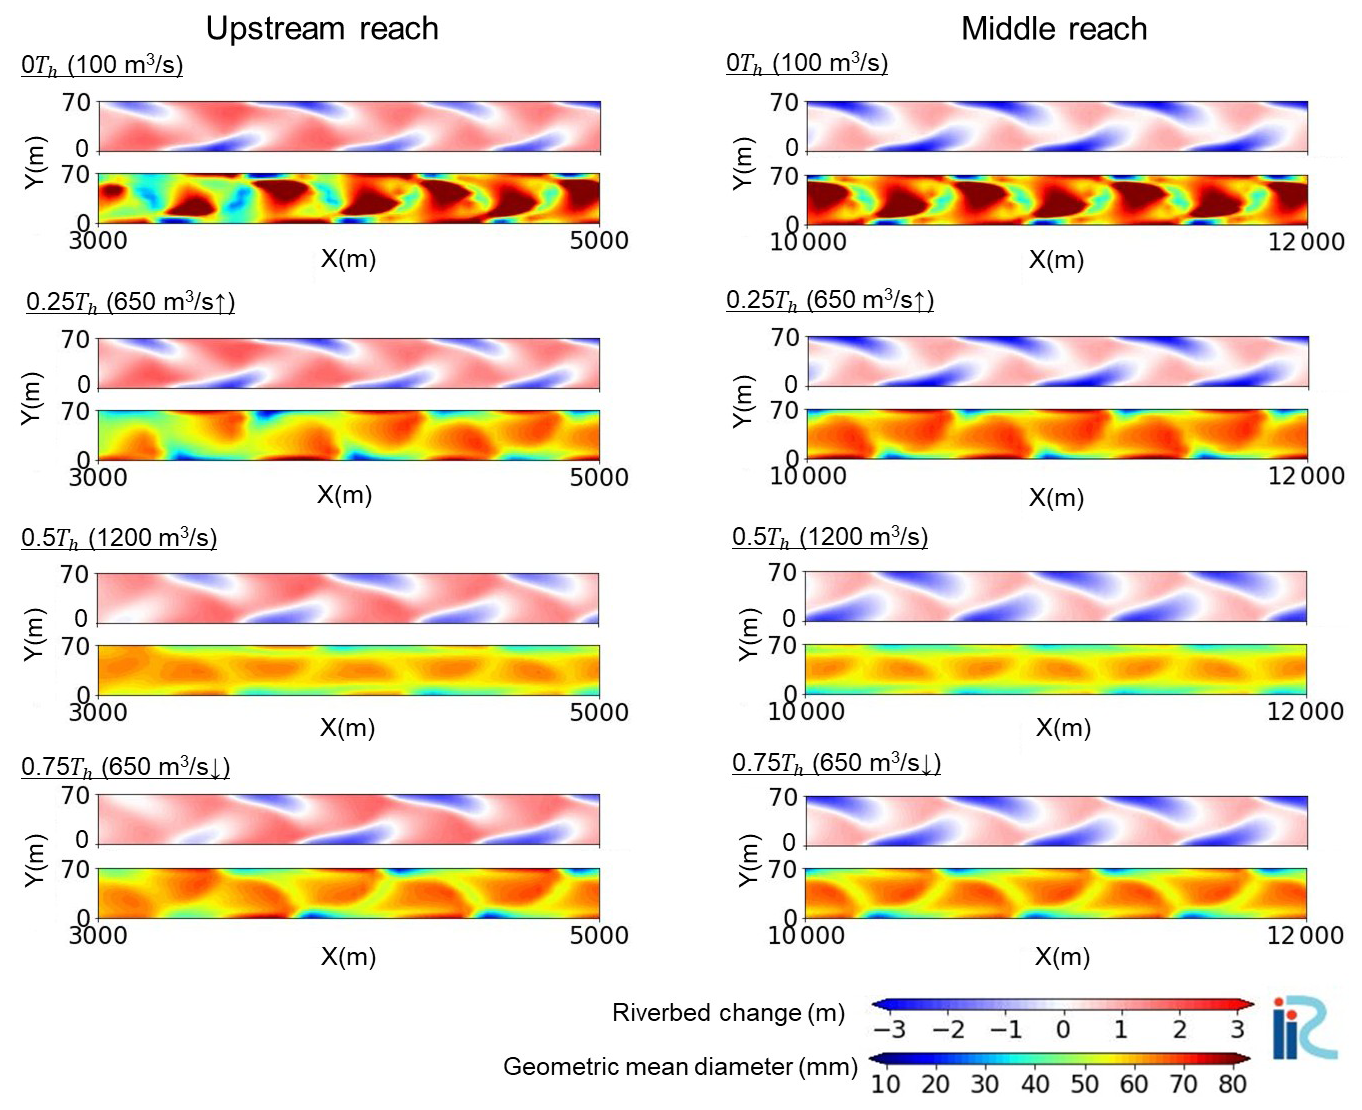
Figure 8Two-dimensional distributions of riverbed change (upper panel) and surface geometric mean diameter (lower panel) at each time (0Th, 0.25Th, 0.5Th, 0.75Th within the final hydrograph) in Case 1-b.
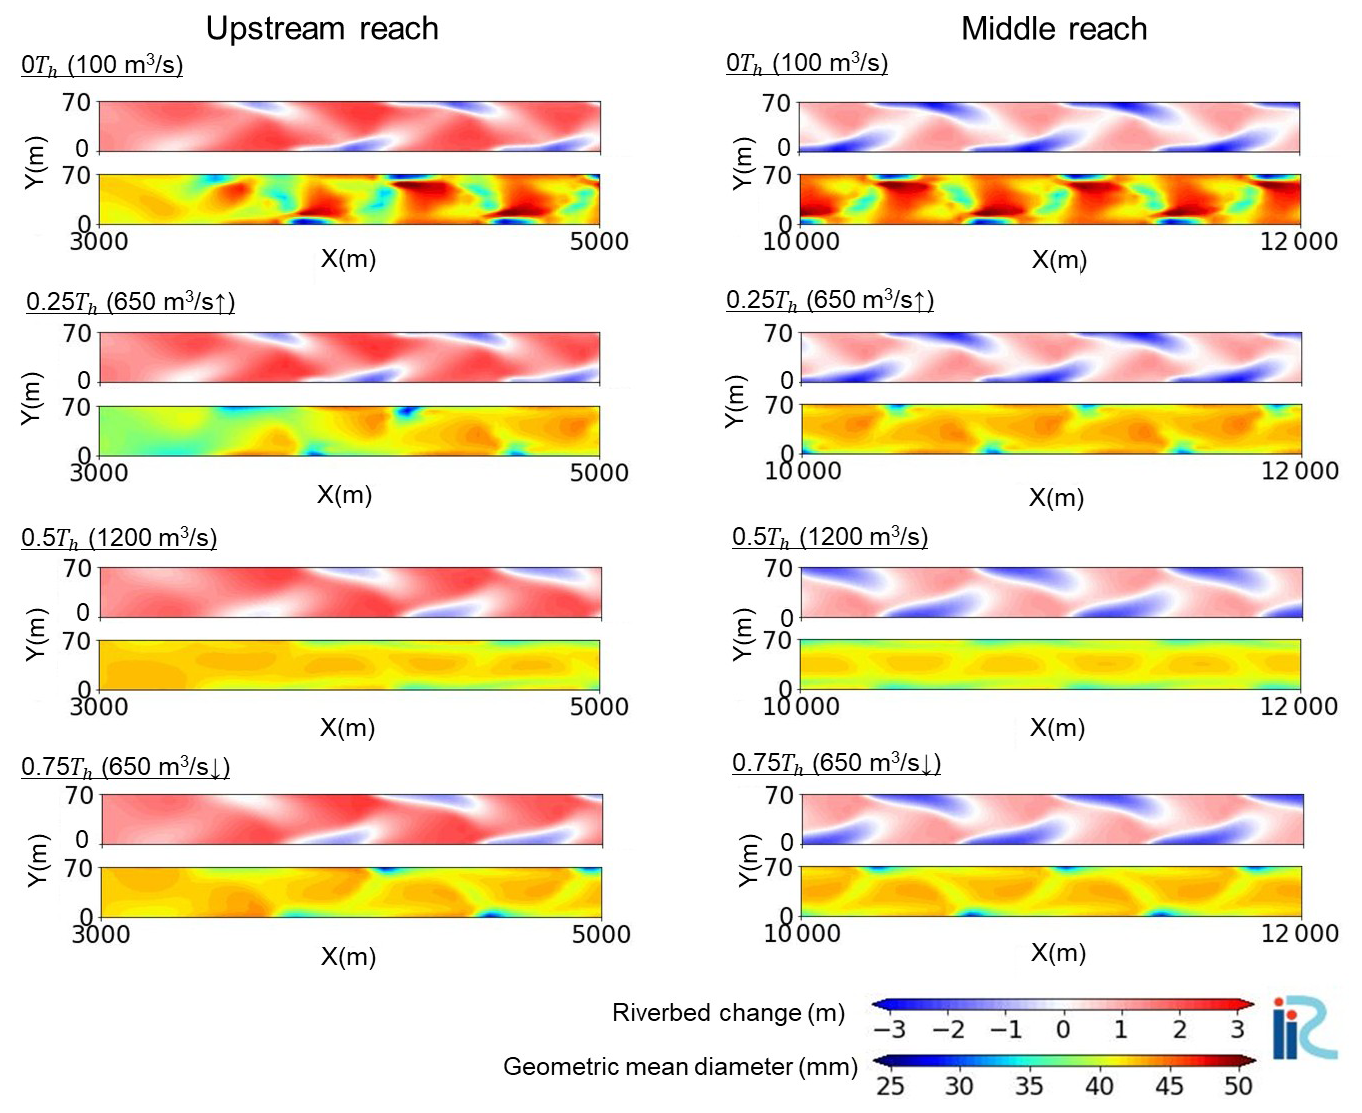
Figure 9Two-dimensional distributions of riverbed change (upper panel) and surface geometric mean diameter (lower panel) at each time (0Th, 0.25Th, 0.5Th, 0.75Th within the final hydrograph) in Case 2-b.
Figures 8 and 9 display the planimetric riverbed variation and geometric mean grain size within the final hydrograph (t=0Th, 0.25Th, 0.5Th, and 0.75Th) in the upstream (3–5 km) and middle reaches (10–12 km). Regardless of time, coarse bars and fine pools are typical surface textures for alternate bars in straight channels (Lisle and Hilton, 1999; Nelson et al., 2010; Recking et al., 2016). Coarse patches are formed at the minimum flow discharge (0Th), and these patches are flushed as the flow discharge increases (Hassan and Church, 2001; Mao, 2012); thus, the maximum flow stage (0.5Th) has the smallest geometric mean grain size in a single hydrograph. Comparisons of the two reaches (i.e. the upstream and middle reaches) illustrate that the middle reach has regular bar shapes, whereas the upstream reach has slightly irregular shapes. A clear difference in the morphodynamic features between the upstream and middle reaches was observed in the surface texture of the rising limb (0.25Th) and falling limb (0.75Th). In general, the surface texture becomes coarser at the rising limb owing to coarse patches formed at the minimum flow discharge (Mao, 2012), which is seen in the middle reach, where the bar shape is regular. However, the upstream reach exhibited finer surface textures in the rising limb because the migrating bedload sheet reached the upstream bars, resulting in a large supply of fine particles. To quantitatively confirm this bar shape difference, we conducted a wavelet analysis to detect spatial changes in the dominant bar length. Wavelet analysis was introduced by Grossmann and Morlet (1984) to treat geophysical seismic signals and can accurately analyse unstable signals. Only a few studies have employed this method for river morphology. Huang et al. (2023) used wavelet analysis to investigate the local migration period in alternate bars, which is fully applicable to the calculation of the wavelength in alternate bars. Figure 10 shows the results of the wavelet analysis of the dominant wavelength along the right bank (Y=0 m) at 0Th and 0.5Th within the final hydrograph. The results show a strong peak downstream of 3 km, such that the dominant bar length is consistent in space in this reach. The wavelength of Case 1-b, which had more poorly sorted sediment, was approximately 600–650 m, shorter than that of Case 2-b (approximately 750 m). This relationship between sediment features and wavelength agrees with the linear stability analysis performed by Lanzoni and Tubino (1999). In case 1-b, although a strong peak appeared 7 km upstream, a secondary peak can also be observed around the dominant peak, indicating that the bar shape was slightly irregular. Importantly, this indication of an irregular bar is not evident in Case 2-b, which is a relatively better-sorted sediment than in Case 1-b. This indicates that a grain-sorting wave with some degree of fine or coarse features may affect alternate bar dynamics.
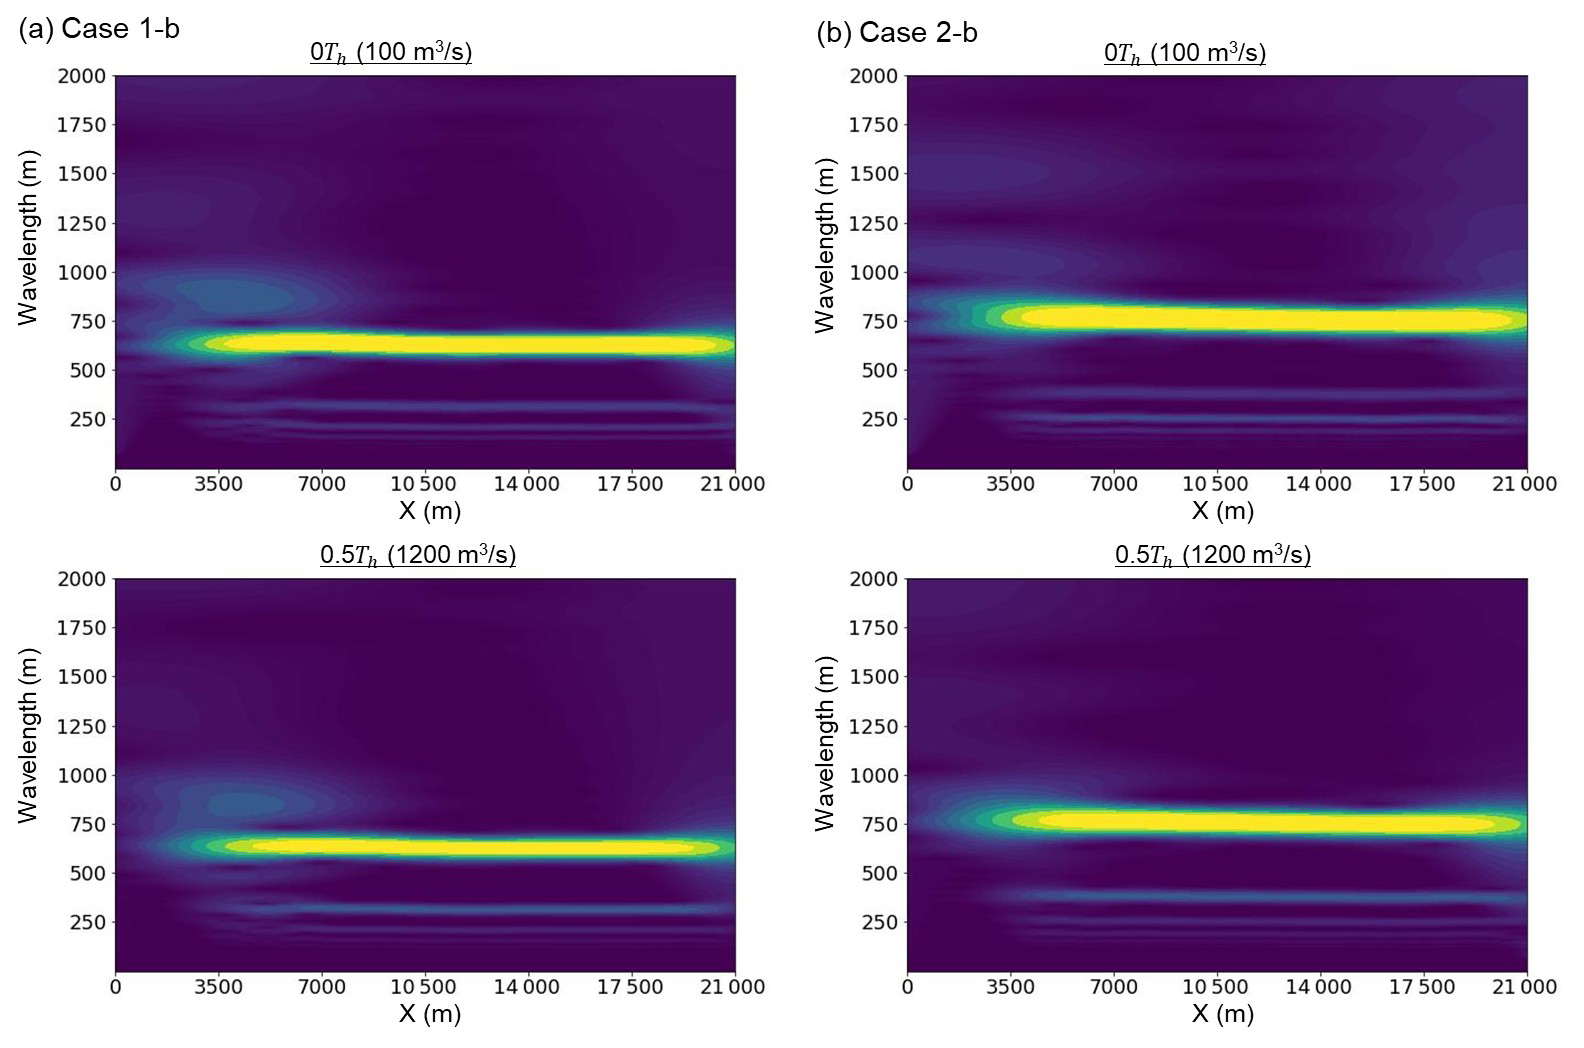
Figure 10Wavelet analysis of the dominant wavelength along the right bank (Y=0 m) at 0Th and 0.5Th within the final hydrograph: (a) Case 1-b and (b) Case 2-b.
To quantify the behaviour of bedload sheets within the bars, we examined the longitudinal distribution of the sediment flux for each grain size. Figures 11 and 12 show the longitudinal distributions of the cross-sectional average bedload transport flux, , for each grain size in Cases 1-b and 2-b, respectively. The small fluctuations observed at X=3.5–21 km are due to the bars. Figure 11 shows a strong temporal variation in the sediment transport rate corresponding to the riverbed change near the upstream end, which was also observed for well-sorted sediment (Wong and Parker, 2006). In addition, the local peak of migrates downstream as a bedload sheet in the early stage of the rising limb (0.1Th–0.2Th) and then reaches the train of alternate bars. At 0.3Th and 0.5Th, the local peak of becomes unclear, but the spatial variation in within the grey area shows a slight irregularity compared with that in the further downstream reach. In contrast, downstream of 7 km, these small variations were absent, and the sediment flux remained constant in space, indicating that this reach was in a dynamic equilibrium state. This indicates that bedload sheets affect the sediment transport rate only 7 km upstream in the rising limb. Since this length aligns with the reach that shows bar irregularity (Fig. 10a), it suggests that bedload sheets can affect bar characteristics, including wavelength, in this reach. However, unlike the non-bar case, the bedload sheet disappeared as it migrated within the bar area because the bar structure was larger than that of bedload sheets. Although Fig. 11 shows an unclear local peak of at 0.3Th and 0.5Th, an irregular bar shape still exists (Fig. 10a). This suggests that the impact of bedload sheets on the bar shape, such as the wavelength, lasts longer than the lifetime of bedload sheets. In Case 2-b, the length affected by bedload sheets extended to approximately 4 km (Fig. 12), where the surface texture was irregular, indicating that the affected length in Case 2-b was shorter than that in Case 1-b. This is because the structure of bedload sheets in Case 2-b is smaller, and the associated effect on the bar dynamics is weaker than that in Case 1-b.
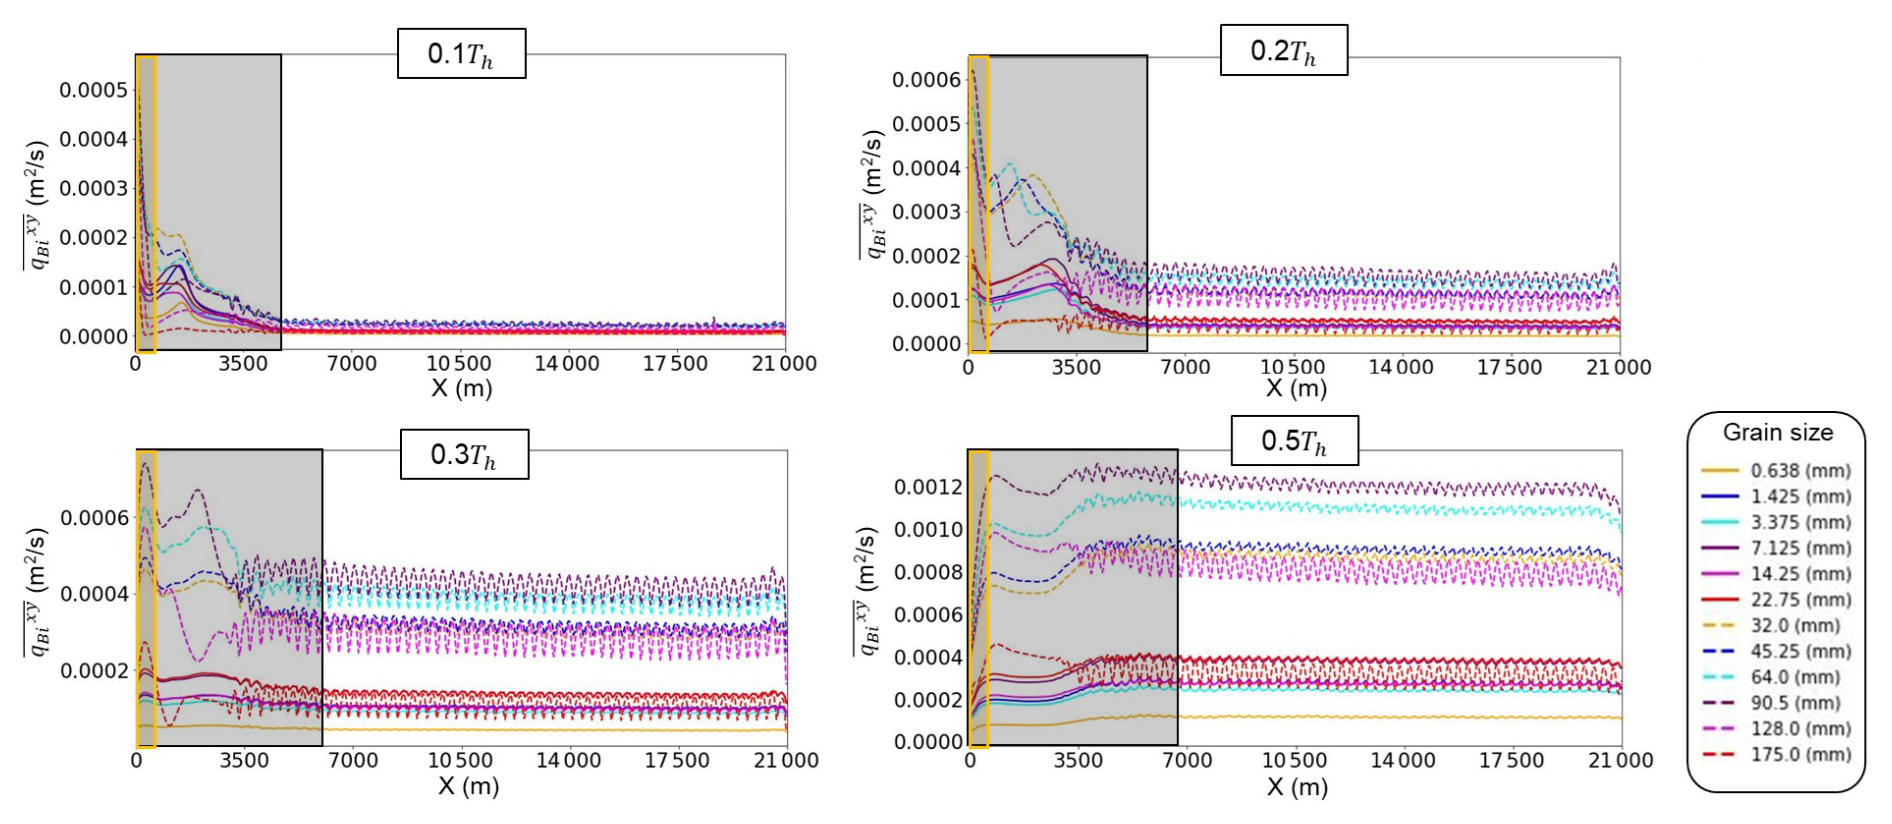
Figure 11Longitudinal distribution of the magnitude of cross-sectional average sediment transport flux, (, for each grain size at each time (0.1Th, 0.2Th, 0.3Th, and 0.5Th within the final hydrograph) in Case 1-b. Yellow and grey areas indicate HBL-like reach and the affected length by bedload sheets, respectively.
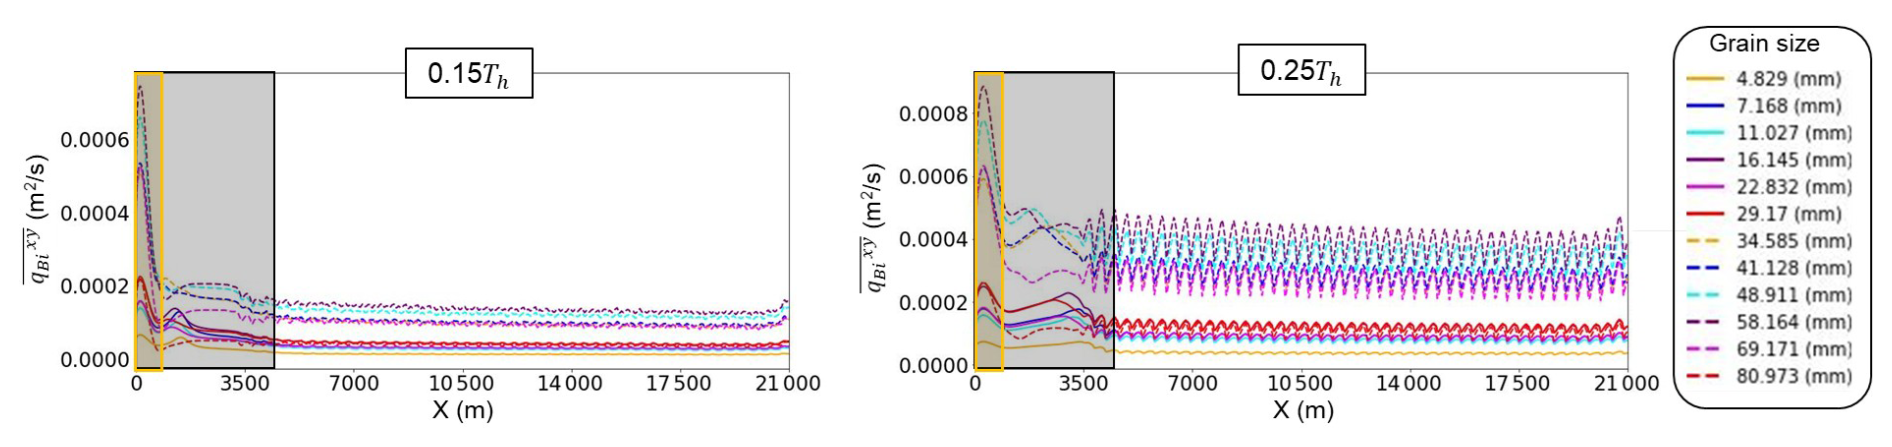
Figure 12Longitudinal distribution of the magnitude of cross-sectional average sediment transport flux, (, for each grain size at each time (0.15Th, 0.25Th within the final hydrograph) in Case 2-b. Yellow and grey areas indicate HBL-like reach and the affected length by bedload sheets, respectively.
Previous studies have suggested that bedload sheets disturb sediment transport (Whiting et al., 1988; Venditti et al., 2008; Nelson et al., 2009; Recking et al., 2009). Figures 13–15 present the temporal flow discharge variation and each corresponding variable during the final hydrograph under the equilibrium state: the cross-sectional average sediment transport flux, ; the cross-sectional average riverbed variation from initial riverbed elevation, ; and the cross-sectional average geometric mean diameter, , respectively. These figures display the hysteresis patterns at 420 m (within the HBL), 3570 m (within the affected length of bedload sheets in the bar cases), and 11 340 m (outside the affected length of bedload sheets in the bar cases). Within the HBL, the peak of preceded the flow peak, indicating a strong clockwise (CW) hysteresis. A similar CW hysteresis in is observed, which means that the riverbed slope within the HBL is steeper in the rising limb than the falling limb. In contrast, there was no obvious hysteresis in except for bedload sheets. This implies that the riverbed slope is a key factor controlling the CW hysteresis in . According to Wong and Parker (2006), HBL magnitude is governed by channel slope, sediment supply volume, and single hydrograph duration. Consequently, hysteresis magnitudes in and are solely dependent on these three parameters and are not influenced by the standard deviation of grain size distribution. However, outside the HBL (i.e. X=3570 m), obvious hysteresis in was still observed in Case 1 (i.e. a more poorly sorted case). In this case, magnitude is very small, but shows strong hysteresis (Figs. 14 and 15). This suggests that the sediment transport hysteresis observed outside the HBL is caused by bedload sheet migration. Case 2-n, which has a narrower grain size distribution range (ξ=0.5), exhibits a smaller disturbance induced by bedload sheets at 3570 m (Fig. 13) compared to Case 1-n, suggesting that bedload sheet magnitude contributes to hysteresis magnitude. Furthermore, a comparison between the non-bar cases (Cases 1-n and 2-n) and bar cases (Case1-b and 2-b) at 3570 m indicates that as bedload sheets gradually dampen within alternate bars, hysteresis magnitude correspondingly decreases.
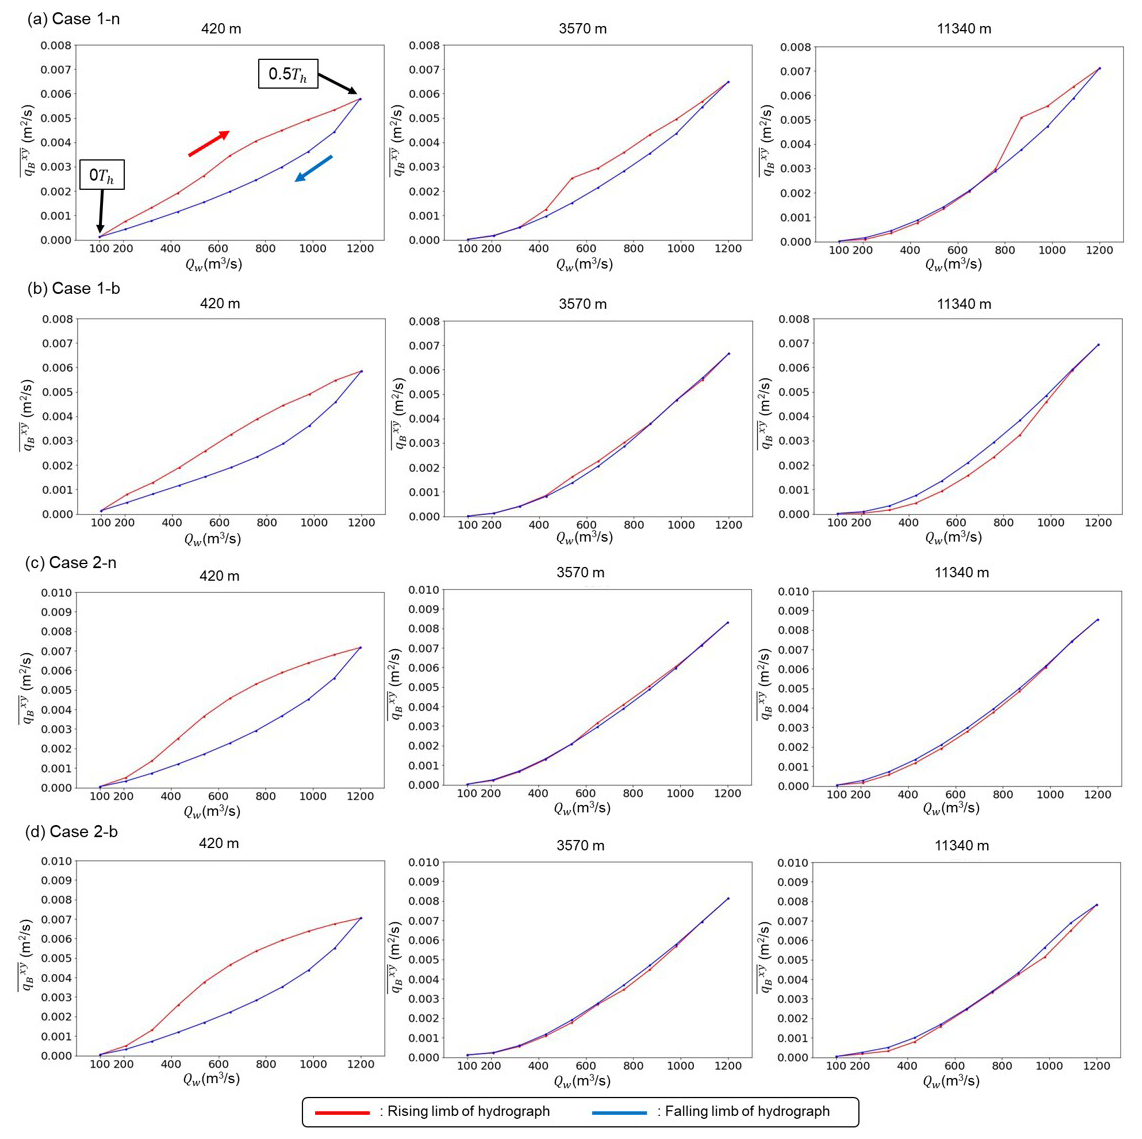
Figure 13Temporal variation of flow discharge, Qw, and the magnitude of cross-sectional average sediment transport flux, , within the final hydrograph: (a) Case 1-n, (b) Case 1-b, (c) Case 2-n, and (d) Case 2-b. The red and the blue lines correspond to the rising limb and the falling limb, respectively.
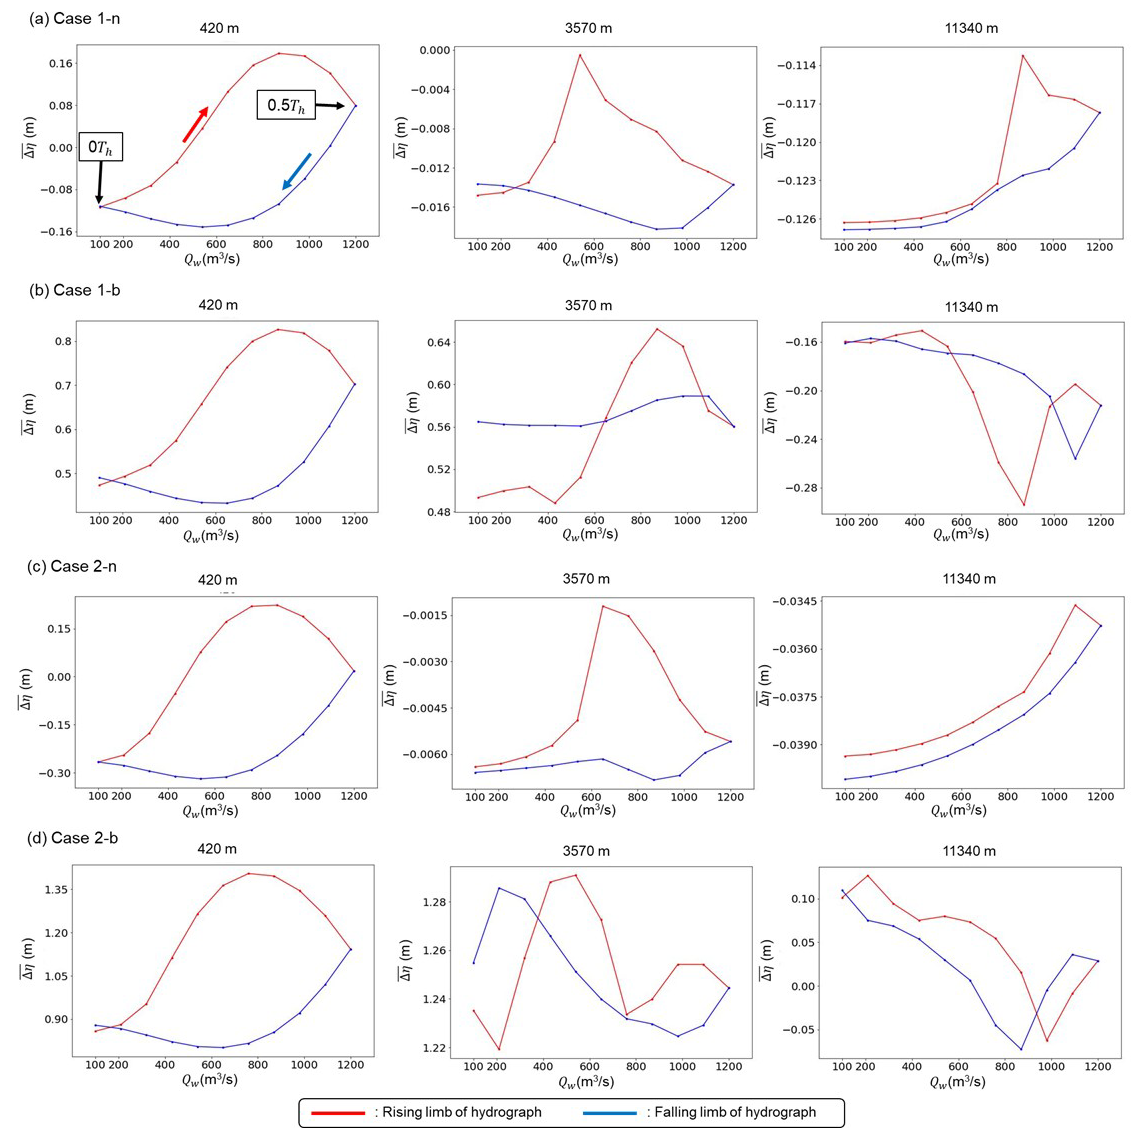
Figure 14Temporal variation of flow discharge, Qw, and the cross-sectional average riverbed variation from initial riverbed elevation, , within the final hydrograph: (a) Case 1-n, (b) Case 1-b, (c) Case 2-n, and (d) Case 2-b. The red and the blue lines correspond to the rising limb and the falling limb, respectively.
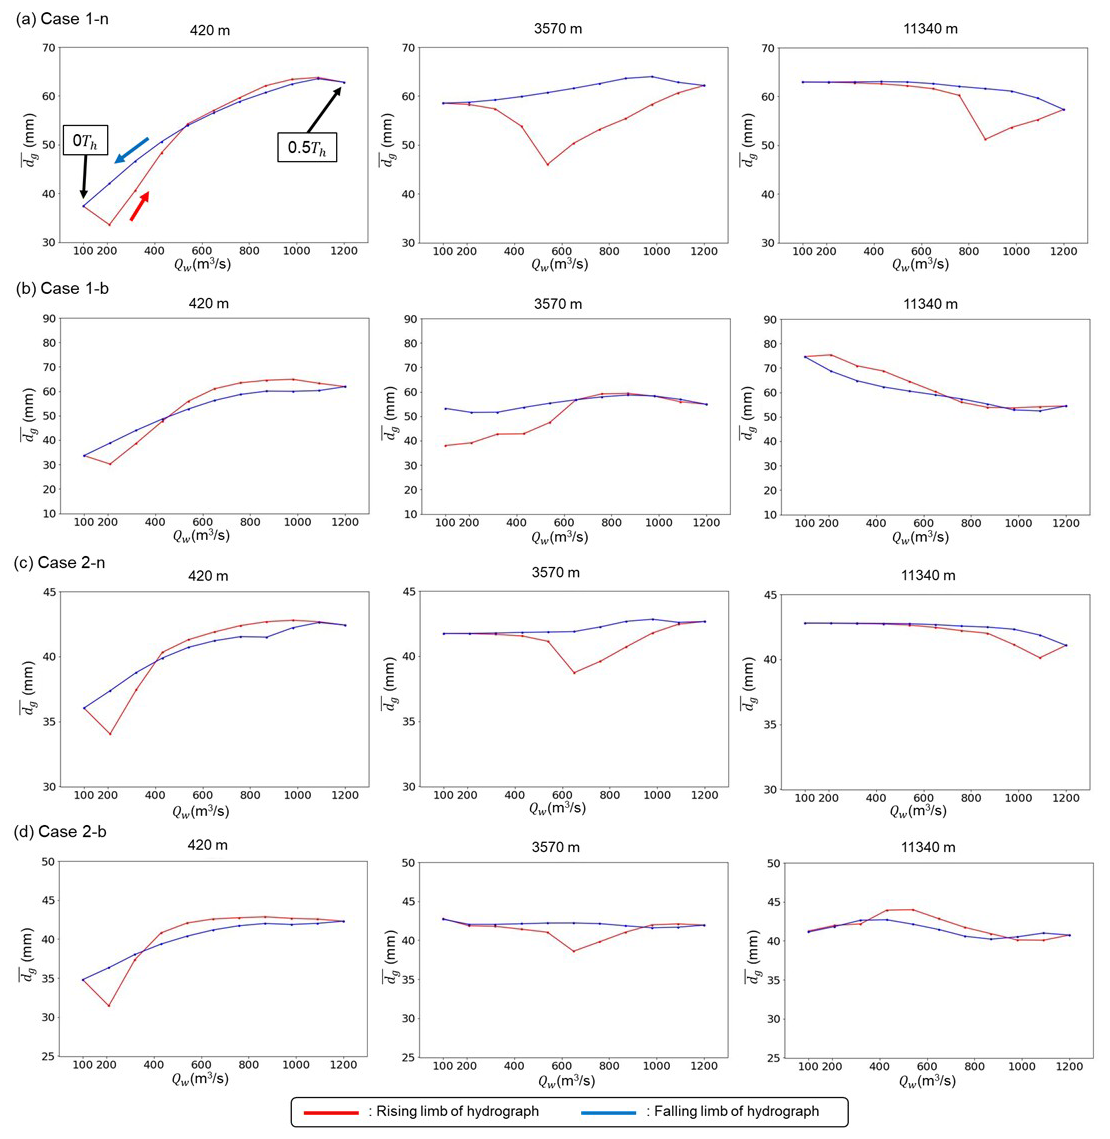
Figure 15Temporal variation of flow discharge, Qw, and the cross-sectional average geometric mean diameter, , within the final hydrograph: (a) Case 1-n, (b) Case 1-b, (c) Case 2-n, and (d) Case 2-b. The red and the blue lines correspond to the rising limb and the falling limb, respectively.
The focus of this study was to understand the effect of sediment supply conditions in poorly sorted sediment on downstream river morphodynamics and the corresponding grain size distribution. Herein, we employed the HBL concept as an effective spatial scale for the non-equilibrium sediment supply from the upstream end. Although this study used simplified upstream conditions (a symmetric triangular hydrograph and constant sediment supply) to create the HBL, this computational setting can partly represent the morphodynamic features that may occur under conditions of unsteady flow and non-equilibrium sediment supply.
Under the upstream conditions of symmetric triangular-shaped hydrographs and a constant sediment supply, bedload sheets, which are a type of grain-sorting wave, formed within the HBL and migrated far downstream from the upstream end (Fig. 5). These bedload sheets are not due to instability of the riverbed (Seminara et al., 1996) but are formed because of an imbalance between the sediment supply and sediment transport capacity (An et al., 2017). This is consistent with the characteristics of bedload sheets, which have grain-scale coarse tips and a zone behind the coarse particles filled with fine particles, as observed in the field (Whiting et al., 1988) and experiments (Kuhnle and Southard, 1988; Venditti et al., 2008; Nelson et al., 2009; Recking et al., 2009). Bedload sheets simulated in our numerical experiments are also a type of morphodynamic feature. Furthermore, bedload sheet characteristics depend on the sediment transport and grain size distribution of the riverbed (An et al., 2017), and their magnitude contributes to their effect on the downstream bar morphology (Figs. 10–12). However, this study only applies to gravel-bed rivers with poorly sorted sediment; thus, different phenomena occur in rivers with well-sorted sediment or those dominated by suspended sediment.
Bedload sheet migration changes sediment mobility, which only affects the alternate bar morphology located upstream. However, bedload sheets disappear as they migrate through the bar reach (Figs. 11–15). This indicates that the reach length affected by bedload sheet was limited, and bedload sheet migration had little effect on most parts of the alternate bars in our simulation. Several studies have reported similar morphological characteristics. For instance, Lisle et al. (1997) reported that sediment pulses had little effect on the dynamics of alternate bars. It should be noted that they used well-sorted sediment; however, our results agree with their findings. Nelson et al. (2015) concluded that a riffle–pool structure played a role in dissipating sediment pulses. Although the riffle–pool and alternate bars are different bedforms, their experimental results support our results in that the three-dimensional bedform structure disperses migrating sediment waves caused by non-equilibrium sediment supply conditions. Iwasaki et al. (2017), who numerically clarified the dynamics of bedload particle tracers in alternate bars, claimed that migrating alternate bars significantly affected tracer movement, resulting in superdiffusion of the tracer, which led to much faster sediment dispersal than normal dispersion. These studies and the current numerical results show that sediment mixing and dispersal due to migrating alternate bars are the main causes of bedload sheet dissipation within short distances and the inhibition of further downstream migration. On the other hand, Humphries et al. (2012) experimentally observed the sediment pulse dynamics on fixed alternate bars that were immobilised using sandbags to prevent exposure to sediment pulses. Their results indicated that sediment pulses mainly migrated to a channel pool characterised by fixed alternate bars, as if bypassing the fixed bars. Although the pulse celerity varied locally because of the local flow features forced by the alternate bars, the sediment pulse migrated further downstream. The morphological features of large-scale bedforms, such as alternate bars and their dynamics (i.e. mobile or immobile), play a critical role in the migration of bedload sheets.
Our study focuses on how long the impact of an ephemeral, non-equilibrium sediment supply (i.e. a cycled triangular hydrograph with constant sediment supply) propagates within alternate bars. This represents the short-term-scale (i.e. single flood) effect of sediment supply on downstream river morphology. In contrast to our study, in which the impact of the non-equilibrium sediment supply on bar dynamics was limited, many experimental studies have argued that there are strong impacts of the sediment inflow (Podolak and Wilcock, 2013; Bankert and Nelson, 2018; Nelson and Morgan, 2018) or cut-off (Lisle et al., 1993; Venditti et al., 2012). A much larger and longer sediment supply/reduction effect will eventually change the alternate bar dynamics. In many previous studies, the effects of the sediment supply were observed to extend throughout the entire flume because of its limited length. Moreover, these studies have primarily focused on the impact of permanent changes in sediment supply conditions. Thus, the critical difference between our study and previous studies was the timescale. Long-term changes are beyond our scope, but our results may help distinguish between the short- and long-term effects of changes in sediment supply conditions of river morphodynamics.
The triangular hydrograph and bedload sheet passage caused hysteresis in sediment transport (Fig. 13). Bedload sheets only migrate downstream during the rising limb, leading to a strong ephemeral clockwise hysteresis (CW: the sediment transport peak precedes the flow peak). Humphries et al. (2012) reported that couterclockwise hysteresis (CCW: the flow peak precedes the sediment transport peak) was observed with sediment pulses, owing to the lag caused by the transport distance between the source and measurement points. However, after sediment pulse injection, there was a large amount of available sediment in the channel, resulting in CW hysteresis. The hysteresis observed in our study, which was caused by the ephemeral increase in sediment transport induced by bedload sheets, supports their finding that sediment pulses indirectly affect hysteresis. Our numerical results suggest that the grain-sorting wave contributes to the sediment transport hysteresis; however, the presence of alternate bars suppresses this hysteresis. This indicates that not only the flow regime but also the interactions among different morphological features, such as grain-sorting waves and alternate bars, play key roles in sediment transport characteristics, such as hysteresis.
Our computational results indicate that bedload sheet migration generated by a single flood hydrograph event has a limited effect on the alternate bar dynamics. This is valid for a spatiotemporal scale but is dependent on the flow regime, intensity of the sediment source impact, and sediment composition of the riverbed and feeding. For example, the amount of sediment supply affects HBL size (Wong and Parker, 2006) and the migration celerity of bedload sheets (Nelson et al., 2009). Venditti et al. (2008) reported that bedload sheets are only formed when the sediment supply is reasonably close to the sediment transport capacity and all particles are in a fully mobile state. As the shear stress on the riverbed increases, bedload sheets either transition into dunes (Whiting et al., 1988) or disappear (Recking et al., 2009). In addition, riverbed and sediment supply compositions also significantly contribute to determining the sediment mobility (Wilcock and Crowe, 2003) and bar characteristics (Lanzoni and Tubino, 1999). In particular, fine particles improve coarse particle mobility, which is known as the magic sand effect (Wilcock, 1998; Wilcock et al., 2001; Parker et al., 2024; Hassan et al., 2024). Fine sediments smooth the riverbed surface, thereby activating the following two mechanisms: (1) skin friction reduction, which increases the flow velocity and sediment transport volume (geometric mechanism), and (2) easier particle entrainment on a hydraulically smooth bed compared to those on a hydraulically rough bed (viscous mechanism). In this case, bedload sheets deliver more fine-grained sediment, contributing not only to the bar shape but also to bar mobility (Podolak and Wilcock, 2013; Bankert and Nelson, 2018). As bedload sheets and fluvial bars are sensitive to external forces, different hydrographs and sediment supplies may cause different morphodynamic phenomena (Gaeuman, 2014; Peirce et al., 2019). Finally, the dynamics of large-scale morphological features such as alternate bars also affect bedload sheet dispersal. This study only addressed migrating alternate bars; however, Iwasaki et al. (2017) indicated that the dispersal patterns of incoming sediment from upstream differ between migrating and non-migrating bars. Fixed bars are more likely to store incoming sediment, meaning that migrating and non-migrating bars may interact differently with bedload sheets. Furthermore, in the presence of other bed morphologies (e.g. multiple-row bars and braiding), bedload sheet dynamics and interactions with the respective bedforms differ from those of alternate bars. These complexities related to the hydrograph, sediment supply, texture, and morphological features may play key roles in controlling the morphodynamic features targeted in this study, suggesting the need for further studies to understand large parameter spaces.
In this study, we present numerical simulations of the interaction between alternate bar dynamics and bedload sheet migration in poorly sorted sediment to understand the morphological response of alternate bars to non-equilibrium sediment supply conditions. Specifically, we perform two-dimensional morphodynamic calculations using iRIC-Nays2DH in a straight channel under repeated cycles of an unsteady water hydrograph and a constant supply of poorly sorted sediment. In well-sorted sediment cases, the upstream non-equilibrium sediment supply can only propagate a limited distance from the upstream end (i.e. the hydrograph boundary layer, Wong and Parker, 2006). However, poorly sorted sediment cases break down the HBL concept, meaning that low-amplitude bedload sheets generated by non-equilibrium sediment supply conditions propagate far downstream (An et al., 2017). In this context, the upstream water and sediment boundary conditions may affect the far-downstream river dynamics through the migration of bedload sheets. This study aims to quantify the effect of bedload sheets on downstream river morphology, specifically on alternate bars. This does not mimic the specific situation in natural streams; rather, we aim to represent the morphodynamic response of gravel-bed rivers with poorly sorted sediment to the upstream forcing condition in which the sediment supply volume and sediment transport capacity do not match under unsteady flow conditions.
The numerical results showed that clear bedload sheets migrated downstream in the poorly sorted sediment case and affected the train of alternate bars that developed in the downstream reaches. More specifically, bedload sheets supply fine sediment to the alternate bars, contributing to a change in the surface texture of the bars and irregularity of the bar characteristics (i.e. wavelength). This effect of bedload sheets on bar morphology in the case with a narrower grain size distribution is weaker than that in the case with a wider distribution, owing to the smaller magnitude of bedload sheets. This suggests an important effect of bedload sheets on the downstream alternate bars and further suggests that the upstream non-equilibrium sediment supply condition plays a non-negligible role in downstream river morphodynamics. However, this effect did not propagate along the entire channel and disappeared completely in the alternate bars located further downstream. The alternate bars in the downstream reach exhibited regular patterns, suggesting that the effect of bedload sheets was limited or negligible. This is because the structure of the bars is approximately 2 orders of magnitude larger than that of bedload sheets; therefore, bedload sheets are strongly dispersed as they migrate into alternate bars. This suggests that bedload sheets, generated by an imbalance between the upstream sediment supply and transport capacity, have a limited effect on the downstream river morphodynamics as long as larger and more active morphological features, such as alternate bars, are dominant in the targeted river reach.
Our study was performed under a limited set of parameters, such as hydrograph, sediment supply conditions, and grain size distribution; therefore, a wider range of parameters should be investigated in future studies. In addition, although our findings should be interpreted as a short-term-scale effect of upstream boundary conditions on downstream river morphology, longer-term upstream conditions are likely to have a more dominant impact over time. Nevertheless, our results may help to distinguish between the short- and long-term effects of changes in sediment supply conditions of river morphodynamics.
The data used to support the findings of this study are available from the corresponding author upon request.
The videos can be accessed via the following links: https://doi.org/10.5446/70174 (Tanabe, 2025a), https://doi.org/10.5446/70172 (Tanabe, 2025b), https://doi.org/10.5446/70173 (Tanabe, 2025c), https://doi.org/10.5446/70175 (Tanabe, 2025d), https://doi.org/10.5446/70176 (Tanabe, 2025e), https://doi.org/10.5446/70177 (Tanabe, 2025f), https://doi.org/10.5446/70178 (Tanabe, 2025g), and https://doi.org/10.5446/70179 (Tanabe, 2025h).
ST – conceptualisation, funding acquisition, methodology, investigation, software, and writing (initial draft). TI – conceptualisation, funding acquisition, methodology, resources, software, supervision, and writing (initial draft and reviewing and editing).
The contact author has declared that neither of the authors has any competing interests.
Publisher's note: Copernicus Publications remains neutral with regard to jurisdictional claims made in the text, published maps, institutional affiliations, or any other geographical representation in this paper. While Copernicus Publications makes every effort to include appropriate place names, the final responsibility lies with the authors.
This research has been supported by JST SPRING (grant no. JPMJSP2119) and JSPS KAKENHI (grant no. 25KJ0486).
This paper was edited by Rebecca Hodge and reviewed by Chenge An and one anonymous referee.
An, C., Fu, X., Wang, G., and Parker, G.: Effect of grain sorting on gravel bed river evolution subject to cycled hydrographs: Bed load sheets and breakdown of the hydrograph boundary layer, J. Geophys. Res.-Earth, 122, 1513–1533, https://doi.org/10.1002/2016JF003994, 2017.
An, C., Moodie, A. J., Ma, H., Fu, X., Zhang, Y., Naito, K., and Parker, G.: Morphodynamic model of the lower Yellow River: flux or entrainment form for sediment mass conservation?, Earth Surf. Dynam., 6, 989–1010, https://doi.org/10.5194/esurf-6-989-2018, 2018.
Andrews, E. D.: Downstream effects of Flaming Gorge Reservoir on the Green River, Colorado and Utah, Geol. Soc. Am. Bull., 97, 1012–1023, https://doi.org/10.1130/0016-7606(1986)97%3C1012:DEOFGR%3E2.0.CO;2, 1986.
Ashida, K., Egashira, S., Liu, B., and Umemoto, M.: Sorting and Bed Topography in Meander Channels, Annuals of Disaster Prevention Research Institute, Kyoto University, 33, 261–279, 1990 (in Japanese).
Bankert, A. R. and Nelson, P. A.: Alternate bar dynamics in response to increases and decreases of sediment supply, Sedimentology, 65, 702–720, https://doi.org/10.1111/sed.12399, 2018.
Benda, L., Miller, D., Bigelow, P., and Andras, K.: Effects of post-wildfire erosion on channel environments, Boise River, Idaho, Forest Ecol. Manag., 178, 105–119, https://doi.org/10.1016/S0378-1127(03)00056-2, 2003.
Blum, M. D. and Roberts, H. H.: Drowning of the Mississippi Delta due to insufficient sediment supply and global sea-level rise, Nat. Geosci., 2, 488–491, https://doi.org/10.1038/ngeo553, 2009.
Bombar, G., Elçi, Ş., Tayfur, G., Güney, M. Ş., and Bor, A.: Experimental and Numerical Investigation of Bed-Load Transport under Unsteady Flows, J. Hydraul. Eng., 137, 1276–1282, https://doi.org/10.1061/(ASCE)HY.1943-7900.0000412, 2011.
Buraas, E. M., Renshaw, C. E., Magilligan, F. J., and Dade, W. B.: Impact of reach geometry on stream channel sensitivity to extreme floods, Earth Surf. Proc. Land., 39, 1778–1789, https://doi.org/10.1002/esp.3562, 2014.
Colombini, M., Seminara, G., and Tubino, M.: Finite-amplitude alternate bars, J. Fluid Mech., 181, 213, https://doi.org/10.1017/S0022112087002064, 1987.
Dai, H., Iwasaki, T., and Shimizu, Y.: Effect of Sediment Supply on Morphodynamics of Free Alternate Bars: Insights from Hydrograph Boundary Layer, Water-Sui., 13, 3437, https://doi.org/10.3390/w13233437, 2021.
Dietrich, W. E., Kirchner, J. W., Ikeda, H., and Iseya, F.: Sediment supply and the development of the coarse surface layer in gravel-bedded rivers, Nature, 340, 215–217, https://doi.org/10.1038/340215a0, 1989.
Erskine, W. D., Terrazzolo, N., and Warner, R. F.: River rehabilitation from the hydrogeomorphic impacts of a large hydro-electric power project: Snowy River, Australia, Regul. River., 15, 3–24, 1999.
Facchini, M., Vetsch, D. F., Boes, R. M., and Siviglia, A.: Modeling the morphological response of gravel-bed rivers subject to repeated sediment bypass tunnel operations, Front. Earth Sci., 12, 1357759, https://doi.org/10.3389/feart.2024.1357759, 2024.
Engelund, F.: Flow and Bed Topography in Channel Bends, J. Hydr. Eng. Div.-ASCE, 100, 1631–1648, https://doi.org/10.1061/JYCEAJ.0004109, 1974.
Exner, F M.: Über die Wechselwirkung zwischen Wasser und Geschiebe in Flüssen, Akad. Wiss. Wien Math. Naturwiss. Klasse, 134, 165–204, 1925.
Fields, J., Renshaw, C., Magilligan, F., Dethier, E., and Rossi, R.: A mechanistic understanding of channel evolution following dam removal, Geomorphology, 395, 107971, https://doi.org/10.1016/j.geomorph.2021.107971, 2021.
Federici, B. and Seminara, G.: On the convective nature of bar instability, J. Fluid Mech., 487, 125–145, https://doi.org/10.1017/S0022112003004737, 2003.
Gaeuman, D.: High-flow Gravel Injection for Constructing Designed In-channel Features: High-flow Gravel Injection, River Res. Appl., 30, 685–706, https://doi.org/10.1002/rra.2662, 2014.
Gaeuman, D., Schmidt, J. C., and Wilcock, P. R.: Complex channel responses to changes in stream flow and sediment supply on the lower Duchesne River, Utah, Geomorphology, 64, 185–206, https://doi.org/10.1016/j.geomorph.2004.06.007, 2005.
Grossmann, A. and Morlet, J.: Decomposition of Hardy Functions into Square Integrable Wavelets of Constant Shape, SIAM J. Math. Anal., 15, 723–736, https://doi.org/10.1137/0515056, 1984.
Gunsolus, E. H. and Binns, A. D.: Effect of morphologic and hydraulic factors on hysteresis of sediment transport rates in alluvial streams, River Res. Appl., 34, 183–192, https://doi.org/10.1002/rra.3184, 2018.
Harada, D. and Egashira, S.: Method to evaluate large-wood behavior in terms of the convection equation associated with sediment erosion and deposition, Earth Surf. Dynam., 11, 1183–1197, https://doi.org/10.5194/esurf-11-1183-2023, 2023.
Harada, D., Nagumo, N., Nakamura, Y., Egashira, S., and International Centre for Water Hazard and Risk Management (ICHARM) under the Auspices of UNESCO, Public Works Research Institute (PWRI): Characteristics of Flood Flow with Active Sediment Transport in the Sozu River Flood Hazards at the Severe Rainfall Event in July 2018, Journal of Disaster Research, 14, 886–893, https://doi.org/10.20965/jdr.2019.p0886, 2019.
Hassan, M. A. and Church, M.: Sensitivity of bed load transport in Harris Creek: Seasonal and spatial variation over a cobble-gravel bar, Water Resour. Res., 37, 813–825, https://doi.org/10.1029/2000WR900346, 2001.
Hassan, M. A., Egozi, R., and Parker, G.: Experiments on the effect of hydrograph characteristics on vertical grain sorting in gravel bed rivers, Water Resour. Res., 42, 2005WR004707, https://doi.org/10.1029/2005WR004707, 2006.
Hassan, M. A., Parker, G., Hassan, Y., An, C., Fu, X., and Venditti, J. G.: The roles of geometry and viscosity in the mobilization of coarse sediment by finer sediment, P. Natl. Acad. Sci. USA, 121, e2409436121, https://doi.org/10.1073/pnas.2409436121, 2024.
Hirano, M.: River-bed degradation with armoring, Proceedings of the Japan Society of Civil Engineers, 1971, 55–65, https://doi.org/10.2208/jscej1969.1971.195_55, 1971 (in Japanese).
Huang, D., Iwasaki, T., Yamada, T., Hiramatsu, Y., Yamaguchi, S., and Shimizu, Y.: Morphodynamic equilibrium of alternate bar dynamics under repeated hydrographs, Adv. Water Resour., 175, 104427, https://doi.org/10.1016/j.advwatres.2023.104427, 2023.
Humphries, R., Venditti, J. G., Sklar, L. S., and Wooster, J. K.: Experimental evidence for the effect of hydrographs on sediment pulse dynamics in gravel-bedded rivers, Water Resour. Res., 48, 2011WR010419, https://doi.org/10.1029/2011WR010419, 2012.
Ikeda, H. and Iseya, F.: Longitudinal sorting process in heterogeneous sediment transportation, in: Proceedings of the Japanese Conference on Hydraulics, vol. 30, 217–222, https://doi.org/10.2208/prohe1975.30.217, 1986 (in Japanese).
Iwasaki, T., Shimizu, Y., and Kimura, I.: Computations of bed deformation and sediment sorting in meander channel using depth-averaged morphodyamic model, International Journal of River Basin Management, 9, 237–245, https://doi.org/10.1080/15715124.2011.597756, 2011.
Iwasaki, T., Shimizu, Y., and Kimura, I.: Sensitivity of free bar morphology in rivers to secondary flow modeling: Linear stability analysis and numerical simulation, Adv. Water Resour., 92, 57–72, https://doi.org/10.1016/j.advwatres.2016.03.011, 2016.
Iwasaki, T., Nelson, J., Shimizu, Y., and Parker, G.: Numerical simulation of large-scale bed load particle tracer advection-dispersion in rivers with free bars, J. Geophys. Res.-Earth, 122, 847–874, 2017.
Kuhnle, R. A. and Southard, J. B.: Bed load transport fluctuations in a gravel bed laboratory channel, Water Resour. Res., 24, 247–260, https://doi.org/10.1029/WR024i002p00247, 1988.
Kyuka, T., Okabe, K., Shimizu, Y., Yamaguchi, S., Hasegawa, K., and Shinjo, K.: Dominating factors influencing rapid meander shift and levee breaches caused by a record-breaking flood in the Otofuke River, Japan, J. Hydro-Environ. Res., 31, 76–89, https://doi.org/10.1016/j.jher.2020.05.003, 2020.
Lanzoni, S. and Tubino, M.: Grain sorting and bar instability, J. Fluid Mech., 393, 149–174, https://doi.org/10.1017/S0022112099005583, 1999.
Lee, K. T., Liu, Y., and Cheng, K.: Experimental investigation of bedload transport processes under unsteady flow conditions, Hydrol. Process., 18, 2439–2454, https://doi.org/10.1002/hyp.1473, 2004.
Lisle, T. E. and Hilton, S.: Fine bed material in pools of natural gravel bed channels, Water Resour. Res., 35, 1291–1304, https://doi.org/10.1029/1998WR900088, 1999.
Lisle, T. E., Iseya, F., and Ikeda, H.: Response of a Channel with alternate bars to a decrease in supply of mixed-size bed load: A Flume Experiment, Water Resour. Res., 29, 3623–3629, https://doi.org/10.1029/93WR01673, 1993.
Lisle, T. E., Pizzuto, J. E., Ikeda, H., Iseya, F., and Kodama, Y.: Evolution of a sediment wave in an experimental channel, Water Resour. Res., 33, 1971–1981, https://doi.org/10.1029/97WR01180, 1997.
Mao, L.: The effect of hydrographs on bed load transport and bed sediment spatial arrangement, J. Geophys. Res., 117, 2012JF002428, https://doi.org/10.1029/2012JF002428, 2012.
Morgan, J. A. and Nelson, P. A.: Experimental investigation of the morphodynamic response of riffles and pools to unsteady flow and increased sediment supply, Earth Surf. Proc. Land., 46, 869–886, https://doi.org/10.1002/esp.5072, 2021.
Mörtl, C. and De Cesare, G.: Sediment Augmentation for River Rehabilitation and Management – A Review, Land, 10, 1309, https://doi.org/10.3390/land10121309, 2021.
Nelson, J. M., Shimizu, Y., Abe, T., Asahi, K., Gamou, M., Inoue, T., Iwasaki, T., Kakinuma, T., Kawamura, S., Kimura, I., Kyuka, T., McDonald, R. R., Nabi, M., Nakatsugawa, M., Simões, F. R., Takebayashi, H., and Watanabe, Y.: The international river interface cooperative: Public domain flow and morphodynamics software for education and applications, Adv. Water Resour., 93, 62–74, https://doi.org/10.1016/j.advwatres.2015.09.017, 2016.
Nelson, P. A. and Morgan, J. A.: Flume experiments on flow and sediment supply controls on gravel bedform dynamics, Geomorphology, 323, 98–105, https://doi.org/10.1016/j.geomorph.2018.09.011, 2018.
Nelson, P. A., Venditti, J. G., Dietrich, W. E., Kirchner, J. W., Ikeda, H., Iseya, F., and Sklar, L. S.: Response of bed surface patchiness to reductions in sediment supply, J. Geophys. Res., 114, 2008JF001144, https://doi.org/10.1029/2008JF001144, 2009.
Nelson, P. A., Dietrich, W. E., and Venditti, J. G.: Bed topography and the development of forced bed surface patches, J. Geophys. Res., 115, F04024, https://doi.org/10.1029/2010JF001747, 2010.
Nelson, P. A., Brew, A. K., and Morgan, J. A.: Morphodynamic response of a variable-width channel to changes in sediment supply, Water Resour. Res., 51, 5717–5734, https://doi.org/10.1002/2014WR016806, 2015.
Nittrouer, J. A. and Viparelli, E.: Sand as a stable and sustainable resource for nourishing the Mississippi River delta, Nat. Geosci., 7, 350–354, https://doi.org/10.1038/ngeo2142, 2014.
Parker, G.: Selective Sorting and Abrasion of River Gravel. I: Theory, J. Hydraul. Eng., 117, 131–147, https://doi.org/10.1061/(ASCE)0733-9429(1991)117:2(131), 1991.
Parker, G., An, C., Lamb, M. P., Garcia, M. H., Dingle, E. H., and Venditti, J. G.: Dimensionless argument: a narrow grain size range near 2 mm plays a special role in river sediment transport and morphodynamics, Earth Surf. Dynam., 12, 367–380, https://doi.org/10.5194/esurf-12-367-2024, 2024.
Peirce, S., Ashmore, P., and Leduc, P.: Evolution of grain size distributions and bed mobility during hydrographs in gravel-bed braided rivers, Earth Surf. Proc. Land., 44, 304–316, https://doi.org/10.1002/esp.4511, 2019.
Podolak, C. J. P. and Wilcock, P. R.: Experimental study of the response of a gravel streambed to increased sediment supply, Earth Surf. Proc. Land., 38, 1748–1764, https://doi.org/10.1002/esp.3468, 2013.
Recking, A., Frey, P., Paquier, A., and Belleudy, P.: An experimental investigation of mechanisms involved in bed load sheet production and migration, J. Geophys. Res., 114, F03010, https://doi.org/10.1029/2008JF000990, 2009.
Recking, A., Piton, G., Vazquez-Tarrio, D., and Parker, G.: Quantifying the Morphological Print of Bedload Transport: Morphological Print, Earth Surf. Proc. Land., 41, 809–822, https://doi.org/10.1002/esp.3869, 2016.
Schuerch, P., Densmore, A. L., McArdell, B. W., and Molnar, P.: The influence of landsliding on sediment supply and channel change in a steep mountain catchment, Geomorphology, 78, 222–235, https://doi.org/10.1016/j.geomorph.2006.01.025, 2006.
Seminara, G., Colombini, M., and Parker, G.: Nearly pure sorting waves and formation of bedload sheets, J. Fluid Mech., 312, 253–278, https://doi.org/10.1017/S0022112096001991, 1996.
Shimizu, Y., Takebayashi, H., Inoue, T., Hamaki, M., and Iwasaki, T.: iRIC-Software: Nays2DH solver manual, https://i-ric.org/en/ (last access: 15 November 2024), 2014.
Shimizu, Y., Nelson, J., Arnez Ferrel, K., Asahi, K., Giri, S., Inoue, T., Iwasaki, T., Jang, C., Kang, T., Kimura, I., Kyuka, T., Mishra, J., Nabi, M., Patsinghasanee, S., and Yamaguchi, S.: Advances in computational morphodynamics using the International River Interface Cooperative (iRIC) software, Earth Surf. Proc. Land., 45, 11–37, https://doi.org/10.1002/esp.4653, 2020.
Tanabe, S.: Movie S1 - The detrended riverbed elevation and the geometric mean grain size in Case 2-n-, TIB [video], https://doi.org/10.5446/70174, 2025a.
Tanabe, S.: Movie S2 - The detrended riverbed elevation and the geometric mean grain size in Case 1-n-, TIB [video], https://doi.org/10.5446/70172, 2025b.
Tanabe, S.: Movie S3 – The two-dimensional riverbed variation from the initial riverbed elevation in Case 2-b-, TIB [video], https://doi.org/10.5446/70173, 2025c.
Tanabe, S.: Movie S4 - The two-dimensional riverbed variation from the initial riverbed elevation in Case 1-b-, TIB [video], https://doi.org/10.5446/70175, 2025d.
Tanabe, S.: Movie S5 - Longitudinal riverbed variation from the initial riverbed elevation and geometric mean grain size in Case 2-b-, TIB [video], https://doi.org/10.5446/70176, 2025e.
Tanabe, S.: Movie S6 - Longitudinal riverbed variation from the initial riverbed elevation and geometric mean grain size in Case 1-b-, TIB [video], https://doi.org/10.5446/70177, 2025f.
Tanabe, S.: Movie S7 - Longitudinal distribution of the magnitude of cross-sectional average sediment transport flux in Case 1-b-, TIB [video], https://doi.org/10.5446/70178, 2025g.
Tanabe, S.: Movie S8 - Longitudinal distribution of the magnitude of cross-sectional average sediment transport flux in Case 2-b-, TIB [video], https://doi.org/10.5446/70179, 2025h.
Trenberth, K.: Changes in precipitation with climate change, Clim. Res., 47, 123–138, https://doi.org/10.3354/cr00953, 2011.
Tubino, M.: Growth of alternate bars in unsteady flow, Water Resour. Res., 27, 37–52, https://doi.org/10.1029/90WR01699, 1991.
Venditti, J. G., Nelson, P. A., and Dietrich, W. E.: The domain of bedload sheets, Marine Sandwave and River Dune Dynamics, 3, 315–321, 2008.
Venditti, J. G., Dietrich, W. E., Nelson, P. A., Wydzga, M. A., Fadde, J., and Sklar, L.: Effect of sediment pulse grain size on sediment transport rates and bed mobility in gravel bed rivers, J. Geophys. Res., 115, 2009JF001418, https://doi.org/10.1029/2009JF001418, 2010a.
Venditti, J. G., Dietrich, W. E., Nelson, P. A., Wydzga, M. A., Fadde, J., and Sklar, L.: Mobilization of coarse surface layers in gravel-bedded rivers by finer gravel bed load, Water Resour. Res., 46, 2009WR008329, https://doi.org/10.1029/2009WR008329, 2010b.
Venditti, J. G., Nelson, P. A., Minear, J. T., Wooster, J., and Dietrich, W. E.: Alternate bar response to sediment supply termination, J. Geophys. Res., 117, 2011JF002254, https://doi.org/10.1029/2011JF002254, 2012.
Venditti, J. G., Nittrouer, J. A., Allison, M. A., Humphries, R. P., and Church, M.: Supply‐limited bedform patterns and scaling downstream of a gravel–sand transition, Sedimentology, 66, 2538–2556, https://doi.org/10.1111/sed.12604, 2019.
Wang, L., Cuthbertson, A., Pender, G., and Zhong, D.: Bed Load Sediment Transport and Morphological Evolution in a Degrading Uniform Sediment Channel Under Unsteady Flow Hydrographs, Water Resour. Res., 55, 5431–5452, https://doi.org/10.1029/2018WR024413, 2019.
Waters, K. A. and Curran, J. C.: Linking bed morphology changes of two sediment mixtures to sediment transport predictions in unsteady flows, Water Resour. Res., 51, 2724–2741, https://doi.org/10.1002/2014WR016083, 2015.
White, D. C., Morrison, R. R., and Nelson, P. A.: Experimental Observations of Floodplain Vegetation, Bedforms, and Sediment Transport Interactions in a Meandering Channel, J. Geophys. Res.-Earth, 128, e2023JF007136, https://doi.org/10.1029/2023JF007136, 2023.
Whiting, P. J., Dietrich, W. E., Leopold, L. B., Drake, T. G., and Shreve, R. L.: Bedload sheets in heterogeneous sediment, Geology, 16, 105, https://doi.org/10.1130/0091-7613(1988)016<0105:BSIHS>2.3.CO;2, 1988.
Wilcock, P. R.: Two-Fraction Model of Initial Sediment Motion in Gravel-Bed Rivers, Science, 280, 410–412, https://doi.org/10.1126/science.280.5362.410, 1998.
Wilcock, P. R. and Crowe, J. C.: Surface-based Transport Model for Mixed-Size Sediment, J. Hydraul. Eng., 129, 120–128, https://doi.org/10.1061/(ASCE)0733-9429(2003)129:2(120), 2003.
Wilcock, P. R., Kenworthy, S. T., and Crowe, J. C.: Experimental study of the transport of mixed sand and gravel, Water Resour. Res., 37, 3349–3358, https://doi.org/10.1029/2001WR000683, 2001.
Wong, M. and Parker, G.: One-dimensional modeling of bed evolution in a gravel bed river subject to a cycled flood hydrograph: bed evolution with flood hydrograph, J. Geophys. Res., 111, F03018, https://doi.org/10.1029/2006JF000478, 2006.
Zinger, J. A., Rhoads, B. L., and Best, J. L.: Extreme sediment pulses generated by bend cutoffs along a large meandering river, Nat. Geosci., 4, 675–678, https://doi.org/10.1038/ngeo1260, 2011.