the Creative Commons Attribution 4.0 License.
the Creative Commons Attribution 4.0 License.
 | 16 Mar 2026
New experiments to probe the role of fractures in bedrock on river erosion rate and processes
Marion Fournereau
Philippe Steer
Jean-Jacques Kermarrec
Paul Leroy
Christophe Lanos
Hélène Hivert
Claire Astrié
Dimitri Lague
River erosion is a fundamental process that impacts, among others, mountain landscape evolution. Mountain rock lithologies often exhibit bedding, joints, and fractures that are thought to alter the incision efficiency of rivers compared to intact, massive rocks. The presence of close enough planar mechanical discontinuities allows the creation and entrainment of large blocks through plucking, a process that adds to abrasion, and potentially macroabrasion, by the transported sediment. Despite preliminary attempts to include shallow fracturing in theoretical models of bedrock incision and a couple of studies that quantified the relative importance of abrasion and plucking processes in situ, we are still lacking ways to systematically probe the role of fractures on bedrock erosion rates and processes. Due to the complex interactions at play, here we investigate this question via an experimental approach, using a new erosion mill designed to erode a fractured concrete disk with a diameter of 17 cm. We simulate vertical or dipping fractures by embedding a 3D-printed plastic mesh in the concrete, using BVOH – a plastic that softens in cold water – creating mechanical weaknesses with a controlled pattern. We explore 10 different geometries and run 4 additional experiments without fractures for control. We record the topographic evolution every 2 min by photogrammetry and derive erosion maps by measuring elevation changes between successive scans. Our results show that fractures influence the morphodynamical evolution of the disks and the relative contributions of abrasion and plucking. However, abrasion systematically remains the dominant erosion mechanism, with plucking contributing at most to 29 % of the total erosion for vertical fractures spaced by 20×20 mm2, 40 % for one specific dip angle (67°), and less than 10 % for most experiments. Average erosion rates show a modest (20 %) increase with the fraction of plucking, but do not show a clear relationship with fracture density and the presence of fractures. We suggest that the rate of erosion by plucking is limited by the depth and slow rate of horizontal fracture propagation between pre-existing vertical fractures, such that in our experimental setup, abrasion is systematically a dominant component. These findings emphasize the critical role of block preparation and loosening for plucking to be an effective process compared to abrasion. This new setup allows abrasion, macroabrasion, and plucking driven by bedload impacts to be studied in controlled situations, albeit with the well-known limits of abrasion mills and without the variety of natural processes that can drive fracture propagation. Further experiments should expand the parameter space of the erosion efficiency problem (i.e., sediment mass, grain size, flow velocity, intact rock mass strength, 3D fracture patterns) to help in developing mechanistic models applicable in natural environments.
- Article
(4177 KB) - Full-text XML
-
Supplement
(22554 KB) - BibTeX
- EndNote


River incision into bedrock is a key process in continental landscape evolution, the efficiency of which is modulated by discharge statistics, channel geometry, sediment supply, and rock mechanical properties (Lague, 2014; Whipple, 2004; Whipple et al., 2022; Yanites, 2018). Developing long-term incision laws accounting for these factors using mechanistic-based arguments is a long-standing challenge in quantitative geomorphology (Whipple et al., 2022). Numerical models that can couple complex flow hydraulics, sediment transport, and rock mechanics over timescales relevant to long-term bedrock incision have not yet been developed (Lague, 2014; Whipple et al. 2022). Bedrock rivers also remain challenging environments for in situ monitoring of erosion rates, sediment transport and hydrodynamics (e.g., Turowski et al., 2008; Beer and Turowski,, 2015; Beer et al., 2017). Experimental studies have therefore been central in providing important insights into the mechanics of bedrock incision (e.g., Beer and Lamb, 2021; Dubinski and Wohl, 2013; Paola et al., 2009; Scheingross et al., 2014; Sklar and Dietrich, 2001; Turowski et al., 2023; Wilkinson et al., 2018; Wilson and Lavé, 2014). Among key advances, seminal experiments by Sklar and Dietrich (2001) showed that for homogeneous rocks, the efficiency of erosion by saltating bedload decreases as the inverse square of the rock tensile strength. This experimental result was later confirmed with different materials (Turowski et al., 2023; Small et al., 2015), extended to suspended load (Scheingross et al., 2014), and has been central in building a mechanical understanding of the link between bedrock lithology and erosion efficiency (e.g., Chatanantavet and Parker, 2009; Sklar and Dietrich, 2004). However, in nature, rocks are frequently fractured, bedded, or contain joints that create mechanical discontinuities that are expected to alter erosion efficiency compared to a homogeneous intact rock (e.g. Molnar et al., 2007). Erosion in fractured bedrock rivers involves a broader and more complex set of interacting processes than in homogeneous substrates (Scott and Wohl, 2019; Whipple et al., 2022). Despite attempts to consider this effect in bedrock incision models (Chatanantavet and Parker, 2009; Whipple et al., 2000b), we are far from being able to include quantitatively the effect of mechanical discontinuities on erosion efficiency and long-term bedrock incision.
Erosion processes that drive river incision into rock with mechanical discontinuities are classically sub-classified into two categories (Whipple et al., 2022): abrasion and plucking processes. In the following, we only consider rivers, away from waterfalls, transporting coarse bedload material, typical of actively eroding mountain belts, and in rock lithologies where dissolution is negligible. Abrasion refers to the progressive wear induced by the impact of sediments on the bedrock substrate Hancock et al., 1998; Sklar and Dietrich, 1998; Whipple et al., 2000b). This process can operate at different scales from wear abrasion (i.e., grain-by-grain abrasion) to macroabrasion. Macroabrasion is a recent term encompassing a variety of mechanical processes: chipping of blocks by grains (Beer and Lamb, 2021; Hancock et al., 1998; Whipple, 2004); breaking of bedrock into blocks by the impact of large clasts (Scott and Wohl, 2019); progressive fracturing of the bedrock surface through repeated impacts creating rock fragments that can then be subsequently entrained (Chatanantavet and Parker, 2009, 2011). Macroabrasion does not necessarily require pre-existing rock mass discontinuities and can create fragments whose size is independent of larger-scale structural features. On the contrary, plucking specifically exploits pre-existing discontinuities, such as fractures, joints, or bedding (Whipple et al., 2022), to liberate structurally-defined blocks. The exact processes encompassing plucking differ among authors. Some consider it as the process of removing blocks that are already completely loose by hydraulic forces (Saha et al., 2021; Scott and Wohl, 2019) with a variety of processes involved, such as sliding (Dubinski and Wohl, 2013), vertical lifting (Wilkinson et al., 2018), and toppling (Lamb and Dietrich, 2009). Others describe plucking as a two-step process (Beer et al., 2017; Chatanantavet and Parker, 2009; Whipple et al., 2000b; Whipple, 2004) with, first, the formation and loosening of blocks susceptible to detachment (e.g., by weathering, macroabrasion, hydraulic jacking or wedging), and second, their entrainment by hydraulic forces (Beer and Lamb, 2021; Chatanantavet and Parker, 2009; Turowski et al., 2023; Whipple et al., 2000a, b). Plucking may involve the propagation of cracks between pre-existing fractures driven by particle impacts, hydraulic wedging, and jacking by transported grains, leading to block loosening and subsequent entrainment (e.g., Fig. 4A in Whipple et al. 2022; Hancock et al., 1998; Hartshorn et al., 2002). We note that glacial erosion by plucking (also called quarrying) is also defined as a similar two-step process encompassing a weathering/fracturing phase and an entrainment phase (Anderson and Anderson, 2010; Hallet, 1996; Scott and Wohl, 2019). In this study, we use this second definition of plucking (i.e., the formation and loosening of blocks followed by their removal). Beyond semantics, a key point is that a larger range of erosion processes encompassing wear, macroabrasion and plucking can occur in rocks with mechanical discontinuities compared to homogeneous rocks. This makes quantifying the impact of discontinuities on erosion efficiency a challenging problem (Scott and Wohl, 2019) as the proportion and the rate of each process must be quantified.
The empirical expectation is that if discontinuities are close enough, plucking tends to prevail over abrasion and yield higher erosion efficiency (e.g., Attal et al., 2006; Hurst et al., 2021; Lima et al., 2021; Molnar et al., 2007; Scott and Wohl, 2019; Whipple et al., 2000b). As the spacing of discontinuities increases, plucking is expected to be too infrequent to become a dominant mechanism, even though large blocks can be removed at once and contribute substantially to long-term erosion (e.g., Beer and Turowski, 2015; Hancock et al., 1998; Whipple et al., 2000b). Field-based morphological constraints have been used to inform the nature and relative dominance of various processes (Whipple et al., 2000b). Field observations indicate that rock fractures, joints, and bedding significantly impact channel morphology (e.g., Hancock et al., 1998; Lima et al., 2021; Whipple et al., 2000b). For example, fractured bedrock, where plucking dominates, is generally associated with rougher river channels, whereas intact bedrock, dominated by abrasion, tends to form smoother channels (Ehlen and Wohl, 2002; Lima et al., 2021; Scott and Wohl, 2019; Wohl, 2008). In addition to fracture density, fracture dip and orientation can influence how easily blocks are removed from bedrock (Scott and Wohl, 2019), with downstream-dipping fractures favouring sliding or pivoting and upstream-dipping fractures creating more resistance to erosion (Wohl, 2000). Yet, very few studies have been able to quantify erosion modes in situ. Hartshorn et al. (2002) documented annual rates of erosion across a bedrock channel for two lithologies with a 4-time difference in tensile strength. Owing to jointing, the more resistant rock was eroding through plucking much faster than the weaker rock which was dominated by abrasion. Beer and Turowski (2015) used 3D scans to systematically document patterns of abrasion in a gorge incised in mostly massive rock and showed that a single large plucking event, during their 2-year survey period, accounted for one-third of the total erosion. They underlined the difficulty in accounting for the fundamental stochastic nature of plucking (e.g., Snyder et al., 2003) and in assessing the contribution of extreme events and the impact of very large boulders in driving macroabrasion on massive rocks.
To make advances in this knowledge gap, we have developed a new erosion mill experiment inspired by the setup of Sklar and Dietrich (2001), considering an additional variable: a network of discontinuities mimicking fractures with a controlled geometry that we can vary. Our artificial bedrock is made of concrete with 3D printed fracture patterns acting as planar discontinuities. Because our fractures are filled, water flow and small grains cannot enter the fractures, such that hydraulic lifting through pressure fluctuations (Whipple et al., 2000b; Wilkinson et al., 2018) and wedging by grains (e.g., Hartshorn et al., 2002) cannot occur. The parameter space potentially controlling erosion efficiency in this setup is large, as we can control flow velocity, sediment load, sediment size, and the fracture pattern. In this first study, we only explore the effect of the fracture pattern and keep the other parameters constant. At regular time intervals during the experiment, we reconstruct the topographic surface and use this information to quantify spatial patterns of erosion, erosion statistics, and the dominant mode of erosion. Experiments with a purely homogeneous concrete serve as a reference case where only abrasion occurs, as in Sklar and Dietrich (2001). When a fracture exists, we use the dual classification of plucking vs abrasion in separating large block detachment detected from erosion patterns, from smaller local topographic change associated with abrasion. In the results of this paper, we therefore do not directly quantify macroabrasion, but we address, in the discussion, its role and potential occurrence within our new experimental setup.
The work is organized as follows: we first present the new experimental setup and the design choices for the artificial fractured bedrock. We then present the results focusing on the role of fracture density, spacing, and dip in controlling mean erosion rates, the relative contributions of plucking and abrasion, and the size distribution of plucking events. The discussion then addresses the benefits and limits of this new setup, the dominant erosion processes and the relevance of our experimental results to natural systems.
The experimental setup consists of an erosion mill system, inspired by previous designs (Sklar and Dietrich, 2001). It features a Plexiglas column with a fractured concrete disk maintained by a screw at the bottom. For the experiment, we use the terminology “fracture” to describe a mechanical discontinuity of planar geometry with a resistance lower than the intact concrete disk. Sediments and water are placed above the disk, while a rotating propeller generates sediment motion, driving the erosion process.
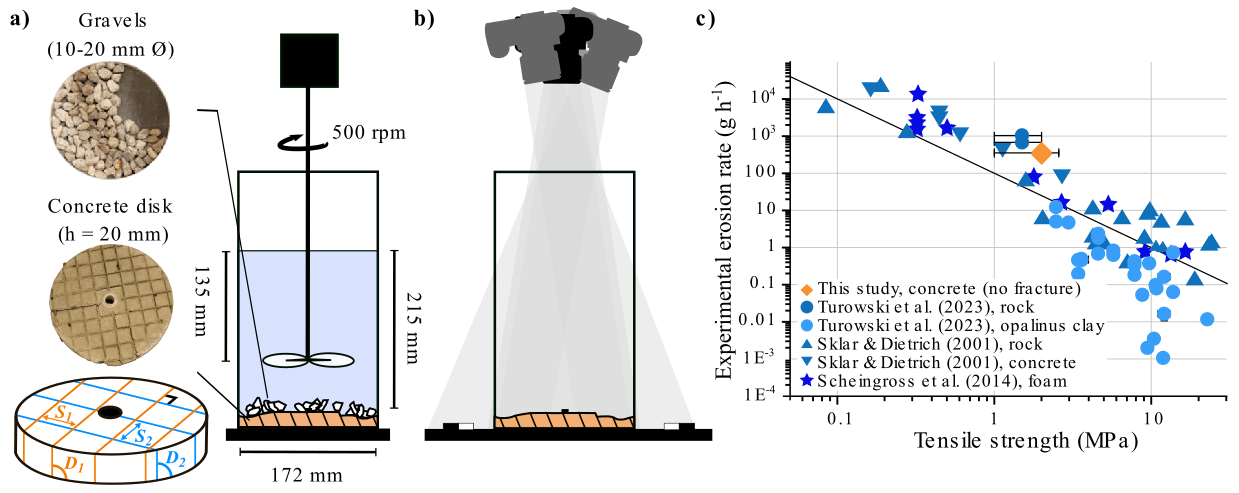
Figure 1General design of the experiments with (a) the setup with the geometric parameters of the fracture networks that we explore in this study (with S and D the spacing and the dip angle of the two families of fractures, respectively), and (b) the photogrammetry system. Note that there is no pre-existing horizontal fracture in the disk. The concrete disk is maintained by a central screw at the bottom of the column and erosion is launched by the motion of the water and gravels induced by the propeller. Every 2 min, the column is emptied and placed under 4 cameras. Targets are placed in the scene for absolute scale. (c) Average erosion rate according to the tensile strength for various erosion mills (blue symbols) and for our concrete without fracture (orange diamonds) (adapted from Turowski et al., 2023).
2.1 Experimental disks
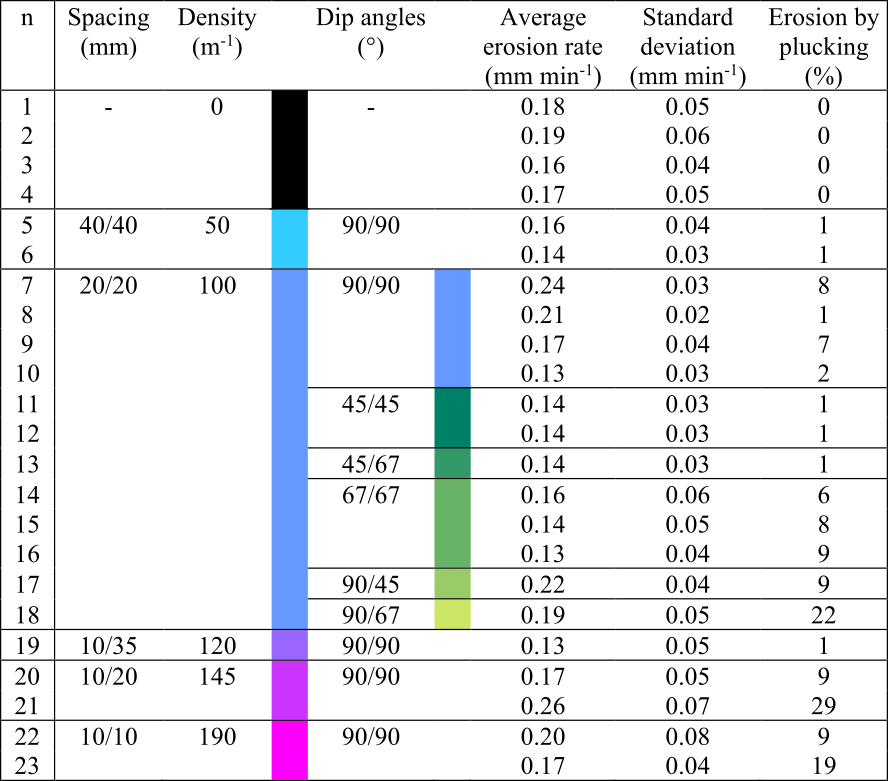
Our fractured substrates are simulated with a synthetic mesh placed in a circular mould before pouring the concrete. Each network is made up of two families of fractures with different spacing and dip angles (Fig. 1a). First, we perform experiments with square networks (i.e., the two families have the same spacing) and vertical fractures. We use three different spacings (10, 20, and 40 mm) and repeat the experiments at least twice to account for intrinsic variability. Then, we perform experiments with rectangular networks (i.e., the two families have different spacings) and vertical fractures. We tested two configurations ( and mm) and repeated one of them (the mm) to assess reproducibility. Finally, we perform experiments to explore the influence of the fracture dip angle, which represents the angle between the fracture plane and the horizontal plane. Starting from a square network of fractures spaced by 20 mm, we change the dip angle of either one or both fracture families. We use two symmetrical networks ( and °) and repeat each experiment at least twice, and three asymmetrical networks (, , and °) that were not repeated. In total, we used 10 different fracture networks and ran 19 experiments. Different methods have been proposed to describe and characterise networks of fractures in natural rocks (e.g., Eppes et al., 2024). Here, the geometry is quite simple, and we therefore only use two parameters: the fracture density, referred to as p21 and defined as the total length of fractures visible on the surface over a given area (Dershowitz and Herda, 1992), and the pairs of fracture dip angles to distinguish the experiments with similar spacing but different dip angles. The experiments and their geometrical properties are summarized in Table 1.
Table 1Geometric properties, mean erosion rates with standard deviations and percentage of erosion by plucking for all the experiments. The colours to the right of density and dip angles are the ones used in the figures.
We use OpenSCAD to model the fracture networks in 3D and a ZORTRAX M200 3D printer to print them, with a width of 0.9±0.1 mm. To create weak zones inside the concrete disk, fracture networks are printed using white BVOH (Butenediol Vinyl Alcohol Co-polymer), a thermoplastic that normally fully dissolves in water. Yet, when in contact with cement during curing, the BVOH softens, but does not fully dissolve (even after 24 h in water). This results in a network of mechanical discontinuities with much lower strength than the intact concrete, while maintaining a cohesion of the disk, as fractures are not empty. Once printed, the fracture network is placed in a circular mould (diameter = 172 mm, height = 20 mm), and concrete is poured over it. Attempts to create a fully 3D fractured network with holes that would allow cement to fill in the void inside the mesh were unsuccessful. We thus used only 2 sets of fracture planes that extend from the top to the bottom of the disk. For experiments without fracture networks, the concrete is directly poured into the mould. We insert a 1.5 mm diameter plastic tube in the center of the mould so that the disk can be fixed on the column during the experiment with a screw. The concrete mix proportioning consists of one part of cement (CEM II/B-LL 32,5 N), three parts of Fontainebleau sand (D50= 210 µm and Dmax < 350 µm), and 15 % of water by weight. This composition was selected to ensure that the concrete disk erodes at a moderate rate – slow enough to track topographic evolution but fast enough to complete each experiment within a few hours. Concrete disks are carefully removed from the mould after 3 d and left to harden for an additional 5 d in an airtight box. The disk is then slightly sanded to make it as flat as possible and secured at the bottom of the Plexiglas column by a central screw (i.e., the disk is not glued to the bottom of the column). All these operations require caution as the fractured disks are fragile and can break along fracture planes even before the BVOH is further softened by immersion in the tank. This fragility explains why we cannot run mechanical tests on the fractured disk. Similarly, because the BVOH mechanical behaviour is altered by the cement, we cannot estimate the exact mechanical properties of the fractures when the BVOH has softened. Once the fractured disk is positioned at the bottom of the column, it cannot be removed without breaking apart.
In our setup, the 2 sets of fractures delimit blocks spanning from the top to the bottom of the concrete disk. The third major horizontal joint is the interface of the disk with the base of the tank. As will be shown in the results, plucking of complete blocks can occasionally happen towards the end of experiments; however, plucking occurs principally through horizontal crack development at various depths due to grain impacts.
To characterize our intact concrete, we estimate its tensile σt and compressive σc strengths after 28 d of drying. Tests are performed on prismatic samples referring to EN 196-1 (AFNOR, 2016). We also estimate the mechanical properties of four additional concretes made with the same cement-to-sand ratio but with different water content (−20 %, −10 %, +10 % and +20 % with respect to the reference concrete, Supplement Sect. S1). Despite these differences, the five concretes exhibit similar properties, with MPa and MPa. All experiments were made within this range of water content. Because we perform experiments after only 7 d of drying, the tensile strength is expected to be lower than the measured value. Using information from the Bulletin du Ciment (1950–1951), we estimate this value at 2 MPa with a conservative uncertainty of 1 MPa. Compared with existing abrasion mill experiments (Fig. 1c), this places our concrete in an intermediate range between very weak material (∼0.1 MPa) and very resistant rocks (> 10 MPa).
2.2 Experimental protocol
For each experiment, the disk fixed at the bottom of the Plexiglas column is immersed in water until saturation of the connected porosity, which occurs in about 20 min. To induce erosion, we add a constant volume of water together with granitic gravels of 10–20 mm in diameter on the top of the disk. To maximize erosion rates, the sediments cover about of the surface of the disk at rest (Sklar and Dietrich, 2001, Fig. 1a). Sediments are weighed at regular time intervals to ensure their mass remains constant. In only a few experiments, we added one grain during the run to keep the mass constant.
The rotation rate of the propeller placed in the column is 500 rpm, so that the maximal flow speed at the edges of the column is a few meters per second, and the sediment motion induces erosion. The propeller is 3D printed, and we tested various designs to limit the vertical recirculation cell that is documented in previous mill experiments (e.g., Sklar and Dietrich, 2001; Small et al., 2015). The objective was to have a simpler radial velocity gradient with maximum abrasion near the mill edge. We note that erosion does not occur if sediment is not included. Every 2 min, we stop the propeller, remove the water and sediment, and take 4 pictures of the disk surface with fixed and remotely triggered cameras (Fig. 1b, see Sect. S2: Fig. S2 for examples of photos taken by one of the four cameras). During the experiments, fragments of the disk can be removed by plucking and become part of the sediment load. However, these concrete blocks are less dense and weaker than the granite grains, and we assume that they do not contribute significantly to further erosion of the disk. To maintain a constant sediment mass, we remove all visible concrete fragments after each 2 min time interval. An experiment ends when the bottom of the plexiglass column is reached, which corresponds on average to half a day per experiment and to about 60 min of effective erosion. Once we reached this stage, it became impractical to continue the experiment, as we cannot easily remove the water and sediment, as the whole disk disaggregates quickly. For each experiment, we thus get 30- to 40-time steps. Such a test duration appears sufficiently short to neglect the concrete strength increases due to the continuous hardening of the cement.
We reconstruct the topography of the disks using photogrammetry with Agisoft Metashape, generating point clouds with elevation (z) and horizontal coordinates (x,y). Since the four cameras remain fixed throughout the experiment, we use the 4D mode (i.e., a temporal series from fixed cameras), ensuring that the disks are consistently referenced in the same position.
To establish an absolute spatial scale, we place reference targets with known locations around the disk, which are automatically identified by the software. After reconstructing the topography as point clouds, we use the Canupo classification algorithm (Brodu and Lague, 2012) to filter out points classified as noise (mainly due to reflections on the Plexiglas tube), ensuring a cleaner and more accurate dataset. The remaining point clouds have a resolution on average of 9 pts mm−2. Then, to obtain erosion maps from the topographic surfaces, we use the M3C2 algorithm (Lague et al., 2013) in a vertical model to calculate the differences in elevation between successive pairs of point clouds. We use a regular grid of core points spaced by millimetre so that each cloud has about 21 000±1000 points. The projection scale in M3C2 is 2 mm, resulting in an average of 25 points from each cloud used to compute the vertical difference at each core point.
To quantify the uncertainty associated with topographic reconstruction and point cloud differencing, we repeat this protocol 10 times with the same disk saturated with water (i.e., removing and replacing the column, taking pictures, generating the point cloud, and 3D point cloud differencing). The maximum local difference in elevation between the 10 point clouds is 0.15 mm, and we use this value as the topographic uncertainty in the following.
For practical reasons, we then convert the point clouds to rasters with 1 mm of resolution describing the elevation of the topographic surfaces z(x,y), the M3C2 differences Δz(x,y) and the erosion rates , with Δt the duration between two acquisitions (i.e., 2 min). In addition, at each time step, we weigh the column after removing the water and the grains. These mass measurements only give a value averaged over the whole surface of the disk and are therefore less detailed than the topographic measurements. Therefore, they are only used to ensure that we accurately capture the erosion dynamics from the topographic evolution.
To compare our fractured material to homogeneous cases, we run 4 experiments with no fractures. We use the mass data measured every 2 min to estimate the average erosion rates. Average erosion rates derived from weighing the column every 2 min are similar between the four experiments and match well with previous studies (Fig. 1c, Scheingross et al., 2014; Sklar and Dietrich, 2001; Turowski et al., 2023).
2.3 Data analyses
For each experiment, we derive two erosion rates from the erosion maps: (i) the mean erosion rate, corresponding to the average erosion of the disk for each time interval, and (ii) the local erosion rate, corresponding to the erosion at each point of the raster and for each time interval. The mean erosion rate calculated from topographic differences correlates well with the mass measurements (Fig. S3). The average erosion rate for each experiment is defined as the mean of the mean erosion rates, and we use one standard deviation as the associated uncertainty.
In this study, we use the term plucking for any localized event of high-intensity erosion (i.e., more intense than the background erosion by abrasion). We define plucking as areas of > 15 mm2 with a minimum erosion rate of 1 mm min−1 per pixel. These specific thresholds used to separate these modes are justified later in Sect. 3.2 and 3.3 of the results, based on the data analysis. For each detected plucking event, we extract its location, area, volume (defined as the area times the change in elevation between the consecutive topographies) and time of occurrence. Then, we define the proportion (in %) of erosion by detected plucking with respect to total erosion as the ratio between the sum of erosion by plucking events during the whole experiment and total erosion.
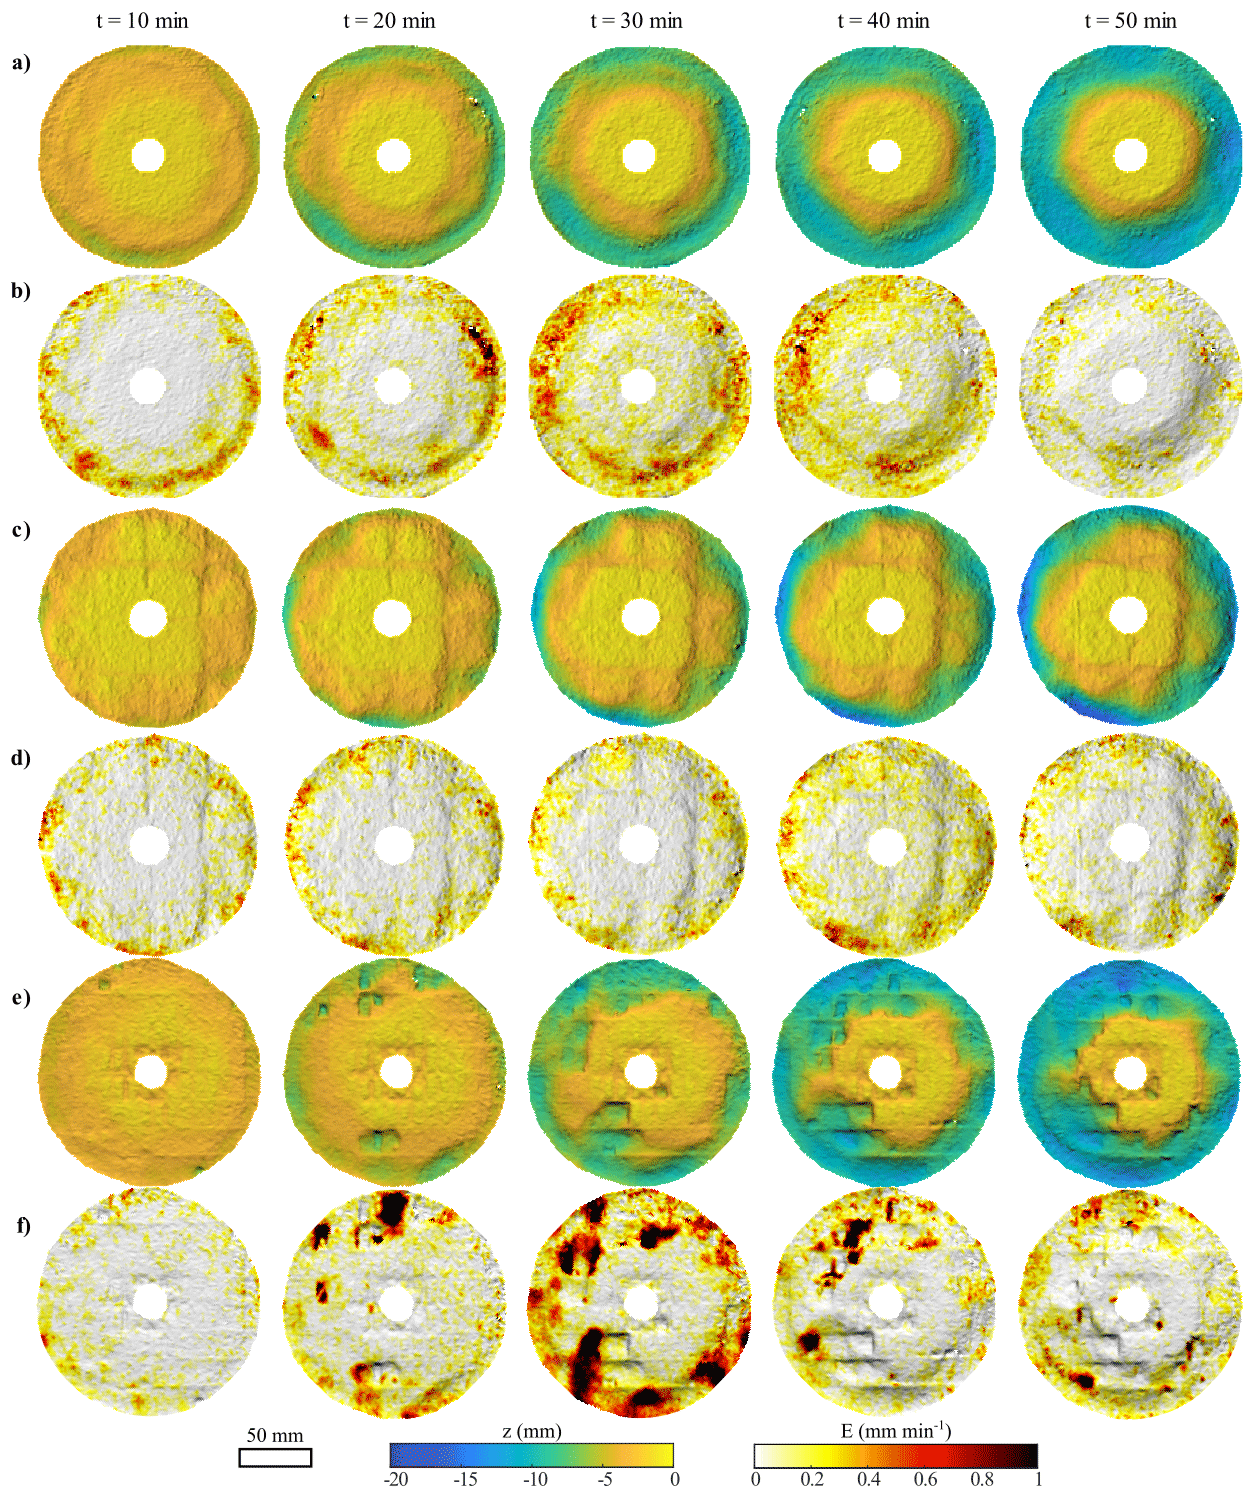
Figure 2Temporal evolution of the topography and erosion rates of three different experiments. The first disk (a, b) has no fracture, the second (c, d) has a moderately dense network (p21= 50 m−1, corresponding to vertical fractures with a spacing of 40 and 40 mm) and the third one (e, f) has a dense network (p21= 145 m−1, corresponding to vertical fractures with a spacing of 10 and 20 mm). The time step between two pictures is 10 min and the flow direction is clockwise. The full temporal series (i.e., topography and erosion map every 2 min) of these three experiments is available in the Sect. S4.
3.1 Influence of fracture density on topographic evolution
During an experiment, the topography of the disks evolves due to erosion, and we observe distinct patterns with and without fractures, illustrated in Fig. 2 (the full temporal series, i.e., topography and erosion map every 2 minutes, is provided as Supplement, Fig. S4). Experiments with no fractures (p21= 0 m−1) erode via continuous wear of the topography through time with a radial pattern (Figs. 2a, S4a). At the end of a run, the topography is smooth and exhibits radial symmetry, with about 15 mm of material removed near the edge. In the experiment shown in Fig. 2a, the average erosion rate is 0.16±0.04 mm min−1 (Table 1) and is characterized by a strong radial gradient, going from about 0 mm min−1 at the centre of the disk to about 0.6 mm min−1 on the edge (Figs. 2b, S4b). The erosion map shows localized patches of higher erosion rate, 2 to 3 times larger than the average erosion rate, and extending over a maximum of 2 cm. They tend to occur in the inner side of the trough created by the previous erosion and correspond to a progressive inner expansion of the active incision zone. A broadly similar behaviour is observed in experiments with a limited number of fractures (p21= 50 m−1). In such experiments, the influence of the fractures is visible in the topography (Figs. 2c, S4c), leading to a less regular radial pattern. The average erosion rate is slightly lower (0.14±0.03 mm min−1, Table 1) than in the absence of fractures, but within the range of uncertainties. On the contrary, experiments with a dense network (p21= 145 m−1) show a different topographic evolution: a radial pattern is still present with more erosion on the edges than in the centre (Figs. 2e, S4e), but the topography is more irregular with sharp elevation changes. Erosion is no longer symmetrical nor regular through time, and patches of high erosion rates, up to 1 mm min−1, are located all over the disk (Figs. 2f, S4f), bounded laterally by the fracture pattern. When emptying the column, we find pieces of concrete debris, some with sizes corresponding to the fracture pattern and a few mm thick (see Sect. 3.5 for a detailed analysis of the debris sizes). This shows that at least some of the high erosion patches correspond to instantaneous plucking events from cracks that have developed horizontally between fractures. The average erosion rate is only slightly higher than without fractures (0.17±0.05 mm min−1, Table 1). As for previous experiments, we observe that erosion occurs first on the edges of the disks before progressing inward (Figs. 2a, 2c, 2e, S4a, S4c, S4e).
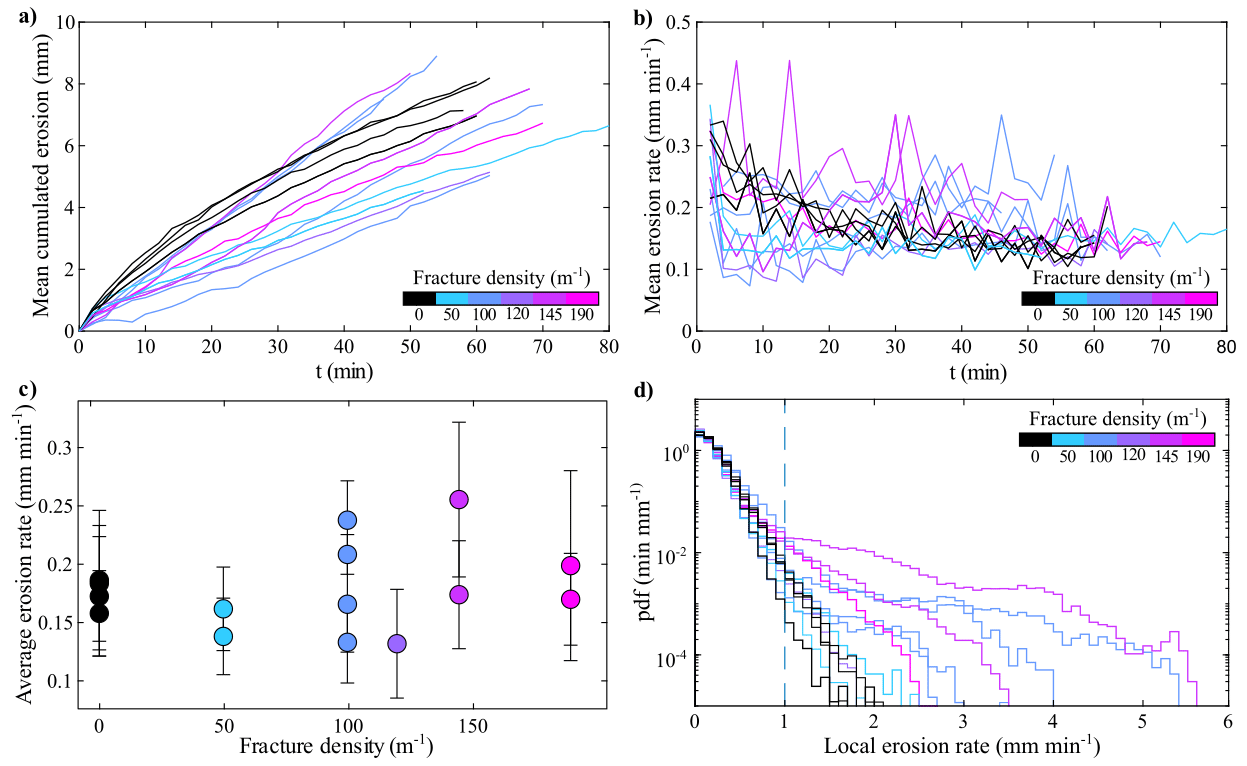
Figure 3Erosion through time of the different disks with: (a) the cumulated erosion (in mm) and (b) the mean erosion rate (mm min−1). Distribution of (c) the average erosion rates and (d) the probability density function of the local erosion rates.
3.2 Temporal evolution of erosion rates and the influence of fracture density
The temporal evolution of the mean cumulated erosion (Fig. 3a) and the mean erosion rate for all experiments (Fig. 3b) show two types of evolution depending on the presence of fractures. For unfractured experiments, the mean erosion rate is of the order of 0.3 mm min−1 at first and then decreases progressively towards a steady value of about 0.13 mm min−1 reached around 30 min, with fluctuations typical of the uncertainty in the 3D measurement approach (0.075 mm min−1). For fractured experiments, the mean erosion rate shows very large variations, with mean rates up to 0.45 mm min−1. Through the comparison with the map of erosion rates (Fig. 2), we observe that the high peaks (Fig. 3b) are associated with large erosion events. For example, the peak of 0.35 mm min−1 occurring at 30 min on the purple line (Fig. 3b) corresponds to the large plucking event visible in Fig. 2f. The cumulated erosion curve shows that unfractured experiments have eroded faster for the first 20 min than any of the fractured experiments. Even if fractured experiments show a very high variability of mean erosion rates, the cumulated erosion tends to increase linearly with time, showing that there is no clear reduction of the mean erosion rate through time as in unfractured experiments. The cumulated erosion curves also show that 3 (resp. 7) fractured experiments have higher (resp. lower) cumulated erosion at the end of the experiment than unfractured experiments. Beyond the different temporal dynamics between the fractured and unfractured experiments, we do not observe an obvious relationship between the fracture density and the total cumulated erosion or the temporal evolution of mean erosion rate.
Comparing average erosion rates over the entire simulation duration to fracture density confirms the lack of clear dependency (Fig. 3c). The average erosion rates range from 0.13±0.05 mm min−1 (p21= 120 m−1) to 0.26±0.07 mm min−1 (p21= 145 m−1) and are all within one standard deviation. The most notable feature is the larger spread of average erosion rates for the experiments with fracture density of 100 and 145 m−1 (Fig. 3c). These results show that the spacing of the fractures does not significantly affect the average erosion of the disk but creates a larger temporal and spatial variability in erosion rates that translates into a larger spread of average erosion rates.
The probability density function of local erosion rates (Fig. 3d) shows that all runs follow the same nearly exponential decrease for local erosion rates smaller than 1 mm min−1. At higher rates, two behaviours emerge: the distribution of local erosion for the experiments with no fracture or low fracture density continue to decrease exponentially with about the same trend, while the distribution for experiments with high fracture density deviate and show a heavy-tail (Fig. 3d). These high fracture density experiments are the ones prone to plucking events (Figs. 2 and 3) showing that the heavy-tail is a signature of plucking. The exponential decay would thus be a signature of abrasion processes. The pdf of local erosion rates shows that plucking events correspond to a maximum of 5.6 mm min−1, which is more than half the thickness of the disk eroded between two digitisations (2 min). We note that the local erosion patches observed in the unfractured or low-density fractured experiments (Fig. 3b, d) have erosion rates that are below the 1 mm min−1 threshold and do not contribute to the heavy-tail behaviour.
3.3 Influence of fracture density on the frequency, size, and proportion of plucking
For all experiments and intervals, we automatically detect the size and the timing of erosion patches, defined as areas of > 15 mm2 minimum (based on visual inspection of plucking events from the time series of topographies) with a minimum erosion rate of 1 mm min−1 per pixel (based on the behaviour change observed in Fig. 3d). As it is not possible to differentiate between one large event or multiple events occurring close to each other during the same time interval, we define one erosion patch as one plucking event during the 2 min time interval.
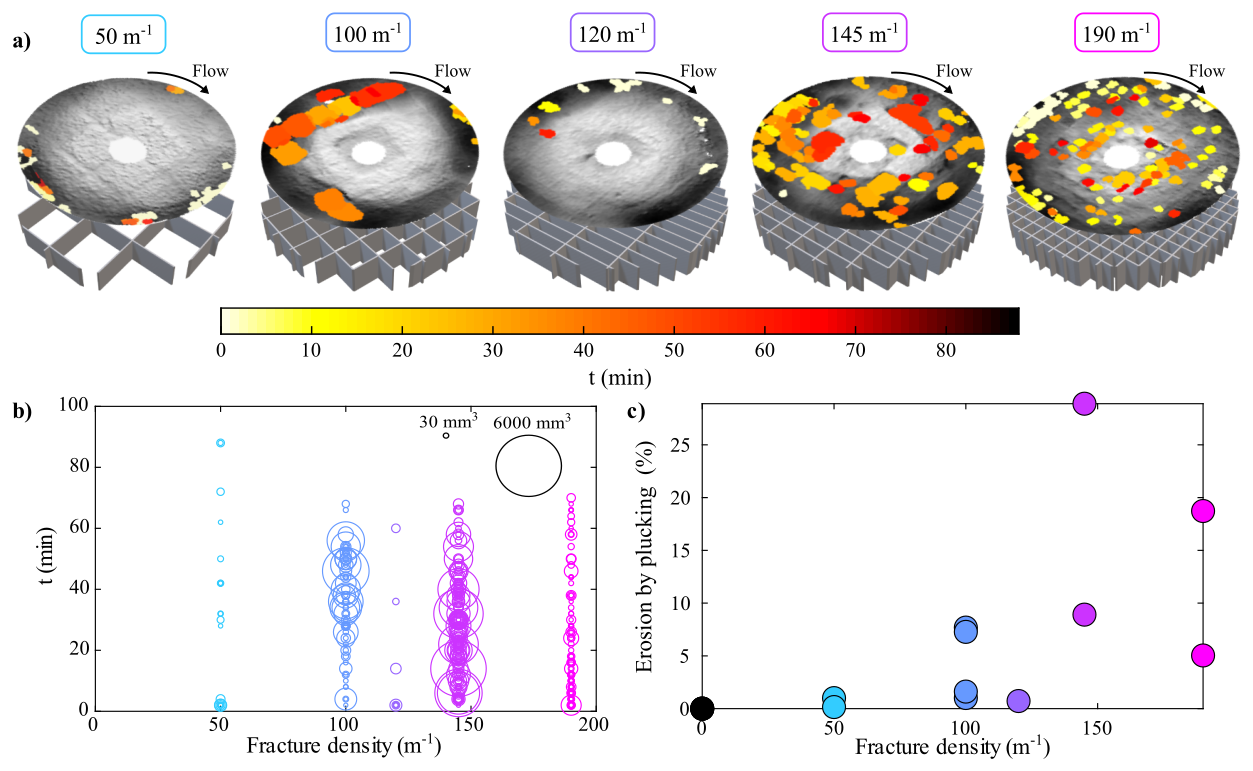
Figure 4Location, size and time of the detected plucking events for experiments with different fracture densities (a) in 3D perspective view with a projection of the fracture network (from 50 to 190 m−1 from left to right; the top view of each map is provided in the Fig. S5), and (b) as a function of time and fracture density for all experiments with vertical fractures. The size of the circles is proportional to the volume of the plucking event. (c) Contribution of plucking to total erosion (in %) with respect to fracture density for experiments with vertical fractures.
The map views of detected plucking location (Figs. 4a, S5) show that the size and location of these events differ for each fracture density. Experiments with a very dense fracture network (190 m−1, mm spacing) exhibit numerous small plucking events scattered across the disc surface. Experiments with a sparse fracture network (50 m−1, mm spacing) exhibit only a few small events (< 50 mm3) through time. The 120 m−1 ( mm spacing) experiment exhibits only a few detected plucking events located on the edges of the disk (Fig. 4a, S5). We observe that for the 100, 145, and 190 m−1 experiments, the detected plucking events reflect the shape of the underlying fracture network (Figs. 4a, S5), while the 120 m−1 exhibits very few plucking events.
During the experiments, the volume and frequency of detected plucking events vary with the fracture network. Plucking events can occur from the very beginning of the experiments, and there is no clear and systematic increase or decrease in plucking size through time for a given experiment (Fig. 4b). The experiment with a low fracture density (50 m−1) exhibits only a few small events (<50 mm3) through time. The 120 m−1 experiment ( mm spacing) behaves similarly to a low-density one. Apart from this, experiments with fracture network densities above 100 m−1 (100, 145, and 190 m−1) exhibit more regular plucking events. The 190 m−1 experiment shows small volumes (90 % of them smaller than 300 mm3), constrained by the size of the fracture network. The 100 and 145 m−1 experiments (respectively and mm spacing between the fractures) exhibit higher volumes, up to 5000 mm3.
Apart from the 120 m−1 experiment, the contribution of plucking to total erosion tends to increase with the fracture density (Fig. 4c, Table 1). A maximum of 29 % is observed for one 145 m−1 experiment, showing that plucking events never dominate the total erosion under the studied experimental conditions. As there are large differences in the contribution of plucking to total erosion between experiments at 145 and 190 m−1 (from 5 % to 29 %), we cannot determine a specific trend between the percentage of plucking and fracture density above 100 m−1.
3.4 Influence of fracture orientation and dip with respect to the flow
Recall that the surface fracture spacing is kept constant at 20 mm in this set of experiments, and that we include in the analysis the previous experiments with vertical fractures (°). At first order, experiments with varying fracture dip angles behave like the previous fractured experiments (Fig. 5): (1) erosion rates increase toward the edges (Fig. S7) and (2) plucking events are observed (Figs. 5a, S5), (3) mean erosion rates range between 0.08 and 0.45 mm min−1 (Fig. S6a), and (4) average erosion rates range between 0.14±0.03 and 0.24±0.03 mm min−1 (Fig. 5b). However, systematic differences emerge depending on the dip of the fracture sets and their combination.

Figure 5Impact of the fracture dip angle on erosion with a constant fracture spacing. (a) Location, size and time of the detected plucking events for experiments with different fracture dip angles in 3D perspective view, with a projection of the fracture network. The top view of each map is provided in the Sect. S5 (Fig. S5). (b) The mean erosion rate with respect to time for the dip angle experiments, and (c) the contribution of plucking to total erosion (in %) with respect to the fracture dip angles. The blue filled circles correspond to the ° network with a mm spacing shown in previous figures. The bars in (b) correspond to the standard deviation.
When only one fracture set is inclined, the response depends strongly on its dip angle. Indeed, combining a vertical fracture set with an inclined set at 45° (°) leads to a moderate quantity of plucking events (Figs. 5a, S5, S6b). These detected plucking events are small on one side of the disk (left of the map view on Figs. 5a, S5) and larger on the other side (right of the map view on Figs. 5a, S5). This configuration also exhibits a high average erosion rate of 0.22 mm min−1 with a contribution of plucking to this erosion of 9 %. Combining a vertical fracture set with an inclined set closer to vertical (dip angle of 67°), shows more pronounced plucking at the surface of the disk (Figs. 5a, S5). Consequently, the contribution of plucking to total erosion is markedly higher, reaching up to 22 % (Fig. 5c). This configuration also exhibits the most pronounced asymmetric erosion pattern of the entire experimental dataset (Figs. 5a, S5). Asymmetric patterns of plucking are not specific to inclined dips for this fracture spacing (e.g., Fig. 4a, experiment 100 m−1); however, the asymmetry is far more pronounced for this experiment (°). The area of increased plucking is centred on the zone where the flow is parallel to the trace of the vertical fracture set and the second fracture set dips in the upflow direction. While only one experiment is shown in Fig. 5, a repeat experiment showed a similar pronounced asymmetry early on, but the experiment was stopped after 16 min due to a runaway entrainment of half of the disk through multiple plucking events (see Sect. S7). This is an extreme case of asymmetric plucking showing that the pronounced asymmetry (Fig. 5a) and percentage of erosion by plucking (22 %, Fig. 5c) are not due to a single outlier, but to the specific combination of dips.
Experiments with two inclined fracture sets dipping at 45 or 67°, systematically exhibit a lower mean erosion rate, as well as fewer and smaller plucking events, compared to the case with one non-vertical fracture set (Fig. 5a and b). This is highlighted by a significantly reduced plucking contribution, close to 0 % for ° and around 7 % for ° (Fig. 5c). These proportions are similar to the two vertical fracture sets (°), but contrast with the experiments where only one fracture set is inclined which lead to significantly higher contribution of plucking (e.g., in particular the ° combination). An additional experiment was performed for a combination of ° (experiment no. 13 in Table 1). It gives results consistent with experiments with two sets of dipping fractures, and is not shown in the figure for the sake of clarity.
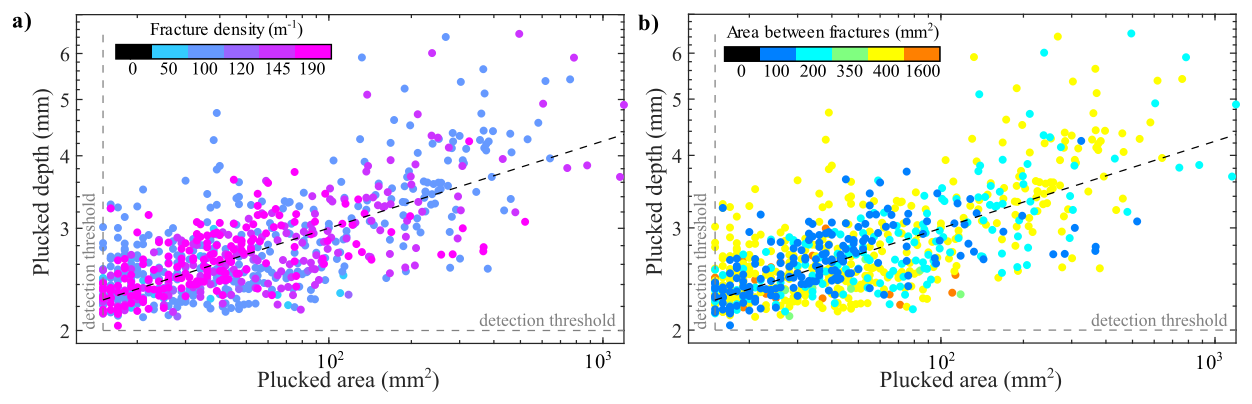
Figure 6Plucked depth with respect to the plucked area coloured as a function of (a) the fracture density and (b) the area between fractures, for all the experiments. The grey dashed lines indicate the detection thresholds and the black one corresponds to the best fit through the data (see text for details).
3.5 Geometry of plucking events
Combining all fractured experiments, the depth of detected plucking events, d (defined as the plucked volume divided by the plucked area), tends to increase with area, a, following a power law relationship with an exponent of 0.16±0.03 (Fig. 6a). Our detection of plucking events is based on area and depth thresholds that we defined from visual inspection (area) and from local erosion rates distribution (depth, Fig. 3d) and applied to the difference between two consecutive topographies acquired at 2 min time interval. A single plucking event in this analysis could therefore be the amalgamation of several smaller events occurring next to each other or on top of each other in the 2 min time interval. The comparison with concrete fragments found in the tank (Fig. S8) supports the possibility of having single plucking events that are several mm thick (Fig. S8). High plucked depths are only observed in experiments with fracture spacing of 20 mm (200 and 400 mm2, corresponding to 10 by 20 and 20 by 20 mm, respectively, Fig. 6b). We note that a few of the detected events are larger than the area between fractures for all experiments except for the lowest fracture density (1600 mm2).
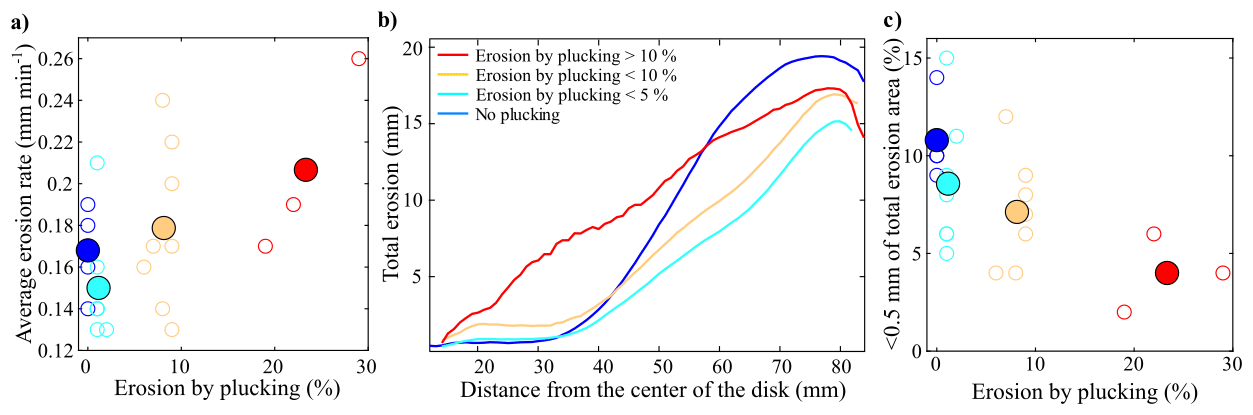
Figure 7Impact of the erosion by plucking on (a) the average erosion rate, (b) the total erosion after 40 min of run and according to the distance from the centre of the disk, and (c) the area with limited total erosion, for all the experiments presented in this study grouped by their percentage of erosion by plucking (group 1, dark blue: no plucking, group 2, light blue: plucking < 5 %, group 3, orange: plucking < 10 % and group 4, red: plucking > 10 %). On panels (a) and (c), white dots are for individual runs, coloured dots are for the average of the group. On panel (b), only the average curves are shown.
3.6 Plucking and spatial patterns of erosion
Here, we group the experiments according to the contribution of plucking to the total erosion of the disk after 40 min (Table 1), whatever the geometry of the fracture network. Four groups emerge with no plucking (0 % of total erosion by plucking) corresponding to unfractured experiments, low plucking (< 5 %), limited plucking (> 5 % and < 10 %), and high plucking (> 10 %). Figure 7a shows that the average erosion rate of each group increases with the increasing percentage of plucking. The average erosion rate is 0.17 mm min−1 in the absence of plucking and reaches up to 0.21 mm min−1 under conditions of high plucking. The lowest rate (0.15 mm min−1) is observed for fractured experiments with low plucking (light blue in Fig. 7a) rather than for the unfractured experiments with no plucking (dark blue in Fig. 7a). For each experiment, we extract the radial profile of total erosion according to the distance from the centre of the disk after 40 min of erosion (Sect. S9, Fig. S9). The profiles are scattered and therefore, for each run, we determine the mean erosion profile, and for each group, we calculate the average cumulated erosion (Sect. S9, Fig. S9). In experiments without fractures and plucking (dark blue, Fig. 7b), there is almost no erosion between 0 and 30 mm distance from the centre of the disks. Erosion then increases with distance to about 70 mm before decreasing slightly toward the edges of the disk. Experiments without fractures have the highest total erosion in the distal parts of the disk (distance > 55 mm, Fig. 7b). For fractured experiments with low or limited plucking (light blue and orange, Fig. 7b), erosion is also very limited from 0 to 30 mm from the centre of the disk and then increases radially, but more slowly than for unfractured experiments. Experiments with high plucking (red, Fig. 7b) have a similar maximum total erosion in the most distal part of the disk, but they exhibit a lower asymmetry along the radial profile, with a significant amount of erosion in the proximal part of the disk between 0 and 50 mm. Therefore, when plucking becomes significant, it extends the area submitted to erosion towards the centre of the disk. For each group, we calculated the area that was only slightly eroded (defined as a pixel with less than 0.5 mm of total erosion over the whole duration of the experiment, based on the erosion profiles of Fig. 7b. The proportion of low erosion areas decreases from about 11 % for to 4 % with the proportion of erosion by plucking (Fig. 7c).
4.1 Benefits and limitations of the study design
To our knowledge, this study is the first to explicitly integrate fracture geometry (2D spacing and dip angles) in an experimental investigation of bedrock river erosion with bedload transport. The erosion mill set up we derive from Sklar and Dietrich (2001) and others (Scheingross et al., 2014; Small et al., 2015; Turowski et al., 2023) has the advantage of being compact, easy to set up compared to annular (Attal et al., 2006) or linear flumes (e.g., Wilkinson et al., 2018), and can reach high flow velocities required to transport cm-size gravel. However, it is not designed to reproduce a channel cross-section or river reach as it has a well-known limitation: the strong radial gradient in flow velocity. The resulting centrifugal force drives the grains toward the disk edge, where the flow velocity and shear stress are higher. Consequently, grain impacts are more frequent and more energetic in this part of the disk. A significant difference with previous setups is that our maximum of abrasion is near the mill edge, while in Sklar and Dietrich (2001) and Small et al. (2015), a vertical recirculation prevents grains from reaching the mill edge, and the maximum erosion is located several centimetres away from the edge (e.g., about 50 mm in Small et al., 2015). We believe our configuration, and the new propeller used, yields saltation trajectories that are not, or at least less, affected by vertical recirculation, and thus potentially closer to reproducing small-scale interactions of sediment with the bedrock floor of an actively incising river. In this setup, our main contribution is the development of a new artificial bedrock material with 3D-printed mechanical discontinuities of chosen orientation and spacing. This allows for reproducible heterogeneity patterns and good control on the spatial density of mechanical discontinuities, a parameter that is expected to strongly control erosion efficiency.
After several tests of 3D printing material, we chose BVOH to print the synthetic fracture networks, a plastic material that fully dissolves when immersed in hot water. In our setup, we use cold water and the cement alters the chemical properties of BVOH so that it does not dissolve, but is turned into a softened plastic. Consequently, water cannot flow through the fractures, and the blocks are not fully loose laterally. Although the tensile strength of dry BVOH is high and generally depends on orientation, ranging from 8.7 to 33.7 MPa for zx (vertical) and xy (horizontal) planes, it is strongly reduced in the condition of our experiments. For instance, when the fractured disks are immersed in the column, they cannot be extracted again as they would break along the fracture planes. However, we note that their softness can create a coating on the fracture planes when they are exposed, which could dampen bedload impacts before being fully abraded.
The synthetic fracture networks in our experiments represent end-members in terms of fracture size distribution, as most fractures have the same area or length, only varying due to the disk shape. In natural settings, fracture length tends to follow power-law distributions with negative exponents (e.g., Bonnet et al., 2001), leading to less frequent long fractures compared to small ones. At the first stage of the study design, we considered printing fracture networks based on more realistic size distributions using, for instance, a Discrete Fracture Network (DFN) model (e.g., Le Goc et al., 2019). However, our tests with DFN models have led to experimental issues, such as isolated volumes that cannot be easily filled with fresh concrete or isolated fractures that require numerous mechanical supports during printing. For these reasons, printing a fully 3D fracture network, including horizontal fractures at various depths to create fully bounded blocks, remains complicated and is beyond the scope of this study.
To characterize the fracture network used in this study, we use the p21 as a classic proxy for fracture density and we use directly the fracture dips for the vertical organization of the fractures. However, the fracture density (p21) does not fully describe the complexity of the networks as it accounts for only part of the geometry. For example, it gives no information on the shape of the block formed by the fractures (square vs rectangle). Yet it is likely that such complexities play a role in the mode and location of erosion. We explored other parameters such as the average spacing of the fractures or the p32, but we did not observe clearer relationships with the average erosion rates or the percentage of erosion by plucking.
4.2 Plucking, macroabrasion and abrasion in our experiments: empirical and physical analysis
Throughout the description of our results, we have referred to two main modes of erosion, abrasion and plucking. We here discuss the relevance of these processes and the associated definitions in the light of empirical and physical analysis.
Empirically, two modes of erosion emerge in our experiments: (1) a “background” mode characterized by an exponential decay of the distribution of local erosion rates with limited or no clear spatial clustering of erosion rates, and (2) a “patch” mode leading to a heavy-tailed distribution of local erosion rates and spatially clustered patches of high erosion rates (Figs. 2 and 3d). For the sake of simplicity, we have referred to these two modes as abrasion and plucking, respectively, and delimited them by considering that plucking events correspond to continuous patches of area greater than 15 mm2 associated with an erosion rate greater than 1 mm min−1 (see Sect. 3). These thresholds are likely related to the scale and conditions of our experiments, to the accuracy and resolution of the SFM topographic reconstruction, and to the method and time intervals used to differentiate erosion rates. Therefore, this binary vision of erosion processes and the associated definitions of plucking and abrasion are intrinsic to our study and do not rely on a universally accepted definition or delimitation of these processes, as presented in the introduction.
Physically, our results indicate at least two distinct modes of erosion: progressive wear by impacting particles and erosion by block formation and loosening, followed by entrainment. An important feature of this second mode is that the size of the removed blocks does not always correspond to the maximum dimensions defined by the fracture network and the thickness of the disk. In fact, the horizontal areal extent of the removed blocks shows a large distribution (Fig. 6), with a significant proportion of blocks reaching the size of the fracture spacing (Fig. 4a). For the vertical dimension, very few blocks erode to the bottom of the disk (at a depth of 2 cm), and this occurs only after significant cumulated erosion, reducing the distance between the disc surface and bottom. The depth of the removed blocks tends to scale with their surface area along a large continuum of sizes, only generally bounded by fracture horizontal spacing. This suggests the existence of two separate stages: (1) a fracturing phase, consisting of systematic horizontal fracturing and sometimes vertical fracturing, in which blocks are formed but not necessarily transported immediately, and (2) an entrainment phase, during which detached blocks are removed. The time interval between fracture formation and block removal, as well as the processes leading to fracturing (e.g., sediment impact, coalescence of pre-existing weaknesses) and block removal (e.g., hydraulic transport, sediment impact) cannot be determined. Sediment impact likely plays a significant role, at least for the fracturing phase, as water flow itself does not lead to erosion.
We now aim at refining the nature and definition of this process, and whether it corresponds only to plucking or to a combination of plucking and macro-abrasion, depending on the size of the debris produced with respect to the pre-existing fracture geometry. Horizontal cracks developing between existing vertical fractures due to bedload impacts is part of the plucking process depicted in Fig. 4 in Whipple et al (2000b) and Fig. 4A in Whipple et al. (2022). As illustrated in our synthetic sketch shown in Fig. 8a, we thus consider that plucking operates in our experiments (Figs. 4 and 5). However, the existence of erosion patches smaller than the area between fracture spacing implies that a more complex fracture pattern with vertical and horizontal components can develop at a smaller scale. This is more akin to the definition of macroabrasion either through one large bedload impact removing a large chunk of rock (Beer and Lamb, 2021; Scott and Wohl, 2019) or progressive fracturing in the vicinity of fractures followed by entrainment (Chatanantavet and Parker, 2009). Because high erosion patches are not detected in unfractured experiments, either macroabrasion does not occur, or operates at a level which we cannot distinguish from classical wear. This means that significant macroabrasion exists in our experiments through exploiting the local mechanical weakness in relation to fractures. Hence, the cm-scale erosion patches detected near fractures for the largest fracture spacing experiments (Fig. 4a and c, 50 and 120 m−1, and some 100 m−1 experiments) are likely produced by structurally driven macroabrasion. For these experiments, the absence of plucking reaching the size of the fracture spacing is likely induced by the limited extent or absence of horizontal fractures connecting the vertical network of fractures that are far apart, as suggested on Fig. 8a. The low proportion of plucking for the rectangular network ( mm or 120 m−1) suggests that it is the largest spacing between fractures that sets the (in)efficiency of plucking, with cracks not able to develop fast enough or to develop at all to connect the fractures that are 35 mm apart. Fracture density might not be the most informative variable in that case. For the smallest fracture spacing ( mm or 190 m−1), plucking likely dominates macroabrasion (Fig. 8a), as most of the blocks have dimensions very close to the fracture spacing (Fig. 4a). But it also becomes difficult to clearly separate plucking from macroabrasion at these small scales. For intermediate fracture spacing ( and mm), both plucking and macroabrasion occur (Fig. 8a), with some experiments showing a clear dominance of plucking (Fig. 4a, 100 m−1), and others a continuum between the two processes (Fig. 4a, 145 m−1). Determining more precisely which of plucking and macroabrasion dominates in the production of large debris is not trivial in these regimes as the removal of large debris can result from the amalgamation of smaller events within a 2 min interval.
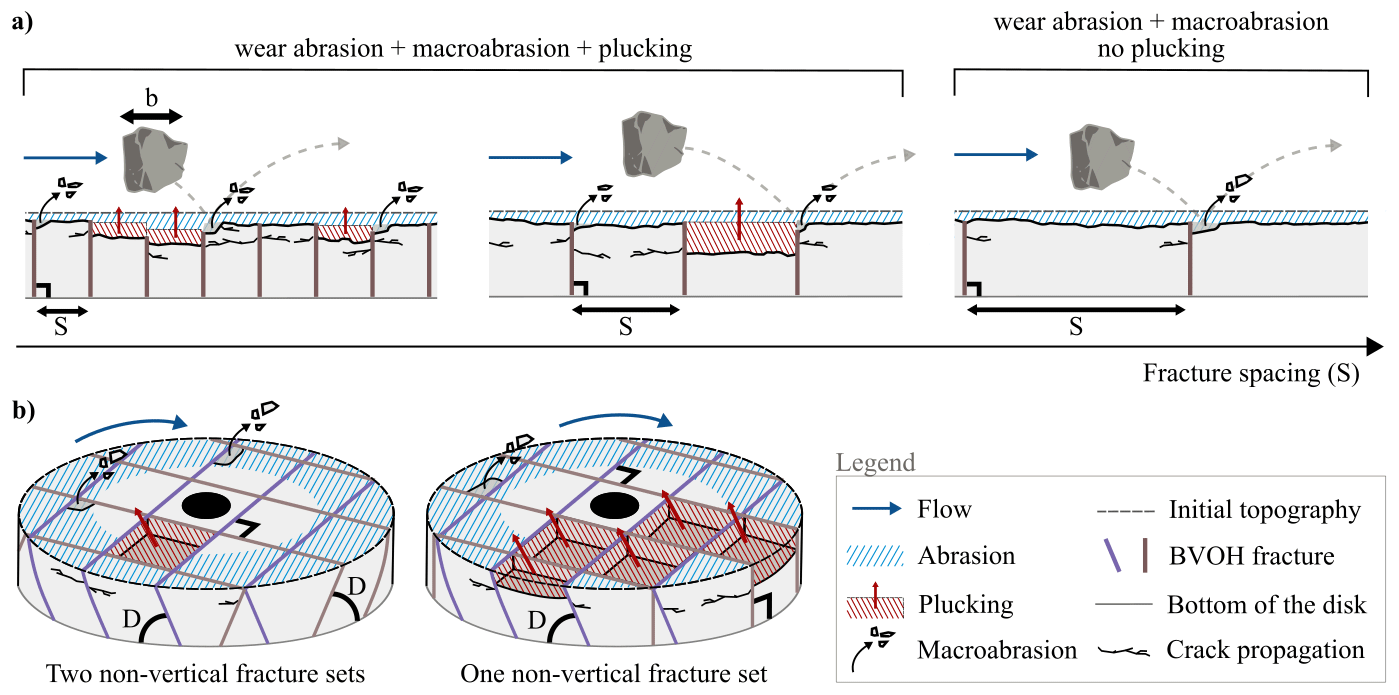
Figure 8Synthetic sketch of our experimental results showing the influence of fracture geometry on erosion processes. (a) Schematic illustration of erosion mode transitions as a function of fracture spacing (S). (b) Three-dimensional schematic representation of erosion patterns for experiments with two non-vertical fracture sets (left) and one non-vertical fracture set (right).
We conclude that the large erosion patches, called plucking in our results, are created by fracturing induced by sediment impacts exploiting the fracture network with two different subprocesses that create a continuum of block sizes: plucking resulting from the creation of horizontal fractures connecting existing ones, to create the largest blocks (Hancock et al., 1998; Whipple, 2004; Whipple et al., 2000b), and macroabrasion that creates smaller debris in the vicinity of fractures (Beer and Lamb, 2021; Chatanantavet and Parker, 2009, 2011). These two processes operate along classical wear abrasion by saltating bedload so that in fractured disks, a continuum between abrasion, macroabrasion and plucking exists. Yet, abrasion is systematically the dominant process in our experiments, as plucking and macroabrasion together never contribute more than 29 % of the total erosion. These two processes can even be negligible when the spacing of vertical fractures is larger than 35 mm in at least one direction (Fig. 4a).
4.3 The impact of fracture geometry on erosion rates
Our experiments yield three key findings: first, unfractured experiments exhibit a systematic decrease in erosion rate during the early stages, with initial rates higher than all fractured experiments (Fig. 3a, b). Second, the mean erosion rate of experiments with vertical fractures does not exhibit a clear dependency on fracture density and is not significantly higher or lower than unfractured experiments (Fig. 3c). Yet, the experiments showing a relatively high proportion of plucking tend to occur at high fracture density. Third, experiments with only one inclined fractures exhibit higher erosion rates and proportion of plucking compared to two inclined sets of fractures, with one specific combination of dip (°) resulting in the highest plucking proportion and asymmetry of all our experiments (Fig. 5). In the following, we seek to explain these three findings.
Unfractured experiments systematically exhibit a higher initial erosion rate close to 0.30 mm min−1 that subsequently decreases through time until reaching a steady value of about 0.15 mm min−1 after 30–40 min (Fig. 3b). Figure 2a and b shows that the first 10 min correspond to the creation of a narrow trough in the outer part of the disk, like a bedrock flute in a natural channel (Hancock et al., 1998; Whipple et al., 2000b). The flute then expands inward as documented by the maps of erosion at 20 and 30 min (Fig. 2b). At 30–40 min, the flute reaches a steady width, and subsequent abrasion is at a lower rate and becomes homogeneous, except in the center of the disk where no abrasion occurs (Fig. 7b). We postulate that the widening of the flute progressively reduces the number of bedload impacts per unit surface and may slightly reduce flow velocity and/or grain saltation height as the distance to the propeller increases. The overall effect would be a reduction in the frequency and kinetic energy of grain impacts per unit surface area, both parameters being central in controlling the abrasion rate of saltating bedload (Sklar and Dietrich, 2004). Testing this hypothesis would require the quantification of grain size trajectories during the experiment. However, the presence of significant turbidity and scratched plexiglass limits visibility through the column, thereby hindering the acquisition of data from, for instance, side-mounted cameras.
Compared to the early stages of unfractured experiments, fractured experiments exhibit a significantly lower erosion rate that does not tend to decline through time (Fig. 3a and b). No smooth flute forms on the outer part, although erosion tends to focus initially on the outer part before progressing inwards. Consequently, the presence of 3D printed fractures appears to reduce the abrasion rate in comparison with an unfractured disk. Two explanations are considered: (1) the effect of the softened BVOH which sometimes sticks out by 1 or 2 mm at the disk surface and may damp the impact of grains on or near fractures; (2) The reduction of abrasion in the outer part of the disk due to a higher radial dispersion of grains, caused by the roughness of fractured disks. The BVOH effect is likely to be unimportant, as the initial erosion rate during the first minutes would tend to decrease with increasing fracture density and BVOH outcropping on the surface. However, this is not observed (Fig. 3a and b). We are therefore exploring the potential impact of the difference in roughness. The presence of fractures quickly generates a rough surface on the outer part of the disk (Figs. 2c and d, 8a). Grain rebound on such a complex rough surface likely results in a higher proportion of grain trajectories with an inward component compared to a smooth surface. Grain impacts thus tend to be less concentrated in the outer part of the disk than in unfractured experiments. This is consistent with the early-on occurrence of single plucking events in the center of the disk (Fig. 4a, 190 m−1) and the decrease of the fraction of the surface with less than 0.5 mm of erosion as the contribution of plucking increases (Fig. 7c). Due to the pronounced radial velocity gradient, grains impacting the bed towards the center of the disk are expected to have a lower impact velocity and a reduced abrasion efficiency compared to grain impacts in the outer part (Sklar and Dietrich, 2004). We therefore propose that the dispersion in grain trajectory related to roughness development is the main explanation for the lower abrasion rate in the early stages compared to unfractured experiments. This transversal dispersion effect continues throughout the experiment in relation to plucking development and is consistent with the lowest radial erosion profile asymmetry observed when the erosion by plucking is greater than 10 % (Fig. 7b).
We now seek to explain the lack of a clear dependency between average erosion rate and vertical fracture density. The proportion of erosion by plucking and macroabrasion tends to increase as fracture density increases (Fig. 4c). A slight increase in average erosion in relation to the proportion of plucking is observed (Fig. 7a). However, given the maximum contribution of 29 % for plucking and macroabrasion (Fig. 4c) and the fact that most experiments are below 10 %, the average erosion rate is always dominated by abrasion. This makes it difficult to clearly detect a potential effect of fracture densities on erosion rates and explains why fractured and unfractured experiments do not exhibit significantly different average erosion rates. As discussed in Sect. 4.2, we suggest that the dominance of abrasion stems from our choice of concrete characteristics, fracture spacing, grain sizes, sediment mass and flow velocity. With these particular experimental parameters, the rate of fracture propagation and its depth in relation to bedload impacts is not large enough compared to the efficiency of abrasion for plucking and macroabrasion to be the dominant erosion processes (Fig. 8a, b). Despite the difficulty in getting a clear signal of the impact of vertical fracture density, we note that plucked depth slightly increases with plucked area (scaling exponent = 0.16) such that the smallest fracture spacing, which generates more frequent plucking events, also creates the shallowest ones. Intermediate fracture spacing, balancing a lower frequency of event but deeper and larger blocks, may actually result in a higher, potentially optimal, plucking erosion rate. Figure 4c suggests an optimum for a mm spacing (145 m−1) with regard to both plucking contribution and erosion rate.
Finally, our exploration of the role of fracture dip for mm suggests contrasting impacts: two sets of fractures dipping at 45° produce negligible plucking and limited macroabrasion (Fig. 5), behaving like lower fracture density experiments or unfractured experiments. Steeper sets of fractures (°) marginally increase the contribution of plucking without having a clear impact on average erosion rates. However, when only one set of fractures is inclined, the contribution of plucking increases. A specific combination of dips (°) yields a significant increase in the contribution of plucking with a runaway effect: the removal of one block led to a very rapid removal of downstream blocks in the zone where the 67° fracture set was dipping towards the flow (Fig. 5a). The resulting pattern is notably asymmetric, with one half of the block extensively eroded, emphasizing the critical role of flow and particle impact direction with the fracture dip (Fig. 5a). Due to this asymmetry, the average erosion rate (Fig. 5b) and the contribution of plucking (Fig. 5c) tell only half of the story. Had plucking occurred at the same level and extent across the entire disk, the resulting average erosion would have been approximately 0.36 mm min−1, with a plucking level of around 40 %. These figures would have far exceeded those observed in all the other fractured experiments. A repeat experiment of this specific combination of dips resulted in a similar runaway asymmetric plucking that had to be stopped early on (Sect. S7, Fig. S7). As illustrated in Fig. 8b, we hypothesize that two sets of inclined fractures likely create a topological constraint that prevents easy entrainment of pluckable blocks in most areas of the disk, except for the quarter side where the two fracture sets orientations favour block entrainment. Conversely, with one vertical fracture set, half of the disks present conditions favorable to block entrainment (Figs. 5a, 8b). In this context, we can hypothesize that one fracture set at 67° can facilitate the development of horizontal fractures through shearing followed by sliding when the block upstream face is directly exposed to grain impacts. Further experiments are required to determine the range of dips that favour plucking and increase bedrock erosion.
4.4 Comparison with previous experimental studies on plucking and abrasion
Previous experimental studies on bedrock incision processes have studied either abrasion (e.g., Scheingross et al., 2014; Sklar and Dietrich, 2001; Small et al., 2015; Turowski et al., 2023), macroabrasion (Beer and Lamb, 2021), or loose block entrainment in the context of plucking (e.g., Chilton et al., 2025; Dubinski and Wohl, 2013; Saha et al., 2021; Wilkinson et al., 2018). Our experimental setup with new fractured material is the first to reproduce simultaneously these 3 processes, and allows us to follow the topographic evolution and spatio-temporal patterns of erosion rates through detailed 3D monitoring.
Experimental studies about plucking only considered the entrainment of already loose 3D blocks (Chilton et al., 2025; Dubinski and Wohl, 2013; Saha et al., 2021; Wilkinson et al., 2018) following one definition of plucking used in the literature (see introduction). These studies show that block entrainment can occur in the absence of initial bed protrusions (Wilkinson et al., 2018), with a dynamics controlled by local hydraulic conditions (Dubinski and Wohl, 2013), and that bedding plane dip angle significantly influences block entrainment thresholds (Chilton et al., 2025). Morphological alterations induced by previous plucking events have also been shown to subsequently influence the spatial and temporal patterns of the following entrainment events (Dubinski and Wohl, 2013; Wilkinson et al., 2018). These findings can be correlated with the propagation of block removal events we observe in our experiments. Yet, while earlier studies mainly observed upstream propagation (Dubinski and Wohl, 2013; Saha et al., 2021; Wilkinson et al., 2018), our experiments reveal plucking propagation in both upstream and downstream directions (Figs. 4a, 5a). We hypothesize that this difference is linked to the combined effects of sediment grain impacts and the fact that blocks are initially not detached, requiring prior fracturing to be entrained.
These studies provide essential knowledge about how the blocks are being entrained by flow hydraulics, but they did not consider the processes that form these blocks, nor the potential role of grain impacts in the entrainment. Here, we do not impose block volume, as depth develops naturally as the 3rd joint set or through a smaller block created by macroabrasion due to the impacts of the saltating grains. Our analysis of the detected plucking events reveals a power-law relationship between their depth and area. We suggest that this emergent relationship is related to the mechanical strength of the concrete we used together with the energy of the grain impacts. This highlights the importance of grains in river erosion, and with the role of fractures, which constrains the mode of erosion.
Finally, some mill experiments using natural rocks have documented a decrease in the abrasion rate through time, followed by a stabilisation that has been interpreted as an increasing rock resistance through depth (Small et al., 2015). Other experiments did not observe such decay (Turowski et al., 2023). Here, the decay in abrasion rate (Fig. 3a, b) is not related to a change in rock resistance, but rather due to the morphodynamical development of the outer flute, and particularly its initial widening. Hence, caution should be exerted when interpreting abrasion mill experiments for which a steady erosion regime has not been reached. Detailed 3D monitoring through time is essential to evaluate how significant the change in microtopography is.
4.5 Relevance to natural systems
Our new fractured material is not directly designed to be an analogy of natural fractured, jointed or bedded rocks, as the fracture patterns we explored are highly simplified. But this simplification and the capacity to control the mechanical discontinuities spacing and orientation makes the problem tractable. In addition, even if abrasion mills make important simplifications to study abrasion rates that are difficult to measure in situ, they have provided key insights into the controls of rock mechanics on abrasion rates (Scheingross et al., 2014; Sklar and Dietrich, 2001; Small et al., 2015; Turowski et al., 2023). We show that our setup can explore the simultaneous occurrence of plucking, abrasion and macroabrasion in the context of bedload transport. These processes are expected to occur in active mountain belts (Whipple et al., 2022) where bedrock rivers are never or rarely free of coarse sediment supply (e.g., Lague, 2010; Turowski et al., 2007), and where bedrock is generally full of discontinuities of various spacing and orientation due to tectonic deformation (e.g., Hartshorn et al., 2002; Molnar et al., 2007), thermal fracturing (Collins et al., 2018), topographic stress (Slim et al., 2015), freeze thaw (Hallet et al., 1991) or expansive minerals (Jarzyna et al., 2023). Yet, many natural processes are not reproduced in our experimental setup, such as wedging by grains, hydraulic jacking and hydraulic pressure fluctuations within open fractures (Whipple et al., 2000b). The mechanical characteristics of our softened BVOH joints are also not fully known beyond the observation that they are much weaker than our concrete. BVOH may also damp bedload impacts and consequently reduce the efficiency of all three processes. Hence, the transfer of our results to natural systems is not direct. However, insights gained through understanding the experiment morphodynamics that we carefully monitor, in relation to known boundary conditions, can shed new light on process dominance in natural bedrock rivers and the role of mechanical discontinuities.
In this first set of experiments, abrasion systematically dominates all experiments. We interpret this as resulting from the impact-driven rate of fracture propagation between pre-existing fractures being too slow, compared to the abrasion rates, for plucking to be dominant. A different choice of concrete strength, grain sizes, sediment mass, and flow velocity could lead to a different balance between these two competing processes. Further experiments are thus needed to expand the parameter space of the erosion efficiency problem in our experimental setup.
Our results suggest that a natural river with bedrock characterized by a high density of 2D mechanical discontinuities that might not be fully connected in 3D, does not necessarily erode much faster than the same intact rock when bedload transport and abrasion occur. This is consistent with the view put forward by various authors, that the rate of crack propagation between pre-existing fractures is a critical parameter for plucking to be a dominant process in nature (Chatanantavet and Parker, 2009; Hancock et al., 1998; Scott and Wohl, 2019; Whipple et al., 2000b). In addition, even though plucking can occur all over the surface leaving a clear morphological signature (Figs. 2e and 4a, 145 m−1), it does not imply that plucking is the dominant erosion process. In consequence, very different bedrock morphologies in relation to the presence or absence of fractures (Fig. 2a and e) can result in very similar time averaged erosion rates. Lastly, our experiments demonstrate that the fracture dip and orientation in relation to flow and impacts direction were a dominant controlling factor (from 0.13 to 0.36 mm min−1 when corrected for asymmetry) compared to the effect of fracture spacing for vertical configurations (0.13 to 0.26 mm min−1). This is consistent with observations in natural rivers (Scott and Wohl, 2019; Wohl, 2000). Our experiments suggest that plucking efficiency has a non-linear dependency with the dip angle (Fig. 5c) that should be further explored.
In this study, we developed a new artificial bedrock made of concrete with 3D printed fracture patterns acting as planar discontinuities that we use in a classical “abrasion mill” experimental setup (Sklar and Dietrich, 2001). We investigate how the spacing and dip of regular fractures can affect the magnitude, the location, and the mode of erosion, between two classes of processes: abrasion and plucking. We also explore if macroabrasion creating smaller debris than fracture spacing occurs in our experiment. We use high-frequency temporal series of 3D topographies to document erosion rates and patterns through time.
We show that in the absence of fractures, the disks erode by wear abrasion only, without macroabrasion, and exhibit a progressive decay of the average erosion rate due to the vertical incision and inward widening of a flute-like feature near the mill edge. Erosion rates then become steady at about half the initial erosion rate. The resulting topography is smooth with radial symmetry. When the disk is fractured, erosion can occur both by abrasion, macroabrasion and plucking, a unique feature of our artificial bedrock and key contribution of this study. Macroabrasion occurs near fractures and dominates plucking for high fracture spacing, while plucking tends to dominate macroabrasion for low fracture densities, even though it is difficult to precisely quantify the relative importance of both. The erosion rate of fractured experiments does not show a temporal decay but exhibits sharp variations over 2 min intervals due to plucking events. The resulting topographies are rougher with less radial symmetry. Plucking can occur closer to the disk center compared to abraded unfractured disks, hinting at more complex grain trajectories owing to the larger roughness. Even though plucking can occur over most of the surface in the intermediate to highest fracture densities, abrasion always dominates plucking and macroabrasion in terms of total erosion budget for all studied fracture spacing and geometries. We posit that the rate of horizontal fracture propagation driven by bedload impacts is too slow and the pluckable depth too shallow for plucking to dominate abrasion. This also explains why erosion rates show little increase with fracture density (factor 2 at most). Further experiments are needed to determine whether the abrasion dominance observed in our experiments is a result of our specific choice of sediment mass, grain size, flow velocity, and mechanical properties of the concrete and the 3D printing material (BVOH). Finally, we demonstrate that in our experiments the orientation and dip of the fractures with respect to the flow plays a dominant role compared to fracture density, in enhancing plucking. Plucking is favoured when fractures dip upstream (i.e., against the flow direction) and only for one specific dip angle (67°) amongst the 3 studied (45 and 90°).
Our results emphasize the critical role that the creation of a 3rd fracture both in terms of depth and propagation rate has for plucking to dominate abrasion in areas where only 2 sets of mechanical discontinuities exist (Chatanantavet and Parker, 2009, 2011; Scott and Wohl, 2019; Whipple et al., 2000b). Compared to our experiments, a larger range of processes can contribute to this 3rd fracture in natural systems including wedging by grains (Hartshorn et al., 2002), wetting and drying, temperature fluctuations (Whipple et al., 2022). Additional complexities related to discharge fluctuations, sediment supply fluctuations and the large range of grain size and fracture spacing can also alter the efficiency of abrasion and plucking. It is thus difficult to evaluate how specific to natural systems is the balance between abrasion and plucking that we obtain in our experiments. However, we demonstrate that the classical view that densely jointed rock erodes much faster than the same intact rock (Molnar et al., 2007; Thuro, 1997) is not always true. We also illustrate how very different bedrock morphologies, typical of abrasion and plucking processes of the same rock material intact or fractured, can have very similar time-averaged erosion rates.
Table 1: Geometric properties, mean erosion rates with standard deviations and percentage of erosion by plucking for all the experiments. The colours to the right of density and dip angles are the ones used in the figures.
Data generated in this study are available online in the Zenodo repository (https://doi.org/10.5281/zenodo.17607654, Fournereau, 2025).
The supplement related to this article is available online at https://doi.org/10.5194/esurf-14-191-2026-supplement.
MF and LG conducted the experiments. JJK assisted in the experimental setup and 3D printing of fracture networks. CL enabled us to perform the strength tests on our concrete. PL and MF developed a Python code to automate calculations on our point clouds. LG and PS developed a Matlab code for the result analysis. MF, LG, PS and DL performed the analysis and prepared the figures. HH helped us in the statistical detection of plucking events. DL, CA and PS initiated the development of the experimental setup. MF, LG, PS, and DL contributed to the writing and revision of the manuscript.
The contact author has declared that none of the authors has any competing interests.
Publisher's note: Copernicus Publications remains neutral with regard to jurisdictional claims made in the text, published maps, institutional affiliations, or any other geographical representation in this paper. The authors bear the ultimate responsibility for providing appropriate place names. Views expressed in the text are those of the authors and do not necessarily reflect the views of the publisher.
The authors would like to thank the two anonymous referees and Dr. Neely, who provided valuable comments that helped to improve and clarify the article. We also thank the handling associate editor, Anastasia Piliouras, for her constructive feedback and suggestions. We thank Edwin Baynes for proofreading the paper.
This research has been supported by the European Research Council, EU H2020 European Research Council (FEASIBLe (grant no. 803721)) and the project CNRS-INSU EROFRAC. We also acknowledge support by the University of Rennes and the French Ministry of Scientific Research.
This paper was edited by Anastasia Piliouras and reviewed by Alexander Neely and two anonymous referees.
AFNOR: NF EN 196-1: Methods of testing cement – Part 1: determination of strength, AFNOR Éditions, https://www.boutique.afnor.org/en-gb/standard/nf-en-1961/methods-of-testing-cement-part-1-determination-of-strength/fa184622/57803, 2016.
Anderson, R. S. and Anderson, S. P.: Geomorphology: The Mechanics and Chemistry of Landscapes, Cambridge University Press, ISBN-13 978-0521519786, ISBN-10 0521519780, 2010.
Attal, M., Lavé, J., and Masson, J.-P.: New Facility to Study River Abrasion Processes, J. Hydraul. Eng., 132, 624–628, https://doi.org/10.1061/(ASCE)0733-9429(2006)132:6(624), 2006.
Beer, A. R. and Lamb, M. P.: Abrasion regimes in fluvial bedrock incision, Geology, 49, 682–386, https://doi.org/10.1130/G48466.1, 2021.
Beer, A. R. and Turowski, J. M.: Bedload transport controls bedrock erosion under sediment-starved conditions, Earth Surf. Dynam., 3, 291–309, https://doi.org/10.5194/esurf-3-291-2015, 2015.
Beer, Alexander. R., Turowski, J. M., and Kirchner, J. W.: Spatial patterns of erosion in a bedrock gorge, J. Geophys. Res.-Earth, 122, 191–214, https://doi.org/10.1002/2016JF003850, 2017.
Bonnet, E., Bour, O., Odling, N. E., Davy, P., Main, I., Cowie, P., and Berkowitz, B.: Scaling of fracture systems in geological media, Rev. Geophys., 39, 347–383, https://doi.org/10.1029/1999RG000074, 2001.
Brodu, N. and Lague, D.: 3D terrestrial lidar data classification of complex natural scenes using a multi-scale dimensionality criterion: Applications in geomorphology, ISPRS Journal of Photogramm., 68, 121–134, https://doi.org/10.1016/j.isprsjprs.2012.01.006, 2012.
Bulletin du ciment: Le durcissement du béton, Bulletin du Ciment, Service de Recherches et Conseils Techniques de l'Industrie Suisse du Ciment (TFB AG), 18–19, 13, https://doi.org/10.5169/seals-145354%E2%80%8B%E2%80%8B, 1950–1951.
Chatanantavet, P. and Parker, G.: Physically based modeling of bedrock incision by abrasion, plucking, and macroabrasion, J. Geophys. Res., 114, https://doi.org/10.1029/2008JF001044, 2009.
Chatanantavet, P. and Parker, G.: Quantitative Testing of Model of Bedrock Channel Incision by Plucking and Macroabrasion, J. Hydraul. Eng., 137, 1311–1317, https://doi.org/10.1061/(ASCE)HY.1943-7900.0000421, 2011.
Chilton, K. D., Zedan, M., Strom, K., and Shobe, C. M.: Dip angle controls on plucking susceptibility and knickpoint evolution in bedrock rivers, Geology, 53, 780–784, https://doi.org/10.1130/g53413.1, 2025.
Collins, B. D., Stock, G. M., Eppes, M.-C., Lewis, S. W., Corbett, S. C., and Smith, J. B.: Thermal influences on spontaneous rock dome exfoliation, Nat. Commun., 9, 762, https://doi.org/10.1038/s41467-017-02728-1, 2018.
Dershowitz, W. S. and Herda, H. H.: Interpretation of fracture spacing and intensity, in: The 33rd U.S. Symposium on Rock Mechanics, https://doi.org/10.1016/0148-9062(93)91769-f, 1992.
Dubinski, I. M. and Wohl, E.: Relationships between block quarrying, bed shear stress, and stream power: A physical model of block quarrying of a jointed bedrock channel, Geomorphology, 180–181, 66–81, https://doi.org/10.1016/j.geomorph.2012.09.007, 2013.
Ehlen, J. and Wohl, E.: Joints and landform evolution in bedrock canyons, Trans. Jpn. Geomorphol. Union, 23, 237–255, 2002.
Eppes, M. C., Rinehart, A., Aldred, J., Berberich, S., Dahlquist, M. P., Evans, S. G., Keanini, R., Laubach, S. E., Moser, F., Morovati, M., Porson, S., Rasmussen, M., and Shaanan, U.: Introducing standardized field methods for fracture-focused surface process research, Earth Surf. Dynam., 12, 35–66, https://doi.org/10.5194/esurf-12-35-2024, 2024.
Fournereau, M.: Dataset used in the study “New experiments to probe the role of fractures in bedrock on river erosion rate and processes”, Zenodo [data set], https://doi.org/10.5281/zenodo.17607654, 2025.
Hallet, B.: Glacial quarrying: a simple theoretical model, Ann. Glaciol., 22, 1–8, https://doi.org/10.3189/1996AoG22-1-1-8, 1996.
Hallet, B., Walder, J. S., and Stubbs, C. W.: Weathering by segregation ice growth in microcracks at sustained subzero temperatures: Verification from an experimental study using acoustic emissions, Permafrost Periglac., 2, 283–300, https://doi.org/10.1002/ppp.3430020404, 1991.
Hancock, G. S., Anderson, R. S., and Whipple, K. X.: Beyond power: Bedrock river incision process and form, in: Rivers Over Rock: Fluvial Processes in Bedrock Channels, vol. 107, edited by: Tinkler, K. J. and Wohl, E. E., Blackwell Publishing Ltd, 35–60, https://doi.org/10.1029/GM107p0035, 1998.
Hartshorn, K., Hovius, N., Dade, W. B., and Slingerland, R. L.: Climate-Driven Bedrock Incision in an Active Mountain Belt, Science, 297, 2036–2038, https://doi.org/10.1126/science.1075078, 2002.
Hurst, A. A., Anderson, R. S., and Crimaldi, J. P.: Toward Entrainment Thresholds in Fluvial Plucking, J. Geophys. Res.-Earth, 126, e2020JF005944, https://doi.org/10.1029/2020JF005944, 2021.
Jarzyna, A., Bąbel, M., Vladi, F., and Ługowski, D.: Hydration caves and cavities from the recent weathering zone of anhydrites at Dingwall (Nova Scotia, Canada), Geomorphology, 433, 108667, https://doi.org/10.1016/j.geomorph.2023.108667, 2023.
Lague, D.: Reduction of long-term bedrock incision efficiency by short-term alluvial cover intermittency, J. Geophys. Res.-Earth, 115, https://doi.org/10.1029/2008JF001210, 2010.
Lague, D.: The stream power river incision model: evidence, theory and beyond, Earth Surf. Proc. Land., 39, 38–61, https://doi.org/10.1002/esp.3462, 2014.
Lague, D., Brodu, N., and Leroux, J.: Accurate 3D comparison of complex topography with terrestrial laser scanner: Application to the Rangitikei canyon (N-Z), ISPRS J. Photogramm., 82, https://doi.org/10.1016/j.isprsjprs.2013.04.009, 2013.
Lamb, M. P. and Dietrich, W. E.: The persistence of waterfalls in fractured rock, GSA Bulletin, 121, 1123–1134, https://doi.org/10.1130/B26482.1, 2009.
Le Goc, R., Pinier, B., Darcel, C., Lavoine, E., Doolaeghe, D., de Simone, S., De Dreuzy, J.-R., and Davy, P.: DFN. lab: software platform for Discrete Fracture Network models, AGU Fall Meeting 2019, https://ui.adsabs.harvard.edu/abs/2019AGUFM.H41H1778L, 2019.
Lima, A. G., Pelegrina, M. A., Pontarolo, M., Gonçalves Lima, A., Pelegrina, M. A., and Pontarolo, M.: Fracture variability in basalts and its effect on river erosion: a case study in the Paraná volcanic province, Earth Sci. Res. J., 25, 13–19, https://doi.org/10.15446/esrj.v25n1.85098, 2021.
Molnar, P., Anderson, R. S., and Anderson, S. P.: Tectonics, fracturing of rock, and erosion, J. Geophys. Res., 112, https://doi.org/10.1029/2005JF000433, 2007.
Paola, C., Straub, K., Mohrig, D., and Reinhardt, L.: The “unreasonable effectiveness” of stratigraphic and geomorphic experiments, Earth-Sci. Rev., 97, 1–43, https://doi.org/10.1016/j.earscirev.2009.05.003, 2009.
Saha, R., Lee, J. S., and Hong, S. H.: The impact of lateral flow contraction on the rock plucking process under sub-critical flow conditions, Earth Surf. Proc. Land., 46, 2902–2915, https://doi.org/10.1002/esp.5220, 2021.
Scheingross, J., Brun, F., Lo, D., Omerdin, K., and Lamb, M.: Experimental evidence for fluvial bedrock incision by suspended and bedload sediment, Geology, 42, 523–526, https://doi.org/10.1130/G35432.1, 2014.
Scott, D. N. and Wohl, E. E.: Bedrock fracture influences on geomorphic process and form across process domains and scales, Earth Surf. Proc. Land., 44, 27–45, https://doi.org/10.1002/esp.4473, 2019.
Sklar, L. and Dietrich, W.: Sediment and rock strength control on river incision into bedrock, Geology, 29, 1087–1090, https://doi.org/10.1130/0091-7613(2001)029<1087:SARSCO>2.0.CO;2, 2001.
Sklar, L. and Dietrich, W. E.: River Longitudinal Profiles and Bedrock Incision Models: Stream Power and the Influence of Sediment Supply, in: Rivers Over Rock: Fluvial Processes in Bedrock Channels, vol. 107, American Geophysical Union (AGU), 237–260, https://doi.org/10.1029/GM107p0237, 1998.
Sklar, L. S. and Dietrich, W. E.: A mechanistic model for river incision into bedrock by saltating bed load, Water Resour. Res., 40, https://doi.org/10.1029/2003WR002496, 2004.
Slim, M., Perron, J. T., Martel, S. J., and Singha, K.: Topographic stress and rock fracture: a two-dimensional numerical model for arbitrary topography and preliminary comparison with borehole observations, Earth Surf. Proc. Land., 40, 512–529, https://doi.org/10.1002/esp.3646, 2015.
Small, E. E., Blom, T., Hancock, G. S., Hynek, B. M., and Wobus, C. W.: Variability of rock erodibility in bedrock-floored stream channels based on abrasion mill experiments, J. Geophys. Res.-Earth, 120, 1455–1469, https://doi.org/10.1002/2015JF003506, 2015.
Snyder, N. P., Whipple, K. X., Tucker, G. E., and Merritts, D. J.: Importance of a stochastic distribution of floods and erosion thresholds in the bedrock river incision problem, J. Geophys. Res.-Sol. Ea., 108, https://doi.org/10.1029/2001JB001655, 2003.
Thuro, K.: Drillability prediction: geological influences in hard rock drill and blast tunnelling, Geol. Rundsch., 86, 426–438, https://doi.org/10.1007/s005310050151, 1997.
Turowski, J. M., Lague, D., and Hovius, N.: Cover effect in bedrock abrasion: A new derivation and its implications for the modeling of bedrock channel morphology, J. Geophys. Res.-Earth, 112, https://doi.org/10.1029/2006JF000697, 2007.
Turowski, J. M., Hovius, N., Wilson, A., and Horng, M.-J.: Hydraulic geometry, river sediment and the definition of bedrock channels, Geomorphology, 99, 26–38, https://doi.org/10.1016/j.geomorph.2007.10.001, 2008.
Turowski, J. M., Pruß, G., Voigtländer, A., Ludwig, A., Landgraf, A., Kober, F., and Bonnelye, A.: Geotechnical controls on erodibility in fluvial impact erosion, Earth Surf. Dynam., 11, 979–994, https://doi.org/10.5194/esurf-11-979-2023, 2023.
Whipple, K. X.: Bedrock Rivers and the Geomorphology of Active Orogens, Annu. Rev. Earth Pl. Sc., 32, 151–185, https://doi.org/10.1146/annurev.earth.32.101802.120356, 2004.
Whipple, K. X., Snyder, N. P., and Dollenmayer, K.: Rates and processes of bedrock incision by the Upper Ukak River since the 1912 Novarupta ash flow in the Valley of Ten Thousand Smokes, Alaska, Geology, 28, 835–838, https://doi.org/10.1130/0091-7613(2000)28<835:RAPOBI>2.0.CO;2, 2000a.
Whipple, K. X., Hancock, G. S., and Anderson, R.: River incision into bedrock: Mechanics and relative efficacy of plucking, abrasion, and cavitation, GSA Bulletin, 112, 490–503, https://doi.org/10.1130/0016-7606(2000)112<490:RIIBMA>2.0.CO;2, 2000b.
Whipple, K. X., DiBiase, R. A., Crosby, B., and Johnson, J. P. L.: 6.40 Bedrock Rivers, in: Treatise on Geomorphology, Second Edition, edited by: Shroder, J. (Jack) F., Academic Press, Oxford, 865–903, https://doi.org/10.1016/B978-0-12-818234-5.00101-2, 2022.
Wilkinson, C., Harbor, D. J., Helgans, E., and Kuehner, J. P.: Plucking phenomena in nonuniform flow, Geosphere, 14, 2157–2170, https://doi.org/10.1130/GES01623.1, 2018.
Wilson, A. and Lavé, J.: Convergent evolution of abrading flow obstacles: Insights from analogue modelling of fluvial bedrock abrasion by coarse bedload, Geomorphology, 208, 207–224, https://doi.org/10.1016/j.geomorph.2013.11.024, 2014.
Wohl, E.: The effect of bedrock jointing on the formation of straths in the Cache la Poudre River drainage, Colorado Front Range, J. Geophys. Res.-Earth, 113, https://doi.org/10.1029/2007JF000817, 2008.
Wohl, E. E.: Substrate Influences on Step-Pool Sequences in the Christopher Creek Drainage, Arizona, J. Geol., 108, 121–129, https://doi.org/10.1086/314385, 2000.
Yanites, B. J.: The Dynamics of Channel Slope, Width, and Sediment in Actively Eroding Bedrock River Systems, J. Geophys. Res.-Earth, 123, 1504–1527, https://doi.org/10.1029/2017JF004405, 2018.