the Creative Commons Attribution 4.0 License.
the Creative Commons Attribution 4.0 License.
 | 20 Mar 2026
Spatiotemporal dynamics of Sentinel-2 NDVI as indicators of bio-hydromorphological interactions: implications for river management
Yuji Toda
Runye Zhu
The Normalized Difference Vegetation Index (NDVI) can be effectively used for monitoring the spatial and temporal dynamics of riparian vegetation. However, quantitative and efficient evaluations of the links between NDVI and bio-hydromorphological processes remain limited, particularly in river management contexts where dense in-channel vegetation can obstruct flow and reduce conveyance capacity. Using 200 cloud-free Sentinel-2 images (2015–2024) covering a 20-km reach of the Chikuma River (Japan), we evaluated the utility of high temporal resolution NDVI and greenness index (defined as NDVI > 0.2) as quantitative indicators of bio-hydromorphological dynamics and its implications for riverine management. The analysis focused on the relationships between NDVI dynamics, flood magnitude, relative elevation along lateral channel morphology, and seasonal vegetation variability within a frequently disturbed channel. The results show that NDVI fluctuations strongly correspond to flood disturbances at lower relative elevations, whereas vegetation at higher elevations remains relatively stable. The annual maximum greenness ratio was well described by a logistic model along the cross-sectional transects. Annual greenness ratio exhibited clear seasonal patterns, showing a late-summer (August–September) greenness peak. These spatiotemporal and seasonal NDVI characteristics demonstrate the potential of Sentinel-2 imagery to operationalize both the “when” (timing) of vegetation management and the “where” (priority zones defined by relative elevation), providing a transferable, remotely sensed basis for flood-risk mitigation in frequently disturbed riverine environments.
- Article
(12055 KB) - Full-text XML
- BibTeX
- EndNote


Riparian zones serve as dynamic interfaces between terrestrial and aquatic ecosystems, playing critical roles in flood regulation, nutrient cycling, biodiversity preservation, and habitat provisioning (Nallaperuma and Asaeda, 2019). The ecological functions of riparian zones result from continuous interactions amongst vegetation dynamics, sediment transport, channel migration, and river hydrodynamics, a process often referred to as bio-hydromorphological feedback (Gurnell et al., 2012; Naiman et al., 2010). Riparian vegetation typically exhibits high sensitivity to hydrological fluctuations such as floods. The seed dispersal and seedling recruitment are highly affected by the inundation zones during the seed dispersal period and by disturbance after seed dispersal, respectively. The flood-induced vegetation mortality may occur following uprooting, burial and prolonged inundation time (Edmaier et al., 2011; Merritt et al., 2010). The riparian vegetation species and distribution are correlated with elevation relative to water level, which is traditionally expressed through the framework of lateral dimension (Hughes, 1997), emphasizing interactions between the river channel, the floodplain, and adjacent terrestrial habitats. Amongst these interactions, lateral connectivity is especially critical, since it enables the redistribution of sediment, nutrients, seeds, and organic materials across the river corridor, thereby supporting vegetation diversity and enhancing ecosystem resilience (Boothroyd et al., 2021; Hughes, 1997; Modi et al., 2022; Ward et al., 2002). Riparian vegetation cover increases flow resistance inducing sediment deposition and driving “biogeomorphic succession” (Corenblit et al., 2007). The river channel pattern and bank strength are thought to have a tight relationship with the in-channel riparian vegetation (Candel et al., 2021).
Dense vegetation growth within river channels can influence river hydraulics by increasing channel roughness, thereby impeding flow, elevating water levels, and potentially exacerbating flood risks (Nepf, 2012). The intense flood events, which occurred in various countries around the world, highlighted the importance of evaluating the vegetation destruction processes, such as the woody debris can induce dangerous obstruction along the channel network (Francalanci et al., 2020). The embankment collapse was identified following the washout of riparian vegetation (Kyuka et al., 2020; Iwasaki et al., 2016). It is necessary to understand the destruction zone and its relationship with the hydromorphological parameters, such as flood magnitude and relative elevation above the water level. The flood may cause vegetation destruction and provide opportunities for post-flood succession (recruitment and growth) on newly formed bare substrates (Mahoney and Rood, 1998; Merritt et al., 2010). Post-flood vegetation recovery is a key component of bio-hydromorphological feedbacks that shape medium- to long-term river corridor adjustment and therefore needs to be considered in river management planning (Corenblit et al., 2011; Stella et al., 2013). Because vegetation responses to floods can include short-lived regrowth phases, high-frequency monitoring is critical to distinguish transient disturbance signals from seasonal phenology and to capture recovery trajectories occurring over weeks to months (Balke et al., 2014). This need is especially acute in gravel-bed and braided systems, where exposure of bare sediment and rapid geomorphic change can confound interpretations based on sparse surveys (Džubáková et al., 2015).
With the increasing availability of large geospatial datasets, the use of remotely sensed information to monitor riverine bio-hydromorphodynamics has gained momentum (Singh and Vyas, 2022). The Normalized Difference Vegetation Index (NDVI), derived from satellite remote sensing, is widely used to quantify vegetation greenness, productivity, and phenology (Marchetti et al., 2016; Tucker, 1979; Zeng et al., 2020). Owing to the improved availability and revisit frequency of satellite platforms, NDVI has enabled numerous spatiotemporal analyses of riparian vegetation, allowing researchers to link vegetation phenology and interannual variability to hydrological and climatic drivers (Betz et al., 2023; Zuo et al., 2022). Despite these advances, existing studies have focused predominantly on lowland floodplains and wetland systems at large spatial extents (Hess et al., 2003; Townsend and Walsh, 2001). Absolute elevation is often used as an explanatory variable for NDVI dynamics in broad-scale studies. However, elevation typically decreases longitudinally from upstream to downstream, and this trend does not adequately represent in-channel vegetation patterns. Consequently, quantitative evaluations of the coupled effects of flood magnitude, lateral connectivity, and NDVI dynamics remain limited, particularly for high-disturbance systems (Herrmann et al., 2024; Marchetti et al., 2020). In addition, practical frameworks that translate satellite-derived vegetation indicators into operational guidance for managing river channels prone to vegetation overgrowth remain underdeveloped. Addressing these gaps is especially important where woody encroachment increases hydraulic roughness and flood risk.
This study addresses three primary research questions using a decade of remote sensing data from the Chikuma River, a steep, gravel-bed and high-disturbance system in Japan characterized by significant vegetation overgrowth:
-
How does the spatiotemporal Sentinel-2 NDVI response to flood-disturbance and relative elevation above water level?
-
Can NDVI effectively indicate bio-hydromorphological interactions within a frequent-disturbance system?
-
How can satellite-derived vegetation metrics be translated into practical strategies for river management?
By addressing these questions, we explore the potential of NDVI as a reliable indicator of bio-hydromorphological interactions and assess its applicability for flood mitigation and vegetation control planning. The structure of the paper is as follows. We first introduce datasets and analytical methods, including remote sensing, hydrological records, and topographic data processing. We then evaluate spatial and temporal NDVI patterns in relation to flood magnitude and elevation relative to water level, and we examine the seasonal variability of NDVI. Finally, we discuss the optimal time (“when”) and the spatial prioritization (“where”) of riparian vegetation management actions.
2.1 Study site
The study area for our research was the Chikuma River, located in Nagano Prefecture, Central Japan (Fig. 1). Our study focused on a 20-km river reach, extending from 109 to 89 km upstream of the river mouth. Within this reach, the river has a slope of approximately and a representative grain size (d60) of 53 mm, classifying it as a steep, gravel-bed river. The 109–89 km section is treated as a single, coherent geomorphic segment because its channel characteristics are distinct from those of the adjacent reaches. The reach upstream of section 109–89 km is characterized by lower vegetation coverage, while the downstream reach possesses a significantly gentler slope. Woody encroachment, primarily Robinia pseudoacacia and Salix, hinders flood management. In 2018, Robinia pseudoacacia alone accounted for approximately 23 % of the total area, which is substantially higher than the coverage of bare gravel bars (around 11 %). As a result, periodic, nature-oriented river maintenance practices, including vegetation cutting and river channel excavation, have been implemented for improving flood conveyance capacity. However, uncertainties remain regarding the optimal timing (“when”) and spatial prioritization (“where”) of vegetation cutting, posing challenges for river managers.
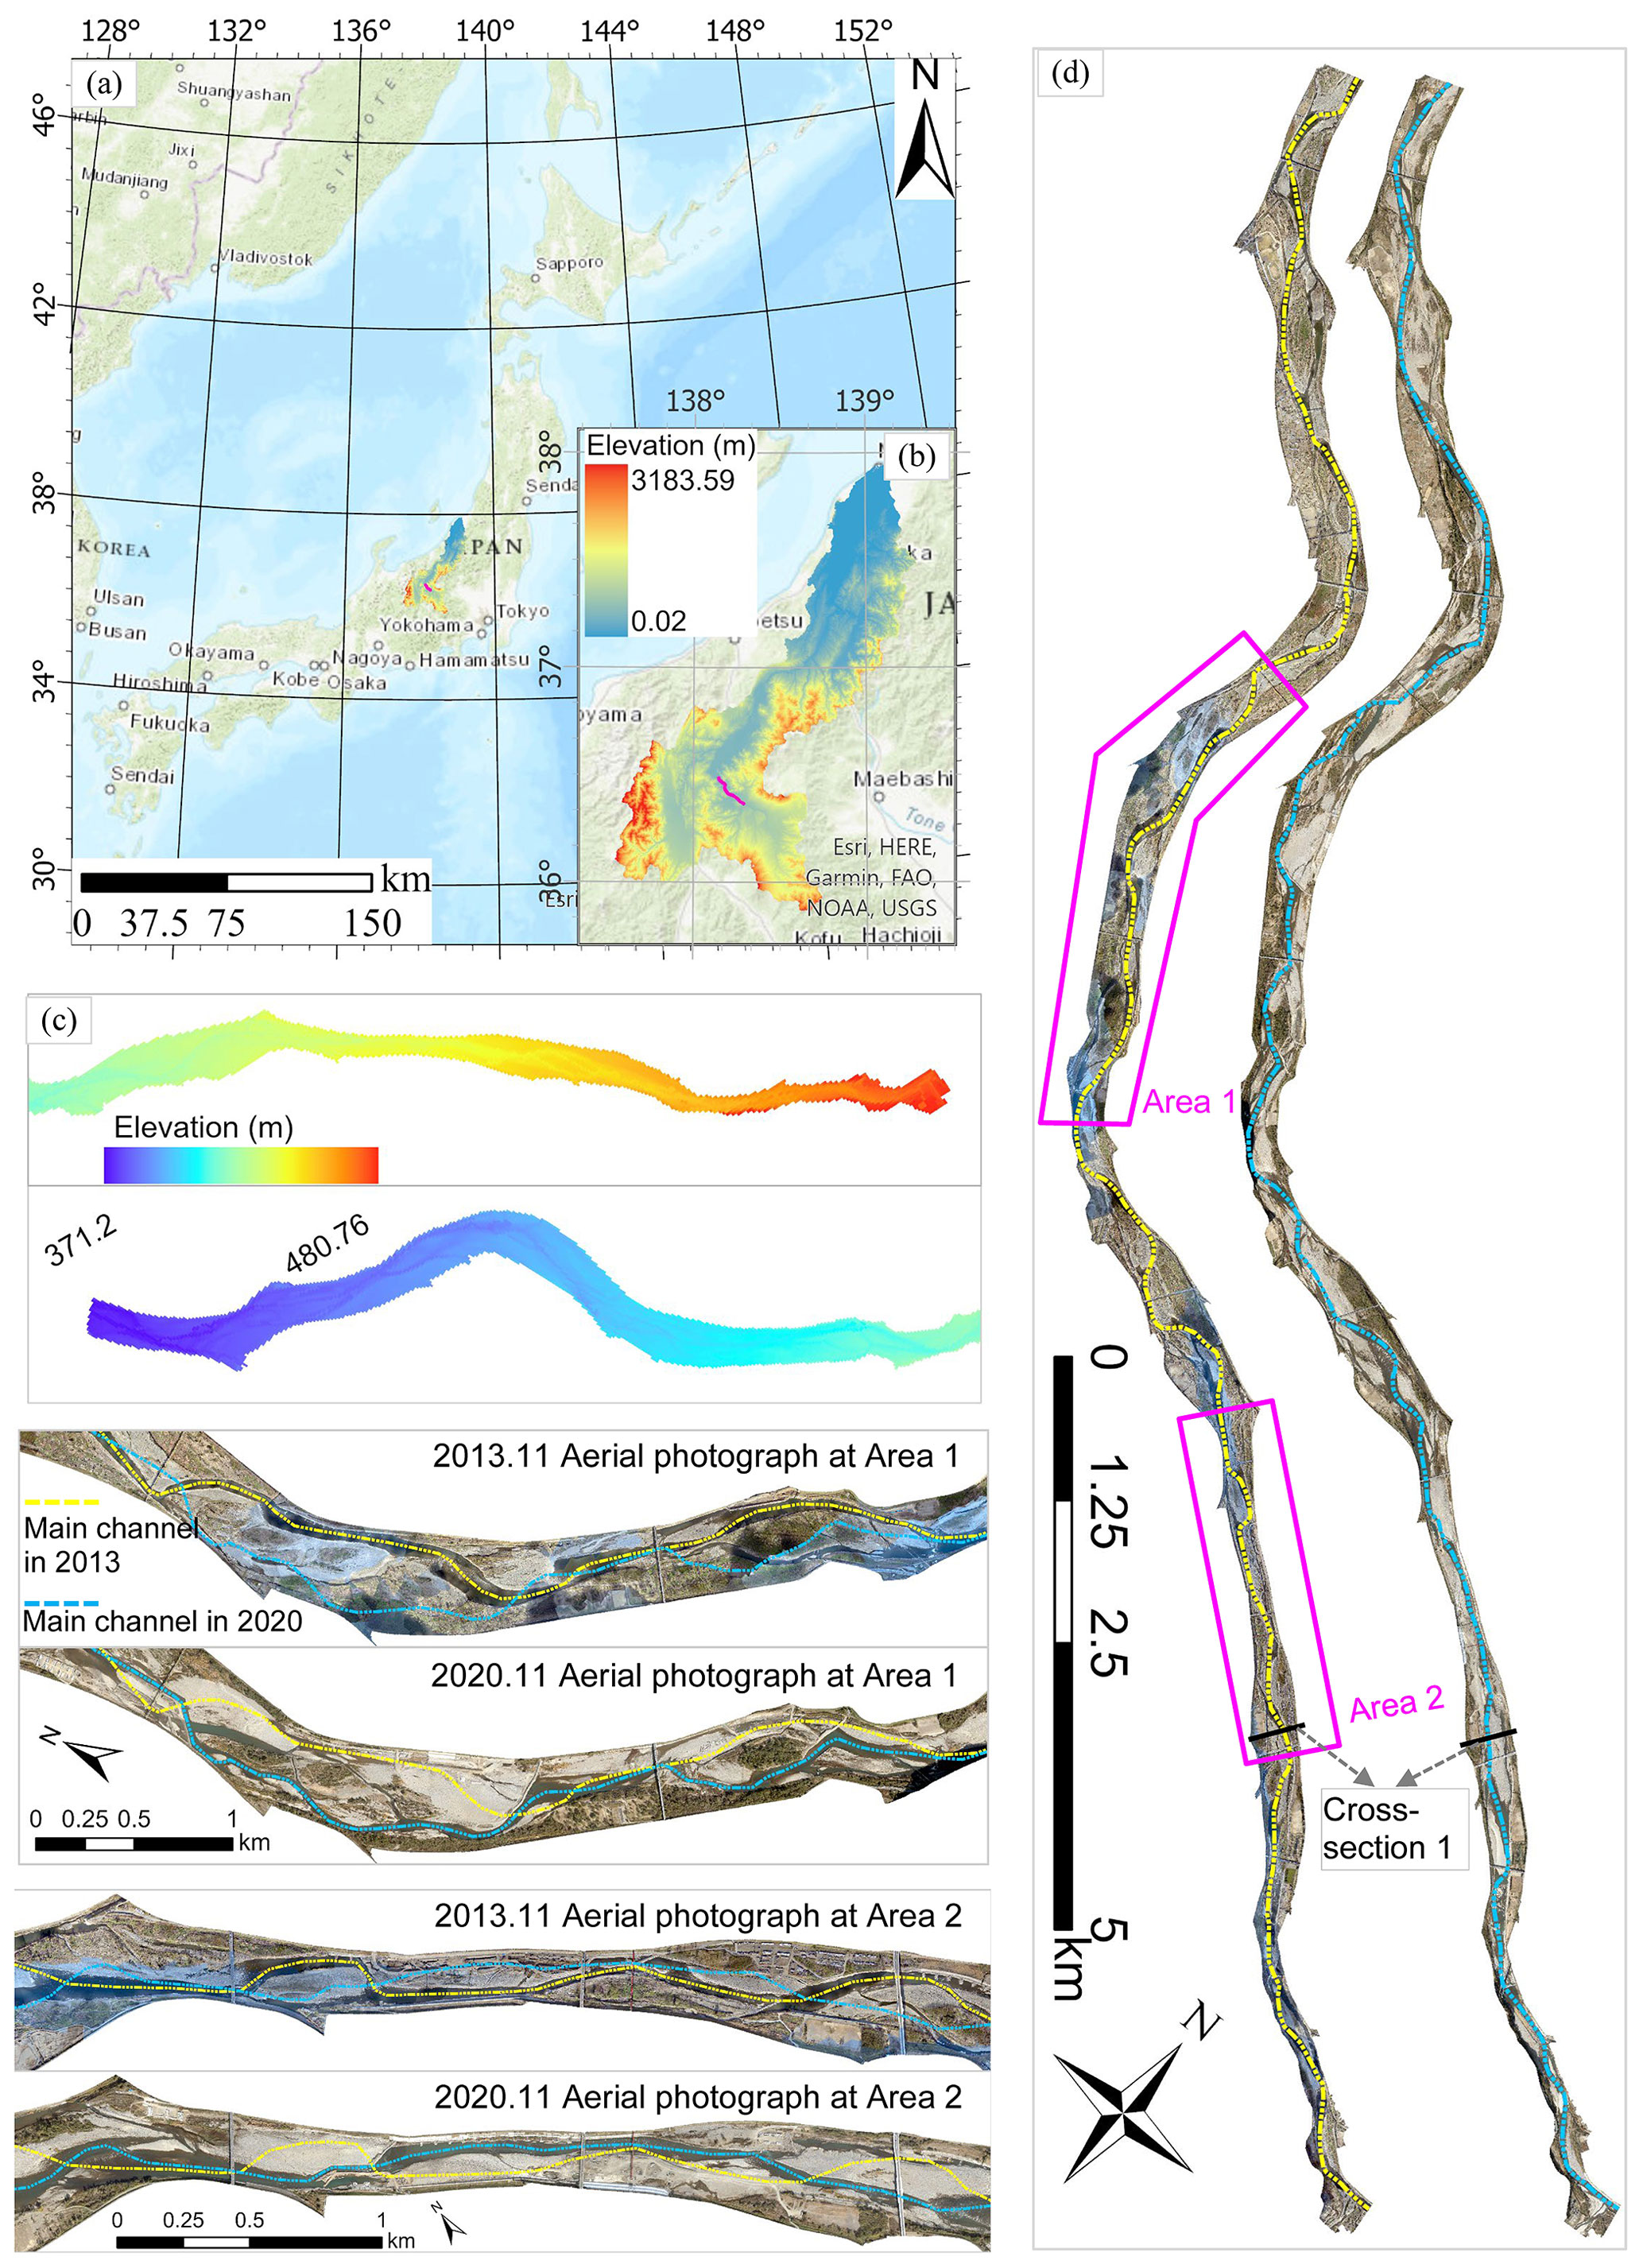
Figure 1An outline of the study area. (a) and (b) show the location of the target site in Japan ((a) Esri, HERE, Garmin, FAO, NOAA, USGS|Powered by Esri and Copyright of (b) © the watershed (Digital Elevation Model from the Geospatial Information Authority of Japan), respectively); (c) shows the morphology (DEM from the GSI) of the target site; and (d) shows orthophotos from 2013 and 2020 (Copyright © Ministry of Land, Infrastructure, Transport and Tourism (MLIT) in Japan), respectively.
2.2 Data source
Considering the application of readily available high-frequency satellite imagery images for grasping riparian vegetation dynamics, a time series of Sentinel-2 imagery from 2015 to 2024 was collected. Topographic and hydrological data were additionally obtained to evaluate the dynamics of hydrology and channel lateral morphology.
2.2.1 Sentinel-2 images
For the study, we collected Sentinel-2 satellite imagery (Red, Green, Blue, and Near-Infrared (NIR) bands) at a spatial resolution of 10 m. Given that the minimum and average channel widths at the study reach are approximately 190 and 380 m, respectively, a spatial resolution of 10 m was sufficient to effectively distinguish between vegetation zones, bare gravel bars, and water surfaces. In total, 200 Sentinel-2 images were downloaded from Copernicus and processed to compute the NDVI. Imagery was selected based on cloud-free conditions to ensure reliable observation of spatiotemporal vegetation and channel dynamics over the period 2015–2024. Figure 2 presents Sentinel-2 imagery (2016–2024) for representative Area 1 in Fig. 1. Moderate and pronounced vegetation mortality and channel shifts are evident in the 2018 and 2020 images (highlighted by red circles in Fig. 2), corresponding to the second-largest and largest flood events during the study period, respectively.
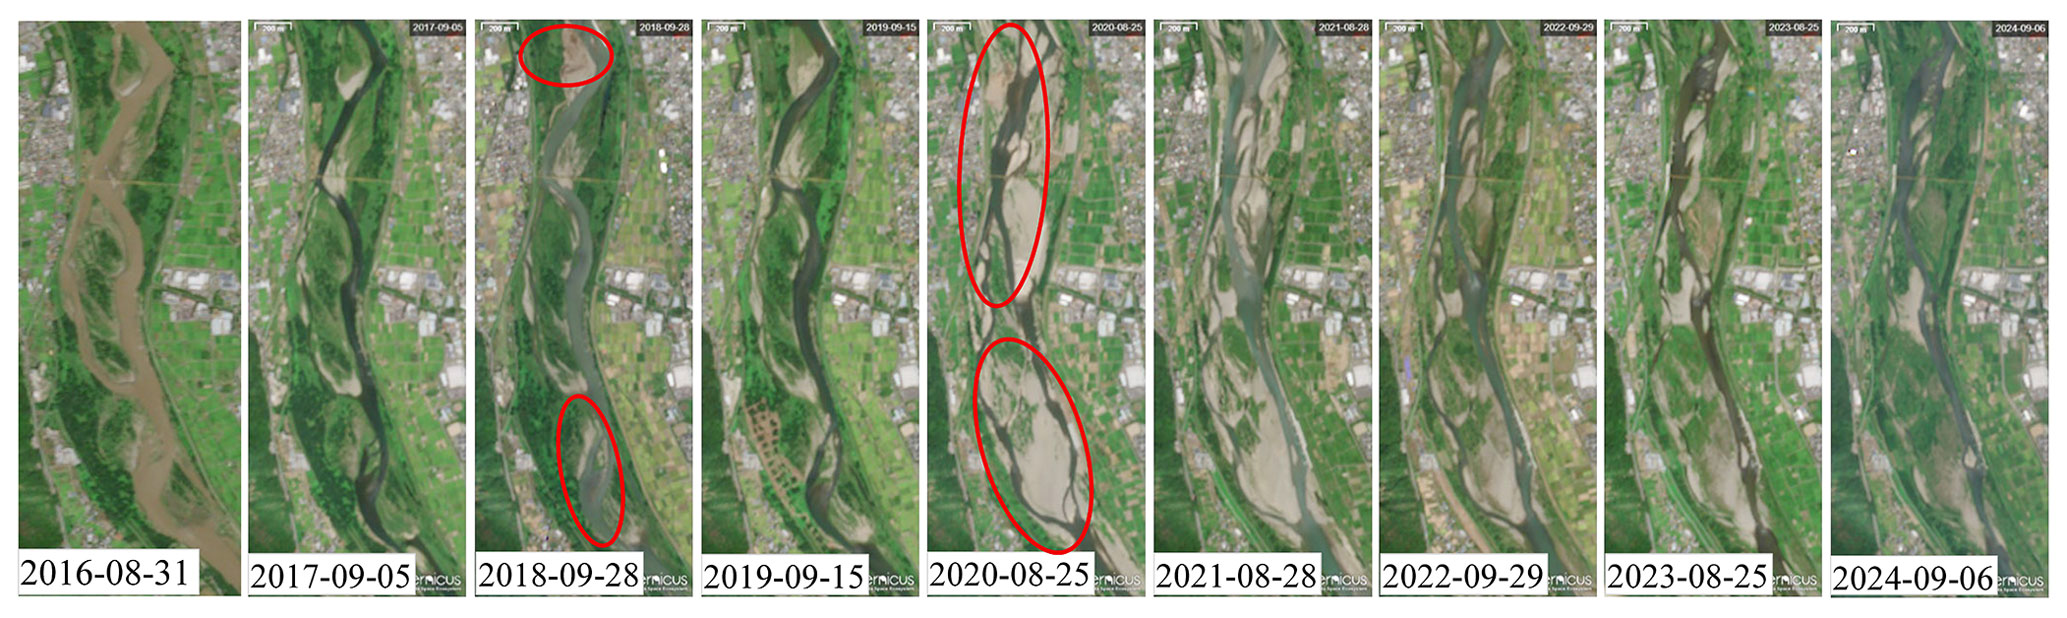
Figure 2Sentinel-2 imagery from 2016 to 2024 at representative Area 1 (accessed via Copernicus Data Space Ecosystem).
2.2.2 Hydrological data
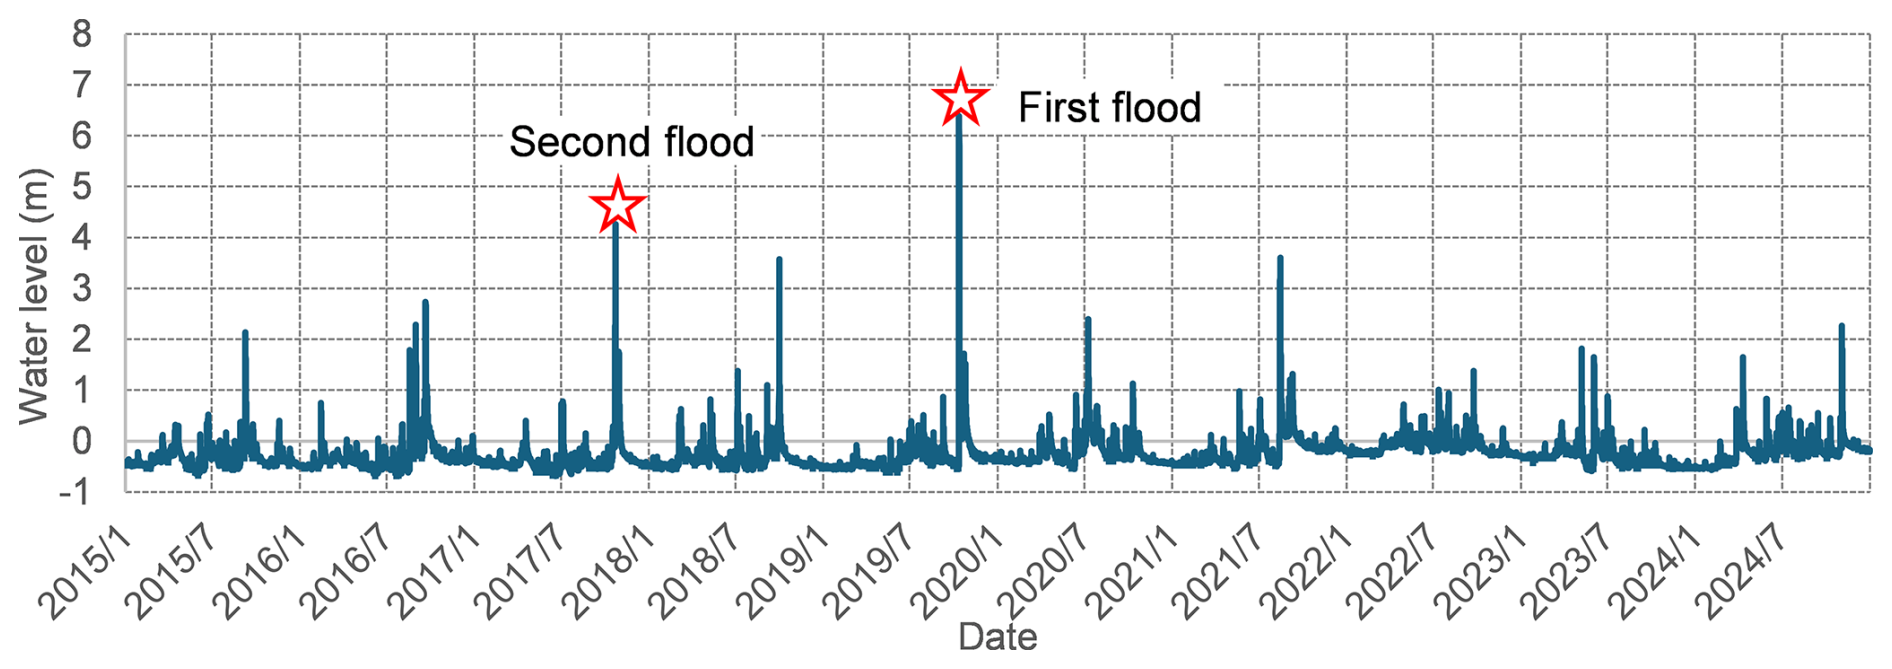
Hydrological records, specifically hourly water level (Fig. 3) measurements during the study period, were obtained from the Water Information System maintained by Ministry of Land, Infrastructure, Transport and Tourism (MLIT), Japan. Data was acquired from the Kuiseke gauging station, located near the center of the study reach. These water level records allowed for the identification of flood timing and magnitude throughout the study period, thus providing critical inputs for investigating the relationship between flow disturbances and vegetation dynamics. During the 10-year study period, four relatively high-magnitude flood events were identified, ranked by severity as October 2019, October 2017, August 2021, and October 2018.
2.2.3 Topography data and vegetation height
Topographic information for areas above the water's surface was obtained from a laser profile (LP) survey, which provided the digital elevation model (DEM) and the digital surface model (DSM), with a resolution of 0.5 m. Since the LP sensor does not penetrate water, bathymetric data for water submerged areas were derived from cross-sectional surveys conducted at 500 m intervals. LP surveys were conducted in October 2013, December 2019, and November 2020, while cross-sectional surveys were performed in 2013, 2017 and 2019. These datasets revealed dynamic changes in lateral channel morphology (Fig. 4) and shifts in the main channel from 2013 to 2019 (Fig. 1d). Airborne Lidar Bathymetry (ALB) data surveyed during early December 2024 were also acquired, covering both submerged and non-submerged topographic regions. All the topographic datasets utilized in this study were provided by the Chikuma River Office of the MLIT, Japan, and are considered reliable and accurate for the purposes of this research.
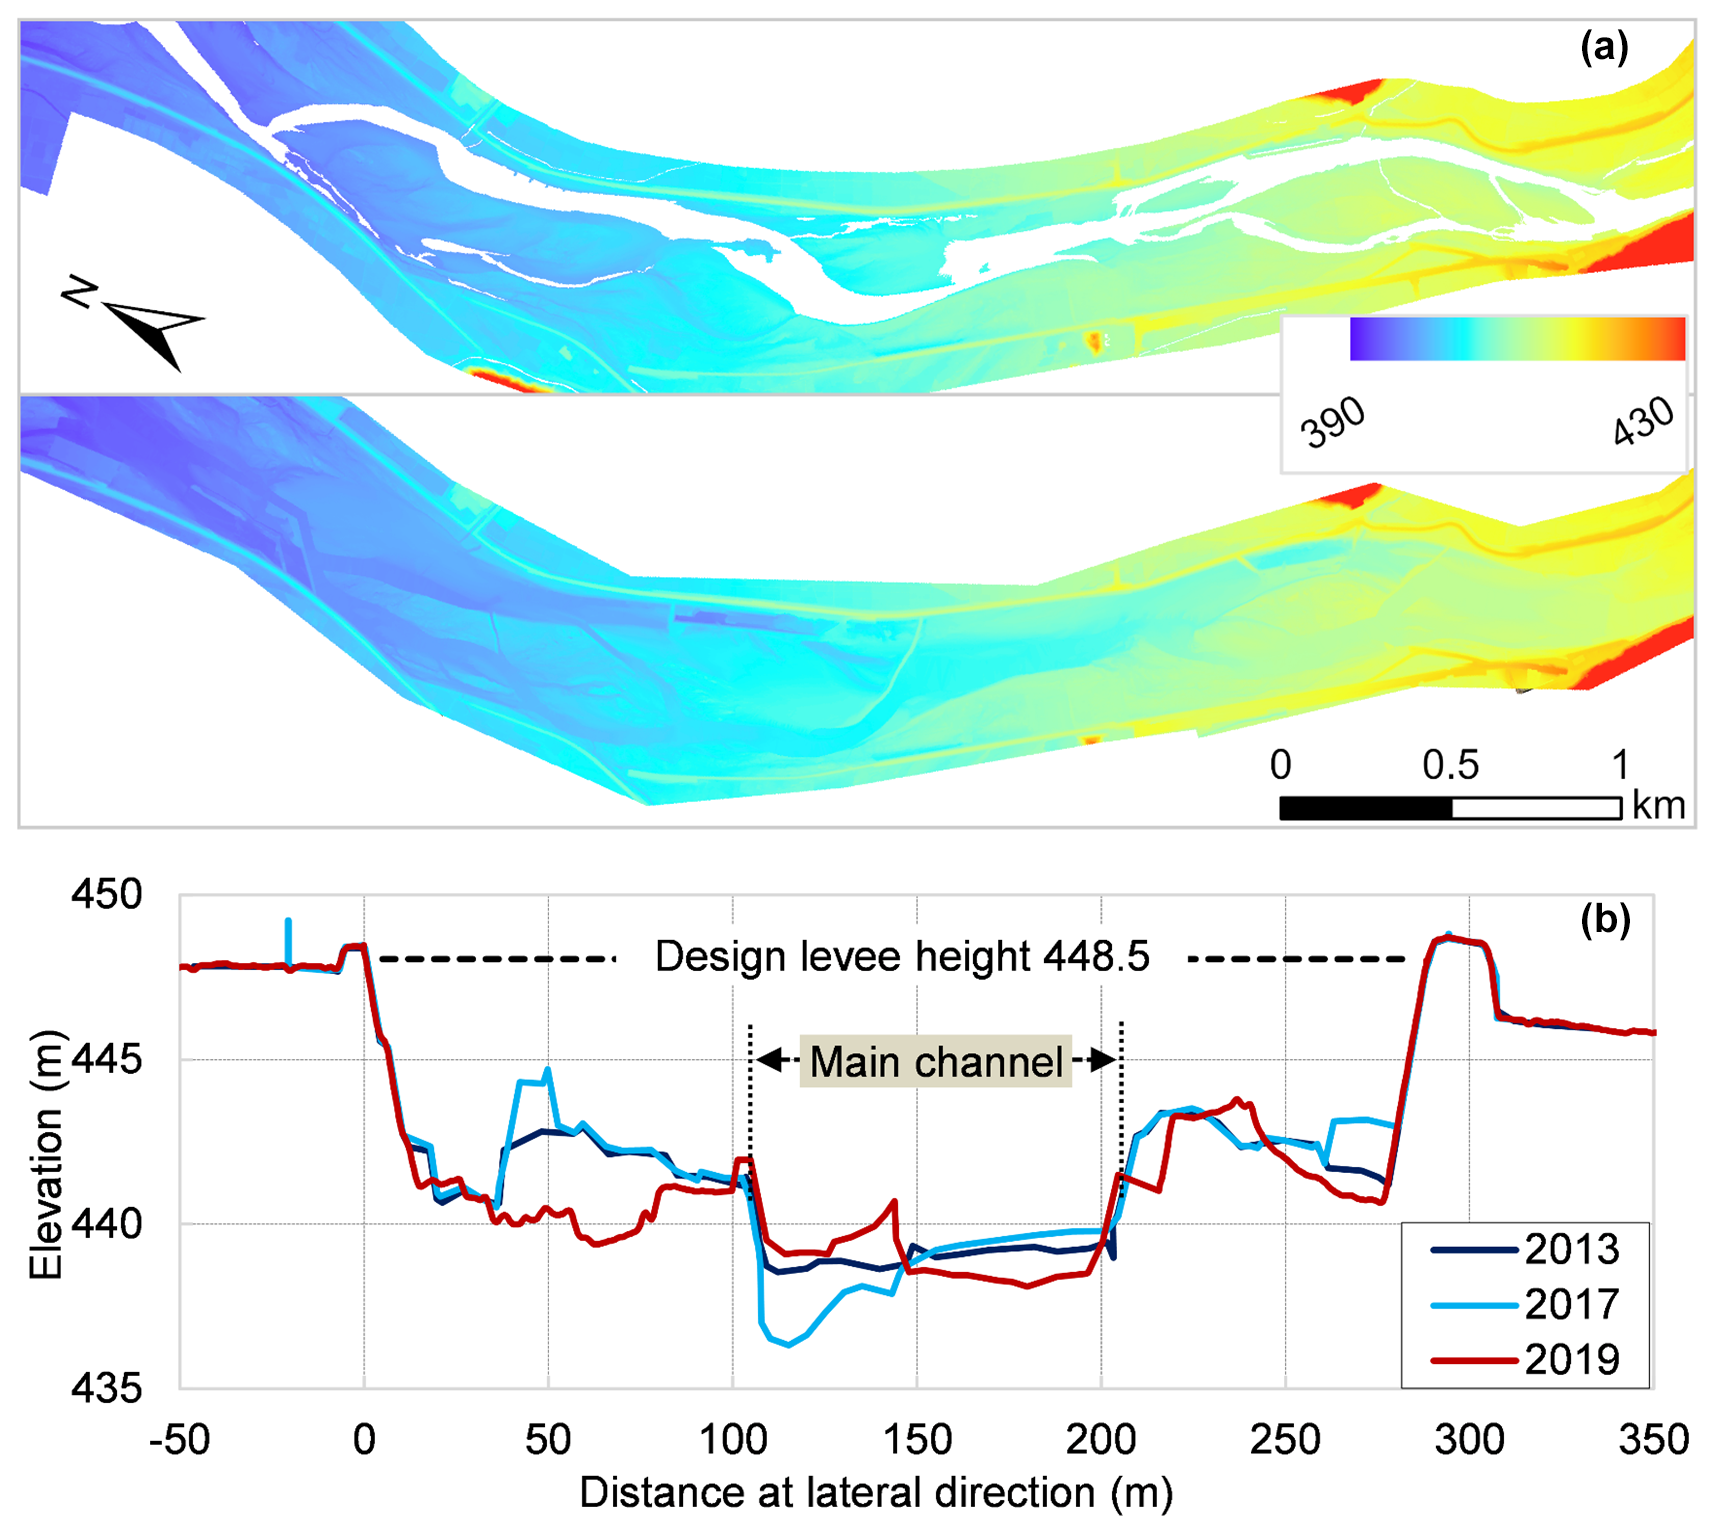
Figure 4LP survey data at representative Area 1 (a) and one cross-sectional morphology at Cross-section 1 (b).
2.3 The methodology for data analysis
2.3.1 The greenness ratio calculation based on NDVI data
NDVI values for each Sentinel-2 image were generated in ArcGIS Pro using Eq. (1). In previous studies, land cover has commonly been classified into three categories using NDVI thresholds: water (NDVI < 0), bare bars or sparse vegetation (NDVI = 0.0–0.2), and active vegetation (NDVI > 0.2) (Tucker, 1979; Drori et al., 2020). However, in riparian zones, NDVI values can drop below 0.2 during late autumn and winter due to seasonal senescence. As a result, we categorized areas with a NDVI ≤ 0 as water, a NDVI between 0 and 0.2 as bare bars or dormant (non-photosynthesizing) vegetation, and a NDVI > 0.2 as active photosynthesizing vegetation, which we refer to as “greenness” (Tucker, 1979). We specifically focused on NDVI > 0.2, vegetation greenness, for analyzing the interaction between vegetation dynamics, flood magnitude, and phenological characteristics, due to the following points. First, major floods at our study site typically occur during September or October, by which time vegetation has generally recovered from seasonal dormancy and is actively photosynthesizing (NDVI > 0.2). During the floods period, vegetation cover is most fully developed and NDVI values above 0.2 reliably correspond to active green vegetation, making NDVI > 0.2 (Drori et al., 2020) a suitable threshold for estimating vegetation cover. Second, phenological activity, inherently reflecting the growth and expansion of active vegetation, corresponding to NDVI values above 0.2. The greenness ratio is defined as the proportion of area with NDVI > 0.2 relative to total area (Eq. 2). To quantify the temporal change of NDVI and the greenness ratio during the study period along the channel transect, we introduced the parameter NDVIvary and Greenvary, calculated using Eq. (3):
where, N0.2 and Ntotal refer to the number of pixels within Sentinel-2 imagery where NDVI > 0.2 and the total number of pixels within the target area, respectively. and represent the average annual maximum NDVI values at each 0.5 m relative elevation zone (detailed as described in Sect. 2.3.2) corresponding to y and y−1 years, respectively. and represent the average annual maximum greenness ratio at each 0.5m relative elevation zone corresponding to y and y−1 years, respectively. n is the total year during the study period. The term “Abs” represents the absolute value of the NDVI difference between two years.
2.3.2 Relative elevation above water level
In this study, we focused on riparian vegetation located between levee banks within the river channel (Fig. 5). The previous research (Zhu et al., 2023) suggests that relative elevation, defined as the height of floodplain landforms above the water's edge, has a stronger influence on the vegetation distribution within levee banks, relative elevation is proposed as a useful index for characterizing lateral continuity and for examining the relationship between NDVI patterns and topographic characteristics within the river corridor. We specifically define relative elevation as the height above the 95th water level, indicating that the water's surface is at or above this level approximately 95 d yr−1. Areas below this water level are inundated more frequently, whereas areas above it undergo alternating wet and dry conditions that are more conducive to vegetation establishment and persistence. At our study site, riparian vegetation is predominantly distributed above the boundary of the 95th flow inundation zone.
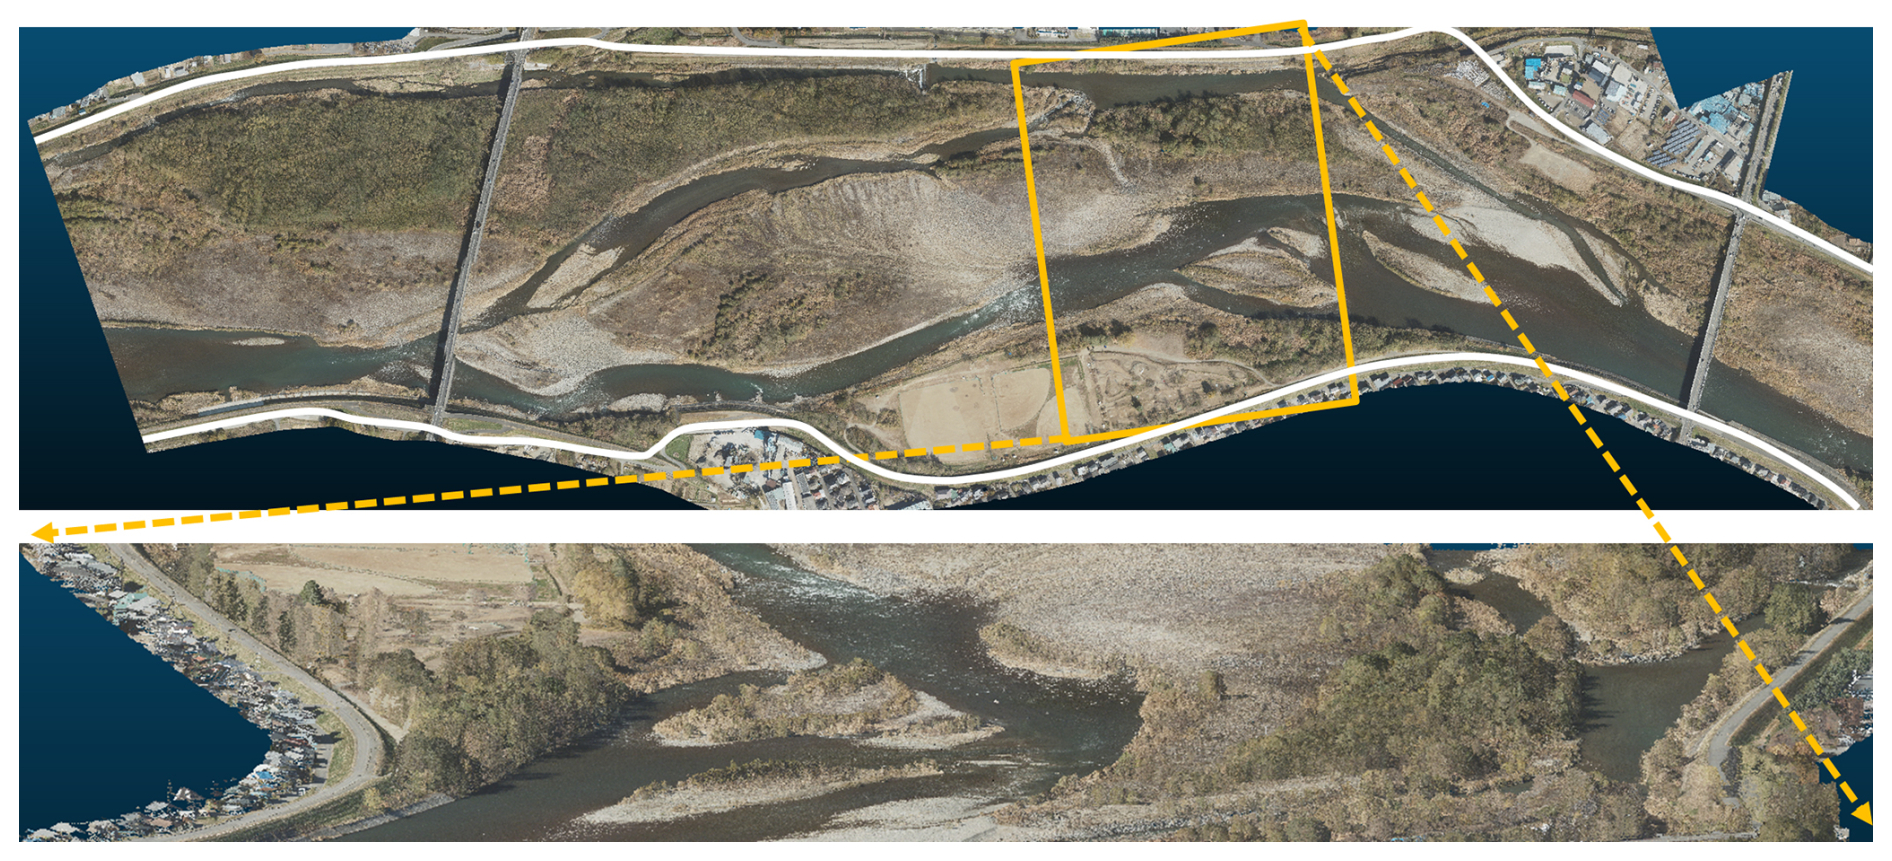
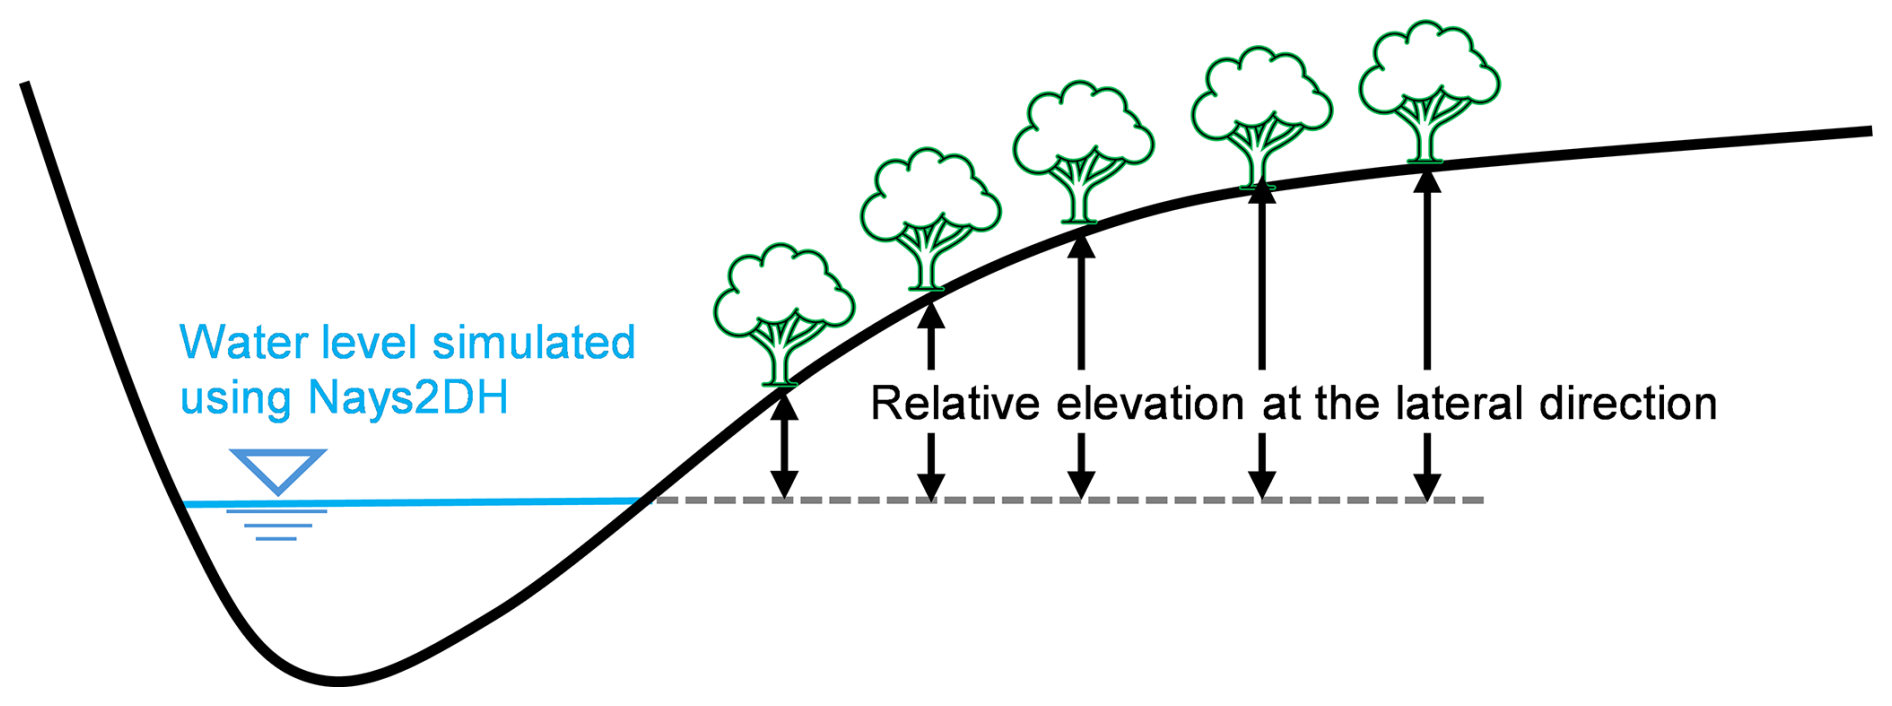
Figure 5A riparian vegetation lateral distribution (2024 ALB survey results, Copyright © MLIT in Japan).
Riparian vegetation lateral distribution is often considered to be reset following major morphological change induced by large flood events (Death et al., 2015). The morphology change was identified after two significant floods occurred in 2017 and 2019 (Fig. 3), prompting us to divide the study period into three intervals to better represent the evolving physical environment: Period 1 (2015–2017), Period 2 (2018–2019), and Period 3 (2020–2024).
To calculate relative elevations above water level for each period, we used a combination of topographic datasets. We specifically employed 2013 laser profiling (LP) and 2013 cross-sectional survey data for Period 1, 2013 LP and 2017 cross-sectional data for Period 2, and 2024 airborne lidar bathymetry (ALB) data for Period 3. Since floodplain morphology was assumed to largely remain unchanged, with most morphological adjustments occurring within the main channel (Fig. 4), the 2013 LP dataset was reused for both Periods 1 and 2. The 95th water level, which varies in response to morphological dynamics, was calculated for each analysis period using the two-dimensional hydraulic simulation model Nays2DH (Shimizu et al., 2020). Relative elevation was then derived by subtracting the simulated water level from topographic elevation (Fig. 6). For detailed analyses, resulting relative elevation values were classified into two schemes: one with 50 classes at 0.1 m intervals, and another with 10 classes at 0.5 m intervals, covering the range from 0 to 5 m.
2.3.3 Seasonal dynamics of NDVI
In-channel riparian vegetation directly modifies hydraulic roughness and thus affects flow conveyance. Therefore, seasonal increases in vegetation greenness and biomass (as indicated by NDVI) can be interpreted as periods of potentially elevated flood risk, particularly when they coincide with the timing of major flood events. In this study, we characterize the seasonal variability of NDVI as a proxy for seasonal roughness dynamics and discuss its implications for flood-risk management. Using time-series NDVI derived from Sentinel-2 imagery, we computed monthly mean NDVI for each year over a 10-year period. This aggregation reduces the influence of short-term fluctuations in water level and the noise associated with individual cloud-free scenes, allowing a clearer identification of recurring seasonal patterns that are relevant for operational planning (e.g., the timing of vegetation cutting prior to the typhoon season). To better understand the environmental drivers influencing these seasonal distribution patterns, we, additionally, collected and integrated temperature and precipitation data from the Ueda meteorological station into our analysis. Yearly averages of monthly mean temperature, monthly maximum temperature, and monthly accumulated precipitation were calculated for the period from 2015 to 2024.
3.1 Spatial-temporal greenness ratio from 2015 to 2024
The NDVI dynamics at representative Area 1 (Fig. 1) from 2016 to 2024 is shown as Fig. 7. The area with NDVI values <0.2 decreased slightly and sharply following the 2017 and 2019 flood events (highlighted by red circles in Fig. 7), respectively, indicating flood-induced vegetation removal. Because vegetation destruction is influenced by both flood magnitude and inundation duration, and the typhoon-driven flood in this study was relatively short (<50 h), we used the 10 h accumulated hourly water level (a rolling sum of hourly water level over a 10 h window) as an integrated metric representing these two components. Figure 8 presents 10 h accumulated water level alongside the greenness ratio at different relative elevations. Fluctuations in vegetation greenness were closely associated with both flood magnitude and relative elevation. The greenness ratio consistently declined following the occurrence of notable annual maximum floods, particularly those in 2017, 2018, 2019, and 2021. The severity of these floods, based on return periods, was as follows: 2019 (∼50-year), 2017 (∼10-year), 2021 (∼5-year), and 2018 (∼3-year). The observed reduction in greenness occurred across different lateral relative elevation ranges: 0–5 m (2019), 0–3 m (2017), 0–3 m (2021), and 0–2 m (2018). Although the lateral extent of greenness reduction during the 2021 and 2017 floods was similar, the magnitude of the reduction was greater in 2017. Overall, the magnitude of greenness declines mirrored flood severity: the most substantial reduction occurred during the 2019 flood, followed by the 2017 event, with smaller but still observable declines in 2021 and 2018, respectively.
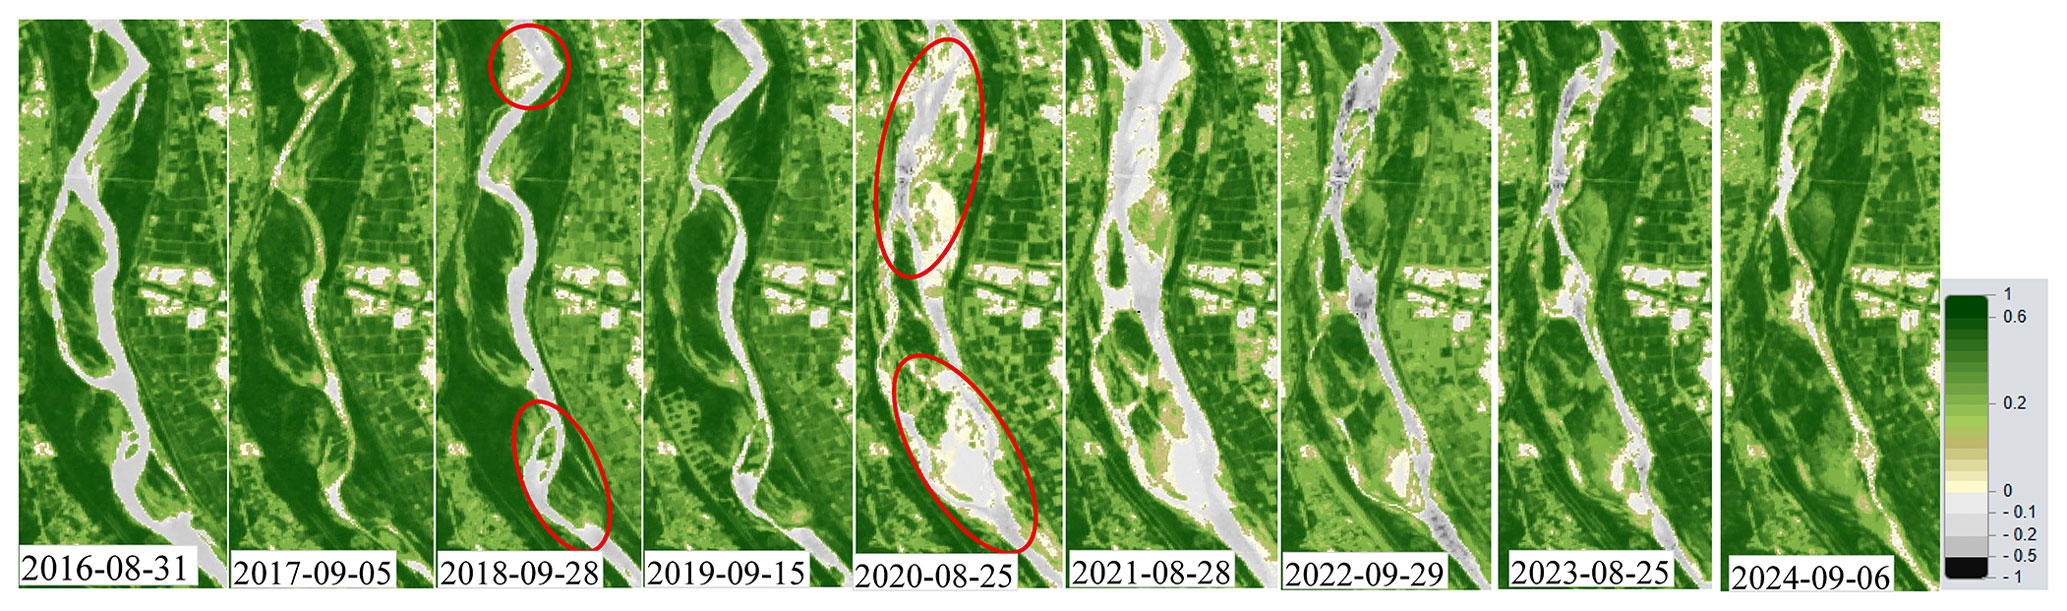
Figure 7NDVI from 2016 to 2024 at the representative Area 1 (accessed via Copernicus Data Space Ecosystem).
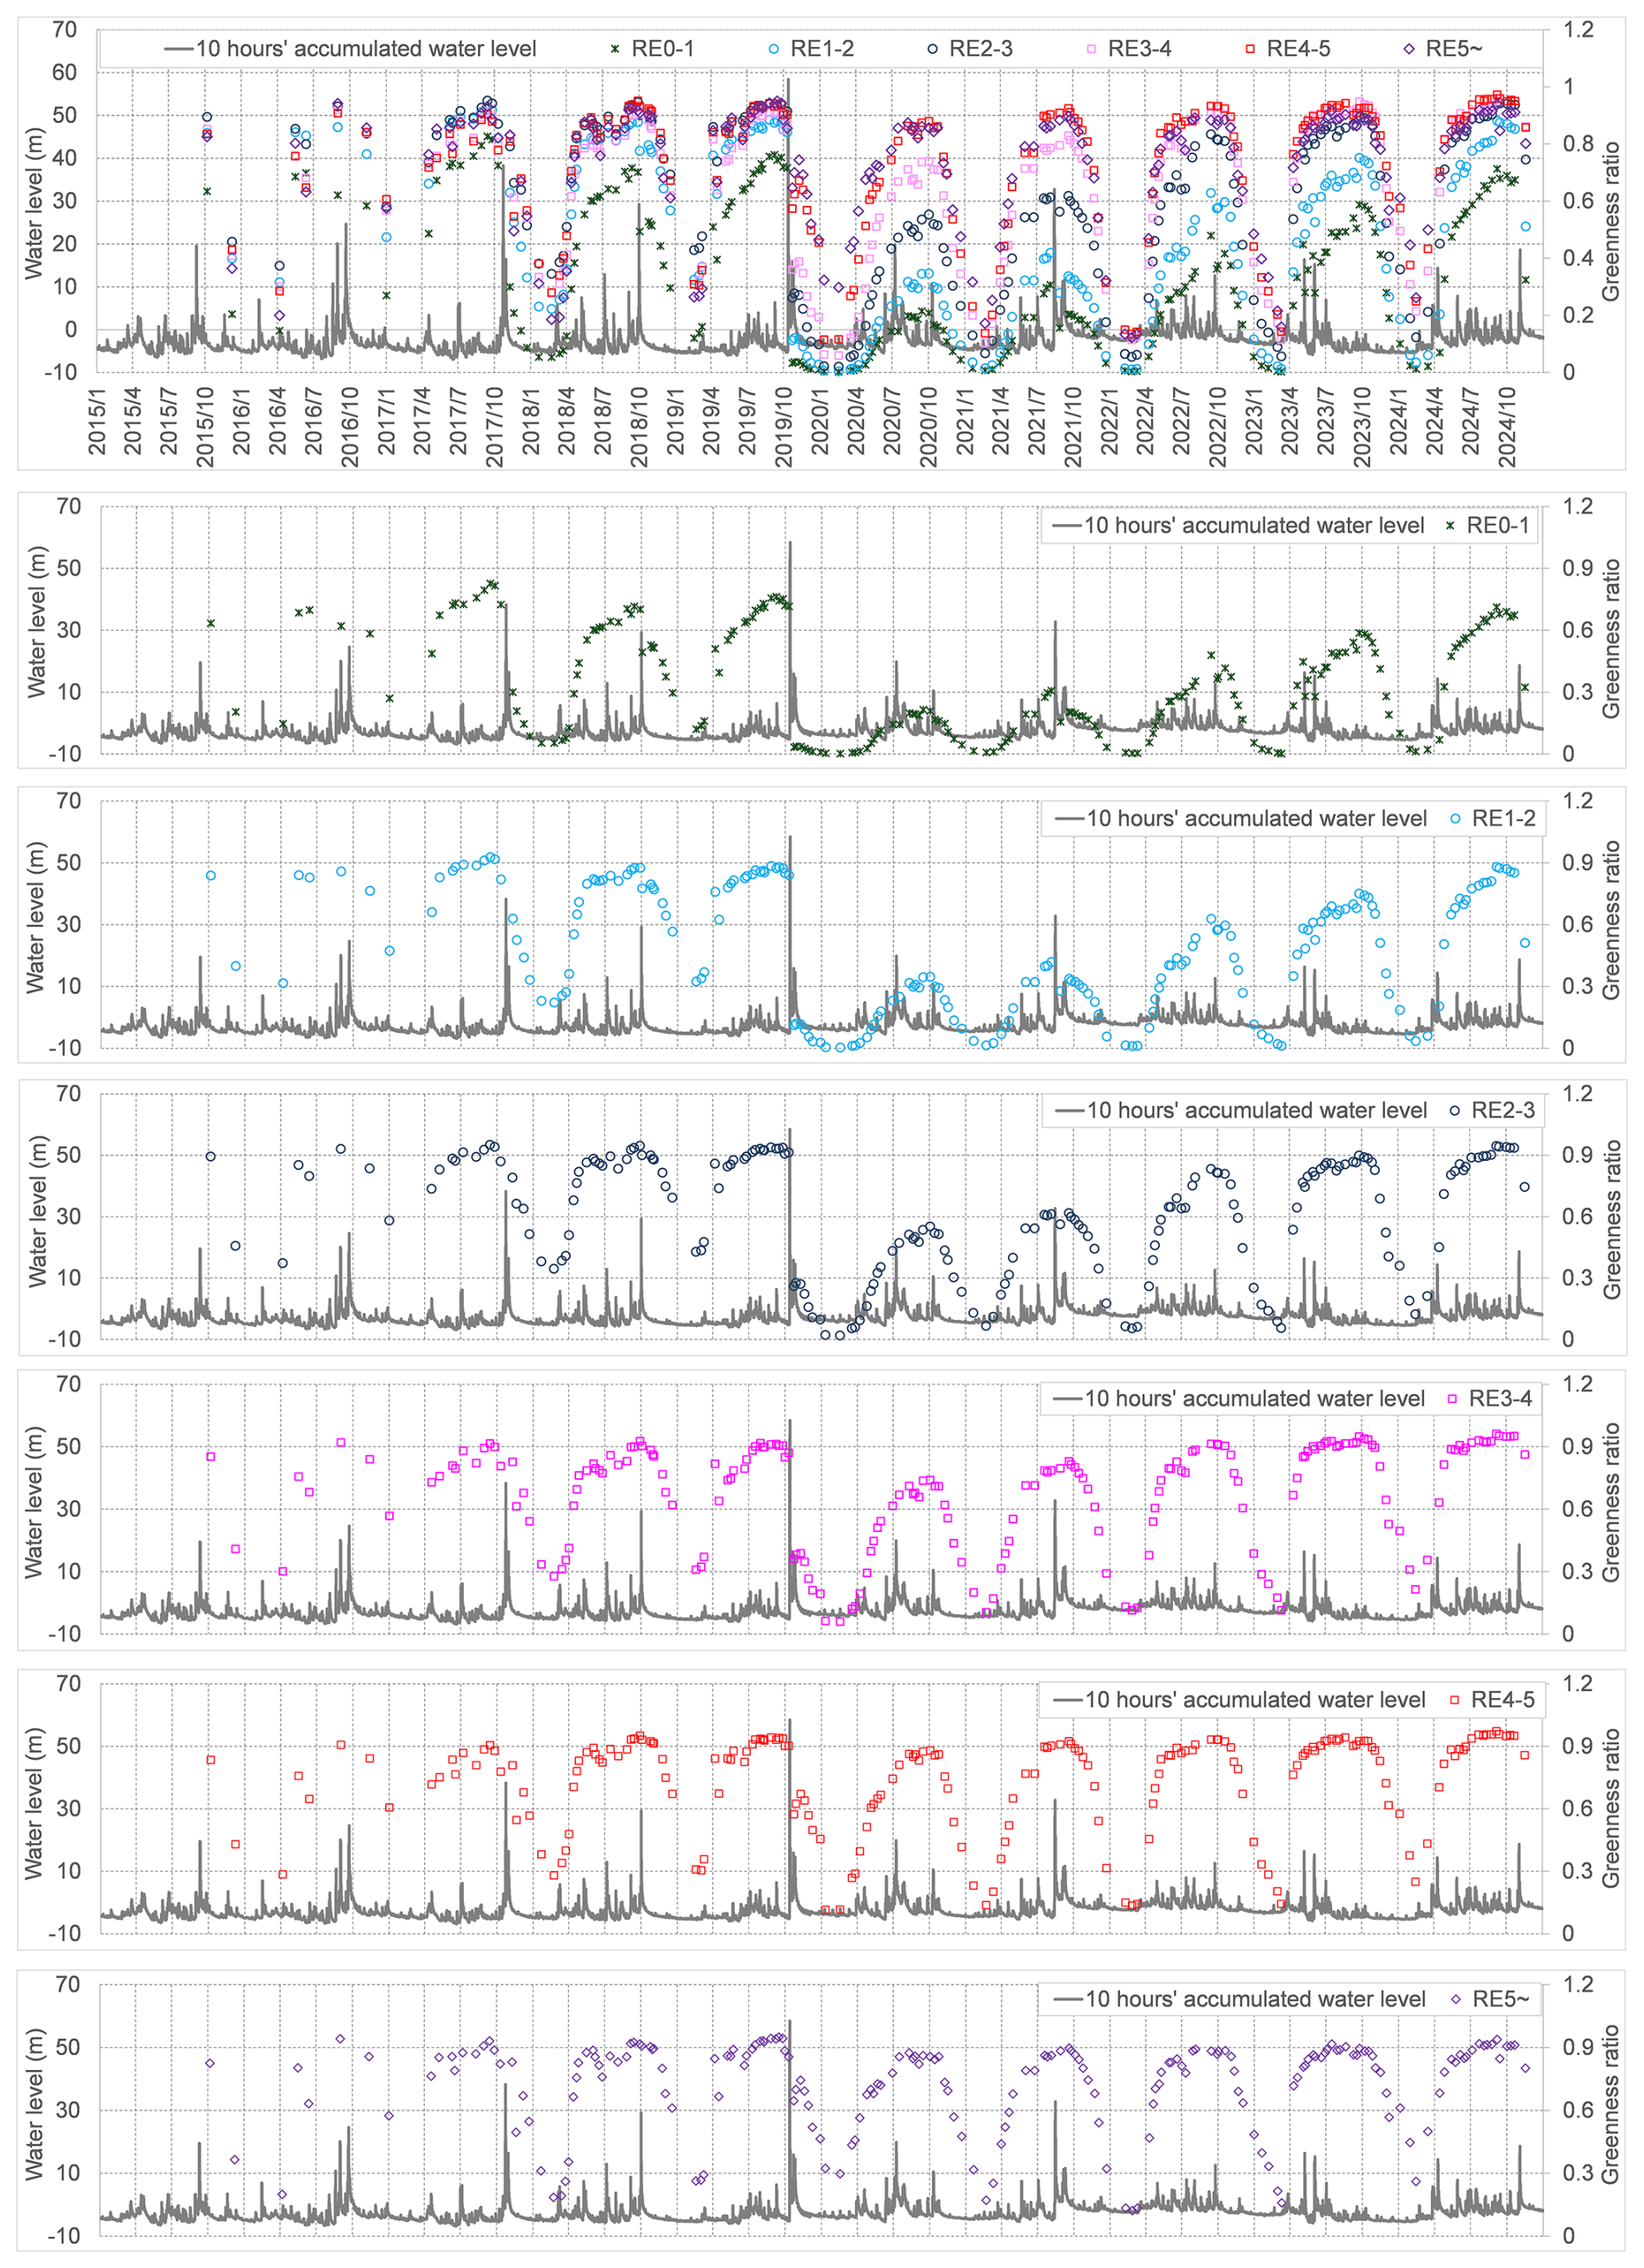
Figure 8Spatiotemporal vegetation greenness and hydro-morphological dynamics (RE0-1, RE1-2, RE2-3, RE3-4, RE4-5, and RE5∼ denote relative elevation (RE) classes of 0–1, 1–2, 2–3, 3–4, 4–5, and ≥5 m, respectively. “10-hour accumulated water level” refers to the water level accumulated over a 10-h period).
3.2 The annual maximum greenness ratio and NDVI along the channel-lateral transect
We further examined the temporal dynamics of riparian vegetation greenness over a nine-year period (2016–2024), excluding 2015 due to insufficient NDVI data. The analysis used the annual maximum NDVI for each relative-elevation band. NDVI at the study site consistently attains its annual maximum between July and October, coinciding with the main growing season. We therefore used the annual maximum greenness ratio as a proxy for peak vegetation cover (Pettorelli et al., 2005), as peak-season NDVI values indicate fully developed vegetation (NDVI > 0.2).
Figure 9 illustrates the lateral distribution of the greenness ratio, measured from the shoreline (relative elevation = 0 m) to the levee bank (above 5 m). A clear increasing trend in the greenness ratio was observed from the river's edge up to approximately 5 m in relative elevation. The relationship between greenness ratio and relative elevation was modelled using an empirical function (Eq. 4), with the fitted curves for each year shown in Fig. 9. The parameters L, h0 and k utilized in the model are summarized in Table 1. Among the parameters, h0 ,which indicates the relative elevation of the greenness ratio to be reached at 50 %, was found to vary with flood conditions from the preceding year.
G(h): Greenness ratio with a relationship to relative elevation (h); L: Maximum greenness ratio; h0: the relative elevation at which the greenness ratio equals 0.5 (50 %); k: Steepness parameter.
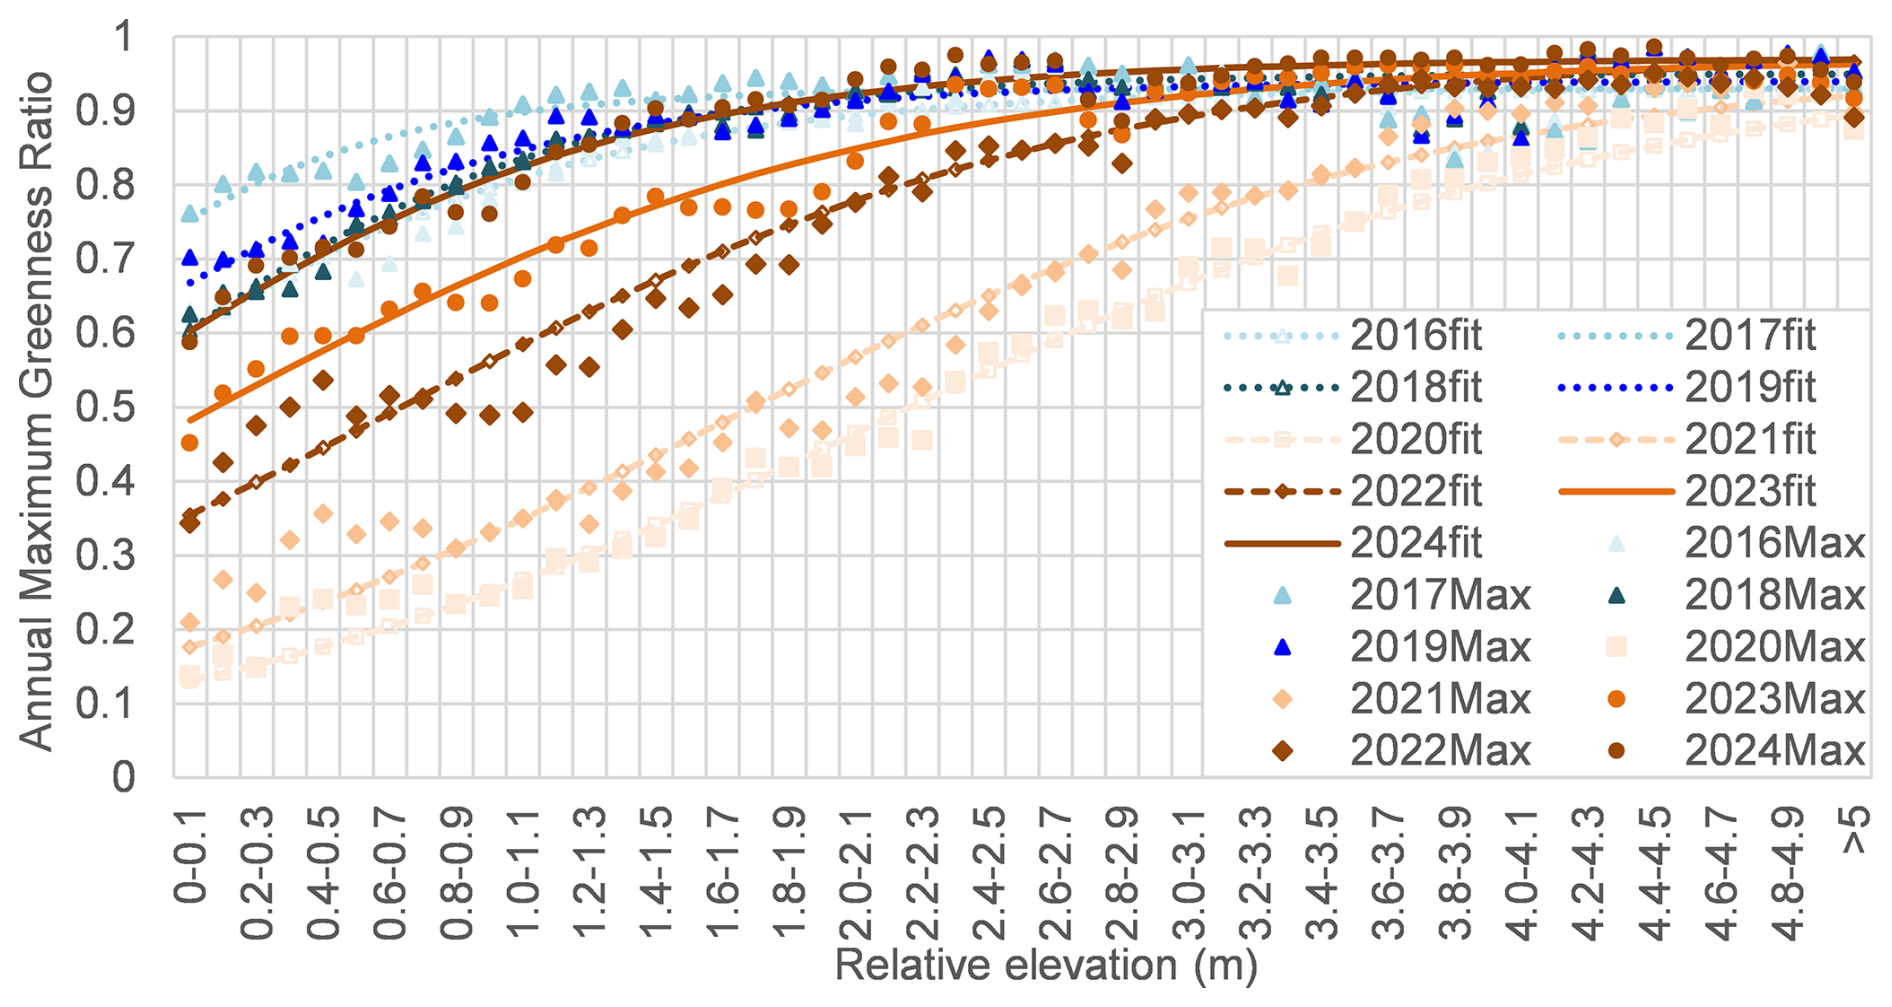
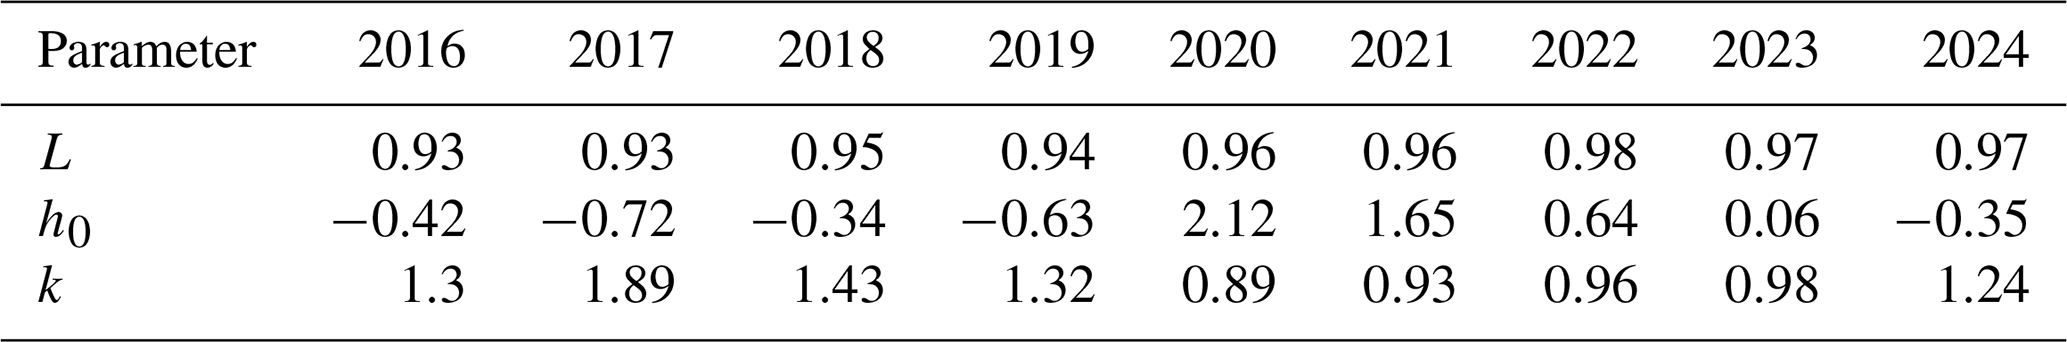
Figure 10 shows annual maximum NDVI along the transect at different relative elevations. Distinct differences in NDVI distribution patterns along transects were observed between the periods 2016–2019 and 2020–2024. During 2016–2019, NDVI values increased with relative elevation from 0 m up to approximately 3 m, and then decreased between 3 and 5 m. Prominent NDVI peaks were identified around the zone between 1.5 and 3.0 m. In contrast, during 2020–2024, NDVI exhibited a more gradual and consistent increase from 0 to 5 m, indicating a different spatial pattern of vegetation greenness ratio.
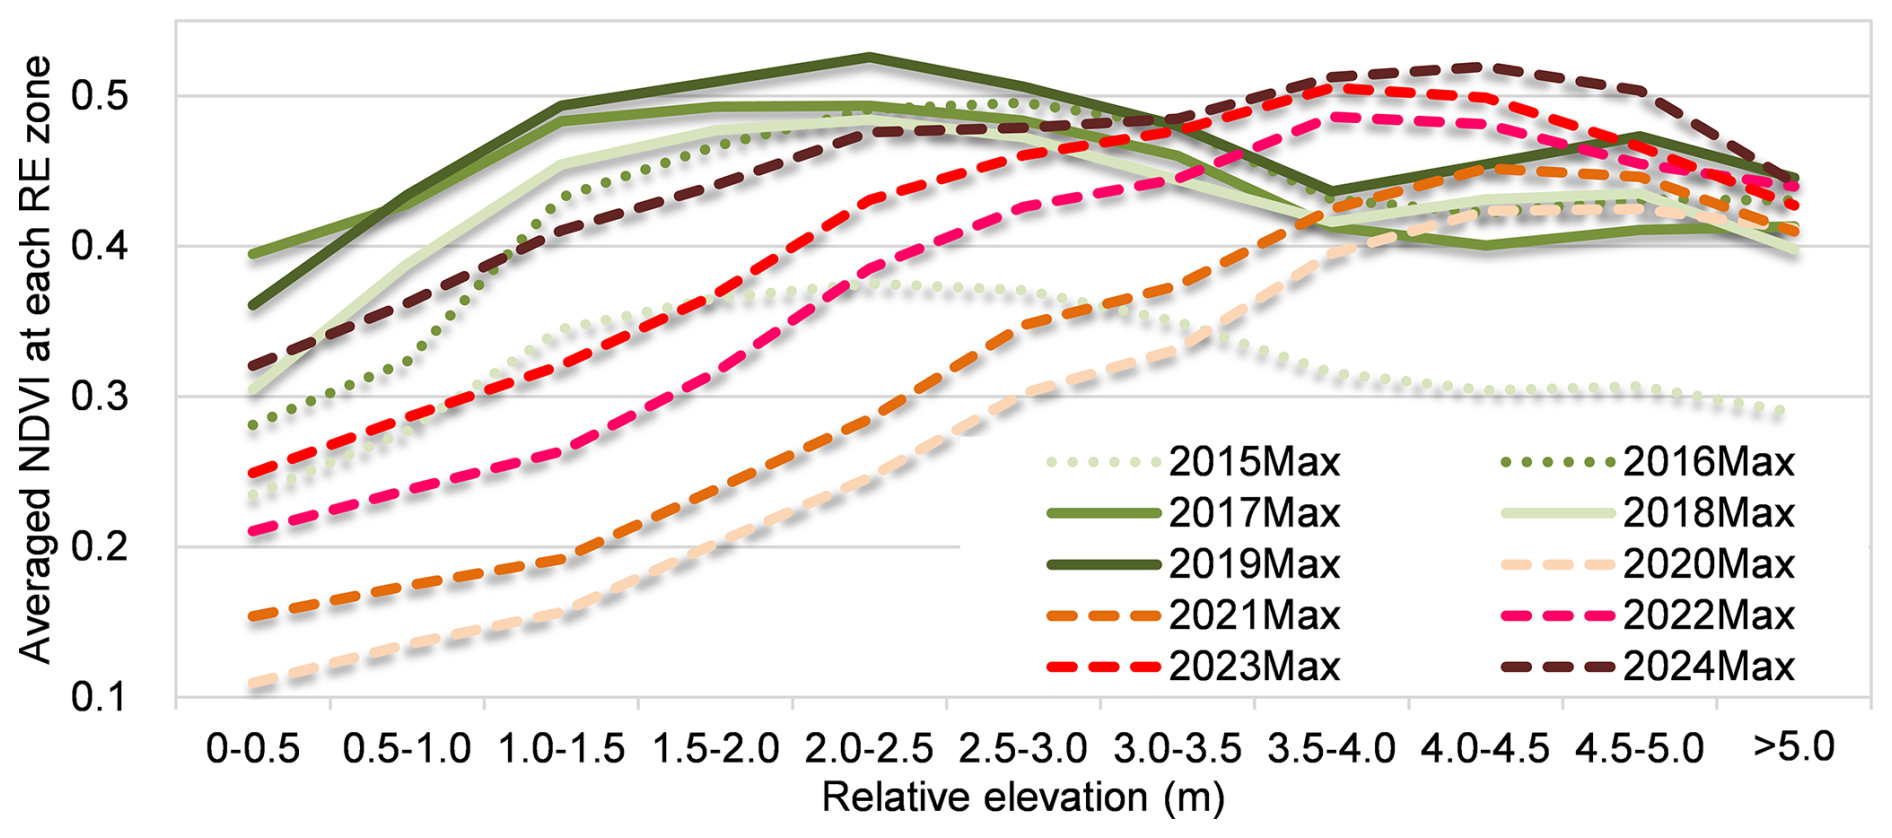
Figure 10Annual maximum NDVI averaged within each 0.5 m relative elevation zone along the transect.
3.3 Seasonal dynamics of riparian greenness ratio
We computed the monthly mean greenness ratio for the period January 2016–November 2024, using NDVI values extracted from approximately 200 Sentinel-2 images. Since only two images were available for 2015, that year was excluded from the analysis. From March to June, the greenness ratio steadily increased with rising temperatures, and precipitation created favorable conditions for photosynthesis. However, the upward trend slowed during July and August, a trend that may have been caused by elevated temperatures and high cumulative precipitation that stimulated respiratory activity more than photosynthesis (Fig. 11). Following the mid-summer peak, the greenness ratio increased again and reached its annual maximum in September, suggesting a late-season growth pulse. This pattern is consistent with findings that late-summer precipitation can enhance late-season growth dynamics in humid subtropical regions (Wang et al., 2025). After October, the greenness ratio declined, coinciding with lower temperatures and reduced precipitation, which likely diminished photosynthetic activity.
Figure 11The relationship between seasonal dynamics of greenness ratio and temperature and precipitation.
4.1 Spatiotemporal Sentinel-2 NDVI response to flood disturbance and lateral elevation change
4.1.1 Sentinel-2 NDVI response to varying flood magnitudes
Our results provide quantitative evidence supporting the biogeomorphic succession framework by demonstrating how riparian vegetation responses diverge across flood pulses of different magnitudes. Figure 12 illustrates the annual maximum greenness ratio and the parameter h0 (the relative elevation where the greenness ratio equals 0.5) against annual maximum water levels. Notably, sharp declines in maximum NDVI during 2018 and 2020 reflect substantial vegetation removal caused by the high-magnitude floods of 2017 and 2019, respectively. A sharp decline in h0 was also observed during 2020, indicating that riparian vegetation was likely removed at a lower relative elevation, as a result of the mega flood in 2019. High-magnitude events (specifically those with return periods of more than five years) tend to cause widespread scouring and drastic channel reshaping (Fig. 4), effectively resetting the riparian distribution and structure (Death et al., 2015). The post-2019 increase in the logistic parameter h0, which shifted from negative values to over 2.0 m, quantifies a significant recovery of vegetation in lower elevation zones. This “clearing the template” effect aligns with previous research (Death et al., 2015), where extreme external forces during mega-floods overcome root stabilization and resets the successional cycle. Conversely, at higher elevations (3.5–4.5 m), NDVI values exceeded pre-flood levels (Fig. 10). This suggests that the mega-flood likely increased moisture availability (and potentially nutrient inputs) on high-elevation surfaces that are typically disconnected during ordinary flows and moderate floods, thereby promoting vegetation expansion in previously water-limited areas.
In contrast, while vegetation reduction occurred between 0–3 m during the 2018 and 2021 events (Fig. 8), the annual maximum greenness ratio increased and h0 decreased (Fig. 12) in the subsequent years (2019 and 2022). This pattern suggests rapid post-flood regrowth following moderate floods. Under such conditions, pioneer species can rapidly colonize newly exposed substrates and bare patches created by the flood pulse, consistent with stochastic frameworks linking flow variability to riparian vegetation recruitment and spatial distribution (Camporeale and Ridolfi, 2006). This response illustrates a resilient, localized successional trajectory compared to the more transformative impacts of mega-floods.
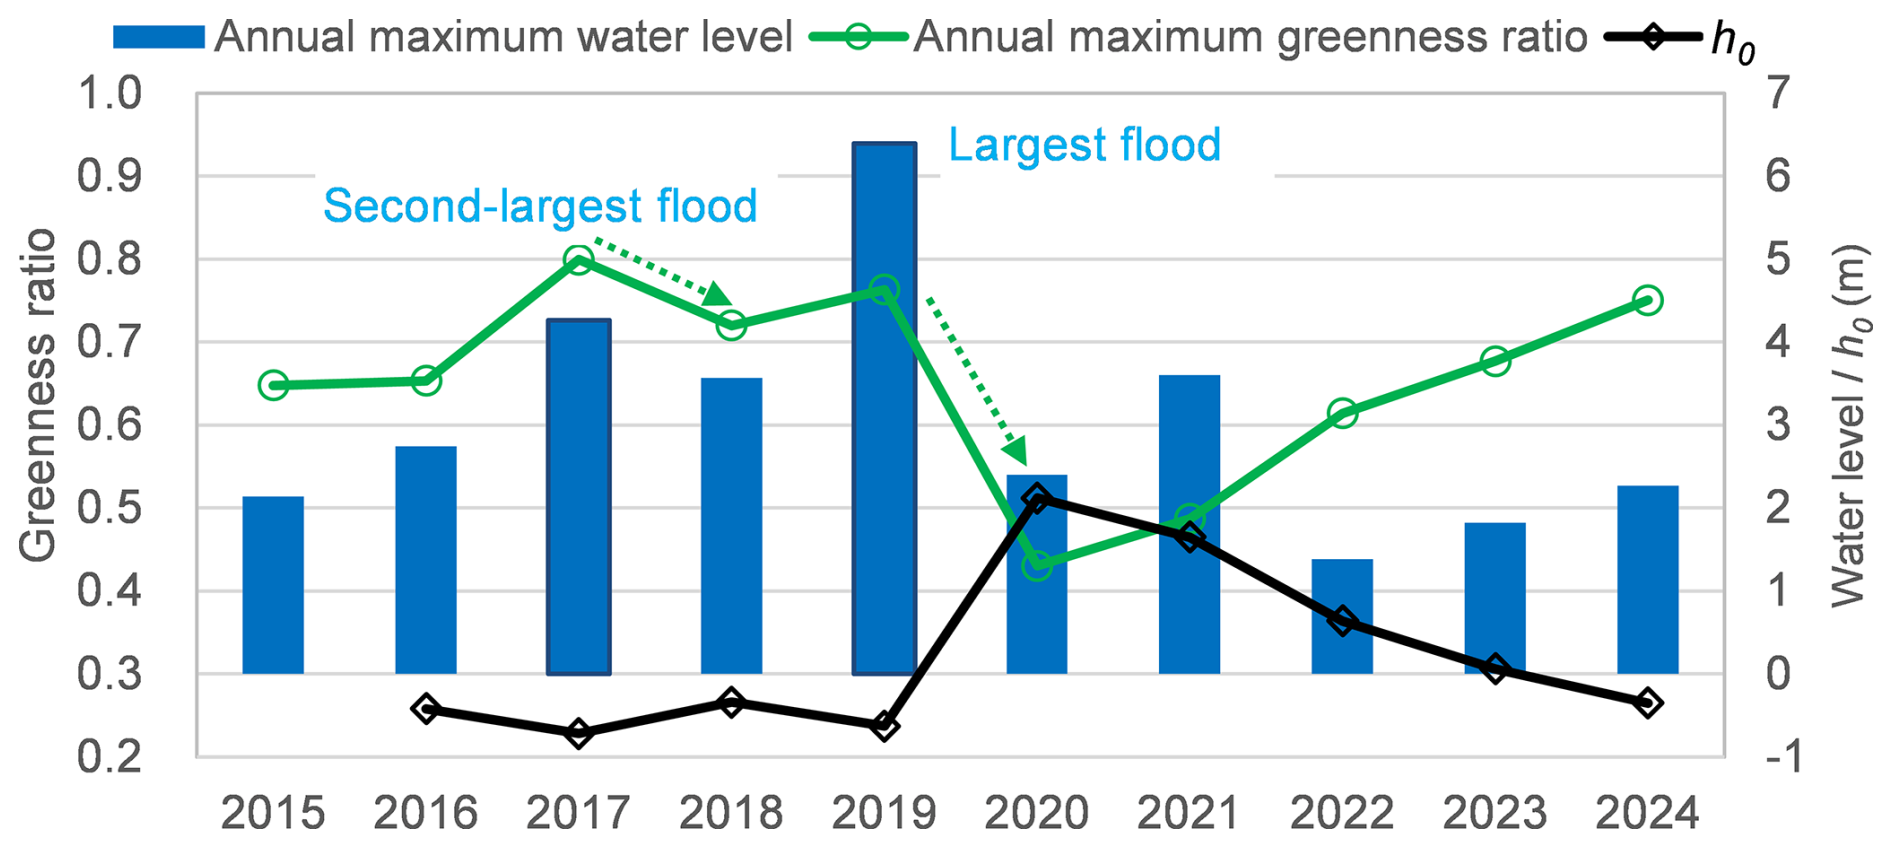
Figure 12Relationship between annual maximum greenness / h0 and annual maximum water level (h0: the relative elevation at which the greenness ratio equals 0.5).
4.1.2 Riparian vegetation dynamics along the lateral transect zone
Based on the 10-year dynamics of greenness ratio and NDVI (Figs. 8, 9 and 10), we identify three functional zones of riparian vegetation by their response to disturbance and resource availability:
-
The high-disturbance zone (relative elevation (RE) ≤ 1.0 m): Vegetation in this zone exists in a “perpetual pioneer” state. Frequent small-to-moderate floods (return periods ≤5 years) prevent woody encroachment, supporting the intermediate disturbance hypothesis (IDH) (Connell, 1978). Here, the frequency of physical disturbance is too high for vegetation to reach a stable state. Consequently, this zone functions as a transient environment in which biomass accumulation is constrained by recurrent disturbance.
-
The biogeomorphic feedback zone (1.0 m < RE ≤ 3.5 m): This band represents a critical “window of opportunity” (Balke et al., 2014) for woody species like Robinia pseudoacacia to survive the seedling stage. Consistent with this interpretation, moderate disturbance and periodic inundation/deposition can maintain favorable establishment conditions in this zone, which is reflected in the high annual NDVI peaks observed before 2019 (Fig. 10). As vegetation patches mature, the system may transition toward a biogeomorphic phase (Corenblit et al., 2007), in which plants act as ecosystem engineers (Corenblit et al., 2014) by trapping sediment and stabilizing landforms. This vegetation establishment may also increase hydraulic resistance, potentially reducing conveyance capacity during floods.
-
The stable zone (RE > 3.5 m): At these higher elevations, vegetation is disconnected from regular hydromorphological changes. While these plants may escape disturbance during most floods, infrequent floodplain connectivity may limit access to inundation-derived water and decrease sediment and nutrient inputs, potentially constraining growth relative to the intermediate zone (Marchetti et al., 2020; Modi et al., 2022). Reduced water and nutrient availability are likely to contribute to the lower NDVI values observed in the stable zone (Fig. 10).
Following the 2019 mega-flood, particularly during 2021–2024, the elevation of annual maximum NDVI shifted from the 1.5–3.0 m band to the 3.5–4.5 m band (Fig. 10), indicating a potential upward migration of the biogeomorphic feedback zone. This shift suggests that vegetation–morphology interactions may have reorganized toward higher elevations after the extreme disturbance. Previous studies have emphasized that stochastic external forcing, such as infrequent extreme floods, plays a critical role in driving ecosystem transitions (Balke et al., 2014). However, because no major flood events have occurred since 2021, we cannot yet evaluate how renewed disturbance will affect the persistence and stability of these newly established vegetation patterns. Longer-term observations are required to determine whether the 2019 mega-flood permanently redefined the boundaries among high-disturbance, biogeomorphic feedback, and stable zones, or whether the observed elevation shift represents a transient successional response rather than a regime shift.
4.2 Practicality of Sentinel-2 NDVI for frequent-disturbed riparian environment
The application of Sentinel-2 NDVI monitoring in this study demonstrates high practicality for adaptive river management. The primary advantage lies in its high temporal resolution, which allows for capturing the ”resetting” of vegetation immediately after flood pulses and the subsequent recovery processes, dynamics that are typically missed by traditional annual or biennial aerial surveys (Bertoldi et al., 2011). As shown in Figs. 8 and 12, NDVI and greenness ratio responses are jointly controlled by flood magnitude (linked to return period) and relative elevation, with slight and pronounced declines following floods with approximately 10-year and 50-year return periods, respectively. Beyond disturbance detection, post-flood NDVI recovery patterns provide quantitative insight into vegetation recruitment and growth rates. For example, the faster recovery observed between 2021 and 2022 compared to 2020–2021 may offer empirical constraints for calibrating process-based riparian vegetation models (Nallaperuma and Asaeda, 2020; Stella et al., 2013; Toda et al., 2020). The above results confirm that Sentinel-2–derived NDVI is a robust indicator for capturing the dual nature of riparian dynamics (abrupt flood-induced removal and gradual successional recovery) and their responses to hydromorphological change. It possesses high potential for application in more stable or other high-disturbance riparian environments. Nevertheless, the specific physical mechanisms of vegetation destruction (e.g., uprooting, burial or bending) cannot be analyzed directly within the current NDVI-based framework and require complementary field or process-based analyses.
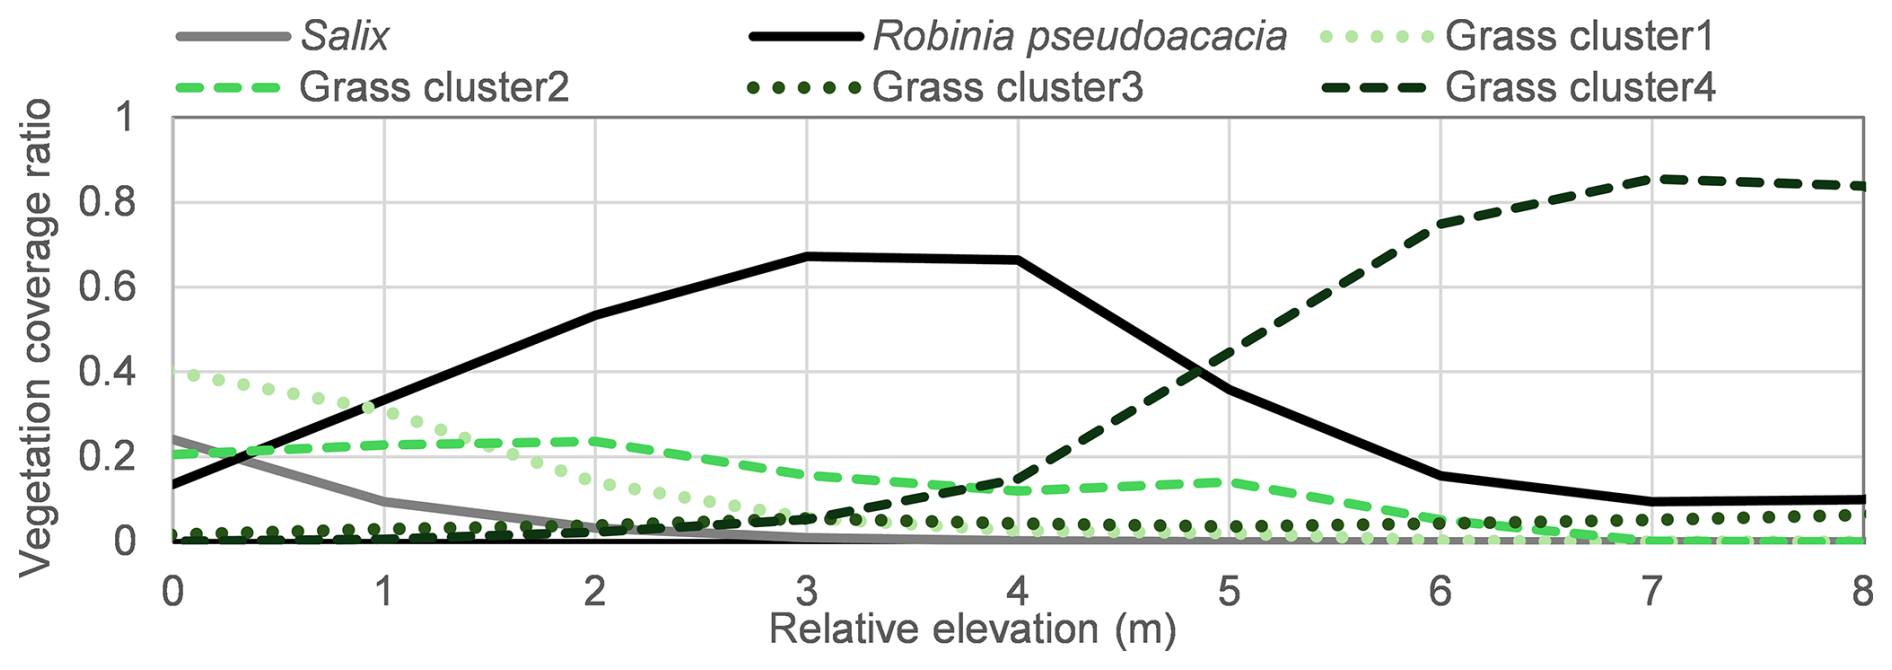
Beyond the potential of Sentinel-2 NDVI for presenting the relationship between vegetation dynamics and hydrodynamics, this dataset may also have the potential for the analysis of vegetation community distribution. The greenness ratio reflects the presence or absence of vegetation based on an NDVI threshold (>0.2), serving as a binary indicator of vegetated area. In contrast, NDVI values themselves provide more detailed information on vegetation health and type, with higher values typically indicating denser and healthier vegetation. At peak summer greenness, trees generally show higher NDVI than grasses due to greater leaf area and NIR reflectance. Accordingly, NDVI may help discriminate woody from herbaceous cover at this site. Prominent NDVI peaks were identified around the zone between 1.5 and 3.0 m (Fig. 10), however, the clear peak of greenness ratio was not identified in Fig. 9. In this study, the ratio of each vegetation type along the lateral transect was calculated based on Environment Information Map 2018 and relative elevation. Environment Information Map 2018 records the vegetation species distribution and was surveyed by the MLIT. As shown in Fig. 13, grass-dominated zones (green line) and tree-dominated zones (black line) spatially differed in 2018, suggesting that lateral hydrogeomorphic gradients (e.g., inundation/disturbance frequency) structure vegetation zonation across the channel–floodplain corridor (Camporeale and Ridolfi, 2006; Johnson et al., 1995; Oorschot et al., 2016). At the current study site, Robinia pseudoacacia, the dominant riparian tree species, is primarily distributed between 2.0 and 4.0 m in relative elevation. Since riparian trees typically exhibit higher NDVI values than grasses, the concentration of Robinia pseudoacacia in this elevation range likely contributed to the distinct NDVI peaks observed from 2016–2019. In the previous research, the Sentinel-2 time-series imagery was reported to have the possibility on grassland plant communities mapping (Rapinel et al., 2019), it may also have the potential to be utilized as the vegetation community's analysis for the frequent disturbed environments based on the spatial greenness ratio and NDVI distribution.
4.3 Management implications: optimizing the “when” and “where”
Effective riparian vegetation management requires addressing two key dimensions: identifying the optimal timing (“when”) and the spatial prioritization (“where”) of interventions. By integrating our NDVI-derived insights with biogeomorphic theory, we propose a strategic framework that balances flood conveyance needs with ecosystem stability.
4.3.1 The timing of vegetation management
Our results suggest that high-magnitude floods (e.g., the 2017 and 2019 events; return period ≥5 years) can act as a natural “resetting” mechanism, producing widespread vegetation removal. By contrast, smaller to moderate floods (e.g., the 2021 event; return period ≤5 years) appear to cause more limited disturbance and may be followed by rapid vegetation recovery in the subsequent growing season, consistent with the increase in greenness ratio from 2021 to 2022. Although the greenness ratio declined substantially after the 2019 event, the steady recovery observed during 2020–2024, when greenness ratio nearly returned to pre-flood levels, highlights the high resilience of the riparian vegetation system. From a management perspective, higher greenness ratio and NDVI values, reflecting greater vegetation cover and denser biomass, are associated with increased hydraulic roughness. Increased roughness reduces flow conveyance and may elevate the risk of embankment overtopping during floods (Al Mehedi et al., 2024). Therefore, vegetation management should be considered not only in relation to small-to-moderate floods (return periods ≤5 years), but also in the context of post-extreme-flood recovery. Continuous post-flood monitoring is essential to track regrowth trajectories and support adaptive intervention strategies.
At the Chikuma River site, NDVI values typically peak in September, coinciding with the end of the growing season. However, in this region, major typhoon-driven flood events tend to occur in late September or October. This seasonal overlap implies that peak vegetation development aligns with the onset of extreme flood events, posing elevated risks to embankment overflow. Accordingly, proactive vegetation management (e.g., selective cutting) may be most effective when prioritized in August, before the typhoon season.
4.3.2 Spatial prioritization for management actions
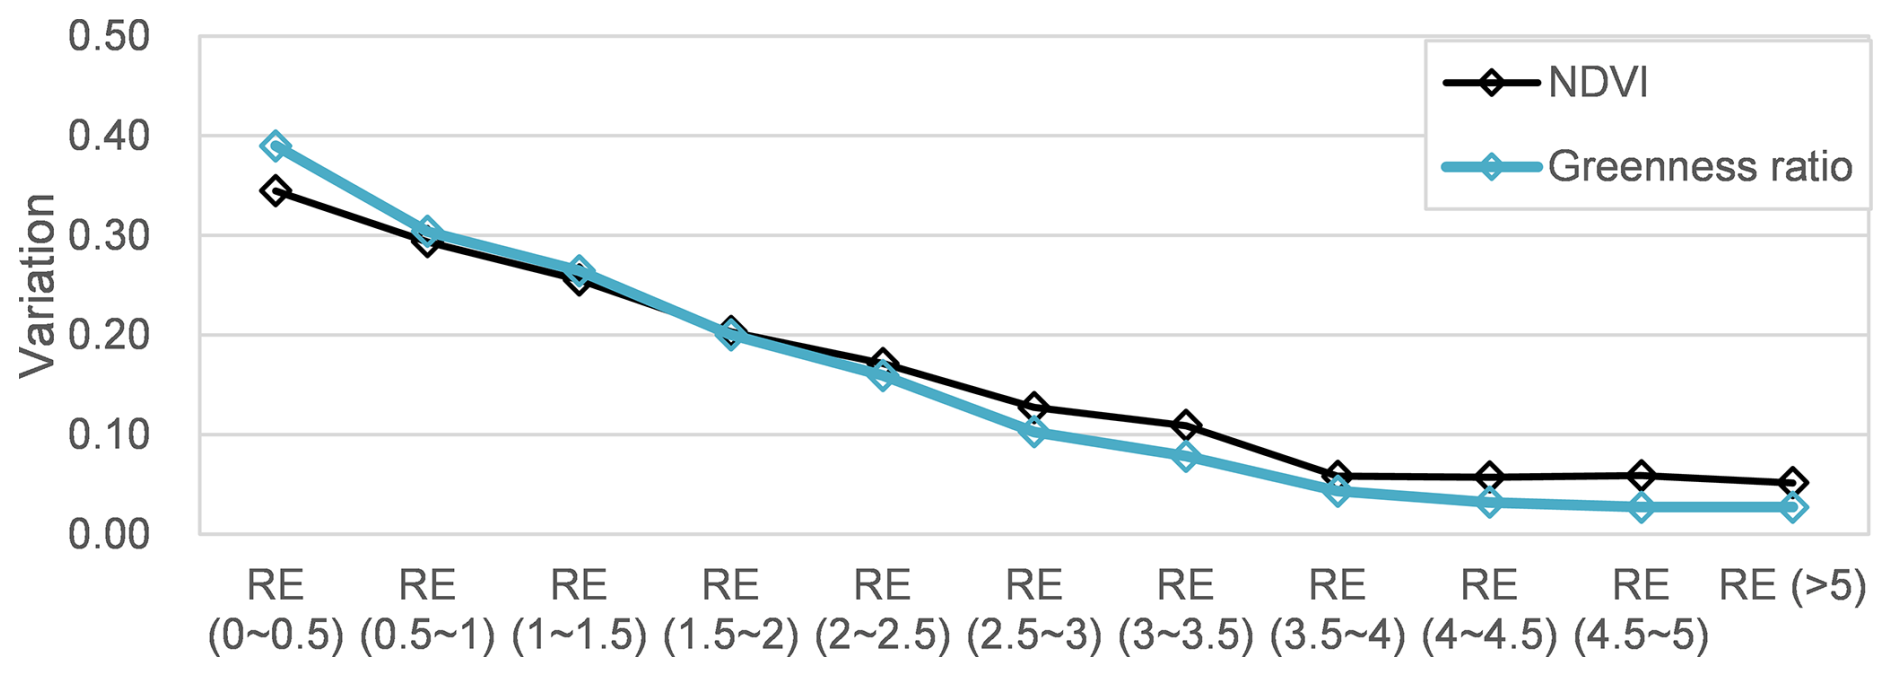
The lateral variation of NDVI and the greenness ratio (Fig. 14) reveals how management should be prioritized across different lateral relative elevation (RE) zones. Low-RE zones: While vegetation here recovers rapidly post-disturbance, it is frequently washed out by moderate floods resulting in the largest interannual variability in annual maximum NDVI and greenness ratio during 2016–2024. Management in this zone is largely “self-maintained” by natural fluvial processes (Death et al., 2015), requiring minimal human intervention except for removing large debris. High-RE zones: These areas harbor stable vegetation that escape most flood disturbance showing the lowest interannual variability during 2016–2024. Although such vegetation zone may improve bank stability, it can significantly obstruct flow during infrequent, high-magnitude floods. Management here should involve periodic, long-term strategic thinning to ensure conveyance during extreme events with lowest variation during 2016–2024. Moderate-RE zones: This band is a key candidate for targeted management aimed at flood-risk reduction. As observed in our NDVI profiles (Fig. 10), these elevations support moderate-to-high density vegetation that impacts flow capacity for both medium and large floods. By utilizing the h0 parameter (relative elevation at which the vegetation coverage equals 0.5) as a monitoring threshold, river managers may quantitatively identify when the “vegetation expansion front” has advanced into floodplain zones, triggering evidence-based, spatially targeted cutting operations that maximize efficiency on flood management.
From the above analysis, spatiotemporal NDVI dynamics and their responses to hydrological disturbances provide a quantitative basis for identifying the timing and necessity of vegetation interventions. The response of riparian vegetation on different disturbances and relative elevation zones was consistent with the intermediate disturbance hypothesis and lateral conceptual theory proposed in previous studies. From a river-management perspective, efficient and cost-effective strategies are essential. Targeting vegetation cutting in moderate relative elevation zones may be economically justified because vegetation cover and density are relatively high in this band. Dense stands can increase hydraulic resistance and reduce conveyance, potentially elevating the risk of overtopping during floods. By contrast, vegetation cutting in low relative elevation zones may be less cost-effective, as vegetation there is frequently removed by natural flood disturbance and thus tends to recover only transiently. The framework developed in this study (integrating spatiotemporal NDVI dynamics with flood disturbances and relative elevation) therefore provides a practical basis for prioritizing when vegetation management should be implemented to maximize benefits while minimizing unnecessary costs. However, this database may not be applied to river systems with narrower channels with the limitation of their spatial resolution.
This study used a decade of Sentinel-2 imagery (2015–2024) and NDVI to quantify disturbance–recovery dynamics of riparian vegetation in the Chikuma River and to translate remotely sensed signals into actionable guidance for river management under frequent disturbances. The key conclusions are as follows.
First, NDVI responses were strongly controlled by flood magnitude and lateral (relative elevation) position. Moderate floods typically produced only minor NDVI declines, whereas high-magnitude events (e.g., the 2019 mega-flood) could act as a system-resetting disturbance. Along the lateral elevation gradient, we identified three functional zones, including high-disturbance, biogeomorphic-feedback, and stable zones. Vegetation responses were elevation-dependent: low relative elevations exhibited repeated flood-driven removal and high interannual variability, while higher elevations remained comparatively stable.
Second, from a cost-effective perspective, management interventions may be most cost-effective when focused on moderate relative elevation zones where vegetation density is sufficiently high to influence conveyance, whereas low relative elevation zones may be less efficient targets because vegetation there is repeatedly reset by frequent floods.
Finally, management is particularly important following intermediate floods (return period ≤5 years). Rapid post-flood regrowth after moderate flood can quickly increase hydraulic resistance. Because peak greenness overlaps seasonally with typhoon-driven floods (late September to October), proactive cutting before the typhoon season (e.g., in August) is recommended to reduce roughness ahead of high-risk periods.
Sentinel-2 imagery used in this study is available at https://doi.org/10.5281/zenodo.17240522 (Zhou, 2025a). Hourly water level data were obtained from the https://www1.river.go.jp/ (last access: 10 March 2026). The temperature and precipitation data were obtained from https://www.data.jma.go.jp/stats/etrn/ (last access: 10 March 2026). The vegetation type and distribution data was downloaded from the https://www.nilim.go.jp/lab/fbg/ksnkankyo/ (last access: 10 March 2026). The temporal water level, temperature and precipitation data are available at https://doi.org/10.5281/zenodo.18092794 (Zhou, 2025b). Topography data of ALB and LP will be made available on request.
YZ planned the study and methodology; YZ and RZ performed the investigation; YZ conducted the formal analysis and curated the data (with additional data curation by YT); YZ wrote the manuscript draft; YT and RZ reviewed and edited the manuscript; YT provided validation and acquired funding.
The contact author has declared that none of the authors has any competing interests.
Publisher's note: Copernicus Publications remains neutral with regard to jurisdictional claims made in the text, published maps, institutional affiliations, or any other geographical representation in this paper. The authors bear the ultimate responsibility for providing appropriate place names. Views expressed in the text are those of the authors and do not necessarily reflect the views of the publisher.
We gratefully acknowledge the provision of the LP, ALB data by the Chikuma River office.
The study was partially funded by JSPS KAKENHI, grants 24K17354 and 25K01333, and the River Fund of the River Foundation (2024-8111-001), Japan.
This paper was edited by Orencio Duran Vinent and reviewed by Maarten Kleinhans and one anonymous referee.
Al Mehedi, M. A., Saki, S., Patel, K., Shen, C., Cohen, S., Smith, V., Rajib, A., Anagnostou, E., Bindas, T., and Lawson, K.: Spatiotemporal variability of channel roughness and its substantial impacts on flood modeling errors, Earths Future, 12, e2023EF004257, https://doi.org/10.1029/2023EF004257, 2024.
Balke, T., Herman, P. M., and Bouma, T. J.: Critical transitions in disturbance – driven ecosystems: identifying Windows of Opportunity for recovery, J. Ecol., 102, 700–708, https://doi.org/10.1111/1365-2745.12241, 2014.
Bertoldi, W., Drake, N. A., and Gurnell, A. M.: Interactions between river flows and colonizing vegetation on a braided river: exploring spatial and temporal dynamics in riparian vegetation cover using satellite data, Earth Surf. Process. Landf., 36, 1474–1486, https://doi.org/10.1002/esp.2166, 2011.
Betz, F., Lauermann, M., and Egger, G.: Biogeomorphology from space: Analyzing the dynamic interactions between hydromorphology and vegetation along the Naryn River in Kyrgyzstan based on dense satellite time series, Remote Sens. Environ., 299, 113890, https://doi.org/10.1016/j.rse.2023.113890, 2023.
Boothroyd, R. J., Nones, M., and Guerrero, M.: Deriving planform morphology and vegetation coverage from remote sensing to support river management applications, Front. Environ. Sci., 9, 657354, https://doi.org/10.3389/fenvs.2021.657354, 2021.
Camporeale, C. and Ridolfi, L.: Riparian vegetation distribution induced by river flow variability: A stochastic approach, Water Resour. Res., 42, W10415, https://doi.org/10.1029/2006WR004933, 2006.
Candel, J., Kleinhans, M., Makaske, B., and Wallinga, J.: Predicting river channel pattern based on stream power, bed material and bank strength, Prog. Phys. Geogr. Earth Environ., 45, 253–278, https://doi.org/10.1177/0309133320948831, 2021.
Connell, J. H.: Diversity in tropical rain forests and coral reefs: high diversity of trees and corals is maintained only in a nonequilibrium state, Science, 199, 1302–1310, https://doi.org/10.1126/science.199.4335.1302, 1978.
Corenblit, D., Tabacchi, E., Steiger, J., and Gurnell, A. M.: Reciprocal interactions and adjustments between fluvial landforms and vegetation dynamics in river corridors: a review of complementary approaches, Earth-Sci. Rev., 84, 56–86, https://doi.org/10.1016/j.earscirev.2007.05.004, 2007.
Corenblit, D., Baas, A. C. W., Bornette, G., Darrozes, J., Delmotte, S., Francis, R. A., Gurnell, A. M., Julien, F., Naiman, R. J., and Steiger, J.: Feedbacks between geomorphology and biota controlling Earth surface processes and landforms: A review of foundation concepts and current understandings, Earth-Sci. Rev., 106, 307–331, https://doi.org/10.1016/j.earscirev.2011.03.002, 2011.
Corenblit, D., Steiger, J., Tabacchi, E., González, E., and Planty-Tabacchi, A. M.: Ecosystem engineers modulate exotic invasions in riparian plant communities by modifying hydrogeomorphic connectivity, River Res. Appl., 30, 45–59, https://doi.org/10.1002/rra.2618, 2014.
Death, R. G., Fuller, I. C., and Macklin, M. G.: Resetting the river template: The potential for climate-related extreme floods to transform river geomorphology and ecology, Freshw. Biol., 60, 2477–2496, https://doi.org/10.1111/fwb.12639, 2015.
Drori, R., Dan, H., Sprintsin, M., and Sheffer, E.: Precipitation-sensitive dynamic threshold: A new and simple method to detect and monitor forest and woody vegetation cover in sub-humid to arid areas, Remote Sensing, 12, 1231, https://doi.org/10.3390/rs12081231, 2020.
Džubáková, K., Molnar, P., Schindler, K., and Trizna, M.: Monitoring of riparian vegetation response to flood disturbances using terrestrial photography, Hydrol. Earth Syst. Sci., 19, 195–208, https://doi.org/10.5194/hess-19-195-2015, 2015.
Edmaier, K., Burlando, P., and Perona, P.: Mechanisms of vegetation uprooting by flow in alluvial non-cohesive sediment, Hydrol. Earth Syst. Sci., 15, 1615–1627, https://doi.org/10.5194/hess-15-1615-2011, 2011.
Francalanci, S., Paris, E., and Solari, L.: On the vulnerability of woody riparian vegetation during flood events, Environ. Fluid Mech., 20, 635–661, https://doi.org/10.1007/s10652-019-09726-5, 2020.
Gurnell, A. M., Bertoldi, W., and Corenblit, D.: Changing river channels: The roles of hydrological processes, plants and pioneer fluvial landforms in humid temperate, mixed load, gravel bed rivers, Earth-Sci. Rev., 111, 129–141, https://doi.org/10.1016/j.earscirev.2011.11.005, 2012.
Herrmann, M., Schmidt-Riese, E., Bäte, D. A., Kempfer, F., Fassnacht, F. E., and Egger, G.: Satellite-observed flood indicators are related to riparian vegetation communities, Ecol. Indic., 166, 112313, https://doi.org/10.1016/j.ecolind.2024.112313, 2024.
Hess, L. L., Melack, J. M., Novo, E. M., Barbosa, C. C., and Gastil, M.: Dual-season mapping of wetland inundation and vegetation for the central Amazon basin, Remote Sens. Environ., 87, 404–428, https://doi.org/10.1016/j.rse.2003.04.001, 2003.
Hughes, F. M.: Floodplain biogeomorphology, Prog. Phys. Geogr., 21, 501–529, https://doi.org/10.1177/030913339702100402, 1997.
Iwasaki, T., Shimizu, Y., and Kimura, I.: Numerical simulation of bar and bank erosion in a vegetated floodplain: A case study in the Otofuke River, Adv. Water Resour., 93, 118–134, https://doi.org/10.1016/j.advwatres.2015.02.001, 2016.
Johnson, W. C., Dixon, M. D., Simons, R., Jenson, S., and Larson, K.: Mapping the response of riparian vegetation to possible flow reductions in the Snake River, Idaho, Geomorphology, 13, 159–173, https://doi.org/10.1016/0169-555X(95)00048-A, 1995.
Kyuka, T., Okabe, K., Shimizu, Y., Yamaguchi, S., Hasegawa, K., and Shinjo, K.: Dominating factors influencing rapid meander shift and levee breaches caused by a record-breaking flood in the Otofuke River, Japan, J. Hydro.-Environ. Res., 31, 76–89, https://doi.org/10.1016/j.jher.2020.05.003, 2020.
Mahoney, J. M. and Rood, S. B.: Streamflow requirements for cottonwood seedling recruitment – an integrative model, Wetlands, 18, 634–645, https://doi.org/10.1007/BF03161678, 1998.
Marchetti, Z. Y., Minotti, P. G., Ramonell, C. G., Schivo, F., and Kandus, P.: NDVI patterns as indicator of morphodynamic activity in the middle Paraná River floodplain, Geomorphology, 253, 146–158, https://doi.org/10.1016/j.geomorph.2015.10.003, 2016.
Marchetti, Z. Y., Ramonell, C. G., Brumnich, F., Alberdi, R., and Kandus, P.: Vegetation and hydrogeomorphic features of a large lowland river: NDVI patterns summarizing fluvial dynamics and supporting interpretations of ecological patterns, Earth Surf. Process. Landf., 45, 694–706, https://doi.org/10.1002/esp.4766, 2020.
Merritt, D. M., Scott, M. L., LeRoy Poff, N., Auble, G. T., and Lytle, D. A.: Theory, methods and tools for determining environmental flows for riparian vegetation: riparian vegetation-flow response guilds, Freshw. Biol., 55, 206–225, https://doi.org/10.1111/j.1365-2427.2009.02206.x, 2010.
Modi, A., Kapoor, V., and Tare, V.: River space: A hydro-bio-geomorphic framework for sustainable river-floodplain management, Sci. Total Environ., 812, 151470, https://doi.org/10.1016/j.scitotenv.2021.151470, 2022.
Naiman, R. J., Décamps, H., and McClain, M. E.: Riparia: Ecology, Conservation, and Management of Streamside Communities, Elsevier Academic Press, Burlington, MA, 2005.
Nallaperuma, B. and Asaeda, T.: Long-term changes in riparian forest cover under a dam induced flow scheme: the accompanying a numerical modelling perspective, J. Ecohydraul., https://doi.org/10.1080/24705357.2019.1663714, 2019.
Nallaperuma, B. and Asaeda, T.: The long-term legacy of riparian vegetation in a hydrogeomorphologically remodelled fluvial setting, River Res. Appl., 36, 1690–1700, https://doi.org/10.1002/rra.3665, 2020.
Nepf, H. M.: Hydrodynamics of vegetated channels, J. Hydraul. Res., 50, 262–279, https://doi.org/10.1080/00221686.2012.696559, 2012.
Oorschot, M. V., Kleinhans, M., Geerling, G., and Middelkoop, H.: Distinct patterns of interaction between vegetation and morphodynamics, Earth Surf. Proc. Landf., 41, 791–808, https://doi.org/10.1002/esp.3864, 2016.
Pettorelli, N., Vik, J. O., Mysterud, A., Gaillard, J. M., Tucker, C. J., and Stenseth, N. C.: Using the satellite-derived NDVI to assess ecological responses to environmental change, Trends Ecol. Evol., 20, 503–510, https://doi.org/10.1016/j.tree.2005.05.011, 2005.
Rapinel, S., Mony, C., Lecoq, L., Clément, B., Thomas, A., and Hubert-Moy, L.: Evaluation of Sentinel-2 time-series for mapping floodplain grassland plant communities, Remote Sens. Environ., 223, 115–129, https://doi.org/10.1016/j.rse.2019.01.018, 2019.
Shimizu, Y., Nelson, J., Arnez Ferrel, K., Asahi, K., Giri, S., Inoue, T., Iwasaki, T., Jang, C. L., Kang, T., Kimura, I., Kyuka, T., Mishra, J., Nabi, M., Patsinghasanee, S., and Yamaguchi, S.: Advances in computational morphodynamics using the International River Interface Cooperative (iRIC) software, Earth Surf. Process. Landf., 45, 11–37, https://doi.org/10.1002/esp.4653, 2020.
Singh, A. and Vyas, V.: A review on remote sensing application in river ecosystem evaluation, Spatial Inf. Res., 30, 759–772, https://doi.org/10.1007/s41324-022-00470-5, 2022.
Stella, J. C., Rodríguez-González, P. M., Dufour, S., and Bendix, J.: Riparian vegetation research in Mediterranean-climate regions: common patterns, ecological processes, and considerations for management, Hydrobiologia, 719, 291–315, https://doi.org/10.1007/s10750-012-1304-9, 2013.
Toda, Y., Zhou, Y., and Sakai, N.: Modeling of riparian vegetation dynamics and its application to the sand-bed river, J. Hydro-Environ. Res., 30, 3–13, https://doi.org/10.1016/j.jher.2019.09.003, 2020.
Townsend, P. A. and Walsh, S. J.: Remote sensing of forested wetlands: application of multitemporal and multispectral satellite imagery to determine plant community composition and structure in southeastern USA, Plant Ecol., 157, 129–149, https://doi.org/10.1023/A:1013999513172, 2001.
Tucker, C. J.: Red and photographic infrared linear combinations for monitoring vegetation, Remote Sens. Environ., 8, 127–150, https://doi.org/10.1016/0034-4257(79)90013-0, 1979.
Wang, C., Zheng, Z., Gao, J., Zhou, F., Rossi, S., and Fang, K.: Linking growth dynamics and intra-annual density fluctuations to late-summer precipitation in humid subtropical China, Front. Plant Sci., 16, 1568882, https://doi.org/10.3389/fpls.2025.1568882, 2025.
Ward, J. V., Tockner, K., Arscott, D. B., and Claret, C.: Riverine landscape diversity, Freshw. Biol., 47, 517–539, https://doi.org/10.1046/j.1365-2427.2002.00893.x, 2002.
Zeng, L., Wardlow, B. D., Xiang, D., Hu, S., and Li, D.: A review of vegetation phenological metrics extraction using time-series, multispectral satellite data, Remote Sens. Environ., 237, 111511, https://doi.org/10.1016/j.rse.2019.111511, 2020.
Zhou, Y.: 2015-2024 Sentinel-2 Imagery of Chikuma River, Zenodo [data set], https://doi.org/10.5281/zenodo.17240522, 2025a.
Zhou, Y.: Water level, temperature and precipitation data, Zenodo [data set], https://doi.org/10.5281/zenodo.18092794, 2025b.
Zhu, R., Tsubaki, R., and Toda, Y.: Effects of vegetation distribution along river transects on the morphology of a gravel bed braided river, Acta Geophys., 71, 1–16, https://doi.org/10.1007/s11600-023-01075-8, 2023.
Zuo, Y., Li, Y., He, K., and Wen, Y.: Temporal and spatial variation characteristics of vegetation coverage and quantitative analysis of its potential driving forces in the Qilian Mountains, China, 2000–2020, Ecol. Indic., 143, 109429, https://doi.org/10.1016/j.ecolind.2022.109429, 2022.