the Creative Commons Attribution 4.0 License.
the Creative Commons Attribution 4.0 License.
 | 13 Apr 2026
TerraceM-3: integrating machine learning and ICESat-2 altimetry to estimate deformation rates from wave-abrasion terraces
Jürgen Mey
Roland Freisleben
Daniel Melnick
Markus Weiss
Patricio Winckler
Chrystelle Mavoungou
Manfred R. Strecker
Wave-abrasion terraces are geomorphic marker horizons that provide information of past water levels, in marine and lacustrine environments. By integrating elevation measurements and age constraints, they serve as strain markers to assess vertical deformation rates associated with tectonic and/or climatic processes. As most geomorphic markers, wave-abrasion terraces are ephemeral features, and their topographic signature has variable levels of noise. Therefore, accurate and precise estimates of marine terrace morphology are essential to obtain significant uplift/subsidence rates. The open source TerraceM-3 enables operators to reduce non-systematic and systematic errors in terrace mapping by integrating machine learning techniques to replicate human mapping criteria, and standardized and reproducible workflows to handle systematic errors. In many regions, the availability of high-resolution topographic data remains relatively scarce limiting precision in geomorphic marker mapping. TerraceM-3 introduces a new module for downloading, filtering, and processing centimeter-resolution topographic data from the ICESat-2 satellite at global scale. The TerraceM-ICESat module produces vegetation-free profiles ready for assisted machine-learning mapping into a graphical user interface. Shallow bathymetry may be also extracted to extend the mapping of drowned terraces offshore. The new functionalities of TerraceM-3 were tested along tectonically active coasts in Peru and Algeria, revealing detailed deformation histories controlled by subducted seamounts and crustal faults. TerraceM-3 is designed to support research in tectonic geomorphology and paleoclimate studies by enhancing the precision and accuracy of wave-abrasion terrace mapping with applications in the assessment of coastal hazards.
- Article
(14532 KB) - Full-text XML
-
Supplement
(3809 KB) - BibTeX
- EndNote


Coastal areas are highly vulnerable to natural hazards such as sea-level rise, earthquakes, and tsunamis. Understanding past changes in coastal environments, requires accurate measurements of surface deformation, which are fundamental for elucidating the governing mechanisms within the solid Earth. This is particularly relevant over millennial timescales, when the interplay between multiple geodynamic and climatic processes needs to be disentangled for proper interpretation. Precise measurements of vertical deformation at these time-scales are essential for distinguishing among various driving mechanisms and their temporal evolution, including tectonic forces from plate boundary interactions, glacial isostatic adjustment following ice-sheet retreat, mantle upwelling anomalies and magmatic inflation (e.g. Lambeck, 2001; Pan et al., 2021; Singer et al., 2018; Fialko and Pearse, 2012; Simms et al., 2016; Walker et al., 2016). Furthermore, quantifying rates associated with these processes at centennial to millennial scales is necessary to separate these long-term natural processes from land-level changes driven by modern anthropogenic activities such as groundwater withdrawal hydrocarbon extraction (e.g. Geertsma, 1973; Holzer and Johnson, 1985; Shirzaei et al., 2021). In coastal areas, the records of deformation at millennial scales can be preserved as fossil geomorphic features in the landscape, such as marine or fluvial terraces, fault scarps or offsets. Nevertheless, the ephemeral nature of such features makes the direct estimation of deformation rates from surface morphology a challenging task (e.g. Anderson et al., 1999).
Wave-abrasion marine terraces have been largely used to estimate vertical deformation rates (Lajoie, 1986; Pedoja et al., 2011; Kaizuka et al., 1973). These geomorphic features were formed by wave abrasion during past sea-level positions, representing fossil markers of deformation that can extend by several kilometers along the coast. Marine terraces are often exposed forming sequences that record past sea-level variability at glacial cycle time-scales. These special characteristics make marine terraces valuable for estimating past sea-level positions and the spatial distribution of deformation (Burbank and Anderson, 2011; Anderson et al., 1999; Chappell, 1974; Roberts et al., 2013; Lajoie, 1986; Broecker et al., 1968; Armijo et al., 1996). As such, marine terraces and their equivalents in the lacustrine realm are first-order geomorphic strain markers that furnish primary observational constraints for understanding the rheological structure of the lithosphere, active deformation of plate boundaries and the mechanical behaviour of active fault systems (e.g. Henriquet et al., 2019; Simms et al., 2016; Armijo et al., 1996; Sato and Matsu'ura, 1992; Ghazleh and Kempe, 2009; Jara-Muñoz et al., 2024; Ghazleh and Kempe, 2021). However, despite its extensive application, marine terraces mapping has traditionally been a qualitative process, often relying on subjective criteria, which has direct repercussions regarding the precision and accuracy of measurements based on these markers. In addition, topographic datasets used for marine terrace mapping can include errors related to data acquisition, topographic artifacts, vegetation, and poor spatial resolution. Such errors can lead to misinterpretations of the underlying deformation processes, particularly when attempting to identify low magnitude deformation rates of over hundreds of thousands to millions of years (e.g. Melnick, 2016; Regard et al., 2010).
1.1 Marine terrace mapping: methods and uncertainties
While several studies have proposed methods to map marine terraces using high-resolution topography (Bowles and Cowgill, 2012; Jara-Muñoz et al., 2019, 2016; Palamara et al., 2007), their accuracy can be significantly compromised by processes that destroy or alter the marine terrace morphology (Fig. 1A–H). For instance, river erosion (Fig. 1B) can effectively destroy the original marine terrace morphology by retreat of slopes adjacent to incising streams (Anderson et al., 1999; Rosenbloom and Anderson, 1994). Diffusion of material from paleo-cliffs and landslides (Fig. 1C–D) can modify the cliff edge and the original slope of both the paleo-cliff and paleo-platform (Hanks et al., 1984; Stephenson, 2015; Griggs and Trenhaile, 1994). Marine terrace deposits, such as alluvial cover, coastal sediments, and active dunes (Fig. 1E) may cover the paleo-platform, potentially leading to overestimation of terrace elevation (Jara-Muñoz and Melnick, 2015).
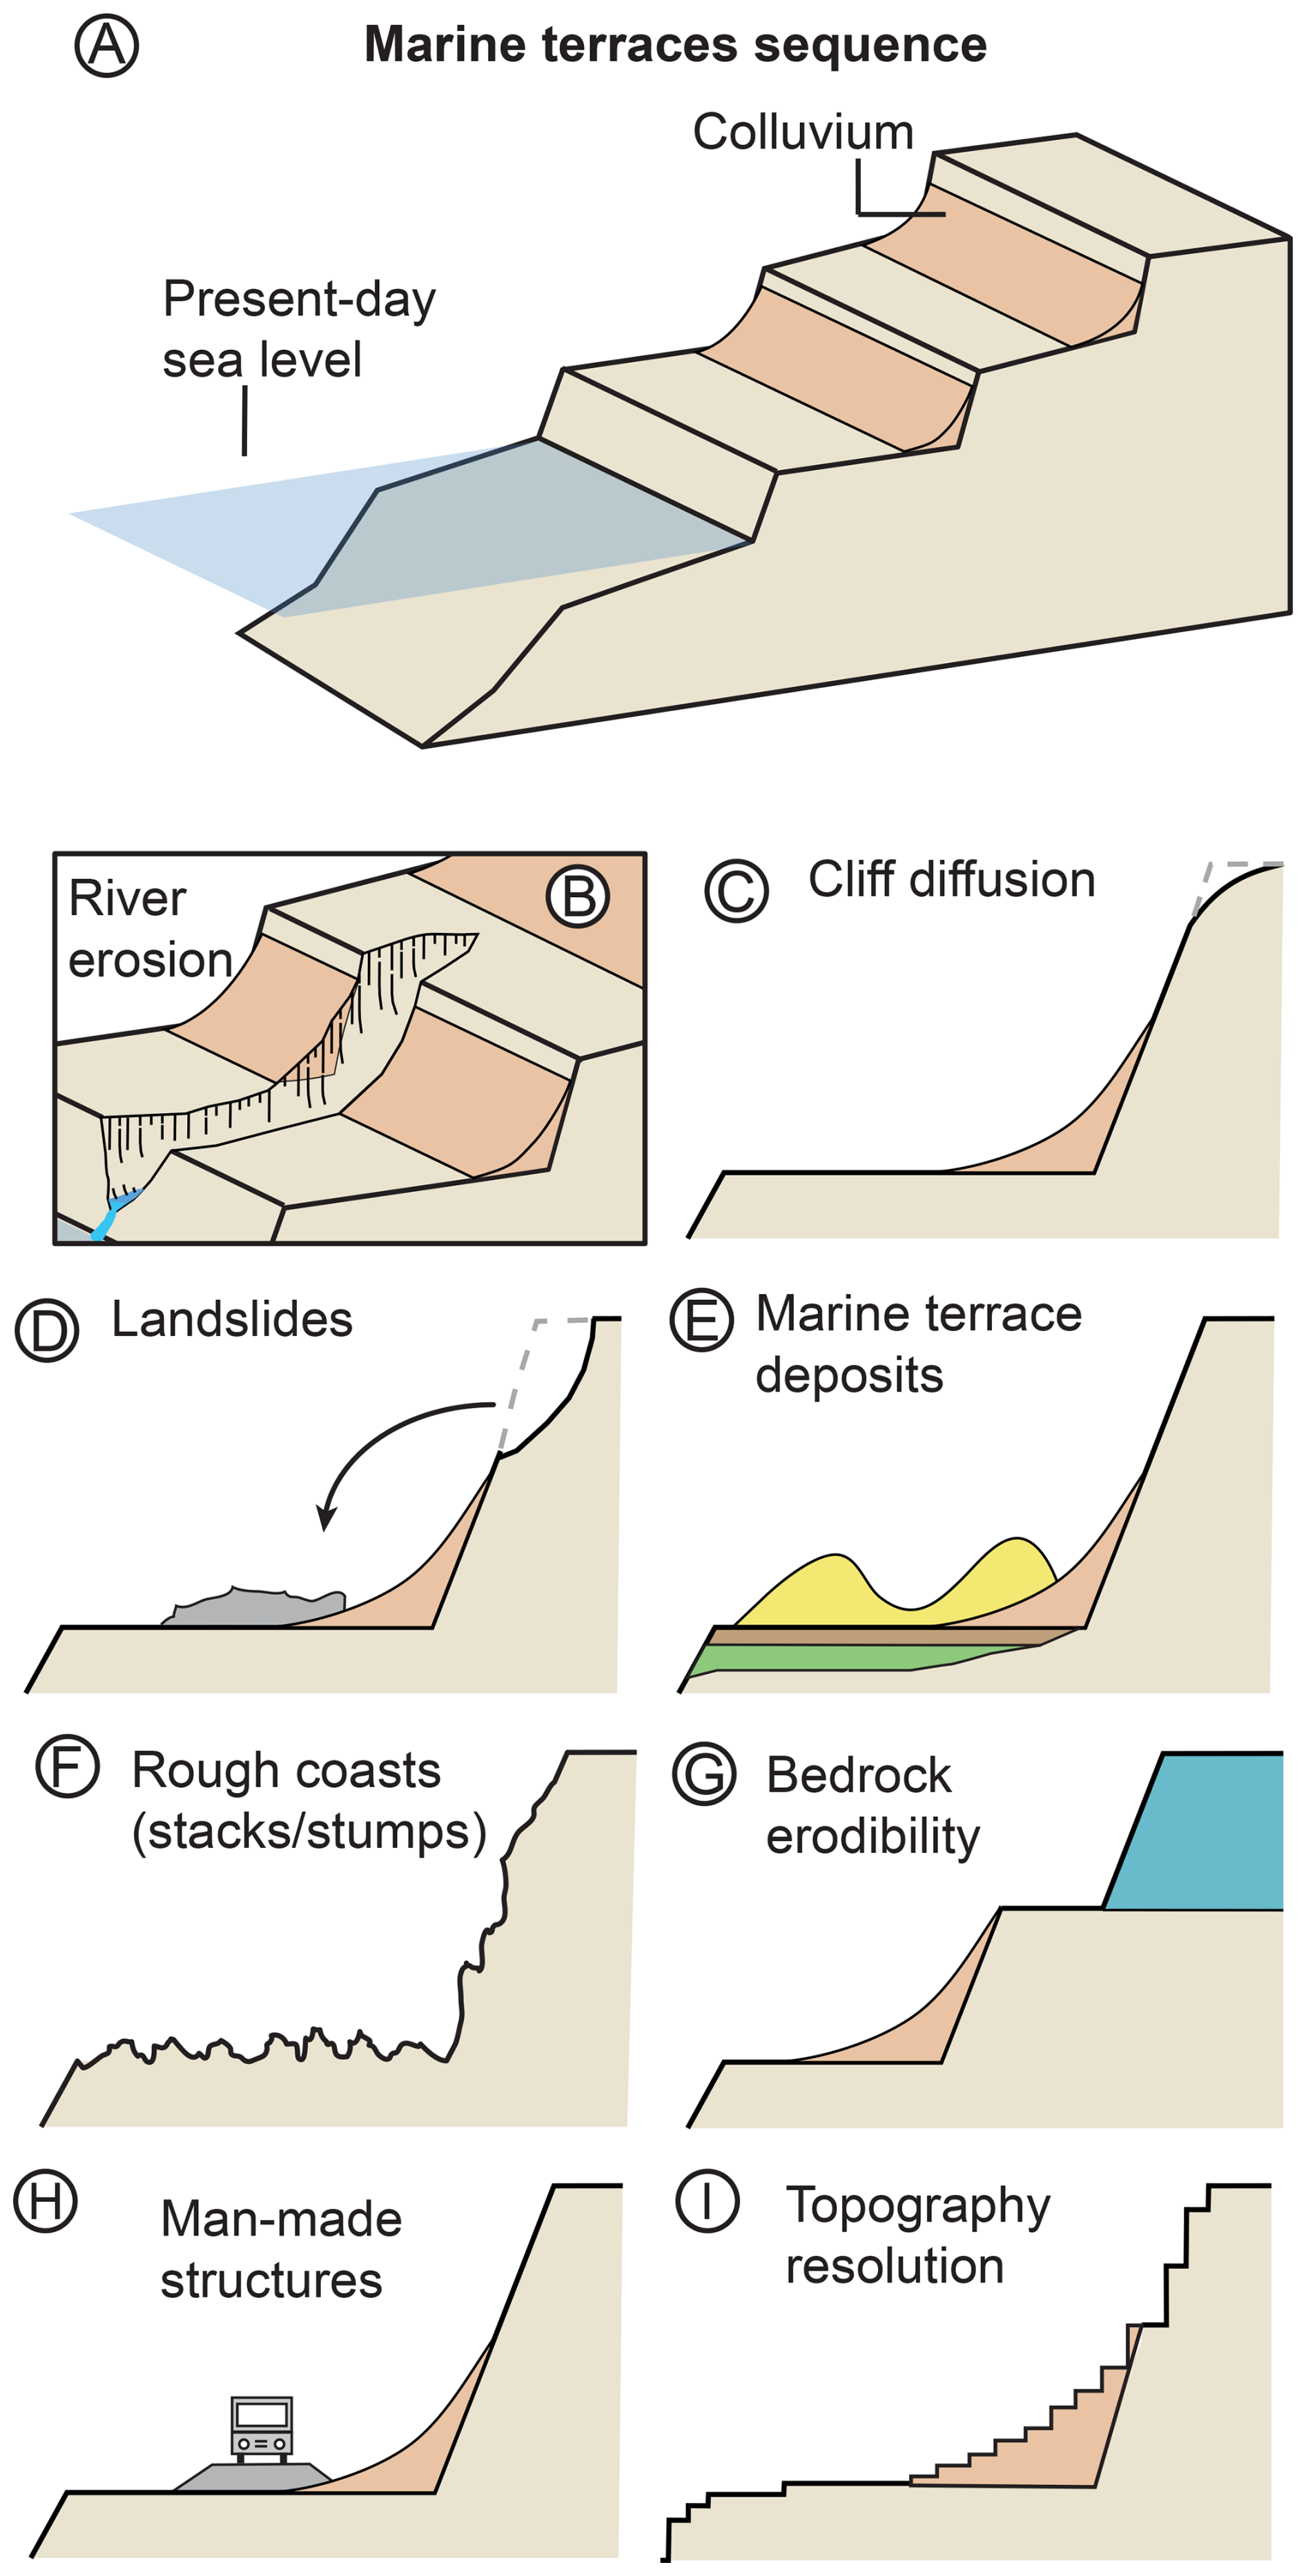
Figure 1Processes and environmental factors affecting the morphology of wave-abrasion marine terraces. (A) Simplified anatomy of a marine terrace sequence. (B–I) Examples of processes and factors that can alter or destroy the marine terrace topography compromising their identification and mapping.
Rough coasts along rocky shorelines, formed under intense wave climate and high bedrock erodibility or affected by strong weathering or bioerosion, result in the formation of sea-stacks and stumps above the paleo-platform (Fig. 1F) (Trenhaile et al., 1998). These topographic irregularities may hinder the assessment of the marine terrace morphology (Jara-Muñoz et al., 2016). Furthermore, differential bedrock erosion, particularly at lithological contacts between rocks of varying erodibility, or the effect of river erosion and non-marine processes, can result in the formation of “pseudo terraces” (Duff, 1993; Mitusio, 1989) inducing an erroneous evaluation of terrace levels (Fig. 1G). Additionally, anthropogenic modification of the landscape can significantly alter terrace morphology (Fig. 1H). For instance, marine terraces are frequently used for the construction of infrastructure, often involving slope reshaping and infilling of the paleo-platform, which complicates mapping of marine terrace elevations. Finally, the low-resolution of digital topography may compromise the assessment of terrace morphology (Fig. 1I) by smoothing out natural terrain slopes (Chang and Tsai, 1991).
One of the main challenges when mapping marine terraces is the limited availability of high-resolution digital topography (0.5–5 m per pixel), currently restricted to certain countries and isolated areas such as those accessible through the OpenTopography portal (Krishnan et al., 2011). Furthermore, the resolution and accuracy of the available medium-resolution digital topography (10–30 m per pixel) can significantly influence the accuracy of terrace mapping (Jara-Muñoz et al., 2016). Recently, satellite altimetry missions such as NASA's ICESat-2 have provided globally available and highly accurate bare-earth elevation data (Abdalati et al., 2010; Markus et al., 2017; Jasinski et al., 2021). Unlike traditional gridded digital elevation models (DEMs), ICESat-2 uses photon-counting LiDAR to capture high-resolution elevation profiles, reducing artifacts and effectively filtering out vegetation (Neuenschwander and Pitts, 2019), see further details in Sect. 2.5.
1.2 The TerraceM project
Since its first release, TerraceM has included methods to mitigate the effects of river erosion and cliff diffusion when mapping marine terrace elevations by using swath topographic profiles (Fig. 2A–D; Jara-Muñoz et al., 2019, 2016). However, the influence of processes that destroy marine terrace morphology remains difficult to discriminate using solely digital topography, often requiring calibration through field observations and detailed geomorphic interpretations (e.g. Matsu'ura et al., 2014; Matsu'ura, 2015; Melnick et al., 2017; Bowles and Cowgill, 2012; Matsu'ura et al., 2019; Berryman, 1993). Consequently, terrace identification and mapping remain partly dependent on the operator's criteria. The TerraceM mapping approach requires the operator to manually define two segments along a topographic profile (Jara-Muñoz et al., 2019, 2016), a couplet comprising the paleo-platform and paleo-cliff of a wave-abrasion marine terrace (Fig. 2C). Linear regressions are then fitted to both segments and extrapolated (Fig. 2D); their intersection defines the shoreline-angle, which represents the marine terrace elevation (Fig. 2D) and the former water level during sea or lake level stands (Lajoie, 1986). The shoreline-angle elevation error is derived from the confidence interval of the linear regressions.
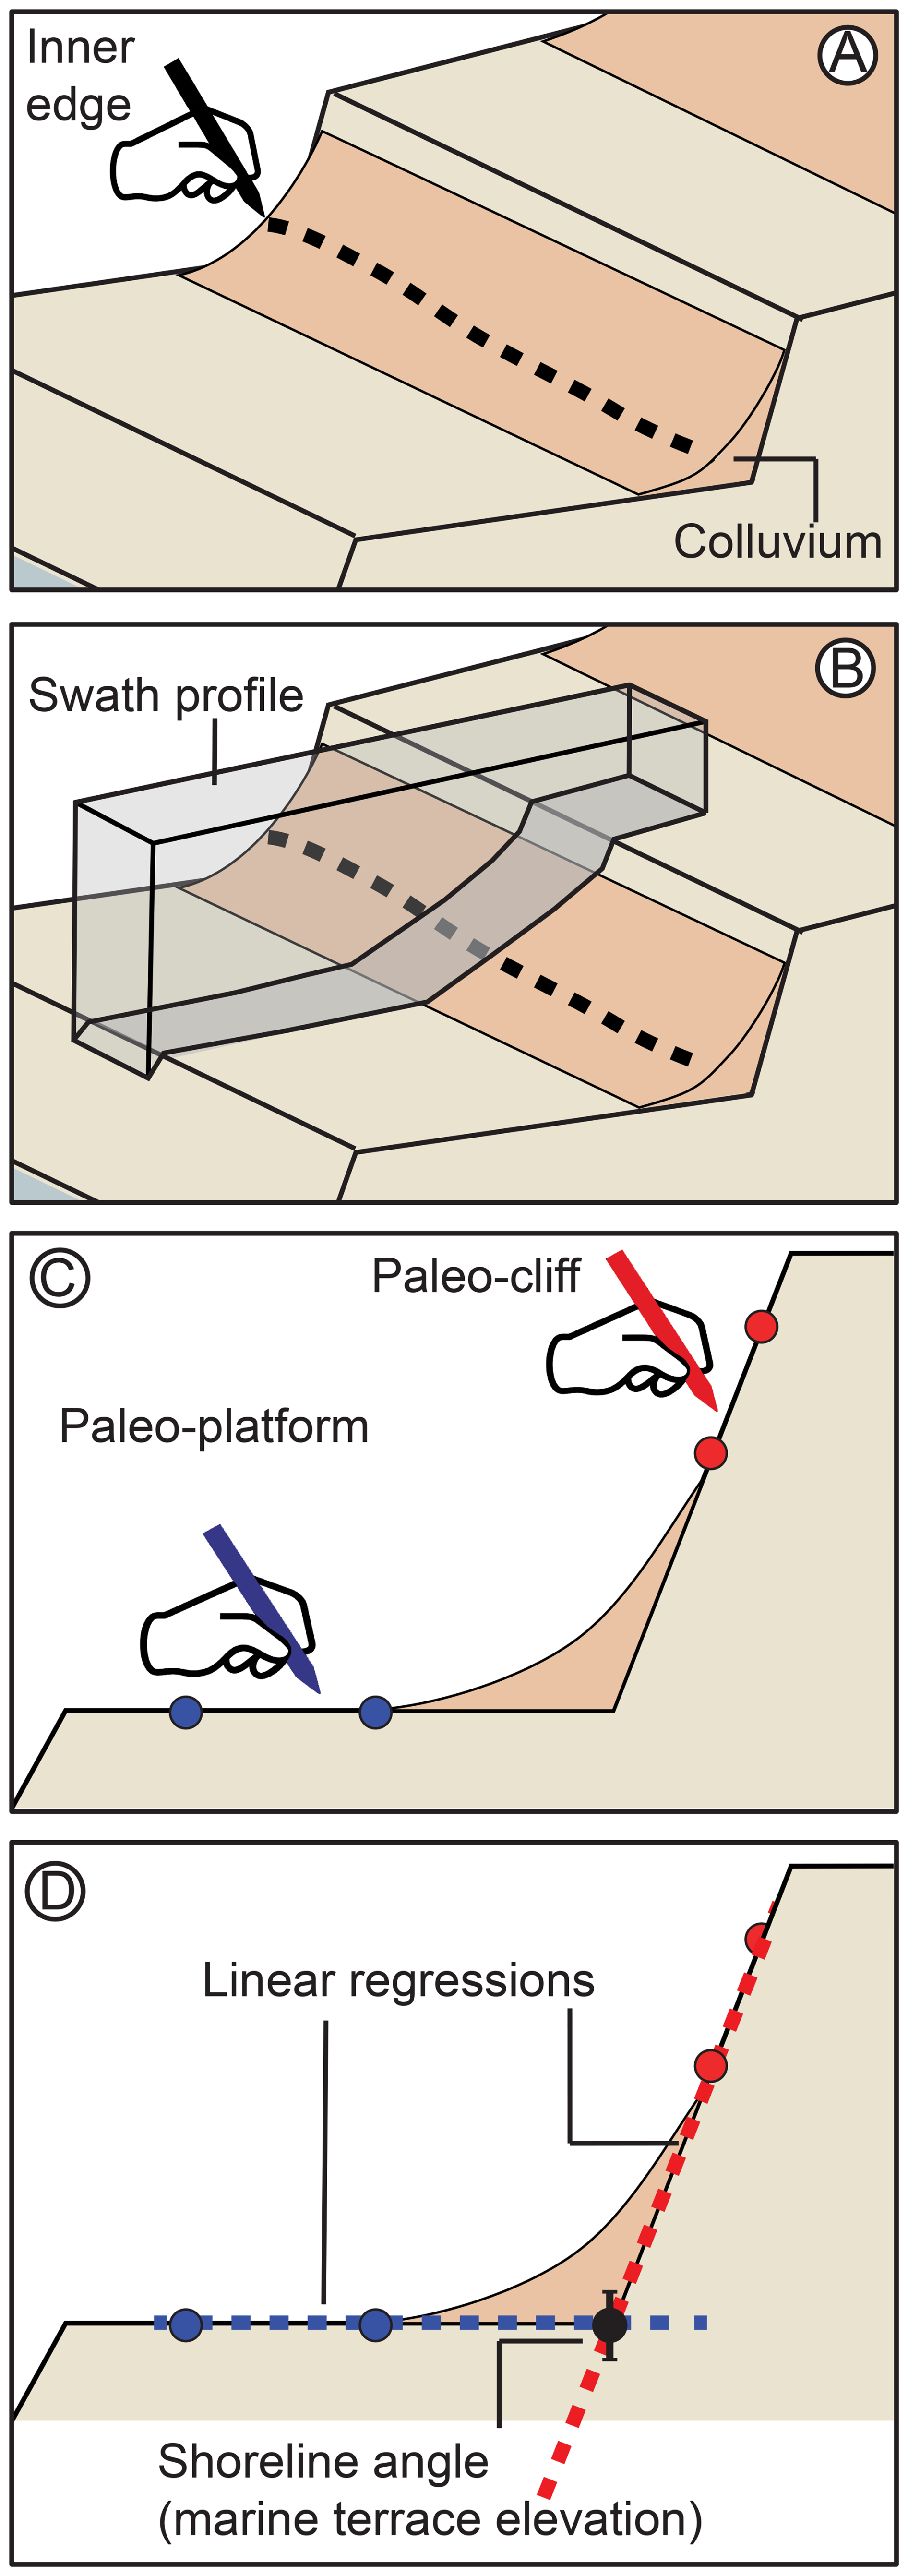
Figure 2The classical TerraceM workflow (Jara-Muñoz et al., 2016) includes: (A) manual mapping of inner edges in a GIS platform; (B) placement of swath profiles perpendicular to inner edge and check profile locations; (C) manual mapping of paleo-cliff and paleo-platform segments in the swath profile; and (D) extrapolation of linear regressions from the topography segments. The intersection of these regressions defines the shoreline angle, which represents the marine terrace elevation.
The shoreline-angle mapping procedure involves a degree of subjectivity, as the manual placement of paleo-cliff and paleo-platform segments can vary depending on the experience and criteria of the operator. Based on data collected during experiments with different operators, Jara-Muñoz et al. (2016) showed that terrace mapping can be a repeatable process within a certain degree of confidence, although it still depends on subjective interpretation and operator experience (non-systematic errors). The advancement of artificial intelligence and machine learning methods combined with the increasing computational power of desktop computers has enabled the reproduction of complex, non-linear relationships involving a wide range of variables. These include operator-based decisions and the qualitative criteria inherent to human-machine interactions (e.g. Johannsen, 2009; Schleidgen et al., 2023). Applying machine learning to automate marine terrace mapping offers the potential to address the qualitative nature of traditional approaches and reduce non-systematic errors associated with human interpretation. However, these advances should be viewed with caution, as increased energy consumption and associated carbon costs may undermine their benefits.
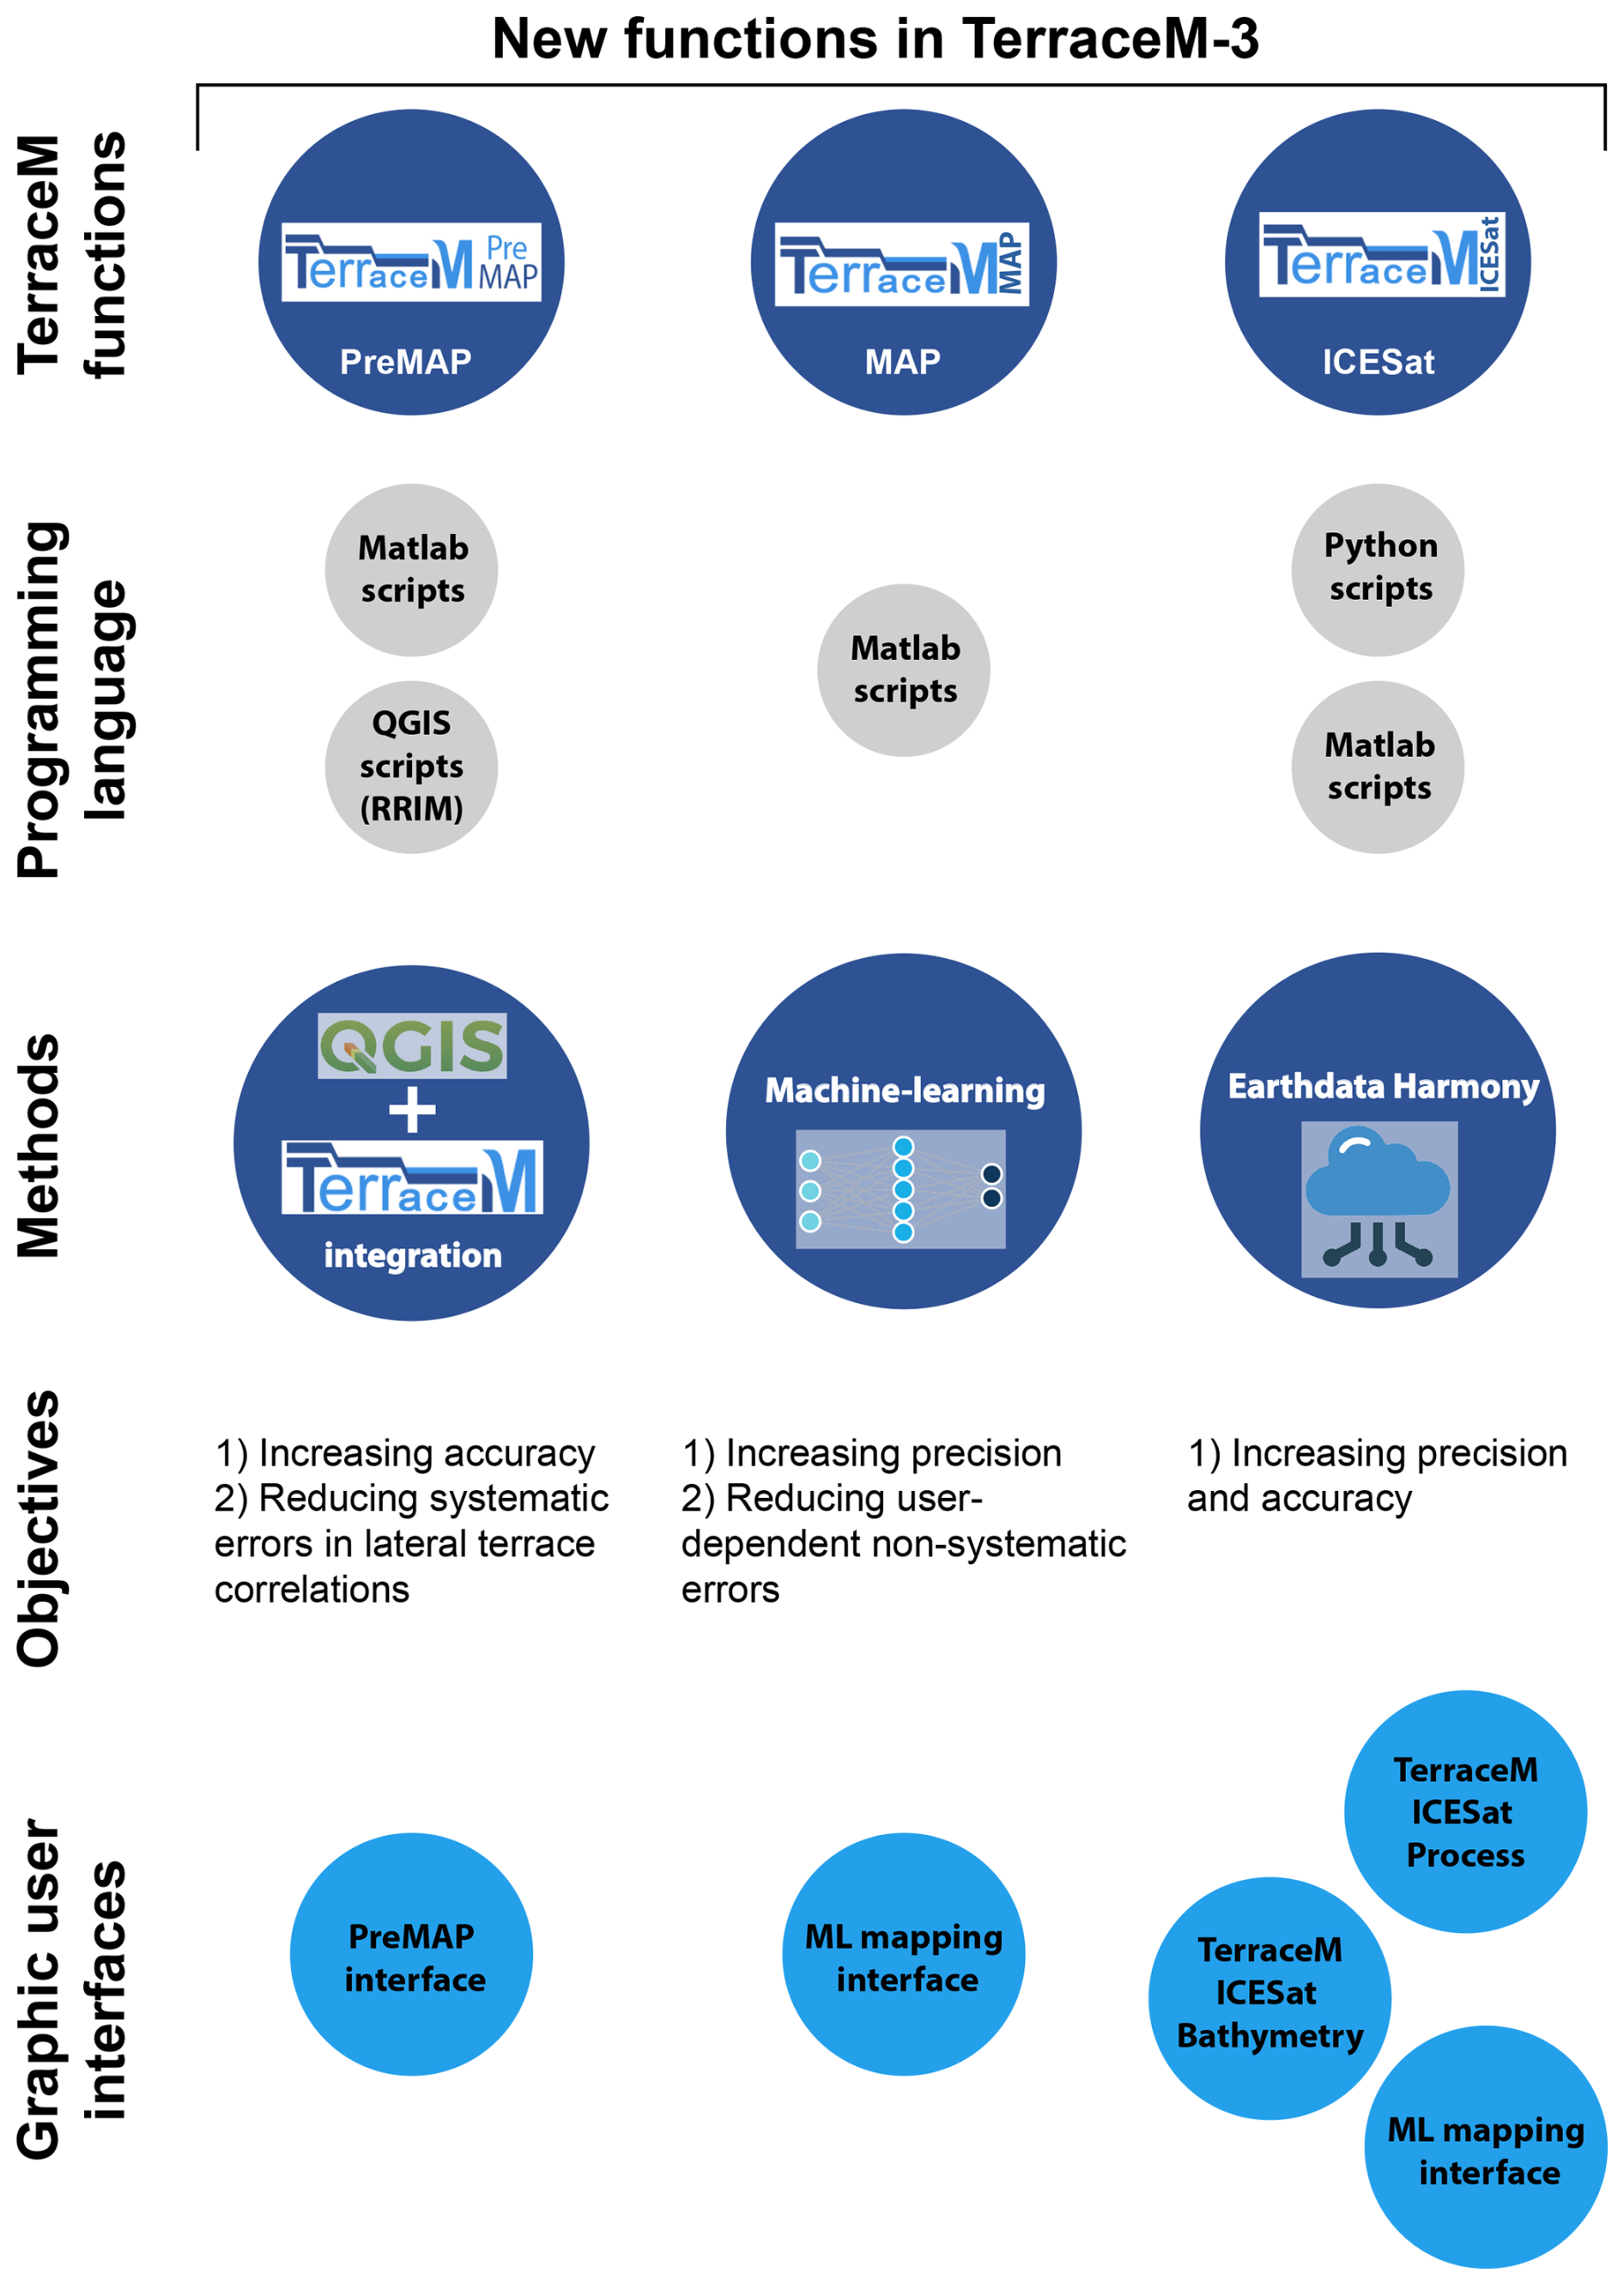
Figure 3Schematic overview of the TerraceM-3 architecture and new modules. TerraceM-3 incorporates three new modules (TerraceM_ICESat-2, TerraceM_PreMAP, and TerraceM_MAP), implemented in MATLAB and combining Python, and QGIS. TerraceM_PreMAP integrates MATLAB® GUIs with QGIS scripts, the MAP module applies machine-learning algorithms for automated marine terrace mapping, and the ICESat-2 module is powered by Python scripts to connect to NASA Earthdata Harmony® servers for satellite data retrieval. The new modules are provided as graphical user interfaces to facilitate analysis increasing the precision and accuracy of marine terrace mapping.
TerraceM is an open-source software written in MATLAB® and originally designed for measuring marine terraces systematically using swath profiles and estimating surface deformation rates (Jara-Muñoz et al., 2016). In the subsequent versions, TerraceM-2 incorporated numerical models to simulate marine terrace formation and to analyze deformation patterns produced by active faults and deep deformation sources (Jara-Muñoz et al., 2019). In the present release, TerraceM-3 introduces a new automatic marine terrace mapping module powered by machine learning (ML) algorithms, along with an integrated interface for directly downloading, processing, and mapping marine terraces using high-resolution satellite altimetry data of the ICESat-2 mission (Fig. 3). TerraceM-3 also includes TerraceM PreMAP, a novel workflow to improve the accuracy of marine terrace mapping by systematizing the preparation of swath profiles (Fig. 3). We use these new approaches at Cerro El Huevo (Peru), and Sahel Ridge (Algeria), obtaining accurate and precise deformation estimates that reveal detailed tectonic deformation histories and the influence of deep deformation sources and crustal faults.
2.1 Systematic approaches in the TerraceM_PreMAP module
Systematic approaches are essential for obtaining reproducible and accurate measurements. By following a systematic approach, a workflow can be designed to include unambiguous steps, standardized methods, data quality control, and reproducibility protocols yielding reliable and consistent outcomes (Atkinson et al., 2017). The classical TerraceM mapping workflow consists of four main steps (Fig. 2A–C) (Jara-Muñoz et al., 2019, 2016): (1) preliminary mapping of the inner edges of marine terraces, identified at the slope break between the paleo-platform and paleo-cliff, within a Geographic Information System (GIS; e.g., QGIS®, Fig. 2A); (2) placement of swath-profile boxes perpendicular to the inner edges and verification of their positioning (Fig. 2B); the boxes are preferably located in areas with optimal terrace exposure, avoiding valleys, anthropogenic structures, and landslides; and (3) manual mapping of marine terraces along swath profiles (Fig. 2C). The mapping targets the shoreline angle, defined as the intersection between the terrace platform and the cliff, which marks the relative sea-level position at the time of formation (Jara-Muñoz et al., 2016; Lajoie, 1986). Although this mapping procedure follows logical steps and standardized criteria, certain aspects remain challenging to produce consistent outcomes, potentially leading to systematic errors.
The first step of the classical TerraceM workflow is the inner edge mapping (Fig. 2A), which can be straightforward if the operator has a basic knowledge on the morphology of marine terraces and GIS software. Usually, a slope model combined with an elevation colormap can help identifying the approximate position of the inner edges (Palamara et al., 2007), or a red relief image (RRIM, provided as a QGIS toolbox on http://www.terracem.com, last access: 5 April 2026) that highlights subtle topographic features (Chiba et al., 2008). A common issue when mapping the inner edge arises from the erroneous assignment to a terrace level, especially when age constraints are scarce. For example, in areas of intense coastal erosion and river incision, marine terrace exposures might be discontinuous, thus complicating the lateral correlation of terrace levels in the topography (e.g. Johnson, 1944; Cerrone et al., 2021). This is an important aspect, as the miscorrelation between marine terrace levels can affect the correspondence of shoreline-angle measurements to a specific sea-level position in the past and hence the estimated uplift rates.
To address these challenges, TerraceM-3 includes the module TerraceM_PreMAP (Fig. 3) that follows a systematic approach for checking and correcting the inner edge mapping process and lateral correlations. The module enables comparison between the mapped inner edges and an innovative variant of topographic profile display defined as “Stacked Swath”, which is based on stacked parallel profiles (de Gelder et al., 2022; Curveur, 2012; Armijo et al., 2015; Forte and Whipple, 2019). The stacked swath forms a structured 2D point cloud in distance-elevation space, where each point corresponds to a topographic measurement (Forte and Whipple, 2019). This approach enables the identification of low-slope areas (e.g., paleo-platforms) through increased point density and highlights zones of sharp slope change, such as at inner edge locations, along the coastal transect (See Sect. S1, Figs. S1 to S7 in the Supplement).
2.2 Increasing resolution of marine terrace mapping with TerraceM_PreMap at Cerro El Huevo
We tested TerraceM_PreMAP at Cerro El Huevo (Fig. 4A–C) on the Peruvian convergent margin, a site characterized by remarkably well-preserved and well-studied marine terraces (Hsu, 1988; Ortlieb and Macharé, 1990; Saillard et al., 2011; Hsu, 1992). The ridge subduction process and associated active deformation provide a challenging test site for evaluating the robustness and limitations of the TerraceM_PreMAP approach. In southern Peru the Nazca plate subducts obliquely (N79° E) beneath South American plate at 68–77 mm yr−1 (DeMets et al., 1990; Norabuena et al., 1998). This sector of the margin also involves the ongoing subduction of the Nazca Ridge (NR, Fig. 4A and B), which began near Ecuador ∼ 40 Ma and has since migrated southward (Bello-González et al., 2018). The marine terraces sequence at Cerro El Huevo consist of eight levels reaching ∼ 200 m a.s.l. that were deformed by the subduction of the NR (Fig. 4C) (Jara-Muñoz et al., 2019; Saillard et al., 2011; Hsu, 1992). The uplift distribution is notably asymmetric relative to the incoming NR bathymetry (Hsu, 1992), with the maximum uplift above its leading southern flank (Fig. 4B). As a result of the complex interplay of vertical displacements, eolian sediment transport, and erosion, some terrace levels exhibit limited lateral extent, providing a challenging setting to evaluate our lateral correlation method.
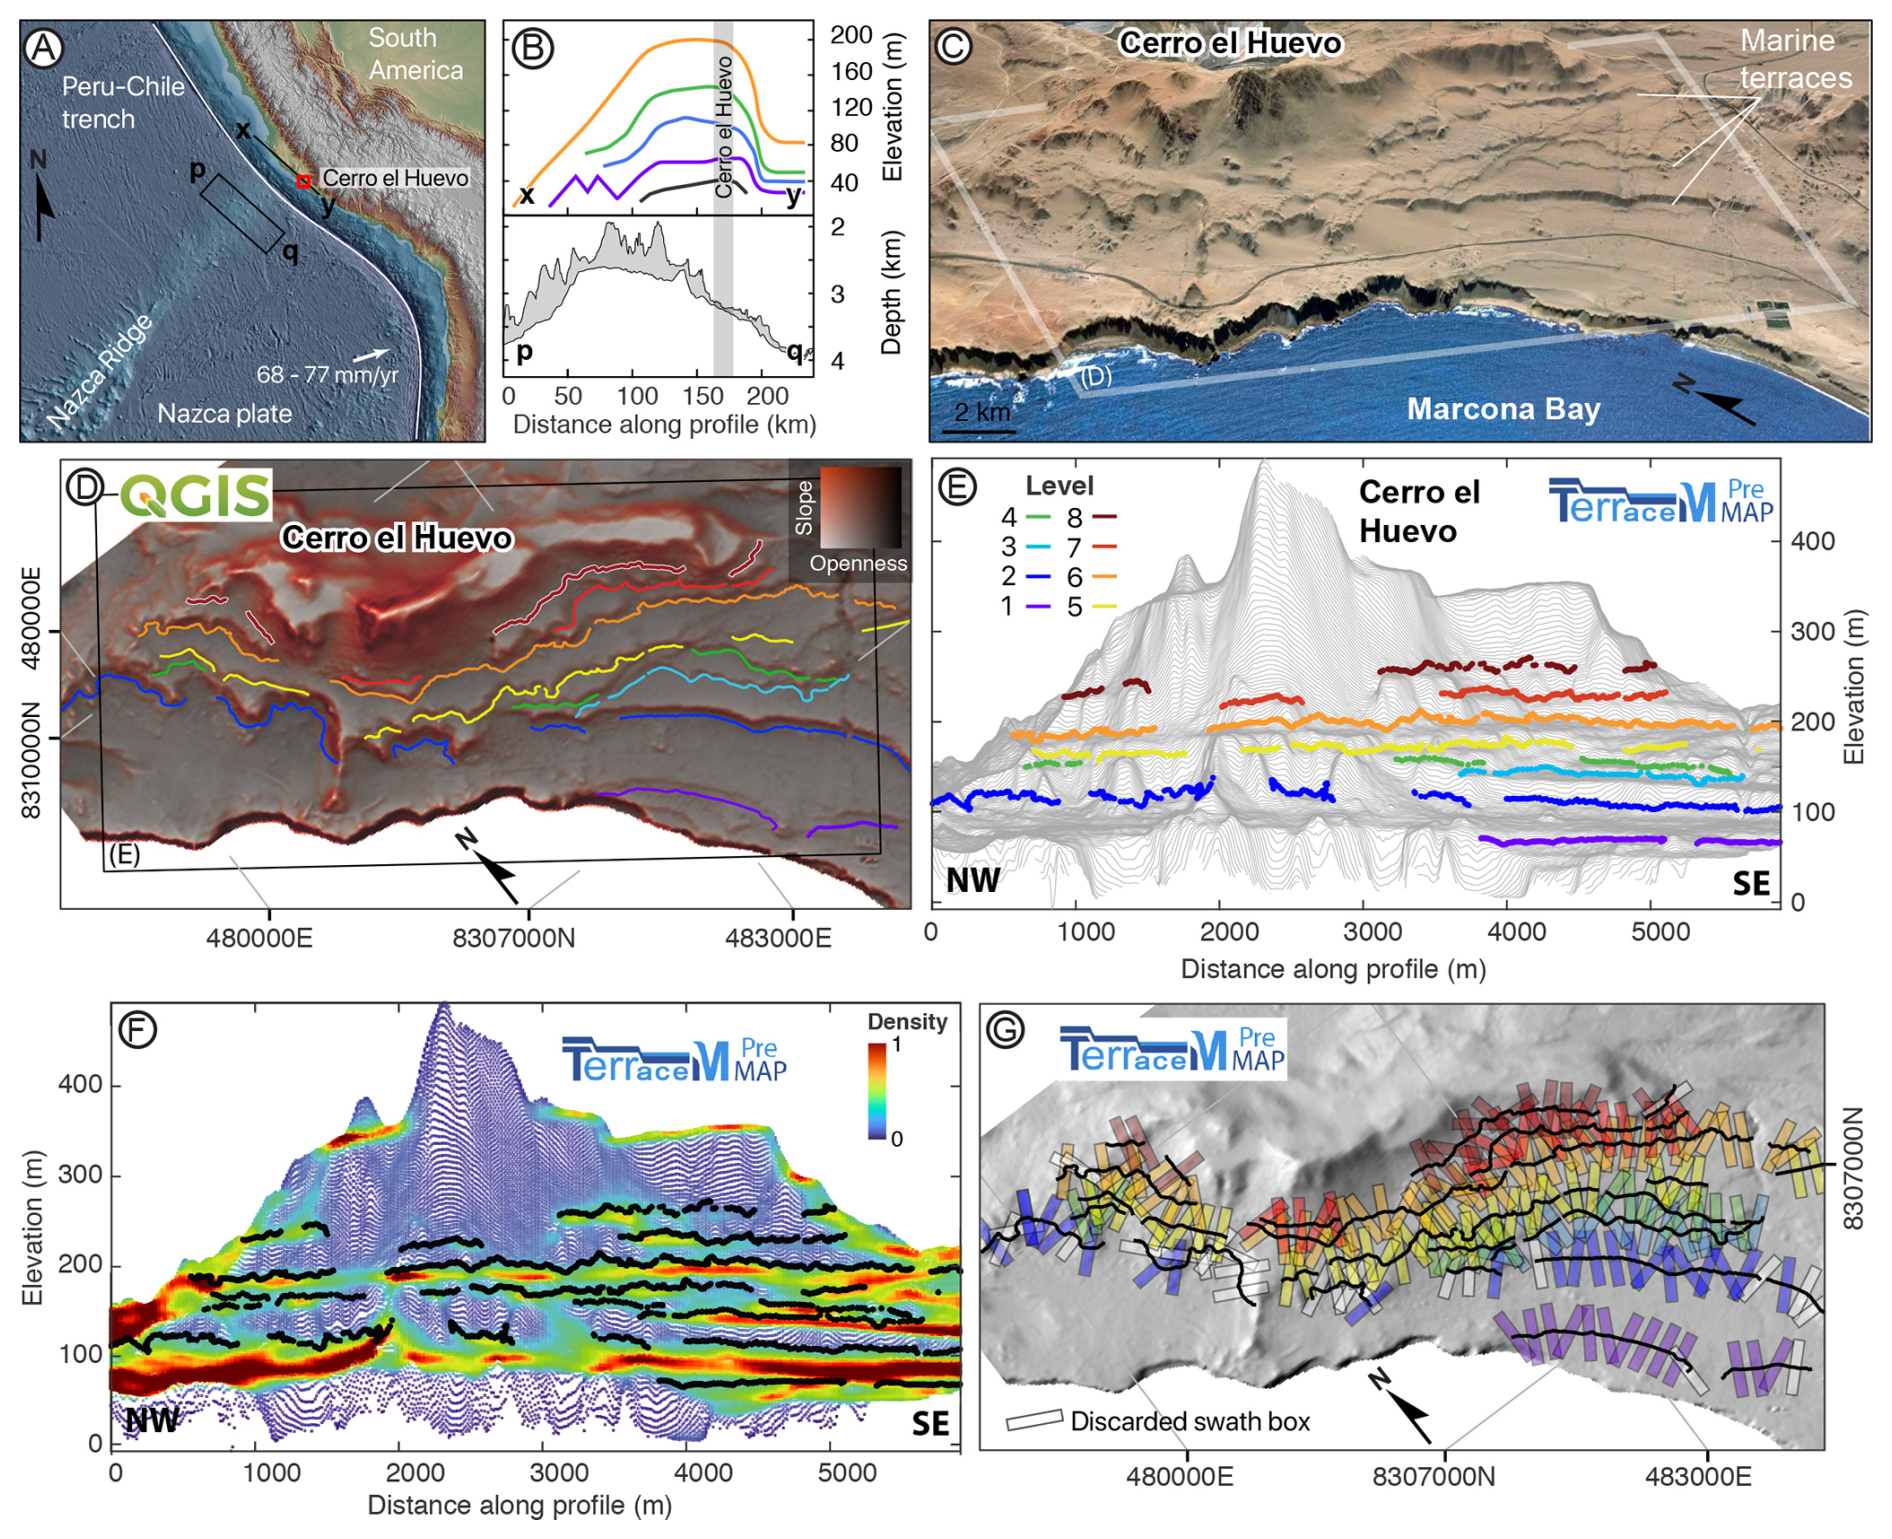
Figure 4Tectonic context of Cerro El Huevo and TerraceM_PreMAP workflow. (A) location of Cerro El Huevo and the Nazca Ridge. (B) Regional elevation patterns of marine terraces based on Hsu (1992) and bathymetric swath profile of the Nazca Ridge. (C) Digital 3D perspective based on Digital Globe® imagery of Cerro El Huevo and Marcona Bay in Southern Peru. (D) Inner edge mapping using a RRIM in QGIS. Inner edge colors represent marine terrace levels (legend in panel E). The black rectangle is the area used for the stacked swath profile in panel (E). (E, F) Joint visualization of inner edges and stacked swath profile, including lines and point density. (G) Automated extraction of swath boxes based on inner edges, manually discarded boxes in white, these boxes are then used to map the shoreline angles.
We mapped the approximate location of the inner edges of eight levels of marine terraces using a RRIM derived from the 12 m resolution TanDEM-X topography (Fig. 4D) provided by the Deutsches Zentrum für Luft- und Raumfahrt (DLR). We used the stacked swath to check the lateral continuity of the mapped inner edges levels along the coastal region (Fig. 4E–F). This procedure allows correcting miscorrelations, such as those between terrace levels 3 and 4, and the discontinuous exposures of levels 7 and 8 below the summit of Cerro El Huevo (Fig. 4D–F). Finally, we use the corrected inner edges to allocate the swath profiles boxes used to map the shoreline angles of each terrace level (Fig. 4G). Although the inner edges represent only the maximum estimate of the marine terrace elevation (Jara-Muñoz et al., 2016), we can preliminarily observe variations of tilt between marine terrace Levels 8–5 and 4–2 (Fig. 4E). The estimation of tilt angles is carried out later in Sect. 2.4, based on accurate shoreline angles measured with ML.
The variability in swath profile spacing, orientation, width, and length can introduce additional systematic errors in marine terrace mapping and measurement (Jara-Muñoz et al., 2016). To minimize these errors, TerraceM_PreMAP automatically generates swath profile boxes oriented perpendicular to the inner edge trace, with user-defined parameters such as width and spacing (Fig. 4D). Next, the swath boxes are manually revised in QGIS and those located in valleys or in areas with poor marine terrace exposure are excluded. The manual exclusion of swath boxes helps eliminate potential mapping errors and increases the precision of marine terrace mapping. For instance, along terrace level 2, of Cerro El Huevo, the stacked swath and the inner edge mapping reveals areas of scattered elevations. This variability reflects the accumulation of colluvial and eolian deposits at the inner edge. Based on these observations, swath boxes in covered areas and valleys were manually excluded (Fig. 4G).
2.3 Automated mapping of marine terraces using neural networks
In simple terms, the automated mapping uses trained neural networks to reproduce how an experienced operator identifies shoreline angles from terrace profiles. As indicated in Sect. 1.2 and Fig. 2, manual marine-terrace mapping is inherently subjective and depends on operator experience, profile quality, and geomorphic noise, which can lead to operator-dependent, non-systematic uncertainties. This subjectivity mainly affects the precision of marine terrace mapping. The goal of the machine-learning (ML) approach implemented in TerraceM-3 is to formalize the expert decision process and to reproduce expert-level shoreline-angle mapping in a consistent way. To achieve this, we use supervised ML algorithms based on artificial neural networks (NNs), which are trained to recognize patterns in data by learning from examples (Tang et al., 2020; Bishop, 1995). In our application, the NN is trained to take elevation-distance data extracted from swath profiles across marine terraces as input and to predict the corresponding shoreline-angle position as output. Thus, the NN does not introduce new geomorphic criteria, but learns to reproduce existing expert-based interpretations. In other words, the NN learns to mimic how an expert or experienced operator identifies shoreline angles from terrace profiles. The ML mapping is not designed to replace expert judgment, but to formalize expert knowledge into a tool that improves reproducibility of marine-terrace mapping.
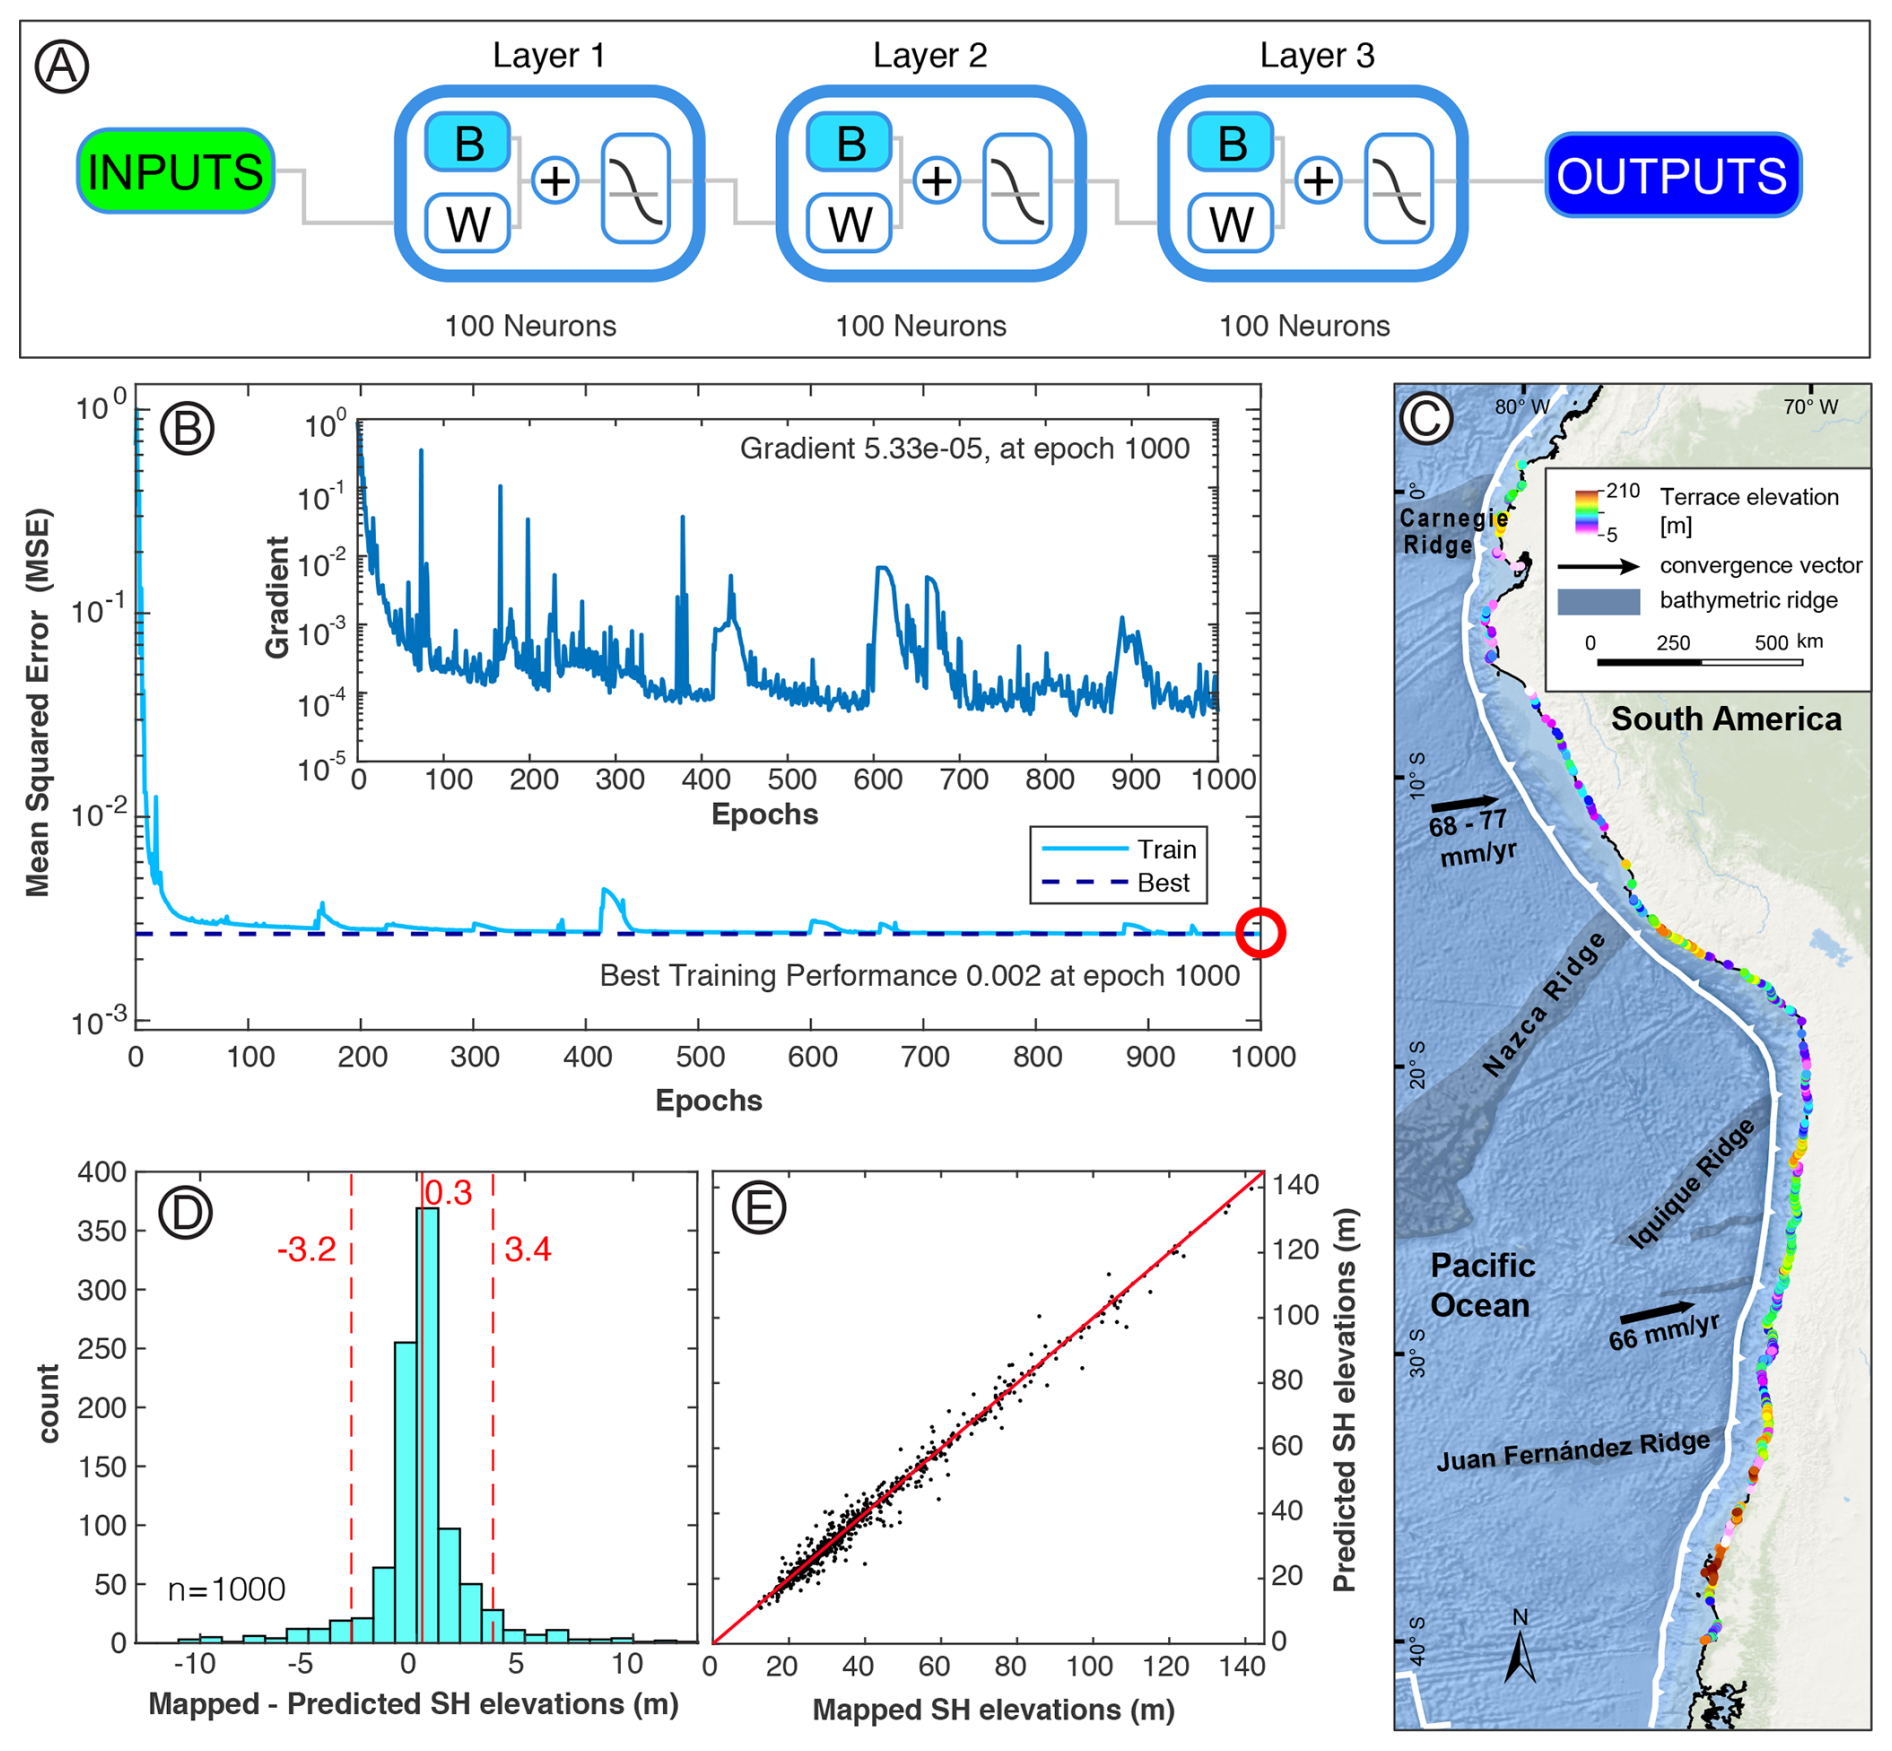
Figure 5Neural Network architecture, training and testing. (A) Neural network (NN) used for the automated recognition of paleo-platform and paleo-cliff segments. B and W represent bias and weights, respectively. The curve represents a sigmoidal function. (B) example of NN training showing variations in gradients and mean squared error (MSE); note the smooth decline of MSE and stabilization around epoch 600. (C) Training and testing data based on 2000 shoreline-angles mapped along South America (Freisleben et al., 2021). (D, E) NN test using the remaining 1000 shoreline-angles not used for NN training.
A NN consists of multiple layers of interconnected artificial neurons that simulate the way biological neurons process information (Wang, 2003) (Fig. 5A). Each neuron applies a simple mathematical operation to the input data, and the network combines many such operations to recognize complex patterns within terrace profiles. During training, the network is provided with input-output pairs, where the inputs are swath-profile data and the outputs are expert-mapped shoreline-angle positions (based on the selected paleo-platform and paleo-cliff segments, Fig. 2). Through multiple iterations, the network adjusts its internal weights to minimize the error between predicted and observed shoreline-angle elevations and thereby learns to recognize the geomorphic patterns associated with paleo-platforms and paleo-cliffs (Fig. 5B). This recursive learning process continues until a predefined stop-criterion is met, e.g. the number of learning epochs, or until the algorithm achieves a high level of accuracy on both the training data and unseen data.
Because the central property of NN's is their ability to generalize from training data it is essential to obtain a large and representative training dataset. The quality of this dataset is crucial for the NN performance and should be carefully filtered and classified before training (Kavzoglu, 2009). For this purpose, we use the continuous mapping of the last interglacial (MIS 5e) terrace along the coast of South America that comprises ∼ 2000 shoreline-angle measurements by an experienced operator (Fig. 5C) (Freisleben et al., 2021). After manual filtering, we split the data, selecting 1000 representative measurements for NN training and removing outliers and noise, while the remaining measurements were subsequently used for validation. The data consisted of distance/elevation data from swath profiles, paleo-cliffs and paleo-platforms and was normalized to a 0–1 scale (See Sect. S2). We trained two separate feedforward NNs, one for the paleo-cliff zone and another for the paleo-platform zone, reflecting the different geomorphic characteristics of these features. Each NN consisted of three hidden layers with 100 neurons per layer and a log-sigmoid activation function (Fig. 5A), a commonly used configuration that allows the network to capture non-linear relationships in geomorphic data. Training performance was evaluated using the mean squared error (MSE) and learning gradients, both dimensionless values (Fig. 5B). The MSE is used as loss function measuring the difference between measured and predicted outputs by the NN. The gradients represent the partial derivative of the loss function (MSE) with respect to model parameters and indicates the direction and magnitude of change needed to reduce the error (See additional information provided in Sect. S2). The MSE decreased rapidly during the first ∼ 30 epochs and stabilized around epoch 600 at MSE values of ∼ 0.002, indicating efficient learning and convergence. Most importantly, the overall MSE versus epoch learning curve was smooth and showed a clear trend, indicating efficient training (Fig. 5B).
We tested the trained NNs using independent shoreline-angle measurements that were not used for training (Fig. 5D, E). The resulting predictions show strong agreement with the manually mapped shoreline angles, with a mean elevation difference of ∼ 0.3 m, which is an order of magnitude lower than the ∼ 2.5 m mean shoreline-angle elevation uncertainty of the training data and negligible compared to natural terrain roughness. This indicates that the NN successfully reproduces expert-level shoreline-angle mapping. The trained NN was then implemented into an automated mapping tool within the TerraceM MAP module.
2.4 Quantifying collision of the Nazca Ridge with automatic mapping
We applied the automated shoreline-angle mapping to our study site at Cerro El Huevo, mapping the swath boxes automatically extracted by TerraceM_PreMAP (Fig. 4G). For a total number of 200 swath boxes, 26 boxes were excluded due to wrong orientation or placement on covered terrace areas. From the remaining 174 swath boxes 61 could not be mapped by ML due to the small topographic expression of the terraces and were excluded. By using only ML mapping, we obtained between 11 and 34 shoreline angles for each marine terrace level that follow the trace of the inner edges (Fig. 6A and B). Based on the dating of marine terraces carried by Saillard et al. (2011) and numerical modeling of marine terraces by Jara-Muñoz et al. (2019) we correlate the marine terrace levels with the interval of highstands between MIS 5c to MIS 13 (Fig. 6A). We extracted linear regressions using the shoreline angles of each terrace level to estimate the marine terrace tilt, corresponding to present-day finite (cumulative) tilt, i.e., the time-integrated angular deformation since terrace formation to the present (Fig. 6C). Then, the incremental tilt between two terrace levels was obtained from the difference between consecutive finite tilts, which isolates the tilt accumulated during the time interval separating two marine terrace levels (Fig. 6D). These incremental tilt values, together with the time interval between terrace levels, can be used to calculate the tilt rate variability along time (Fig. 6E).

Figure 6Distribution of shoreline-angle elevations, tilt angles and deformation mechanisms. (A) Shoreline-angle mapping overlapping a stacked swath and inner edges. Notice the coherence between inner edge level and shoreline angles. (B) Tilt estimates from linear regressions of shoreline angles across marine-terrace levels (n = number of shoreline angles). (C) Finite tilt estimated from linear regressions, representing cumulative deformation. (D) Incremental tilt is the difference between successive finite tilts, represents the deformation accumulated between terrace levels. (E) Tilt rate calculated as incremental tilt divided by the corresponding time interval. (F) Conceptual model using three time slices to explain changes in tilt angles: Slice 1: between MIS 13 and 7e Cerro El Huevo (CH) was located at the margin of the subsiding zone (northward tilt); Slice 2: between MIS 7e and 7a CH was near the hinge between uplift and subsidence (almost no tilt), the short-lived incremental tilt increase is attributed to crustal faults (See text for details); Slice 3: between MIS 7a and MIS 5c CH reached the flank of the uplifting bulge (southward tilt). NR: Nazca Ridge, NP: Nazca plate, SA: South American plate.
Interestingly, the finite and incremental tilt values display a change in the tilt angle and polarity between terraces in the sequence (Fig. 6B and C). For instance, the older marine terrace levels MIS 13–MIS 7e, display a NW tilt direction with incremental tilt angles varying between 0.02 and 0.37°. The marine terrace levels MIS 7e–MIS 7a display a slightly higher incremental tilt between 0.11 and 0.31, whereas the marine terrace levels MIS 7a–MIS 5c show a SE tilt direction with incremental tilt angles between −0.08 and −0.36° (Fig. 6B). This change in tilt polarity and magnitude is expected to result from changes in surface deformation linked to the subduction of the NR. As indicated in Sect. 2.2, the oblique convergence between Nazca and South America plates results in the southward migration of the NR at a velocity of 43 mm yr−1 (Hampel, 2002). On the other hand, Cerro El Huevo is located south of the indentation point of the NR and at the edge of the deformation bulge produced by the ridge subduction (Fig. 4B). According to Saillard et al. (2011), the NR flank slopes range between 0.15 and 0.55° which are comparable with the terrace tilt here documented. This setting makes Cerro El Huevo a sensible recorder of changes in vertical deformation linked to the position of the NR and its migration along the margin.
Our mapping of marine terraces along Cerro El Huevo coast using TerraceM-3 allows refining and better quantifying rates from the initial conceptual model proposed by Macharé and Ortlieb (1992) and Hsu (1992). In these models the subduction of the NR generates a bulge of deformation that bends the overriding plate upward. We propose that this bulge is flanked by areas of subsidence as a consequence of mass transfer during ridge migration. This model is similar to analog models of the NR subduction (Hampel et al., 2004) and numerical models of seamount subduction (Ruh et al., 2016). During the MIS 13 and 9 Cerro El Huevo was located at the edge of the subsiding area leading to northward tilting of the terrace sequence. The subsequent southward migration of the ridge positioned Cerro El Huevo at the hinge between uplift and subsidence, resulting in near horizontal marine terraces during MIS 7. As the ridge continued to migrate, Cerro El Huevo reached the leading flank of the uplifting bulge, causing a southwards tilt of the sequences between MIS 7 and MIS 5c. This interpretation is supported by modeled subsidence rates of ∼ −0.2 m ka−1 for MIS 13 and 11 at Cerro El Huevo, which progressively increased to 0.8 m ka−1 until MIS 5c (Jara-Muñoz et al., 2019). Moreover, considering the southward migration rate of 43 mm yr−1 for the NR over the past 5 Ma (Hampel, 2002), the observed change in tilt polarity between MIS 13 and MIS 5c would require ∼ 20 km of southward ridge displacement (Fig. 6C). This is approximately the distance between Cerro El Huevo and the limit of the uplift bulge documented by Hsu (1992) and Macharé and Ortlieb (1992) (Fig. 4B). On the other hand, immediately prior to the polarity change, between MIS 7a and 7c, we observe an increase in incremental tilt and tilt rate. This short-lived acceleration is difficult to reconcile with a simple model of progressive southward NR migration, which would predict a gradual and long-wavelength tilting signal. We suggest instead that this pulse reflects transient activity along local upper-plate faults, including the Tres Hermanas, Lomas, and El Huevo faults, which are known to offset several terrace levels at the Cerro El Huevo region (Saillard et al., 2011). The fault slip acceleration may have been triggered by changes in regional stress associated with the southward displacement of the NR and its deformation bulge, and it coincides with the fault-slip acceleration from 0.4 to 0.8 m ka−1 documented by Saillard et al. (2011) since MIS 7e.
These results provide, for the first time, quantitative estimates of marine-terrace tilting in the Cerro El Huevo area and link changes in tilt polarity to the subduction and migration of the Nazca Ridge. They also demonstrate the importance of high-resolution, accurate shoreline-angle mapping for resolving subtle variations in terrace elevations that are critical for constraining the underlying deformation mechanisms.
2.5 Automated mapping using ICESat-2 altimetry data
The resolution of a digital topography dataset can strongly influence the accuracy of marine terrace mapping. However, the availability of high-resolution topography is scarce and limited to specific areas. Nevertheless, the satellite mission Ice, Cloud, and land Elevation Satellite-2 (ICESat-2, NASA's Earth observation program) offers open access to global scale data with characteristics similar to high-resolution LiDAR topography (Markus et al., 2017). The mission was launched in September 2018, recording to date more than three trillion laser pulses in almost 65 000 h of operation (7.5 years). The satellite carries the Advanced Topographic Laser Altimeter System (ATLAS), a photon-counting system designed to measure surface elevation with centimeter-level accuracy (Field et al., 2020). Originally developed to monitor ice sheet dynamics and sea ice, ICESat-2 also provides valuable topographic data for terrestrial and coastal environments (Abdalati et al., 2010; Jasinski et al., 2021; Markus et al., 2017). The satellite follows a near-polar, sun-synchronous orbit, enabling consistent global coverage. ICESat-2 provides a 2D high-resolution along-track sampling, with photon returns spaced approximately 20 cm, allowing for detailed bare-earth elevation profiling and making it particularly useful for analyzing geomorphic features such as marine terraces. However, the complexity of data products, structures, and the programming knowledge required for bulk download, filtering and processing makes this data difficult to use.
TerraceM-3 includes a user-friendly GUI to facilitate the selection, download, and processing of ICESat-2 data (Fig. 3, See Sects. S3 and S4, Figs. S8 to S27). The download functionality of TerraceM ICESat-2 is built on python and html languages linked to MATLAB®, enabling efficient data retrieval from the Harmony online servers allowing cloud data subsets. Once downloaded, the data is processed using the built-in h5read function of MATLAB®, alongside a set of custom TerraceM scripts created to extract orbital and geolocation parameters. To extract the profiles, two ICESat-2 data products are utilized: ATL03 (geolocated photon data) and ATL08 (canopy and ground classification). ATL03 provides raw photon elevations, while ATL08 contains the photon classification into different surface types, enabling the isolation of ground points and the generation of bare-earth topographic profiles. The ATL08 classification is generated during NASA's data preprocessing and is based on photon denoising and low-pass filtering along 20 m segments to separate ground returns from canopy signals (See Sect. S3). Furthermore, the TerraceM ICESat-2 module creates lightweight structured datasets, at least ∼ 20 % of the original data size and easy to manipulate in MATLAB®, which can be helpful when data storage is limited. One limitation of the TerraceM_ICESat-2 module arises from the predominantly N-S ground tracks of the ICESat-2 satellite. As a result, marine terraces along coastlines oriented roughly E–W are most suitable for mapping, since this geometry provides profiles perpendicular to the terrace inner edges. A further limitation is memory demand, as downloading and processing areas larger than ∼ 40 km2 may exceed the capacity of standard desktop computers (∼ 32 GB RAM). For this reason, the tool is best applied to local areas or site-specific studies. Nevertheless, beyond the standard GUI, TerraceM_ICESat functions can be accessed individually, enabling operators to develop custom scripts and adapt the processing workflows, thereby providing flexibility and overcoming memory limitations.
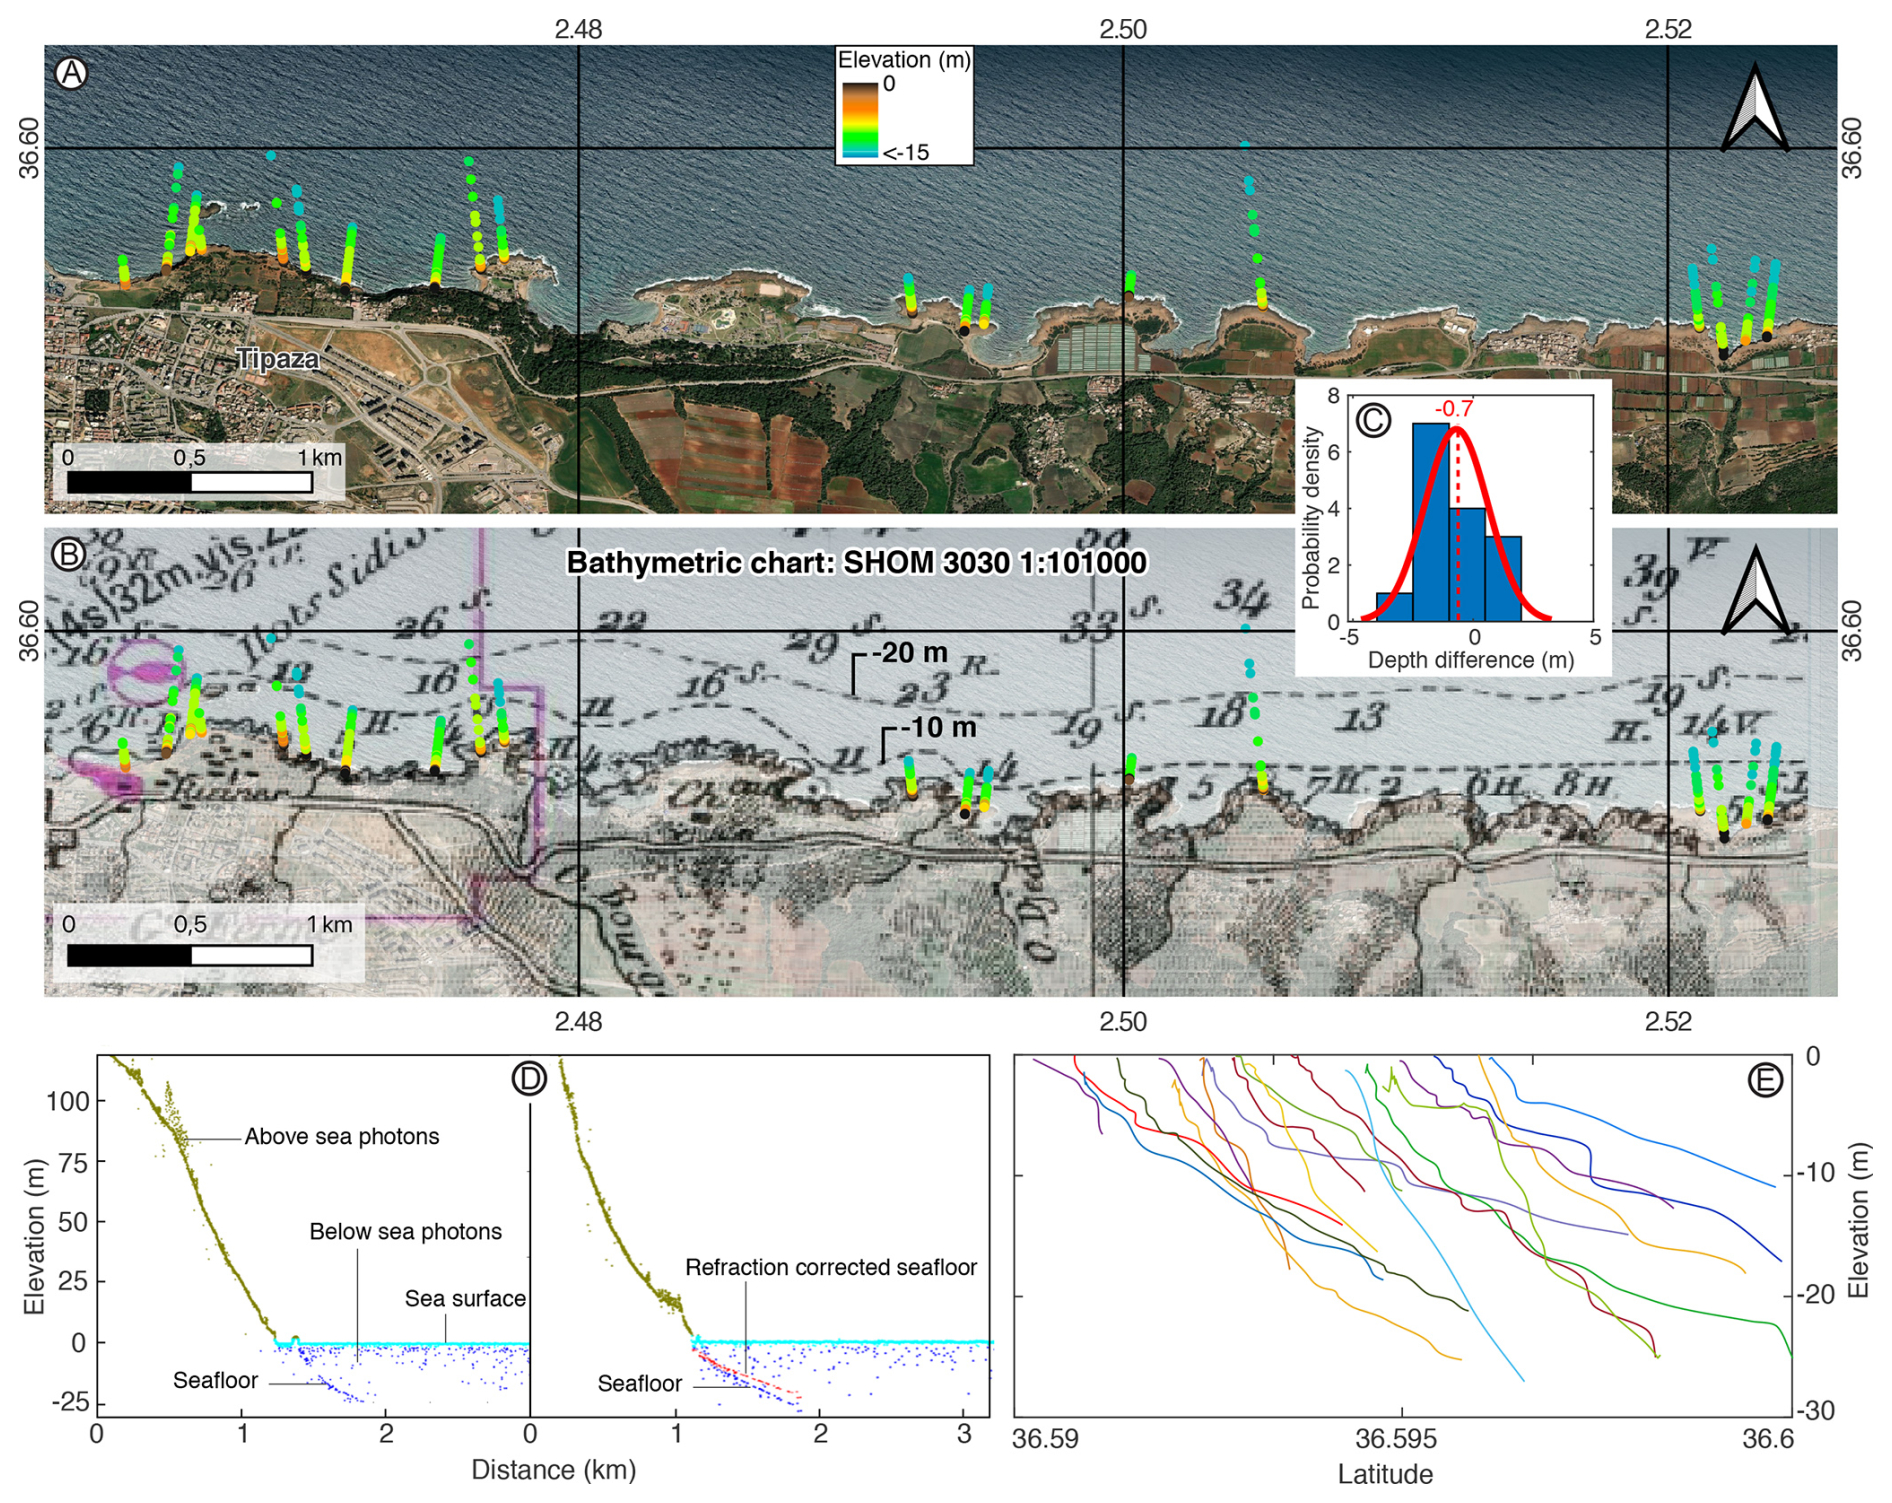
Figure 7Example application of the TerraceM ICESat-2 bathymetric module at the locality of Tipaza, Algeria. (A) Location of the 19 ICESat-2 photon profiles used for bathymetry extraction. (B) Bathymetric chart SHOM 3030 used to compare bathymetry estimates. (C) Histogram and normal probability distribution of the differences between the 10 m bathymetric contour line and the ICESat bathymetry. The mean difference is 0.7 m. (D) Example of automatically classified profiles and the clear delineation of the seafloor, which is afterwards corrected by water diffraction to obtain a bathymetric profile. (E) Stacked bathymetric profiles displaying the seafloor morphology and the maximum depth reached by photons. Panel (A) uses open BING® imagery as background.
Additionally, TerraceM ICESat-2 allows estimating shallow coastal bathymetry (Figs. 3 and 7), useful for extending marine terrace mapping offshore and to analyze the hydrodynamic processes controlling coastal erosion at present-day. The new module uses ATL03 photon data identifying water-penetrating photons up to ∼ 40 m depth in low turbidity conditions. Water-refraction corrections based on the method proposed by Parrish et al. (2019) and Ranndal et al. (2021) are used to account for changes in photon trajectory driven by density variations from air to water. The topographic and bathymetric analysis scripts are incorporated into TerraceM-3, including a graphical user interface (GUI) encoded in MATLAB® (TerraceM ICESat-BAT) and separate functions for customized coding outside the GUI. Furthermore, the bathymetric profiles of TerraceM ICESat-BAT are exported in TerraceM format, which can be integrated into the TerraceM ICESAT-2 mapping workflow, thereby extending the mapping to drowned marine terraces using ML or manual methods. To demonstrate the applicability of the TerraceM ICESat-2 bathymetry module, we conducted an analysis along the Algerian coast near Tipaza, where bathymetry was extracted along 19 profiles (Fig. 7A–E). Each profile was automatically classified into above- and below-sea-surface photons, then the seafloor was extracted manually. Water-refraction corrections were then applied to obtain the final bathymetric profiles (Fig. 7D). Most profiles reached depths of 15–25 m below sea level, largely due to local water turbidity, which reduces photon penetration at greater depths (Fig. 7E).
To evaluate the accuracy of the ICESat-derived bathymetry, we compared the results with available regional bathymetric charts. East of Tipaza, detailed local bathymetric data are scarce and primarily available at regional scales. For this comparison, we used the 1 : 101 000 bathymetric chart SHOM 3030 (Service Hydrographique et Océanographique de la Marine, France), originally surveyed between 1867 and 1868, revised in 1928, and geodetically corrected in 2025 (Mouchez, 1928) (Fig. 7B). The chart was georeferenced and used to calculate depth differences between the −10 m isobath and the ICESat-derived bathymetry, yielding differences between −3.0 and +1.8 m and a mean value of 0.7 m (Fig. 7C). The origin of the 0.7 m difference cannot be uniquely determined and may reflect uncertainties in the ICESat measurements, limitations related to the scale and historical nature of the reference chart, uncertainties associated with geodetic corrections, potential errors in contour-line interpolation, changes in coastal erosion or sedimentation patterns since the original survey, or vertical crustal movements. Despite these uncertainties, the mean offset of 0.7 m falls within the precision acceptable for geomorphic and coastal analyses (e.g. Rovere et al., 2017; Misra and Ramakrishnan, 2020), supporting the applicability of the TerraceM ICESat-BAT approach.
2.6 Deciphering deformation gradients along the Sahel Ridge in Algeria using ICESat-2 altimetry and automated mapping
We selected the marine terraces at Sahel Ridge, NE Algeria, which exposes a staircase sequence of more than seven levels of marine terraces and provides excellent conditions to test the TerraceM-ICESat mapping workflow; this example is intended as a benchmark and validation exercise for the TerraceM ICESat tool. The marine terraces and rasas extend for more than 150 km between Tipaza and Algiers and comprise upper Pre- and co-Messinian and lower post-Messinian marine terraces, which ages range from Late Miocene to Late Pleistocene respectively (Authemayou et al., 2017). The marine terrace elevations reflect the deformation produced by the convergence between the African and Eurasian plates at 4–6 mm yr−1 (Nocquet and Calais, 2004), which has resulted in crustal compression since the late Miocene driving reverse faulting and folding, such as the Sahel ridge and various blind reverse faults offshore (Yelles et al., 2009; Strzerzynski et al., 2010) (Fig. 8A). This area is seismically active, characterized by historic and recent strong magnitude (Mw > 6) tsunamigenic earthquakes (Meghraoui et al., 1988; Harbi et al., 2007; Maouche et al., 2011) (Fig. 8A).
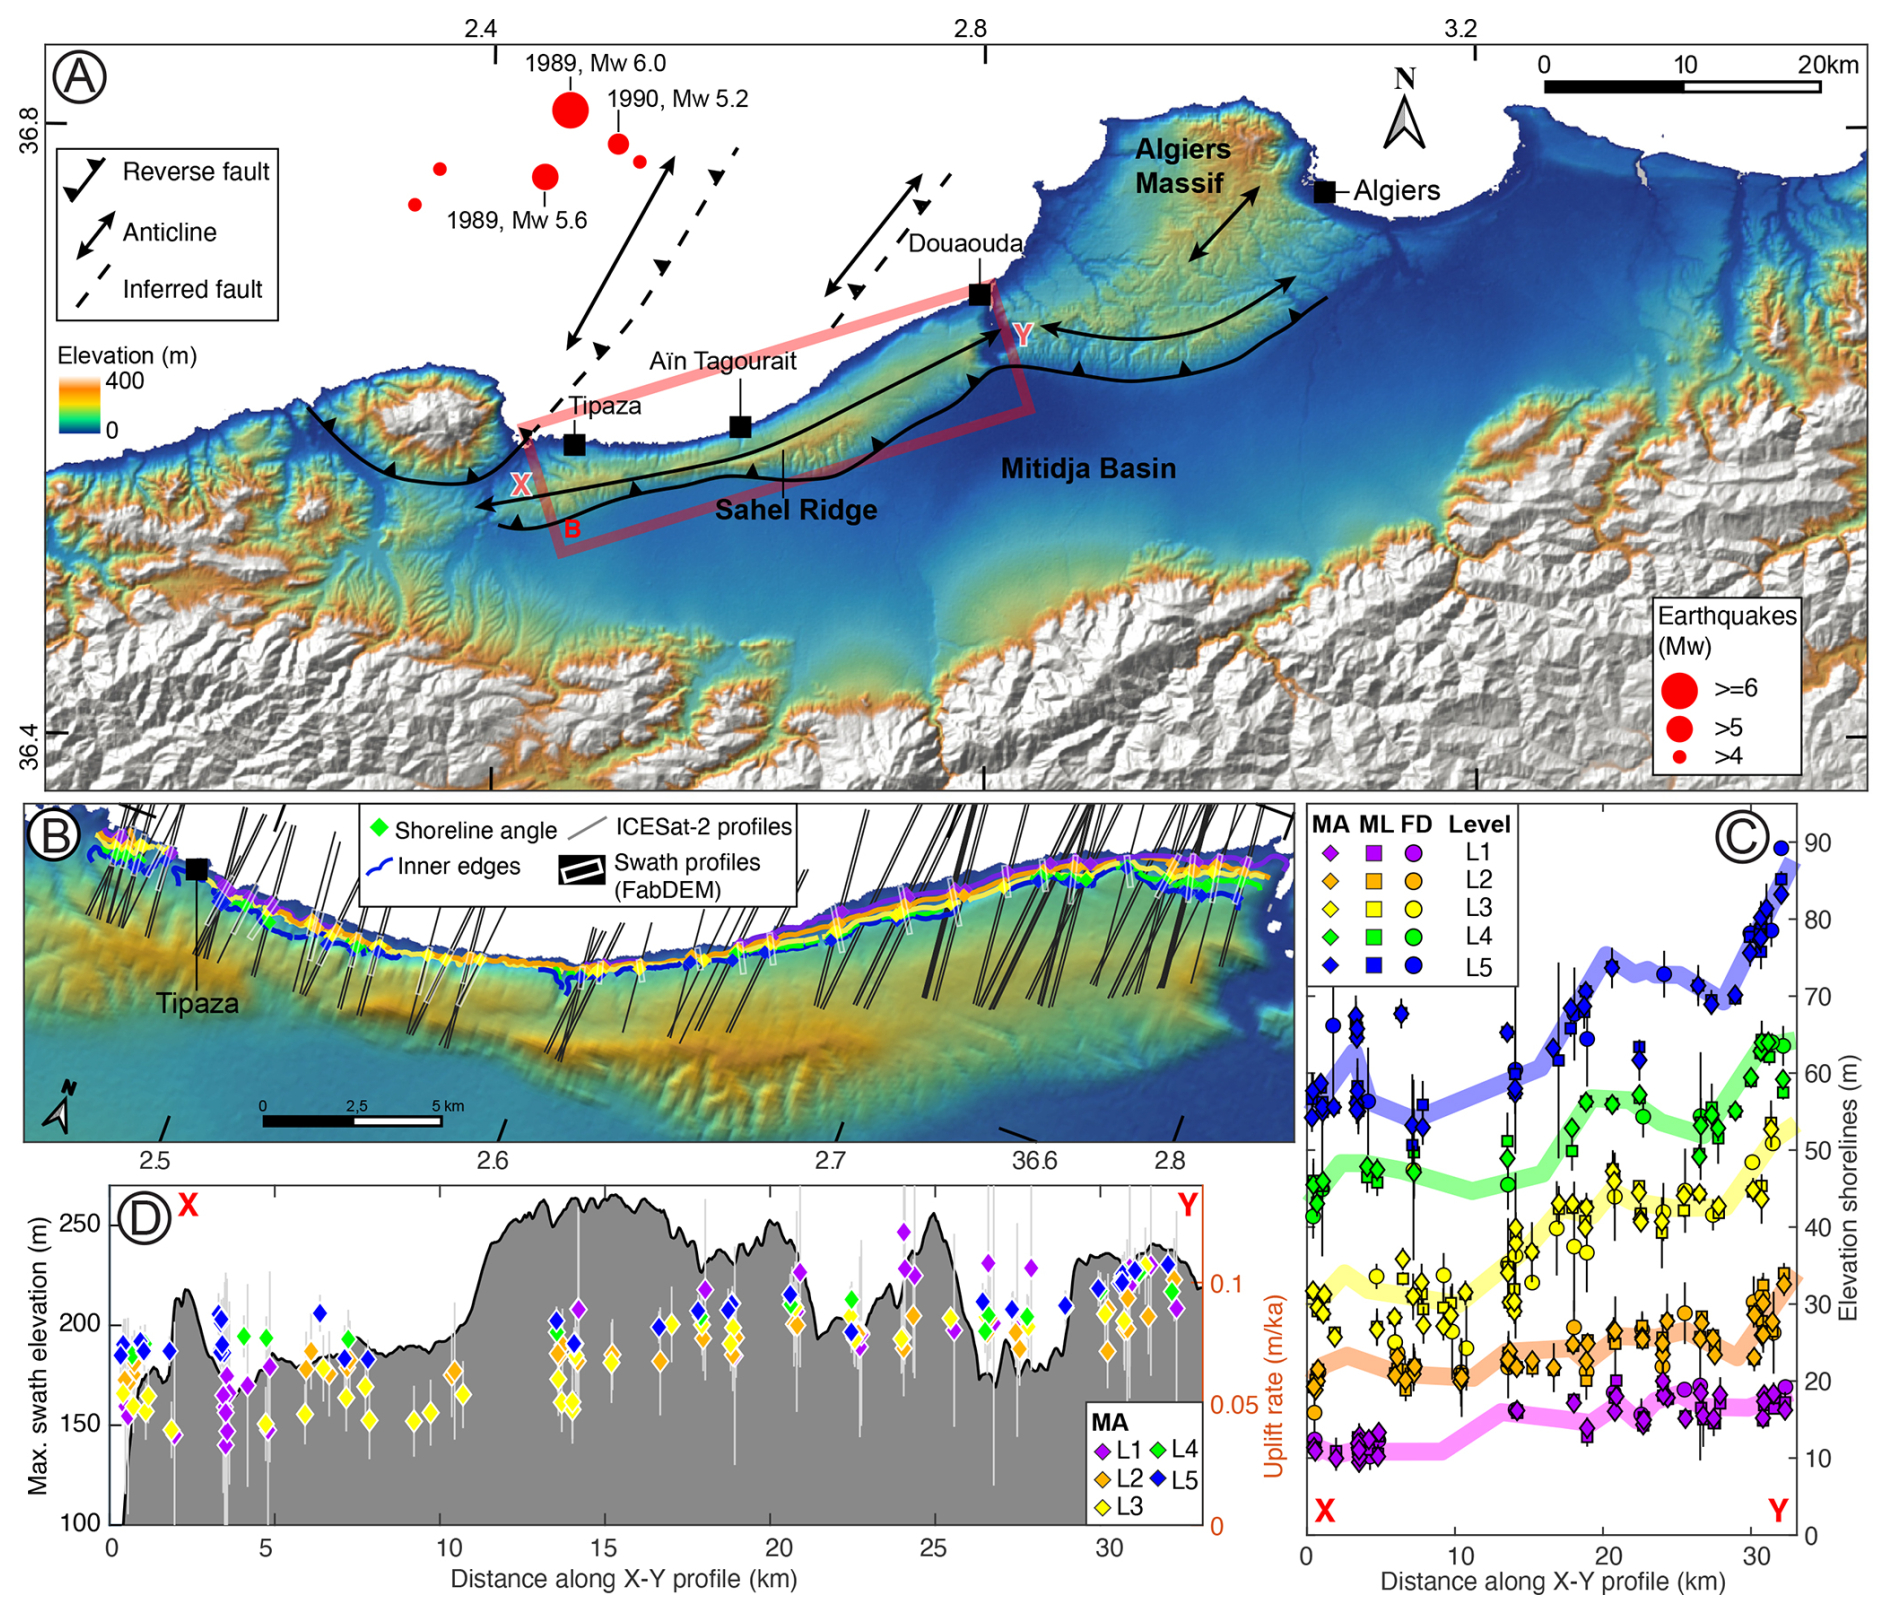
Figure 8Tectonic setting of NE Algeria and marine terraces. (A) Tectonics of the Sahel Ridge area (based on Maouche et al., 2011; Authemayou et al., 2017). Red dots denote > Mw 4 to ≥ Mw 6 earthquakes. (B) Marine terraces between Tipaza and Douaouda; the colored dots represent the shoreline angles mapped using ICESat-2 photon profiles (grey lines). (C) Marine terrace elevations projected along the profile X-Y indicated in panel (A). (D) Uplift rates and maximum topography along the X-Y swath profile indicated in panel (A). MA: Manually mapped shoreline angles using ICESat-2 profiles. ML: Shoreline angles mapped using machine learning and ICESat-2 profiles. FD: Manually mapped shoreline angles using 30 m resolution FABDEM topography.
We studied a 33 km-long segment of the marine terraces between the cities of Tipaza and Douaouda (Fig. 8A and B), an area of well-studied and dated marine terraces in E-W orientation, ensuring ICESat-2 profiles are almost perpendicular to the terraces. The marine terraces have been carved on the northern flank of the Sahel ridge (Lamothe and De, 1911; Aymé, 1952; Glangeaud, 1932; Saoudi, 1985). This structure has been interpreted as an anticline associated with a north-dipping blind thrust that bounds the southern edge of the Sahel ridge (Meghraoui, 1991; Maouche et al., 2011; Heddar et al., 2013). We focus on the lower (post-Messinian) marine terraces formed between MIS 11 and MIS 5e (Authemayou et al., 2017). The lowest terraces were dated using U-Th, resulting in ages between MIS 5e and the Holocene, whereas the upper terraces remain undated with inferred ages of MIS 11 and older (Authemayou et al., 2017; Maouche et al., 2011). To test the accuracy and precision of the new TerraceM ICESat-2, we mapped the post-Messinian marine terraces using three methods: manual mapping using 30 m per pixel FABDEM Forest And Buildings removed Copernicus DEM (FD) topography (Uhe et al., 2022), manual mapping (MA), and machine-learning (ML) mapping, both using ICESat-2 vegetation-filtered topographic profiles. We emphasize that this analysis is not intended to redefine the levels or chronology of the marine terraces, but rather to test the performance of TerraceM-ICESat. Therefore, the chronological assignment of terrace levels to sea-level highstands and the assumption of constant uplift rates are interpretative choices that follow the framework of Authemayou et al. (2017).
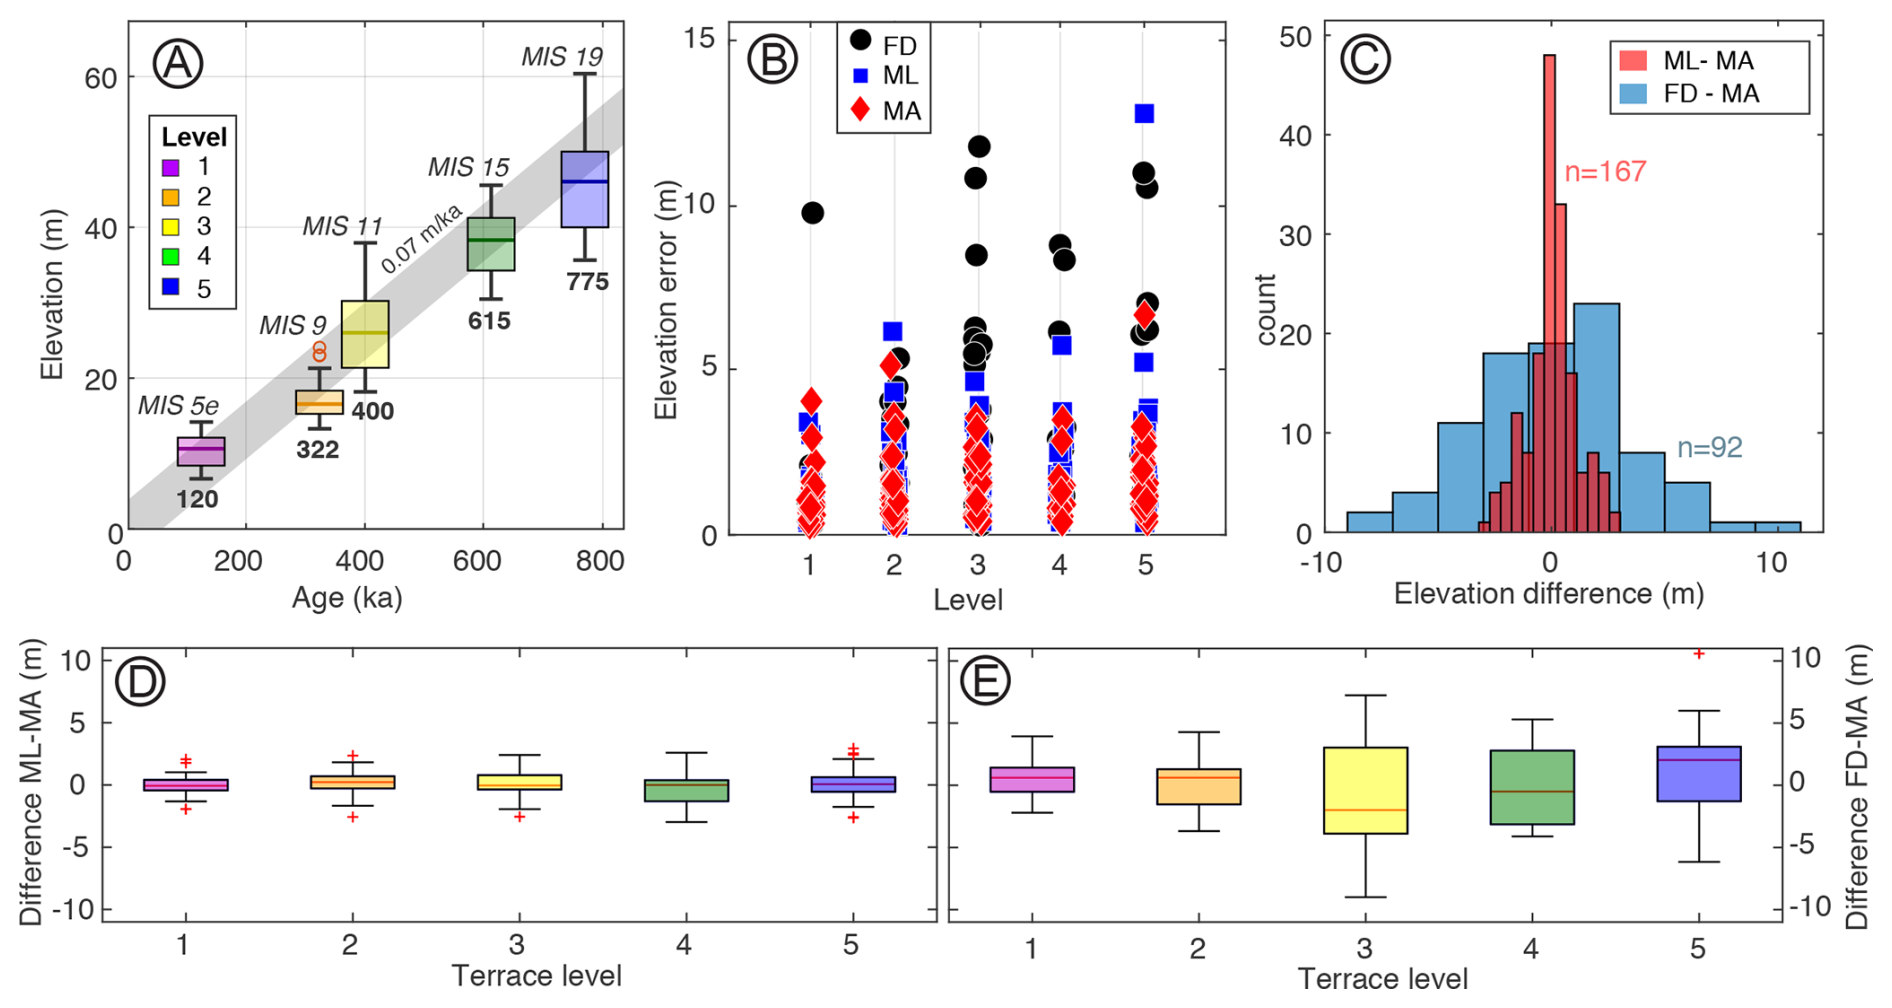
Figure 9Statistics of different shoreline-angle mapping methods applied along the Sahel Ridge, NE Algeria. (A) Shoreline-angle elevations versus marine terrace ages. Age assignments for levels 1–3 follow Authemayou et al. (2017), while the ages of levels 4 and 5 are based on the extrapolation of uplift rate. (B) Shoreline-angle elevation errors for each mapped shoreline, note the higher errors for shoreline angles mapped using FABDEM (FD). (C) Distributions of elevation differences between manually (MA) and machine-learning (ML) mapped shoreline-angles using ICESat-2 profiles, and between FABDEM and ICESat-2 manual mapping (FD-MA). Notice the higher dispersion of the results based on FABDEM mapping. (D) Boxplots showing the difference in elevations between machine-learning and manual mapping both using ICESat-2 profiles. (E) Boxplots showing the difference in elevations between FD and MA shoreline angles.
Our results are consistent with the marine terrace elevation estimates of Authemayou et al. (2017) for the same area; furthermore, terrace elevations show an eastward increase comparable to that described in their study (Fig. 8C). We follow the nomenclature and chronology used by these authors, correlating level 1 with MIS 5e (120 ka), level 2 with MIS 9 (322 ka), and level 3 with MIS 11 (400 ka). From this correlation, we derive a mean uplift rate of 0.07 m ka−1, close to the mean 0.06 m ka−1 estimated by Authemayou et al. (2017). Assuming constant uplift, we assign levels 4 and 5 to MIS 15 and MIS 19, with ages of 615 and 775 ka respectively by assuming a constant uplift rate of 0.07 m ka−1 (Fig. 9A). The highstand ages and sea-level positions used in this assessment were based on the sea-level curves of Bintanja et al. (2005) and Spratt and Lisiecki (2016).
The marine terraces between Tipaza and Aïn Tagourait record a stable uplift rate of about 0.06 m ka−1, gradually increasing eastwards to ∼ 0.12 m ka−1 near Douaouda (Fig. 8D). The distribution of uplift rates shows some scatter; for example, near Tipaza, level 1 exhibits broad variability in urbanized areas due to anthropogenic modification of the topography. In addition, uplift rates associated with level 1 are slightly higher than those of the other levels, suggesting an uplift acceleration since MIS 5e, consistent with the observations of Authemayou et al. (2017). Interestingly, the deformation pattern approximately mimics the maximum topography of the Sahel Ridge, indicating a possible relationship between the long-term anticlinal growth and coastal uplift (Fig. 8D).
The mapping of the Sahel Ridge terraces yielded broadly consistent results across methods, though with different levels of precision and accuracy. Elevation errors (Ze) of individual shoreline angles are larger when using FD mapping compared to MA and ML approaches using ICESat-2 profiles. This difference reflects the much higher resolution of ICESat-2 data (point spacing 10–30 cm) relative to the 30 m per pixel FABDEM resolution, which better captures slope gradients and allows clearer identification of paleo-cliffs. To evaluate accuracy and precision, we compared elevation differences between methods for each mapped shoreline angle. Shoreline angles obtained using FD have a lower precision (greater dispersion) than those from ICESat-2, with maximum differences of ±10 and ±3 m, respectively (Fig. 9C–E). Comparisons between MA and ML mapping on ICESat-2 profiles reveal only minor differences between mean values (0.2–0.4 m), with ML values slightly underestimated. In contrast, comparisons involving MA and FD yield mean differences of up to 3 m, underscoring the lower accuracy of FD shoreline-angle mapping.
ML and MA mapping produce both very similar results, which indicate that ML is able to perform like an expert operator. This similarity highlights the need to clarify the added value of using ML when results are comparable to MA. The added value of TerraceM-3 and the ML-based approach does not lie in producing different terrace measurements, but in providing results that are comparable to those of expert operators. As previously explained, manual mapping is inherently operator-dependent and affected by operator experience, learning curves, and subjective decisions. Thus, differences in operator experience may lead to non-systematic errors and uncertainties that are difficult to quantify. The ML-based approach provides stable and repeatable outputs that are independent of operator experience.
This final section provides the conceptual and experimental foundation for the machine-learning component of TerraceM-3 by examining how inexperienced operators acquire expertise in marine terrace mapping and how their performance converges toward that of an experienced operator. We demonstrate that the cognitive sequence of recognition, evaluation, and decision-making can be formalized and directly translated into automated algorithms, providing the basis for machine-learning tools that reproduce expert mapping criteria while broadening the accessibility of marine terrace analysis to the scientific community.
It has always been a challenge to make machines replicate the qualitative aspects of the human decision process (e.g. Peterson et al., 2021). For instance, a human operator relies on sensory input, experience, and information processing to control a machine. Similarly, operators use their perception and experience to observe and interpret the results produced by machines. These machine operations form a cycle of human-machine interactions (Farhan Hussain et al., 2023). The communication and exchange between a human and a machine are facilitated through a user interface (Georga et al., 2018), which enables the operator to efficiently visualize sensed quantities and input commands to control the machine. Analogous to the above relationships, TerraceM represents the machine, while the marine terrace mapping tool represents the user interface.
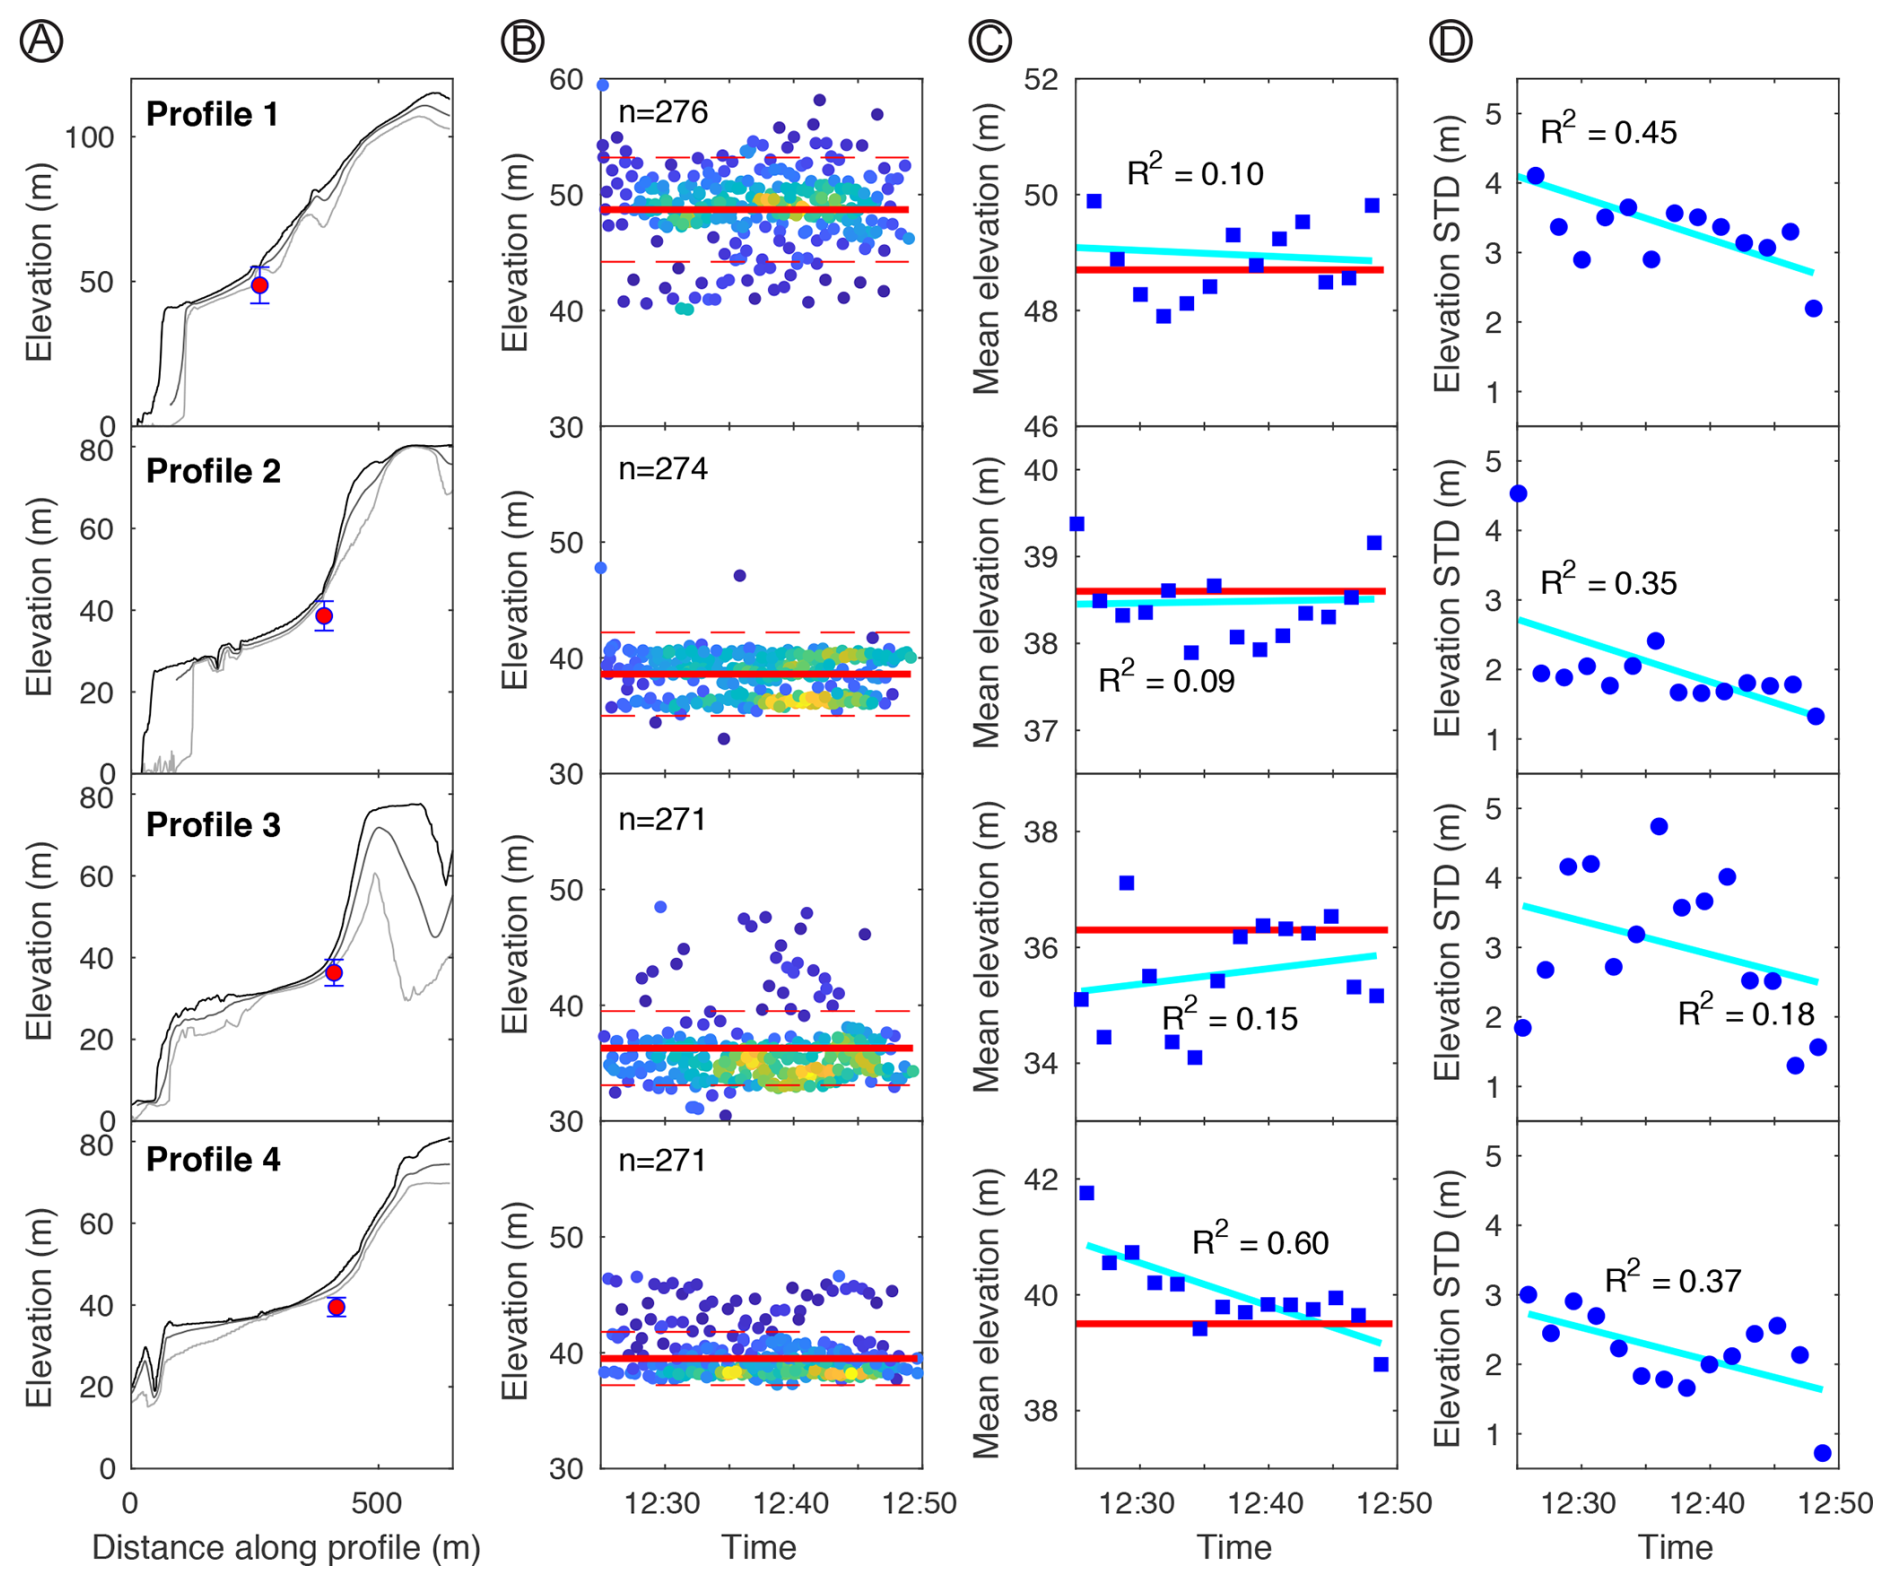
Figure 10Shoreline-angle mapping experiment. (A) Four topographic swath profiles used in the experiment. The red point is the shoreline angle mapped by an experienced operator. (B) Shoreline-angle elevations mapped by nine students during the experiment (n: number of measurements). (C, D) Evolution of shoreline-angle mapping elevations and dispersion during the experiment, the blue squares and dots are calculated by binning measurements every 2 min. The light blue lines in panels (C) and (D) are linear regression with their corresponding goodness of fit (root mean squared error, R2). Red lines in panels (B), (C) and (D) are the shoreline-angle elevations mapped by an experienced operator.
To study the factors controlling human-machine interaction in the classical TerraceM mapping tool, we carried out an experiment with nine geology students from the University of Potsdam, who had no previous experience with the software. They were asked to map four marine terrace profiles in a loop (Fig. 10A). Each operator performed the mapping for 25 min, yielding a total of 1094 shoreline-angle measurements. The 25 min duration was chosen to obtain enough measurements (on average ∼ 120 per operator), while avoiding fatigue or distraction during the task.
The results show that the dispersion of shoreline-angle measurements, calculated in 2 min time bins and expressed as the standard deviation, progressively decreased over the course of the experiment (Fig. 10B and D). This reduction in variability indicates a gradual improvement in operator consistency as mapping skills developed. Likewise, the mean elevation of the mapped shoreline angles converged toward the reference elevation previously defined by an experienced operator (red line in Fig. 10C), demonstrating a clear learning trajectory. At the beginning of the experiment, the limited experience of participants in identifying marine terrace morphologies produced large deviations in shoreline-angle estimates, particularly in sectors where terrace boundaries were poorly defined or affected by topographic artifacts. With increasing time, however, operators displayed improved recognition, resulting in more stable and accurate outputs.
These results provide quantitative evidence of a learning curve in manual terrace mapping, in which cognitive pattern recognition and decision-making progressively align with expert-level interpretation. The observed convergence toward expert reference values highlights that terrace-mapping accuracy is not solely dependent on data quality but also on the capacity to identify subtle morphological signals through experience. Importantly, this learning process can be formalized and replicated computationally: the sequence of recognition, evaluation, and classification steps performed by trained operators has been translated into the machine-learning algorithms of TerraceM-3, capable of identifying the paleo-cliff and paleo-platform segments automatically, mapping the shoreline angles with precision comparable to that achieved by an experienced operator.
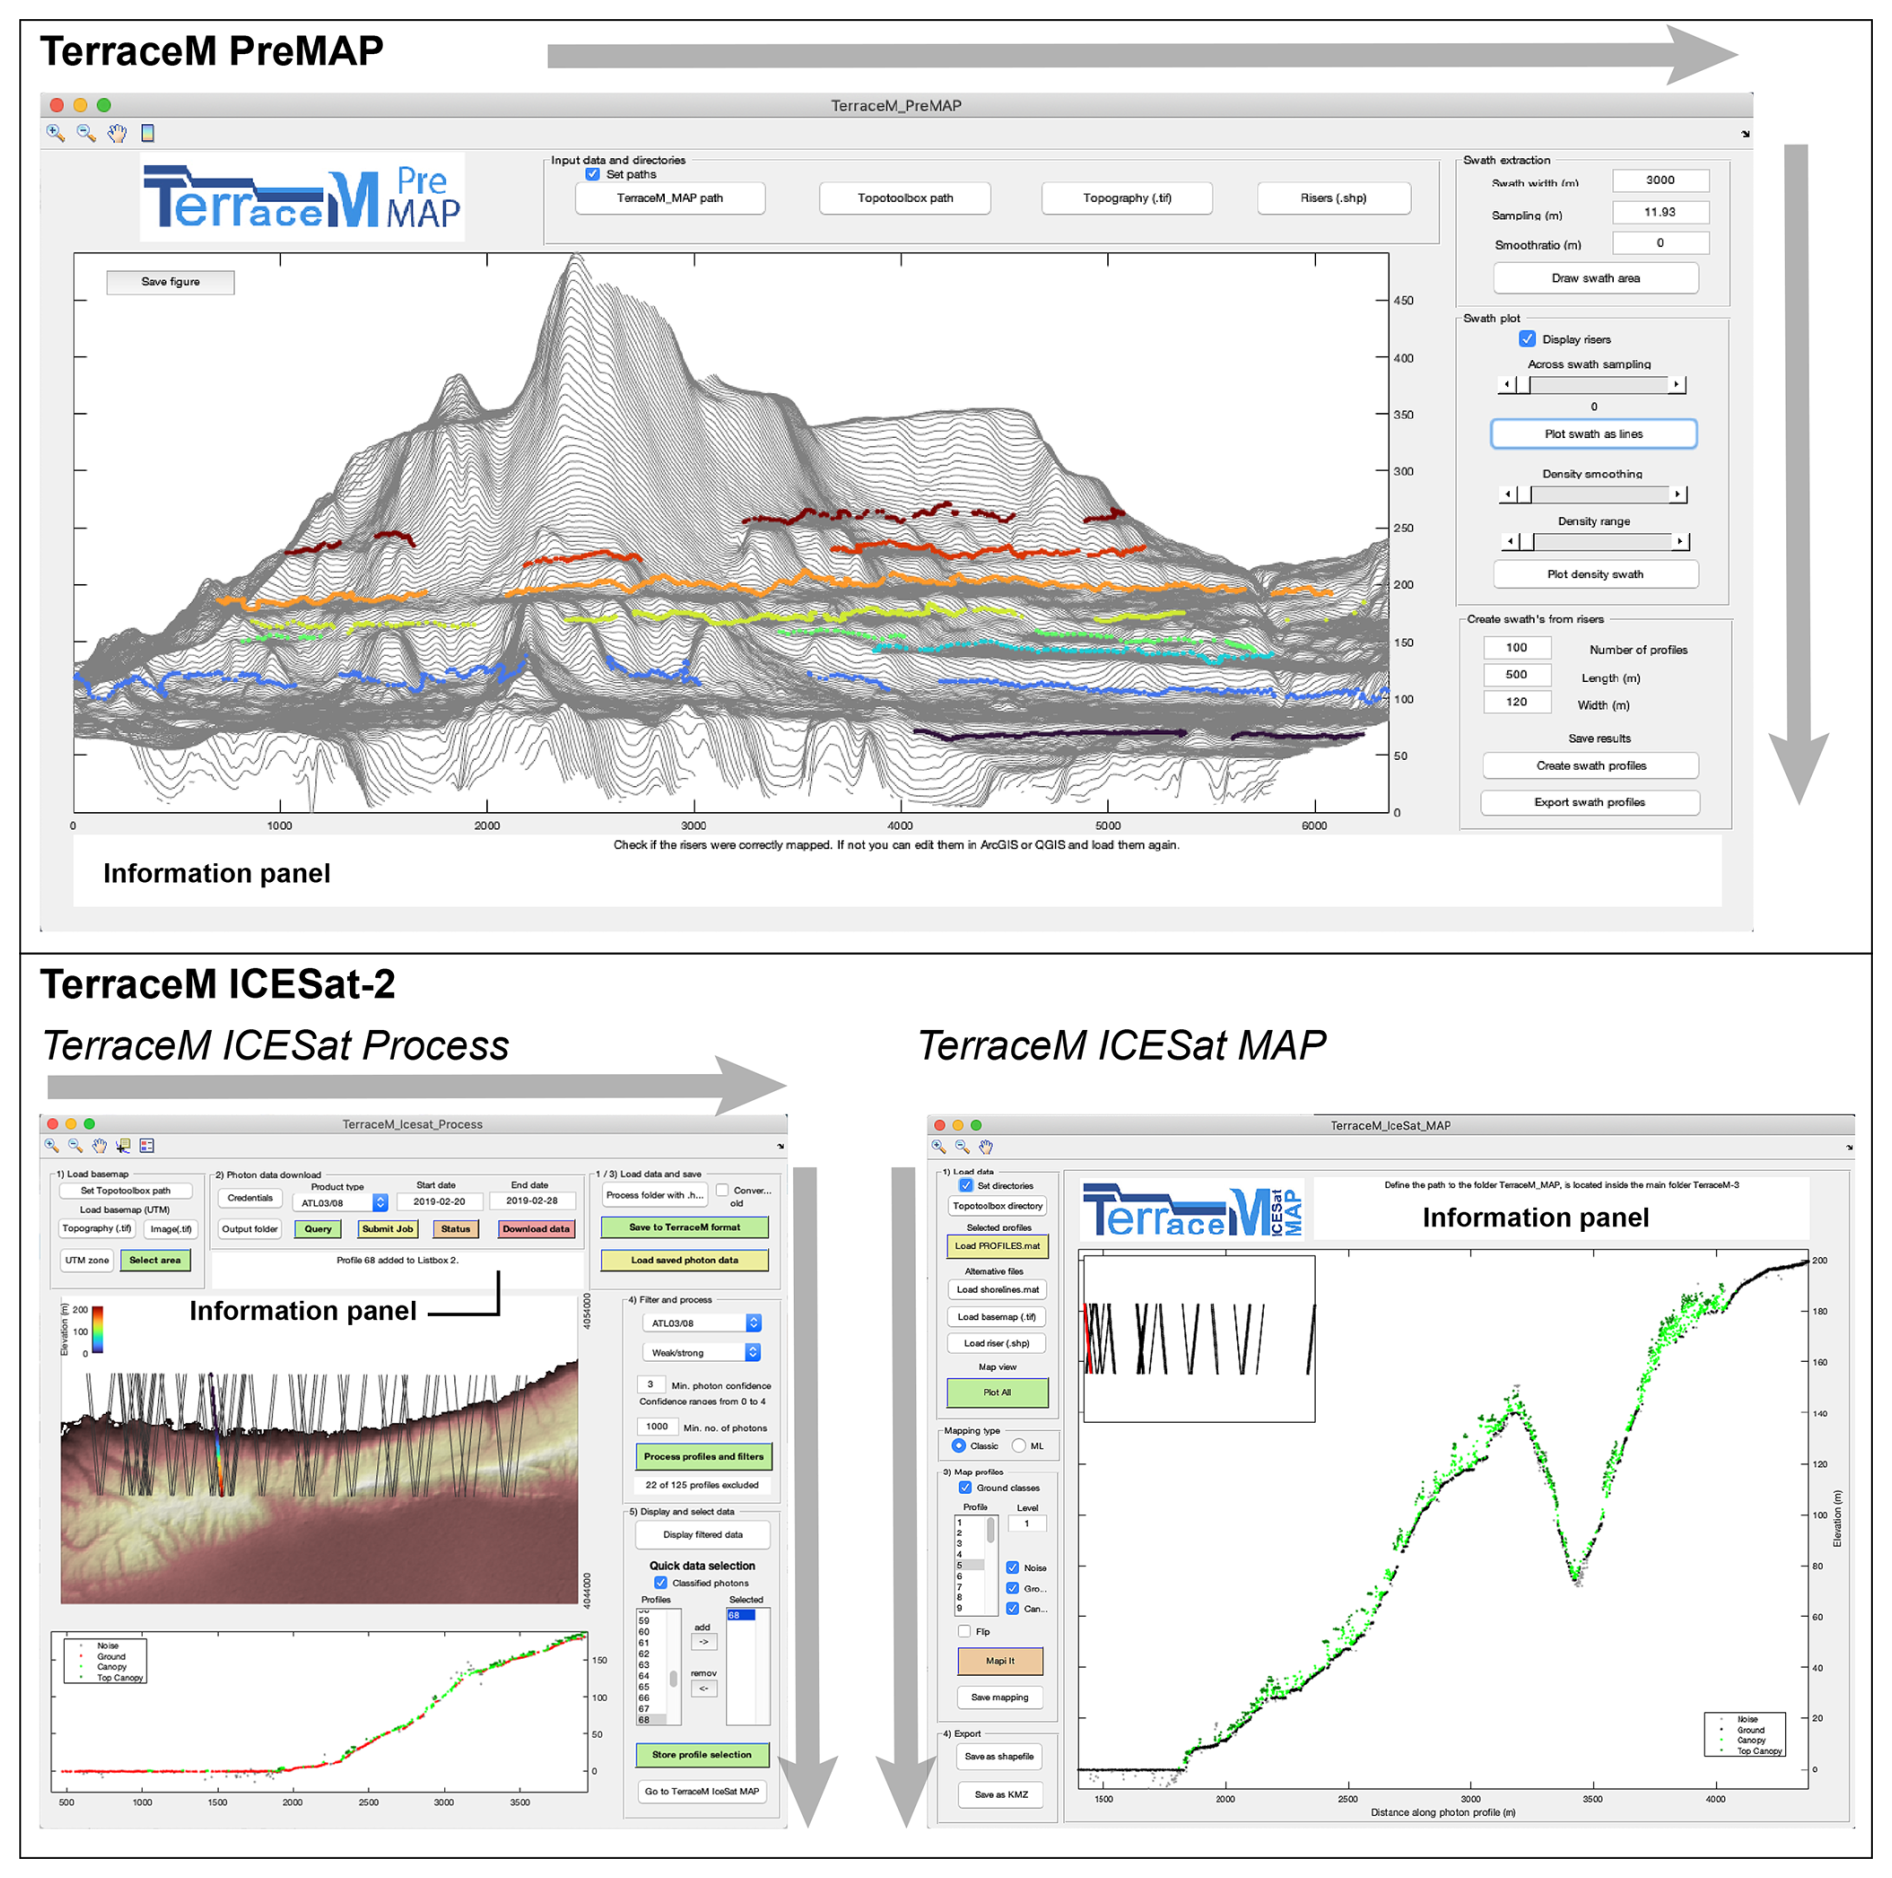
Figure 11Graphical user interfaces of the main modules implemented in TerraceM-3. Grey arrows indicate the direction of the workflow. Information on the additional GUIs is provided in the Supplement, Sects. S1 and S4. The software and interface shown are original work created by the authors.
Beyond the mapping algorithms, the interaction between the operator and TerraceM can significantly influence the results. Complex interfaces may lead to workflows that are difficult to follow and increase the likelihood of errors during analysis and processing. To minimize this, TerraceM was designed with an intuitive graphical interface and linear workflow that guides operators through data loading or downloading, processing, and terrace mapping. Contextual information is dynamically displayed within dedicated panels of the GUI, assisting the operator throughout the procedure (Fig. 11). This operator-centered design enhances the consistency of terrace elevations and deformation rate estimates, while providing a friendly and efficient environment.
Building on this human-machine interaction context, the new machine-learning component of TerraceM-3 aims to formalize the decision processes used by experienced operators during terrace mapping. We do not attempt not to replace expert criteria or to outperform trained operators, but to reproduce expert-level mapping in a consistent and reproducible way. Manual mapping carried by experienced operators can yield highly accurate shoreline-angle estimates; however, the results may vary depending on user experience, training, and subjective decisions. Developing expertise in marine-terrace mapping using TerraceM traditionally requires repeated training exercises and a substantial investment of time and resources to learn how to reliably recognize marine terrace morphologies. By encoding expert-level mapping criteria within a trained neural network, the ML mapping tool provides stable and repeatable identification of paleo-cliff and paleo-platform segments, thereby reducing operator-dependent bias. These characteristics make the ML mapping particularly useful for large-scale collaborative studies, as well as for applications where expertise in marine-terrace mapping may be limited. Because the model was trained to recognize geomorphic patterns associated with marine terraces rather than site-specific characteristics, the approach can be applied to wave-cut marine terraces in different tectonic and geomorphic settings without requiring additional training. The model training typically represents the most computationally demanding stage of ML workflows; TerraceM-3 is distributed with a pre-trained neural network, which minimizes computational requirements and addresses concerns about the carbon cost of ML approaches. In routine applications, shoreline-angle mapping requires only a few seconds per measurement on a standard desktop or laptop computer. The low computational requirements and the reduced need for extensive operator training facilitate the use of the tool in regions where access to resources may be limited, thereby helping to democratize access to marine terrace mapping and analysis within the broader geoscience community.
TerraceM-3 introduces new approaches to reduce systematic and non-systematic errors in marine terrace mapping. Systematic errors associated with lateral correlation of marine terrace level and the geometry of swath profiles used for marine terrace mapping are solved using the Terrace_PreMAP tool, which provides a systematic way to cross-check and standardize marine terrace measurements. Non-systematic errors are reduced by following a machine learning approach, which allows to effectively substitute the qualitative aspect of marine terrace mapping, and associated non-systematic errors, with a tool capable of performing as reliably as an expert operator.
Finally, considering that one of the main limitations of marine terrace mapping is the scarcity of high-resolution topography, we created a new TerraceM_ICESat-2 module to download, process and analyze 2D topographic data of the ICESat-2 mission. This tool is coupled with the machine-learning mapping tool, facilitating the marine terrace mapping process. This release of TerraceM furthermore includes a Python version to map marine terraces outside the MATLAB® environment (See Sect. S5). The new additions of TerraceM-3 will expedite marine and lacustrine abrasion terrace analysis and deformation rate estimations along coastal areas ensuring methodological repeatability.
The TerraceM scripts, written in MATLAB®, are available on Zenodo at https://doi.org/10.5281/zenodo.17439972 (Jara Muñoz et al., 2025) and on the TerraceM project website http://www.terracem.com, where additional information, tips and monthly updates are also provided.
The data used in this study are publicly available. ICESat-2 photon data were obtained from the National Aeronautics and Space Administration (NASA) through the National Snow and Ice Data Center (NSIDC) Distributed Active Archive Center and can be accessed at https://nsidc.org/data/icesat-2 (last access: 10 April 2026). The FabDEM (Forest And Buildings removed Copernicus DEM) dataset is openly available and can be downloaded from https://data.bris.ac.uk/data/dataset/s5hqmjcdj8yo2ibzi9b4ew3sn (last access: 10 April 2026). Additiopnal topograpy is provided as example data within TerraceM-3 (https://doi.org/10.5281/zenodo.18882765, Jara Muñoz et al., 2026).
The supplement related to this article is available online at https://doi.org/10.5194/esurf-14-291-2026-supplement.
JJM designed the software and methodology, conducted the formal analysis, data curation, and wrote the original manuscript. JM contributed to the conceptualization and the design of the machine-learning algorithms. RF contributed to data curation for neural network training. DM contributed to the conceptualization and formal analysis. MW supported the methodology development and Python programming. PW contributed to the conceptualization and formal analysis. CM contributed to conceptualization, methodology development and supervision of MW. MS participated in the conceptualization and formal analysis. All authors contributed to editing the manuscript and the revision of the final version.
The contact author has declared that none of the authors has any competing interests.
Publisher's note: Copernicus Publications remains neutral with regard to jurisdictional claims made in the text, published maps, institutional affiliations, or any other geographical representation in this paper. The authors bear the ultimate responsibility for providing appropriate place names. Views expressed in the text are those of the authors and do not necessarily reflect the views of the publisher.
We gratefully acknowledge support of our Greek colleagues, Prof. Dr. Konstantinos Tsanakas, Dr. Dimitrios-Vasileios Batzakis and Diamantina Griva for their support testing the TerraceM code in the Hochschule Biberach, Germany. We thank Dr. Simone Racano for his insights on TerraceM functionalities and suggestions. We also thank Prof. Aicha Heddar and Dr. Yahia Mohammedi for their feedback on the application of TerraceM in Algeria. We also thank the Center for Interdisciplinary Research on Disaster Risk, Resilience and Recovery (CIGIDEN R+) CIN250023.
This study was supported by TANTA “Earthquakes and coastal deformation in subduction zones at continental scale” grant P2022-13-001 funded by the Carl-Zeiss-Stiftung; the Millennium Nucleus CYCLO “The Seismic Cycle Along Subduction Zones” grant NC160025 and Millennium Institute of Oceanography IMO grant ICN2025_030, both funded by the Millennium Scientific Initiative (ICM) of the Chilean Government; the Chilean National Fund for Development of Science and Technology (FONDECYT) grant 1150321; and the German Science Foundation (DFG) grant STR373/41-1. The visit of the colleagues who tested TerraceM-3 was supported by KINETICS: Kithera Neotectonic analysis funded by DAAD (German Academic Exchange Service) under grant 57730124.
This paper was edited by Fiona Clubb and reviewed by Laurent Husson and Michele Delchiaro.
Abdalati, W., Zwally, H. J., Bindschadler, R., Csatho, B., Farrell, S. L., Fricker, H. A., Harding, D., Kwok, R., Lefsky, M., and Markus, T.: The ICESat-2 laser altimetry mission, P. IEEE, 98, 735–751, 2010.
Anderson, R., Densmore, A., and Ellis, M.: The generation and degredation of marine terraces, Basin Res., 11, 7–19, 1999.
Armijo, R., Meyer, B., King, G., Rigo, A., and Papanastassiou, D.: Quaternary evolution of the Corinth Rift and its implications for the Late Cenozoic evolution of the Aegean, Geophys. J. Int., 126, 11–53, 1996.
Armijo, R., Lacassin, R., Coudurier-Curveur, A., and Carrizo, D.: Coupled tectonic evolution of Andean orogeny and global climate, Earth-Sci. Rev., 143, 1–35, 2015.
Atkinson, M., Gesing, S., Montagnat, J., and Taylor, I.: Scientific worflows: Past, present and future, Future Gener. Comp. Sy., 216–227, https://doi.org/10.1016/j.future.2017.05.041, 2017.
Authemayou, C., Pedoja, K., Heddar, A., Molliex, S., Boudiaf, A., Ghaleb, B., Van Vliet Lanoe, B., Delcaillau, B., Djellit, H., and Yelles, K.: Coastal uplift west of Algiers (Algeria): pre-and post-Messinian sequences of marine terraces and rasas and their associated drainage pattern, Int. J. Earth Sci., 106, 19–41, 2017.
Aymé, A.: Le Quaternaire littoral des environs d'Alger, Actes du Congrès Panafricain de Préhistoire, IIe session, Alger, 242–246, 1952.
Bello-González, J. P., Contreras-Reyes, E., and Arriagada, C.: Predicted path for hotspot tracks off South America since Paleocene times: Tectonic implications of ridge-trench collision along the Andean margin, Gondwana Res., 64, 216–234, 2018.
Berryman, K.: Age, height, and deformation of Holocene marine terraces at Mahia Peninsula, Hikurangi subduction margin, New Zealand, Tectonics, 12, 1347–1364, 1993.
Bintanja, R., van de Wal, R. S., and Oerlemans, J.: Modelled atmospheric temperatures and global sea levels over the past million years, Nature, 437, 125–128, 2005.
Bishop, C.: The Multi-Layer Perceptron, in: Neural Networks for Pattern Recognition, https://doi.org/10.1093/oso/9780198538493.001.0001, 1995.
Bowles, C. J. and Cowgill, E.: Discovering marine terraces using airborne LiDAR along the Mendocino-Sonoma coast, northern California, Geosphere, 8, 386–402, 2012.
Broecker, W. S., Thurber, D. L., Goddard, J., Ku, T.-L., Matthews, R., and Mesolella, K.: Milankovitch hypothesis supported by precise dating of coral reefs and deep-sea sediments, Science, 159, 297–300, 1968.
Burbank, D. W. and Anderson, R. S.: Tectonic geomorphology, John Wiley & Sons, https://doi.org/10.1002/9781444345063, 2011.
Cerrone, C., Di Donato, V., Mazzoli, S., Robustelli, G., Soligo, M., Tuccimei, P., and Ascione, A.: Development and deformation of marine terraces: Constraints to the evolution of the Campania Plain Quaternary coastal basin (Italy), Geomorphology, 385, 107725, https://doi.org/10.1016/j.geomorph.2021.107725, 2021.
Chang, K.-T. and Tsai, B.-W.: The Effect of DEM Resolution on Slope and Aspect Mapping, Cartogr. Geogr. Inform., 18, 69–77, https://doi.org/10.1559/152304091783805626, 1991.
Chappell, J.: Geology of coral terraces, Huon Peninsula, New Guinea: a study of Quaternary tectonic movements and sea-level changes, Geol. Soc. Am. Bull., 85, 553–570, 1974.
Chiba, T., Kaneta, S.-i., and Suzuki, Y.: Red relief image map: new visualization method for three dimensional data, Int. Arch. Photogramm., 37, 1071–1076, 2008.
Curveur, A. C.: Evolution morpho-tectonique de la marge de subduction andine au Nord Chili, Paris 7, https://theses.fr/2012PA077010 (last access: 10 April 2026), 2012.
de Gelder, G., Husson, L., Pastier, A.-M., Fernández-Blanco, D., Pico, T., Chauveau, D., Authemayou, C., and Pedoja, K.: High interstadial sea levels over the past 420 ka from the Huon Peninsula, Papua New Guinea, Commun. Earth Environ., 3, 256, https://doi.org/10.1038/s43247-022-00583-7, 2022.
DeMets, C., Gordon, R. G., Argus, D., and Stein, S.: Current plate motions, Geophys. J. Int., 101, 425-.478, 1990.
Duff, R. O.: Uplifted marine terraces and some other aspects of late quarternary geology in northern Taranaki, PhD, University of Otago, https://hdl.handle.net/10523/4580 (last access: 10 April 2026), 1993.
Farhan Hussain, R., Mokhtari, A., Ghalambor, A., and Amini Salehi, M.: Chapter 5 – Threats and side-effects of smart solutions in O&G industry: Smartness is not necessarily smart, in: IoT for Smart Operations in the Oil and Gas Industry, edited by: Farhan Hussain, R., Mokhtari, A., Ghalambor, A., and Amini Salehi, M., Gulf Professional Publishing, 133–161, https://doi.org/10.1016/B978-0-32-391151-1.00014-9, 2023.
Fialko, Y. and Pearse, J.: Sombrero uplift above the Altiplano-Puna magma body: Evidence of a ballooning mid-crustal diapir, Science, 338, 250–252, 2012.
Field, C., Martino, A., and Ramos-Izquierdo, L.: ICESat-2/ATLAS instrument linear system impulse response, Earth Space Sci., 10504651, https://doi.org/10.1002/essoar.10504651.1, 2020.
Forte, A. M. and Whipple, K. X.: Short communication: The Topographic Analysis Kit (TAK) for TopoToolbox, Earth Surf. Dynam., 7, 87–95, https://doi.org/10.5194/esurf-7-87-2019, 2019.
Freisleben, R., Jara-Muñoz, J., Melnick, D., Martínez, J. M., and Strecker, M. R.: Marine terraces of the last interglacial period along the Pacific coast of South America (1° N–40° S), Earth Syst. Sci. Data, 13, 2487–2513, https://doi.org/10.5194/essd-13-2487-2021, 2021.
Geertsma, J.: Land subsidence above compacting oil and gas reservoirs, J. Petrol. Technol., 25, 734–744, 1973.
Georga, E. I., Fotiadis, D. I., and Tigas, S. K.: 9 – Existing and Potential Applications of Glucose Prediction Models, in: Personalized Predictive Modeling in Type 1 Diabetes, edited by: Georga, E. I., Fotiadis, D. I., and Tigas, S. K., Academic Press, 201–220, https://doi.org/10.1016/B978-0-12-804831-3.00009-1, 2018.
Ghazleh, S. A. and Kempe, S.: Geomorphology of Lake Lisan terraces along the eastern coast of the Dead Sea, Jordan, Geomorphology, 108, 246–263, 2009.
Ghazleh, S. A. and Kempe, S.: Discovery of high-level terraces of last glacial Lake Lisan (Dead Sea) and eastern mediterranean paleoclimatic implications, Quaternary Int., 604, 38–50, 2021.
Glangeaud, L.: Etude géologique de la région Littorale de la province d'Alger, Thèse Sci. Paris et bull. Serv. Carte G´eol. Alger, 2ème sér. 8, 1932.
Griggs, G. and Trenhaile, A.: Coastal cliffs and platforms, Cambridge University Press, Cambridge, UK, https://doi.org/10.1017/CBO9780511564420.013, 1994.
Hampel, A.: The migration history of the Nazca Ridge along the Peruvian active margin: a re-evaluation, Earth Planet. Sc. Lett., 203, 665–679, 2002.
Hampel, A., Adam, J., and Kukowski, N.: Response of the tectonically erosive south Peruvian forearc to subduction of the Nazca Ridge: Analysis of three-dimensional analogue experiments, Tectonics, 23, https://doi.org/10.1029/2003TC001585, 2004.
Hanks, T. C., Bucknam, R. C., Lajoie, K. R., and Wallace, R. E.: Modification of wave-cut and faulting-controlled landforms, J. Geophys. Res.-Sol. Ea., 89, 5771–5790, 1984.
Harbi, A., Maouche, S., Vaccari, F., Aoudia, A., Oussadou, F., Panza, G., and Benouar, D.: Seismicity, seismic input and site effects in the Sahel–Algiers region (North Algeria), Soil Dyn. Earthq. Eng., 27, 427–447, 2007.
Heddar, A., Authemayou, C., Djellit, H., Yelles, A., Déverchère, J., Gharbi, S., Boudiaf, A., and Lanoe, B. V. V.: Preliminary results of a paleoseismological analysis along the Sahel fault (Algeria): New evidence for historical seismic events, Quaternary Int., 302, 210–223, 2013.
Henriquet, M., Avouac, J.-P., and Bills, B. G.: Crustal rheology of southern Tibet constrained from lake-induced viscoelastic deformation, Earth Planet. Sc. Lett., 506, 308–322, 2019.
Holzer, T. L. and Johnson, A. I.: Land subsidence caused by ground water withdrawal in urban areas, GeoJournal, 11, 245–255, 1985.
Hsu, J.: Emerged Quaternary marine terraces in southern Peru: sea-level changes and continental margin tectonics over the subducting Nazca Ridge, PhD thesis, Cornell University, Ithaca, NY, USA, https://www.proquest.com/openview/cd6d761ca9ff8b727b8bed66a234c249 (last access: 10 April 2026), 1988.
Hsu, J. T.: Quaternary uplift of the Peruvian coast related to the subduction of the Nazca Ridge: 13.5 to 15.6 degrees south latitude, Quaternary Int., 15–16, 87–97, 1992.
Jara-Muñoz, J. and Melnick, D. J. Q. R.: Unraveling sea-level variations and tectonic uplift in wave-built marine terraces, Santa María Island, Chile, Quaternary Res., 83, 216–228, 2015.
Jara-Muñoz, J., Melnick, D., and Strecker, M. R.: TerraceM: A MATLAB(R) tool to analyze marine and lacustrine terraces using high-resolution topography, Geosphere, 12, 20, https://doi.org/10.1130/ges01208.1, 2016.
Jara-Muñoz, J., Melnick, D., Pedoja, K., and Strecker, M. R.: TerraceM-2: A Matlab® interface for mapping and modeling marine and lacustrine terraces, Front. Earth Sci., 7, 255, https://doi.org/10.3389/feart.2019.00255, 2019.
Jara-Muñoz, J., Agnon, A., Fohlmeister, J., Tomás, S., Mey, J., Frank, N., Schröder, B., Schröder-Ritzrau, A., Garcin, Y., and Darvasi, Y.: Unveiling the Transition From Paleolake Lisan to Dead Sea Through the Analysis of Lake Paleoshorelines and Radiometric Dating of Fossil Stromatolites, Geochem. Geophy. Geosy., 25, e2024GC011541, https://doi.org/10.1029/2024GC011541, 2024.
Jara Muñoz, J., Mey, J., Freisleben, R., Melnick, D., Markus, W., Winckler, P., Mavoungou, C., and Strecker, M.: TerraceM-3: Marine terrace mapping using machine learning and satellite altimetry (Version 3), Zenodo [code], https://doi.org/10.5281/zenodo.17439972, 2025.
Jara Muñoz, J., Mey, J., Freisleben, R., Melnick, D., Markus, W., Winckler, P., Mavoungou, C., and Strecker, M.: TerraceM-3: Marine terrace mapping using machine learning and satellite altimetry (v.3.2), Zenodo [code], https://doi.org/10.5281/zenodo.18882765, 2026.
Jasinski, M., Stoll, J., Hancock, D., Robbins, J., Nattala, J., Moriso, J., Jones, B., Ondrusek, M., Pavelsky, T., and Parrish, C.: ATLAS/ICESat-2 L3B mean inland surface water data, NASA National Snow Ice Data Center Distributed Active Archive Center data set, ATL22.001, https://doi.org/10.5067/ATLAS/ATL13QL.007, 2021.
Johannsen, G.: Human-machine interaction, Control Systems, Robotics and Automation, 21, 132–162, 2009.
Johnson, D.: Problems of terrace correlation, Bull. Geol. Soc. Am., 55, 793–818, 1944.
Kaizuka, S., Matsuda, T., Nogami, M., and Yonekura, N.: Quaternary tectonic and recent seismic crustal movements in the arauco peninsula and its environs, central chile, Geographical Reports of Tokyo Metropolitan University, 8, 1–49, 1973.
Kavzoglu, T.: Increasing the accuracy of neural network classification using refined training data, Environ. Model. Softw., 24, 850–858, 2009.
Krishnan, S., Crosby, C., Nandigam, V., Phan, M., Cowart, C., Baru, C., and Arrowsmith, R.: OpenTopography: a services oriented architecture for community access to LIDAR topography, Proceedings of the 2nd international conference on computing for Geospatial Research & Applications, 1–8, https://doi.org/10.1145/1999320.1999327, 2011.
Lajoie, K. R.: Coastal tectonics, Active Tectonics, 95–124, 1986.
Lambeck, K.: Glacial crustal rebound, sea levels and shorelines, Encyclopaedia of Ocean Sciences, 2, 1157–1167, 2001.
Lamothe, D. and De, L.: Les anciennes lignes de rivage du Sahel d'Alger et d'une partie de la côte Algérienne, Societe geologique de France, 1911.
Macharé, J. and Ortlieb, L.: Plio-Quaternary vertical motions and the subduction of the Nazca Ridge, central coast of Peru, Tectonophysics, 205, 97–108, 1992.
Maouche, S., Meghraoui, M., Morhange, C., Belabbes, S., Bouhadad, Y., and Haddoum, H.: Active coastal thrusting and folding, and uplift rate of the Sahel Anticline and Zemmouri earthquake area (Tell Atlas, Algeria), Tectonophysics, 509, 69–80, 2011.
Markus, T., Neumann, T., Martino, A., Abdalati, W., Brunt, K., Csatho, B., Farrell, S., Fricker, H., Gardner, A., and Harding, D.: The Ice, Cloud, and land Elevation Satellite-2 (ICESat-2): science requirements, concept, and implementation, Remote Sens. Environ., 190, 260–273, 2017.
Matsu'ura, T.: Late Quaternary uplift rate inferred from marine terraces, Muroto Peninsula, southwest Japan: Forearc deformation in an oblique subduction zone, Geomorphology, 234, 133–150, 2015.
Matsu'ura, T., Kimura, H., Komatsubara, J., Goto, N., Yanagida, M., Ichikawa, K., and Furusawa, A.: Late Quaternary uplift rate inferred from marine terraces, Shimokita Peninsula, northeastern Japan: A preliminary investigation of the buried shoreline angle, Geomorphology, 209, 1–17, 2014.
Matsu'ura, T., Komatsubara, J., and Wu, C.: Accurate determination of the Pleistocene uplift rate of the NE Japan forearc from the buried MIS 5e marine terrace shoreline angle, Quaternary Sci. Rev., 212, 45–68, 2019.
Meghraoui, M.: Blind reverse faulting system associated with the Mont Chenoua-Tipaza earthquake of 29 October 1989 (north-central Algeria), Terra Nova, 3, 84–92, 1991.
Meghraoui, M., Philip, H., Albarede, F., and Cisternas, A.: Trench investigations through the trace of the 1980 El Asnam thrust fault: Evidence for paleoseismicity, B. Seismol. Soc. Am., 78, 979–999, 1988.
Melnick, D.: Rise of the central Andean coast by earthquakes straddling the Moho, Nat. Geosci., 9, 401–407, 2016.
Melnick, D., Yıldırı m, C., Hillemann, C., Garcin, Y., Ciner, A., Pérez-Gussinyé, M., and Strecker, M. R.: Slip along the Sultanhanı Fault in Central Anatolia from deformed Pleistocene shorelines of palaeo-lake Konya and implications for seismic hazards in low-strain regions, Geophys. J. Int., 209, 1431–1454, 2017.
Misra, A. and Ramakrishnan, B.: Assessment of coastal geomorphological changes using multi-temporal Satellite-Derived Bathymetry, Cont. Shelf Res., 207, 104213, https://doi.org/10.1016/j.csr.2020.104213, 2020.
Mitusio, T.: The middle terrace problems in Shikoku, Japan, Kochi University, 0913-1302, 187–202, 1989.
Mouchez, E.: Carte particulière de la Côte Septentrionale d'Afrique, D'Alger a Cherchell, 1928.
Neuenschwander, A. and Pitts, K.: The ATL08 land and vegetation product for the ICESat-2 Mission, Remote Sens. Environ., 221, 247–259, 2019.
Nocquet, J.-M. and Calais, E.: Geodetic measurements of crustal deformation in the Western Mediterranean and Europe, Pure Appl. Geophys., 161, 661–681, 2004.
Norabuena, E., Leffler-Griffin, L., Mao, A., Dixon, T., Stein, S., Sacks, I. S., Ocola, L., and Ellis, M.: Space geodetic observations of Nazca-South America convergence across the central Andes, Science, 279, 358–362, 1998.
Ortlieb, L. and Macharé, J.: Geocronologia y morfoestratigrafia de terrazas marinas del Pleistoceno superior: el caso de San Juan-Marcona, Peru, Boletin de la Sociedad Geologica del Peru, 81, 87–106, 1990.
Palamara, D. R., Dickson, M. E., and Kennedy, D. M.: Defining shore platform boundaries using airborne laser scan data: a preliminary investigation, Earth Surf. Proc. Land., 32, 945–953, https://doi.org/10.1002/esp.1485, 2007.
Pan, L., Powell, E. M., Latychev, K., Mitrovica, J. X., Creveling, J. R., Gomez, N., Hoggard, M. J., and Clark, P. U.: Rapid postglacial rebound amplifies global sea level rise following West Antarctic Ice Sheet collapse, Sci. Adv., 7, eabf7787, https://doi.org/10.1126/sciadv.abf7787, 2021.
Parrish, C. E., Magruder, L. A., Neuenschwander, A. L., Forfinski-Sarkozi, N., Alonzo, M., and Jasinski, M.: Validation of ICESat-2 ATLAS bathymetry and analysis of ATLAS's bathymetric mapping performance, Remote Sens. Environ., 11, 1634, https://doi.org/10.3390/rs11141634, 2019.
Pedoja, K., Husson, L., Regard, V., Cobbold, P. R., Ostanciaux, E., Johnson, M. E., Kershaw, S., Saillard, M., Martinod, J., and Furgerot, L.: Relative sea-level fall since the last interglacial stage: Are coasts uplifting worldwide?, Earth-Sci. Rev., 108, 1–15, 2011.
Peterson, J. C., Bourgin, D. D., Agrawal, M., Reichman, D., and Griffiths, T. L.: Using large-scale experiments and machine learning to discover theories of human decision-making, Science, 372, 1209–1214, https://doi.org/10.1126/science.abe2629, 2021.
Ranndal, H., Sigaard Christiansen, P., Kliving, P., Baltazar Andersen, O., and Nielsen, K.: Evaluation of a Statistical Approach for Extracting Shallow Water Bathymetry Signals from ICESat-2 ATL03 Photon Data, Remote Sens., https://doi.org/10.3390/rs13173548, 2021.
Regard, V., Saillard, M., Martinod, J., Audin, L., Carretier, S., Pedoja, K., Riquelme, R., Paredes, P., and Hérail, G.: Renewed uplift of the Central Andes Forearc revealed by coastal evolution during the Quaternary, Earth Planet, Sc, Lett,, 297, 199–210, 2010.
Roberts, G. P., Meschis, M., Houghton, S., Underwood, C., and Briant, R. M.: The implications of revised Quaternary palaeoshoreline chronologies for the rates of active extension and uplift in the upper plate of subduction zones, Quaternary Sci. Rev., 78, 169–187, https://doi.org/10.1016/j.quascirev.2013.08.006, 2013.
Rosenbloom, N. A. and Anderson, R. S.: Hillslope and channel evolution in a marine terraced landscape, Santa Cruz, California, J. Geophys. Res.-Sol. Ea., 99, 14013–14029, 1994.
Rovere, A., Casella, E., Harris, D. L., Lorscheid, T., Nandasena, N. A., Dyer, B., Sandstrom, M. R., Stocchi, P., D'Andrea, W. J., and Raymo, M. E.: Giant boulders and Last Interglacial storm intensity in the North Atlantic, P. Natl. Acad. Sci. USA, 114, 12144–12149, 2017.
Ruh, J. B., Sallarès, V., Ranero, C. R., and Gerya, T.: Crustal deformation dynamics and stress evolution during seamount subduction: High-resolution 3-D numerical modeling, J. Geophys. Res.-Sol. Ea., 121, 6880–6902, 2016.
Saillard, M., Hall, S., Audin, L., Farber, D., Regard, V., and Hérail, G.: Andean coastal uplift and active tectonics in southern Peru: 10Be surface exposure dating of differentially uplifted marine terrace sequences (San Juan de Marcona, ∼ 15.4 S), Geomorphology, 128, 178–190, 2011.
Saoudi, N.-E.: Pliocène et Pléistocène inférieur et moyen du Sahel occidental d'Alger, Bulletin de liaison-Association sénégalaise pour l'étude du quaternaire de l'ouest africain, 67–70, 1985.
Sato, T. and Matsu'ura, M.: Cyclic crustal movement, steady uplift of marine terraces, and evolution of the island arc-trench system in southwest Japan, Geophys. J. Int., 111, 617–629, 1992.
Schleidgen, S., Friedrich, O., Gerlek, S., Assadi, G., and Seifert, J.: The concept of “interaction” in debates on human–machine interaction, Humanities and Social Sciences Communications, 10, 551, https://doi.org/10.1057/s41599-023-02060-8, 2023.
Shirzaei, M., Freymueller, J., Törnqvist, T. E., Galloway, D. L., Dura, T., and Minderhoud, P. S.: Measuring, modelling and projecting coastal land subsidence, Nature Reviews Earth Environment, 2, 40–58, 2021.
Simms, A. R., Rouby, H., and Lambeck, K.: Marine terraces and rates of vertical tectonic motion: The importance of glacio-isostatic adjustment along the Pacific coast of central North America, GSA Bulletin, 128, 81–93, 2016.
Singer, B. S., Le Mével, H., Licciardi, J. M., Córdova, L., Tikoff, B., Garibaldi, N., Andersen, N. L., Diefenbach, A. K., and Feigl, K. L.: Geomorphic expression of rapid Holocene silicic magma reservoir growth beneath Laguna del Maule, Chile, Sci. Adv., 4, eaat1513, https://doi.org/10.1126/sciadv.aat1513, 2018.
Spratt, R. M. and Lisiecki, L. E.: A Late Pleistocene sea level stack, Clim. Past, 12, 1079–1092, https://doi.org/10.5194/cp-12-1079-2016, 2016.
Stephenson, W.: Rock coasts, Coastal environments global change, 356–379, https://doi.org/10.1002/9781119117261.ch15, 2015.
Strzerzynski, P., Déverchère, J., Cattaneo, A., Domzig, A., Yelles, K., Mercier de Lépinay, B., Babonneau, N., and Boudiaf, A.: Tectonic inheritance and Pliocene-Pleistocene inversion of the Algerian margin around Algiers: Insights from multibeam and seismic reflection data, Tectonics, 29, https://doi.org/10.1029/2009TC002547, 2010.
Tang, Y., Kurths, J., Lin, W., Ott, E., and Kocarev, L.: Introduction to Focus Issue: When machine learning meets complex systems: Networks, chaos, and nonlinear dynamics, Chaos, 30, 063151, https://doi.org/10.1063/5.0016505, 2020.
Trenhaile, A., Pepper, D., Trenhaile, R., and Dalimonte, M.: Stacks and notches at Hopewell Rocks, New Brunswick, Canada, Earth Surf. Proc. Land., 23, 975–988, 1998.
Uhe, P., Hawker, L., Paulo, L., Sosa, J., Sampson, C., and Neal, J.: FABDEM – A 30 m global map of elevation with forests and buildings removed, EGU General Assembly 2022, Vienna, Austria, 23–27 May 2022, EGU22-8994, https://doi.org/10.5194/egusphere-egu22-8994, 2022.
Walker, R., Telfer, M., Kahle, R., Dee, M., Kahle, B., Schwenninger, J.-L., Sloan, R., and Watts, A.: Rapid mantle-driven uplift along the Angolan margin in the late Quaternary, Nat. Geosci., 9, 909–914, 2016.
Wang, S.-C.: Artificial Neural Network, in: Interdisciplinary Computing in Java Programming, edited by: Wang, S.-C., Springer US, Boston, MA, 81–100, https://doi.org/10.1007/978-1-4615-0377-4_5, 2003.
Yelles, A., Domzig, A., Déverchère, J., Bracène, R., Mercier de Lépinay, B., Strzerzynski, P., Bertrand, G., Boudiaf, A., Winter, T., and Kherroubi, A.: Evidence for large active fault offshore west Algiers, Algeria, and seismotectonic implications, Tectonophysics, 475, 98–116, 2009.
- Abstract
- Introduction
- New methodological approaches in TerraceM-3
- Analysis of human-machine interactions in marine terrace mapping
- Conclusions
- Code availability
- Data availability
- Author contributions
- Competing interests
- Disclaimer
- Acknowledgements
- Financial support
- Review statement
- References
- Supplement