
the Creative Commons Attribution 4.0 License.
the Creative Commons Attribution 4.0 License.
 | 07 Oct 2026
Forecasting coastal dune mobility: a logistic regression model driven by meteorological data and climate indices

Silvio Casadío
Predicting dune mobility under changing climatic conditions remains a challenge in aeolian geomorphology, particularly in data-scarce regions. This study presents a novel application of binomial logistic regression to forecast dune activation and migration using readily available meteorological data. We combine established dune mobility indices (Tsoar and Lancaster) into a new integrated index (TsoLa) and evaluate its performance against observed dune migration rates derived from satellite imagery. The model incorporates wind speed, precipitation, and the Southern Annular Mode (SAM) as predictors, achieving robust predictive accuracy (AUC > 0.75) for two distinct coastal dunefields in NE Patagonia, Argentina. Our results demonstrate that even with standard climatic inputs, logistic regression can effectively identify periods of dune activity, offering a low-cost tool for coastal management. The approach may be transferable to other aeolian systems, providing a framework for assessing dune dynamics under current and future climate scenarios.
- Article
(8967 KB) - Full-text XML
- BibTeX
- EndNote


Predicting the mobility of coastal dunes in response to climatic variability remains a significant challenge in aeolian geomorphology (Hugenholtz and Wolfe, 2005; Levin et al., 2014). Dune systems are dynamic landscapes that reflect complex interactions between wind energy, sediment supply, vegetation cover, and climatic oscillations (Hesp and Thom, 1990; Tsoar and Blumberg, 2002; Marcomini and Maidana, 2006; Yizhaq et al., 2007, 2013; Miot da Silva and Hesp, 2013; Miot da Silva et al., 2013; Hoover et al., 2018; Louassa et al., 2018; Gao et al., 2023; Ren et al., 2024). While traditional approaches, such as drift potential calculations and mobility indices, provide valuable descriptors of wind-driven sediment transport (Fryberger and Dean, 1979; Lancaster, 1988; Tsoar, 2005), they offer limited predictive capacity for forecasting dune activation or stabilization over time. This methodological gap is particularly relevant in the context of climate change, where shifts in wind regimes, precipitation patterns, and storm frequency may alter dune behavior with consequences for coastal ecosystems and human infrastructure (Jackson et al., 2019a; Hesp et al., 2022).
Statistical modeling presents a promising pathway to bridge this gap. Binomial logistic regression is well-suited for predicting binary geomorphic outcomes – such as dune migration versus fixation – based on continuous environmental predictors. This is a statistical modeling technique used to predict the probability of a dichotomous dependent variable, coded as 0 or 1 (fixed or active dunes, respectively), based on one or more independent variables (climate parameters). The method was first developed by Hosmer and Lemeshow (1980) and Lemeshow and Hosmer (1982), and has been successfully applied in related environmental fields to model landslide susceptibility (Ohlmacher and Davis, 2003; Lombardo et al., 2015), soil distribution (Giasson et al., 2006; Abdel-Kader, 2011), vegetation dynamics (Rudgers and Maron, 2003; Andrew et al., 2012; Snedden and Steyer, 2013; Gallego-Fernández et al., 2015), and extreme climatic events on coastal environments (Koerth et al., 2013; Ozbas and Greenberg, 2013; Pour et al., 2014), yet its application to coastal dune mobility remains notably limited. The few existing studies that employ logistic regression in coastal contexts have focused primarily on habitat change (Brus et al., 2016) or storm damage (Ozbas and Greenberg, 2013), rather than on predicting dune activity from routine meteorological data.
The potential of logistic regression for dune studies lies in its ability to integrate multiple climatic variables, including wind speed, precipitation, and large-scale atmospheric indices into a single probabilistic framework (Hosmer et al., 2013; Sperandei, 2014). Unlike descriptive indices, a well-calibrated regression model can provide forecast probability of dune activation, offering a more dynamic tool for land management and risk assessment. Moreover, by relying on standard meteorological observations, such models can be applied in data-scarce regions where more complex numerical simulations are not feasible (Michel et al., 2018).
This study addresses this methodological opportunity by developing and validating a binomial logistic regression model to predict dune mobility in the coastal dunefields of northeastern Patagonia, Argentina. This region serves as an ideal natural laboratory due to its strong climatic forcing, well-documented aeolian activity (Carbone et al., 2007; Kokot and Favier-Dubois, 2017; Toffani et al., 2024), and availability of long-term meteorological records. The integration of the Southern Annular Mode (SAM), a key driver of extratropical climate variability in the Southern Hemisphere (Fogt and Marshall, 2020), further allows us to examine how regional atmospheric circulation patterns influence local dune dynamics.
The primary objectives of this work are (1) to develop a predictive logistic regression model that links meteorological variables and climate indices to the probability of dune activation; (2) to validate the model against multi-decadal records of dune migration derived from remote sensing, and (3) to assess the transferability of the modeling framework and its potential for application in other aeolian environments.
By framing our research around methodological innovation, we aim to provide a generalizable, accessible tool for forecasting dune activity – one that complements existing descriptive approaches and supports proactive coastal management in a changing climate. The study of these landforms is important because they constitute the first barrier against storm impacts, protecting coastal communities from extreme events and serving as freshwater reservoirs for nearby populations (Rusticucci et al., 2016; Portz et al., 2021).
2.1 Geographic and Demographic Context
The study area encompasses the northern coast of the San Matías Gulf, in northeastern Patagonia, Argentina, extending approximately 180 km from the mouth of the Negro River to the town of San Antonio Oeste (SAO) (Fig. 1). This area includes a series of villages and recreational areas, such as El Cóndor, La Lobería, Bahía Rosas, Bahía Creek, Caleta de los Loros, San Antonio Este and Oeste, and Las Grutas (Carbone et al., 2007; Kokot and Favier-Dubois, 2017). The combined permanent population of these towns was 22 205 inhabitants in 2010 (INDEC, 2010), with a significant seasonal increase due to tourism, particularly in Las Grutas, which averaged 118 000 visitors annually between 2006 and 2023 (INDEC, 2023). The area is connected by National Route No. 3 and Provincial Route No. 1, the latter running parallel to the coast. The presence of natural protected areas – Bahía de San Antonio, Punta Bermeja, and Pozo Salado–Caleta de los Loros–Punta Mejillón – highlights the region's ecological value, hosting diverse flora and fauna, as well as archaeological sites evidencing human occupation since at least 6000 years BCE (Favier-Dubois and Kokot, 2011; Marcos and Mancini, 2012; Favier-Dubois, 2013).
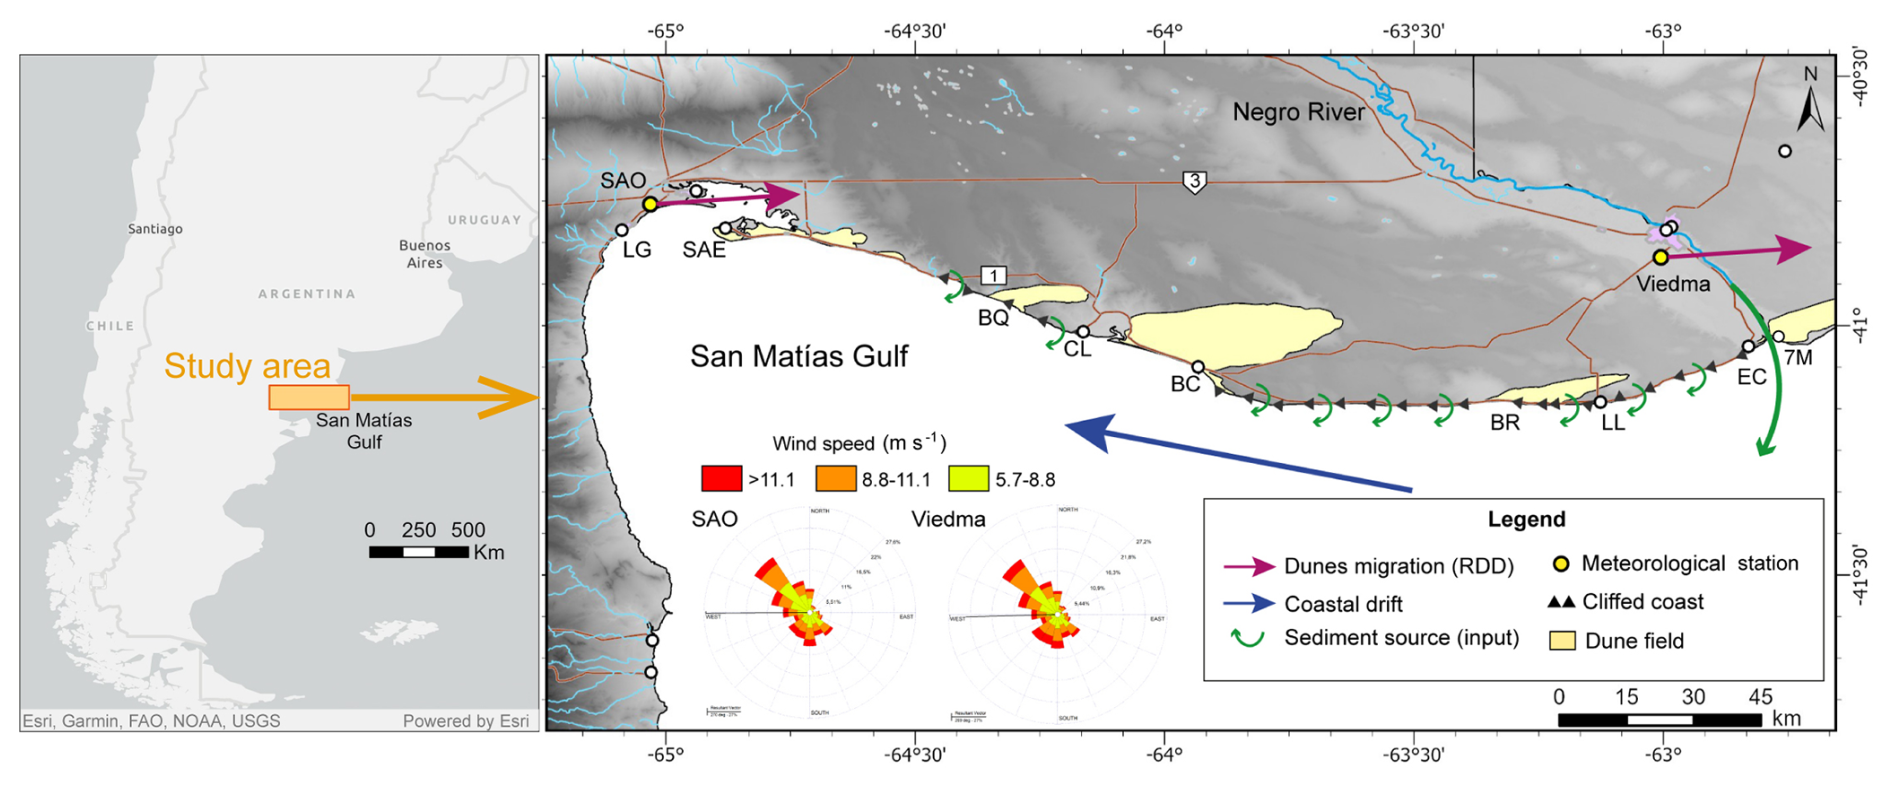
Figure 1Study area. Meteorological stations, dunefields, and coastal villages. LG: Las Grutas, SAO: San Antonio Oeste, SAE: San Antonio Este, BQ: Bajo la Quinta, CL: Caleta de los Loros, BC: Bahía Creek, BR: Bahía Rosas, LL: La Lobería, EC: El Cóndor, 7M: Villa 7 de Marzo. SAO and Viedma sand roses are present. Argentina map powered by Esri. DEM basemap from Instituto Geográfico Nacional.
2.2 Climate
The climate is classified as cold semi-arid (BSk) according to the Köppen–Geiger system (Peel et al., 2007). Mean annual temperatures range from 14 to 17 °C, with maxima in January (22.2–23.6 °C) and minima in July (7.1–7.5 °C) (Fig. 2). Annual precipitation increases from west to east, averaging 292 mm in SAO and 383 mm in Viedma for the 1991–2020 period, with higher values typically recorded in late summer and autumn (Servicio Meteorológico Nacional, 2024). Annual evapotranspiration ranges from 1050 to 1485 mm, and mean air humidity was 57 % during 1961–2000 (Genchi et al., 2010; Bohn et al., 2014).
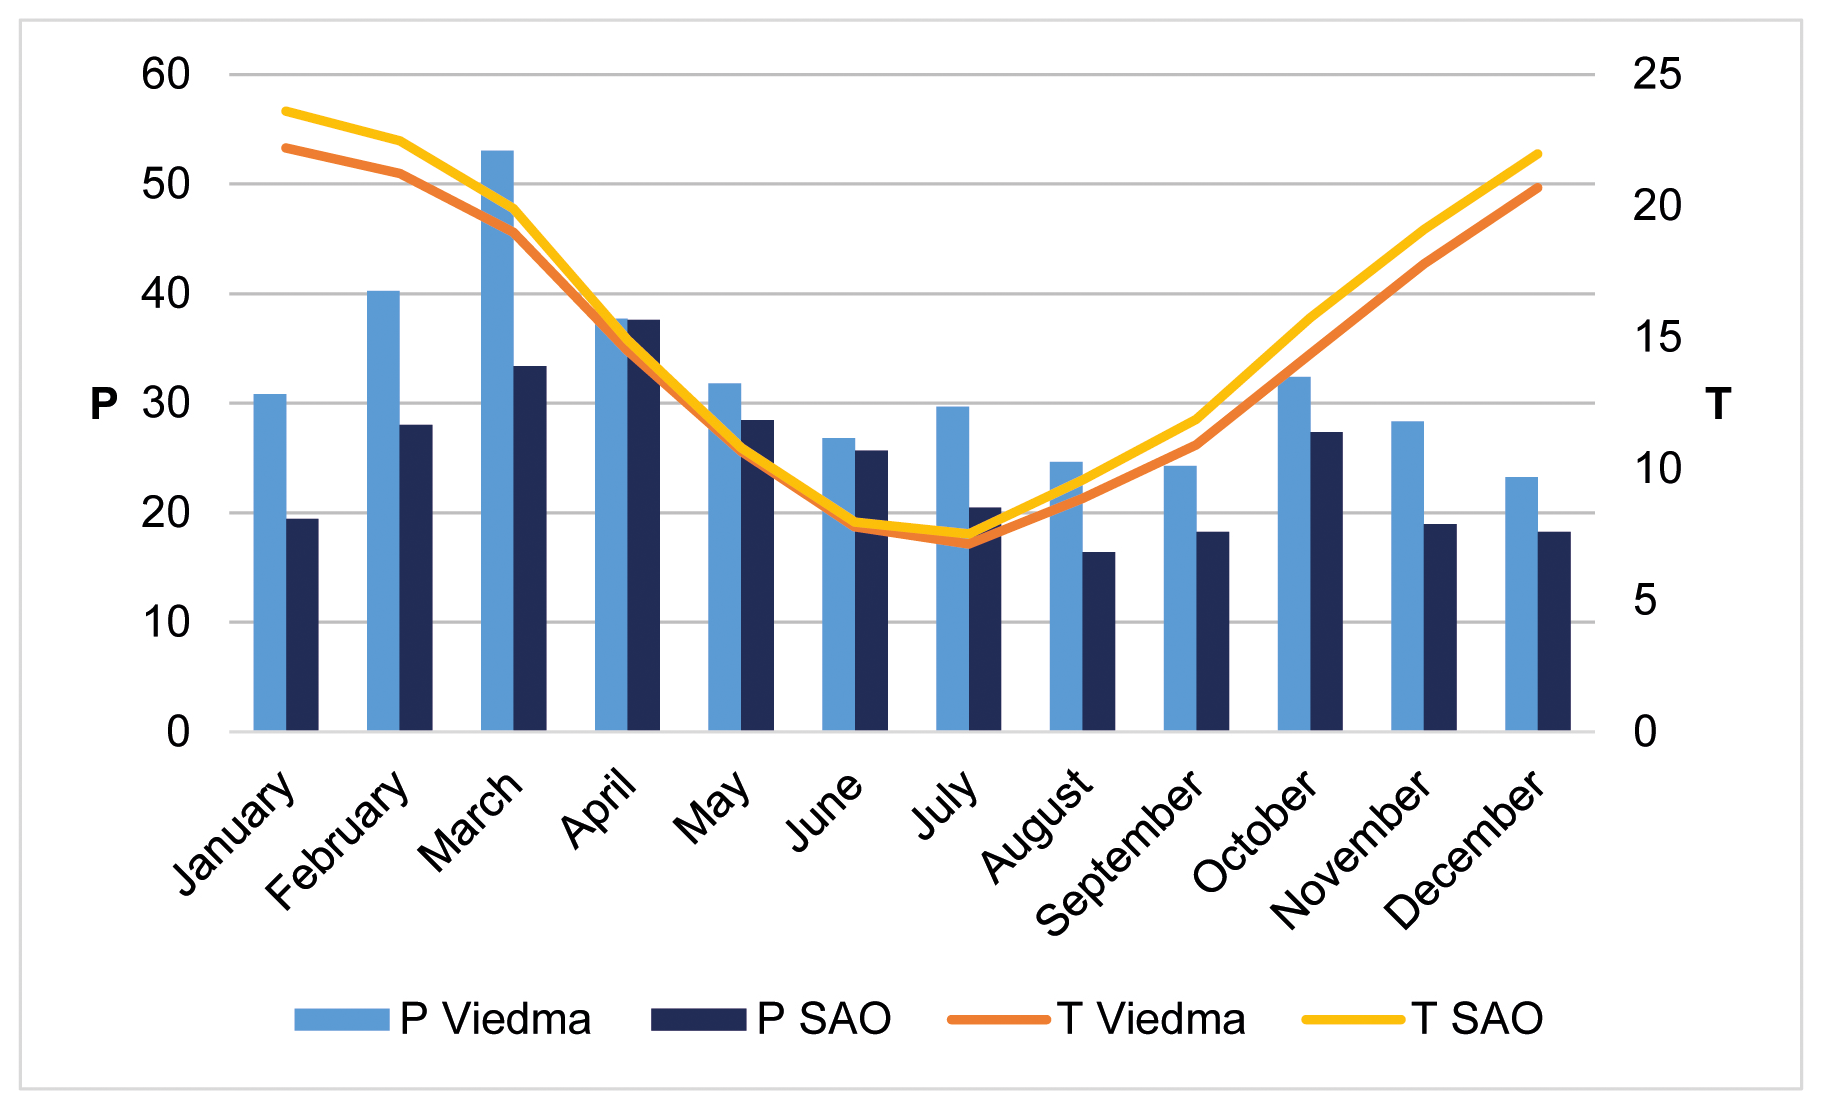
Figure 2Mean monthly temperature (°C) and total mean monthly rainfall (mm) between 1991 and 2020 registered in Viedma Aero and San Antonio Oeste Aero meteorological stations. P: precipitation; T: temperature.
The region lies within the belt of mid-latitude westerlies, driven by the South Pacific and South Atlantic anticyclones and the subpolar low-pressure channel (del Valle et al., 2008; Rusticucci et al., 2016; Montes et al., 2017). These winds induce a mean surface circulation towards the E–ENE (Saavedra, 2011; Pisoni, 2012). Wind speeds are generally highest during the austral summer, exacerbating aridity in an already dry environment shaped by the rain-shadow effect of the Andes (Montes et al., 2017). Dominant summer wind directions are W, SW, and NW. Easterly winds, associated with sea breezes, are more frequent in winter, bringing moisture, cloud cover, and dew (López Alfonsín et al., 2012; Agosta et al., 2019).
The Southern Annular Mode (SAM) is the dominant mode of extratropical climate variability in the Southern Hemisphere. Its positive phase is associated with a poleward contraction and intensification of the westerly wind belt, leading to warmer, drier conditions at mid-latitudes (∼ 40° S). Conversely, the negative phase is characterized by increased precipitation, cooler temperatures, and a northward expansion of storm tracks (Berman et al., 2012; Fogt and Marshall, 2020). A positive trend in the SAM index has been observed since the mid-20th century, particularly in summer, linked to greenhouse gas increases and stratospheric ozone depletion (Fogt and Marshall, 2020).
The El Niño–Southern Oscillation (ENSO) also influences regional climate. El Niño events are typically associated with increased annual precipitation (up to +50 mm) and higher autumn-winter temperatures in the study area, while La Niña phases correlate with reduced precipitation and cooler summers (Servicio Meteorológico Nacional, 2014). The interplay between SAM and ENSO can amplify or attenuate their individual climatic signals (Rusticucci et al., 2016).
The tides in the San Matías Gulf are semidiurnal, with a mean range of 6.67 m at San Antonio Este and 3.35 m near the Negro River mouth. The maximum high tide reaches 9.62 m and the minimum low tide is 0.14 m (Servicio de Hidrografía Naval, 2024). Typical wave heights range from 0.5 to 1.5, reaching up to 3 m during storms, with periods of 7–10 s (Wörner et al., 2019).
2.3 Geology and geomorphology
San Matías Gulf covers approximately 18 000 km2 with a maximum depth of 160 m (Isla, 2013). The gulf was flooded around 11 000 years BCE, with the post-glacial marine transgression peak (∼ 6000 years BCE) reaching about 6 m above present sea level, flooding depressions that now form coastal inlets and tidal flats (Isla, 1989; Mancini et al., 2005; Favier-Dubois and Kokot, 2011). A subsequent sea-level drop of 2–4 m, coupled with abundant sand supply and persistent westerlies, favored the development of extensive transgressive dunefields (Isla, 2013, 2017; Sander et al., 2018). Sand availability has also been linked to humidity fluctuations over the last 7500 years (Marcos et al., 2014), consistent with typical formation mechanisms for transgressive coastal dunefields (Hesp, 2013).
Table 1Presence or absence of spits, maximum dune width and height, dune migration rate, and direction of the transgressive dunefields within the study area. Vegetated and non-vegetated areas from dunefields were included to estimate their dimensions. Data sources: San Antonio Oeste (SAO) – San Antonio Este (SAE) (Carbone et al., 2007; Kokot and Favier-Dubois, 2017); Bajo la Quinta (Favier-Dubois and Kokot, 2011); Bahía Creek (Sander et al., 2018; Toffani, 2020); El Cóndor (Vergara Dal Pont et al., 2017); and Villa 7 de Marzo (Cortizo and Isla, 2012).
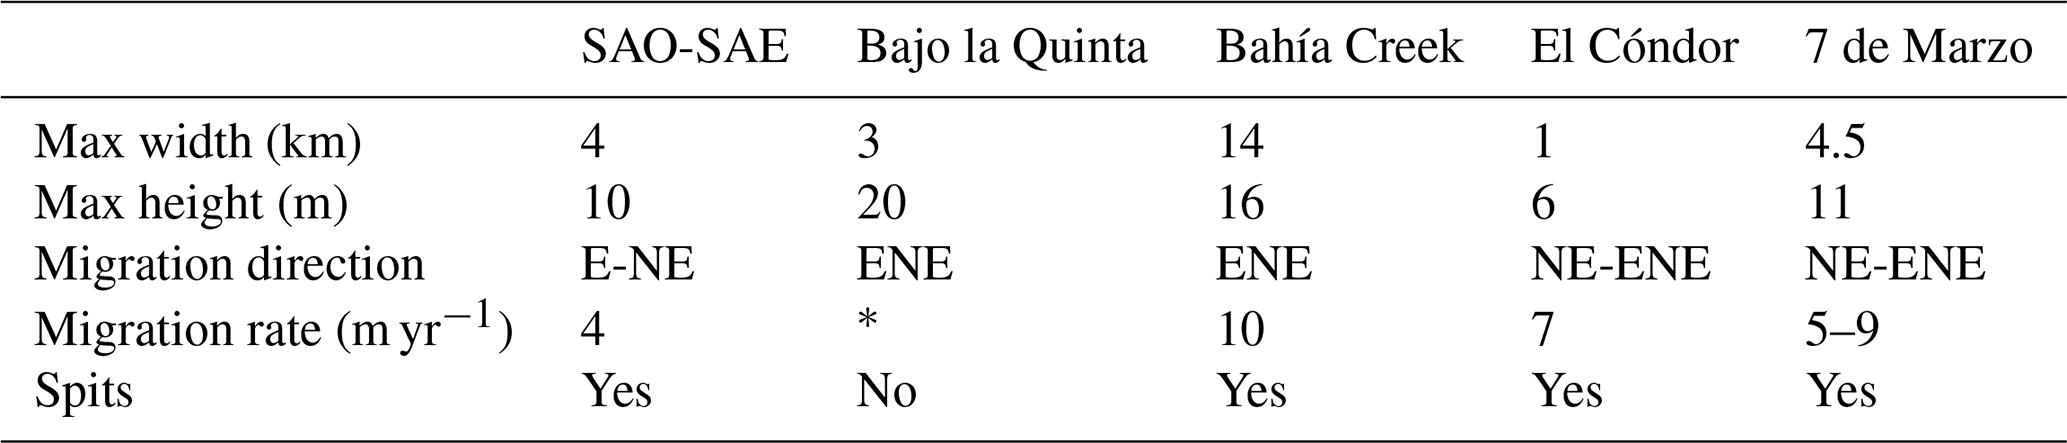
∗ No data available.
The northern coast of the gulf features active sea cliffs fronted by beaches, backed by cliff-top dunes where cliffs are present, and transgressive dunefields where cliffs are absent (Toffani, 2020). Major dunefields include Bahía Rosas (largely stabilized), Bahía Creek, Bajo la Quinta, San Antonio Este/Oeste, and El Cóndor-Villa 7 de Marzo (Table 1, Fig. 3) (Carbone et al., 2007; Cortizo and Isla, 2012; Kokot and Favier-Dubois, 2017; Vergara Dal Pont et al., 2017; Sander et al., 2018).
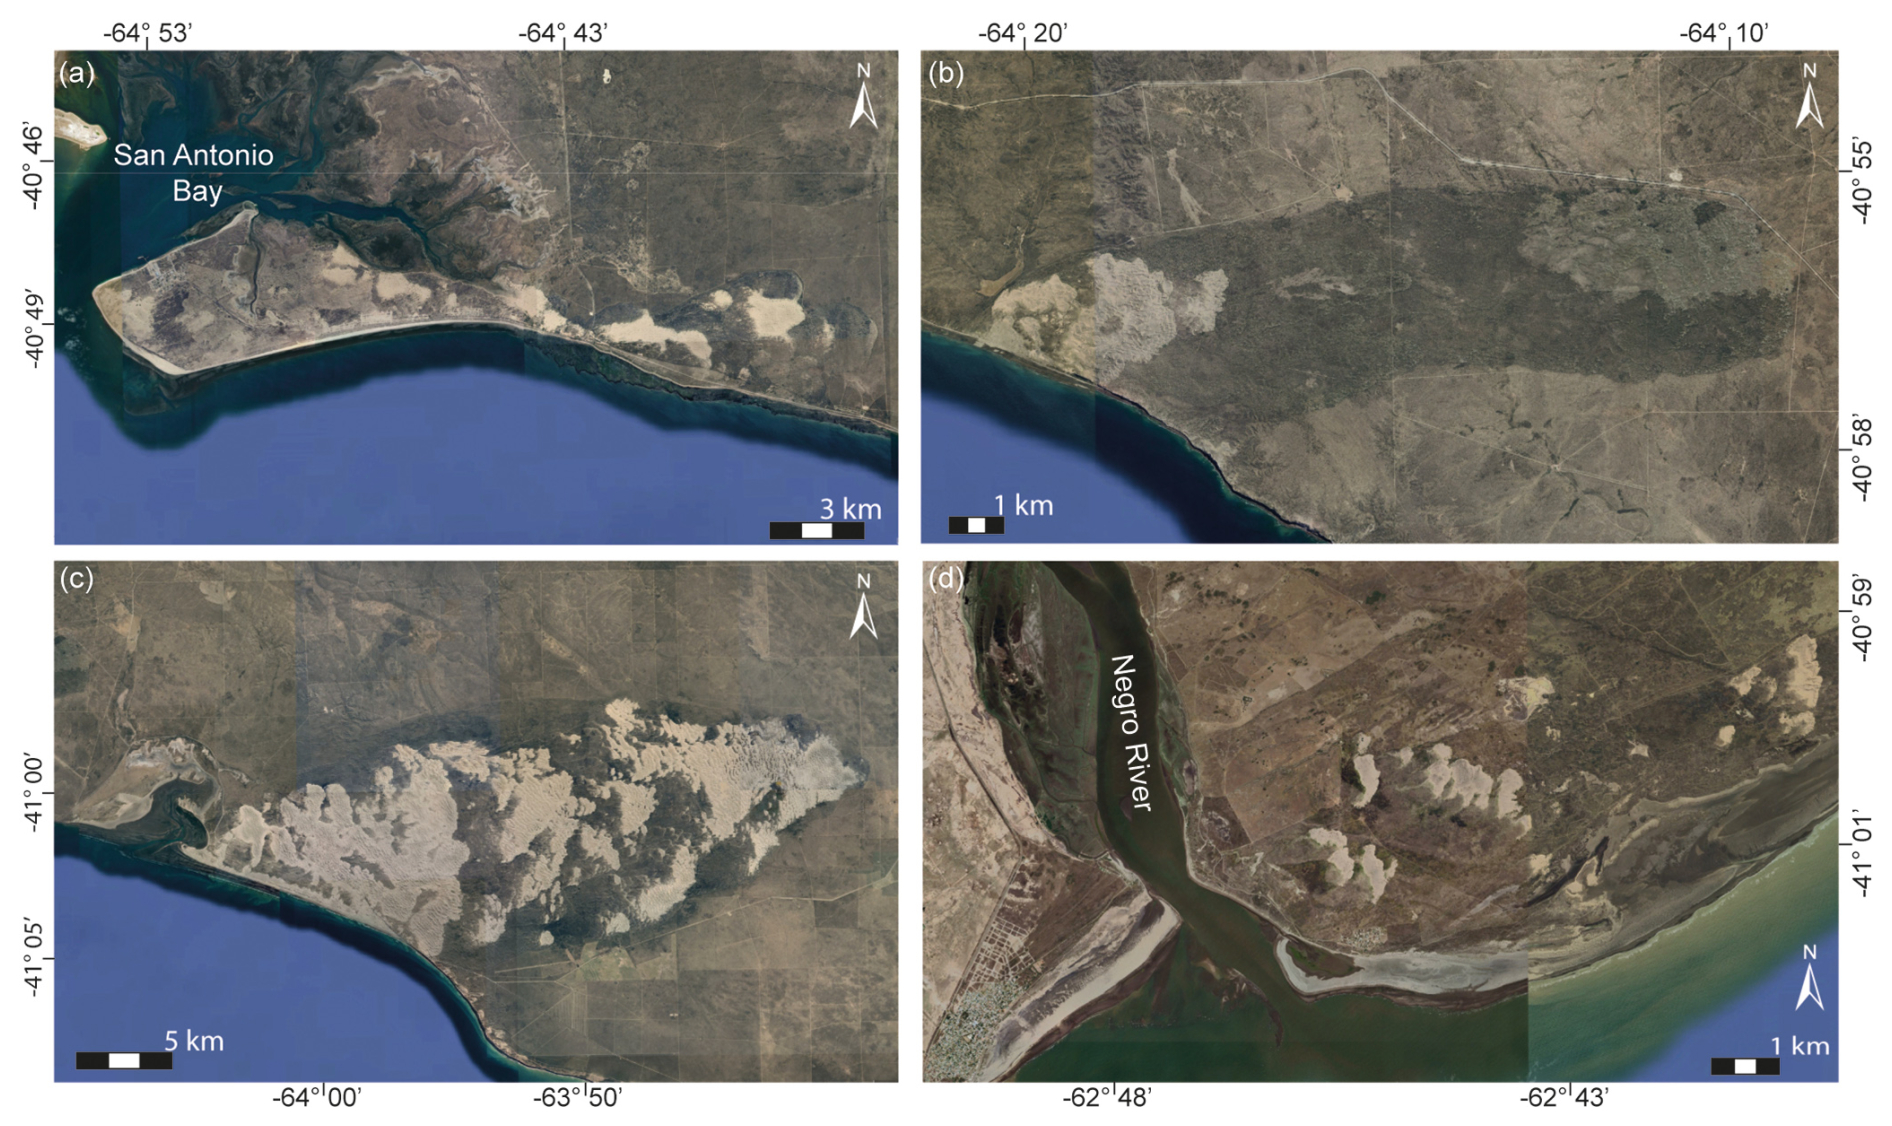
Figure 3Main dunefields within the study area. (a) San Antonio Este. (b) Bajo la Quinta. (c) Bahía Creek. (d) El Cóndor-Villa 7 de Marzo. Imagery © 2025 Airbus, Map data © 2022–2024 Google.
The cliffs are composed of sedimentary formations ranging from Oligocene to Holocene age, including the Gran Bajo del Gualicho, Río Negro, Baliza San Matías, Tehuelche, and San Antonio formations (Andreis, 1965; Angulo et al., 1978; Lizuain and Sepúlveda, 1978; Sepúlveda, 1983). These deposits, representing continental and marine facies, are the primary sediment source for the dunes, via cliff erosion, beach/tidal flat reworking, and dune recycling (Gelós et al., 1990; Zavala and Freije, 2005; Fucks et al., 2012; Toffani et al., 2020). Sandstone compositions indicate a dominant volcaniclastic contribution from the North Patagonian Cordillera, mixed with quartz-rich sand derived from the Holocene transgression and fluvial input from the Negro and Colorado rivers (Gelós et al., 1990).
The dunefields exhibit significant spatial variability in morphology, size, and activity (Table 1, Fig. 3):
-
San Antonio Oeste/Este (SAO/SAE): The dunefield extends up to 4 km in width, featuring barchanoid and transverse ridges, and blowouts. Dune heights reach up to 10 m, composed of fine to medium sand, migrating at an average rate of 4 m yr−1 towards the E–NE (Carbone et al., 2007; Kokot and Favier-Dubois, 2017).
-
Bajo la Quinta: An active dunefield buries Pleistocene-Holocene deposits. Dunes can reach 20 m in height and include barchanoid, transverse, and oblique forms (Favier-Dubois and Kokot, 2011).
-
Bahía Creek–Caleta de los Loros: This is the largest dunefield in the study area, extending over 36 km in length and 5–14 km in width. It features a complex assemblage of crescentic, linear, parabolic, embryo, foredunes, cliff-top, and climbing dunes, with minor occurrences of oblique, reverse, and star dunes. Active dunes cover ∼ 168 km2, reach heights up to 16 m, migrate ENE at 6–10 m yr−1, and are composed of medium to fine sand (Sander et al., 2018; Toffani, 2020). Vegetation patches, notably Sporobolus rigens and Hyalis argentea, form nebkhas.
-
El Cóndor–Villa 7 de Marzo: Near the Negro River mouth, this field consists of barchanoid and parabolic dunes extending 1–4.5 km inland. Migration is towards the NE–ENE at rates of 7 m yr−1 (El Cóndor) and 5–9 m yr−1 (Villa 7 de Marzo) (Cortizo and Isla, 2012; Vergara Dal Pont et al., 2017).
This diverse and dynamic coastal setting, with its well-defined climatic forcing, clear sediment sources, and varied dune morphologies, provides an optimal natural laboratory for developing and testing a predictive model of dune mobility based on meteorological parameters.
3.1 Climate analysis
Climatic data were obtained from the Viedma Aero and San Antonio Oeste Aero (SAO) meteorological stations operated by the SMN (Fig. 1). The study period was 1991–2020, during which at least hourly records were collected from 06:00 to 23:00 (local time/GMT-3). This time frame corresponds to a standard reference period for regional climatic studies, as recommended by the World Meteorological Organization (Wang, 2005). In Viedma, the data were recorded 7 m above the ground, while in SAO, they were recorded 20 m above the ground. Both datasets were normalized to 10 m standard acquisition data height (Touma, 1977; Robeson and Shein, 1997; Klink, 1999), according to the following Eq. (1) (Guevara Díaz, 2013):
where VZ is the wind speed to be estimated at the height (Z), where the measurement was taken; Vrefis the measured wind speed; Zrefis the standardized height above the ground; and “a” is the wind shear exponent (a=0.2 in this study, corresponding to crops and bushes).
Hourly wind speed and direction (grouped monthly), total monthly precipitation, and mean monthly temperature data were analyzed. The dataset provided one measure per hour for each variable: wind speed (km h−1), precipitation (mm), and temperature (°C). In addition, values for the SAM and the Southern Oscillation Index (SOI) were analyzed, obtained from the Natural Environment Research Council–British Antarctic Survey (NERC-BAS, 2025) and the National Oceanic and Atmospheric Administration (NOAA, 2025, https://www.noaa.gov/, last access: 26 August 2025), respectively. Wave height data were downloaded from a Copernicus reanalysis, while cattle population was obtained from several censuses from the Instituto Nacional de Estadística y Censos (INDEC) between 1960 and 2018.
Wind speeds exceeding 6.17 m s−1 were considered sufficient for sediment transport, based on Toffani (2020)'s calculations, which considered local grain size, environmental conditions, and Bagnold (1954)'s equations for the friction speed threshold, when sediment transport begins and the minimum velocity threshold for grains to travel by saltation. Annual and seasonal DP were calculated according to the formula developed by Fryberger and Dean (1979):
where Q represents transported sediments within a certain time t, V is the mean wind speed during t time, Vt is the minimum speed for wind saltation transport, and t is the wind blow time as a percentage. The Fryberger and Dean (1979)'s method was applied using wind velocity data expressed in knots, with 16 directional classes based on geographic coordinates (each 22.5°). DP indicates wind energy environments classified as low (< 200), mean (200–400), and high (> 400). From these, the RDP and RDD were calculated. This approach is commonly used to assess regional wind intensity and sand transport in areas receiving more than 50 mm of annual rainfall (Levin et al., 2014).
The Lancaster (1988) and Tsoar (2005) mobility indices were calculated to estimate a measure of dune migration:
Equation (3) represents the Tsoar index, which has been widely used to study dunefields across diverse environments worldwide, subjected to different climatic conditions. This index assumes that wind intensity is the most important factor in dune activity and is valid for sites with annual rainfall greater than 50 mm. Values below 1 represent fixed or vegetated dunes, whereas values above 1 correspond to dunes that are fully active or lack vegetation growth (Tsoar, 2005). Equation (4) represents the Lancaster index, where W is the wind percentage above the sand transport threshold, P is precipitation, and PE represents potential evapotranspiration, obtained using the Thornthwaite equation (Thornthwaite, 1948). This equation has also been successfully applied to assess dune behavior across different environments. According to Hugenholtz and Wolfe (2005), dunes are classified as inactive when M<50, as active crest dunes when 50 < M < 100, as active dunes except the interdune area when 100 < M < 200, and as fully active dunes when M > 200. For this study, dunes were considered active only when both the Tsoar index exceeded 1 and the Lancaster index exceeded 50 at the same time. This new index is a combination of the previous ones and is referred to here as the TsoLa index, which provides values that reinforce the characteristic of fixed or mobile dunes for every observation and also works better for the proposed model. In this case, 0 values refer to stabilized dunes, while 1 values refer to active dunes.
3.2 Statistical model
For the statistical analysis, RStudio software (R Core Team, 2024, version 2024.12.0), including the boot, broom, car, ggeffects, ggplot2, glm2, glm.predict, glmtoolbox, mosaic, ResourceSelection, ROCR, sjPlot, and vcd packages, was used to perform a multiple binary logistic regression, following the guidelines proposed by Hosmer and Lemeshow (1980), Kalil et al. (2010), and Stoltzfus (2011). This statistical method is used to establish the relationship between a set of continuous independent predictor variables and a binary categorical variable to model the probability of occurrence of an event, for which variables with p < 0.05 were considered significant, represented as in the software calculations (Zhu, 2016).
To perform the logistic regression, the independence of the predictor variables was considered through statistical correlation tests using the “cor.test()” function, with significance defined as p < 0.05 (Schober et al., 2018). Collinearity was evaluated to exclude correlated variables, seeking values closer to 1 (Daoud, 2017). Likewise, the less frequent results concerning the number of independent variables were considered to avoid overfitting (ratio equal to or greater than 10) (Kalil et al., 2010). The outliers were calculated based on the third quartile plus 1.5 times the interquartile range. However, they were retained in the analysis as they were interpreted as valid extreme environmental values rather than measurement errors. Once the individual variables met the selection criteria, they were combined in the model, which was tested using the “stats::step(model)” function to identify if the overall model performed better with or without each variable. Thus, the final models included monthly values (1991–2020) of the SAM index, total monthly precipitation, and monthly average wind speed as independent predictor variables. Temperature, potential evapotranspiration, and soil moisture were excluded due to multicollinearity, while wave height, cattle population, and SOI and NDVI indices were excluded to improve the model performance. Moreover, monthly data for cattle and NDVI were considered unreliable due to limited availability and minimal temporal variability. The binary categorical variable was defined using a combination of the Tsoar and Lancaster indices and RDD values. A value of 0 was assigned when the dunes behaved as fixed in at least one index and/or when the RDD values ranged between 181 and 360°. Conversely, a value of 1 was assigned when they behaved as active in both indices and the RDD values ranged from 1 to 180°, consistent with the general drift direction for dunes along the coast.
The estimated probability for each model, known as the Logit function (), is:
where X1, X2, …, Xn are the different predictors and β1, β2, …, βn are their associated coefficients (Herrera Briones, 2023). If the regression coefficient βi is positive (negative), an increase in the explanatory variable Xi increases (decreases) the probability of the event () (Sperandei, 2014). The inverse function of the Logit is the cumulative distribution function, also known as the sigmoid function, which is used to plot the probabilities of occurrence of an event (Jansche, 2005).
To build the statistical model, the dataset was randomly split, allocating 70 % for training and 30 % for testing. The accuracy of the models for both subsets was evaluated by calculating the proportion of correct predictions made by the model relative to the total number of predictions made. To separate these classes, a threshold value was determined that maximized or minimized a specific metric (between 0 and 1). This optimal cut-off point was identified using the “opt.cut” function. In this study, priority was given to minimizing false negatives, which correspond to cases where dunes mobility is not predicted despite the actual movement, given the potential risks this poses to nearby coastal villages and for coastal management applications based on coastal dunes dynamics. To achieve this, the cut-off value that maximizes sensitivity (true positive rate) was selected. Additionally, the receiver operating characteristic curve (ROC) and the area under the curve (AUC) value were used to evaluate the model's performance. An AUC value greater than 0.5 indicates that the model performs better than random guessing. However, the model is overfitted when this value is close to 1 (Wei and Dunbrack, 2013).
The goodness of fit of the model was evaluated, i.e., how well it can predict whether a dune is fixed or mobile, using the chi-square regression test (with p < 0.05 considered statistically significant) (Healy, 2006) and the Hosmer–Lemeshow test, where p > 0.05 indicates adequate fit (Hosmer and Lemeshow, 1980). Finally, internal validation of the predictive values was also performed using a bootstrapping method (Steyerberg et al., 2001).
3.3 Remote sensing and dunes migration
Satellite and aerial images were processed to estimate dune migration rates between 1985 and 2023. Visible-spectrum satellite images with three spectral bands and a spatial resolution of 1.05 to 1.25 m (except one Landsat image from 1985 from the Viedma area), were obtained from Google Earth for the years 1985, 2003, 2004, 2009, 2010, 2013, 2016, 2019, 2020, and 2023 (Table 2). In addition, a 1986 aerial photograph with a spatial resolution of 2.35 m and three spectral bands was obtained from the Instituto Geográfico Nacional for the San Antonio area (Table 2). Most images from the Viedma area were acquired during spring, whereas those from San Antinio correspond to both spring and autumn. The spatial resolution was determined by measuring individual pixels in ArcGIS Pro 3.4.0 software and verified using the image properties in QGIS 4.0.2. Due to cloud cover, portions of the dune fronts could not be identified in the 2009 image from Viedma. The images were processed using ArcGIS Pro 3.4.0, georeferenced using ground control points, primarily located in the towns of San Antonio Este and Villa 7 de Marzo, orthorectified, and projected to the WGS 84/UTM Zone 20 S coordinate system.
Table 2Date of acquisition and spatial resolution from utilized imagery.
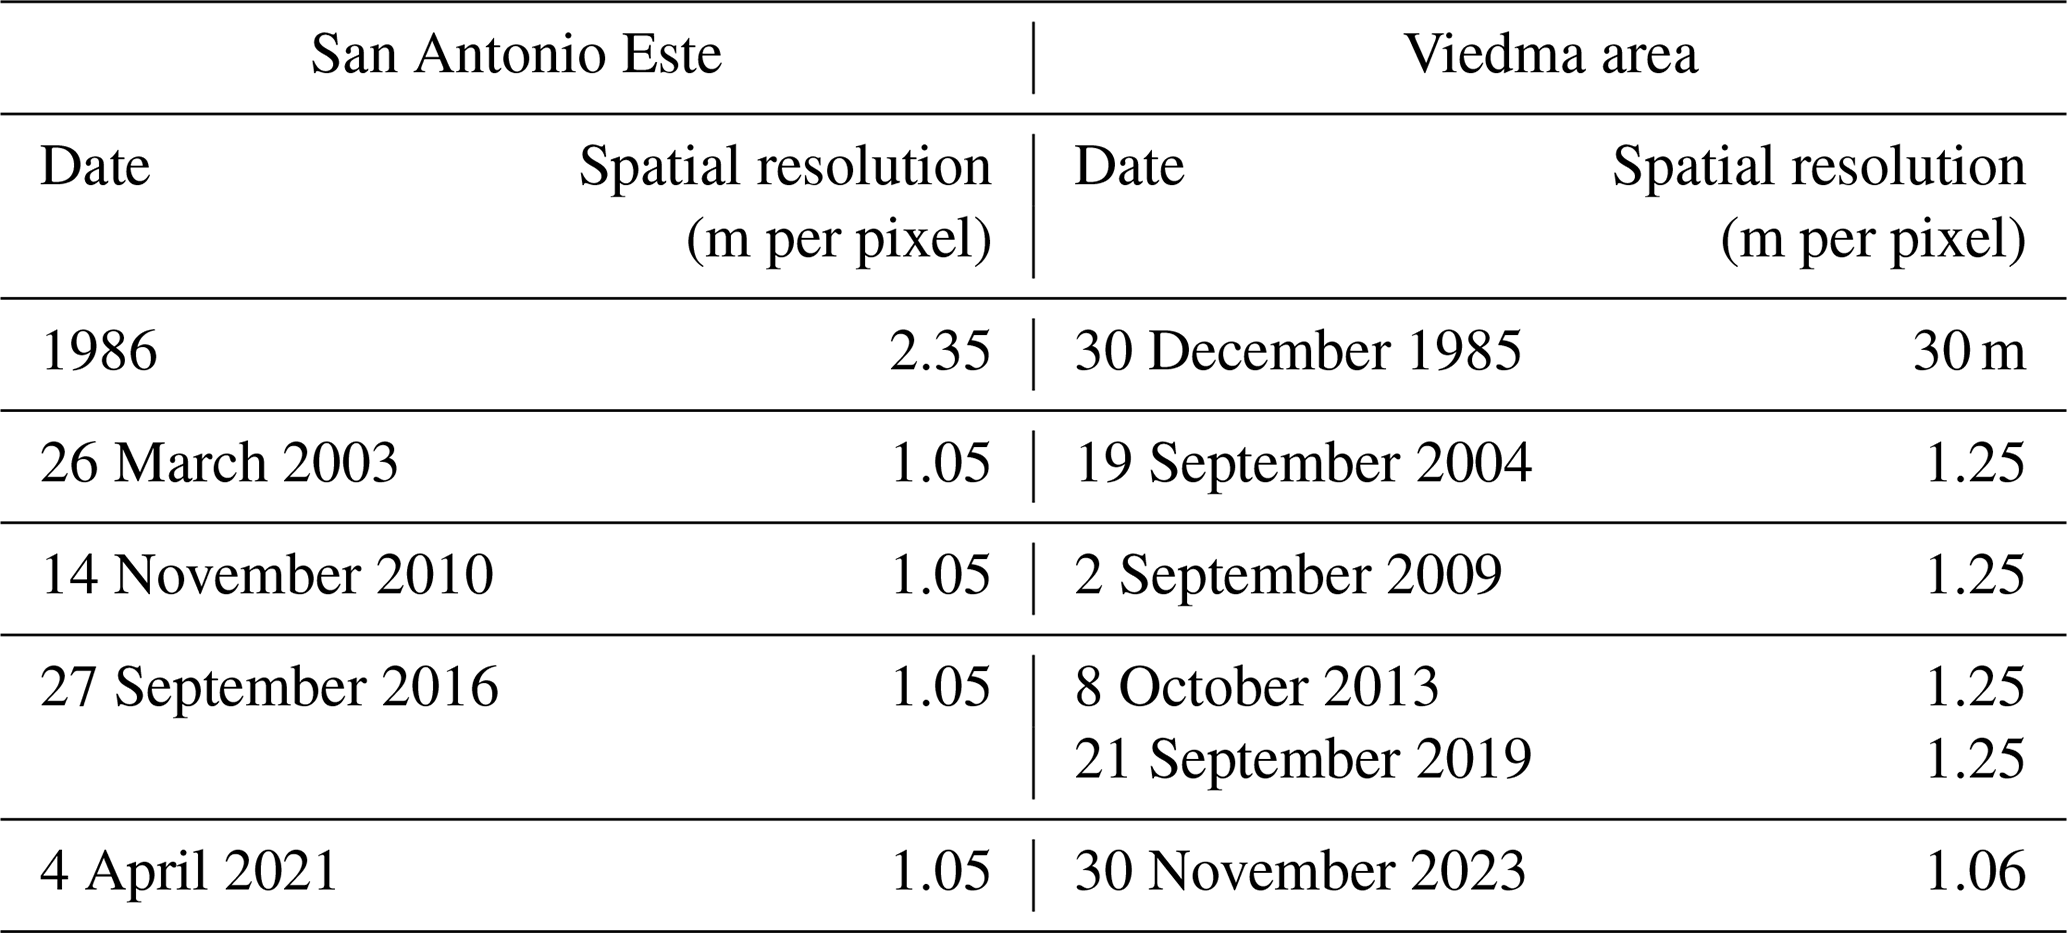
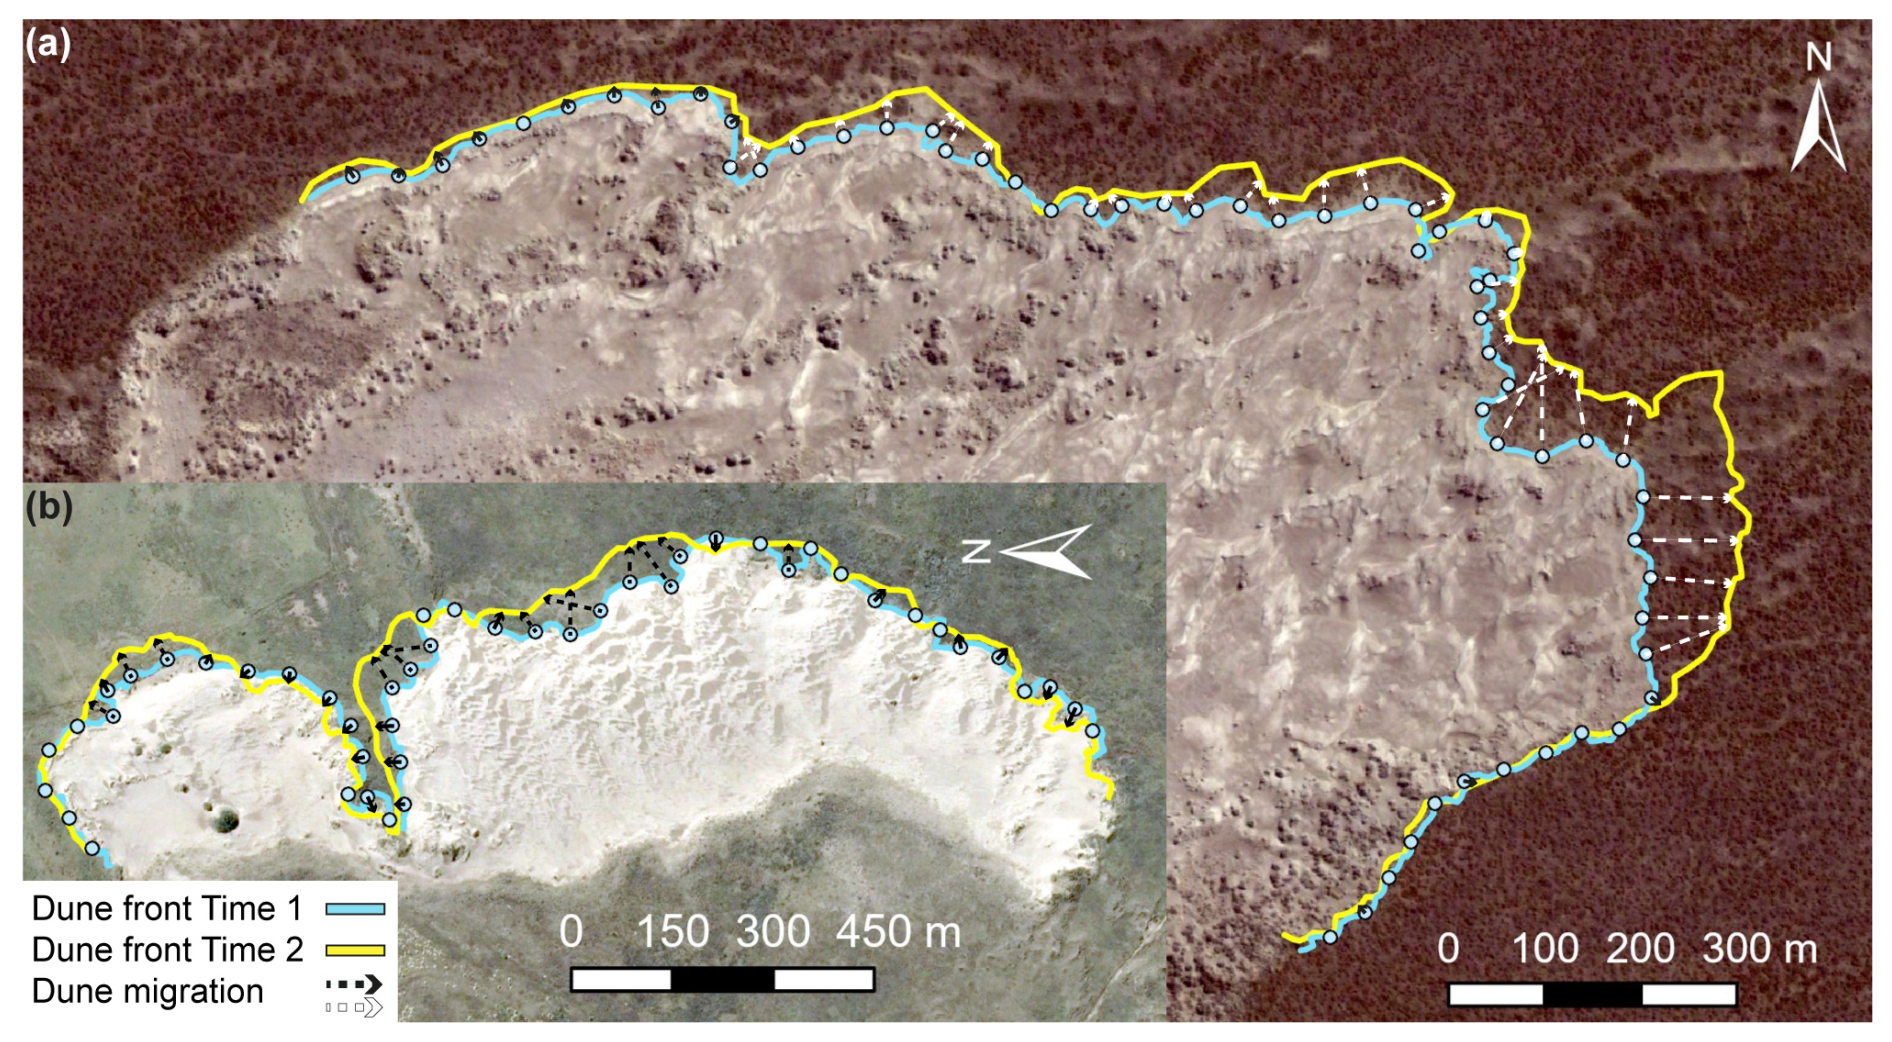
Figure 4Examples of dune-front measurement procedure in San Antonio Este (a) and Viedma (b). Reference points were automatically generated at 50 m intervals using GIS software, whereas arrows were manually drawn perpendicular to the older dune front (Time 1) toward the corresponding position of the subsequent dune front (Time 2). Very short arrows are omitted for clarity. Dune fronts correspond to 2016 and 2021 in panel (a), and to 2013 and 2019 in panel (b). The locations of the illustrated dunes are shown in Fig. 13. Image © 2026 CNES/Airbus, Map data 2013 and 2016 Google.
Dune fronts and selected slipface toes of unvegetated dunes were manually digitalized where the boundary between bare sand and vegetation was clearly identifiable. The extent of the dune surface was delineated based on dune morphology and pixel color, with bare sand appearing lighter than the surrounding vegetated areas. Only images in which these features could be reliably distinguished were included in the analysis; for example, the September 2019 image from San Antonio Este was excluded because the spectral similarity between bare sand and adjacent sand sheets prevented accurate delineation. Migration rates were estimated following an approach similar to that of Tsoar and Blumberg (2002), Yao et al. (2007), and Ding et al. (2020). Reference points were automatically placed at 50 m intervals along each digitalized dune front (slipface toe), with lengths ranging from 500 to 1450 m. Orthogonal distances between each reference point and the corresponding dune front position in the subsequent image were manually measured in the GIS to calculate migration rates, obtaining a mean value from all of measurements for each time period (Fig. 4). To ensure that distances were measured perpendicular to the dune front, a short line segment was drawn at each reference point, and the measurement was taken at 90° to this segment. If there was retreat at a certain point, the measured value was negative. The root mean square error (RMSE) values were always below the spatial resolution of the images, indicating minimal position error. Meteorological data from the SAO station were compared with dune activity in the San Antonio Este dunefield, located 13 km away. Likewise, data from the Viedma meteorological station were compared to the El Cóndor-Villa 7 de Marzo dunefield, located 26 km away, distances equal to or less than those considered acceptable by Hugenholtz and Wolfe (2005).
4.1 Climate analysis
According to the established procedures (Sect. 3.2), i.e., the independence of the predictor variables, collinearity, and model test performance, the optimal model for each location included the Southern Annular Mode (SAM), precipitation, and wind speed as predictor variables. A total of 360 data measurements per variable were used for each meteorological station to develop the models. Overfitting was assessed based on the frequency of the least common outcome relative to the number of independent variables (n=3), resulting in at least 30 events of each possible outcome (0 and 1). Variance Inflation Factor (VIF) values were below 1.08 in SAO and below 1.16 in Viedma, indicating no multicollinearity. Precipitation ranged from 122 to 578 mm in SAO and from 214 to 653 mm in Viedma, while SAM index values varied between −5.77 and 4.92. For wind, a more exhaustive analysis was performed. Winds exceeding the minimum threshold accounted for 33.7 % of the total observations for the 1991–2020 period in SAO and 30.6 % in Viedma, mainly blowing from the NW and SW in both cases (Fig. 5). According to the Tsoar index, dunes were identified as active in 119 months (33.1 %) in SAO and in 268 months (74.4 %) in Viedma. Using the Lancaster index, dunes were classified as mobile during 254 months (70.6 %) in SAO and during 247 months (68.6 %) in Viedma. When both indices were considered simultaneously, active dune conditions were recorded in 82 months (22.8 %) in SAO and in 160 months (44.4 %) in Viedma. Monthly DP values in SAO ranged from 30 to 1976, averaging 549. In Viedma, DP values ranged from 55 to 6203, with a mean of 1176 (Fig. 6). Overall, higher DP values were recorded during the austral summer, with NW, SW, and SE as main components, while lower values were typical in autumn. During the remainder of the year, most records correspond to the NW component, with the addition of the SW component during spring in Viedma, where in general stronger winds were registered (Fig. 7). The RDD values suggest a general trend of dune migration toward the east. Over the full study period, the mean RDD was 90 ° in SAO and 89 ° in Viedma. A decreasing trend in DP values was observed in Viedma over time (Fig. 8). In contrast, although fluctuations were recorded in SAO, DP values remained relatively stable over the study period (Fig. 8). RDP values generally follow these tendencies.
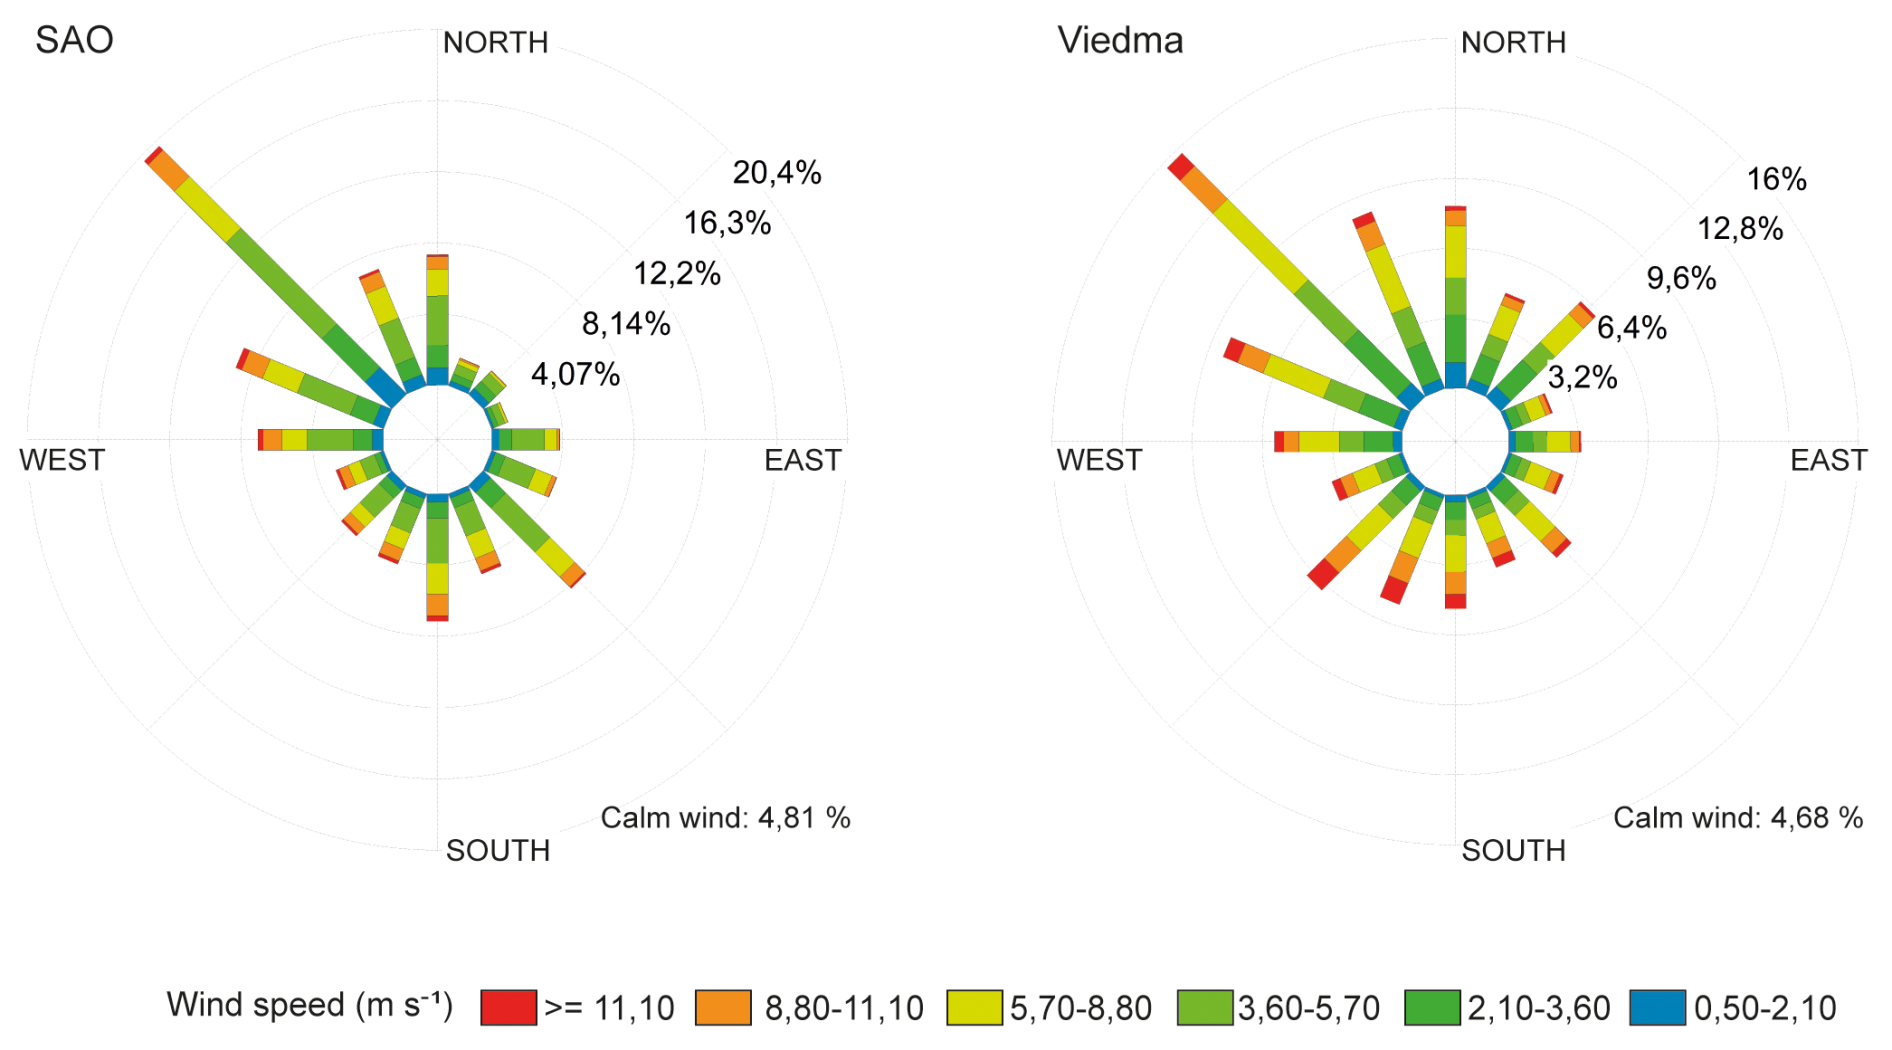
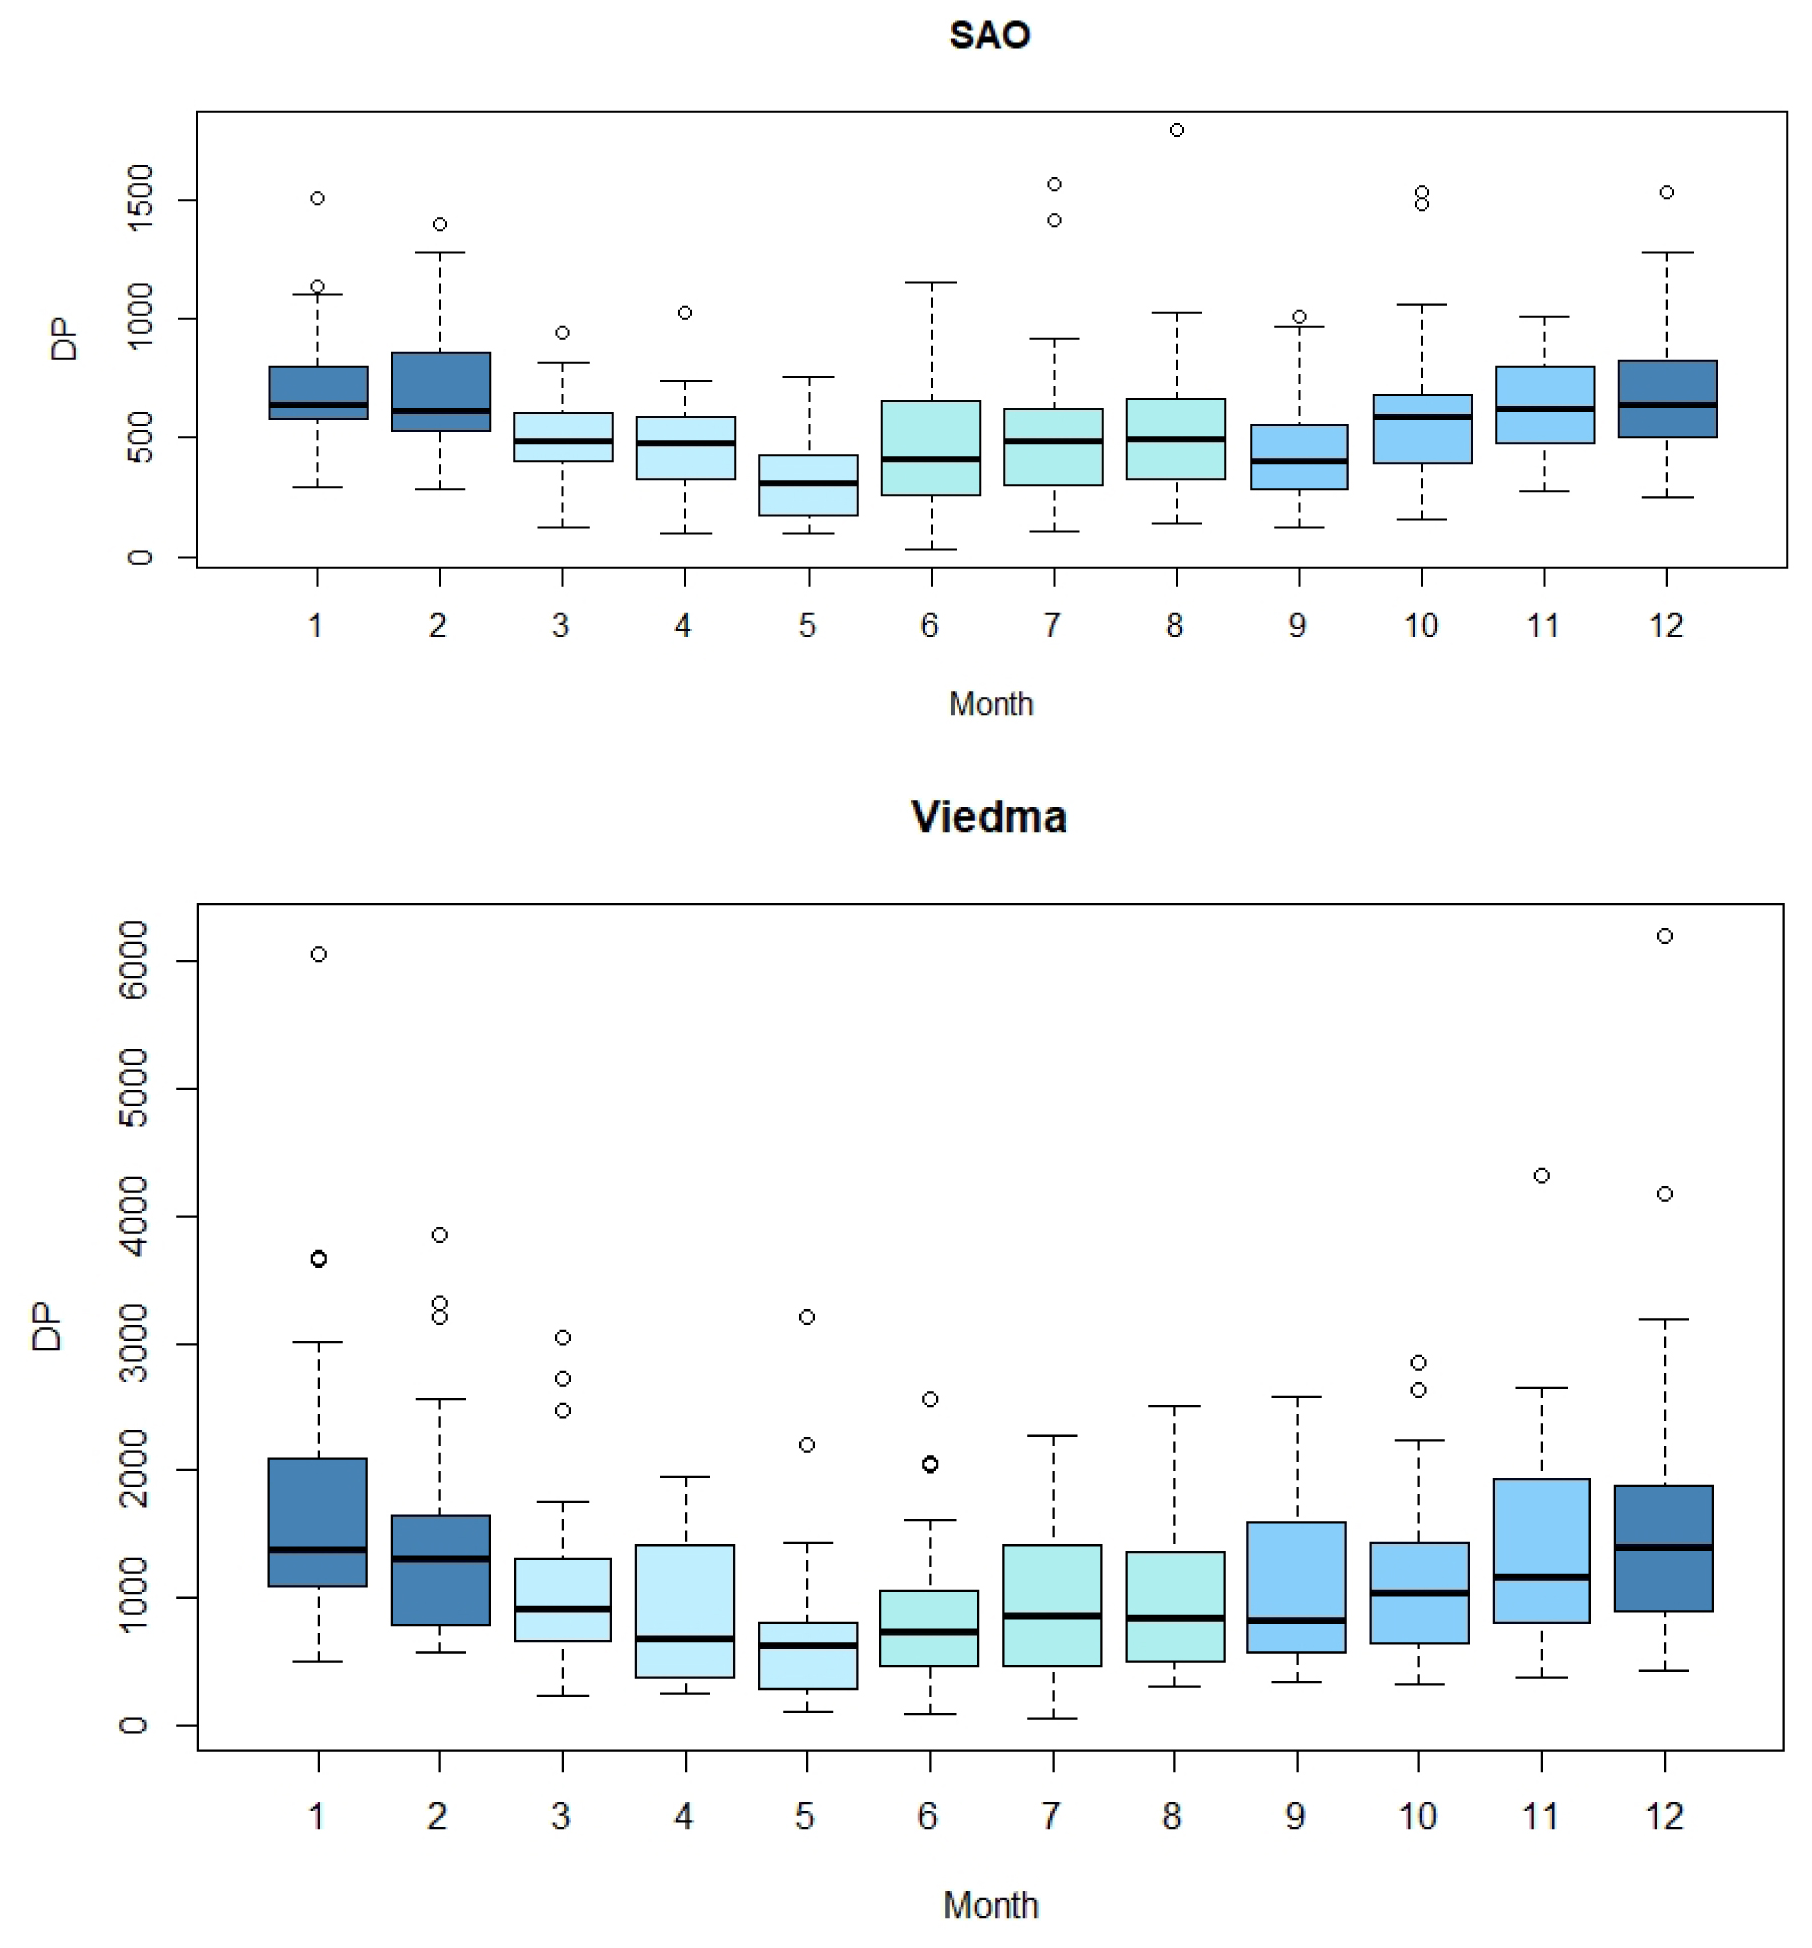
Figure 6Boxplots showing the monthly Drift Potential values obtained from SAO and Viedma meteorological stations during the 1991–2020 period.
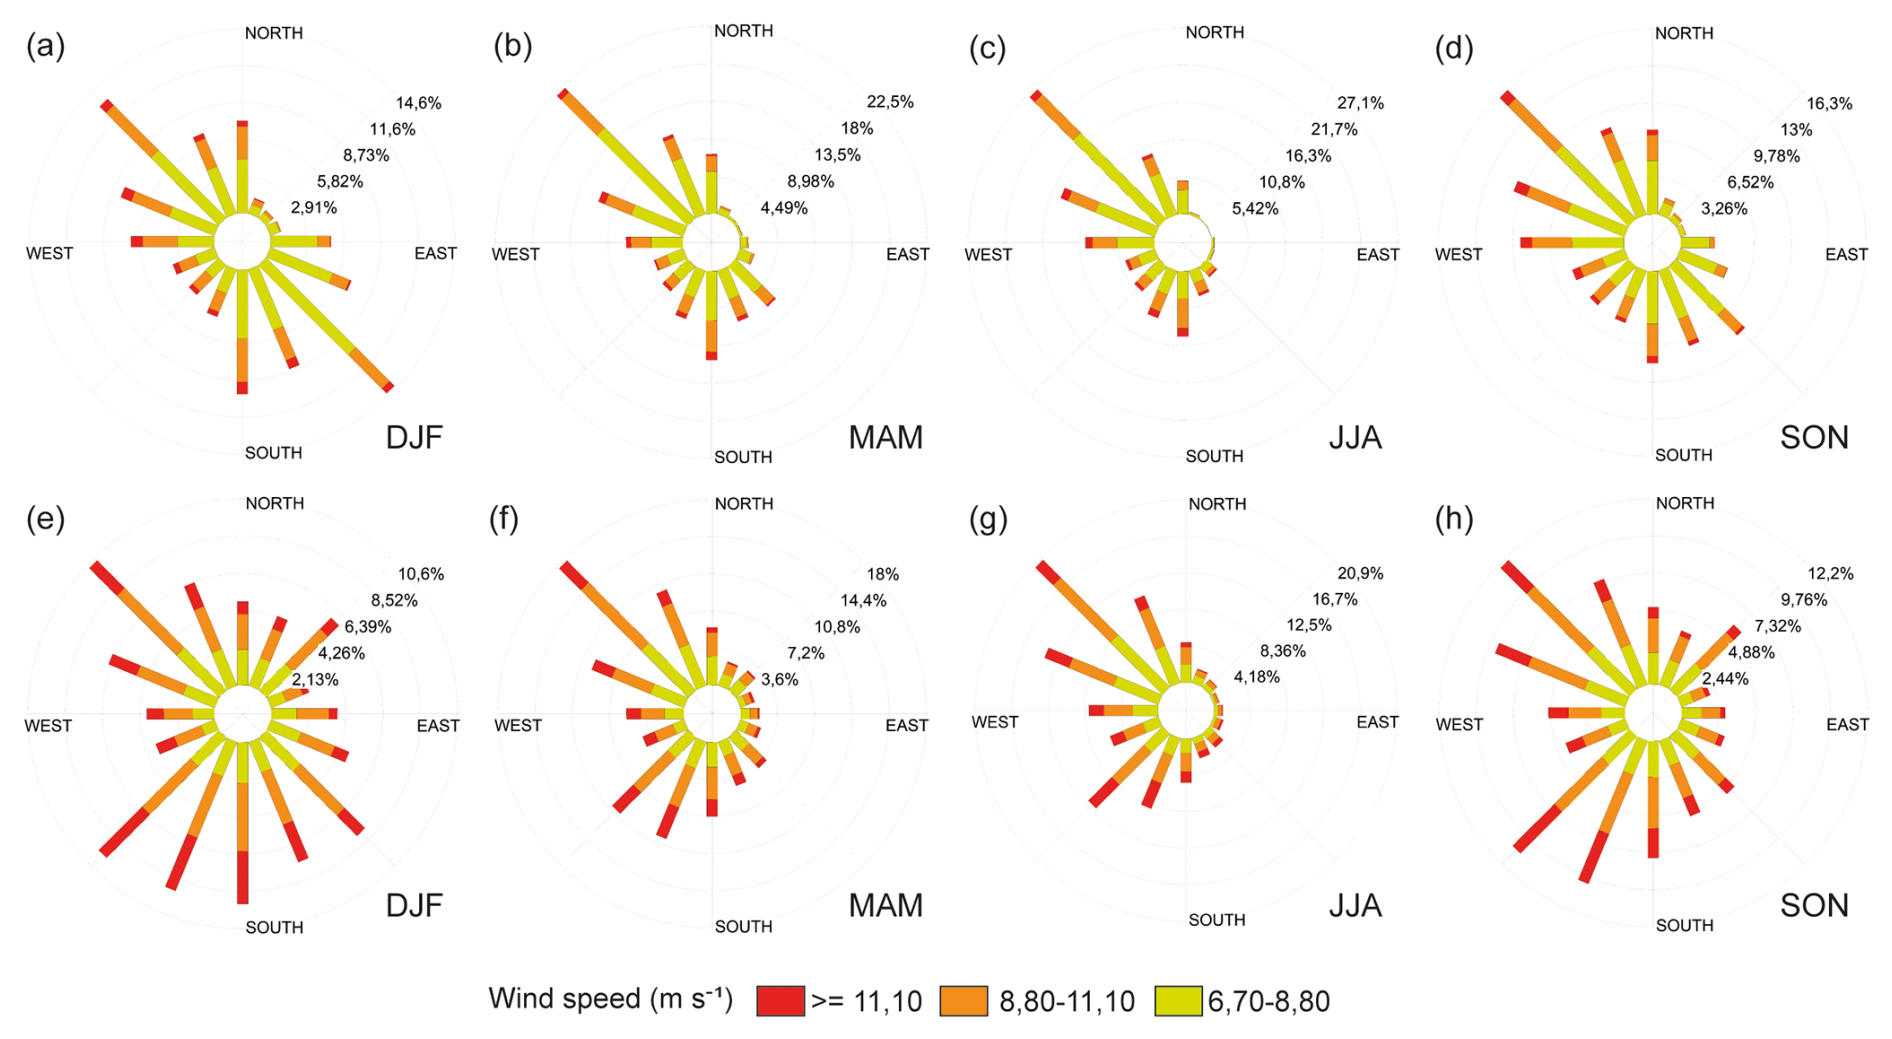
Figure 7Seasonal winds above the sediment transport threshold for the 1991–2020 period. (a–d) San Antonio Oeste, (a) summer, (b) fall, (c) Winter, (d) spring. (e–h) Viedma, (e) summer, (f) fall, (g) winter, (h) spring.
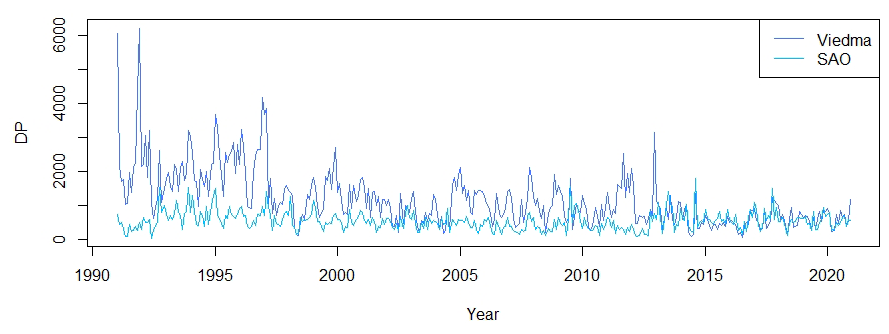
Figure 8Drift Potential variation between 1991 and 2020, according to the recorded winds in Viedma and SAO.
4.2 Statistical model
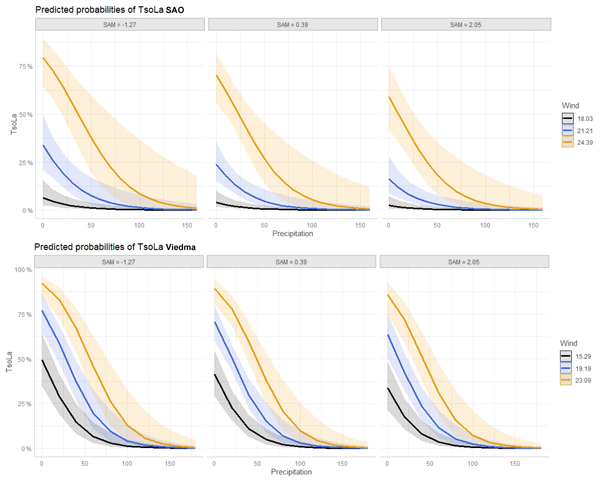
For both study areas, the logistic regression model identified three significant predictors of dune migration: SAM, precipitation (P), and wind speed (Wind) (Table 3). In the SAO region, significance levels were p=0.01 for SAM, p=0.001 for precipitation, and p < 0.001 for wind speed. In Viedma, all three predictors also showed statistical significance (p=0.04 for SAM, p < 0.001 for precipitation, and p < 0.001 for wind speed). The estimated coefficients indicate that SAM and precipitation have a negative effect on dune migration probability, while wind speed has a positive effect. Considering the binary outcome included in the model from the TsoLa index, values of 1 refer to mobile dunes, while 0 values correspond to fixed dunes. This suggests that the probability of dune migration (i.e., the event coded as 1) increases when wind speeds are higher or if precipitation and SAM index values decrease. Coefficient values further support this interpretation: in the SAO region, estimates were −0.3 for SAM, −0.04 for precipitation, and 0.64 for wind speed; in Viedma, the values were −0.2, −0.04, and 0.32, respectively. The combined influence of these three variables determines the final predicted probability of dune migration for each observation (Table 3). A response curve was generated to visualize these relationships (Fig. 9), illustrating that dune migration is unlikely when precipitation exceeds 150 mm, wind speeds fall below 20 km h−1, or SAM values are high. The final equations for this model are:
Where p represents the probability of occurrence of dune migration. Precipitation, wind speed, and SAM index variables can be replaced with actual values to evaluate the final result (outcome). Equation (6) is for SAO, and Eq. (7) is for Viedma. If it is > 0.2 (SAO) or > 0.4 (Viedma), dunes will probably migrate, while if it is < 0.2 (SAO) or < 0.4 (Viedma), dunes will probably not migrate.
Table 3SAO and Viedma logistic regression estimates (log-odds), 95 % confidence intervals (CI), and p-values are shown for each predictor. p < 0.05 values result significant to the model.
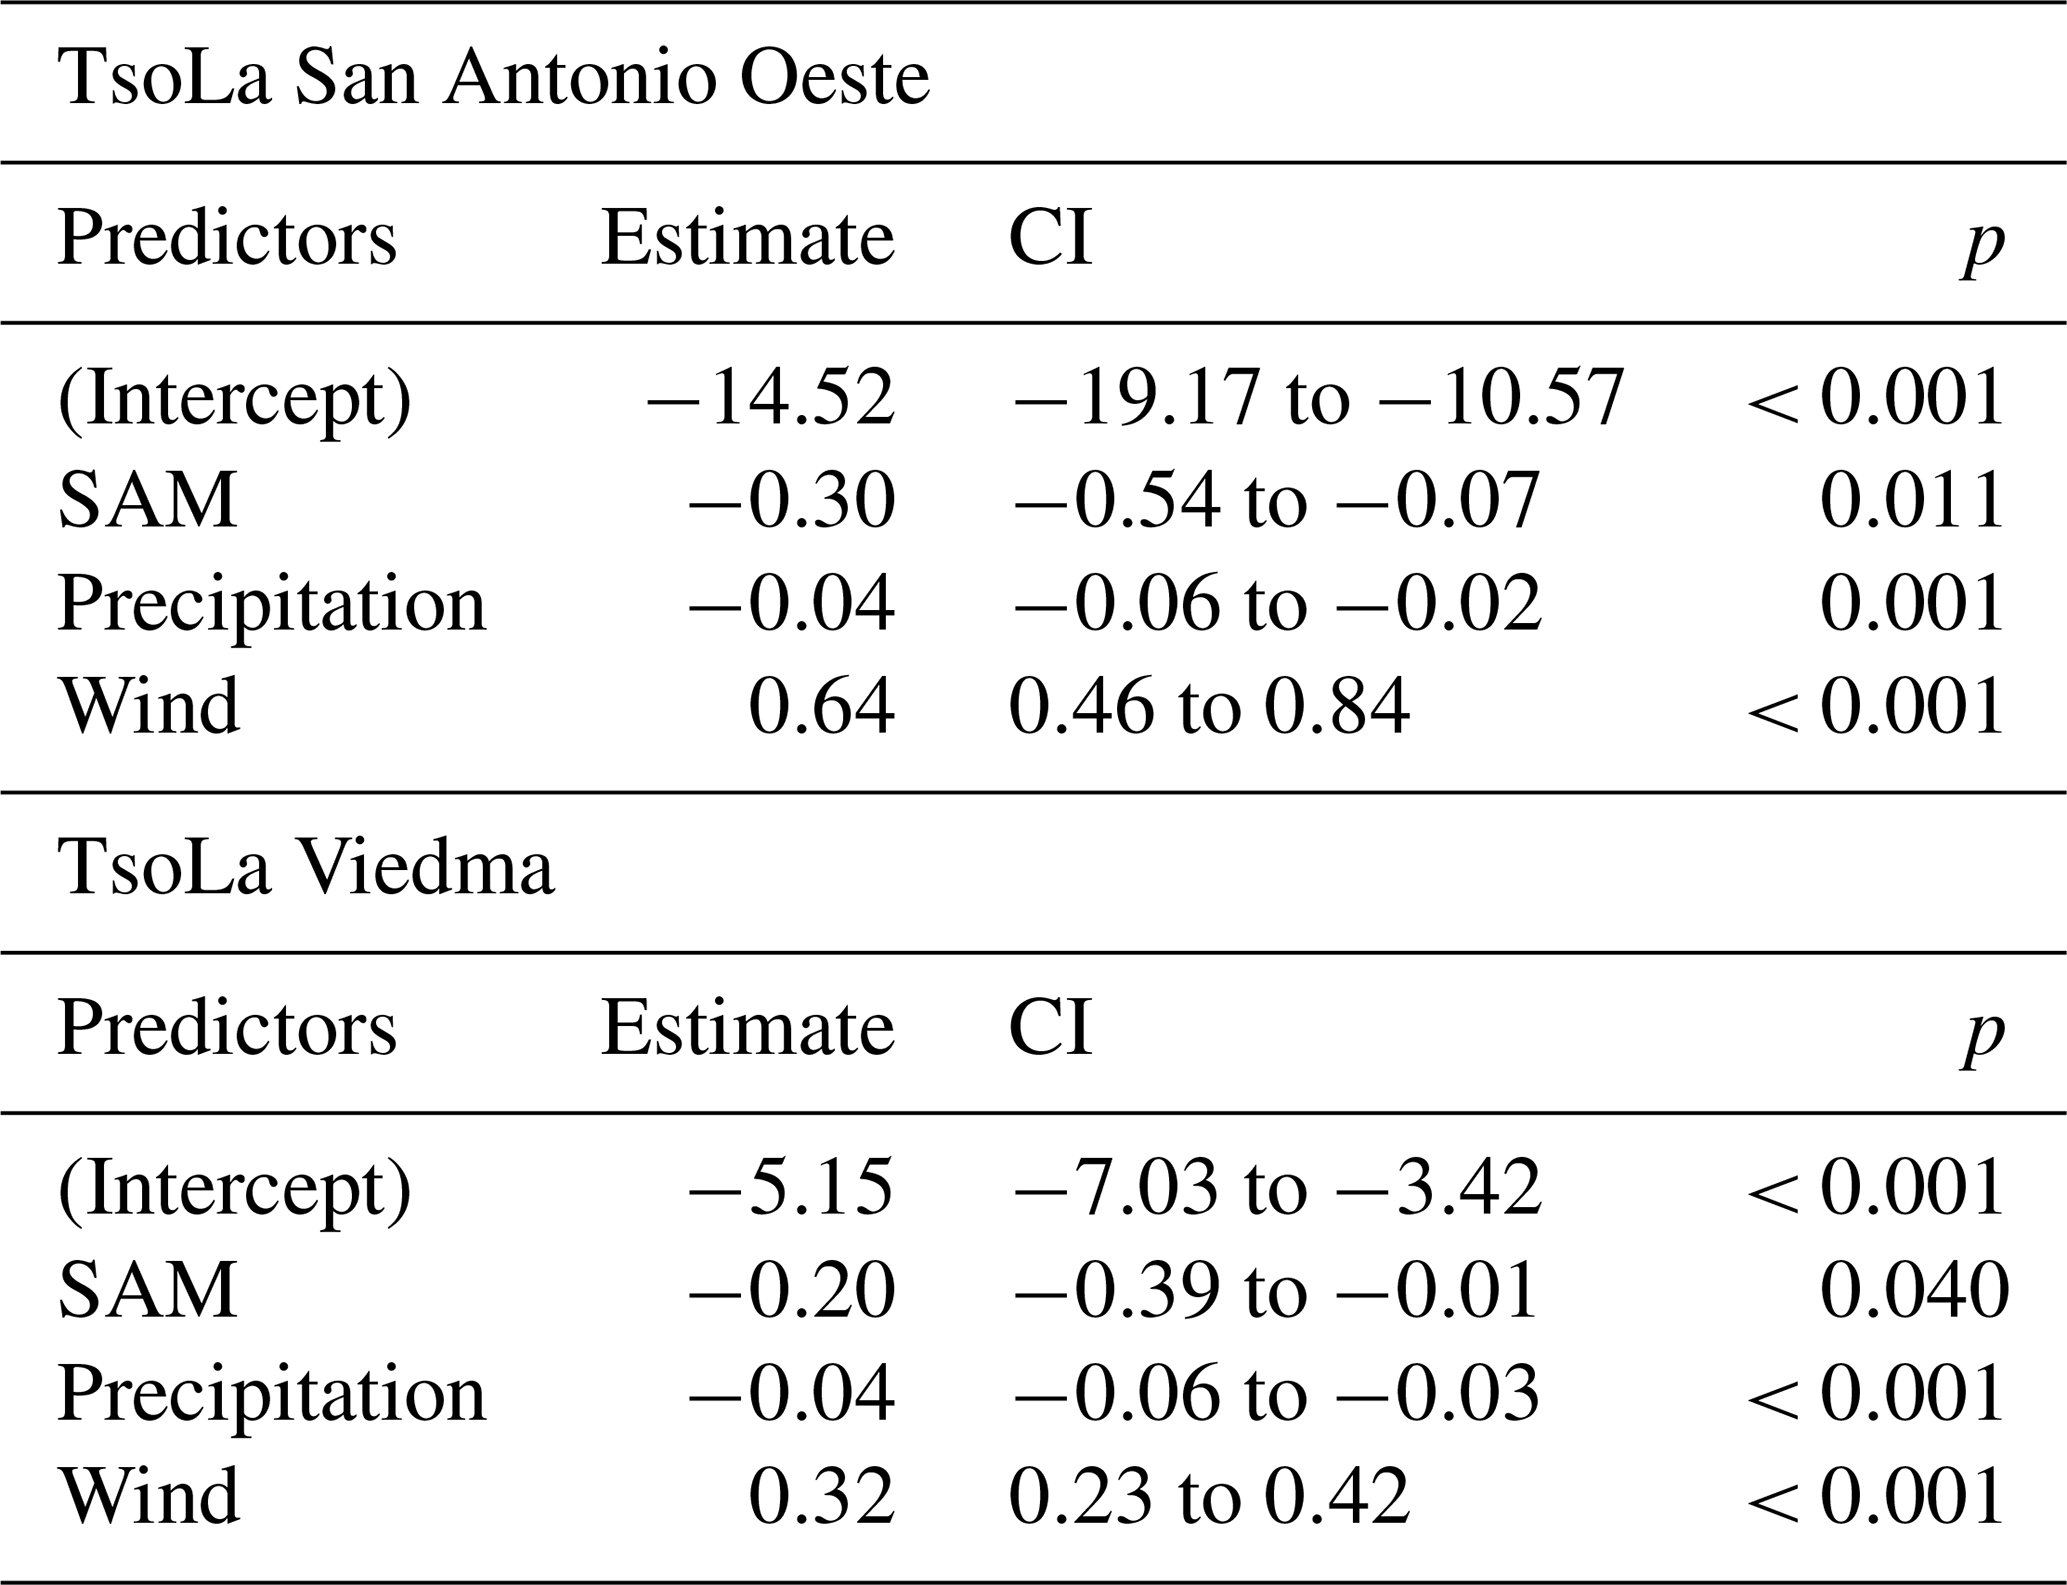
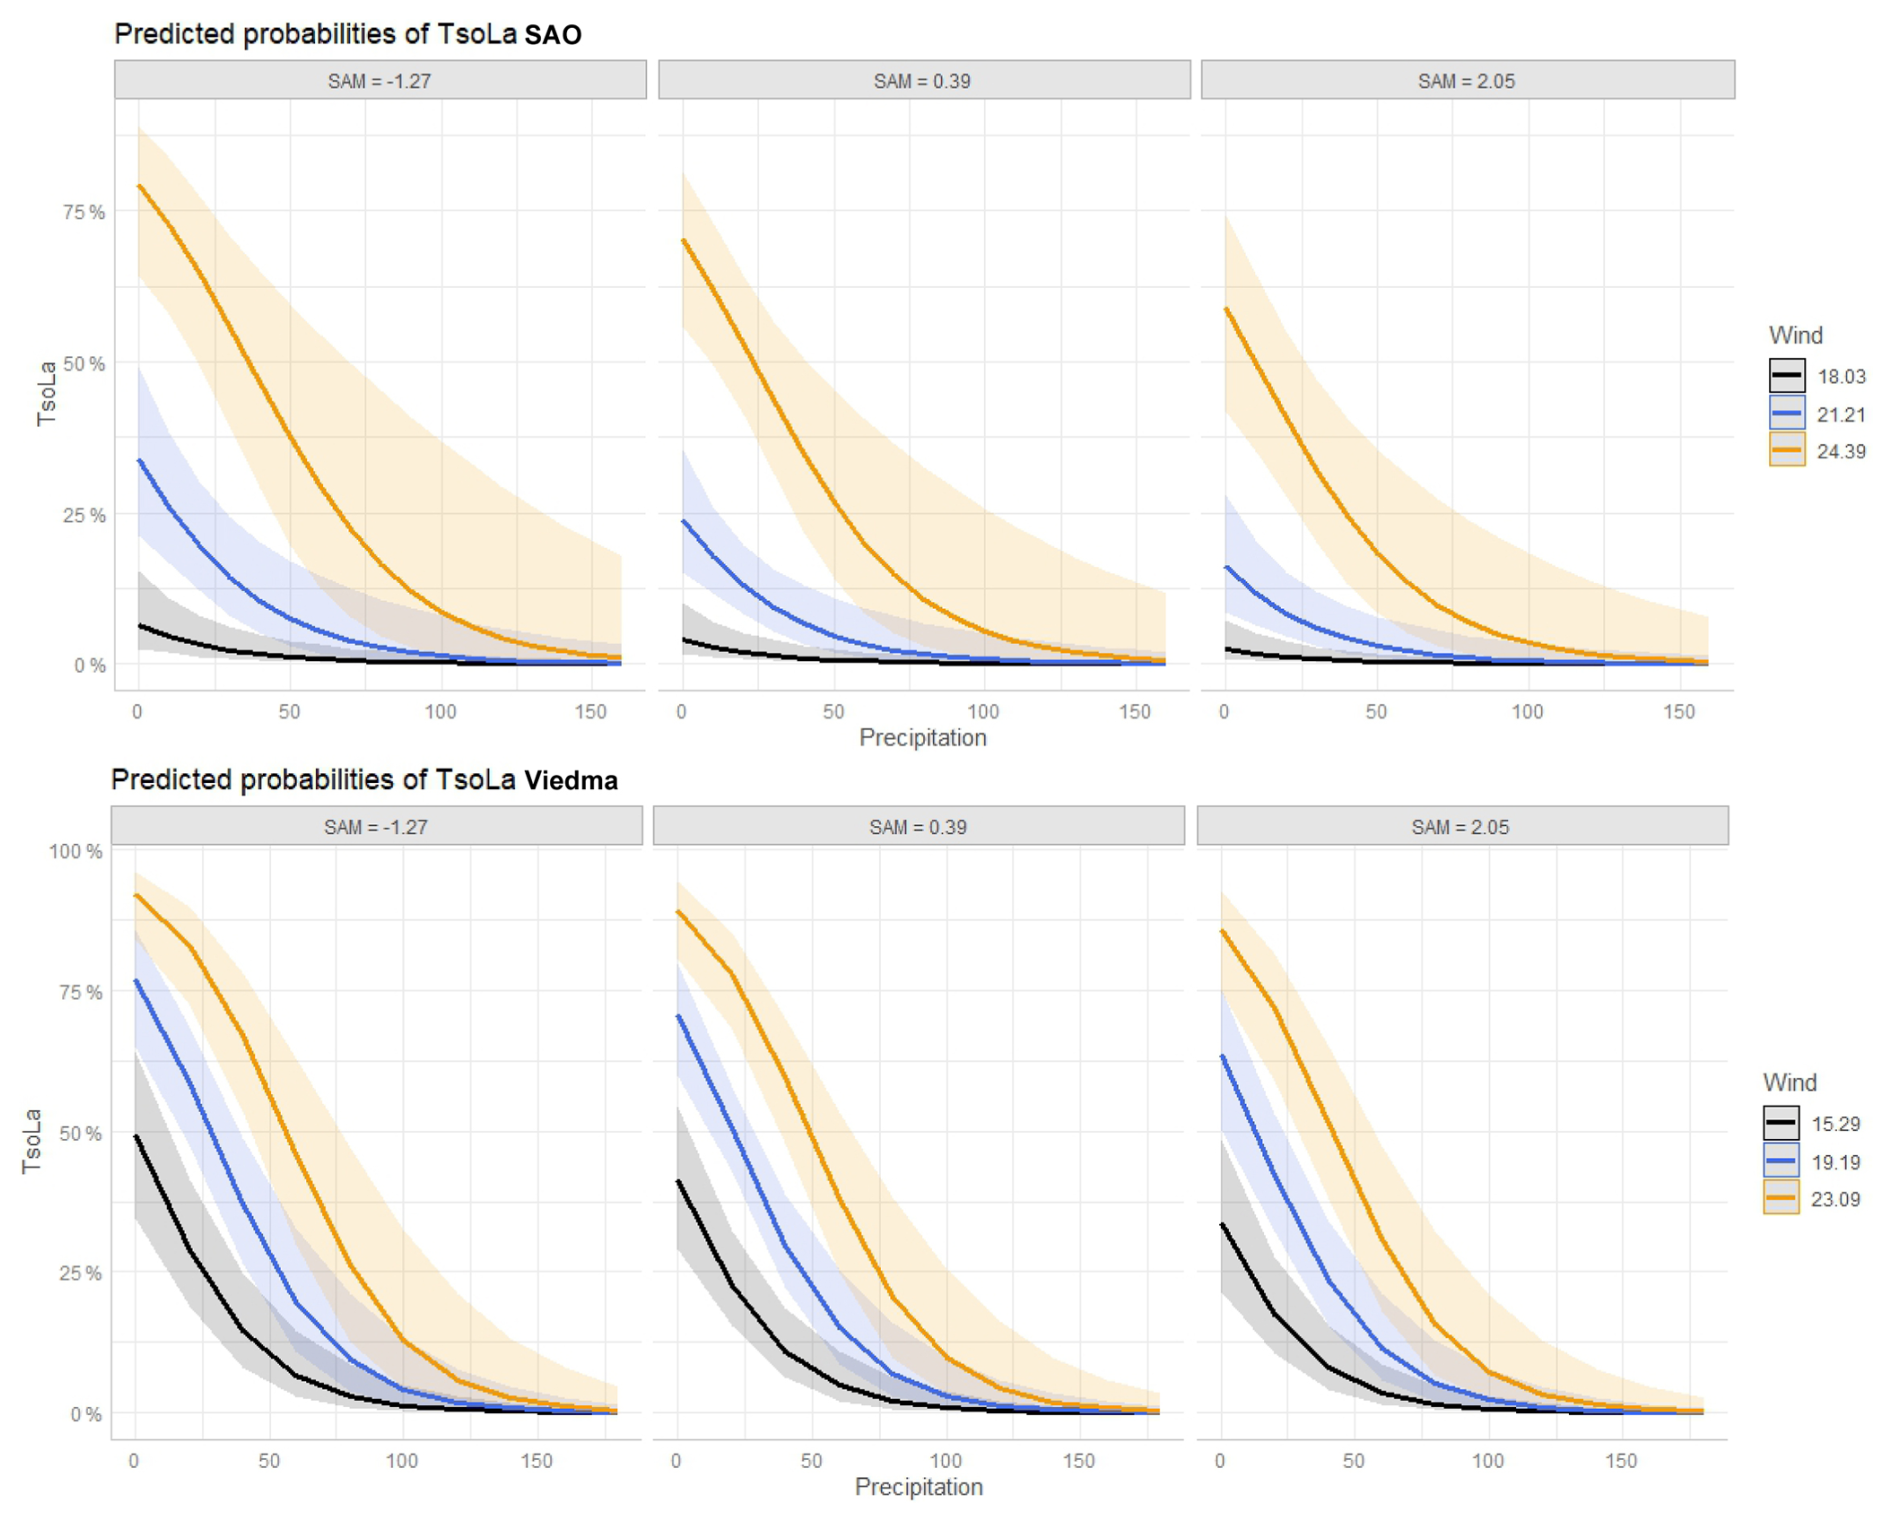
Figure 9The plots show how the TsoLa probability diminishes when precipitation increases and wind speed is slower for different SAM values in both meteorological stations. SAO curves on top, Viedma curves at the bottom.
The logistic regression models demonstrated a good fit, as indicated by the likelihood ratio test (p < 0.001) and the Hosmer–Lemeshow goodness-of-fit test (p > 0.05). These results suggest that the models adequately represent the relationship between the predictor variables and dune migration probability. Model discrimination was further assessed using the Area Under the Receiver Operating Characteristic Curve (AUC-ROC), which yielded values of 0.77 for SAO and 0.78 for Viedma, indicating acceptable predictive performance. The true positive rate (sensitivity) was plotted against the false positive rate (1 − specificity) across a range of classification thresholds. The ROC curve, therefore, illustrates the trade-off between correctly identifying positive cases and incorrectly classifying negative cases as positives. The area under the ROC curve (AUC) provides a threshold-independent measure of discriminatory performance, with higher AUC values indicating a greater ability of the model to distinguish between positive and negative outcomes (Fig. 10). The optimal classification thresholds (cut-points) were determined to be 0.2 for SAO and 0.4 for Viedma (Fig. 10).

Figure 10Area Under the Receiver Operating Characteristic (AUC-ROC) curves for the logistic regression model in SAO (left) and Viedma (right). The ROC curve represents the trade-off between sensitivity (true positive rate) and 1 − specificity (false positive rate) across classification thresholds, while the AUC summarizes the model's discrimination ability. The diagonal line represents the random guess (0.5).
The models also showed consistent classification performance, i.e., how many predictions are coincident with observations, considering 0 as fixed dunes (negative) and 1 as mobile dunes (positive). In SAO, the model correctly classified 77 % of the training data and 73 % of the test data, while in Viedma, 75 % of the training and 74 % of the test observations were correctly predicted (Figs. 11–12). A breakdown of classification performance shows that, for the training data, in SAO, predictions included 57 % true negatives, 20 % true positives, 19 % false positives, and 4 % false negatives (Fig. 11). In Viedma, the distribution was 39 % true negatives, 36 % true positives, 17 % false positives, and 8 % false negatives (Fig. 11). For the test data in SAO, dunes were correctly classified as active in 15 % of cases and as fixed in 58 %. False positives accounted for 21 %, and false negatives for 5 % (Fig. 12). In Viedma, dunes were correctly predicted as active in 39 % of cases and fixed in 35 %. False positives represented 19 %, while false negatives reached 7 % (Fig. 12).
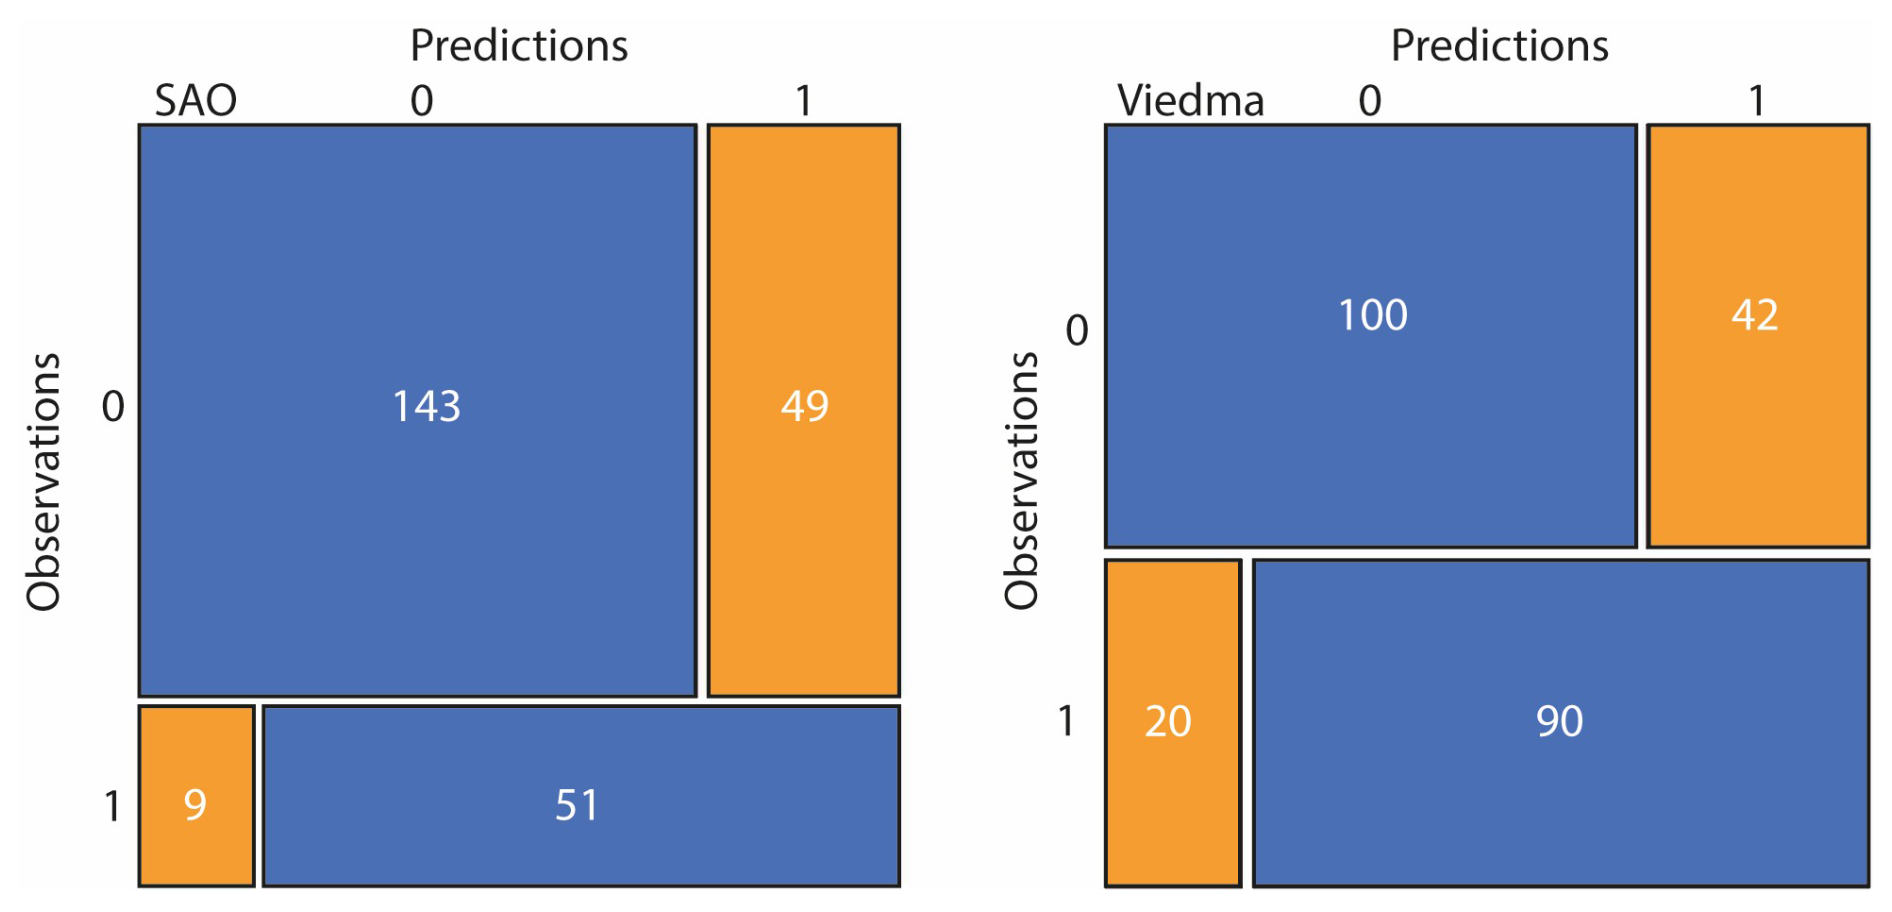
Figure 11Confusion matrix for the training data in SAO (left) and Viedma (right). The blue areas represent the number of observations equal to predictions, while the orange ones represent the observations different from predictions: (0,0) for true negatives, (1,0) for false positives, (0,1) for false negatives, (1,1) for true positives.
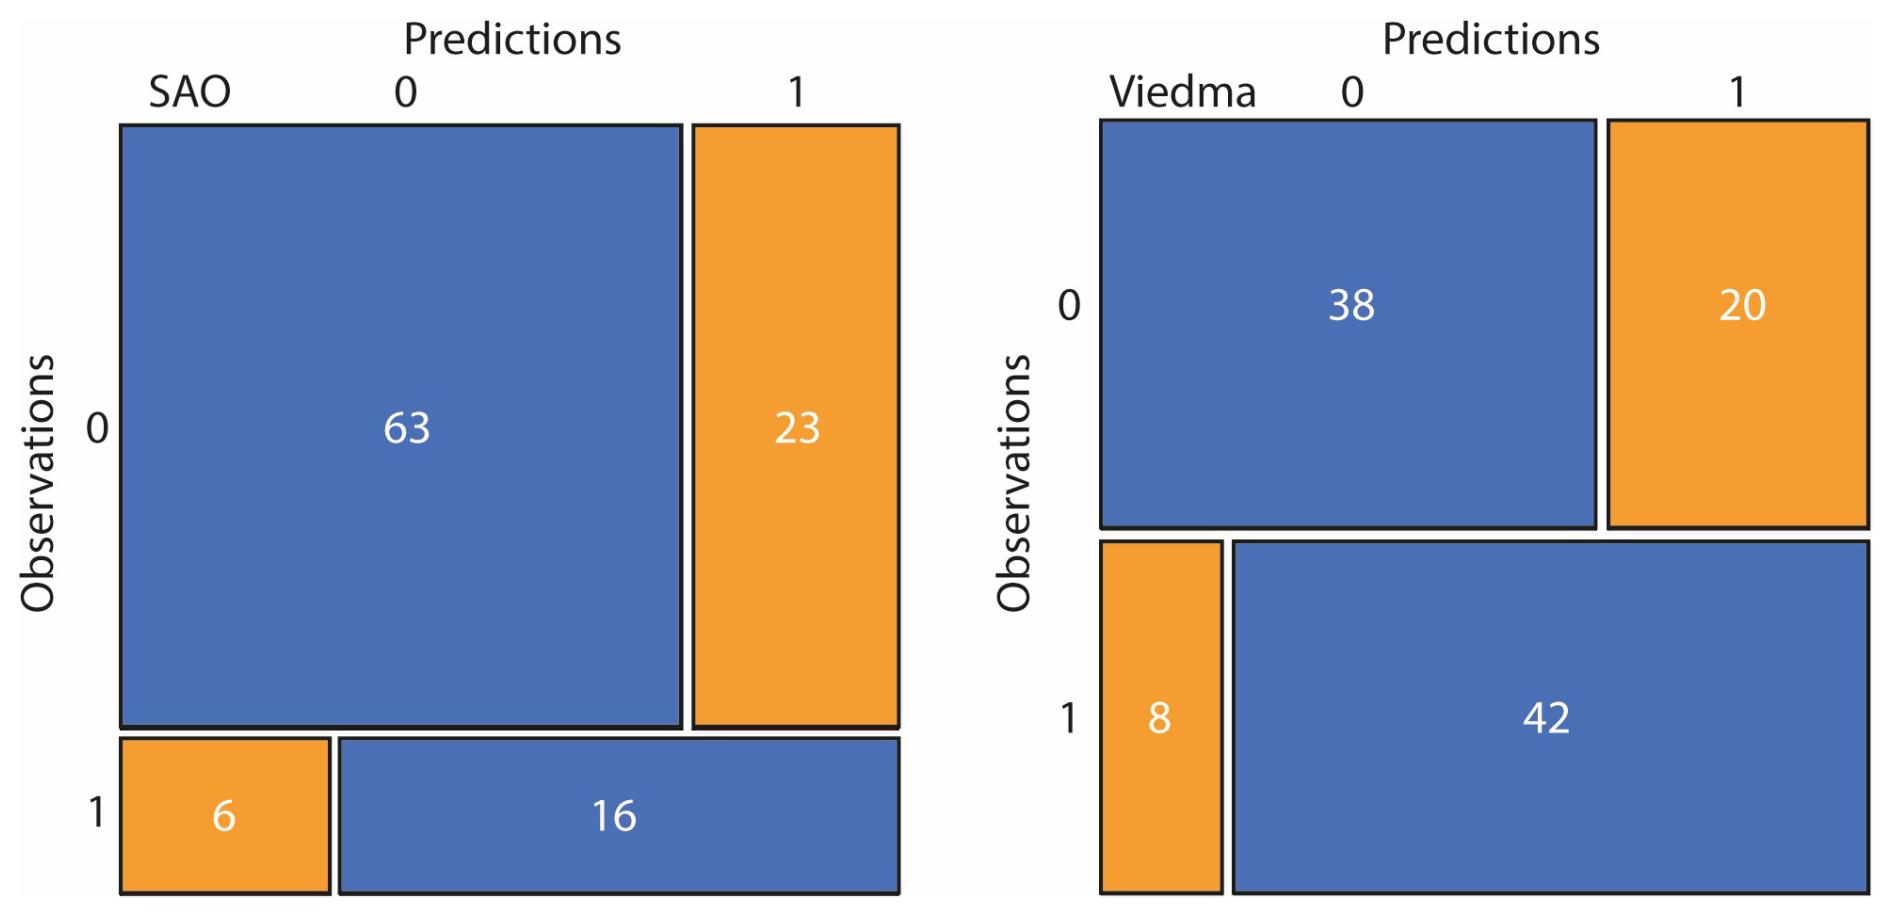
Figure 12Confusion matrix for the test data in SAO (left) and Viedma (right). The blue areas represent the number of observations equal to predictions, while the orange ones represent the observations different from predictions: (0,0) for true negatives, (1,0) for false positives, (0,1) for false negatives, (1,1) for true positives.
A bootstrap analysis with 1000 resample attempts with replacement was performed to validate the stability of the fitted logistic regression model. The model coefficients were estimated in each iteration. In SAO, the coefficient associated with the variable Wind had a mean value of 0.635, with a 95 % confidence interval (percentile method) of [0.421, 0.806], suggesting a positive and consistent effect on the probability of TsoLa occurrence. In contrast, SAM and Precipitation showed negative effects, with average bootstrap coefficients of −0.296 and −0.037, and respective 95 % confidence intervals of [−0.553, −0.035] and [−0.060, −0.017]. In Viedma, the coefficient associated with the variable Wind had a mean value of 0.318, with a 95 % confidence interval (percentile method) of [0.218, 0.427]; the coefficient associated with the variable SAM had a mean value of −0.196, with a 95 % confidence interval of [−0.379, −0.035]; and the coefficient related to the variable Precipitation showed a mean value of −0.044, with a 95 % confidence interval of [−0.059, −0.029]. This non-parametric approach enabled a robust assessment of predictor significance without relying on classical model assumptions.
4.3 Dunes migration
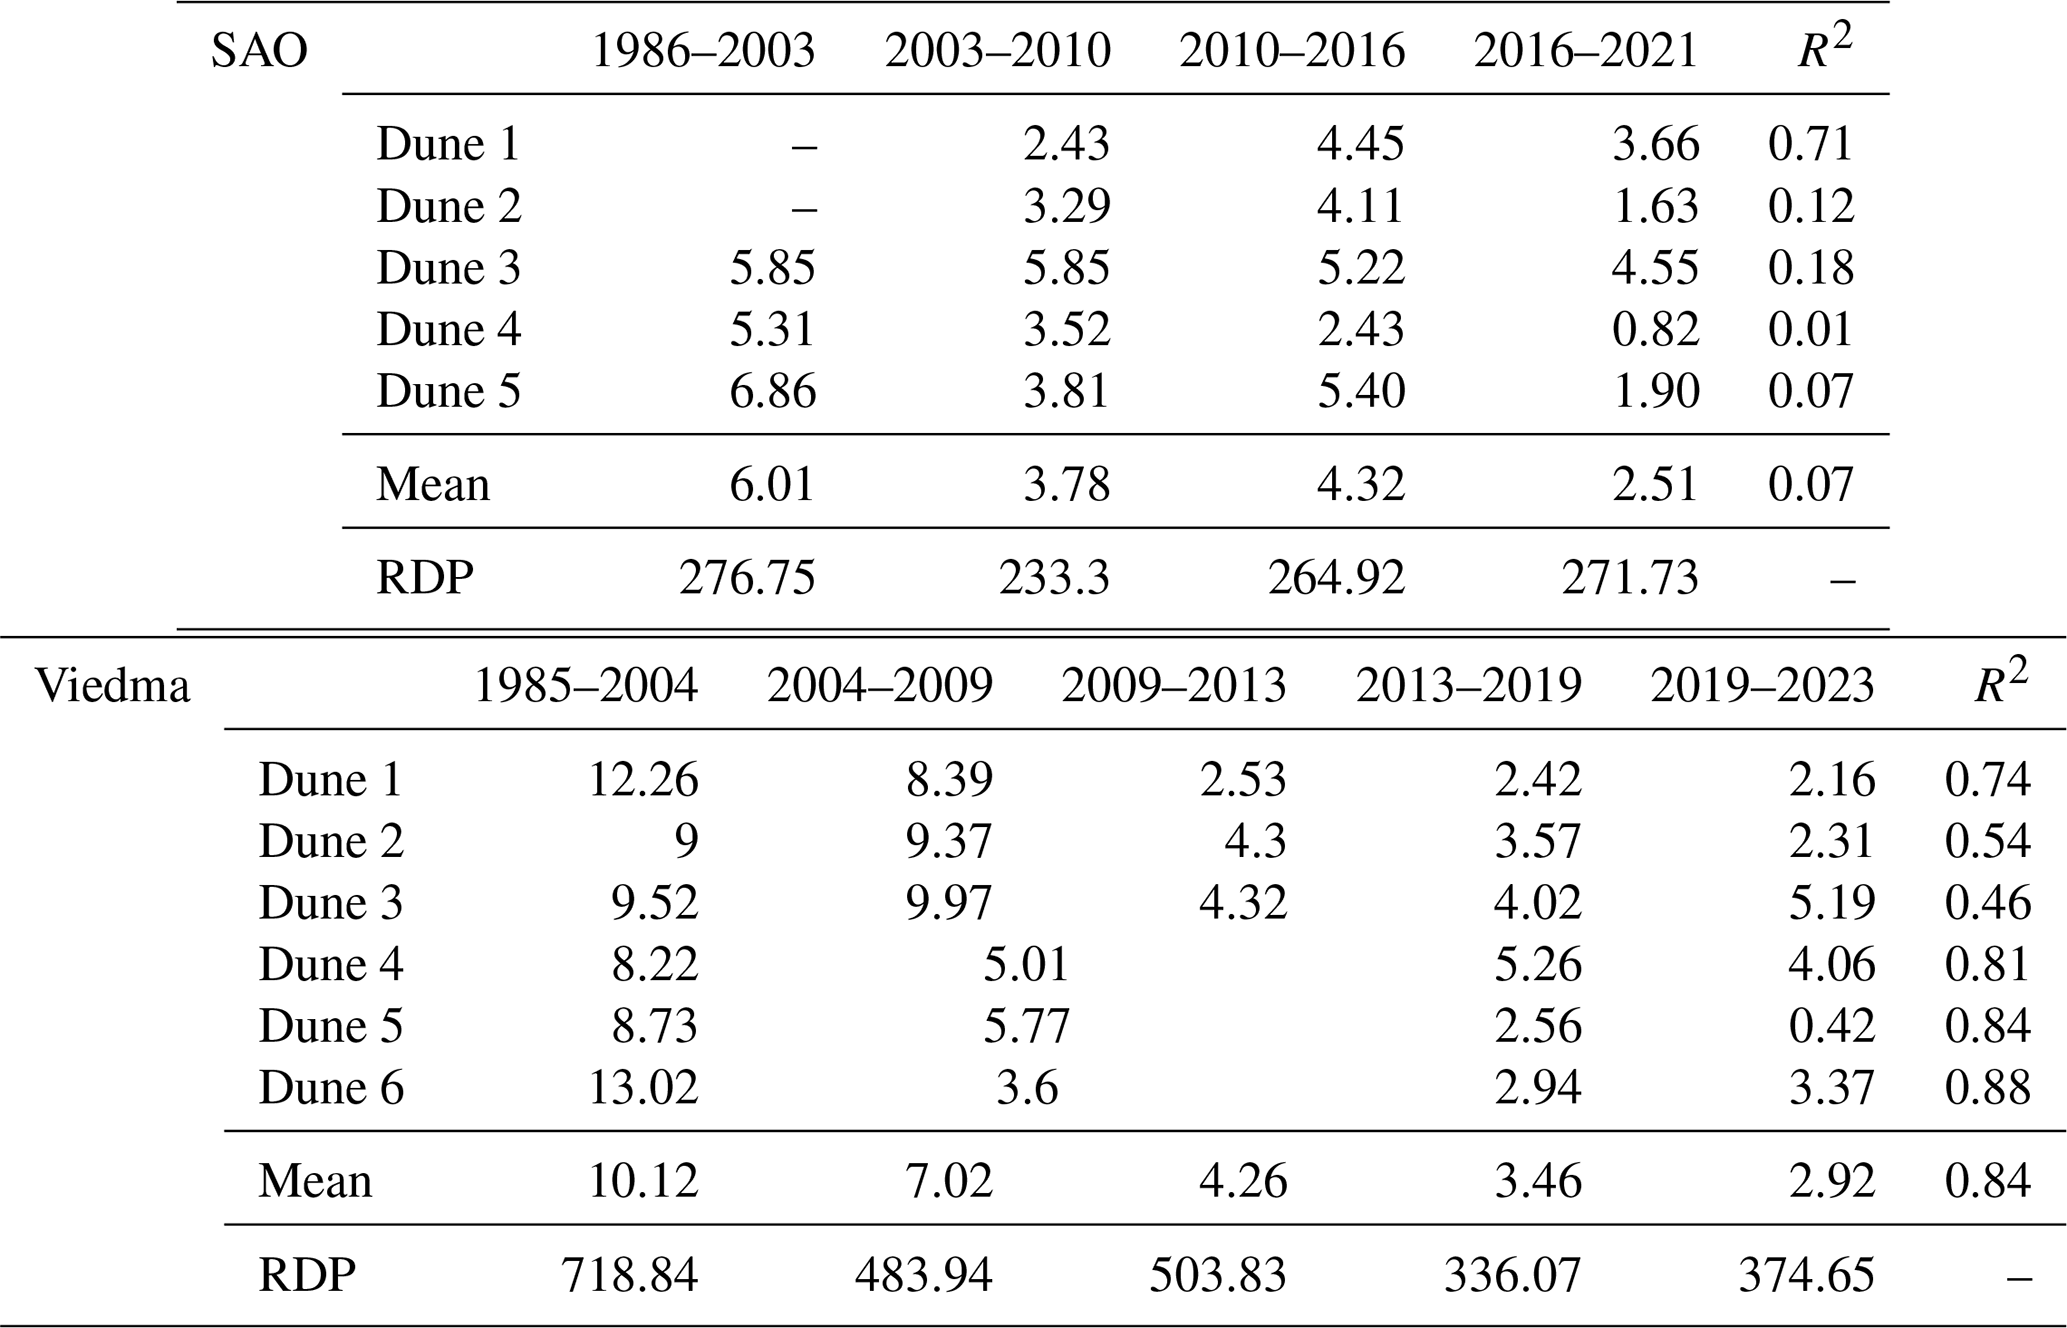
To estimate dune migration over time, different dune fronts from the San Antonio area (1986–2021) and the Viedma/El Cóndor-Villa 7 de Marzo area (1985–2023) were studied (Fig. 13). The dune precipitation ridge was measured at a minimum of 10 points per dune/dunefield for each specific time period. In San Antonio, average migration rates ranged from 2.51 to 6.01 m yr−1 (Table 4), with no significant correlation to RDP values, except for one dune (R = 0.71). In contrast, in Viedma, the average migration ranged from 2.92 to 10.12 m yr−1 (Table 4), showing a general decreasing trend over time and a positive correlation with RDP values for the same periods, R = 0.84 (Table 4). The RDP values were selected because they better represent the wind intensity in relation to the direction of dune migration.
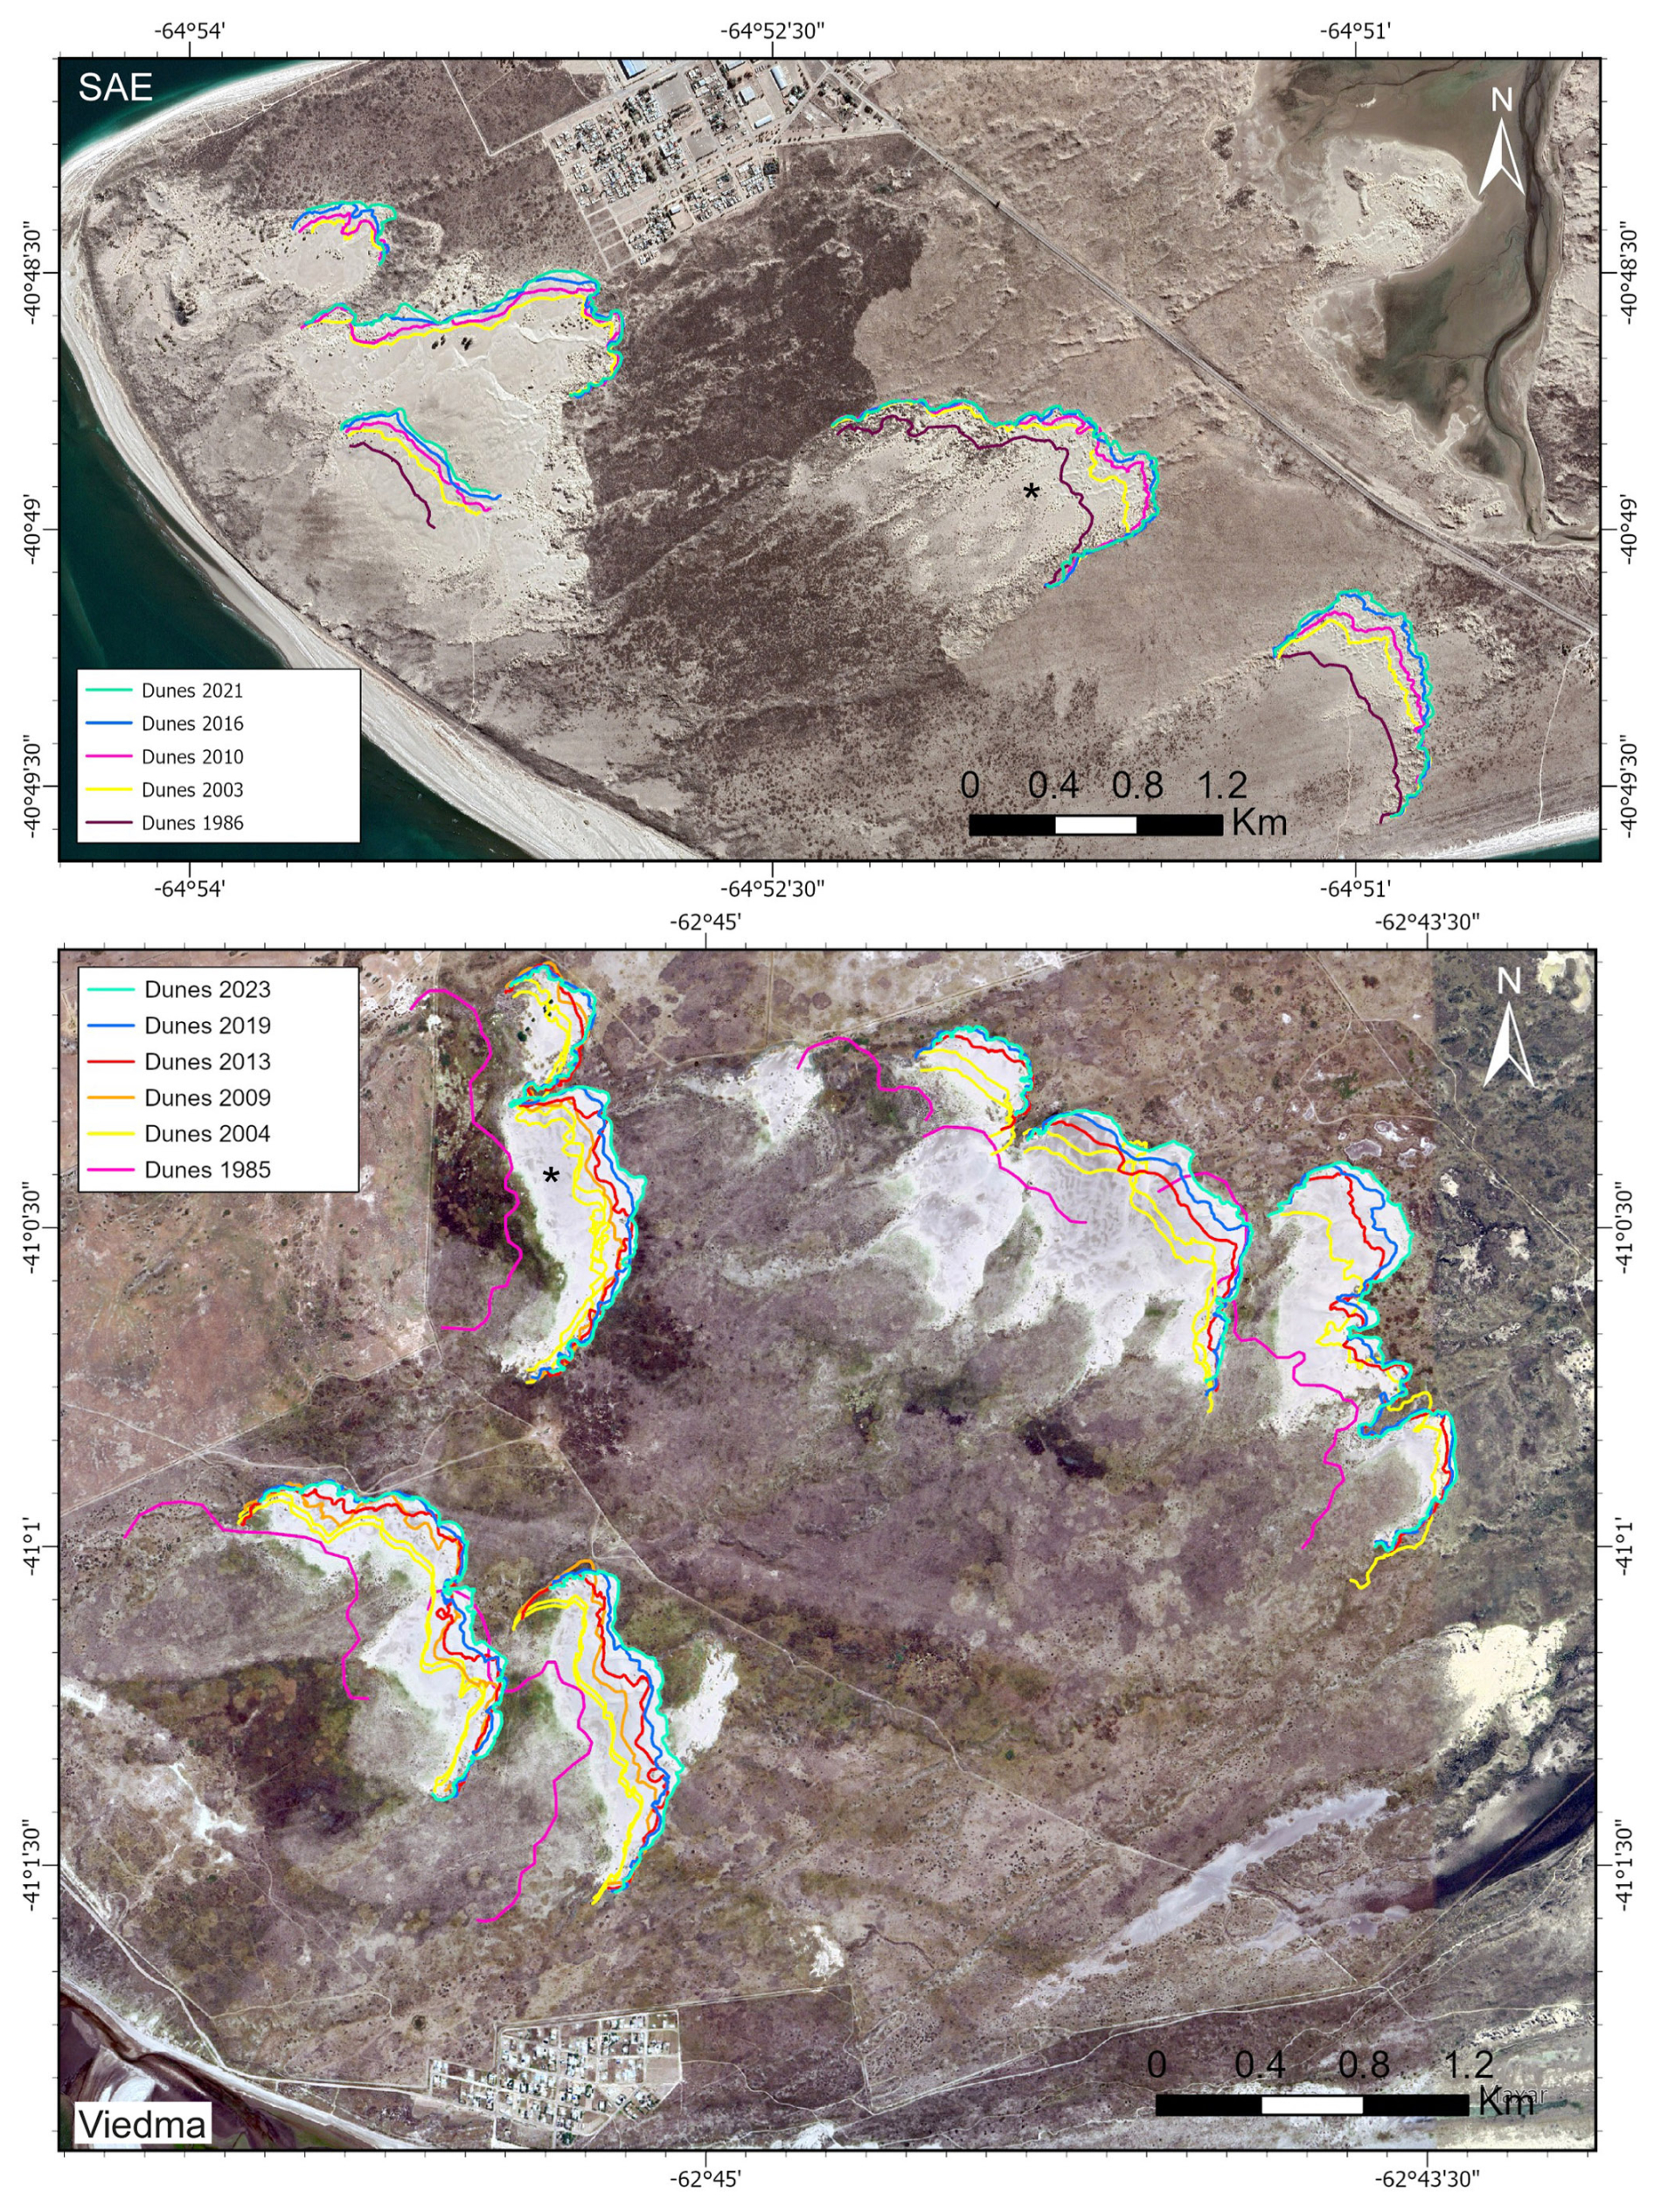
Figure 13Dune migration between 1985 and 2023 in the San Antonio Este (SAE) area and the Viedma–Villa 7 de Marzo areas. The asterisks correspond to the dunes shown in Fig. 4. Imagery © 2025–2026 CNES/Airbus and Maxar Technologies, Map data © 2003–2023 Google.
Table 4Dune migration rates and average RDP values for the 1991–2020 period. Dunefield migration rates in m yr−1. Dune 1 to Dune 5 and Dune 1 to Dune 6 represent the different dune fronts measured in San Antonio and Viedma, respectively (Fig. 13).
The statistical significance of wind speed as a predictor of the binomial outcomes of the TsoLa mobility index supports the model's validity. Ultimately, the values of this index are related to this parameter through the DP and RDP values, as defined by the formula used in its calculation. Furthermore, the dominance of the westerlies is reflected in the RDD values. The observed negative relationship between precipitation and dune migration direction may be attributed to increased soil moisture resulting from higher precipitation levels, which restricts dune mobility and promotes their fixation. Additionally, easterly winds (SE) of oceanic origin are typically associated with greater moisture influx inland and increased precipitation. This pattern is consistent with the findings reported by Agosta et al. (2019), especially during austral fall and winter. Both factors influence general dune migration towards ENE, because easterly wind components are less frequent and are usually associated with rainfall, which decelerates dune migration. Finally, the negative estimate value of the SAM in the model can be attributed to its climatological implications. Negative SAM phases are associated with a northward displacement of the mid-latitude westerlies, bringing stronger winds, lower temperatures, and increased precipitation to regions around 40° S. Although precipitation increases slightly, heightened storm activity and lower temperatures are often associated with greater instability in coastal dunefields and the destabilization of vegetated dunes (Jackson et al., 2019a, b). Conversely, during positive SAM phases, the atmospheric circulation shifts southward, leading to more stable weather, weaker winds, higher temperatures, and reduced precipitation in the study area. These conditions generally favor vegetation growth and dune stabilization (Toffani et al., 2024). This highlights the dominant role of wind over precipitation in controlling sediment transport, reinforcing wind as the primary driver of dune mobility. It is also worth to mention that the DP shows a tendency toward higher values during warmer months, likely reflecting periods with stronger winds. This feature, combined with longer daylight hours and higher temperature, favor the drying of the material that may be transported by winds.
Considering these parameters together with the general decline in dune migration rates, the observed trend can be linked to a progressive greening of the landscape, as detailed for the study area by Toffani et al. (2024), who found that in the San Antonio area, surface covered by vegetation increased from 16 % in 1961 to 60 % in 2021. This process is characterized by increasing vegetation cover and dune fixation due to weaker winds (reflected in lower values of DP and RDP), higher temperatures, and a trend to more positive SAM index values, which was observed from the climate data for the 1991–2020 period. Vegetation cover will also expand in dunes when DP is below 1000 units, following the hysteresis concept proposed by Tsoar (2005). In Viedma, DP values have remained below this threshold since the year 2002, coinciding with the observed increase in vegetation cover. In contrast, in SAO, DP values have been almost always lower than 1000 units throughout the study period, which may explain the smaller changes in vegetation cover. According to the hysteresis model, once a dunefield becomes vegetated, substantially greater wind power is required to reactivate it. Therefore, under present-day climatic conditions, wind alone is unlikely to remove the vegetation and restore widespread dune mobility in the study area. In San Antonio, the slower dune migration rates may also be related to dune morphology and sand supply: shorter and “worm-like” dunes, characterized by particular long sinuous ridge pattern there appear to experience faster vegetation colonization (Toffani et al., 2024). Combined with lower sediment supply and wind intensity, vegetation colonization may result in slower dune migration rates not necessarily directly related to the RDP because RDP also takes into account the wind direction, not just speed. Therefore, dune stabilization can occur over decadal timescales (i.e., 10 to 20 years) (Delgado-Fernández et al., 2019; Jackson et al., 2019a). Even if wind speed increases, enhanced vegetation cover and dune fixation may prevent increases in dune migration, indicating that the RDP value alone does not fully reflect dune mobility dynamics, being dune mobility also limited by sediment supply. Contrarily, the Viedma area has a greater sand supply due to its proximity to the mouth of the Negro River, allowing the growth of larger transverse dunes, with their migration controlled by transport capability, reflected in the correlation to RDP values. San Antonio receives sand primarily from its narrow adjacent beach and the San Antonio Bay, resulting in a more limited sand budget (Carbone et al., 2007). This contrast highlights the importance of integrating geological and geomorphological variables into predictive models. In addition, mean dune migration rate values are higher in Viedma than in SAE, related to more intensive winds and higher DP and RDP values in the region.
The absence of a significant effect of the regional climate index SOI and the relatively minor influence of SAM compared to precipitation and wind speed in the models may be attributed to a stronger influence of local-scale phenomena driving dune dynamics. The exclusion of SOI is justified by its negligible contribution to the model. SOI reflects conditions associated with El Niño and La Niña events, which in the study area result in relatively minor climatic anomalies: annual precipitation variations of no more than 50 mm and temperature deviations typically below ±0.5 °C. However, some authors have reported delayed effects of El Niño over southeastern South America, which may help explain the limited influence of this variable in the current analysis. The reported lag period varies between 5 months in Buenos Aires and 8–13 months in southernmost Patagonia (Schneider and Gies, 2004; Pasquini et al., 2008). Further work is needed to obtain a correct lag period for the SAO and Viedma areas.
The AUC values obtained for the model, 0.77 for SAO and 0.78 for Viedma, indicate a good fit and suggest that the selected predictors can be considered reliable indicators of dune migration dynamics. The distribution of true positives and true negatives confirms that the models perform reasonably well, particularly in identifying stable dune conditions because of the higher number of these events. The Viedma model shows a higher rate of false positives in the test dataset, indicating some limitations in detecting fixed dunes. This reflects the chosen optimum cut value, which prioritizes minimizing false negatives. Despite these strengths, model performance is constrained by the limited number of observations, i.e., 360 records per station. While this sample dataset is sufficient to detect general patterns, the lower number of positive cases in SAO restricts the model's robustness. For those cases, data covering more years can help to improve it. Furthermore, given the values of each variable, it is possible to estimate what values of the remaining variables are needed to get a higher or lower chance of dune migration (Eqs. 6–7).
With improved datasets, such as higher-resolution livestock data, vegetation index, sediment supply, or wave dynamics, a more accurate and representative model could be developed, allowing for better predictive capabilities. In this study, wave data were obtained from reanalysis sources; however, this variable could be refined using data from nearby buoys. Livestock data are limited to annual records at different governmental agencies, rather than at localized scales near the dunefields. Monthly vegetation indices have poor spatial resolution, with similar values for each month. This lack of variation may be associated with the low resolution or minimal change in vegetation cover over time. Finally, the absence of a reliable method to estimate monthly sediment supply remains a significant gap and its inclusion would substantially improve the model performance. Nevertheless, the current model demonstrates that even with basic meteorological data from standard weather stations, a Binomial Logistic Regression Model can provide a reasonably robust prediction of dune mobility. The development and application of such models is crucial, given that these phenomena already impact, and will continue to impact, nearby populations. Predictive modeling supports more informed and proactive land-use planning and decision-making policies, particularly in coastal areas experiencing population growth and infrastructure expansion. These models gain even greater relevance when combined with field-based observations of dune migration. Incorporating data from additional meteorological stations, integrating reanalysis datasets, and/or adding adjusted early mentioned parameters would further refine and strengthen the model's accuracy. Building comparable models for other coastal or inland regions and including other phenomena may enhance their validity.
The results derived from the DP analysis herein are consistent with findings from other areas along the Argentine coast and Patagonia, including those obtained by Cortizo and Isla (2012) in the south of the Buenos Aires province, where westerly winds also predominate. There, spring and summer exhibit the highest wind intensity, with average DP values around 900 units. Del Valle et al. (2008), in Peninsula Valdés, obtained higher DP values, comparable to the highest values observed at the Viedma meteorological station. The RDD values also suggest predominantly westerly winds throughout the entire year, particularly influenced by the SW and N components. In southern Patagonia, Montes et al. (2015) analyzed the migration rate and direction of certain dunes, which were between 29.6 and 70 m yr−1 and towards the E (86° N) between 2003 and 2013 in the central area of the San Jorge Gulf. Additionally, at a site adjacent to Colhué Huapi Lake, Montes et al. (2017) recorded an average dune advance of 45 m yr−1 towards the E (95° N). These places exhibit similar dynamics and could serve to upgrade the model and extend it to inland dunes.
This study demonstrates that binomial logistic regression provides a robust and transferable methodological framework for predicting coastal dune mobility based on standard meteorological variables. By integrating established wind-based indices (DP, RDP) with a novel mobility index (TsoLa), we developed a probabilistic model that successfully links climatic drivers to discrete geomorphic states (active vs. fixed). The model's strong performance (AUC > 0.75) across two distinct dunefields in NE Patagonia validates its core premise: even with readily available climatic data, it is possible to move beyond descriptive wind roses and mobility indices toward a predictive, probabilistic understanding of dune activity.
Our analysis identified wind speed as the primary and most consistent predictor of dune activation, a finding that reinforces the fundamental role of aeolian forcing in dune dynamics while also providing internal validation for the model's logical coherence. The negative relationships with both precipitation and the Southern Annular Mode (SAM) highlight the moderating effects of moisture availability and large-scale atmospheric circulation. Specifically, the SAM's significant role underscores how regional climate modes can exert a measurable, predictable influence on local-scale geomorphic processes – an important linkage for forecasting dune behavior under future climate scenarios.
The use of common meteorological parameters (wind speed, precipitation) and globally available climate indices (e.g., SAM, ENSO) means the framework can be adapted to other coastal and inland aeolian systems with minimal modification. While applied here in a semi-arid, wind-driven setting, the model structure can accommodate additional site-specific variables such as vegetation indices (NDVI), sediment supply estimates, or anthropogenic factors where data resolution permits.
Notably, the model offers a practical, low-cost tool for land-use planning and proactive coastal zone management. By outputting a probability of dune activation, it enables early identification of periods and locations with higher erosion or encroachment risk, supporting decision-making for infrastructure protection, especially in developing coastal regions vulnerable to climate pressures.
Future research should focus on enhancing the model's spatial and temporal resolution, testing its performance in diverse climatic and geomorphic settings (e.g., temperate coastal dunes, arid continental ergs), and incorporating lagged effects of climate oscillations. The integration of higher-frequency remote sensing data, improved sediment budget constraints, and process-based validation using computational fluid dynamics or cellular automata models will further strengthen the predictive power and physical grounding of this statistical approach. Ultimately, this work establishes a scalable pathway for integrating climatic forecasting with geomorphic hazard assessment, contributing to more resilient management of dynamic dune landscapes worldwide.
The datasets and R scripts used in this study are publicly available in the Zenodo repository at https://doi.org/10.5281/zenodo.21996832 (Toffani and Casadio, 2026). The repository contains the original climatic datasets, together with the R scripts used for statistical, and multiple binary logistic regression.
MT: conceptualization, data curation, formal analysis, investigation, methodology, software, visualization, and writing (original draft preparation). SC: funding acquisition, investigation, resources, supervision, validation, and writing (review and editing).
The contact author has declared that neither of the authors has any competing interests.
Publisher's note: Copernicus Publications remains neutral with regard to jurisdictional claims made in the text, published maps, institutional affiliations, or any other geographical representation in this paper. The authors bear the ultimate responsibility for providing appropriate place names. Views expressed in the text are those of the authors and do not necessarily reflect the views of the publisher.
The authors would like to thank Dr. Alina Shchepetkina for improving the English language of the manuscript and Dr. Evangelina Palópolo for her contributions to the development of the statistical model. We thank Thomas Smyth and one anonymous reviewer, and the editor, Andreas Baas, for providing valuable comments to improve the manuscript.
This paper was edited by Andreas Baas and reviewed by Thomas Smyth and one anonymous referee.
Abdel-Kader, F. H.: Digital soil mapping at pilot sites in the northwest coast of Egypt: A multinomial logistic regression approach, Egypt. J. Remote Sens. Space Sci., 14, 29–40, https://doi.org/10.1016/j.ejrs.2011.04.001, 2011.
Agosta, E. A., Martin, P. B., and Serio, L. A.: Persistent easterly winds leading to precipitation in the Atlantic Coast of Patagonia, Int. J. Climatol., 39, 5063–5090, https://doi.org/10.1002/joc.6127, 2019.
Andreis, R. R.: Petrografía y paleocorrientes de la Formación Río Negro (tramo General Conesa-boca del Río Negro), Rev. Mus. La Plata, 36, 245–310, http://sedici.unlp.edu.ar/handle/10915/144048 (last access: 13 December 2025), 1965.
Andrew, R. L., Ostevik, K. L., Ebert, D. P., and Rieseberg, L. H.: Adaptation with gene flow across the landscape in a dune sunflower, Mol. Ecol., 21, 2078–2091, https://doi.org/10.1111/j.1365-294X.2012.05454.x, 2012.
Angulo, R., Fidalgo, F., Gómez Peral, M. A. and Schnack, E. J.: Las ingresiones marinas cuaternarias en la bahía de San Antonio y sus vecindades, provincia de Río Negro, 7th Congreso Geológico Argentino, Neuquén, Argentina, April 1978, 271–283, https://repositorio.segemar.gob.ar/bitstream/handle/308849217/1857/6317_SL003442.pdf?sequence=1&isAllowed=y (last access: 26 August 2026), 1978.
Bagnold, R. A.: Experiments on a gravity-free dispersion of large solid spheres in a Newtonian fluid under shear, Proc. R. Soc. Lond. A, 225, 49–63, https://doi.org/10.1098/rspa.1954.0186, 1954.
Berman, A. L., Silvestri, G., and Compagnucci, R.: Eastern Patagonia seasonal precipitation: influence of southern hemisphere circulation and links with subtropical South American precipitation, J. Clim., 25, 6781–6795, https://doi.org/10.1175/JCLI-D-11-00514.1, 2012
Bohn, V. Y., Sánchez, R. M., Carrascal, C. N., and Romagnoli, F. B.: Estudio preliminar de variables climatológicas y productividad de los suelos, XXIV Congreso Argentino de la Ciencia del Suelo, Bahía Blanca, Argentina, May 2014, 1–6, https://doi.org/10.13140/2.1.2880.2241, 2014.
Brus, D. J., Slim, P. A., Gort, G., Heidema, A. H., and Van Dobben, H.: Monitoring habitat types by the mixed multinomial logit model using panel data, Ecol. Indic., 67, 108–116, https://doi.org/10.1016/j.ecolind.2016.02.043, 2016.
Carbone, M. E., Perillo, G. M. E., and Piccolo, M. C.: Dinámica morfológica de los ambientes costeros de Bahía San Antonio Oeste, provincia de Rio Negro, Geoacta, 32, 83–91, 2007.
Cortizo, L. C. and Isla, F. I.: Dinámica de la barrera medanosa e islas de barrera de Patagones (Buenos Aires, Argentina), Lat. Am. J. Sedimentol. Basin Anal, 19, 47–63, 2012.
Daoud, J. I.: Multicollinearity and regression analysis, J. Phys. Conf. Ser. 949, 012009, https://doi.org/10.1088/1742-6596/949/1/012009, 2017.
Delgado-Fernández, I., O'Keeffe, N., and Davidson-Arnott, R. G.: Natural and human controls on dune vegetation cover and disturbance, Sci. Total Environ., 672, 643–656, https://doi.org/10.1016/j.scitotenv.2019.03.494, 2019.
del Valle, H. F., Rostagno, C. M., Coronato, F. R., Bouza, P. J., and Blanco, P. D.: Sand dune activity in North-Eastern Patagonia, J. Arid Environ., 72, 411–422, https://doi.org/10.1016/j.jaridenv.2007.07.011, 2008.
Ding, C., Zhang, L., Liao, M., Feng, G., Dong, J., Ao, M., and Yu, Y.: Quantifying the spatio-temporal patterns of dune migration near Minqin Oasis in northwestern China with time series of Landsat-8 and Sentinel-2 observations, Remote Sens. Environ., 236, 111498, https://doi.org/10.1016/j.rse.2019.111498, 2020.
Favier-Dubois, C.: Hacia una cronología del uso del espacio en la costa norte del golfo San Matías (Río Negro, Argentina): sesgos geológicos e indicadores temporales, in: Tendencias teórico-metodológicas y casos de estudio en la arqueología de la Patagonia, edited by: Zangrando, A., Barberena, R., Gil, A., Neme, G., Giardina, M., Luna, L., Otaola, C., Paulides, S., Salgán, L., and Tívoli, A., Museo de Historia Natural de San Rafael, San Rafael, Argentina, 87–96, ISBN 978-987-29262-0-5, 2013.
Favier-Dubois, C. M. and Kokot, R.: Changing scenarios in Bajo de la Quinta (San Matías Gulf, Northern Patagonia, Argentina): Impact of geomorphologic processes in subsistence and human use of coastal habitats, Quat. Int., 245, 103–110, https://doi.org/10.1016/j.quaint.2011.03.051, 2011.
Fogt, R. L. and Marshall, G. J.: The Southern Annular Mode: variability, trends, and climate impacts across the Southern Hemisphere, Rev. Clim. Chang., 11, e652 https://doi.org/10.1002/wcc.652, 2020.
Fryberger, S. G. and Dean, G.: Dune forms and wind regime, in: A Study of Global Sand Seas, edited by: McKee, E. D., United States Geological Survey, Washington D.C., 137–169, https://doi.org/10.3133/pp1052, 1979.
Fucks, E. E., Schnack, E. J., and Charó, M.: Aspectos geológicos y geomorfológicos del sector N del golfo San Matías, Río Negro, Argentina, Rev. Soc. Geol. Esp., 25, 95–105, 2012.
Gallego-Fernández, J. B., Muñoz-Valles, S., and Dellafiore, C. M.: Spatio-temporal patterns of colonization and expansion of Retama monosperma on developing coastal dunes, J. Coast. Conserv., 19, 577–587, https://doi.org/10.1007/s11852-015-0408-6, 2015.
Gao, J., Kennedy, D. M., and McSweeney, S.: Patterns of vegetation expansion during dune stabilization at the decadal scale, Earth Surf. Process. Landf., 48, 3059–3073, https://doi.org/10.1002/esp.5681, 2023.
Gelós, E. M., Spagnuolo, J. O., and Schillizzi, R. A.: Caracteres texturales y mineralógicos de sedimentos de playa de la costa norte del golfo San Matías, Rev. Asoc. Arg. Mineral. Petrol. y Sedimentol, 21, 41–52, 1990.
Genchi, S. A., Carbone, M. E., Piccolo, M. C., and Perillo, M. E.: Déficit hídrico en San Antonio Oeste, Argentina, Rev. Climatol., 10, 29–43, 2010.
Giasson, E., Clarke, R. T., Inda Junior, A. V., Merten, G. H., and Tornquist, C. G.: Digital soil mapping using multiple logistic regression on terrain parameters in southern Brazil, Sci. Agric., 63, 262–268, https://doi.org/10.1590/S0103-90162006000300008, 2006.
Guevara Díaz, J. M.: Cuantificación del perfil del viento hasta 100 m de altura desde la superficie y su incidencia en la climatología eólica, Terra, 29, 81–101, 2013.
Healy, L. M.: Logistic regression: An overview, Eastern Michigan College of Technology, https://www.researchgate.net/publication/255597415_Logistic_Regression_An_Overview (last access: 26 August 2026), 2006.
Herrera Briones, J.: Aplicación de Regresión Logística al análisis de gravedad de lesiones en colisiones de vehículos para ensayos experimentales, MS thesis, Universidad Politécnica de Madrid, Spain, 147 pp., https://oa.upm.es/74772/ (last access: 26 August 2026), 2023.
Hesp, P. A.: Conceptual models of the evolution of transgressive dune field systems, Geomorphology, 199, 138–149, https://doi.org/10.1016/j.geomorph.2013.05.014, 2013.
Hesp, P. A. and Thom, B. G.: Geomorphology and evolution of transgressive dunefields, in: Coastal Dunes: Processes and Morphology, edited by: Nordstrom, K., Psuty, N., and Carter, W., Wiley and Sons, London, 253–288, ISBN 0471918423, 1990.
Hesp, P. A., DaSilva, M., Miot da Silva, G., Bruce, D., and Keane, R.: Review and direct evidence of transgressive aeolian sand sheet and dunefield Initiation, Earth Surf. Process. Landf., 47, 2660–2675, https://doi.org/10.1002/esp.5400, 2022.
Hoover, R. H., Gaylord, D. R., and Cooper, C. M.: Dune mobility in the St. Anthony Dune Field, Idaho, USA: effects of meteorological variables and lag time, Geomorphology, 309, 29–37, https://doi.org/10.1016/j.geomorph.2018.02.018, 2018.
Hosmer, D. W. and Lemeshow, S.: Goodness of fit tests for the multiple logistic regression model, Commun. Stat.-Theor. Meth., 9, 1043–1069, https://doi.org/10.1080/03610928008827941, 1980.
Hosmer, D. W., Lemeshow, S., and Sturdivant, R. X. (Eds.): Applied logistic regression, John Wiley & Sons, New Jersey, 511 pp., ISBN 978-0-470-58247-3, 2013.
Hugenholtz, C. H. and Wolfe, S. A.: Recent stabilization of active sand dunes on the Canadian prairies and relation to recent climate variations, Geomorphology, 68, 131–147, https://doi.org/10.1016/j.geomorph.2004.04.009, 2005.
Instituto Nacional de Estadística y Censos (INDEC): Censo Nacional de Población, Hoagares y Viviendas, https://www.indec.gob.ar/indec/web/Nivel4-CensoProvincia-3-999-62-077-2010 (last access: 26 August 2026), 2010.
Instituto Nacional de Estadística y Censos (INDEC): Censo Nacional de Población, Hogares y Viviendas, https://www.indec.gob.ar/ftp/cuadros/poblacion/sintesis_resultados_censo2022.pdf (last access: 6 May 2025), 2023.
Isla, F. I.: Holocene sea-level fluctuation in the southern hemisphere, Quat. Sci. Rev., 8, 359–368, https://doi.org/10.1016/0277-3791(89)90036-X, 1989.
Isla, F. I.: The flooding of the San Matías Gulf: the Northern Patagonia Sea-level curve, Geomorphology, 203, 60–65, https://doi.org/10.1016/j.geomorph.2013.02.013, 2013.
Isla, F. I.: Coastal barriers from Argentina: Buenos Aires, Patagonia and Tierra del Fuego, Quat. Environ. Geosci., 7, 1–9, https://doi.org/10.5380/abequa.v8i1.43783, 2017.
Jackson, D. W., Costas, S., González-Villanueva, R., and Cooper, A.: A global “greening” of coastal dunes: an integrated consequence of climate change? Glob. Planet. Chang., 182, 103026 https://doi.org/10.1016/j.gloplacha.2019.103026, 2019a.
Jackson, D. W., Costas, S., and Guisado-Pintado, E.: Large-scale transgressive coastal dune behaviour in Europe during the Little Ice Age, Glob. Planet. Chang., 175, 82–91, https://doi.org/10.1016/j.gloplacha.2019.02.003, 2019b.
Jansche, M.: Maximum expected F-measure training of logistic regression models, in: Proceedings of Human Language Technology Conference and Conference on Empirical Methods in Natural Language Processing, Vancouver, Canada, 6–8 October 2005, 692–699, https://doi.org/10.3115/1220575.1220662, 2005.
Kalil, A. C., Mattei, J., Florescu, D. F., Sun, J., and Kalil, R.: Recommendations for the assessment and reporting of multivariable logistic regression in transplantation literature, Am. J. Transplant., 10, 1695–1703, https://doi.org/10.1111/j.1600-6143.2010.03141.x, 2010.
Klink, K.: Climatological mean and interannual variance of United States surface wind speed, direction and velocity 1, Int. J. Climatol., 19, 471–488, https://doi.org/10.1002/(SICI)1097-0088(199904)19:5<471::AID-JOC367>3.0.CO;2-X, 1999.
Koerth, J., Vafeidis, A. T., Hinkel, J., and Sterr, H.: What motivates coastal households to adapt pro-actively to sea-level rise and increasing flood risk?, Reg. Environ. Change, 13, 897–909, https://doi.org/10.1007/s10113-012-0399-x, 2013.
Kokot, R. R. and Favier-Dubois, C. M.: Evolución geomorfológica de la bahía de San Antonio, Provincia de Río Negro, Rev. Asoc. Geol. Arg., 74, 315–325, 2017.
Lancaster, N.: Development of linear dunes in the southwestern Kalahari, southern Africa, J. Arid Environ., 14, 233–244, https://doi.org/10.1016/S0140-1963(18)31070-X, 1988.
Lemeshow, S. and Hosmer, D. W.: A review of goodness of fit statistics for use in the development of logistic regression models, Am. J. Epidemiol., 115, 92–106, https://doi.org/10.1093/oxfordjournals.aje.a113284, 1982.
Levin, N., Neil, D., and Syktus, J.: Spatial variability of dune form on Moreton Island, Australia, and its correspondence with wind regime derived from observing stations and reanalyses, Aeolian Res., 15, 289–300, https://doi.org/10.1016/j.aeolia.2014.06.006, 2014.
Lizuain, A. and Sepúlveda, E.: Geología del Gran Bajo del Gualicho (Provincia de Río Negro), 7th Congreso Geológico Argentino, Neuquén, Argentina, April 1978, 407–422, https://www.bfa.fcnym.unlp.edu.ar/id/25320 (last access: 26 August 2026), 1978.
Lombardo, L., Cama, M., Conoscenti, C., Märker, M., and Rotigliano, E. J. N. H.: Binary logistic regression versus stochastic gradient boosted decision trees in assessing landslide susceptibility for multiple-occurring landslide events: application to the 2009 storm event in Messina (Sicily, southern Italy), Nat. Hazards, 79, 1621–1648, https://doi.org/10.1007/s11069-015-1915-3, 2015.
López Alfonsín, R., Coccia, M. E., Fauqué, L. E., Castaños, C., and Olvar, N. M.: Estudio para el ordenamiento territorial de la Orla Atlántica Rionegrina: Desde La Lobería a Bahía Creek, Consejo Federal de Inversiones, Buenos Aires, 141 pp., ISBN 978-987-510-190-6, 2012.
Louassa, S., Merzouk, M., and Merzouk, N. K.: Sand drift potential in western Algerian Hautes Plaines, Aeolian Res., 34, 27–34, https://doi.org/10.1016/j.aeolia.2018.07.002, 2018.
Mancini, M. V., Paez, M. M., Prieto, A. R., Stutz, S., Tonello, M., and Vilanova, I.: Mid- Holocene climatic variability reconstruction from pollen records (32–52 S, Argentina), Quat. Int., 132, 47–59, https://doi.org/10.1016/j.quaint.2004.07.013, 2005.
Marcomini, S. and Maidana, N.: Response of Eolian ecosystems to minor climatic changes, J. Coast. Res., 39, 204–208, https://www.jstor.org/stable/25741562 (last access: 26 August 2026), 2006.
Marcos, M. A. and Mancini, M. V.: Modern pollen and vegetation relationships in Northeastern Patagonia (Golfo San Matías, Río Negro), Rev. Palaeobot. Palynol., 171, 19–26, https://doi.org/10.1016/j.revpalbo.2011.11.007, 2012.
Marcos, M. A., Espinosa, M. A., and Mancini, M. V.: Múltiples Indicadores de los cambios ambientales desde el Holoceno Medio en el Noreste de Patagonia (Bajo de la Quinta), Argentina, Ameghiniana, 51, 344–360, https://doi.org/10.5710/AMGH.28.03.2014.793, 2014.
Michel, S., Avouac, J. P., Ayoub, F., Ewing, R. C., Vriend, N., and Heggy, E.: Comparing dune migration measured from remote sensing with sand flux prediction based on weather data and model, a test case in Qatar, Earth Planet. Sci. Lett., 497, 12–21, https://doi.org/10.1016/j.epsl.2018.05.037, 2018.
Miot da Silva, G. and Hesp, P. A.: Increasing rainfall, decreasing winds, and historical changes in Santa Catarina dunefields, Southern Brazil, Earth Surf. Process. Landf., 38, 1036–1045, https://doi.org/10.1002/esp.3390, 2013.
Miot da Silva, G., Martinho, C. T., Hesp, P. A., Keim, B. D., and Ferligo, Y.: Changes in dunefield geomorphology and vegetation cover as a response to local and regional climate variations, J. Coast. Res., 65, 1307–1312, https://doi.org/10.2112/SI65-221.1, 2013.
Montes, A., Rodríguez, S., San Martín, C., and Allard, J.: Migración de campos de dunas en cañadones costeros de Patagonia. Geomorfología e implicaciones paleoclimáticas, Rev. Soc. Geol. España 28, 65–76, 2015.
Montes, A., Rodríguez, S. S., and Domínguez, C. E.: Geomorphology context and characterization of dunefields developed by the southern westerlies at drying Colhué Huapi shallow lake, Patagonia Argentina, Aeolian Res., 2, 58–70, https://doi.org/10.1016/j.aeolia.2017.08.001, 2017.
National Oceanic and Atmospheric Administration (NOAA): https://www.cpc.ncep.noaa.gov/data/indices/soi, last access: 18 May 2025.
Natural Environment Research Council–British Antarctic Survey (NERC-BAS): http://www.nerc-bas.ac.uk/icd/gjma/sam.html, last access: 18 May 2025.
Ohlmacher, G. C. and Davis, J. C.: Using multiple logistic regression and GIS technology to predict landslide hazard in northeast Kansas, USA, Eng. Geol., 69, 331–343, https://doi.org/10.1016/S0013-7952(03)00069-3, 2003.
Ozbas, B. and Greenberg, M.: Correlation between Hurricane Sandy Damage along the New Jersey Coast with Land Use, Dunes and Other Local Attributes, U.S. Department of Transportation, Washington D. C., File 20590-0001, 61 pp., https://rosap.ntl.bts.gov/view/dot/27218 (last access: 26 August 2026), 2013.
Pasquini, A. I., Lecomte, K. L., and Depetris, P. J.: Climate change and recent water level variability in Patagonia proglacial lakes, Argentina, Glob. Planet. Change, 63, 290–298, https://doi.org/10.1016/j.gloplacha.2008.07.001, 2008.
Peel, M. C., Finlayson, B. L., and McMahon, T. A.: Updated world map of the Köppen-Geiger climate classification, Hydrol. Earth Syst. Sci., 11, 1633–1644, https://doi.org/10.5194/hess-11-1633-2007, 2007.
Pisoni, J. P.: Los sistemas frontales y la circulación en las inmediaciones de los Golfos Norpatagónicos, PhD thesis, Facultad de Ciencias Exactas y Naturales, Universidad de Buenos Aires, Argentina, 197 pp., https://bibliotecadigital.exactas.uba.ar/download/tesis/tesis_n5193_Pisoni.pdf (last access: 26 August 2026), 2012.
Portz, L., Manzolli, R. P., Alcántara-Carrió, J., Rockett, G. C., and Barboza, E. G.: Degradation of a transgressive coastal Dunefield by pines plantation and strategies for recuperation (Lagoa do Peixe National Park, Southern Brazil), Estuar. Coast. Shelf Sci., 259, 107483, https://doi.org/10.1016/j.ecss.2021.107483, 2021.
Pour, S. H., Harun, S. B., and Shahid, S.: Genetic programming for the downscaling of extreme rainfall events on the East Coast of Peninsular Malaysia, Atmosphere, 5, 914–936, https://doi.org/10.3390/atmos5040914, 2014.
R Core Team: R: A language and environment for statistical computing, R Foundation for Statistical Computing, Vienna, Austria, https://www.R-project.org/ (last access: 30 August 2026), 2024.
Ren, H., Gao, X., Zhao, Y., Lei, J., De Maeyer, P., and De Wulf, A.: Strong-wind events control barchan dune migration, Commun. Earth Environ., 5, 278, https://doi.org/10.1038/s43247-024-01444-1, 2024.
Robeson, S. M. and Shein, K. A.: Spatial coherence and decay of wind speed and power in the north-central United States, Phys. Geogr., 18, 479–495, https://doi.org/10.1080/02723646.1997.10642631, 1997.
Rudgers, J. A. and Maron, J. L.: Facilitation between coastal dune shrubs: a non‐nitrogen fixing shrub facilitates establishment of a nitrogen‐fixer, Oikos, 102, 75–84, 2003.
Rusticucci, M., Kyselý, J., Almeira, G., and Lhotka, O.: Long-term variability of heat waves in Argentina and recurrence probability of the severe 2008 heat wave in Buenos Aires, Theor. Appl. Climatol., 124, 679–689, https://doi.org/10.1007/s00704-015-1445-7, 2016.
Saavedra, M.: Caracterización climática de la circulación atmosférica en América del Sur, Revista de Investigación de Física, 14, 111401761, https://doi.org/10.15381/rif.v14i01.8539, 2011.
Sander, L., Pejrup, M., Murray, A. S., Perillo, G. M. E., Rniolo, L. A., and Fruergaard, M.: Chronology and late Holocene evolution of Caleta de los Loros, NE Patagonia, Argentina, Holocene, 28, 1276–1287, https://doi.org/10.1177/0959683618771477, 2018.
Schneider, C. and Gies, D.: Effects of El Niño–southern oscillation on southernmost South America precipitation at 53 S revealed from NCEP–NCAR reanalyses and weather station data, Int. J. Climatol., 24, 1057–1076, https://doi.org/10.1002/joc.1057, 2004.
Schober, P., Boer, C., and Schwarte, L. A.: Correlation coefficients: appropriate use and interpretation, Anesth. Analg., 126, 1763–1768, https://doi.org/10.1213/ANE.0000000000002864, 2018.
Sepúlveda, E. G. (Ed.): Hoja Geológica 38I, Gran Bajo del Gualicho. Provincia de Río Negro, Servicio Geológico Minero Argentino, Buenos Aires, Argentina, 61 pp., http://repositorio.segemar.gov.ar/308849217/460 (last access: 26 August 2026), 1983.
Servicio de Hidrografía Naval (SHN): http://www.hidro.gov.ar/DA/DatosAbiertos.asp (last access: 15 May 2025), 2024.
Servicio Meteorológico Nacional (SMN): https://www.smn.gob.ar/estadisticas (last access: 18 May 2025b), 2024.
Servicio Meteorológico Nacional (SMN): https://www.smn.gob.ar/como_nos_afecta (last access: 17 May 2025), 2014.
Snedden, G. A. and Steyer, G. D.: Predictive occurrence models for coastal wetland plant communities: Delineating hydrologic response surfaces with multinomial logistic regression, Estuar. Coast. Shelf Sci., 118, 11–23, https://doi.org/10.1016/j.ecss.2012.12.002, 2013.
Sperandei, S.: Understanding logistic regression analysis, Biochem. Med., 24, 12–18, https://doi.org/10.11613/BM.2014.003, 2014.
Steyerberg, E. W., Harrell Jr., F. E., Borsboom, G. J., Eijkemans, M. J. C., Vergouwe, Y., and Habbema, J. D. F.: Internal validation of predictive models: efficiency of some procedures for logistic regression analysis, J. Clin. Epidemiol., 54, 774–781, https://doi.org/10.1016/S0895-4356(01)00341-9, 2001.
Stoltzfus, J. C.: Logistic regression: a brief primer, Acad. Emerg. Med., 18, 1099–1104, https://doi.org/10.1111/j.1553-2712.2011.01185.x, 2011.
Thornthwaite, C. W.: An approach toward a rational classification of climate, Geog. Rev., 38, 55–94, https://doi.org/10.2307/210739, 1948.
Toffani, M.: Estudio morfodinámico de las dunas del campo eólico de Bahía Creek, Río Negro, Patagonia Argentina, Latin American Journal of Sedimentology and Basin Analysis, 27, 55–79, 2020.
Toffani, M. and Casadio, S.: “TsoLa Model”. In Earth Surface Dynamics, Zenodo [data set] and [code], https://doi.org/10.5281/zenodo.21996832, 2026.
Toffani, M., Caselli, A. T., and Lothari Inaudi, L. D.: Estudio de los acantilados activos y del campo de dunas de Bahía Creek, Río Negro, Argentina, como base para la elaboración de un mapa de peligro geológico, Rev. Asoc. Geol. Argent., 77, 31–46, 2020.
Toffani, M., Hesp, P., Isla, F. I., and Casadío, S.: Evolutionary stages of active to vegetated coastal transgressive dune fields in the San Matías Gulf coast, Argentina, Geomorphology, 461, 109289, https://doi.org/10.1016/j.geomorph.2024.109289, 2024.
Touma, J. S.: Dependence of the wind profile power law on stability for various locations, J. Air Pollut. Control Assoc., 27, 863–866, https://doi.org/10.1080/00022470.1977.10470503, 1977.
Tsoar, H.: Sand dunes mobility and stability in relation to climate, Physica A, 357, 50–56, https://doi.org/10.1016/j.physa.2005.05.067, 2005.
Tsoar, H. and Blumberg, D. G.: Formation of Parabolic Dunes from Barchan and Transverse Dunes along Israel's Mediterranean Coast, Earth Surf. Process. Landf., 27, 1147–1161, https://doi.org/10.1002/esp.417, 2002.
Vergara Dal Pont, I. P., Caselli, A. T., Moreiras, S. M., and Lauro, C.: Recent coastal geomorphological evolution in the Negro River's mouth (41 S), Argentinean Patagonia, J. Coast. Res., 33, 1367–1375, https://doi.org/10.2112/JCOASTRES-D-16-00060.1, 2017.
Wang, G.: Agricultural drought in a future climate: results from 15 global climate models participating in the IPCC 4th assessment, Clim. Dyn., 25, 739–753, https://doi.org/10.1007/s00382-005-0057-9, 2005.
Wei, Q. and Dunbrack Jr., R. L.: The role of balanced training and testing data sets for binary classifiers in bioinformatics, PloS one, 8, e67863, https://doi.org/10.1371/journal.pone.0067863. 2013.
Wörner, S., Dragani, W. C., Echevarría, E. R., Carrasco, M., and Barón, P. J.: An estimation of the possible migration path of the Pacific Oyster (Crassostrea gigas) along the northern coast of Patagonia, Estuar. Coasts, 42, 806–821, https://doi.org/10.1007/s12237-018-00492-z, 2019.
Yao, Z. Y., Wang, T., Han, Z. W., Zhang, W. M., and Zhao, A. G.: Migration of sand dunes on the northern Alxa Plateau, Inner Mongolia, China, J. Arid Environ., 70, 80–93, https://doi.org/10.1016/j.jaridenv.2006.12.012, 2007.
Yizhaq, H., Ashkenazy, Y., and Tsoar, H.: Why do active and Stabilized Dunes Coexist under the same Climatic Conditions?, Phys. Rev. Lett., 98, 188001, doi;10.1103/PhysRevLett.98.188001, 2007.
Yizhaq, H., Ashkenazy, Y., Levin, N., and Tsoar, H.: Spatiotemporal model for the progression of transgressive dunes, Physica A, 392, 4502–4515, https://doi.org/10.1016/j.physa.2013.03.066, 2013.
Zavala, C. and Freije, H.: Geología de los acantilados, in: Las mesetas patagónicas que caen al mar: la costa rionegrina, edited by: Masera, R., Lew, J., and Serra Peirano, Gobierno de Río Negro, Viedma, Argentina, 187–199, ISBN 9872260400, 2005.
Zhu, W.: p < 0.05, < 0.01, < 0.001, < 0.0001, < 0.00001, < 0.000001, or < 0.0000001 …, J. Sport Health Sci., 5, 77–79, https://doi.org/10.1016/j.jshs.2016.01.019, 2016.