the Creative Commons Attribution 4.0 License.
the Creative Commons Attribution 4.0 License.
 | 07 Nov 2018
Uniform grain-size distribution in the active layer of a shallow, gravel-bedded, braided river (the Urumqi River, China) and implications for paleo-hydrology
Laurie Barrier
Youcun Liu
Clément Narteau
Eric Lajeunesse
Eric Gayer
François Métivier
The grain-size distribution of ancient alluvial systems is commonly determined from surface samples of vertically exposed sections of gravel deposits. This method relies on the hypothesis that the grain-size distribution obtained from a vertical cross section is equivalent to that of the riverbed. Such an hypothesis implies first that the sediments are uniform in size in the river bed, and second that the sampling method implemented on a vertical section leads to a grain-size distribution equivalent to the bulk one. Here, we report a field test of this hypothesis on granulometric samples collected in an active, gravel-bedded, braided stream: the Urumqi River in China. We compare data from volumetric samples of a trench excavated in an active thread and from surface counts performed on the trench vertical faces. Based on this data set, we show that the grain-size distributions obtained from all the samples are similar and that the deposit is uniform at the scale of the river active layer, a layer extending from the surface to a depth of approximately 10 times the size of the largest clasts. As a consequence, the grid-by-number method implemented vertically leads to a grain-size distribution equivalent to the one obtained by a bulk volumetric sampling. This study thus brings support to the hypothesis that vertical surface counts provide an accurate characterization of the grain-size distribution of paleo-braided rivers.
- Article
(7215 KB) - Full-text XML
-
Supplement
(3616 KB) - BibTeX
- EndNote


The size of the river-bed sediment and its spatial distribution result from transport and deposition mechanisms in alluvial systems. These mechanisms have been intensively studied to model fluvial behavior and landscape evolution (Paola and Seal, 1995; Piedra et al., 2012; Sun et al., 2015; Vericat et al., 2008; Wilcock and McArdell, 1993), and the temporal variations in grain-size distributions can be used to reconstruct paleo-environments or changes in tectonic and climatic conditions (Chen et al., 2018; D'Arcy and Whittaker, 2016; Duller et al., 2010; Michael et al., 2014; Schlunegger and Norton, 2015; Whittaker et al., 2011). For such reconstructions, the granulometry in ancient systems is often characterized on the basis of a single grain-size distribution sampled along vertical conglomeratic outcrops with a limited extent (Chen et al., 2018; Duller et al., 2010; Whittaker et al., 2011). Such a grain-size distribution can be relevant to derive quantitative information about a stream from its deposits, but it should be changed for this approach. First, the sampled deposits must be equivalent to the ones that were in direct contact with the flow, and thus actively involved in the transport and deposition processes. Second, the grain-size distribution obtained from vertical outcrops must be equivalent to the reach-scale distribution (i.e., to the granulometry of the whole river bed).
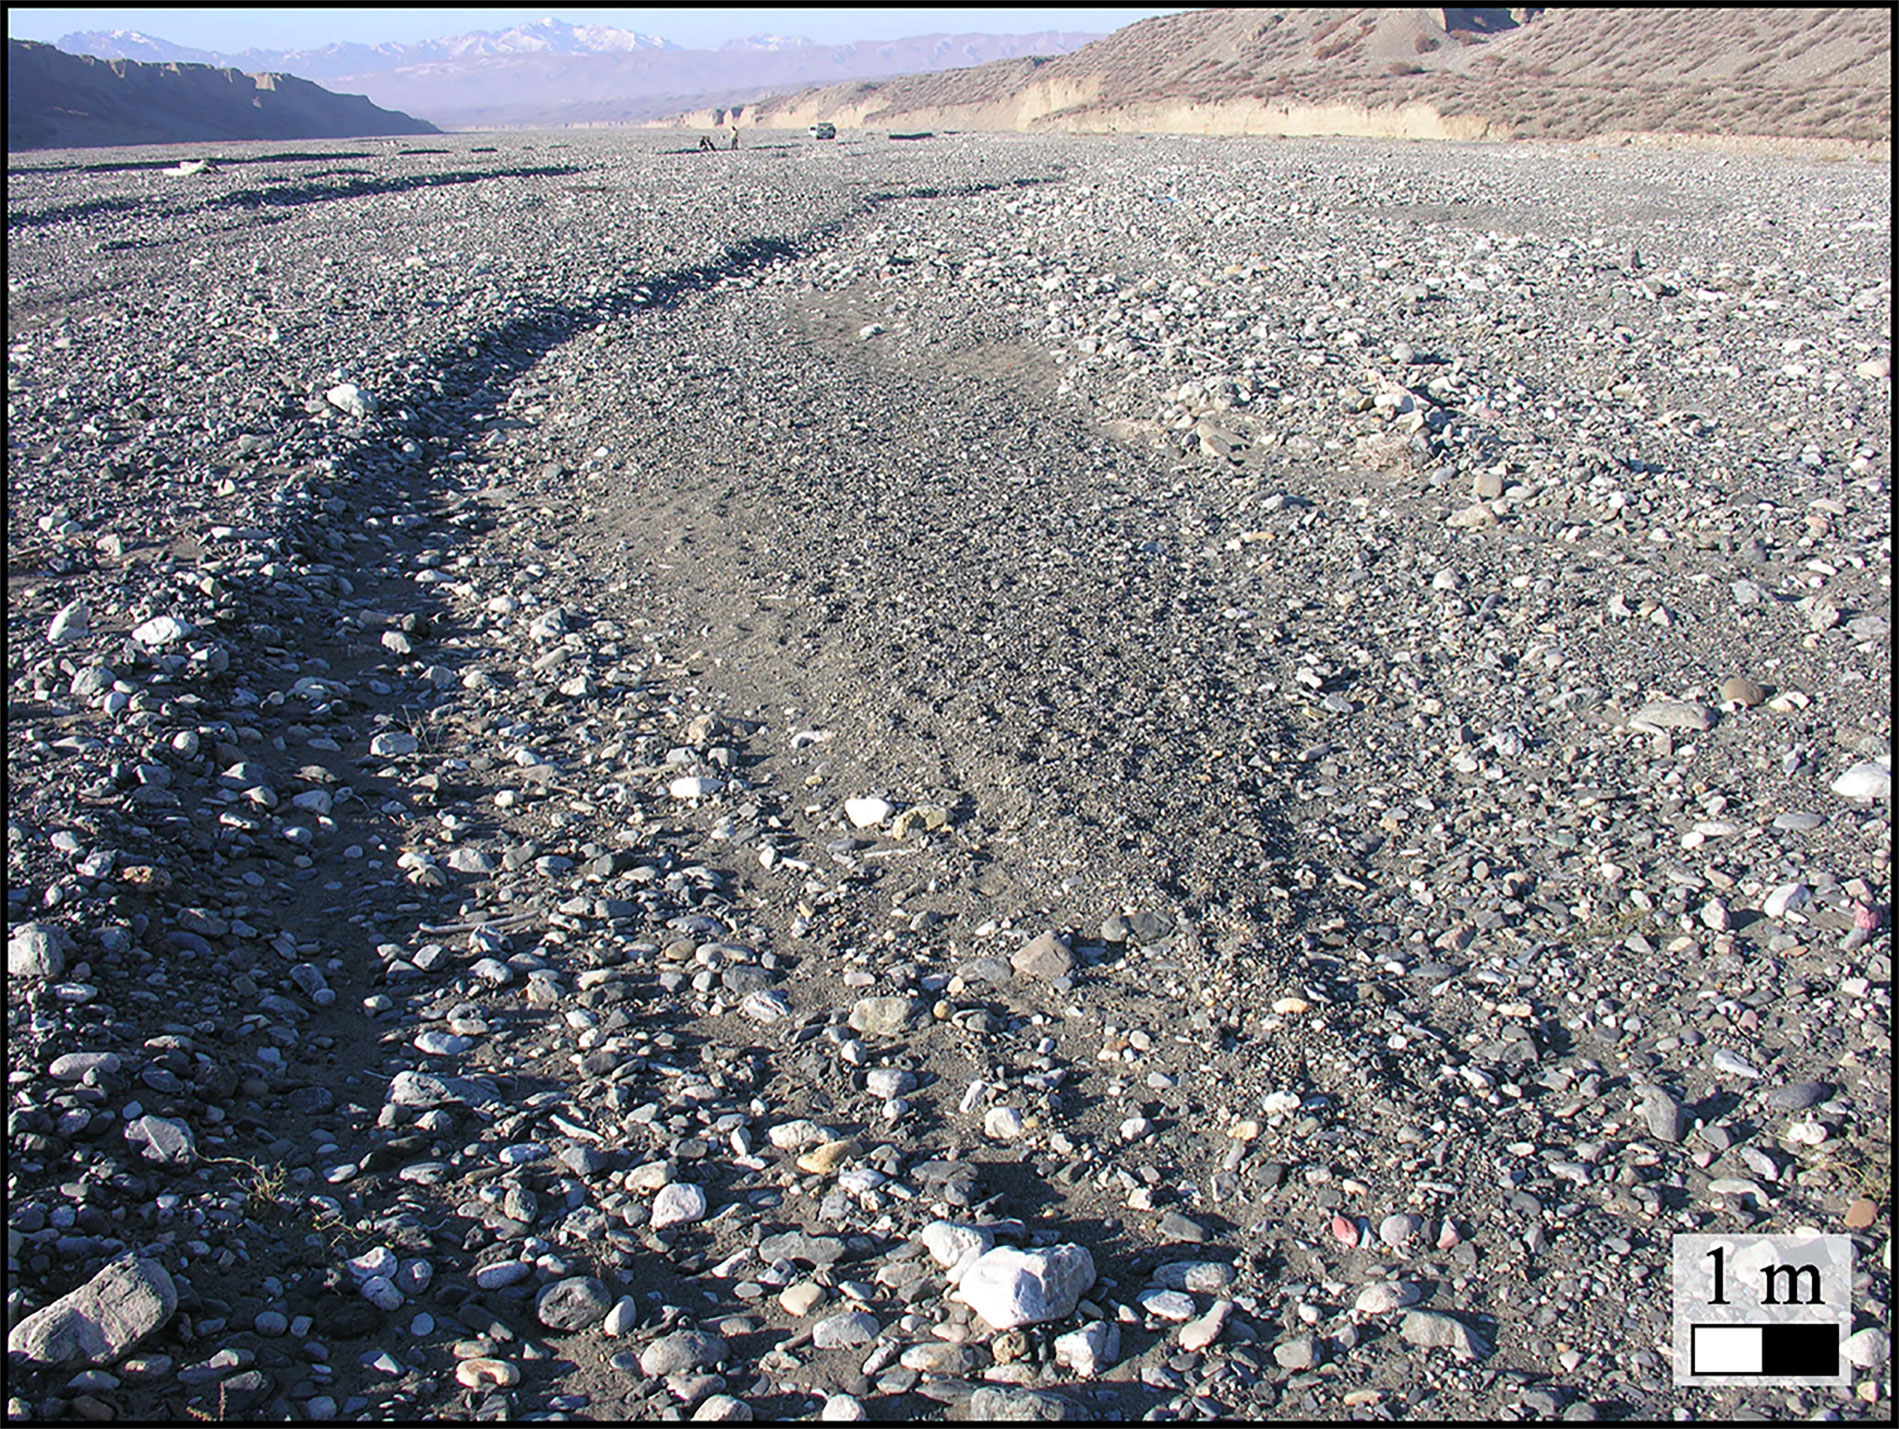
Figure 1Example of a shallow, gravel-bedded, braided river during the dry season (Urumqi River, China). Spatial variations in grain size can be observed at the surface of the riverbed with finer- and coarser-grained areas.
In alluvial gravel systems, sediments can experience strong spatial variations in size. Downstream fining, which results from abrasion and preferential deposition of coarse particles, dominates the large-scale evolution of granulometry along a river path (Paola and Seal, 1995; Parker, 1991; Rice and Church, 2010; Singer, 2008). This preferential deposition of the coarse grains, together with the removal of fine grains by winnowing during low flows, can be responsible for the formation of a coarse layer, or armor, at the surface of the bed (Church et al., 1987; Mao et al., 2011; Parker and Klingeman, 1982; Wilcock and McArdell, 1993). This layer generally forms at the reach scale (i.e., at the scale of the whole riverbed, from several dozens to several hundreds of meters), although it is not always observed (Laronne and Shlomi, 2007; Laronne et al., 1994; Storz-Peretz and Laronne, 2013b, 2018). In addition, local (from a meter to a few tens of meters) trends in grain size are observed at the scale of the morpho-sedimentary elements (e.g., the bars, anabranches, and chutes for braided rivers) that built the riverbed with coarser or finer grained patches (Ashworth et al., 1992; Bluck, 1971; Guerit et al., 2014; Laronne and Shlomi, 2007; Laronne et al., 1994; Lisle and Madej, 1992; Milne, 1982; Smith, 1974; Storz-Peretz et al., 2016). As a consequence, two different features of granulometric sorting can occur at a given location along a stream: (1) a vertical evolution at the reach scale with a surface layer (the first centimeters of the bed deposits, often scaled with the larger grains) coarser than what is below (the subsurface layer), and (2) local lateral variations associated with the morpho-sedimentary elements.
However, recent experimental findings suggest that the granulometry of gravel-bedded, braided streams might be uniform above a given scale. Indeed, over a hydrological season, grains actively involved in transport and deposition are contained within the active layer of a riverbed. Using a physical model of braided streams, Leduc et al. (2015) show that this layer extends laterally over the whole riverbed and that its thickness corresponds to the maximum difference in bed elevation measured in the cross section on the surveyed reach. They also observe that the active layer scales with the largest clast of the bed and extends over a thickness closed to 10 D90 (the 90th percentile of the grain-size distribution). Based on the spatial organization of deposits with different calibers, a few experimental studies show that the sediments are well mixed in the active layer, and thus suggest that the grain-size distribution of gravel-bedded, braided rivers is uniform at the scale of the active layer (Gardner and Ashmore, 2011; Gardner et al., 2018; Leduc et al., 2015). However, such an analysis has not yet been performed on natural rivers. The first aim of this study is therefore to investigate the granulometric uniformity of this active layer of a gravel-bedded, braided river, which is a prerequisite for a relevant paleo-grain-size sampling.
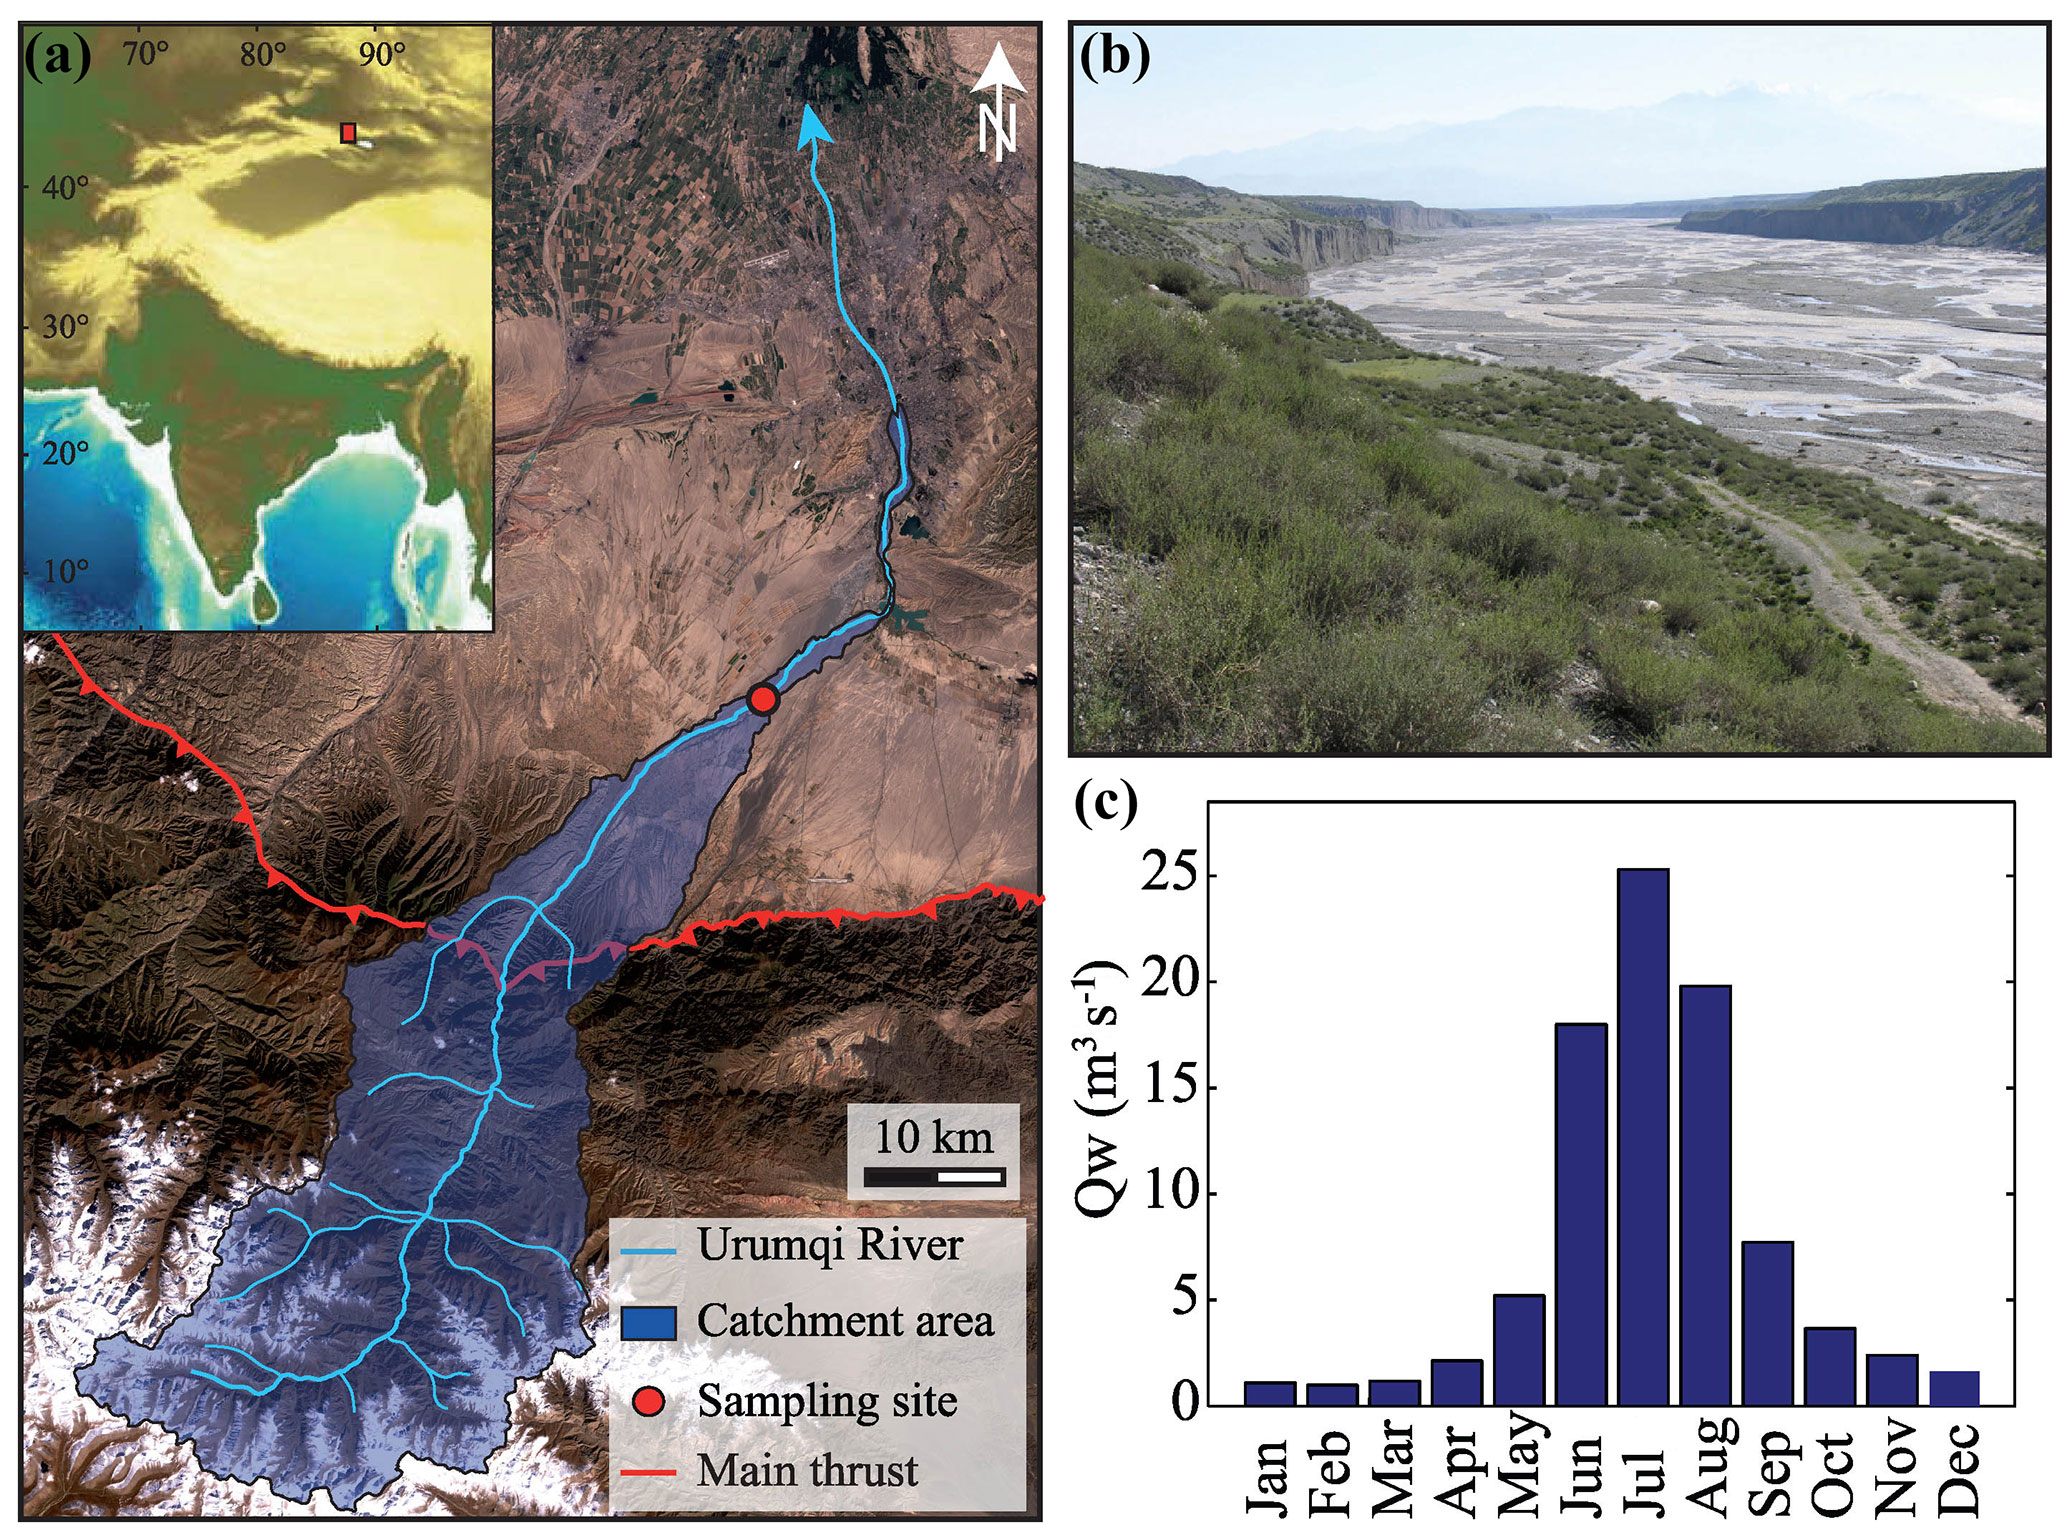
Figure 2(a) Location, drainage network, and catchment area of the Urumqi River system, (b) picture of the river at the sampling site during the high flow season (the channel is ∼300 m wide), and (c) annual hydrograph of the river (after Zhou et al., 1999).
Two methods are commonly used to characterize the granulometry of gravel deposits (grains larger than 4 mm; Wentworth, 1922): the surface count (grid-by-number) and the volumetric (sieve-by-weight) methods. The first one consists of measuring the intermediate axis (b axis) of the grains lying on the top of a riverbed and located at the nodes of a predefined grid. It is classically used to determine the surface granulometry of present-day stream beds (Bunte and Abt, 2001; Church et al., 1987; Wolman, 1954). The second one consists of sieving a volume of sediments excavated from a river bed. It is generally used to sample the subsurface or bulk granulometry. The grain-size distribution obtained by this method is generally considered as representative of the whole riverbed (Bunte and Abt, 2001; Church et al., 1987). The two methods lead to grain-size distributions that can be directly compared (Bunte and Abt, 2001; Church et al., 1987; Kellerhalls and Bray, 1971). In ancient alluvial systems, sediments are often cemented and it is not always possible to remove grains from outcrops. Photographic approaches, that do not require grain extraction, can thus also be implemented for such outcrops but grain identification is strongly affected by the shadows and lights on the photo or by the resolution of the camera, and these methods often require a non-negligible amount of operator corrections to accurately measure the diameters (Bunte and Abt, 2001; Buscombe, 2013; Church et al., 1987; Diplas and Fripp, 1992; Kellerhalls and Bray, 1971; Storz-Peretz and Laronne, 2013a). Consequently, the surface count methodology adapted on vertical sections is preferably used (Chen et al., 2018; Duller et al., 2010; Michael et al., 2014; Whittaker et al., 2011). However, this method has been developed to characterize the surface granulometry of active rivers where grains can be easily picked up and measured at the surface of the bed. To date, its validity on vertical sections has not been demonstrated. This is the second aim of this study.
Accordingly, we present a granulometric study on the Urumqi River, an active braided river in China. First, we describe the methodology implemented to sample the grain-size distributions by volumetric sieving and vertical surface counts. Then, based on a large data set, we show that despite local heterogeneities probably associated with the morpho-sedimentary elements of the riverbed, the grain-size distribution of the sediments is uniform at the scale of the active layer. In addition, we observe that the distribution obtained by vertical surface counts is similar to the bulk granulometry of the riverbed. This study thus shows that quantitative information about the granulometry of paleo-rivers can be accurately derived from surface counts along vertical conglomeratic outcrops.
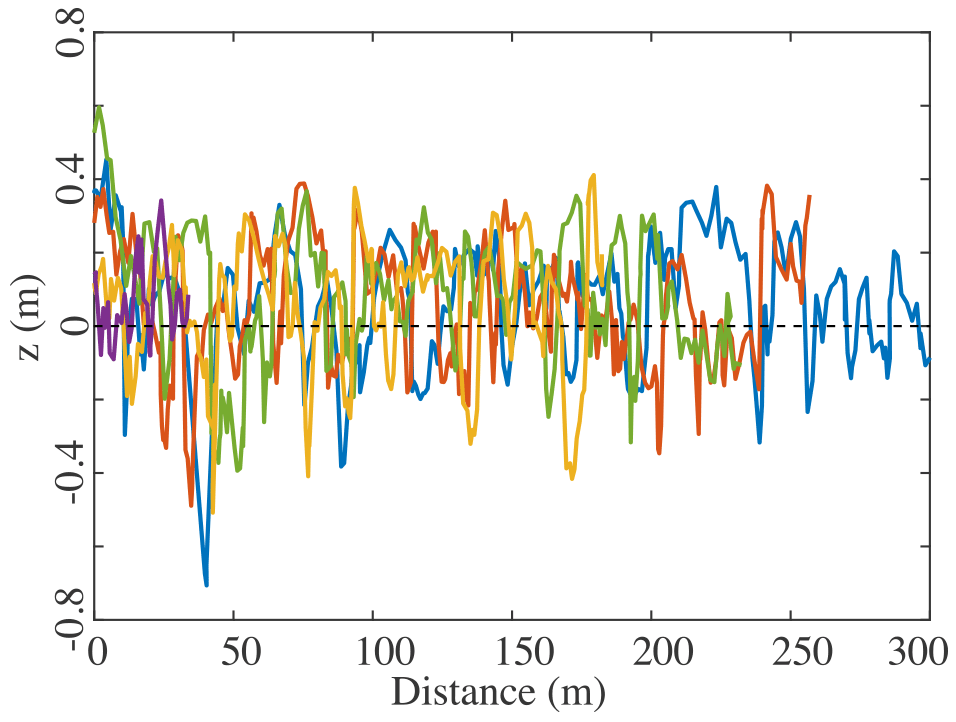
Figure 3Transverse topographic profiles acquired along the Urumqi River bed. Elevation (z) is given as the deviation from the mean bed elevation at each cross section.
The Urumqi River is a shallow (<1 m deep), gravel-bedded, braided river draining the northern side of the Tian Shan range in China (Figs. 1 and 2a–b). This river initiates at the front of a glacier in the high range at 3600 m and runs northwards to the Junggar Basin, where it dies out into the desert at an elevation of 1100 m. The sediments sampled in this study are located about 10 km downstream of the mountain topographic front. There, the Urumqi River braids within an alluvial valley cut into the deposits of a Pleistocene alluvial fan (Guerit et al., 2016; Zhou et al., 2002; Fig. 2a–b). At this location, the catchment area of the river is close to 1000 km2, its average slope is 0.02, and its runoff is mainly due to summer rains and snow or ice melt. As a consequence, the river mostly flows from May to September with a mean annual discharge of about 7.5 m3 s−1 (Zhou et al., 1999; Fig. 2b–c) and a total sediment load of 1–2×10⁸ kg yr−1 (Liu et al., 2008, 2011). The river is almost dry outside of the high flow season and we could thus measure the granulometry of its bed (Fig. 1). The sediments found at the surface of the riverbed are mostly gravels (Guerit et al., 2014).
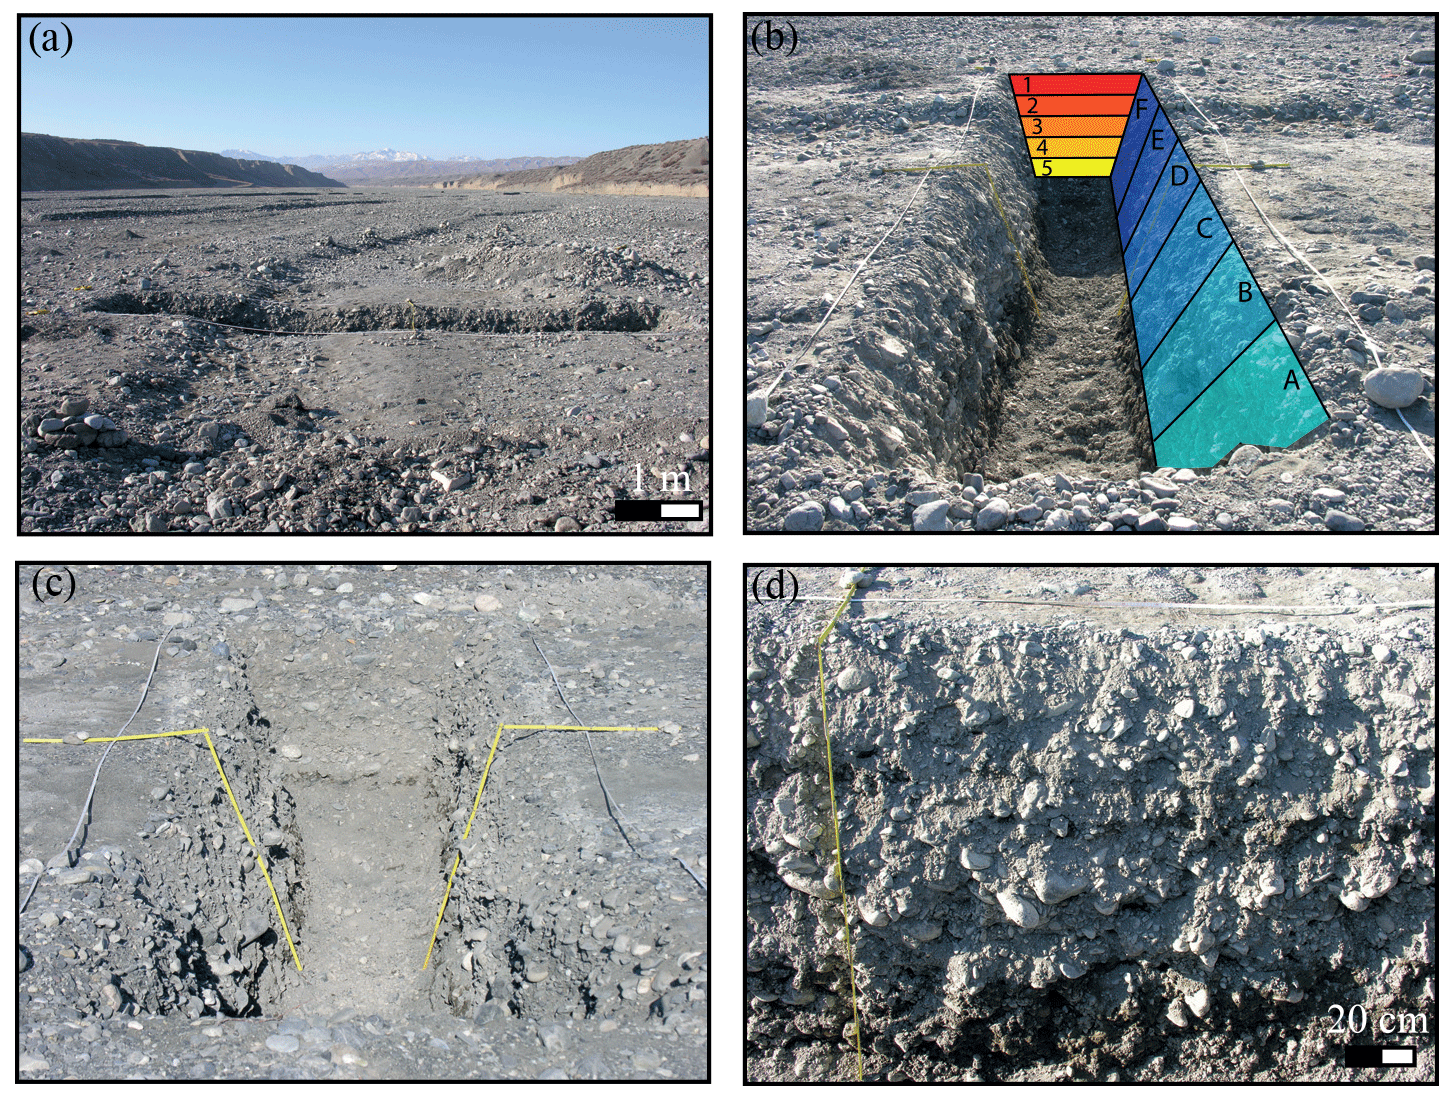
Figure 4View (a) from the north and (b) from the west of the 7.2 m long and 1.2 m wide trench. In this second view, the sampling nomenclature is indicated. Layers are colored from red to yellow and labeled from 1 to 5, whereas columns are colored from light to dark blue and labeled from A to F. Panels (c) and (d) show an implementation of the vertical surface counts along the trench walls with a node every 20 cm.
To estimate the thickness of the active layer of the Urumqi River, we acquired five transverse topographic profiles across the riverbed with a Trimble S6 DR300+ total station with a point every meter on average. Differences in elevation between the highs and the lows of the riverbed are on the order of 1 m (Fig. 3). We thus estimate the active layer of the Urumqi River to be ∼1 m. This morphological estimate is in good agreement with the one based on the D90 of the grain-size distribution at the same location. Indeed, the D90 is ∼10 cm at the sampling site (Guerit et al., 2014) and according to this value, the active layer should also extend from the surface down to 1 m (i.e., 10 D90; Leduc et al., 2015).
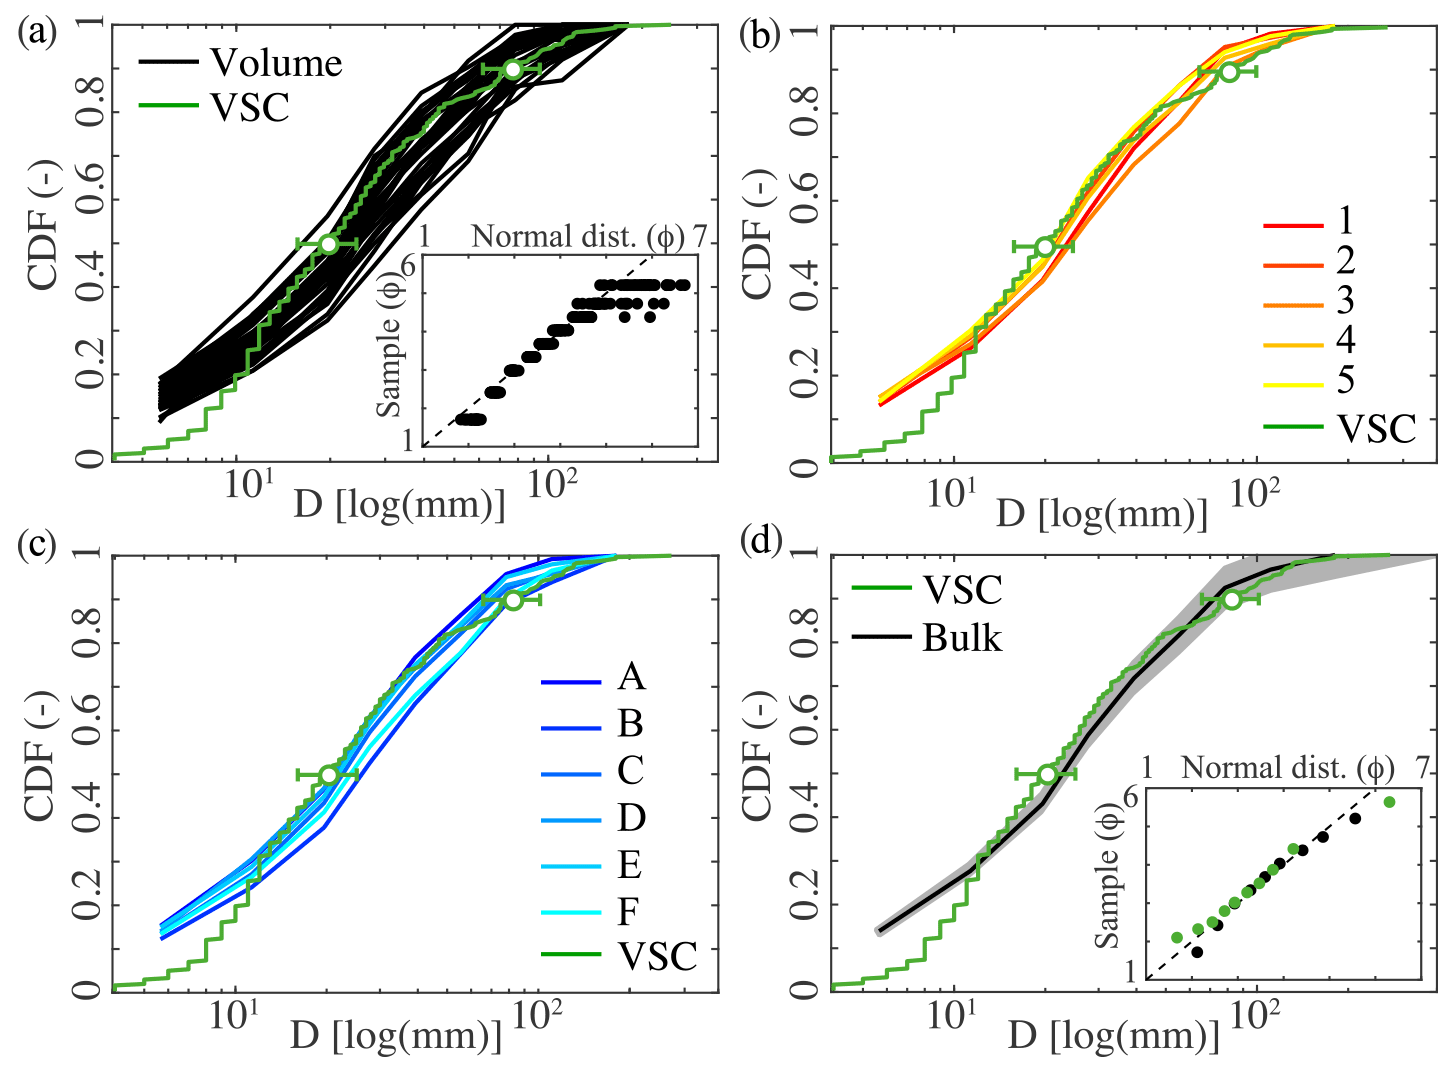
Figure 5Cumulative density function (CDF) of the grain-size distributions of (a) the 30 individual volumetric samples excavated from the trench (1.2 × 1.2 × 0.2 m, black lines) with corresponding Q–Q plots inset (ϕ scale), (b) the five 20 cm thick layers of the trench from the surface to 1 m deep (red to yellow), and (c) the six 1.2 m wide columns of the trench from the west to the east (dark to light blue). In each figure, the grain-size distribution sampled by vertical surface counts (VSC) on the trench wall is indicated (green), together with its D50 and D90 and their associated uncertainties (green dots). (d) Grain-size distributions of the two bulk samples obtained by vertical surface counts on the walls of the trench and volumetric sieving of the trench (Bulk, black) with corresponding Q–Q plots inset (ϕ scale). The gray shading corresponds to the uncertainties in the volumetric sample quantiles. These four graphs suggest that the sediments of the Urumqi River active layer follow a similar distribution and are thus uniform at the scale of this active layer in terms of grain-size distribution.
We combined two methods to characterize the grain-size distribution of the Urumqi River at the scale of its active layer: the volumetric and the surface count methods.
To characterize the surface-layer and subsurface granulometries of the river bed, we dug a 7.2 m × 1.2 m × 1 m trench perpendicular to the flow direction of one thread into its deposits (Fig. 4a–b). The sediments were excavated step by step from this trench as individual volumetric samples. We set the thickness of these samples to 2 D90 to ensure that the largest grains were contained within one sample, and we determined the volume to be large enough to accurately characterize the grain-size distribution. Indeed, the accuracy of the volumetric method depends upon the sample weight with respect to the weight of its largest clast (Church et al., 1987; Haschenburger et al., 2007). Ideally, the largest grain of a volumetric sample should not contribute to more than 0.1 % of the total weight but this criterion is difficult to achieve in the field and a relaxed criteria of 5 % is acceptable when the large particles are >128 mm, as for the Urumqi River. In this study, each grain-size fraction is thus determined within ±5 %. The corresponding individual volumetric samples are 1.2 m × 1.2 m × 0.2 m, resulting in 30 samples labeled from 1 to 5 with respect to their depth, and from A to F with respect to their lateral position (Fig. 4b). We sieved the sediments using mesh sizes ranging from 63 µm up to 256 mm. Each mesh size was twice the previous one and we added three sieves (24, 48, and 96 mm) to obtain a more detailed description in the gravel range. We then weighed the grains retained in each mesh to obtain a mass for a given diameter. The diameter of the grains retained in each sieve corresponds to the geometric mean of the sieve size and the following larger sieve, and it is considered to be the b axis of the clasts (Bunte and Abt, 2001; Church et al., 1987; Guerit et al., 2014). To be consistent with the surface counts, for which only the grains larger than 4 mm were considered, we removed all the grains smaller than 4 mm (24 % of the volumetric samples on average). These individual volumetric samples can be combined in different ways. (i) They can be used individually to characterize the grain-size distribution at the local scale. (ii) They can be merged according to their depth (layers 1 to 5) or to their lateral position (columns A to F) to document potential granulometric variability associated with the location of a sample within the riverbed. (iii) These individual volumetric samples can also be merged altogether to characterize the bulk granulometry of the Urumqi riverbed at the scale of the active layer. (iv) Finally, they can be merged randomly and analyzed to document the granulometric evolution with respect to the weight of a sample.
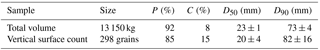
In order to test whether the bulk granulometry of the riverbed can be characterized from the sampling of a cross section, we determined the grain-size distribution of the sediments outcropping on the walls of the trench by a vertical surface count. We implemented the surface count methodology on the vertical sections of the river deposits (Fig. 4c–d), using a square grid of 20 cm (∼2 D90 in order to avoid sampling the same grain twice). We extracted the grains located directly under each node and measured their b axis (Wolman, 1954). However, grains smaller than 4 mm (19 % of the total sample) were not considered in order to reduce the measurement uncertainties (Bunte and Abt, 2001; Church et al., 1987; Kellerhalls and Bray, 1971). The resulting sample is thus composed of 298 grains with D>4 mm. We evaluated the confidence interval by a bootstrap method (Bunte and Abt, 2001; Rice and Church, 1996) for two characteristic diameters: the D50 (the diameter associated with the 50th percentile of the distribution) and the D90. We estimated the D50 and the D90 of 10 000 distributions built by randomly sampling with replacement 1 to 298 grains from the vertical surface sample. For both diameters, the range of values decreases with increasing bootstrap resample size. Above a given bootstrap sample size, values stabilize around the D50 (or D90) of the initial sample and the confidence intervals correspond to the observed scatter.
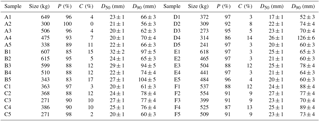
Table 1Main characteristics of the local-scale samples excavated from the trench. P and C are the proportions of pebbles and cobbles, respectively, within the sediments defined after Wentworth (1922). D50 is the median diameter and D90 the 90th quantile of the grain-size distributions. Confidence intervals are calculated from the Church et al. (1987) criteria (see the Methodology section for details).
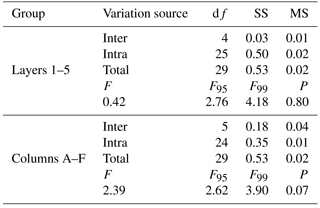
Grain-size distributions often follow a lognormal distribution. We thus normalize our samples using the ϕ scale (log2 based) and fit the distributions by a normal law. The simplest way to assess the accuracy of this fit is to compare the quantiles of our normalized samples to the quantiles of a normal distribution with the same mean and standard deviation (Q–Q plots) to test whether or not our samples follow such a distribution. For the volumetric samples, in order to avoid interpolation between the measurements, the quantiles correspond to those defined by the points defined by the discrete cumulative density function (CDF), whereas for the vertical surface sample we can compare the Q10 to Q90 quantiles. If the distributions are similar, points align on the x=y line. Regardless of the nature of the grain-size distributions, we can not statistically compare the individual distributions to each other because we do not have access to the number of grains in each sieve, a data value required for most statistical tests of comparison (the volumetric method provides only the frequency distribution of the grain sizes). Accordingly, the similarities and differences between the 30 volumetric samples are discussed below based on the visual comparison of the distributions, together with the comparison of the characteristic diameters, D50 and D90. However, when the samples are merged with respect to their position in the trench, they can be considered as several samples coming from the same group. For example, the five layers correspond to five groups, each group being characterized by six samples. In this case, ANOVA tests can be performed to compare the median diameters of the five layers (1 to 5) and of the six columns (A to F). ANOVA tests determine whether at least two groups come from the same population, based on the analysis of their variance. The ratio F of the variability within and between the different groups is calculated and compared to theoretical F values. The tests are based on the null hypothesis that all the samples come from the same population of grains. This hypothesis is rejected if F is higher than the acceptable values F95 and F99 at a level of significance of 95 % and 99 %, respectively.
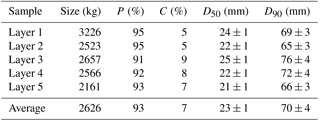
Table 2Main characteristics of the five layers issued from the trench. P and C are the proportions of pebbles and cobbles, respectively, within the sediments defined after Wentworth (1922). D50 is the median diameter and D90 the 90th quantile of the grain-size distributions. Confidence intervals are calculated from the Church et al. (1987) criteria (see the Methodology section for details).
4.1 Granulometry of the riverbed at different spatial scales
4.1.1 Local variability in grain-size distribution
First, we analyze the grain-size distributions of the individual volumes excavated from the trench (Fig. 5a, Table 1). These 30 volumetric samples have an average weight of 440 kg and they are composed by more than 85 % of pebbles (i.e., grains with D∈4–64 mm). The Q–Q plots indicate that all the normalized samples follow a normal distribution, although we observe some deviation for the coarser quantiles (inset Fig. 5a). In addition, the means and the standard deviations of the fitted curves are in the same range of values (Fig. S1, Table S1 in the Supplement). Accordingly, the distributions show a similar shape and plot close to each other (Fig. 5a). However, we observe some scatter between them and for any quantile, diameters can vary within a range of ±25 %–30 % around the mean value. For example, the D50 vary between 17±1 mm and 32±2 mm with an average value of 23 mm, while their D90 are comprised between 52±3 and 126±6 mm with an average of 73 mm (Table 1).
Table 3ANOVA tests on the grain-size distributions of the five layers and the six columns from the trench. df is the number of degrees of freedom, SS the sum of square, and MS the mean square. The null hypothesis is that there is no difference in the mean values of the grain-size distributions, and P is the probability to get the obtained F value from samples extracted from a single population. The five layers, as well as the six columns, are indistinguishable (F< F95).
4.1.2 Vertical sorting
Second, we merge the individual volumetric samples according to their depth (layers 1 to 5) and analyze the grain-size sorting with respect to depth (Fig. 5b, Table 2). On average, the different layers weigh 2600 kg and they are composed by 93 % of pebbles. The five distributions are similar in shape and for any quantile, diameters vary within a limited range of ±10 % around the mean value (Fig. 5b). This is illustrated by the limited variability of the characteristic diameters: their D50 range between 21±1 and 25±1 mm, while their D90 are comprised between 65±1 and 76±2 mm, with mean values of 23 and 70 mm, respectively (Table 2). The grain-size distributions of these larger samples are thus less variable than the individual ones. In addition, we observe that the grain-size distribution of the surface layer (between 0 and 0.2 m, i.e., layer 1) is similar to the grain-size distribution of the subsurface layer (between 0.2 and 1 m, i.e., merged layers 2 to 5) (Fig. S2), and in particular that the ratio between the D50 of the two layers is 1.07. Moreover, the ANOVA tests confirm that the five layers are statistically indistinguishable (Table 3). Our data set thus indicates that at the scale of the active layer, there is no vertical sorting in the Urumqi riverbed.
Table 4Main characteristics of the six columns issued from the trench. P and C are the proportions of pebbles and cobbles, respectively, within the sediments defined after Wentworth (1922). D50 is the median diameter and D90 the 90th quantile of the grain-size distributions. Confidence intervals are calculated from the Church et al. (1987) criteria (see the Methodology section for details).
4.1.3 Horizontal sorting
Third, we merge the individual volumes according to their lateral position (columns A to F) and analyze the horizontal grain-size sorting (Fig. 5c, Table 4). On average, the different columns weigh 2200 kg and they are composed by 92 % of pebbles. Here again, we observe that the samples exhibit a similar grain-size distribution, and for all the quantiles the scatter between these six samples is quite limited (Fig. 5c). For example, the D50 range between 21±1 and 26±1 mm, while their D90 vary between 64±1 and 76±2 mm (Table 4). This corresponds to a range of ±13 % and ±10 % around the means of the samples (23 and 71 mm, respectively). Here again, the ANOVA tests confirm that the six columns are indistinguishable in terms of grain size (Table 3). Thus, at the scale of the active layer, the Urumqi riverbed has no horizontal granulometric sorting. In consequence, grain-size distributions issued from vertical pits are equivalent to distributions measured from horizontal layers.
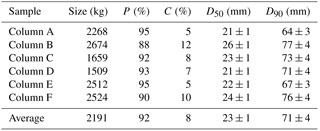
Table 5Main characteristics of the large-scale samples. P and C are the proportions of pebbles and cobbles, respectively, within the sediments defined after Wentworth (1922). D50 is the median diameter and D90 the 90th quantile of the grain-size distributions. Confidence intervals are calculated by bootstrapping for the surface counts and from the Church et al. (1987) criteria for the volumetric sample (see the Methodology section for details).
4.2 Granulometry of the riverbed according to sampling methods
Finally, we merge all the volumetric samples together to determine the bulk granulometry of the riverbed (Fig. 5d, Table 5). Based on 13 150 kg of sediments, this large volumetric distribution is composed of 92 % pebbles, and the Q–Q plot indicates that the normalized sample also follows a normal distribution (inset Fig. 5d). It is characterized by a D50 of 23±1 mm and a D90 of 73±1 (Fig. 5d, Table 5).
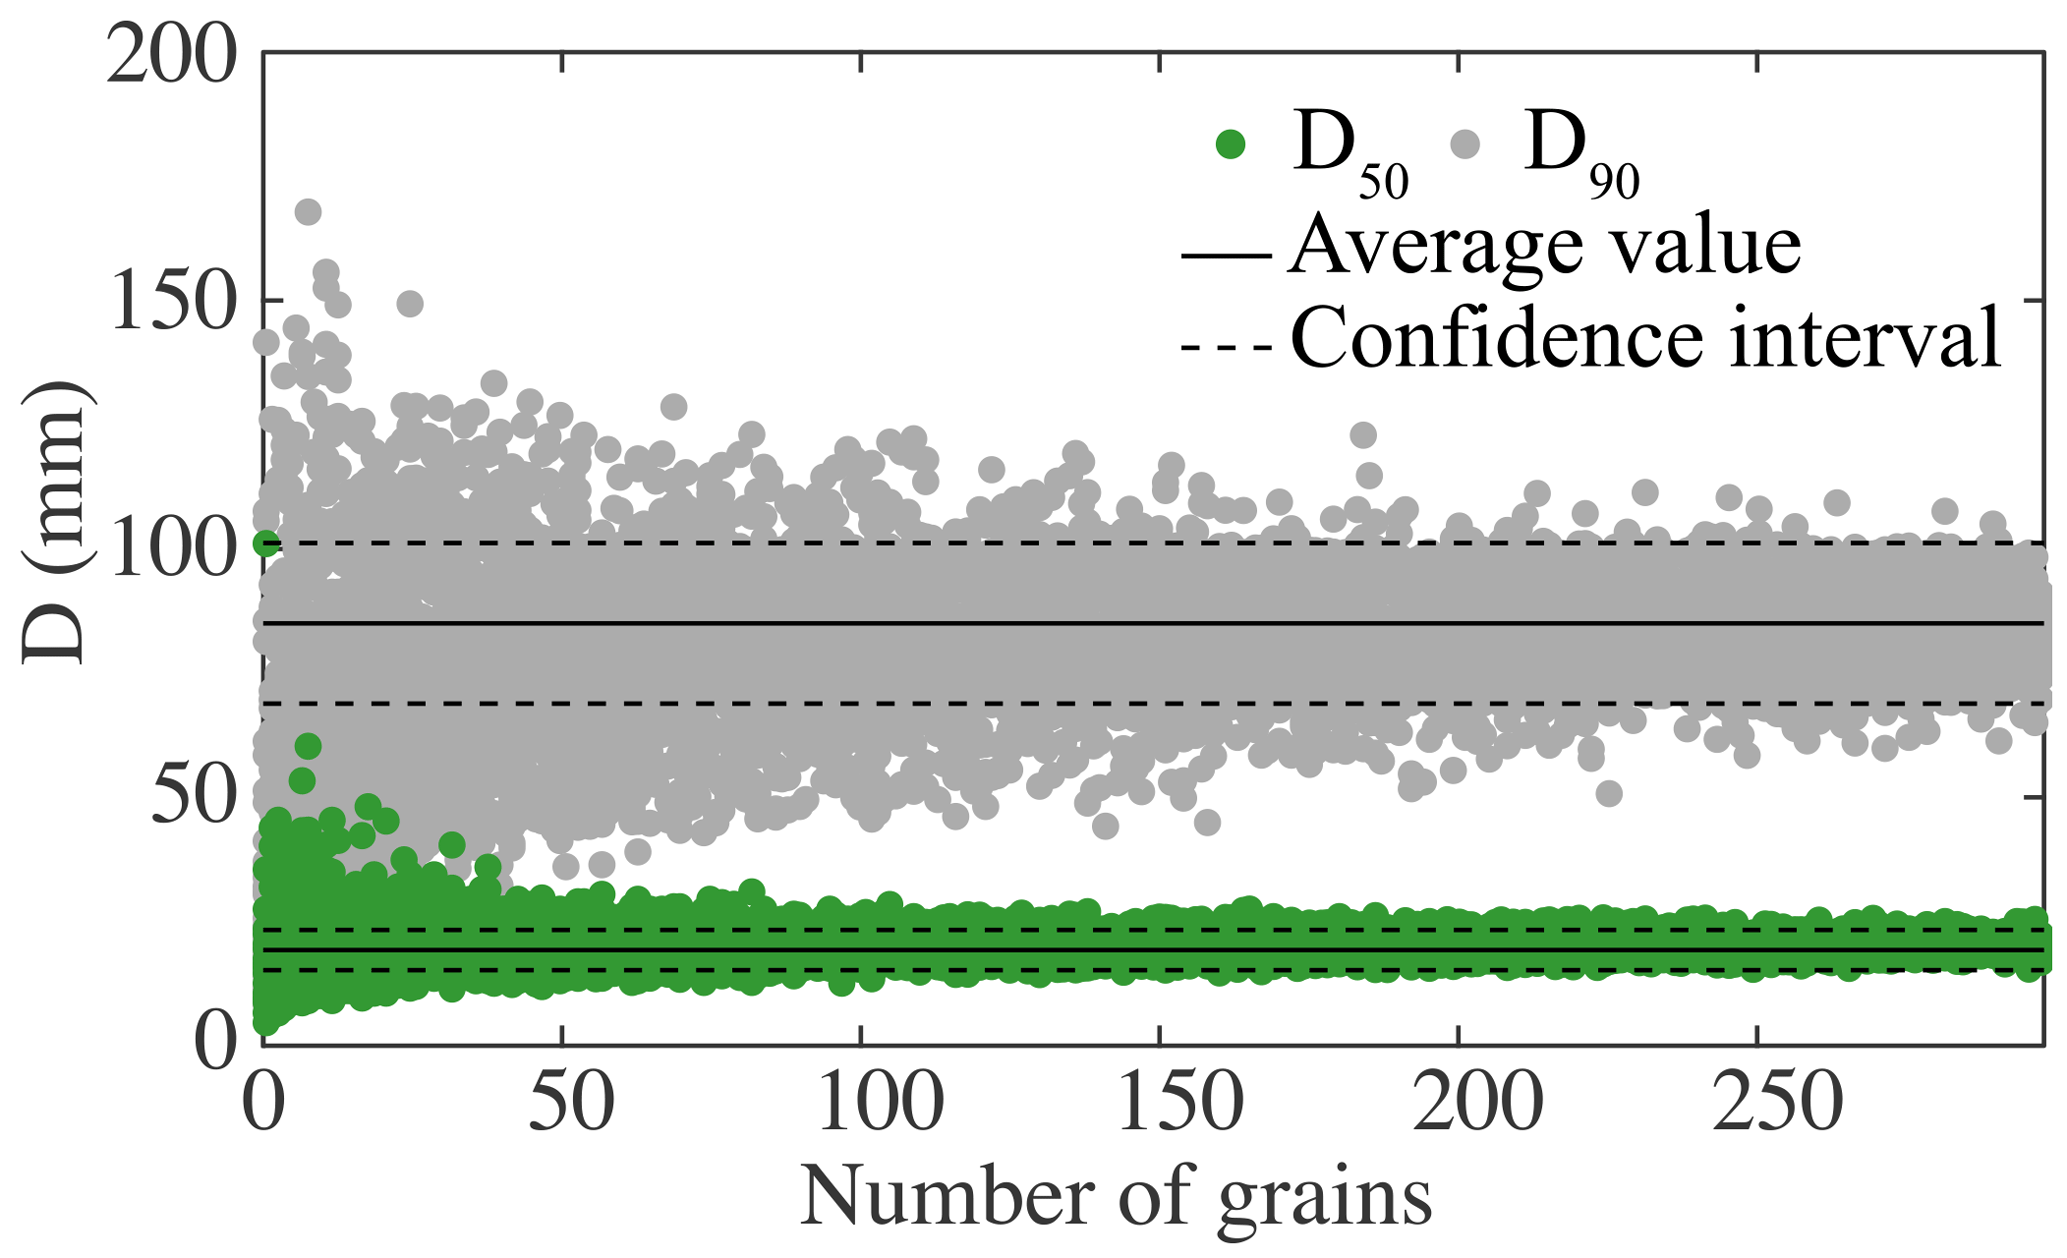
Figure 6Estimation of the confidence interval by a bootstrap approach of the D50 (green dots) and D90 (gray dots) of the surface counts performed along the walls of the trench (see text for details on the method). Diameters are defined within a range of ±15 %–20 %.
We compare this distribution to the one obtained by vertical counts along the walls of the trench (Fig. 5d). Based on 298 grains (D≥4 mm), the vertical surface-count sample is made up of 85 % of pebbles. From the bootstrap approach, we find the D50 and D90 to be defined within a range of ±15 % and ±20 %, respectively (Fig. 6); and here again, the Q–Q plot indicates that the normalized sample follows a normal distribution (inset Fig. 5d). The median diameter D50 of this vertical surface count is 20±4 mm, while its D90 is 82±16 mm (Table 5). Accordingly, the shape of the vertical surface grain-size distribution compares well with the bulk volumetric distribution of the trench, but also with the 30 individual volumetric samples as well as with the five layers and the six columns (Fig. 5). Except for the smallest grain sizes, the diameters associated with each quantile are very similar (Fig. 5). A Q–Q plot also confirms that the distribution obtained by the vertical surface count is similar to the bulk volumetric one (Fig. S3). This comparison indicates that the characterization in cross section of the Urumqi active layer is equivalent to the more traditional volumetric method, and thus shows for the first time that surface counts implemented on vertical outcrops can be used as proxies for a bulk volumetric sampling.
5.1 Grain-size uniformity in an active, gravel-bedded, braided river
At the local scale (< 1 m to tens of meters), features of grain-size sorting are commonly observed and documented on the bed of braided gravel-bed streams (Ashmore, 2013; Ashworth, 1996; Bluck, 1971, 1976; Guerit et al., 2014; Leopold et al., 1964; Smith, 1974). In these rivers, this surface sorting is associated with the morpho-sedimentary elements (bars, anabranches, and chutes) that shape the riverbed. In the Urumqi River, we also observe local variations in grain sizes in the vertical section of the active layer with small areas enriched in fine or coarse grains (Fig. S4) and this variability could be the expression in cross section of the small-scale sorting associated with the morpho-sedimentary elements observed on the bed (Guerit et al., 2014). We propose that this sorting may be responsible for the scatter observed between the granulometric distributions of the 30 individual volumetric samples (Fig. 5a), as the volumetric samples scale in size with the morpho-sedimentary elements corresponding to meter-wide and centimeter-to-decimeter-deep grain-size patches. This suggestion is supported by the fact that scatter around the mean values seems to be dependent on the sample size (Fig. 5).
To assess the minimum weight required for a sample to go over the local variability and to be equivalent to the bulk one, we randomly merge, without replacement, the individual volumetric samples to obtain 600 composite volumetric samples of 241 to 13 150 kg. We then determine the D50 and D90 as a function of the sample weight (Fig. 7). Variability around the mean decreases with increasing weight and at first order, the sample weight must increase by a factor of 2 for the variability around the mean value to decrease by 5 % (Fig. 7). We observe that ∼5000 kg of sediments larger than 4 mm (about 11 individual volumetric samples) are required to estimate a D50 and a D90 within a range of ±10 % around the mean values (Fig. 7). To reach a level of accuracy equivalent to the bulk sample (±5 %), we observe that 9000 kg (about 20 individual volumetric samples) are necessary (Fig. 7). This analysis confirms that small-scale grain-size sorting exists in the active layer of the Urumqi River, but this sorting becomes negligible as the sample size increases. The active layer of the Urumqi River thus appears as the superposition of small-scale structures (the morpho-sedimentary elements), whose variability vanishes above a given scale. Accordingly, at the scale of the active layer, the grain-size distribution of the Urumqi River deposits can be considered as uniform.
The uniformity in the grain-size distributions of the various samples we analyze (individual volumes, layer, and column samples), and their similarity with the bulk one, indicates that the Urumqi riverbed is not armored at the reach scale. In consequence, at any depth or location of the active layer of the bed, the deposits are representative of the sediments transported as bed load in direct contact with the flow, providing that the sample is large enough to integrate at least a dozen morpho-sedimentary elements. Our results therefore accord with the experimental findings of Gardner and Ashmore (2011), Leduc et al. (2015), and Gardner et al. (2018). The agreement between field and physical experiments leads us to propose that the absence of vertical and lateral sorting may be typical of non-armored, gravel-bedded, braided rivers.
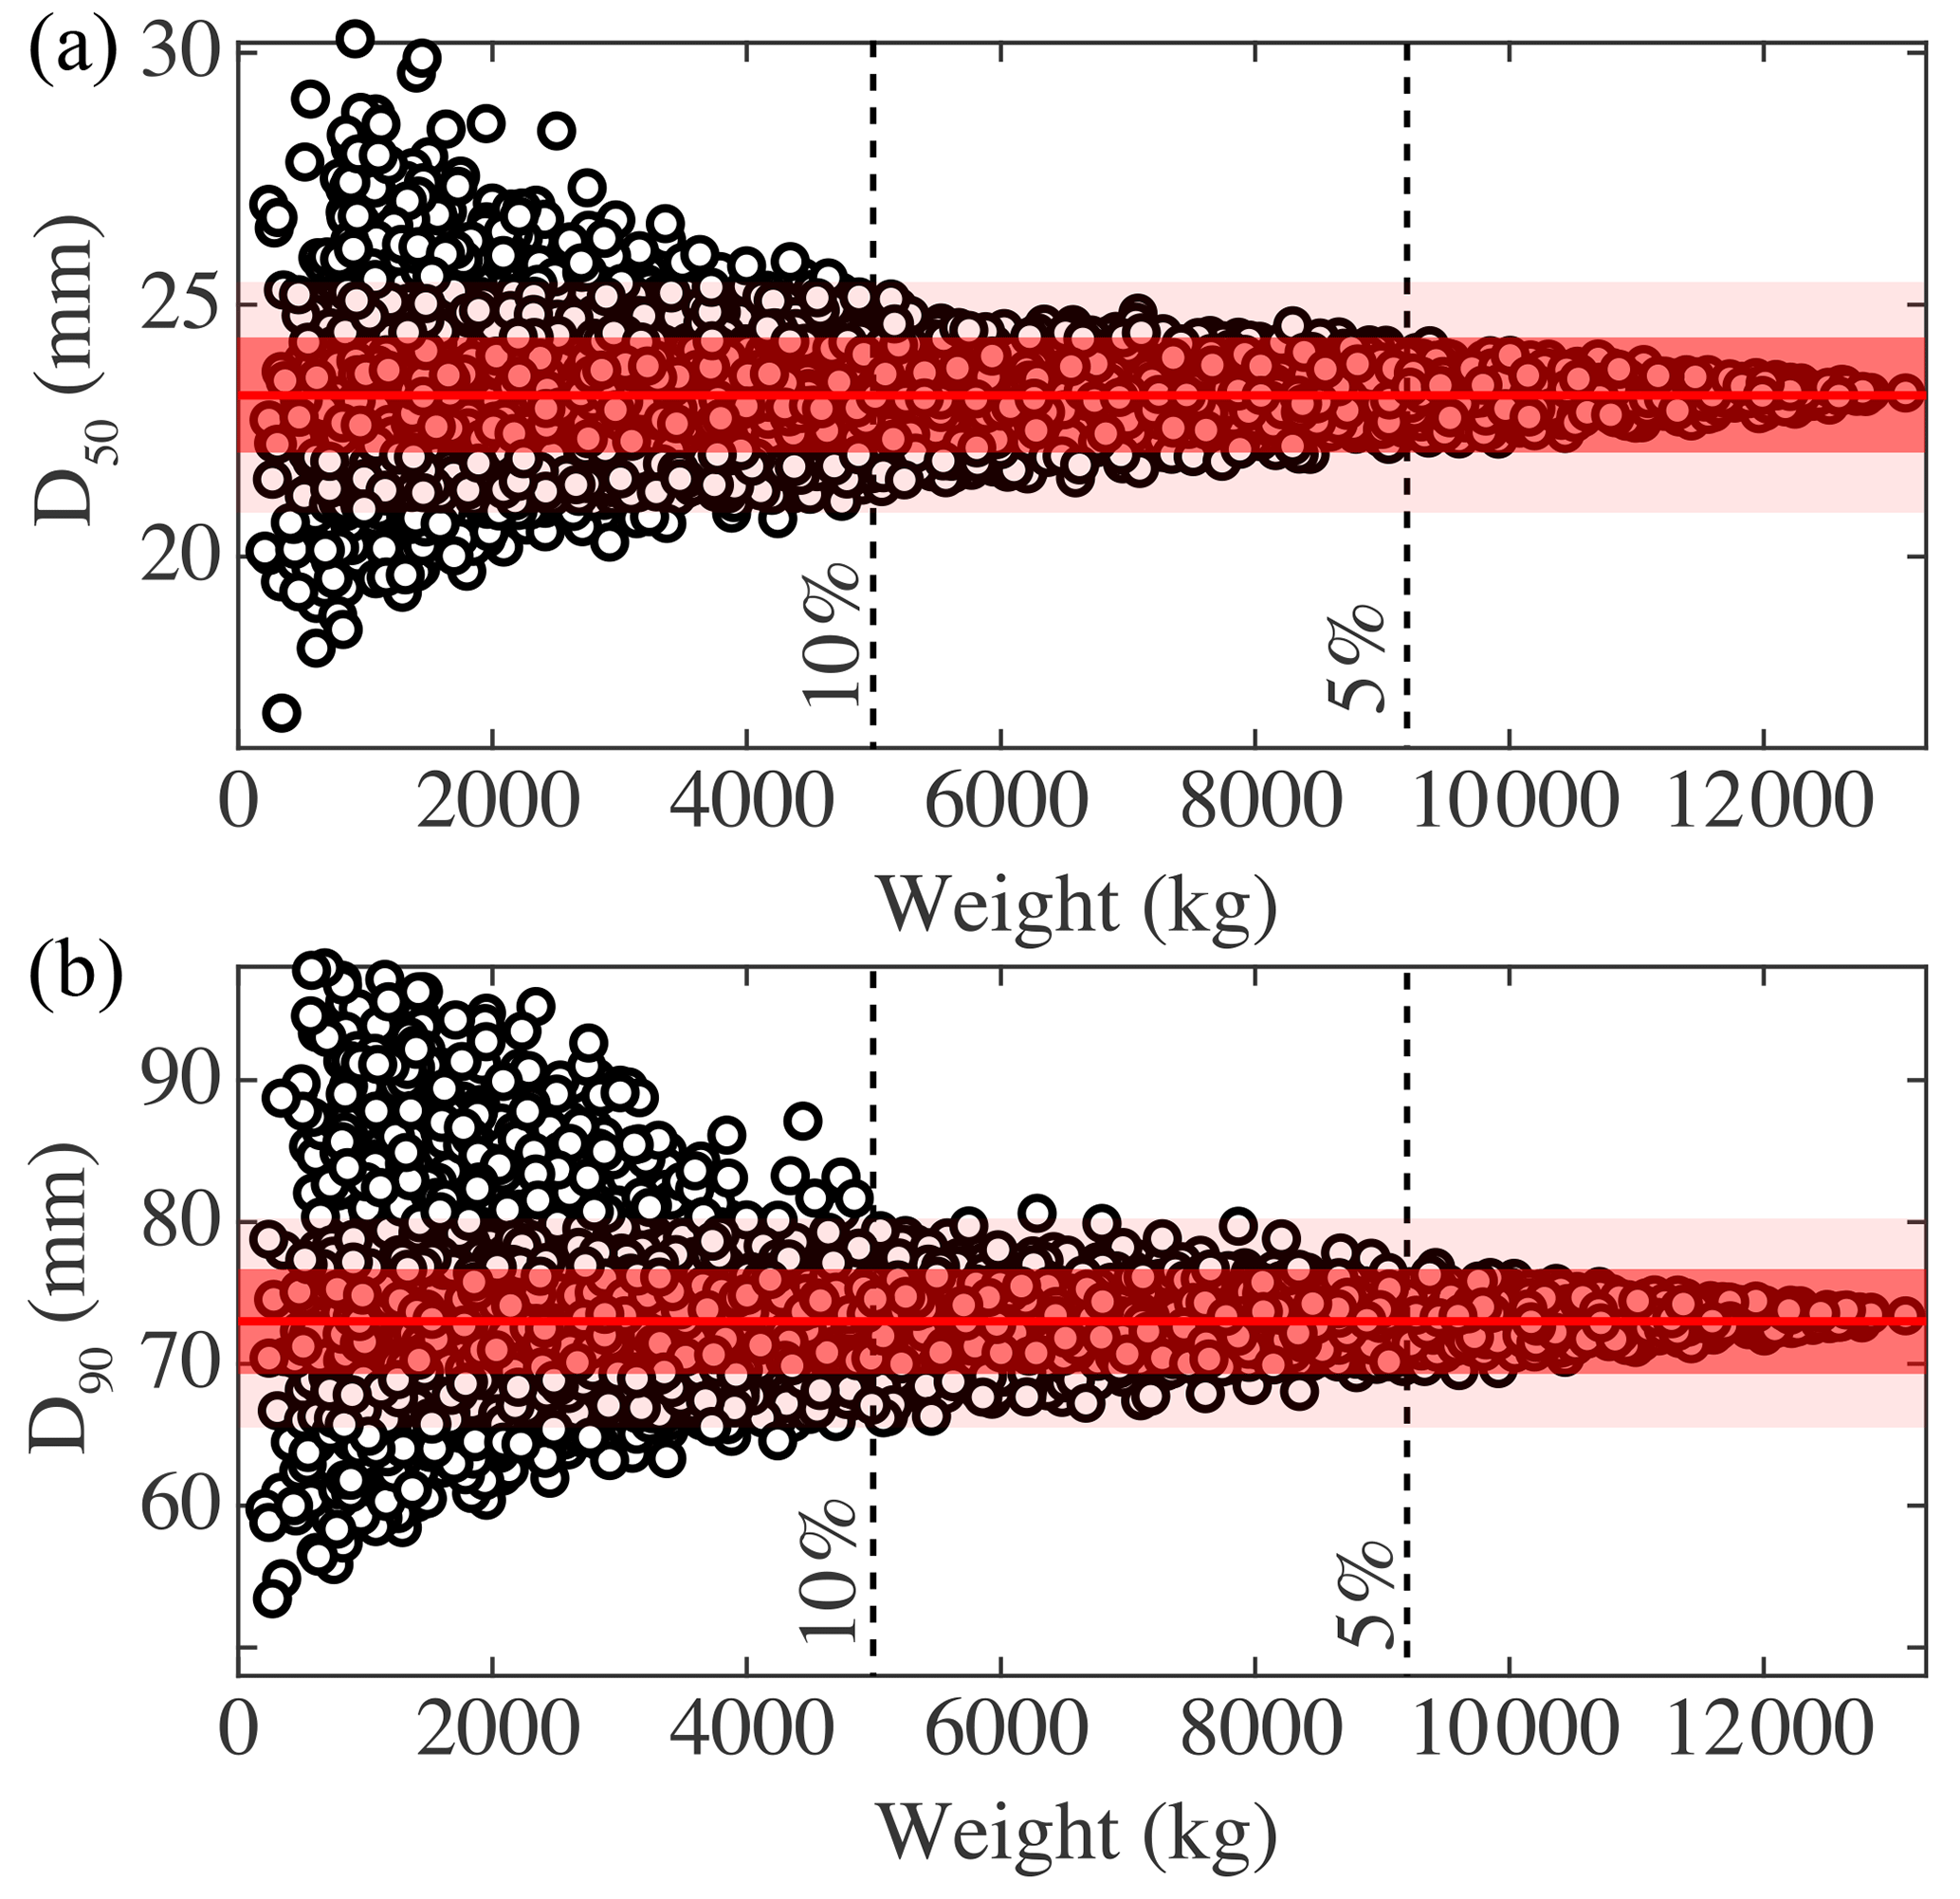
Figure 7Evolution of (a) the D50 and (b) the D90 with respect to the sample weight. These diameters are issued from grain-size distributions built by random merging without replacement of the individual volumetric samples. The red line is for the mean value, the dark red area for the mean ±5 %, and the light red area for the mean ±10 %. The black dashed lines indicate the visually estimated threshold for a sample to be within ±10 % and 5 %.
5.2 Grain-size sampling in ancient systems
We show that the broadly used Wolman grid-by-number method can be implemented on vertical sections to characterize grain-size distributions with a good level of confidence. In addition, the granulometric uniformity at the scale of the Urumqi active layer implies that the grain-size distribution of paleo-rivers can be adequately determined from conglomeratic outcrops. Our study thus legitimates this kind of sampling (Chen et al., 2018; Duller et al., 2010; Michael et al., 2014; Whittaker et al., 2011), at least for unarmored braided rivers, for stratigraphical or paleo-hydrological reconstructions .
However, three limitations must be considered to generalize our results to any field work in ancient systems. First, this study is based on grains removed from trench walls so that it is possible to measure their actual b axis. In ancient systems, deposits are often cemented and it is not always possible to remove grains from outcrops. In that case, outcropping diameters should be identified before implementing measurements. Indeed, in a section perpendicular to the main flow, the a (long) and c (small) axes are expected to be visible. In such a situation, a correction factor should be applied to determine the b axis (Storz-Peretz and Laronne, 2013a). On the contrary, in a section parallel to the main flow, the b (intermediate) and c (short) axes are expected to be visible, and the b axis will then appear to be the longest one (Bunte and Abt, 2001). Indications of paleo-flows can thus help to identify the actual b axis.
Second, the grain-size distribution of the deposits can be altered after deposition or after surface abandonment by several factors. Aeolian processes can either bring fine material that can infiltrate the gravels and decrease the global granulometry of the deposits, or lead to the formation of desert pavements (McFadden et al., 1987, 1998). Soil development on the top of a surface can also induce the formation of secondary particles that will contaminate the initial gravel deposits (Pimentel, 2002). However, the gravel fraction should not be affected by such secondary processes that generally affect the fine-grain content, and truncation of the grain-size distribution below a given diameter (4 mm here) should ensure the removal of these secondary signals. Moreover, as these processes might mostly affect the upper part of gravel deposits (Cui et al., 2008; Wooster et al., 2008), samples should be acquired as much as possible where evidence for such modifications are not observed. With time, chemical alteration can also modify the size of the initial gravels, but this process might be difficult to quantify. Accordingly, we suggest that outcrops showing evidence of gravel alteration should not be sampled.
Finally, the third limitation is related to the limited thickness of the active layer, which extends in depth over several D90 only for an active system (Gardner and Ashmore, 2011; Laronne et al., 1994; Leduc et al., 2015). Moreover, the thickness of this layer is not fixed though time as it could evolve with potential changes in the river characteristics. The sediments deposited during a hydrological season can also be remobilized afterwards if the river incises, leading to a partial or total destruction of the former active layer(s). In stratigraphic successions, deposits are stacked vertically through time and consequently, to compensate for this limited extension in depth of the active layer and for its potential preservation changes through time, the grids used for vertical surface counts should extend laterally rather than vertically to stay as much as possible within the same sedimentary layer.
We perform a granulometric study on the deposits of the Urumqi River, an active, gravel-bedded, braided stream in China. Based on a large data set collected by volumetric and vertical surface count samplings, we show that the grain-size distribution of the riverbed is uniform at the scale of its active layer. Despite some local variabilities related to small-scale grain-size features, there is no vertical or lateral granulometric trend within this layer. Because our findings confirm earlier physical models (Gardner and Ashmore, 2011; Gardner et al., 2018; Leduc et al., 2015), we propose that, beyond the Urumqi River, this uniformity can be the case for all the non-armored, gravel-bedded, braided streams.
This uniformity implies that it is possible to determine the grain-size distribution of gravel-bedded, braided alluvial systems from vertical outcrops. We show that the grid-by-number method, initially developed and tested on the horizontal surface of riverbeds, can be implemented on vertical outcrops to obtain samples equivalent to a volumetric investigation in non-armored, gravel-bedded rivers. This study thus supports the hypothesis that vertical surface counts can be implemented on conglomeratic outcrops to provide an accurate characterization of the grain-size distribution of paleo-braided rivers.
The dataset is available in the attached Supplement.
The supplement related to this article is available online at: https://doi.org/10.5194/esurf-6-1011-2018-supplement.
All authors contributed to data acquisition and analysis, and were actively involved in writing the manuscript.
The authors declare that they have no conflict of interest.
We are thankful to two anonymous reviewers and to the associate editor for
their comments that strongly improved the quality of the paper. The study
presented in this manuscript was conducted with research grants from the
CNRS-INSU RELIEF program and the French–Chinese CNRS-CAS international
associated laboratory SALADYN, as
well as from the IPGP BQR and Potamology programs. Laure Guerit benefitted
from a PhD grant from the French Ministry of Research and Higher Education
(MESR). This work is partially supported by the National Natural Science
Foundation of China (no. 41471001).
Edited
by: Rebecca Hodge
Reviewed by: two anonymous referees
Ashmore, P.: Treatise on Geomorphology, vol. 9, chap. Morphology and Dynamics of Braided Rivers, San Diego, Academic Press, 289–312, 2013. a
Ashworth, P. J.: Mid-channel bar growth and its relationship to local flow strength and direction, Earth Surf. Proc. Land., 21, 103–123, 1996. a
Ashworth, P. J., Ferguson, R. I., and Powell, M. D.: Dynamics of gravel-bed rivers, Bedload transport and sorting in braided channels, John Wiley & Sons Ltd., 497–515, 1992. a
Bluck, B. J.: Sedimentation in the meandering River Endrick, Scot. J. Geol., 7, 93–138, 1971. a, b
Bluck, B. J.: Sedimentation in some Scottish rivers of low sinuosity, Transactions Royal Society of Edinburgh, 69, 425–455, 1976. a
Bunte, K. and Abt, S.: Sampling surface and subsurface particle-size distributions in wadable gravel-and cobble-bed streams for analyses in sediment transport, hydraulics, and streambed monitoring, Gen. Tech. Rep. RMRS-GTR-74, 2001. a, b, c, d, e, f, g, h
Buscombe, D.: Transferable wavelet method for grain-size distribution from images of sediment surfaces and thin sections, and other natural granular patterns, Sedimentology, 60, 1709–1732, 2013. a
Chen, C., Guerit, L., Foreman, B. Z., Hassenruck-Gudipati, H. J., Adatte, T., Honegger, L., Perret, M., Sluijs, A., and Castelltort, S.: Estimating regional flood discharge during Palaeocene-Eocene global warming, Sci. Rep., 8, 13391, https://doi.org/10.1038/s41598-018-31076-3, 2018. a, b, c, d
Church, M. A., McLean, D. G., and Wolcott, J. F.: Sediments transport in Gravel Bed Rivers, chap. River Bed Gravels : Sampling and Analysis, John Wiley and Sons, New York, 43–88, 1987. a, b, c, d, e, f, g, h, i, j, k, l
Cui, Y., Wooster, J. K., Baker, P. F., Dusterhoff, S. R., Sklar, L. S., and Dietrich, W. E.: Theory of fine sediment infiltration into immobile gravel bed, J. Hydraul. Eng., 134, 1421–1429, 2008. a
D'Arcy, M. and Whittaker, A., and Roda-Boluda, D.: Measuring alluvial fan sensitivity to past climate changes using a self-similarity approach to grain-size fining, Death Valley, California, Sedimentology, 64, 388–424, 2016. a
Diplas, P. and Fripp, J. B.: Properties of Various Sediment Sampling Procedures, J. Hydraul. Eng.-ASCE, 118, 955–970, 1992. a
Duller, R., Whittaker, A., Fedele, J., Whitchurch, A., Springett, J., Smithells, R., Fordyce, S., and Allen, P.: From grain size to tectonics, J. Geophys. Res., 115, F03022, https://doi.org/10.1029/2009JF001495, 2010. a, b, c, d
Gardner, T. and Ashmore, P.: Geometry and grain-size characteristics of the basal surface of a braided river deposit, Geology, 39, 247–250, 2011. a, b, c, d
Gardner, T., Ashmore, P., and Leduc, P.: Morpho-sedimentary characteristics of proximal gravel braided river deposits in a Froude-scaled physical model, Sedimentology, 65, 877–896, 2018. a, b, c
Guerit, L., Barrier, L., Narteau, C., Métivier, F., Liu, Y., Lajeunesse, E., Gayer, E., Meunier, P., Malverti, L., and Ye, B.: The Grain-size Patchiness of Braided Gravel-Bed Streams–example of the Urumqi River (northeast Tian Shan, China), Adv. Geosci., 37, 27–39, 2014. a, b, c, d, e, f
Guerit, L., Barrier, L., Jolivet, M., Fu, B., and Métivier, F.: Denudation intensity and control in the Chinese Tian Shan: new constraints from mass balance on catchment-alluvial fan systems, Earth Surf. Proc. Land., 41, 1088–1106, 2016. a
Haschenburger, J. K., Rice, S. P., and Voyde, E.: Evaluation of bulk sediment sampling criteria for gravel-bed rivers, J. Sediment. Res., 77, 415–423, 2007. a
Kellerhalls, R. and Bray, D. I.: Sampling Procedures for Coarse Fluvial Sediments, J. Hydr. Eng. Div.-ASCE, 97, 1165–1180, 1971. a, b, c
Laronne, J. B. and Shlomi, Y.: Depositional character and preservation potential of coarse-grained sediments deposited by flood events in hyper-arid braided channels in the Rift Valley, Arava, Israel, Sediment. Geol., 195, 21–37, 2007. a, b
Laronne, J. B., Reid, I., Yitshak, Y., and Frostick, L. E.: The non-layering of gravel streambeds under ephemeral flood regimes, J. Hydrol., 159, 353–363, 1994. a, b, c
Leduc, P., Ashmore, P., and Gardner, J.: Grain sorting in the morphological active layer of a braided river physical model, Earth Surf. Dynam., 3, 577–585, 2015. a, b, c, d, e, f
Leopold, L. B., Wolman, M. G., and Miller, J. P.: Fluvial processes in geomorphology, Freeman, 1964. a
Lisle, T. E. and Madej, M. A.: Dynamics of gravel-bed rivers, chap. Spatial variation in armouring in a channel with high sediment supply, John Willey & Sons, 277–293, 1992. a
Liu, Y., Métivier, F., Lajeunesse, E., Lancien, P., Narteau, C., and Meunier, P.: Measuring bed load in gravel bed mountain rivers: averaging methods and sampling strategies, Geodynamica Acta, 21, 81–92, 2008. a
Liu, Y., Métivier, F., Gaillardet, J., Ye, B., Meunier, P., Narteau, C., Lajeunesse, E., Han, T., and Malverti, L.: Erosion rates deduced from seasonal mass balance along the upper Urumqi River in Tianshan, Solid Earth, 2, 283–301, https://doi.org/10.5194/se-2-283-2011, 2011. a
Mao, L., Cooper, J. R., and Frostick, L. E.: Grain size and topographical differences between static and mobile armour layers, Earth Surf. Proc. Land., 36, 1321–1334, 2011. a
McFadden, L. D., Wells, S. G., and Jercinovich, M. J.: Influences of eolian and pedogenic processes on the origin and evolution of desert pavements, Geology, 15, 504–508, 1987. a
McFadden, L. D., McDonald, E. V., Wells, S. G., Anderson, K., Quade, J., and Forman, S. L.: The vesicular layer and carbonate collars of desert soils and pavements: formation, age and relation to climate change, Geomorphology, 24, 101–145, 1998. a
Michael, N. A., Whittaker, A. C., Carter, A., and Allen, P. A.: Volumetric budget and grain-size fractionation of a geological sediment routing system: Eocene Escanilla Formation, south-central Pyrenees, Geol. Soc. Am. Bull., 126, 585–599, 2014. a, b, c
Milne, J. A.: Bed-material size and the riffle-pool sequence, Sedimentology, 29, 267–278, 1982. a
Paola, C. and Seal, R.: Grain-size patchiness as a cause of selective deposition and downstream fining, Water Resour. Res., 31, 1395–1407, 1995. a, b
Parker, G.: Selective sorting and abrasion of river gravel. I: Theory, J. Hydraul. Eng., 117, 131–147, 1991. a
Parker, G. and Klingeman, P.: On why gravel bed streams are paved, Water Resour. Res., 18, 1409–1423, 1982. a
Piedra, M. M., Haynes, H., and Hoey, T. B.: The spatial distribution of coarse surface grains and the stability of gravel river beds, Sedimentology, 59, 1014–1029, 2012. a
Pimentel, N.: Pedogenic and early diagenetic processes in Palaeogene alluvial fan and lacustrine deposits from the Sado Basin (S Portugal), Sediment. Geol., 148, 123–138, 2002. a
Rice, S. and Church, M.: Sampling surficial fluvial gravels the precision of size distribution percentile estimates, J. Sediment. Res., 66, 654–665, 1996. a
Rice, S. and Church, M.: Grain-size Sorting within River Bars in Relation to Downstream Fining Along a Wandering Channel, Sedimentology, 57, 232–251, 2010. a
Schlunegger, F. and Norton, K.: Climate vs. tectonics: the competing roles of Late Oligocene warming and Alpine orogenesis in constructing alluvial megafan sequences in the North Alpine foreland basin, Basin Research, 27, 230–245, 2015. a
Singer, M.: Downstream patterns of bed material grain size in a large, lowland alluvial river subject to low sediment supply, Water Resour. Res., 44, W12202, https://doi.org/10.1029/2008WR007183, 2008. a
Smith, N. D.: Sedimentology and bar formation in Upper-Kicking-Horse-River, a braided outwash stream, J. Geol., 82, 205–223, 1974. a, b
Storz-Peretz, Y. and Laronne, J. B.: Automatic Grain Sizing of vertical exposures of gravelly deposits, Sediment. Geol., 294, 13–26, 2013a. a, b
Storz-Peretz, Y. and Laronne, J. B.: Morphotextural characterization of dryland braided channels, Geol. Soc. Am. Bull., 125, 1599–1617, 2013b. a
Storz-Peretz, Y. and Laronne, J. B.: The morpho-textural signature of large bedforms in ephemeral gravel-bed channels of various planforms, Hydrol. Process., 32, 617–635, 2018. a
Storz-Peretz, Y., Laronne, J. B., Surian, N., and Lucía, A.: Flow recession as a driver of the morpho-texture of braided streams, Earth Surf. Proc. Land., 41, 754–770, 2016. a
Sun, J., Lin, B., and Yang, H.: Development and application of a braided river model with non-uniform sediment transport, Adv. Water Res., 81, 62–74, 2015. a
Vericat, D., Batalla, R. J., and Gibbins, C. N.: Sediment entrainment and depletion from patches of fine material in a gravel-bed river, Water Resour. Res., 44, W11415, https://doi.org/10.1029/2008WR007028, 2008. a
Wentworth, C. K.: A scale of grade and class terms for clastic sediments, J. Geol., 30, 377–392, 1922. a, b, c, d, e
Whittaker, A., Duller, R., Springett, J., Smithells, R., Whitchurch, A., and Allen, P.: Decoding downstream trends in stratigraphic grain size as a function of tectonic subsidence and sediment supply, Geol. Soc. Am. Bull., 123, 1363–1382, 2011. a, b, c, d
Wilcock, P. and McArdell, B.: Surface-based fractional transport rates: Mobilization thresholds and partial transport of a sand-gravel sediment, Water Resour. Res., 29, 1297–1312, 1993. a, b
Wolman, M.: A method for sampling coarse river-bed material, American Geophysical Union Transactions, 35, 951–956, 1954. a, b
Wooster, J. K., Dusterhoff, S. R., Cui, Y., Sklar, L. S., Dietrich, W. E., and Malko, M.: Sediment supply and relative size distribution effects on fine sediment infiltration into immobile gravels, Water Resour. Res., 44, W03424, https://doi.org/10.1029/2006WR005815, 2008. a
Zhou, L., Yang, F., and Shao, X.: River hydrology and water resources in Xinjiang, Urumqi (in chinese), Xinjiang Science and Technology Press, 1999. a, b
Zhou, S. Z., Jiao, K. Q., Zhao, J. D., Zhang, S. Q., Cui, J. X., and Xu, L. B.: Geomorphology of the Urumqi River Valley and the uplift of the Tianshan Mountains in Quaternary, Sci. China Ser. D, 45, 961–968, 2002. a