the Creative Commons Attribution 4.0 License.
the Creative Commons Attribution 4.0 License.
 | 13 Nov 2018
A comparison of structure from motion photogrammetry and the traversing micro-erosion meter for measuring erosion on shore platforms
Ankit Kumar Verma
Mary Clare Bourke
For decades researchers have used the micro-erosion meter and its successor the traversing micro-erosion meter to measure micro-scale rates of vertical erosion (downwearing) on shore platforms. Difficulties with “upscaling” of micro-scale field data in order to explain long-term platform evolution have led to calls to introduce other methods which allow for the measurement of platform erosion at different scales. Structure from motion photogrammetry is fast emerging as a reliable, cost-effective tool for geomorphic change detection, providing a valuable means for detecting micro-scale to mesoscale geomorphic change over different terrain types. Here we present the results of an experiment in which we test the efficacy of structure from motion photogrammetry for measuring change on shore platforms due to different erosion processes (sweeping abrasion, scratching, and percussion). Key to this approach is the development of the coordinate reference system used to reference and scale the models, which can be easily deployed in the field. Experiments were carried out on three simulated platform surfaces with low to high relative rugosity to assess the influence of surface roughness. We find that structure from motion photogrammetry can be used to reliably detect micro-scale (sub-millimetre) and mesoscale (cm) erosion on shore platforms with a low rugosity index. As topographic complexity increases, the scale of detection is reduced. We also provide a detailed comparison of the two methods across a range of categories including cost, data collection, analysis, and output. We find that structure from motion offers several advantages over the micro-erosion meter, most notably the ability to detect and measure the erosion of shore platforms at different scales.
- Article
(10750 KB) - Full-text XML
- BibTeX
- EndNote


There are numerous methods employed for measuring natural rates of change on rock surfaces. For decades researchers were restricted to direct measurement of change relative to a datum; however, this method has been largely superseded by techniques which fall into two general categories: contact methods which utilize erosion meters and non-contact methods such as terrestrial laser scanning (TLS) and structure from motion (SfM) photogrammetry (Moses et al., 2014). On shore platforms, the micro-erosion meter (MEM) and its successor the transversing micro-erosion meter (TMEM) are the most frequently applied instruments for quantifying micro-scale erosion. However, SfM photogrammetry is fast emerging as a valuable tool for detecting and quantifying geomorphic change across a range of scales and environments and represents a potential alternative to the MEM and TMEM for measuring erosion on shore platforms if a suitable level of resolution, accuracy, and repeatability can be achieved. There is a large body of literature focussed on each of these methods (e.g. Hanna, 1966; Trudgill, 1975; Trudgill et al., 1981; Stephenson and Kirk, 2001; Trenhaile, 2006; Snavely, 2006; Stephenson and Finlayson, 2009; Stephenson et al., 2010; Westoby et al., 2012; Gómez-Gutiérrez et al., 2014; Kaiser et al., 2014; Carrivick et al., 2016; Smith et al., 2016). A brief overview of the two methods is given below.
1.1 The micro-erosion meter and the traversing micro-erosion meter
The MEM was developed and described by Hanna (1966) and High and Hanna (1970) as a tool for measuring relatively slow lowering rates of bedrock surfaces. Since its inception, the MEM and its modified successor, the TMEM (Trudgill et al., 1981), have been used by numerous researchers to measure rates of surface lowering on shore platforms of varying lithologies. The spatial and temporal variability of measured erosion rates for shore platforms have allowed for a more detailed understanding of processes operating on shore platform, contributing to the ongoing debate on the origin of shore platforms and the relative contributions of marine, biological, and subaerial processes which drive their evolution (see Stephenson and Finlayson, 2009, for a more detailed review of the contribution of the TMEM to rock coast research). The popularity of the TMEM stems from the ability to detect sub-millimetre changes over very short timescales (hours) as is the case with platform swelling and timescales comparative with the duration of many research projects (1–3 years), which are also considered representative of longer-term (decadal) measurements (Stephenson et al., 2010). Add to this the often cited low cost of construction and portability of the instrument, and its popularity among rock coast researchers is easily understood.
Moses et al. (2014) outlined some limitations associated with the TMEM that had been identified by previous research (e.g. Spate et al., 1985; Ellis, 1986; Andrews and Williams, 2000; Trenhaile, 2003; Foote et al., 2006; Swantesson et al., 2006). Authors studying erosion on (relatively soft) chalk platforms noted that the probe might cause erosion of the platform surface. This “probe erosion” was also noted early on by Spate (1985). However, this does not constitute a problem in which erosion rates are rapid (Foote et al., 2006; Swantesson et al., 2006). In addition, Moses et al. (2014) also pointed to previous research which showed that where rapid rates of erosion occur, this may result in the loosening or dislodgement of the bolts on which the TMEM is placed on annual (Ellis, 1986; Andrews, 2000) or decadal timescales (Stephenson and Kirk, 1996). Trenhaile (2003) noted that although the TMEM records small amounts of platform downwearing, it cannot record wave quarrying of larger blocks or loss of rock fragments due to frost riving.
Additional significant limitations have also been identified. For example, the location of a TMEM measurement station is limited to surfaces with low topographic complexity. This is an issue for shore platforms with highly variable mesoscale and macro-scale roughness and which only broadly conform to the Sunamura (1977) traditional Type A and Type B classification. Excluding these more complex platform morphologies significantly limits our ability to quantify rates and identify processes and styles of shore platform erosion across the complete spectrum of platform morphologies. Second, while decades of measuring micro-scale erosion using the TMEM have provided valuable insights into rates and processes of downwearing on shore platforms, there are difficulties associated with “upscaling” these field data to explain mesoscale and macro-scale landform development (Warke and McKinley, 2011). Stephenson and Naylor (2011) noted a tendency towards micro- and macro-scale studies of shore platform erosion. A recent study that reviewed 95 publications on shore platforms (Cullen and Bourke, 2018) also highlighted this concentration of micro- and macro-scale studies.
In comparison, mesoscale processes have received less attention, although research at this scale has increased significantly in the last 2 decades (Cullen and Bourke, 2018). Indeed, Stephenson et al. (2010) advocated the introduction of new techniques which capture the full range of scales of erosion on shore platforms. SfM photogrammetry is one such technique that has this potential.
1.2 Structure from motion photogrammetry
Significant developments in digital photogrammetry techniques over the last decade have revolutionized the collection of 3-D topographic data in the geosciences. Traditional photogrammetry requires a knowledge of the 3-D location and orientation of the camera and accurate 3-D information on control points in the scene of interest. While methods which allow for the accurate calibration of non-metric cameras and reliable automation of the photogrammetric process have enhanced the use of photogrammetry in the geosciences (e.g. Chandler, 1999; Chandler et al., 2002; Carbonneau et al., 2004), it still requires expert understanding and practice (Carrivick et al., 2016). In the last decade, there have been significant workflow advancements which have dramatically reduced the expertise required. Structure from motion (SfM) photogrammetry uses a standard camera for collecting image data on a 3-D landform.
Multiple overlapping images are taken from different spatial positions and used to reconstruct the 3-D geometry of the target. Unlike traditional photogrammetry, the SfM workflow does not require prior knowledge of the 3-D location, the camera orientation, or 3-D information on control points before the reconstruction of scene geometry. Rather, scale-invariant feature detection (SIFT) (Lowe, 2004) is used to match points between images, and a least square bundle adjustment algorithm is used to align images and produce a “sparse” point cloud representing the most prominent features in the images. A further development utilizes multi-view stereo (SfM-MVS) algorithms (e.g. Furukawa et al., 2010) to intensify the sparse cloud and merge the resulting 3-D point cloud into a single dense point-based model. This can then be used to generate a high-resolution orthophoto, mesh, or digital elevation model (DEM). Successive point clouds and DEMs of the same location or feature can be analysed utilizing widely available GIS software (e.g. ESRI ArcGIS desktop or QGIS) and other programmes (e.g. CloudCompare) used for geomorphic change detection to quantify erosion and deposition. A large amount of literature has been published on SfM, and the reader is referred to Walkden and Hall (2005), Westoby et al. (2012), Fonstad et al. (2013), Thoeni et al. (2014), Micheletti et al. (2015a, b), Carrivick et al. (2016), Smith et al. (2016), Özyeşil et al. (2017), and Verma and Bourke (2018) for more detailed discussions of SfM techniques and workflows.
The SfM-MVS workflow has been widely applied in the geosciences at varying scales of resolution from small-scale (mm to cm) studies of soil erosion to morphodynamic studies of beaches, coastal cliffs, and braided rivers (e.g. Lim et al., 2010; Javernick et al., 2014; Kaiser et al., 2014; Brunier et al., 2016a, b; Balaguer-Puig et al., 2017). SfM-MVS offers several advantages over traditional surveying techniques, specifically its relatively low cost and portability of required equipment, i.e. a camera, compared to that of TLS. In addition, the availability of free and relatively low-cost commercial software, a semi-automated workflow, and the decreasing cost of high-end desktop computers have resulted in the increasing application of this method in geomorphological research. While SfM-MVS offers significant advantages at a range of scales, it is worth noting that the scale of some processes operating on shore platforms, for example platform swelling, operates at a resolution currently not obtainable using SfM-MVS, and other tried and tested approaches (i.e. the TMEM) remain the most suitable method of measurement.
It is worth noting that the accuracy and resolution of SfM-MVS-derived DEMs rely heavily on the quality of the images used and the accuracy of the coordinate reference system. For work on shore platforms, the accuracy of the DEM is limited by the accuracy of the ground control points (GCPs) used. These are often determined using a differential GPS (dGPS) or total stations which have reported accuracies of centimetres and millimetres, respectively. However, a number of rock breakdown processes such as granular disintegration (Viles, 2001) and features such as weathering pits (Viles, 2001; Bourke et al., 2007; Thornbush, 2012) occur at centimetre to sub-millimetre scale.
Our work has three foci: the first is to test the SfM-MVS for measuring micro-scale erosion on shore platforms. The second is to determine the potential of SfM-MVS for mesoscale geomorphic change detection. The third is to provide a robust assessment and comparison of the two methods (TMEM and SfM-MVS) for measuring erosion on shore platforms. Key to our approach is to adapt the local coordinate reference system (CRS) and SfM-MVS workflow developed by Verma and Bourke (2018). Their system was developed to generate sub-millimetre-scale DEMs of rock surfaces (< 10 m2) in difficult to access terrains (e.g. cliffs and steep-sided impact crater walls). Their method can produce high-resolution (sub-millimetre) DEMs with sub-millimetre accuracy. We advance this work through the design and manufacture of a field-hardy coordinate reference system (CRS) which can be quickly deployed repeatedly at the same site. Our approach will enable the application of SfM-MVS for geomorphic change detection on shore platforms at both the micro-scale and mesoscale.
In this paper, we present the results of a series of experiments on simulated platform surfaces using our newly developed CRS.
2.1 A manufactured coordinate reference system for SfM-MVS
We have adapted the local coordinate reference system of Verma and Bourke (2018), which utilizes a precisely measured equilateral triangle with a coded marker (downloaded from Agisoft Photoscan) attached at each vertex (Fig. 1a and b). The x, y, and z coordinates of each coded marker are calculated using trigonometry and serve as the GCPs for generating the DEMs in the SfM-MVS workflow. When used for a small surface area (≤6.76 m2), this method has proven to produce high-resolution (0.5 mm per pixel) DEMs with sub-millimetre accuracy (Verma and Bourke, 2018).
We mounted the coded markers onto a specifically designed stainless-steel platform (Fig. 1a and b) based on the design of Verma and Bourke (2018). The platform consists of a 15 cm equilateral triangle with three square steel plates (4 cm × 4 cm × 0.5 cm) and a specially machined leg. Each plate is engineered so that the centre of a plate is fixed precisely (±0.01 mm) on one vertex of the triangular base. The centre of each plate is also permanently marked during manufacture to aid the application of coded markers. The base of the leg is machined to fit a stainless-steel square-headed bolt to a depth of 1.5 cm and is fixed at the centre of gravity on the underside of the triangular base plate.
In the field, the square-headed bolt is fixed to the platform by drilling a hole and fixing the bolt with marine-grade epoxy resin using a digital inclinometer to make sure the bolt head is level. This is similar to the approach used to install TMEM stations. When mounted onto the bolt, this design secures the base plate with the coordinate system in place with a high degree of relocation precision (see Sect. 3.2). This permits repeated measurements and the georeferencing of DEMs for high-resolution change detection at field sites.
2.2 The experiments
The experiments were designed to capture different scales of erosion from the granular-scale (sub-millimetre) abrasion of the platform surface to the removal of rock fragments (mm to cm). The accuracy of the SfM-MVS-generated DEMs used to calculate DEMs of difference (DoDs) for geomorphic change detection was assessed by means of horizontal and vertical checkpoints. We also investigated the influence of surface roughness on the accuracy of the DEMs and resultant DoDs.
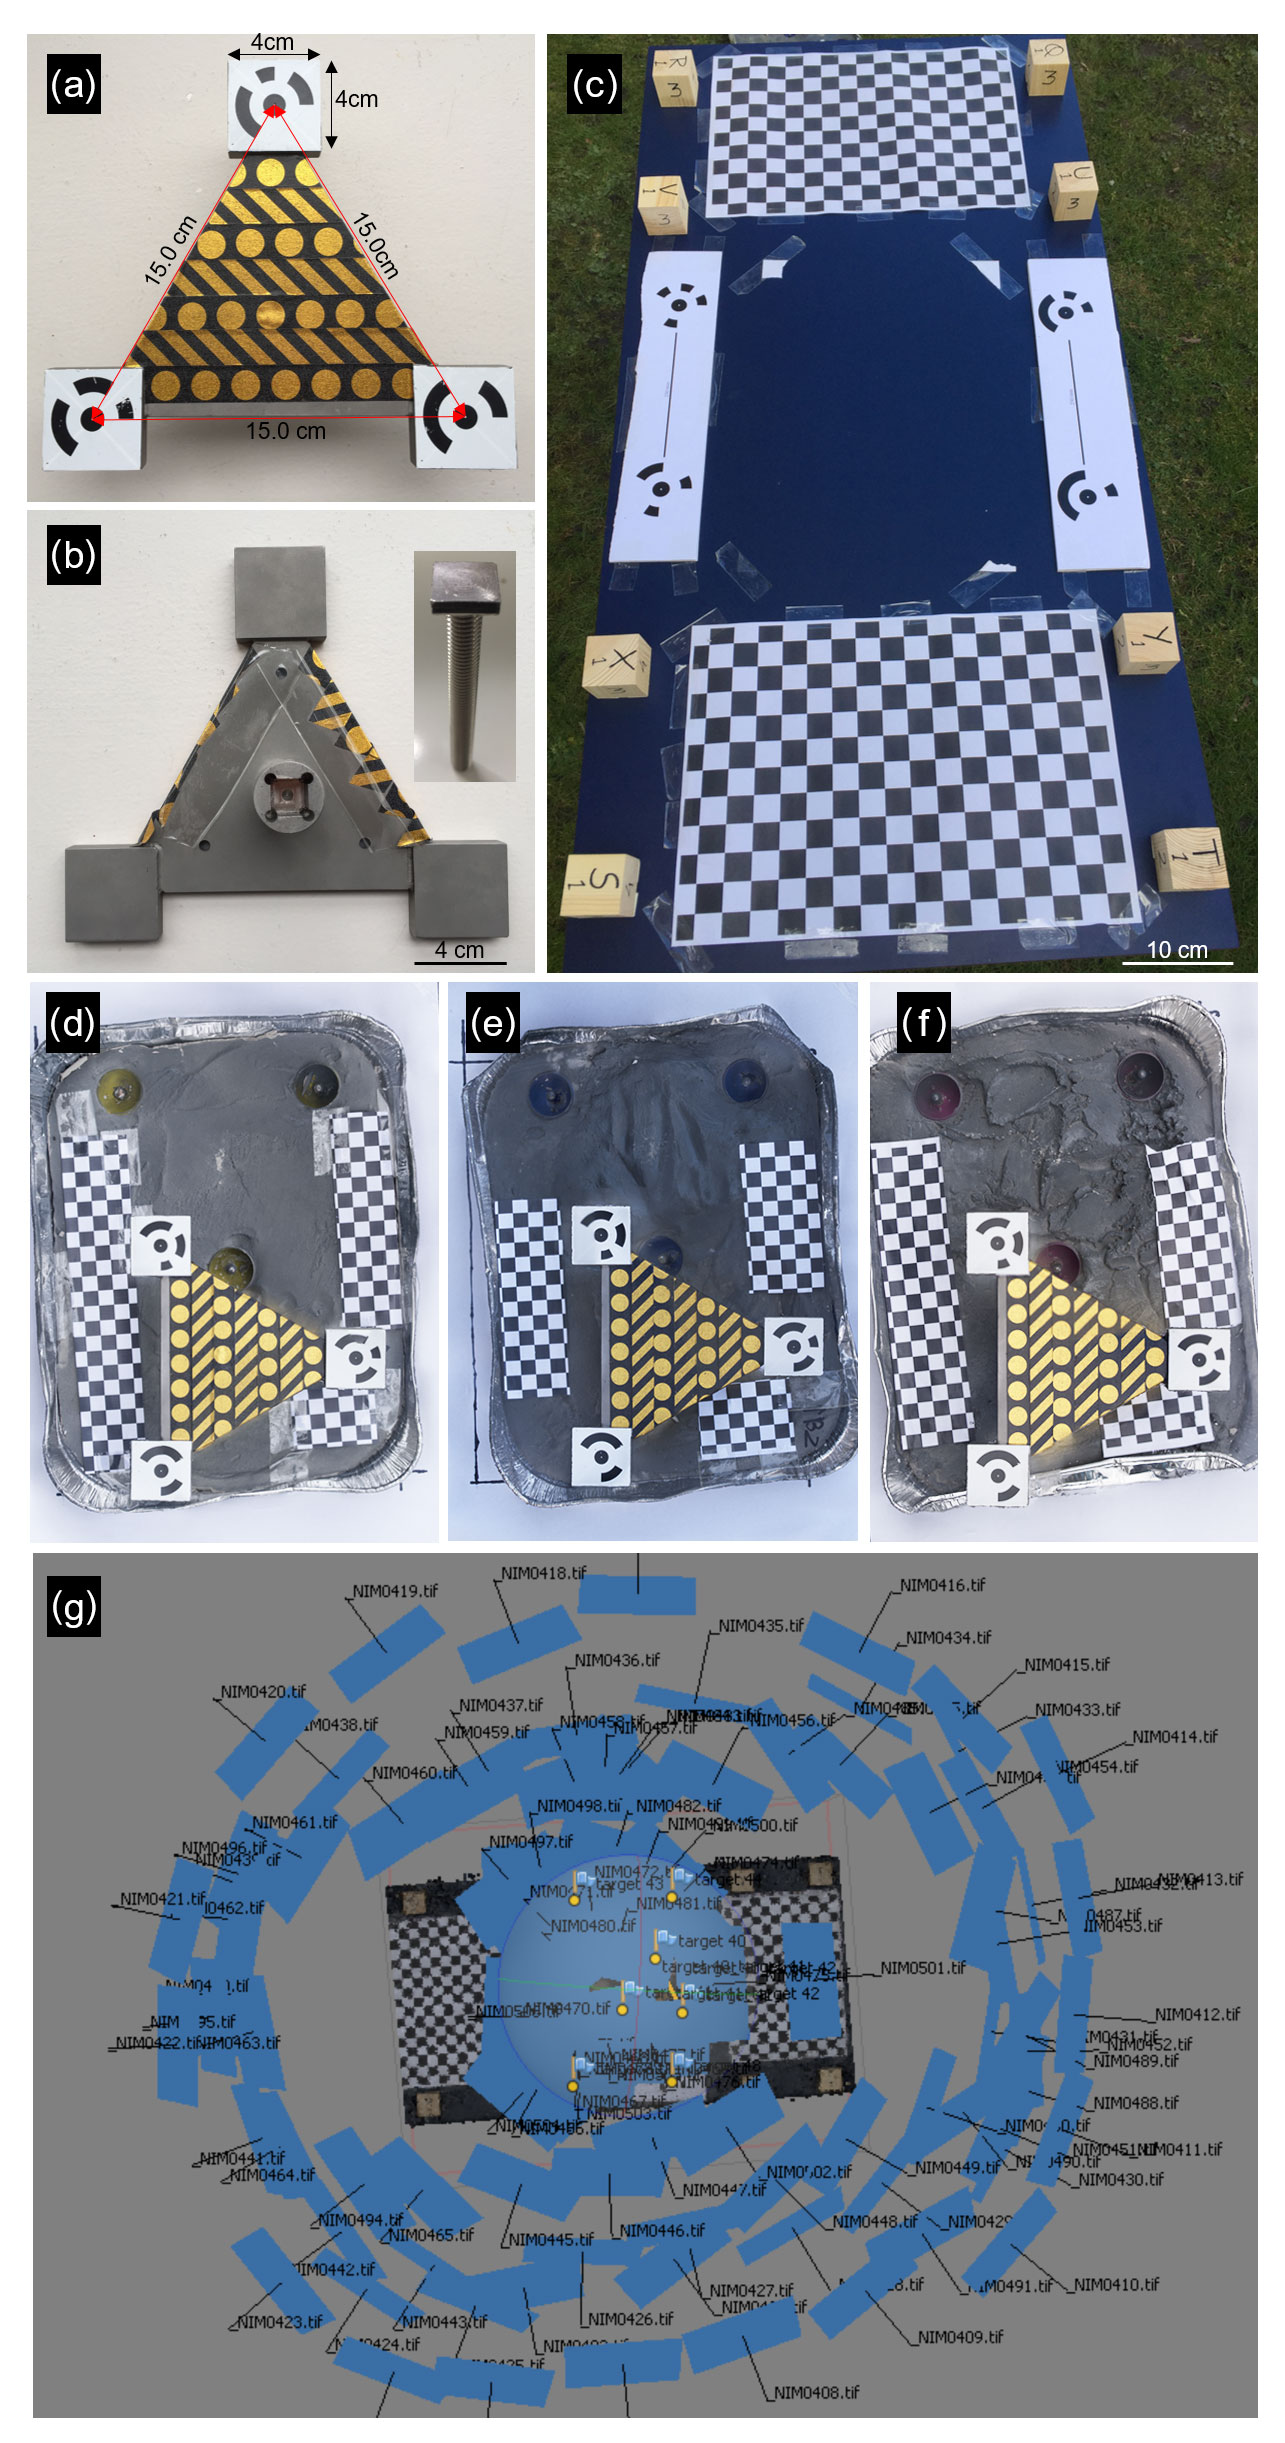
Figure 1The experimental set-up. (a) The CRS top view with scale shown and (b) underside with the square-headed bolt (inset). (c) The experimental platform with markers and wooden blocks used to calculate the horizontal and vertical error. (d, e, f) The simulated platform and (g) example of the camera positions for image acquisition.
The experiment was set up outdoors on a level table (1.2 m × 0.6 m). Two scaled coded markers (0.25 m) and a series of 2.5 cm × 2.5 cm and 1 cm × 1 cm checker-board pattern, non-coded markers and eight, evenly spaced wooden blocks of known dimensions were fixed onto the table surface (Fig. 1c). These were used to calculate the horizontal and vertical error of the DEMs (as recommended by Verma and Bourke, 2018). Four simulated platform surface blocks were constructed using moulds and gypsum plaster. Stainless-steel, square-headed bolts for mounting the CRS, as described above, were installed on each block. A digital inclinometer (Examobile Bubble Level for iPhone) was used to ensure the surface of the bolt was level. The surface of the experimental blocks was constructed to represent a range of micro-scale (< mm mm) to mesoscale (> mm cm) roughness that is observed in the field. These include low (B1), medium (B2), and high (B2) relative surface roughness (Fig. 1d–f). All blocks were sprayed with matte grey paint to allow for easy identification of “erosion” areas and provide additional visual validation of the models. A set of three 1 cm × 1 cm checker-board non-coded markers was fixed to each experimental block to serve as additional checkpoints for horizontal error. One block (B-Con) was used as a control. The remaining three blocks (B1, B2, and B3) were used to carry out the experiment. Each block was placed at the centre of the table when acquiring images.
2.3 Data collection
In order to replicate field conditions as closely as possible, all images of the experimental blocks were acquired outdoors during a single day. The CRS was placed on the pre-installed square-headed bolt (Stig Fasteners, SQHM8x75), and orientation was noted. We used a Nikon D5500 with a variable zoom lens set up at 24 mm focal length on a tripod to reduce effects of handshake. Approximately 100 images of each block were obtained. This number of images was required to capture the full extent of the table with the non-coded markers and the wooden blocks used for the error analysis. We expected that 40–50 images would be sufficient to generate a high-resolution DEM for a smaller area (e.g. < 0.5 m2) in the field. In this study, ∼70 images were acquired at a distance of ∼1 m from the experimental blocks with the camera mounted on a tripod to reduce the effect of handshake on image quality and then a series (25–30 images) of close-range shots at < 0.5 m (Fig. 1). All three experimental blocks and the control block were imaged on the table prior to simulating erosion on the blocks.
Recent work has demonstrated the potential efficacy of smaller-scale physical erosion processes (e.g. abrasion, scratching, percussion impact) on high-energy Atlantic shore platforms (Cullen and Bourke, 2018). However, accurate quantification of these features has not been possible. We therefore tested simulations of three known types of erosion. (1) Sweeping abrasion was simulated by gently abrading the surface of all three blocks with medium-grit sandpaper to variable depths up to approximately 1 mm. (2) Scratches were simulated using a screwdriver. (3) Impact percussion marks were simulated on one block using a hammer and chisel.
The CRS was removed and replaced between each stage of data collection, as would be practical for carrying out repeat surveys in the field. Images of the blocks were taken following simulated erosion as outlined above.
2.4 Repeatability
The utility of this approach for micro-scale change detection using the CRS developed for this study is contingent on the exact replacement of the CRS during successive surveys in the field. To test the repeatability of this approach, we used a control block to acquire images for DEM generation using the data collection and processing procedure outlined above. At the end of the experiment, the CRS was replaced and the second series of images was acquired for DEM generation for comparison. DEM accuracy and error propagation were calculated as described below.
2.5 Data processing
2.5.1 Digital elevation models
All the images were acquired in the raw format during the experiment. Raw images were converted to 14 bit uncompressed tiff format with AdobeRGB colour space in Adobe Lightroom. We used Agisoft Photoscan (version 1.4.1). Image quality (Q) was assessed using the Estimate Image Quality tool in Agisoft and images with Q values < 0.5 were removed. The CRS was used to scale and georeference the model. Baseline DEMs and orthophoto mosaics for each block were generated and exported at the highest common pixel resolution (0.3 mm pixel−1) and common pixel coordinates.
2.5.2 DEMs of difference
DEMs were exported in ArcMap, and a polygon shapefile was drawn over the area of interest for each block. The area of interest, i.e. the erosion area of the simulated platform surface, was extracted for analysis using the Extract by Mask tool in Spatial Analyst tools. DoDs were generated using the Raster Math tool (minus) in ArcMap (version 10.5) using Eq. (1):
where the subscript refers to the experimental stage.
2.5.3 Rugosity
To permit evaluation of the impact of different degrees of surface roughness on the accuracy and reliability of our generated DEMs, a rugosity index for each block was calculated in ArcMap using the standard surface area ratio method (Risk, 1972; Dahl, 1973):
A rugosity index (RI) of 1 indicates a planar surface, while increasingly higher values indicate increasingly “rougher” surfaces. The contoured area for each block was calculated using the relevant baseline DEM. A TIN surface was generated using the Raster to TIN tool in ArcMap. The contoured surface area for the specified region was calculated using the Polygon Volume tool in ArcMap. The planar surface area of the same region was derived using the Calculate Geometry tool assuming negligible change in slope over the specified area. The RI was calculated using Eq. (2).
2.5.4 DEM accuracy and error propagation
The coded and non-coded markers fixed to the table were used as checkpoints to determine the horizontal (XY) error of the DEMs produced using the CRS developed by Verma and Bourke (2018). For each DEM, the model and its respective orthophoto were imported into ArcMap (version 10.5) and the distance between 30 randomly selected checkpoints and the two coded scale bars (Fig. 1) was measured using the measurement tool. The horizontal error was calculated as the root mean square error (RMSE) of the difference between the measured length and known length.
To determine the vertical accuracy of the DEMs, eight wooden blocks were used as checkpoints (Fig. 1). The DEMs and orthophotos were imported in ArcMap with which the height of wooden blocks were measured using the Interpolate Line tool by drawing a line across one of the sides of the wooden block and extending it to the table surface. We ensured that the line drawn was straight. Height was estimated as the difference in mean elevation between the wooden block top surface and the surrounding table surface on each side. The actual height of wooden blocks was measured by an electronic digital Vernier caliper. The Vernier caliper has an accuracy of 0.03 mm and measurement repeatability of 0.01 mm. We obtained five measurements along the same side of the wooden block measured in ArcMap. We used the mean of these five measurements to calculate the height of the wooden block. The actual height was subtracted from the estimated DEM height to calculate the vertical error.
The calculation of a DoD can result in the propagation of error associated with the DEMs used in the computation process. As such, an error analysis is required to increase confidence in the DoD results. This is particularly important when the scale of geomorphic change being detected is of similar magnitude to uncertainties of the DEMs used in the DoD calculation.
We determined the minimum level of detection as the most suitable method of error analysis for this study as the development of shore platforms is primarily an erosional process; as such, the spatial coherence of erosion and deposition (Wheaton et al., 2010) is unsuitable as a method for error analysis in this study. Additionally, while probabilistic approaches produce reliable estimates of morphological change (e.g. Brasington et al., 2000, 2003; Lane et al., 2003), small changes in elevation, such as those measured in this experiment, may be disguised as noise (Williams, 2012). The minimum level of detection (LoD) uses the quadratic composition of errors in the original DEMs to estimate the propagated error of the calculated DoD (Brasington et al., 2003; Lane et al., 2003; Wheaton et al., 2010; Williams, 2012; Gómez-Gutiérrez et al., 2014):
where EDoD1–2 refers to the LoD calculated as the square root of the combined squared errors of the DEMs used to generate the DoD. If values of EDEM1 and EDEM2 are known, this method can be applied at a global or local scale at which the spatial variability of the error terms is known (Lane et al., 2003). We applied Eq. (3) to determine the minimum threshold of detection for each DEM (Williams, 2012) for each stage of the experiment. Changes detected that fall within the limits of detection (+LODmin or – LODmin) calculated using Eq. (1) are considered noise and interpreted as no change.
3.1 Accuracy and error propagation
DEM generation resulted in a maximum and minimum horizontal (XY) RMSE of 0.23 and 0.03 mm, respectively. Maximum vertical (Z) RMSE was 0.52 mm with a minimum of 0.23 mm. The minimum limit of detection was calculated at 0±0.27 mm, while the maximum LoD was 0±0.71 mm.
Table 1The horizontal (XY) and vertical (Z) RMSE for the control block (B-Con) and the experimental blocks B1, B2, and B3. LoD for each DoD is also shown. n/a – not applicable.
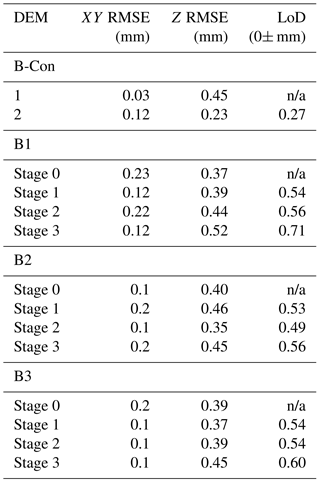
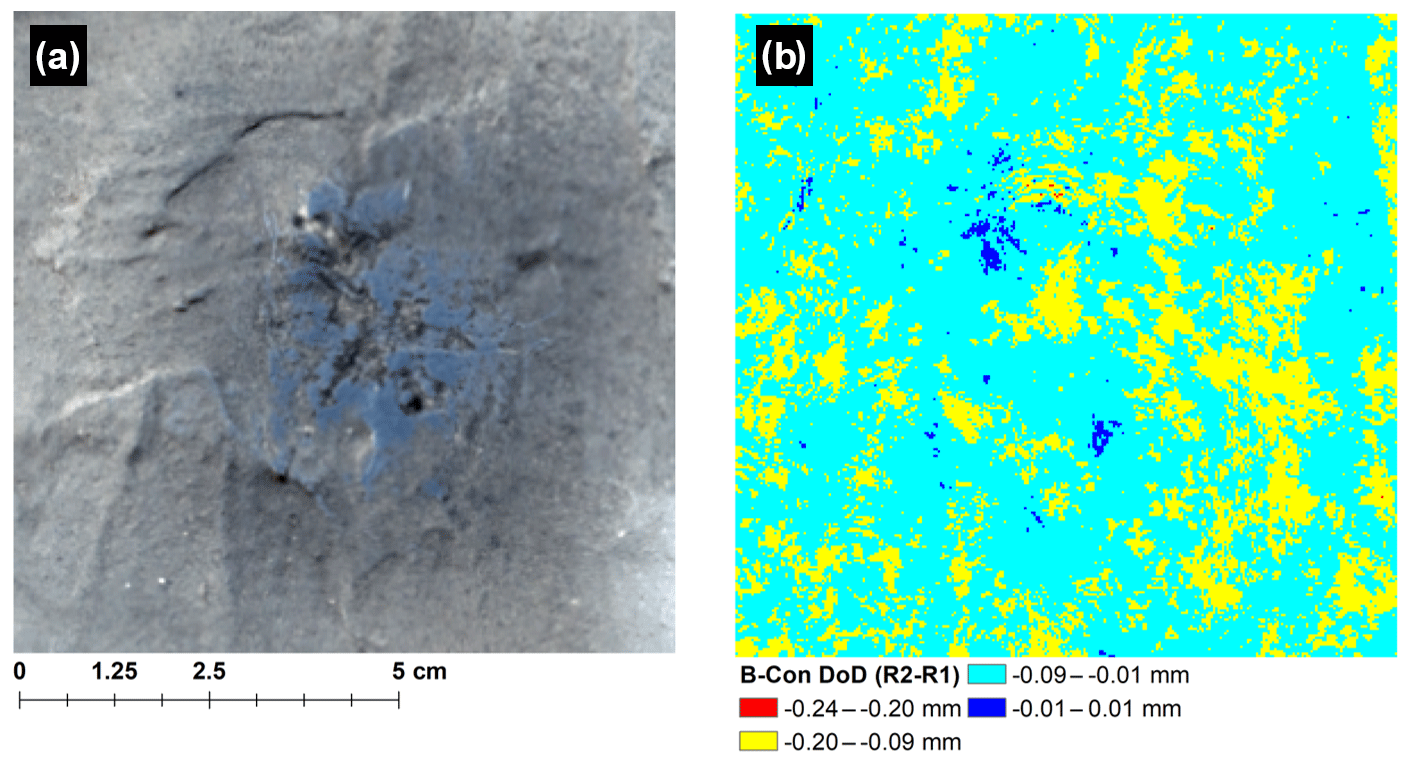
Figure 2(a) The control block (B-Con) orthophoto and (b) DoD showing a change in surface elevation between successive DEMs. Note that detected change is within the calculated LoD (±0.27 mm).
3.2 Repeatability
The change in vertical elevation for the control block calculated from the DoD is shown in Fig. 2 below. The maximum change in elevation (−0.29 mm) is within the LoD and is interpreted as no change.
3.3 Rugosity
The RI calculated for each block is shown in Table 2. The control block (B-Con) had the lowest rugosity (planar surface), while B1 had a very low RI followed by B2 and B3 in order of increasing rugosity.
Table 2Contoured surface area (SA), planar surface area, and rugosity index (RI) for each of the experimental blocks.
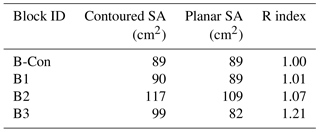
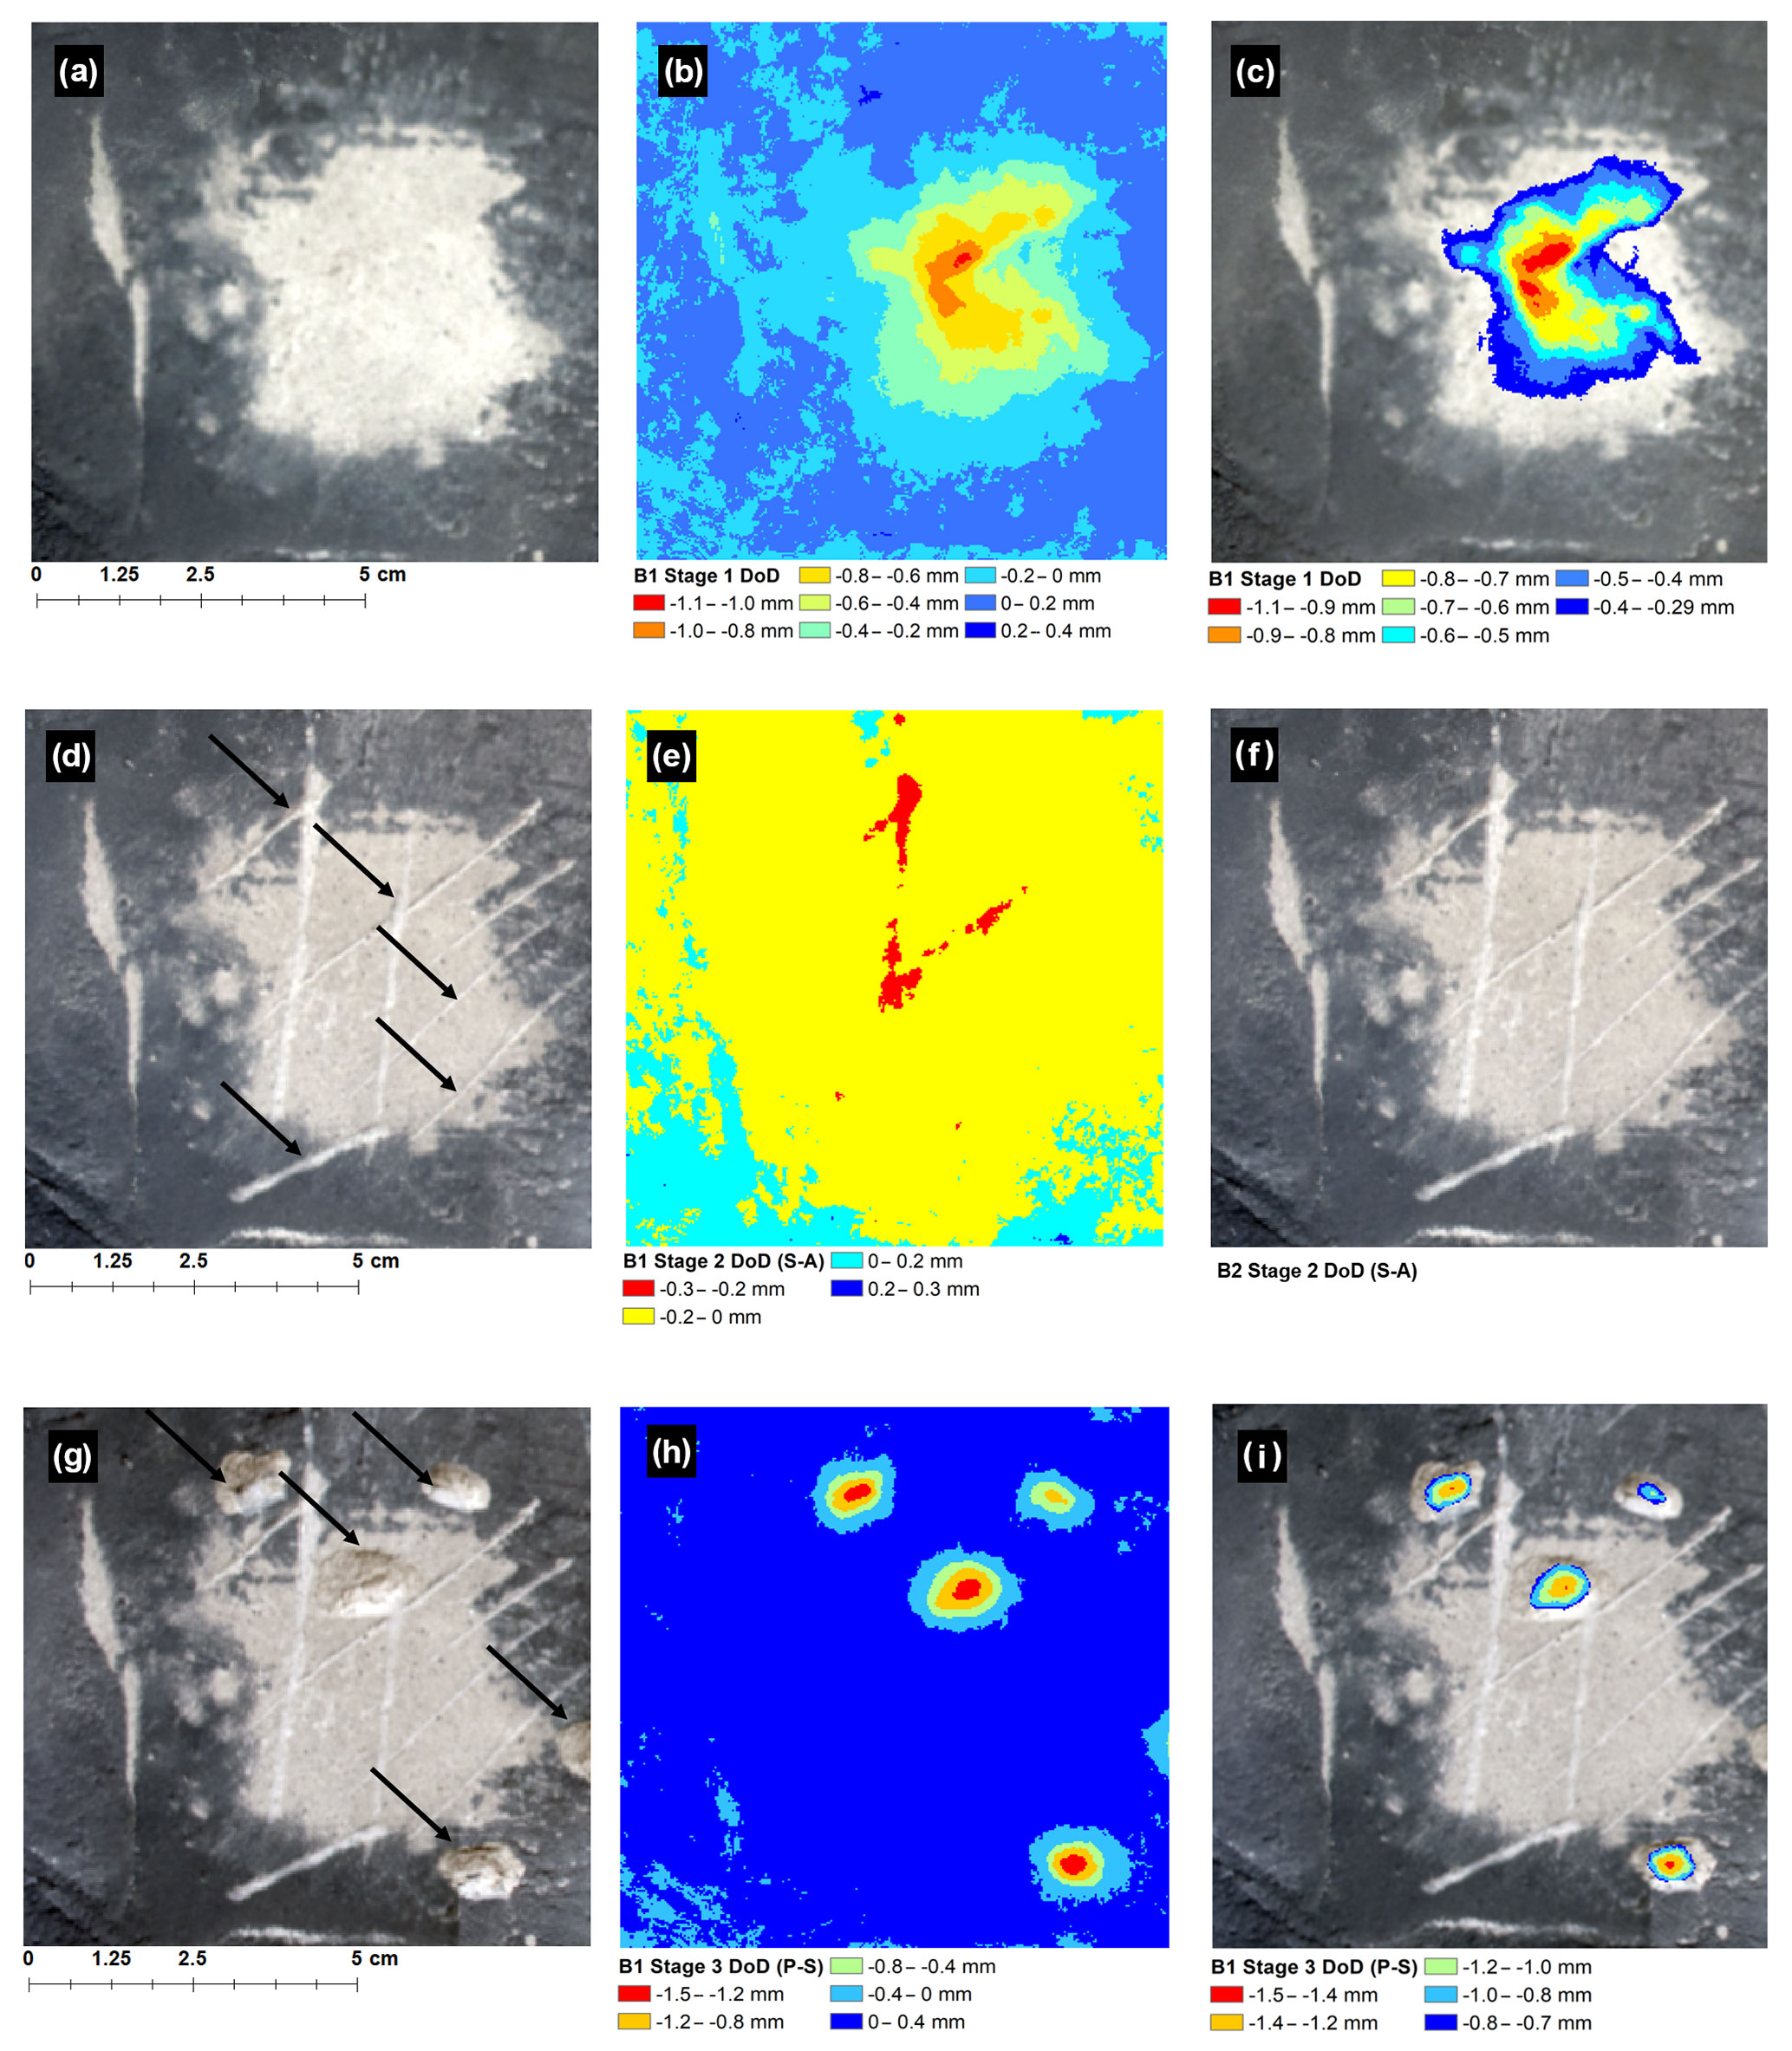
Figure 3(a) B1 Stage 1 orthophoto showing abraded surface of simulated platform surface (light grey). (b) DoD for B1 Stage 1 before thresholding at LoD and the thresholded DoD (c). (d) B1 Stage 2 orthophoto showing the location of scratches, (e) B1 Stage 2 DoD before thresholding, and (f) the DoD shown in (e) thresholded at LoD. (g) B1 Stage 3 orthophoto showing locations of percussions. (h) B1 Stage 2 DoD before thresholding at the LoD and the thresholded DoD (i).
3.3.1 Very low rugosity platform: B1
The results for experimental block B1 are shown in Fig. 3a–i. The surface area of B1 used in the analysis is shown in panel (a) in which light grey indicates the area of abrasion. For B1 abrasion, a maximum negative surface change of 1.06 mm was detected, while an increase of 0.30 mm was observed (b) before the LoD was applied. The area of negative surface change between 0.1 mm and 1.06 mm corresponds to the actual area abraded. After thresholding at the LoD, the area of change detected is significantly lower (less than half) than the area where the actual change occurred. No increase in surface elevation was detected. For B1 scratches, the scratched surface is shown in panel (d) (black arrows). Before thresholding, the maximum negative change on the surface of B2 was 0.35 mm, while an increase in surface elevation of 0.26 mm was detected. Negative changes corresponded well to the observed locations of scratches. After thresholding at the LoD, no changes were detected on the block surface (f). For B1 impact percussions, the locations where block fragments were removed are shown in panel (g) (black arrows). Maximum negative change detected, i.e. the predicted depth of percussions, was 1.49 mm, while a positive change in surface elevation of 0.30 mm was detected before thresholding (h). After thresholding, no positive change in surface elevation was detected and predicted negative change corresponded well to the actual location of percussions (i).
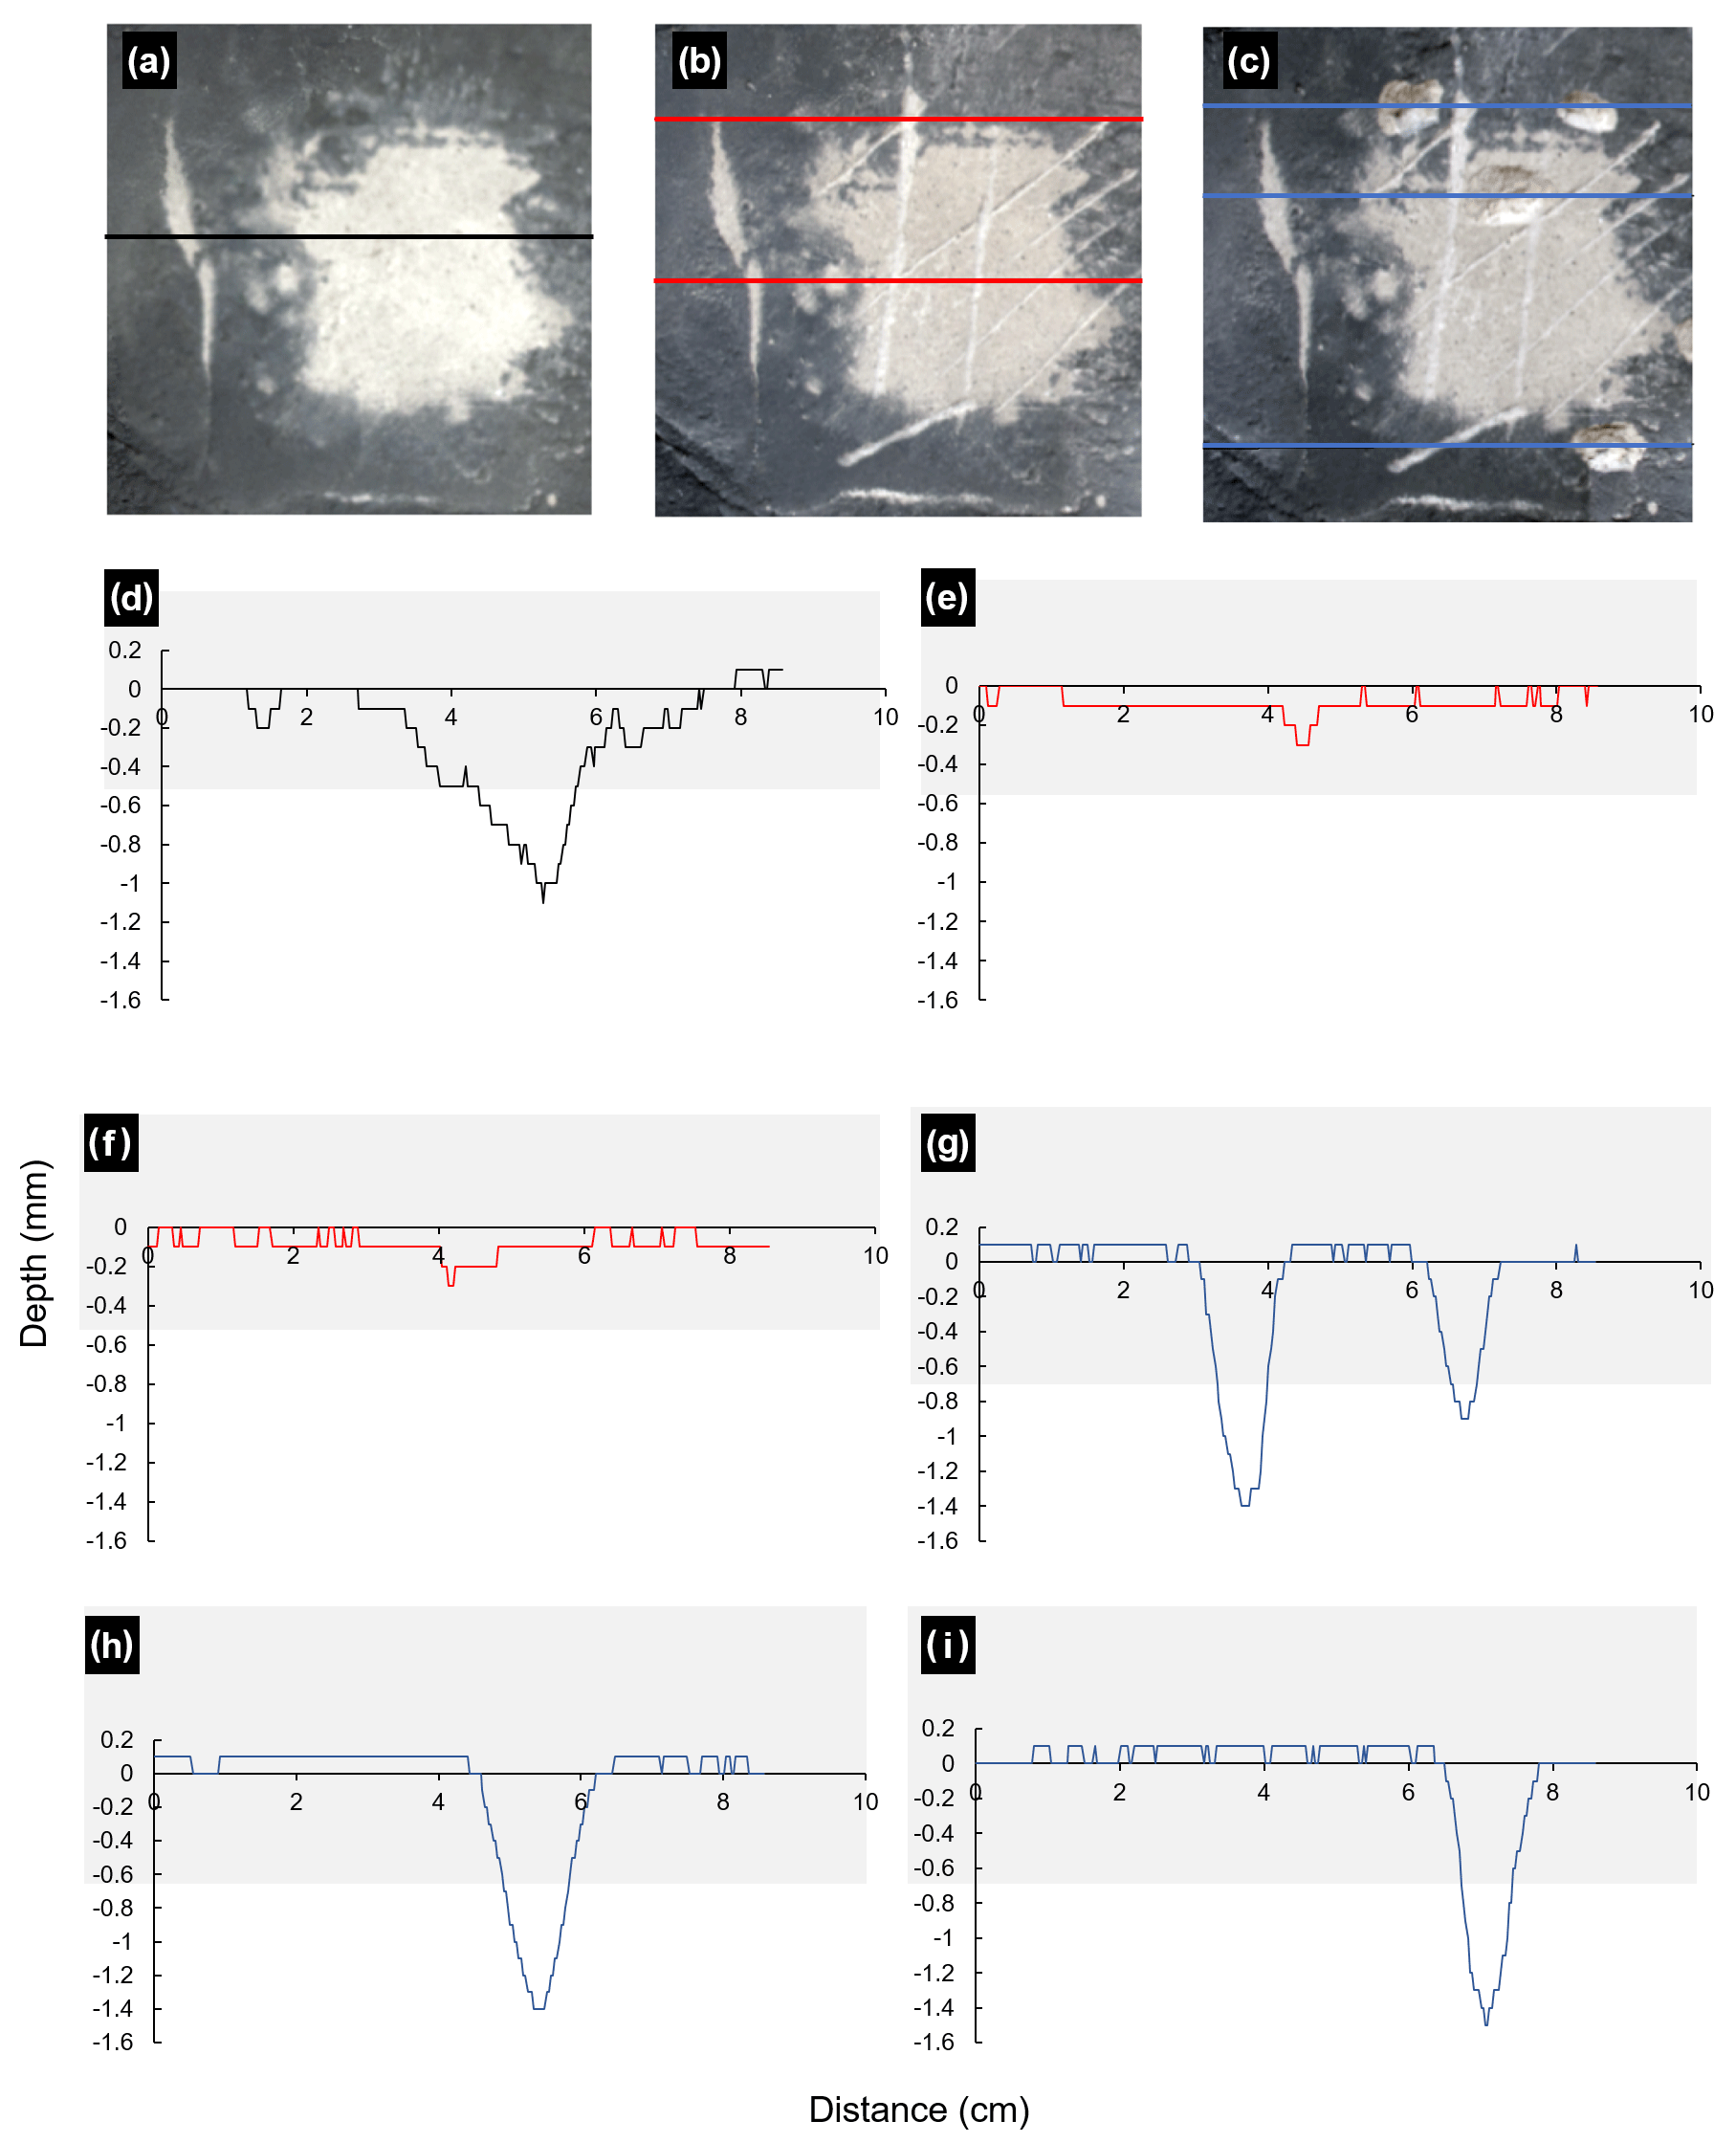
Figure 4Location and topographic profiles of “erosion” features on the simulated platform surface of B1 for (a) Stage 1 (profile shown in d), (b) Stage 2 (e and f, top and bottom respectively shown in b), and (c) Stage 3 (g, h, and i, top, middle, and bottom profiles respectively shown in b). Grey shaded areas in (d)–(i) show the LoD.
To summarize, for a simulated platform with a very low RI, sweeping abrasion and chips were reliably detected in the thresholded DoD. Scratch depths were less than the LoD and as such were not detected in the thresholded model.
The topographic profiles of erosion features on B1 for Stages 1, 2, and 3 are shown in Fig. 4. The profiles show the geometry (i.e. max depth and width) of erosion features on B1, which are similar in scale for all experimental blocks.
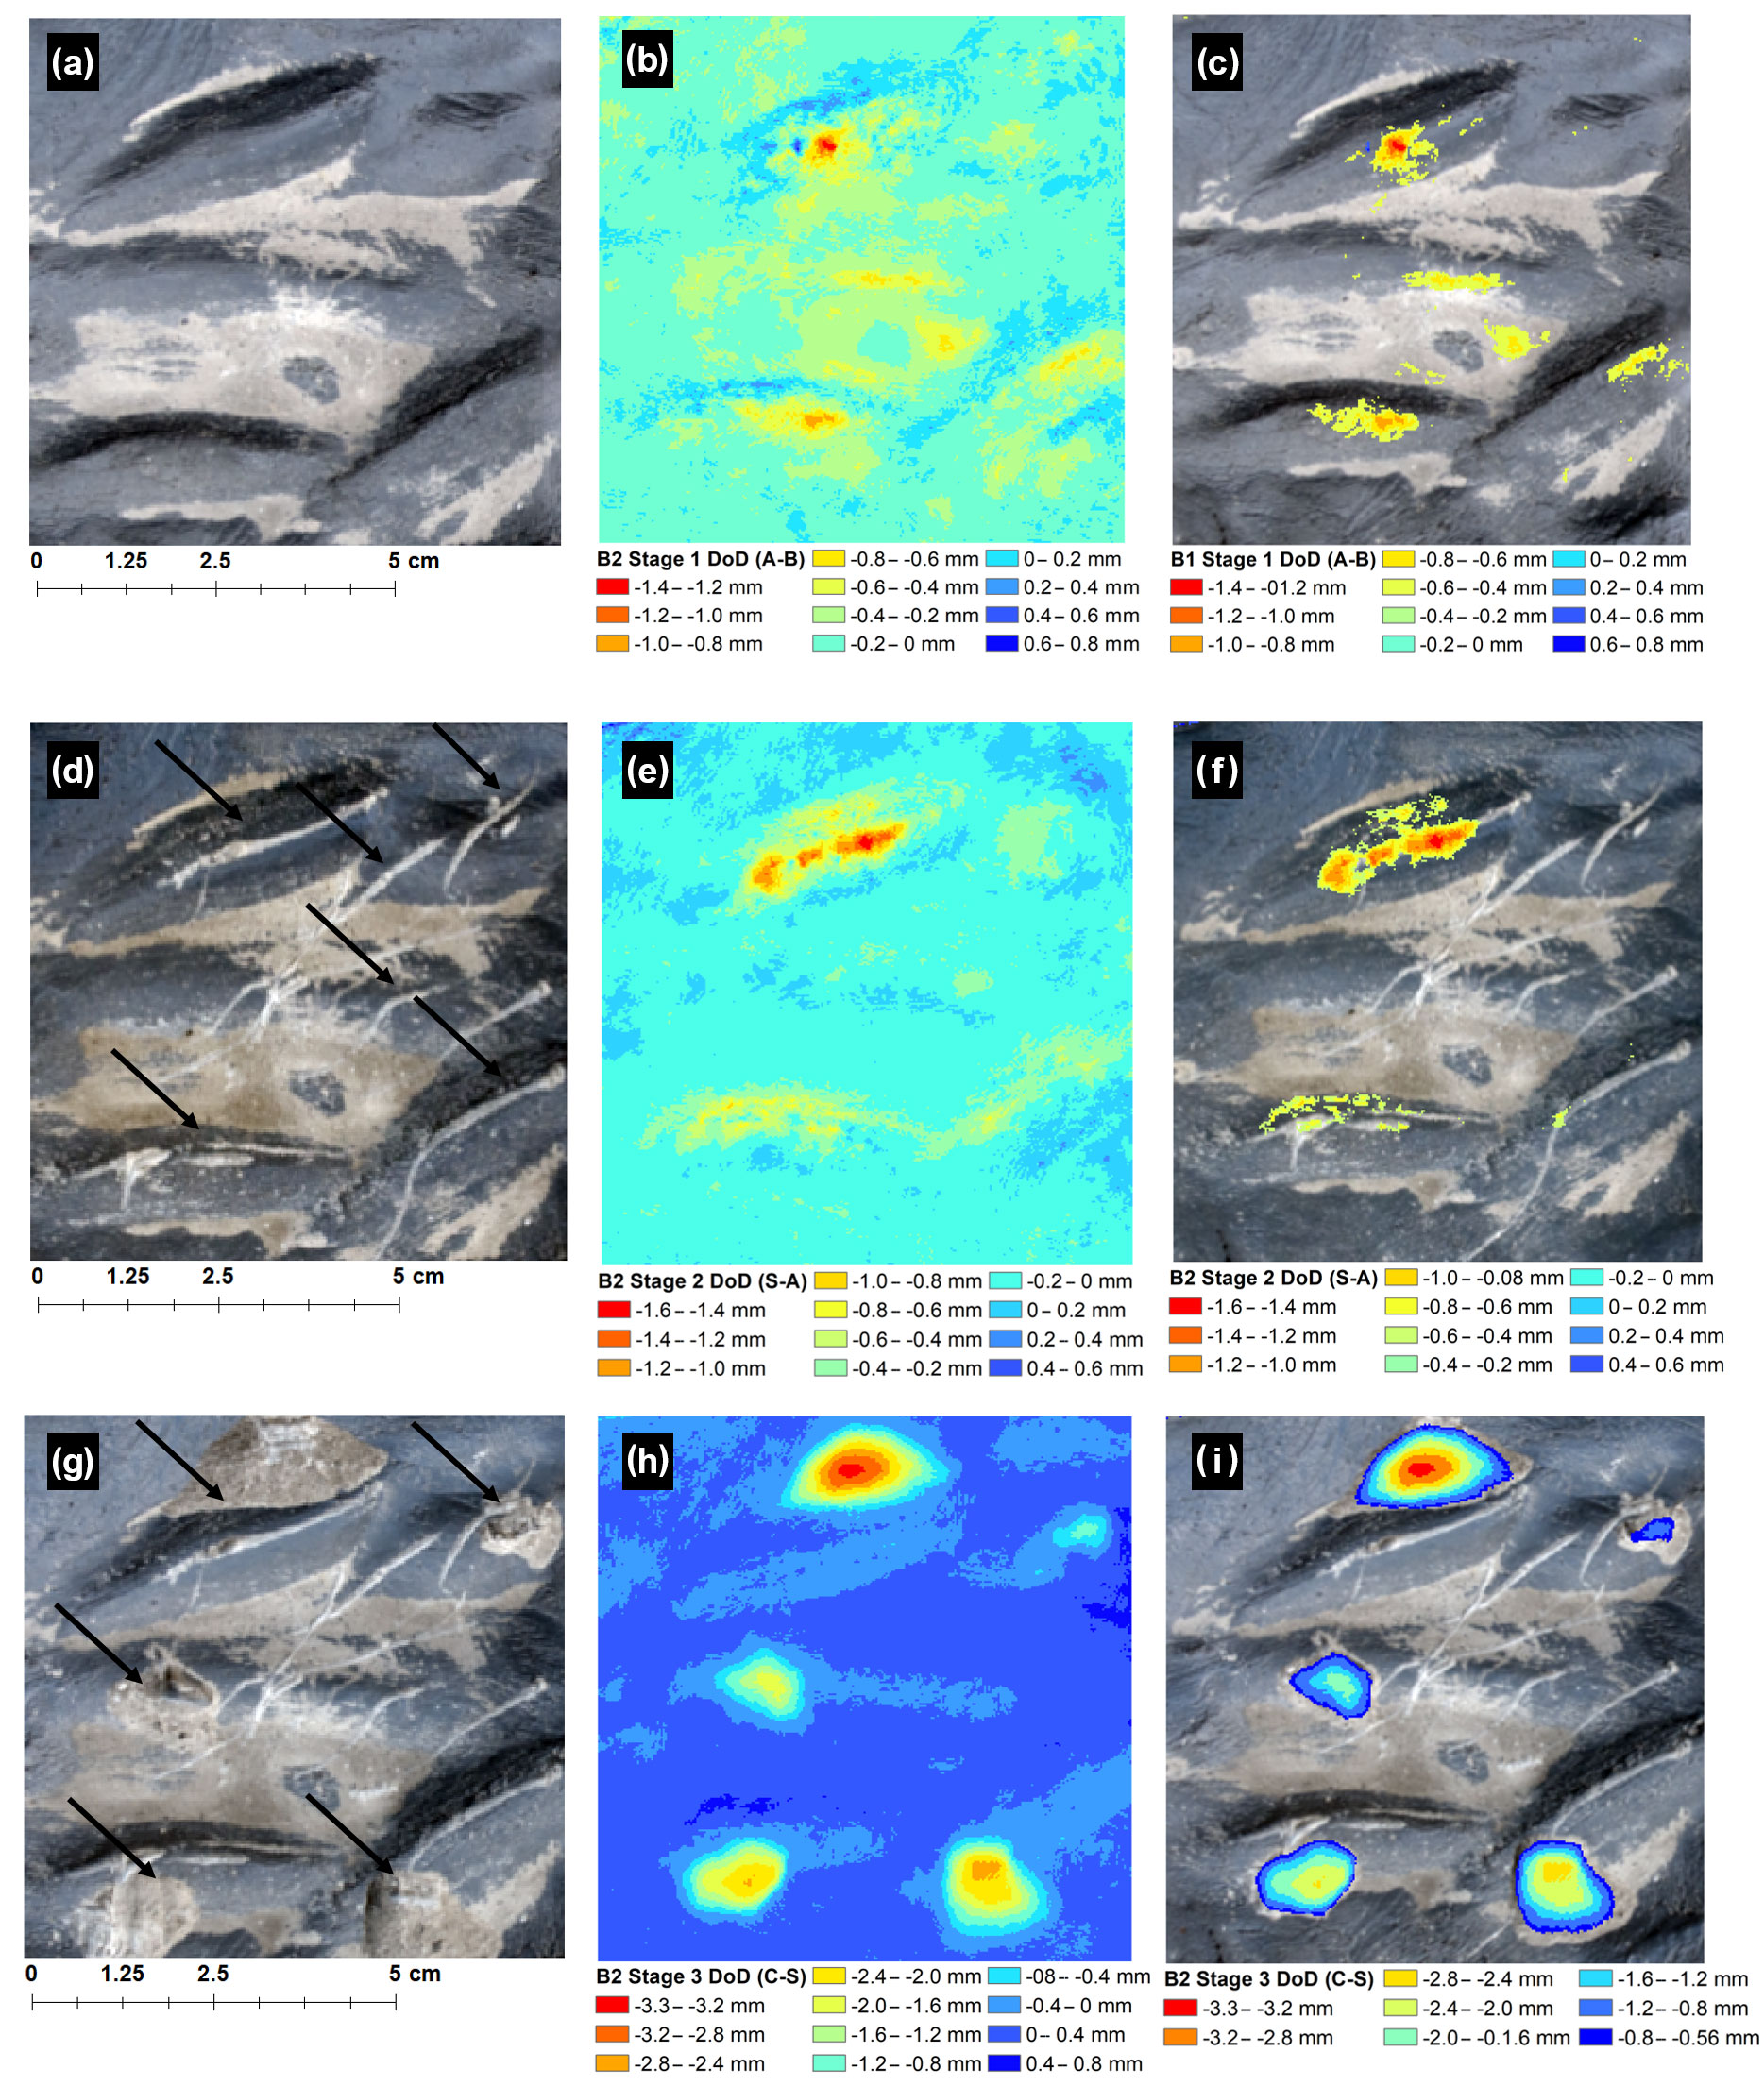
Figure 5(a) B2 Stage 1 orthophoto showing abraded area (light grey) of simulated platform surface, (b) B2 Stage 1 DoD before thresholding at LoD, and the thresholded DoD (c). (d) B2 Stage 2 orthophoto showing scratched surface of B2 (black arrows). (e) B2 Stage 2 DoD before thresholding and (f) DoD shown in (e) thresholded at LoD. Note change detected in shadow zones in (f) where none is expected. (g) B2 Stage 3 orthophoto percussed surface. (h) DoD before thresholding at LoD and (i) DoD thresholded using calculated LoD.
3.3.2 Moderate rugosity platform (B2)
The results for experimental block B2 are shown in Fig. 5a–i. The abraded surface area is indicated by lighter-toned areas in Fig. 5a. While this abrasion is visible in the DoD (Fig. 5b), a significant component of the detected change occurred where no change was expected. This corresponds to “shadow zones” associated with topographic highs. This result was not affected by thresholding at the LoD (Fig. 5c).
Scratches are evident in Fig. 5d. Furthermore, the location of negative change corresponds well to the location of scratches (Fig. 5e). However, similar to B1, a small area of change is detected around the deepest scratch where none is expected (Fig. 5f). The impact percussion features are shown in Fig. 5g. The maximum negative change in the surface elevation detected (i.e. the depth of percussions) was 3.35 mm, while the maximum positive change was 0.57 mm (h). Following thresholding, no positive change in elevation was detected (Fig. 5i) and negative change corresponded well to the actual location of percussions.
To summarize, for a simulated platform with a moderate RI, only scratches and impacts were detected in the thresholded DoD.
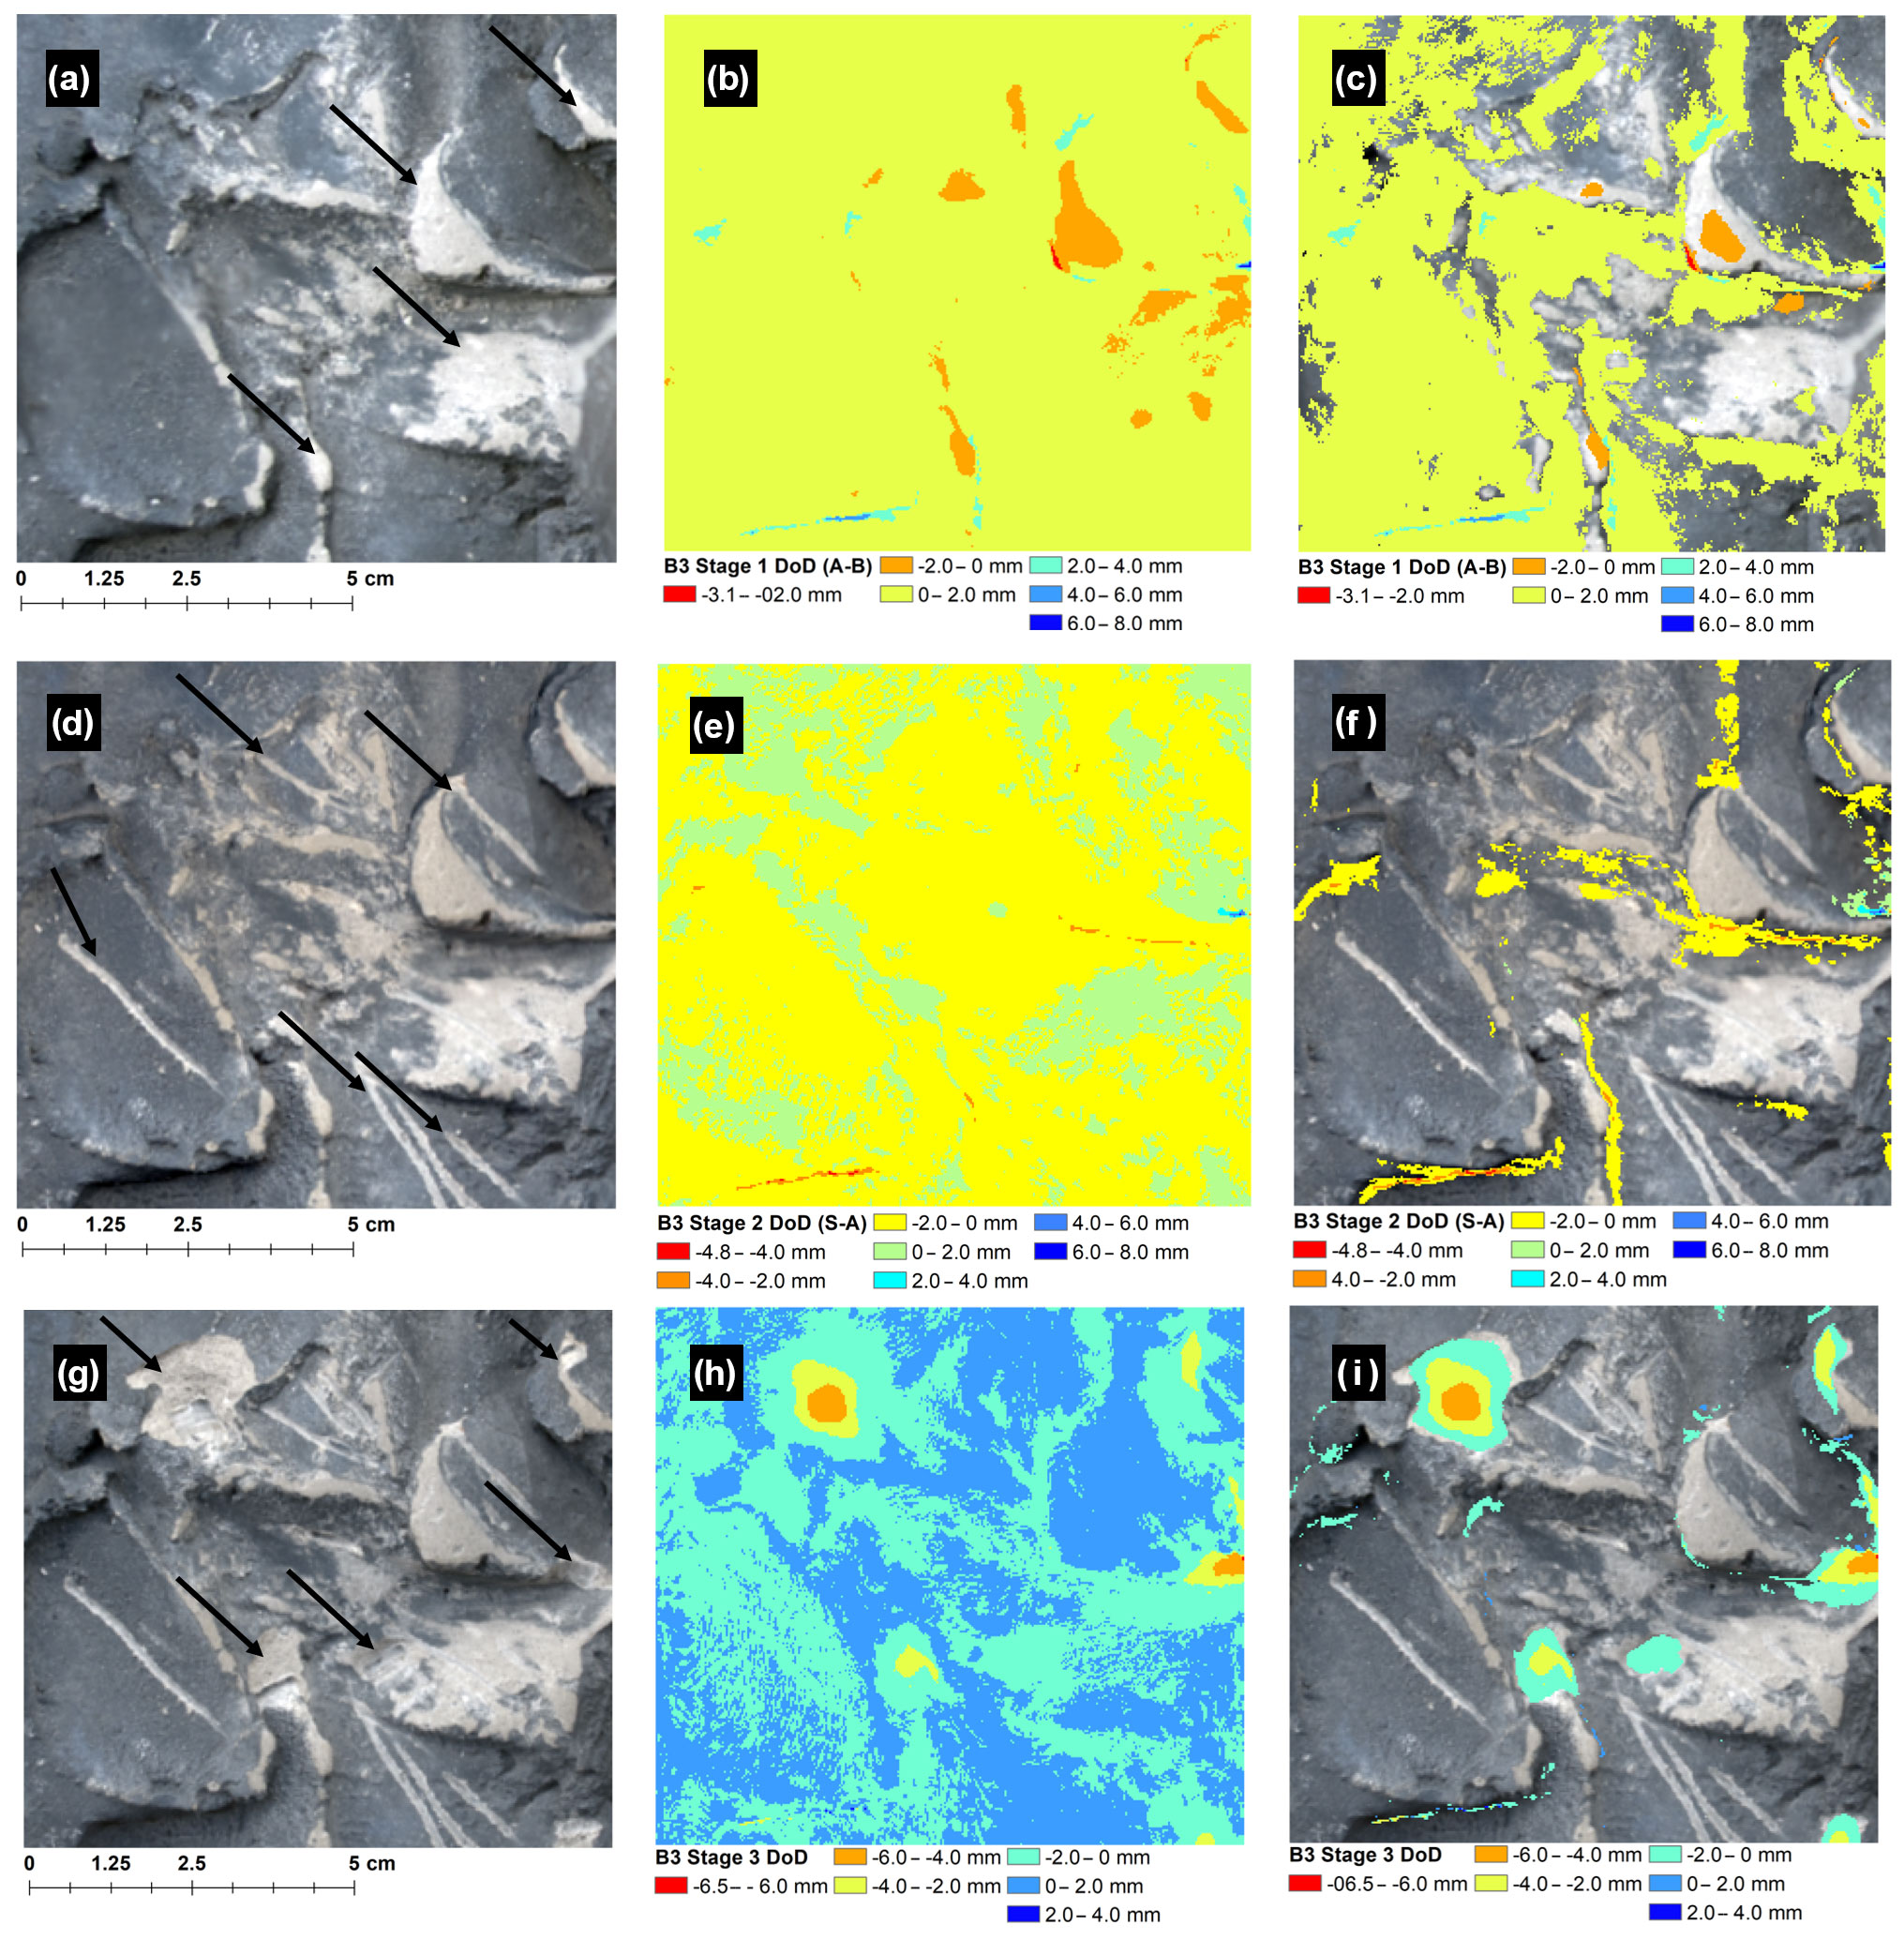
Figure 6(a) B3 Stage 1 orthophoto showing abraded surface area (light grey) of simulated platform surface. (b) DoD for B3 Stage 3 before thresholding and (c) DoD at LoD shown at 50 % transparency overlaid onto the orthophoto shown in (a). Note significant geomorphic change detected in shadow zones where no change is expected. (d) B3 Stage 2 orthophoto showing the scratched surface of the simulated platform (black arrows), (e) DoD before thresholding, and (f) DoD thresholded at LoD. As in (c), note the change higher than the LoD detected in shadow zones in (f) where no change is expected. (g) B3 Stage 3 orthophoto showing the location of percussions (black arrows), (h) B3 Stage 3 DoD before thresholding at LoD, and (i) B3 Stage 3 DoD thresholded using calculated LoD. Note shadow zones where DoD indicates change, but none is expected.
3.3.3 Relatively high rugosity platform (B3)
The results for B3 are shown in Fig. 6a–i. The light-toned areas in panel (a) indicate the abraded surface of the experimental block. In general, the maximum negative change detected (red and orange areas in panel b) correspond well to the abraded area. However, there are significant increases and decreases (> 3 mm) in surface elevation where no change was expected. As above, the largest of these errors generally occurred in “shadow zones”. Thresholding did not significantly improve the resultant DoD (i). For scratches (Fig. 6d) there was a reduction in surface elevation of 3.45 mm detected where no change was expected. As with the previous stage, these changes were observed to occur in shadow zones. Thresholding at the LoD did not improve the resultant DoD, and both increases and decreases were recorded where no change was expected. The location of percussions is shown in Fig. 6g. Maximum negative change detected corresponded mainly to the location of percussion; however, negative change was recorded where none was expected (h). As before, an abnormal change occurred in shadow zones. Thresholding improved the resultant DoD (i), and the majority of negative change observed corresponded well to the location of percussions, except in some small areas associated with shadow zones. Maximum percussion depth was recorded at 5.43 mm.
To summarize, for a simulated platform with a relatively high RI, only impacts were reliably detected in the thresholded DoD. However, there were errors (larger than in B2) in the data, which are concentrated in topographic “shadows”.
3.3.4 Comparison of the TMEM and SfM-MVS for measuring erosion on shore platforms
The TMEM has, over decades, cemented its position as a low-cost method for measuring micro-scale erosion on shore platforms, while SfM-MVS is fast emerging as a valuable tool in the geomorphologist toolkit for the detection and measurement of geomorphic change at a range of scales. Both approaches have advantages and limitations, and the choice for the use of one method over another will depend on a number of factors such as cost, the ease of data collection, and the quality and value of the data required to answer a specific research question.
We have compared our experience of using the TMEM to that of the SfM-MVS (based on the CRS and workflow used in this study) as a means for detecting geomorphic change on shore platforms under the following headings. We evaluated both techniques for ease of data acquisition (including both installation and data collection), data processing, hardware costs, software costs, model resolution, accuracy, and overall ease of use. Our reported installation, data collection, and data processing times refer to a single measurement station. Hardware costs for the TMEM are based on initial outlay for the slotted driveshaft (SDS) drill, drill bits, the TMEM platform, and an engineer gauge. Hardware for the SfM-MVS workflow described in this study refers to initial outlay for the manufacture of CRS and the cost of the camera. Basic hardware costs (e.g. computer for processing) are not included. Overall ease of use for each method is based on our experience of data acquisition in the field (installation and collection) and data processing. An overall comparison is provided based on the above factors in addition to the value of the data obtained.
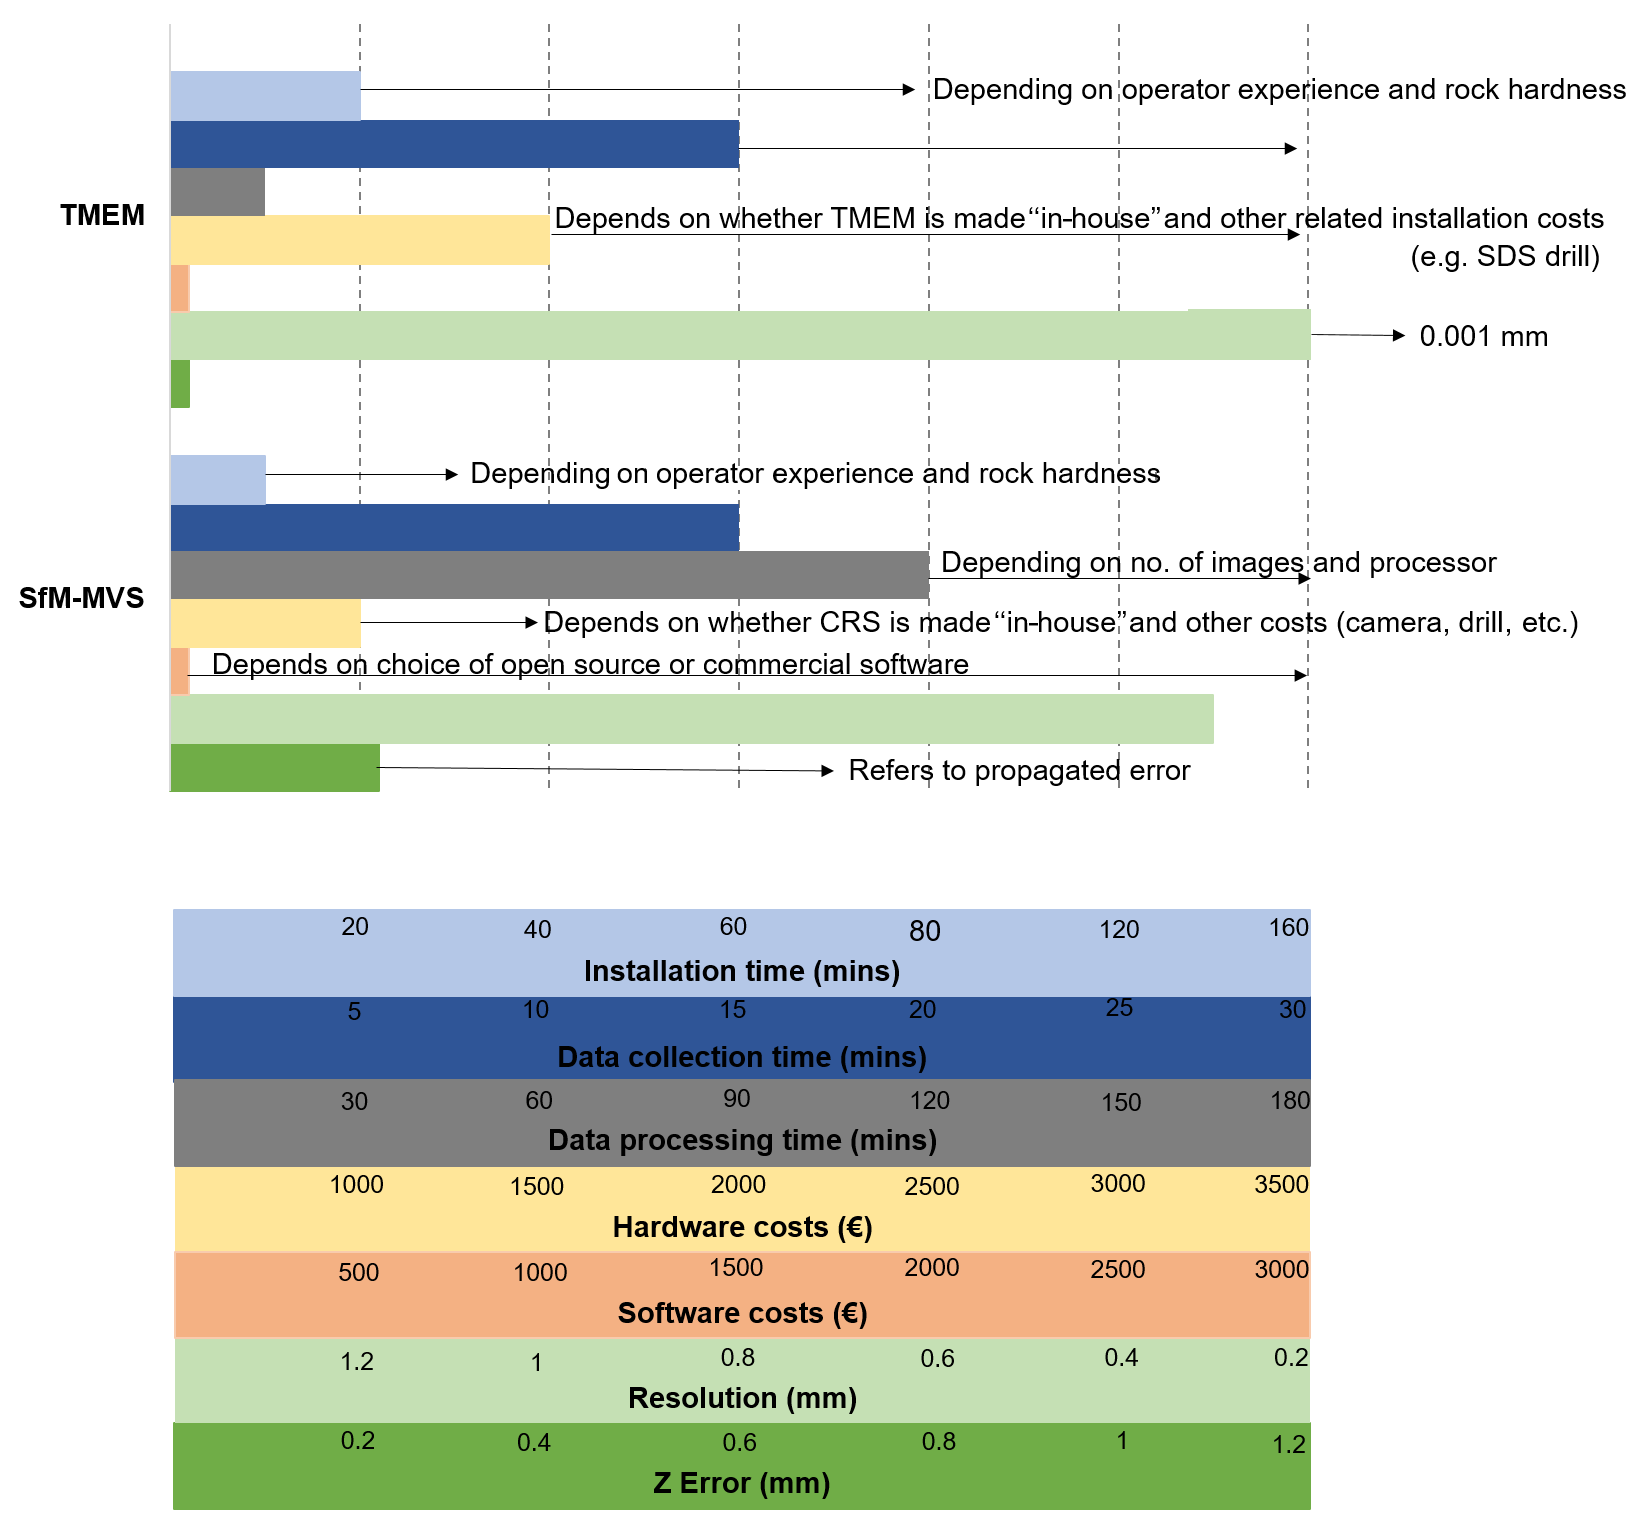
Figure 7Comparison of TMEM and the SfM-MVS workflow presented in this study under different categories. Values shown (cost, time, etc.) increase from left to right apart from “resolution” for which decreasing values from left to right indicate increasing resolution.
A comparison of the TMEM and the SfM-MVS approach as a means for detecting geomorphic change on shore platforms is shown in Fig. 7. Both methods have clear advantages and disadvantages, and the comparison is intended to be a guide to assist researchers in choosing the most appropriate method for specific project deliverables.
3.3.5 Installation
To install a single TMEM measurement station, three holes are drilled at the apex of an equilateral triangle and pins are set into each hole with a marine-grade epoxy resin. The time needed to install a single TMEM station varies between 20 and 80 min depending on operator experience and rock hardness. For the workflow used in this study, the time needed to install a single bolt to mount the CRS will take approximately one-third of the time.
3.3.6 Data collection
In our experience, the time needed to collect data from a single station (based on 100 measurements) using a TMEM varies between 15 and 30 min (grey bar in Fig. 6). This will depend on whether the digital gauge being used has a USB memory, which automatically stores measurements as they are taken (e.g. Stephenson, 1997), or whether measurements are recorded manually, which increases the time required. In comparison, acquiring the 40–50 images as necessary for SfM-MVS took approximately 15 min.
3.3.7 Data processing
The time required to process TMEM data will depend on the number of measurements collected and the method used to record data in the field, i.e. whether they are stored automatically (e.g. Stephenson, 1997) or manually. Automatic recording reduces the time needed to process data; however, manual processing can take up to 30 min per station (based on 100 measurements). Data processing takes significantly longer for SfM-MVS (2–3 h per DEM) depending on number of images and the processor used.
3.3.8 Hardware costs
The cost of a TMEM platform varies considerably depending on whether it is made in-house or commercially. In-house construction is considerably less (∼ EUR 900 for materials and labour), while a commercial TMEM costs approximately EUR 2000 (based on 2017 prices). The cost of the digital gauge also varies depending on the manufacturer, model, resolution, accuracy, and ingress protection (IP) needed and ranges from EUR 200–500. Most rock types will also require an SDS drill with masonry bits, which costs in the region of EUR 600. The cost of the 316 stainless-steel pins also varies depending on whether they are constructed in-house or purchased commercially.
3.3.9 Software costs
The software cost for TMEM data processing is negligible, while there are free open-source software programmes available for processing images for SfM-MVS (e.g. visual SfM). However, commercial packages such as Agisoft Photoscan can cost between EUR 600 and 3500 depending on the licence type (e.g. pro, standard, educational, stand-alone, or floating).
3.3.10 Resolution and error
Depending on the digital gauge used, TMEM measurements can have a resolution of up to 0.001 mm with a reported measurement error of ±0.005 mm (Gómez-Pujol et al., 2007). This resolution permits the detection of change at a scale not currently achievable using the SfM-MVS approach described here. The resolution for SfM-MVS (achieved in this study) was 0.3 mm per pixel. For some DEMs it was less than this (0.15 mm per pixel); however, differencing of DEMs requires that the pixel resolution be the same for both DEMs being compared. The CRS and SfM-MVS workflow employed for this study achieved maximum XY and Z RMSEs of 0.2 and 0.5 mm, respectively.
The TMEM has contributed significantly to our understanding of micro-scale erosion processes on shore platforms. Measurements of micro-scale platform erosion using a TMEM are limited to repeated point measurements over time, which provides a mean rate of surface downwearing within the measurement area for that measurement period with the dominant process(es) being inferred from the spatial and temporal variation in downwearing rates (Trenhaile, 2003). However, the method's inability to measure erosion at different scales was noted by Stephenson and Finlayson (2009) as a limitation and the authors advocated the introduction of new methods for measuring shore platform erosion at a range of scales. We have developed a CRS which can be quickly deployed by researchers in the field for the detection of micro-scale and mesoscale erosion on shore platforms using SfM-MVS photogrammetry and a geomorphic change detection approach. The CRS described in this study permits the rigorous georeferencing of DEMs derived using the SfM-MVS workflow. Although we demonstrate the potential of the method on a simulated shore platform, the approach is not limited to shore platforms and has potential as a means for measuring bedrock erosion at similar scales in other environments (see Turowski and Cook, 2017, for examples).
We have demonstrated that SfM-MVS photogrammetry can be used to reliably detect sub-millimetre changes on shore platforms for which the platform surface has a low RI. This approach successfully detected 0.3 mm downwearing of the simulated platform surface of B1 caused by abrasion of the surface. While we were also able to identify shallow scratches on the surface of the experimental block, applying the LoD obscured this finding due to the shallow depth of scratches (< 0.3 mm). However, we were able to detect loss of millimetre- to centimetre-sized rock fragments effectively. This demonstrates that our approach offers a method for cross-scalar analysis of erosion on shore platforms, offering a much-needed means to examine relationships between micro-scale and mesoscale processes of shore platform erosion and morphologies.
Our results indicate that as RI increases, the reliability of SfM-MVS for the detection of fine-scale (sub-millimetre) erosion is reduced due to increased topographic complexity. Despite areas of reduced elevation, i.e. erosion, aligning well with areas where the surface had been abraded, there were areas of change where clearly none was expected. Despite this, our approach successfully detected the loss of rock fragments on the simulated platform surface of B2 (higher RI) once the LoD was applied. Similarly, for B3, which had the highest RI, fine-scale erosion and scratches were not detected reliably, and while the loss of rock fragments was detected, the effect of complex topography in creating shadow zones produced abnormal change. The orthophotos were important in this regard as they provided visual validation of the models and highlighted the influence of shadow zones in introducing error into the models. The additional uncertainty introduced into the models due to the surface complexity was not accounted for using the LoD approach. This resulted in abnormal change detection associated with mesoscale (> 1 mm) slopes and troughs. Indeed, this is a well-recognized limitation of the SfM-MVS approach to geomorphic change detection, and appropriate solutions (e.g. precision mapping) have been proposed. While the strong influence of surface complexity may be considered a limitation, it should be noted that the TMEM is largely restricted to measurements of downwearing on small surface areas with low topographic complexity. As such, it does not exclude this approach as an alternative for measuring change on this type of surface.
Precision mapping (James et al., 2017) offers a potential approach to address this as there is an opportunity to increase confidence in the accuracy of point clouds derived for more complex platform morphologies. While the LoD assumes a global uniform distribution of error, precision mapping explicitly accounts for the spatially variable precision characteristic of photo-based surveys (James et al., 2017) and has been demonstrated to improve change detection in areas with complex topography. Future work will test this approach.
Another possible contributor to the erroneous results may be variable lighting conditions and specular reflection. A study by Guidi et al. (2014) demonstrated that the use of a polarizing filter and digital pre-processing with High Dynamic Range (HDR) imaging could help to homogenize brightness over the subject, subsequently improving image matching. We recommend these approaches to overcome this problem.
This study and our experience in the field using a TMEM suggest that the time required for data collection (installation and acquisition) is shorter using an SfM-MVS approach compared to the TMEM. The requirement of just one bolt per measurement site for the CRS described here, compared to three bolts per measurement site for the TMEM, reduces the time needed for initial installation in the field. Add to that the time required to collect images for the SfM-MVS workflow compared to the time needed to obtain 100 TMEM measurements, and SfM-MVS has notable advantages. This reduced installation and data acquisition time is of particular worth for shore platforms with meso- to macro-tidal ranges for which time in the intertidal zone is limited to, at most, a couple of hours on either side of low tide. For larger platforms on which a number of measurement stations are located in the intertidal zone, time is a limiting factor, and methods which allow for rapid installation data collection are preferable. Regarding data processing, the time required depends on the gauge used to collect the TMEM data, i.e. manual or automatic, and the desired output (point measurements or 3-D surface). Regardless, the processing time required for SfM-MVS is significantly higher (2–3 h per DEM generated). Nevertheless, batch processing options in Photoscan mean that DEM generation processes and steps can be automated and the user time on the computer is reduced. With respect to image acquisition for SfM-MVS, we used a Nikon D5500 and included this in our overall analysis; however, expensive cameras are not a prerequisite. For example, in a recent experimental study of surface features in sand caused by the sublimation of CO2 ice of a similar scale to this study, Mc Keown et al. (2017) used an iPhone to acquire images and utilized the same CRS developed by Verma and Bourke (2018) to scale and reference DEMs, achieving similar accuracy and resolution (< 1 mm).
It is important to note that the resolution of the SfM-MVS approach, while capable of detecting sub-millimetre-scale change, is still 2 orders of magnitude lower than that achievable with a TMEM. The TMEM offers considerable resolution and accuracy for measurements of very small surface changes, which is particularly useful for measuring very slow rates of downwearing and detection of very small changes due to processes which operate at much finer spatial scales such as platform swelling (e.g. Stephenson and Kirk, 2001; Trenhaile, 2006; Gómez-Pujol et al., 2007; Hemmingsen et al., 2007; Porter and Trenhaile, 2007). For faster-eroding rocks, the precision obtainable using a TMEM is not required (Stephenson and Finlayson, 2009). While the highest common resolution of the DEMs produced for this study was 0.3 mm pixel−1, this is demonstrated to be sufficient for measuring micro-scale and mesoscale erosion on surfaces with low RI and loss of rock fragments on more topographically complex surfaces.
In terms of data output, the TMEM produces a series of surface point measurements. These can be compared directly to point measurements made from previous surveys or plotted as a digital elevation model for 3-D visualization of the surface at the bolt site (e.g. Stephenson, 1997). The spatial and temporal variation in downwearing rates can be used to infer the efficacy of erosion processes. In this, we suggest that SfM-MVS has a clear and important geomorphic advantage. The technique produces point clouds and DEMs which can be used to identify and classify surface features as well as detect geomorphic change at different scales. This added value in the approach is significant. Orthophotograph mosaics offer additional means for validating mesoscale changes on the rock surface and identifying erosion styles.
-
This study demonstrates that SfM can be used to detect sub-millimetre changes due to erosion on shore platforms. However, we find that as the complexity of the rock surface topography increases, the reliability of SfM to detect sub-millimetre changes decreases. We note that the application of TMEM is also limited to relatively planar surfaces. Future work will test the precision mapping approach of James et al. (2017) to determine the spatial distribution of error and increase confidence in results on more topographically complex platform surfaces.
-
While TMEM has higher resolution and accuracy compared to SfM, it offers a limited number of point measurements over a small area. In comparison, SfM produces 3-D topographic data from dense point clouds and DEMs which can be used to identify, classify, and quantify different styles and scales of erosion.
-
In this study, we have provided a detailed comparison between TMEM and SfM methods to measure change due to the erosion of rock surfaces in the coastal environment. The approach is not limited to shore platforms and has potential as a means for measuring erosion at similar scales in a range of environments.
All data are available upon request from the corresponding author at cullenni@tcd.ie.
NDC prepared and wrote the main body of the paper with discussion and contributions from AKV and MCB. NDC designed the experiment with input from AKV and MCB, AKV designed the original coordinate reference system, NDC designed the field-adapted version with input from AKV and MCB, and NDC and AKV carried out the experiments. AKV processed images and generated the digital elevation models. NDC carried out data analysis. AKV and MCB reviewed and edited the final paper.
The authors declare that they have no conflict of interest.
Niamh Danielle Cullen and Ankit Kumar Verma were supported by the Trinity College Dublin Postgraduate
Studentship, Faculty of Engineering, Mathematics and Science. The authors
would also like to thank the Geography Department at Trinity College Dublin
for additional support in carrying out this research. Our thanks also to
Neil Dawson from J.F. Dunne Engineering for expertise in the manufacture of
the field-adapted coordinate reference system used in the experiment.
Edited by: Giulia Sofia
Reviewed by: Wayne J. Stephenson and one anonymous referee
Andrews, C. and Williams, R. B.: Limpet erosion of chalk shore platforms in southeast England, Earth Surf. Proc. Land., 25, 1371–1381, 2000.
Balaguer-Puig, M., Marqués-Mateu, Á., Lerma, J. L., and Ibáñez-Asensio, S.: Estimation of small-scale soil erosion in laboratory experiments with Structure from Motion photogrammetry, Geomorphology, 295, 285–296, https://doi.org/10.1016/j.geomorph.2017.04.035, 2017.
Bourke, M. C., Brearley, J. A., Haas, R., and Viles, H. A.: A photographic atlas of rock breakdown features in geomorphic environments, Planetary Science Institute, 2007.
Brasington, J., Rumsby, B., and McVey, R.: Monitoring and modelling morphological change in a braided gravel-bed river using high resolution GPS-based survey, Earth Surf. Proc. Land., 25, 973–990, 2000.
Brasington, J., Langham, J., and Rumsby, B.: Methodological sensitivity of morphometric estimates of coarse fluvial sediment transport, Geomorphology, 53, 299–316, https://doi.org/10.1016/S0169-555X(02)00320-3, 2003.
Brunier, G., Fleury, J., Anthony, E. J., Gardel, A., and Dussouillez, P.: Close-range airborne Structure-from-Motion Photogrammetry for high-resolution beach morphometric surveys: Examples from an embayed rotating beach, Geomorphology, 261, 76–88, https://doi.org/10.1016/j.geomorph.2016.02.025, 2016a.
Brunier, G., Fleury, J., Anthony, E. J., Pothin, V., Vella, C., Dussouillez, P., Gardel, A., and Michaud, E.: Structure-from-Motion photogrammetry for high-resolution coastal and fluvial geomorphic surveys, Geomorph. Rel. Proc. Enviro., 22, 147–161, https://doi.org/10.1016/j.geomorph.2016.02.025, 2016b.
Carbonneau, P. E., Lane, S. N., and Bergeron, N. E.: Catchment-scale mapping of surface grain size in gravel bed rivers using airborne digital imagery, Water Resour. Res., 40, W07202, https://doi.org/10.1029/2003WR002759, 2004.
Carrivick, J. L., Smith, M. W., and Quincey, D. J.: Structure from Motion in the Geosciences, John Wiley & Sons, 2016.
Chandler, J.: Effective application of automated digital photogrammetry for geomorphological research, Earth Surf. Proc. Land., 24, 51–63, https://doi.org/10.1002/(SICI)1096-9837(199901)24:1<51::AID-ESP948>3.0.CO;2-H, 1999.
Chandler, J., Ashmore, P., Paola, C., Gooch, M., and Varkaris, F.: Monitoring river-channel change using terrestrial oblique digital imagery and automated digital photogrammetry, Ann. Am. Assoc. Geogr., 92, 631–644, https://doi.org/10.1111/1467-8306.00308, 2002.
Cullen, N. D. and Bourke, M. C.: Clast abrasion of a rock shore platform on the Atlantic coast of Ireland, Earth Surf. Proc. Land., 43, 2627–2641, https://doi.org/10.1002/esp.4421, 2018.
Dahl, A. L.: Surface area in ecological analysis: quantification of benthic coral-reef algae, Mar. Biol., 23, 239–249, https://doi.org/10.1007/BF00389331, 1973.
Ellis, N.: Morphology, process and rates of denudation on the chalk shore platform of East Sussex, Brighton Polytechnic, PhD Thesis, 1986.
Fonstad, M. A., Dietrich, J. T., Courville, B. C., Jensen, J. L., and Carbonneau, P. E.: Topographic structure from motion: a new development in photogrammetric measurement, Earth Surf. Proc. Land., 38, 421–430, https://doi.org/10.1002/esp.3366, 2013.
Foote, Y., Plessis, E., Robinson, D., Hénaff, A., and Costa, S.: Rates and patterns of downwearing of chalk shore platforms of the Channel: comparisons between France and England, Z. Geomorphol., 144, 93–115, 2006.
Furukawa, Y., Curless, B., Seitz, S. M., and Szeliski, R.: Towards internet-scale multi-view stereo, IEEE Comp. Soc. Conf. on Comp. Vis. and Patn. Recog, San Francisco, CA, 1434–1441, https://doi.org/10.1109/CVPR.2010.5539802, 2010.
Gómez-Gutiérrez, Á., Schnabel, S., Berenguer-Sempere, F., Lavado-Contador, F., and Rubio-Delgado, J.: Using 3-D photo-reconstruction methods to estimate gully headcut erosion, Catena, 120, 91–101, https://doi.org/10.1016/j.catena.2014.04.004, 2014.
Gómez-Pujol, L., Stephenson, W. J., and Fornós, J. J.: Two-hourly surface change on supra-tidal rock (Marengo, Victoria, Australia), Earth Surf. Proc. Land., 32, 1–12, https://doi.org/10.1002/esp.1373, 2007.
Guidi, G., Gonizzi, S., and Micoli, L. L.: Image pre-processing for optimizing automated photogrammetry performances, ISPRS Ann. Photogramm. Remote Sens. Spatial Inf. Sci., II-5, 145–152, https://doi.org/10.5194/isprsannals-II-5-145-2014, 2014.
Hanna, F.: A technique for measuring the rate of erosion of cave passages, Proc. Uni. Bristol Spel. Soc., 83–86, 1966.
Hemmingsen, S. A., Eikaas, H. S., and Hemmingsen, M. A.: The influence of seasonal and local weather conditions on rock surface changes on the shore platform at Kaikoura Peninsula, South Island, New Zealand, Geomorphology, 87, 239–249, https://doi.org/10.1016/j.geomorph.2006.09.010, 2007.
High, C. J. and Hanna, F. K.: A method for the direct measurement of erosion on rock surfaces, Brit. Geomorphol. Res. Grp. Tech. Bull., 5, 1–25, 1970.
James, M. R., Robson, S., and Smith, M. W.: 3-D uncertainty-based topographic change detection with structure-from-motion photogrammetry: precision maps for ground control and directly georeferenced surveys, Earth Surf. Proc. Land., 42, 1769–1788, https://doi.org/10.1002/esp.4125, 2017.
Javernick, L., Brasington, J., and Caruso, B.: Modeling the topography of shallow braided rivers using Structure-from-Motion photogrammetry, Geomorphology, 213, 166–182, https://doi.org/10.1016/j.geomorph.2014.01.006, 2014.
Kaiser, A., Neugirg, F., Rock, G., Müller, C., Haas, F., Ries, J., and Schmidt, J.: Small-scale surface reconstruction and volume calculation of soil erosion in complex Moroccan gully morphology using structure from motion, Remote Sens., 6, 7050–7080, https://doi.org/10.3390/rs6087050, 2014.
Lane, S. N., Westaway, R. M., and Murray Hicks, D.: Estimation of erosion and deposition volumes in a large, gravel-bed, braided river using synoptic remote sensing, Earth Surf. Proc. Land., 28, 249–271, https://doi.org/10.1002/esp.483, 2003.
Lim, M., Rosser, N. J., Allison, R. J., and Petley, D. N.: Erosional processes in the hard rock coastal cliffs at Staithes, North Yorkshire, Geomorphology, 114, 12–21, https://doi.org/10.1016/j.geomorph.2009.02.011, 2010.
Lowe, D. G.: Distinctive image features from scale-invariant keypoints, Int. J. Comput. Vision, 60, 91–110, https://doi.org/10.1023/B:VISI.0000029664.99615.94, 2004.
Mc Keown, L., Bourke, M., and McElwaine, J.: Experiments On Sublimating Carbon Dioxide Ice And Implications For Contemporary Surface Processes On Mars, Sci. Rep., 7, 14181, https://doi.org/10.1038/s41598-017-14132-2, 2017.
Micheletti, N., Chandler, J. H., and Lane, S. N.: Investigating the geomorphological potential of freely available and accessible structure-from-motion photogrammetry using a smartphone, Earth Surf. Proc. Land., 40, 473–486, https://doi.org/10.1002/esp.3648, 2015a.
Micheletti, N., Chandler, J. H., and Lane, S. N.: Structure from Motion (SfM) Photogrammetry, in: Geomorphlogical Techniques, 2 (2.2), British Society for Geomorphology, Loondon, 2015b.
Moses, C., Robinson, D., and Barlow, J.: Methods for measuring rock surface weathering and erosion: A critical review, Earth Sci. Rev., 135, 141–161, https://doi.org/10.1016/j.earscirev.2014.04.006, 2014.
Özyeşil, O., Voroninski, V., Basri, R., and Singer, A.: A survey of structure from motion, Acta Numer., 26, 305–364, 2017.
Porter, N. J. and Trenhaile, A.: Short-term rock surface expansion and contraction in the intertidal zone, Earth Surf. Proc. Land., 32, 1379–1397, https://doi.org/10.1002/esp.1479, 2007.
Risk, M. J.: Fish diversity on a coral reef in the Virgin Islands, The Smithsonian Institution,, Washington, Atoll Research Bulletin, Report No. 153, 1972.
Smith, M., Carrivick, J., and Quincey, D.: Structure from motion photogrammetry in physical geography, Prog. Phys. Geogr., 40, 247–275, 2016.
Snavely, N.: Bundler: SfM for unordered image collections, available at: http://phototour.cs.washington.edu/bundler/ (last access: 15 September 2018), 2006.
Spate, A., Jennings, J., Smith, D., and Greenaway, M.: The micro-erosion meter: use and limitations, Earth Surf. Proc. Land., 10, 427–440, https://doi.org/10.1002/esp.3290100504, 1985.
Stephenson, W. and Finlayson, B.: Measuring erosion with the micro-erosion meter–contributions to understanding landform evolution, Earth Sci. Rev., 95, 53–62, https://doi.org/10.1016/j.earscirev.2009.03.006, 2009.
Stephenson, W. and Naylor, L.: Within site geological contingency and its effect on rock coast erosion, J. Coast. Res., 61, 831–835, 2011.
Stephenson, W., Kirk, R., Hemmingsen, S., and Hemmingsen, M.: Decadal scale micro erosion rates on shore platforms, Geomorphology, 114, 22–29, https://doi.org/10.1016/j.geomorph.2008.10.013, 2010.
Stephenson, W. J.: Improving the traversing micro-erosion meter, J. Coast. Res., 13, 236–241, 1997.
Stephenson, W. J. and Kirk, R. M.: Measuring erosion rates using the micro-erosion meter: 20 years of data from shore platforms, Kaikoura Peninsula, South Island, New Zealand, Mar. Geol., 131, 209–218, https://doi.org/10.1016/0025-3227(96)00008-4, 1996.
Stephenson, W. J. and Kirk, R. M.: Surface swelling of coastal bedrock on inter-tidal shore platforms, Kaikoura Peninsula, South Island, New Zealand, Geomorphology, 41, 5–21, https://doi.org/10.1016/S0169-555X(01)00100-3, 2001.
Sunamura, T.: A relationship between wave-induced cliff erosion and erosive force of waves, J. Geol., 85, 613–618, 1977.
Swantesson, J., Moses, C., Berg, G., and Jansson, K. M.: Methods for measuring shoreplatform micro-erosion; a comparison of the micro-erosion meter and the laser scanner, Z. Geomorphol. Supp., 144, 1–17, 2006.
Thoeni, K., Giacomini, A., Murtagh, R., and Kniest, E.: A comparison of multi-view 3-D reconstruction of a rock wall using several cameras and a laser scanner, Int. Arch. Photogramm. Remote Sens. Spatial Inf. Sci., XL-5, 573–580, https://doi.org/10.5194/isprsarchives-XL-5-573-2014, 2014.
Thornbush, M. J.: A site-specific index based on weathering forms visible in Central Oxford, UK, Geosci., 2, 277–297, https://doi.org/10.3390/geosciences2040277, 2012.
Trenhaile, A.: Tidal wetting and drying on shore platforms: an experimental study of surface expansion and contraction, Geomorphology, 76, 316–331, https://doi.org/10.1016/j.geomorph.2005.11.006, 2006.
Trenhaile, A. S.: Modeling shore platforms: present status and future developments, in: Advances in Coastal Modeling, Amsterdam: Elsevier, edited by: Lakhan, V. C., Elsevier Science B.V., 2003.
Trudgill, S.: Measurement of erosional weight loss of rock tablets, British Geomorphological Research Group Technical Bulletin, 13–20, 1975.
Trudgill, S., High, C., and Hanna, F.: Improvements to the micro-erosion meter, British Geomorphological Research Group Technical Bulletin, 3–17, 1981.
Turowski, J. M. and Cook, K. L.: Field techniques for measuring bedrock erosion and denudation, Earth Surf. Proc. Land., 42, 109–127, https://doi.org/10.1002/esp.4007, 2017.
Verma, A. K. and Bourke, M. C.: A Structure from Motion photogrammetry-based method to generate sub-millimetre resolution Digital Elevation Models for investigating rock breakdown features, Earth Surf. Dynam. Discuss., https://doi.org/10.5194/esurf-2018-53, in review, 2018.
Viles, H. A.: Scale issues in weathering studies, Geomorphology, 41, 63–72, https://doi.org/10.1016/S0169-555X(01)00104-0, 2001.
Walkden, M. and Hall, J.: A predictive mesoscale model of the erosion and profile development of soft rock shores, Coast. Eng., 52, 535–563, https://doi.org/10.1016/j.coastaleng.2005.02.005, 2005.
Warke, P. A. and McKinley, J.: Scale issues in geomorphology, Geomorphology, 130, 1–4, https://doi.org/10.1016/j.geomorph.2011.04.031, 2011.
Westoby, M., Brasington, J., Glasser, N., Hambrey, M., and Reynolds, J.: “Structure-from-Motion” photogrammetry: A low-cost, effective tool for geoscience applications, Geomorphology, 179, 300–314, 2012.
Wheaton, J. M., Brasington, J., Darby, S. E., and Sear, D. A.: Accounting for uncertainty in DEMs from repeat topographic surveys: improved sediment budgets, Earth Surf. Proc. Land., 35, 136–156, https://doi.org/10.1002/esp.1886, 2010.
Williams, R.: DEMs of difference, in: Geomorph. Tech., 2 (3.2), British Society for Geomorphology, London, UK, 2012.