the Creative Commons Attribution 4.0 License.
the Creative Commons Attribution 4.0 License.
 | 22 Nov 2018
Determining the scales of collective entrainment in collision-driven bed load
Dylan B. Lee
Fluvial bed-load transport is notoriously unpredictable, especially near the threshold of motion where stochastic fluctuations in sediment flux are large. Laboratory and field observations suggest that particles are entrained collectively, but this behavior is not well resolved. Collective entrainment introduces new length scales and timescales of correlation into probabilistic formulations of bed-load flux. We perform a series of experiments to directly quantify spatially clustered movement of particles (i.e., collective motion), using a steep-slope 2-D flume in which centimeter-scale marbles are fed at varying rates into a shallow and turbulent water flow. We observe that entrainment results exclusively from particle collisions and is generally collective, while particles deposit independently of each other. The size distribution of collective motion events is roughly exponential and constant across sediment feed rates. The primary effect of changing feed rate is simply to change the entrainment frequency, although the relation between these two diverges from the expected linear form in the slowly driven limit. The total displacement of all particles entrained in a collision event is proportional to the kinetic energy deposited in the bed by the impactor. The first-order picture that emerges is similar to generic avalanching dynamics in sandpiles: “avalanches” (collective entrainment events) of a characteristic size relax with a characteristic timescale regardless of feed rate, but the frequency of avalanches increases in proportion to the feed rate. The transition from intermittent to continuous bed-load transport then results from the progressive merger of entrainment avalanches with increasing transport rate. As most bed-load transport occurs in the intermittent regime, the length scale of collective entrainment should be considered a fundamental addition to any probabilistic bed-load framework.
- Article
(9426 KB) - Full-text XML
- BibTeX
- EndNote


Bed load, the motion of particles along a stream bed by rolling, hopping and sliding, is the dominant mode of transport in rivers for particles larger than 10 mm (Dade and Friend, 1998; Jerolmack and Brzinski, 2010; Parker et al., 2007). Bed-load flux equations lose their predictive power as fluid stress decreases toward the threshold of motion (Recking, 2010), where sediment transport becomes increasingly intermittent and exhibits fluctuations across a wide range of length scales and timescales (Ancey and Heyman, 2014; Ancey et al., 2008; Heyman et al., 2013; Singh et al., 2009). Gravel-bed rivers organize their bankfull geometry such that they are always near the threshold (Parker et al., 2007; Phillips and Jerolmack, 2016). There are two potential causes of intermittency in near-threshold bed load: (i) variability in the driving stress due to turbulent eddies near the bed (Diplas et al., 2008; Nelson et al., 1995; Papanicolaou et al., 2001; Schmeeckle and Nelson, 2003; Sumer et al., 2003) and (ii) variability in the resistive force of the bed due to structural arrangements of the grains (Charru et al., 2004; Martin et al., 2014; Prancevic and Lamb, 2015; Yager et al., 2007). While the role of turbulence has received the most attention, granular contributions to bed-load dynamics are increasingly being recognized (Frey and Church, 2011; Houssais et al., 2015; Maurin et al., 2016; Pähtz and Durán, 2017). One of the defining features of granular systems is a continuous transition from flowing to static regimes, known as the jamming transition. On approach to jamming, particle motion becomes progressively slower and more heterogeneous; the variance in fluctuations of particle displacements grows rapidly (Keys et al., 2007; Liu and Nagel, 2010). Experiments show that the onset of bed-load transport has the hallmarks of a jamming transition (Houssais et al., 2015, 2016; Maurin et al., 2016). Near-threshold transport rates exhibit strong correlations and intermittency, while fluxes at rates far above the threshold are uncorrelated and smooth (Singh et al., 2009).
Given the many-body nature of the problem, one sensible approach is to examine bed-load transport in a probabilistic framework after Einstein (1950). Einstein defined a bed-load flux function of the form . In this formulation of bed-load flux qx, the entrainment rate function E assumes a fixed timescale for the exchange of an inactive particle with an active one; is the mean hop length. Importantly, this formulation assumes that both entrainment and deposition of particles are a time-independent Poisson process and that particles do not interact. The discussion above, however, indicates that bed-load transport has characteristics that deviate from the time-independent, non-correlated process assumed by Einstein. Indeed, experimental and field observations have revealed extreme fluctuations in particle activity/flux above the mean (i.e., extreme variance) (Ancey et al., 2008; Gomez and Phillips, 1999; Nikora et al., 2002; Singh et al., 2009), collective grain motion (Ancey et al., 2008; Dinehart, 1999; Drake et al., 1988) and anomalous diffusion of particles (Ganti et al., 2010; Phillips et al., 2013; Tucker and Bradley, 2010). Starting with Ancey et al. (2008), a series of models for bed-load transport have been proposed that posit that the probability of entrainment depends on the number of moving particles. These models propose modifications of Einstein's entrainment function that take this correlated behavior into account through the introduction of a collective entrainment rate, μ, that leads to a characteristic correlation length scale, lc (Ancey et al., 2008; Heyman et al., 2013, 2014; Ma et al., 2014). As the mean transport rate is lowered, the relative contribution of the model-derived μ parameter must increase in order to reproduce the observed growth in variance of bed-load activity (i.e., the number density of moving grains). Collective entrainment is thus hypothesized to be the primary driver of observed intermittent and correlated bursts in bed-load transport near the threshold. The dynamical origins of this apparent collective behavior, however, are unknown because it has not been directly observed in terms of grain motion. Furbish et al. (2017) have taken a more generalized approach to modeling stochastic bed-load transport by viewing all probabilistic formulations of bed-load flux that incorporate diffusivity as an approximation of a master equation that exactly conserves both probability and mass. One key to making this approximation effective is a deep understanding of the underlying assumptions used to construct the effective diffusivity of the particles. For example, recently Fathel et al. (2016) showed that the apparently anomalous behavior in the diffusivity of bed-load particles at short times is actually a by-product of the nonlinear growth in the variance of particle hop lengths as particle travel times are shortened. Furbish and colleagues' statistical mechanics framework is the most general model for bed-load transport; given knowledge of the microscopic and probabilistic motions of particles, one may derive continuum-like expressions for the macroscopic behavior. Collective particle motion could be incorporated into this framework, but this requires an intimate understanding of the associated scales and correlations.
While the probabilistic approach has proven valuable for describing the nature of transport near the threshold, it is vital to link this description to the physical origins of the stochastic behavior. If collective entrainment is the primary cause of bed-load flux intermittency, then what leads to it? One possible mechanism for collective motion is entrainment due to collisional impulses. Collisions are widely recognized as drivers of bed-load transport in aeolian systems where separate thresholds for entrainment without collision (the fluid threshold) and with collisions (the impact threshold) have been defined (Bagnold, 1941; Martin and Kok, 2016). In aeolian systems these collisions are accompanied by dramatic “splash” events where numerous particles are ejected at once (i.e., collectively). Recently, it has been proposed that entrainment in subaqueous systems has a significant collisional component as well, especially in the case of large Stokes numbers (Pähtz and Durán, 2017). The Stokes number is the ratio of a particle's inertial forces to the viscous forces of the fluid and, for binary collision between same-sized spheres, is given by Schmeeckle et al. (2001): . Here, R is the submerged specific density, us is particle velocity, ν is fluid viscosity and D is particle diameter. For St>102, viscous damping of collisions is negligible (Schmeeckle et al., 2001) and thus collisions from saltation are expected to impart significant momentum to both the bed and neighboring particles for m. Thus, it is likely that in coarse gravel streams, colliding particles cause a subdued splash similar to aeolian systems. If the analogy with aeolian systems holds, then this splash entrainment will involve many particles becoming entrained at once. This hypothetical, collision-induced collective entrainment could be strong enough to be a primary driver of burstiness in bed-load flux near the threshold.
There are other physical systems examined previously that organize themselves near a threshold and display intermittent mass flux; the behavior of avalanching sand and rice piles comes to mind (Lemieux and Durian, 2000; Rajchenbach, 1990). These systems have been extensively studied and display intermittent transport at the limit where they are slowly driven past a threshold (in this case a critical angle). In the intermittent regime, the size and duration of avalanches is indeterminate (Frette et al., 1996). As the sand pile is driven harder this intermittent regime gives way to continuous flow down the heap with an approximately constant flux. Hwa and Kardar (1992) showed how this transition into continuous flow can be viewed as a merger of the intermittent, avalanching events. Might bed load fit into a class of more generic avalanching systems that transition from intermittent to continuous transport as they are taken from slowly driven to continuously driven?
In this paper we use the slowly to continuously driven limits as end-members to explore how the nature of bed-load transport in an idealized experiment changes as the frequency of mean transport is varied. This is achieved by using a system that allows for precise control of the sediment feed rate while all other parameters (slope, fluid discharge, etc.) are held constant, while particle motion is tracked using sequential images. The imposed feed rate is analogous to a driving frequency. We replicate the previously observed growth in the intermittency of transport as the imposed sediment feed-rate/driving frequency is slowed. Our major contribution is the direct observation of collective entrainment, which reveals that collisions release spatially grouped clusters from the bed that are analogous to avalanches. We note here that the term avalanche is used in this paper in the generic manner of dynamical systems, i.e., bursts of transport that exhibit some kind of spatially extended correlation. We relate the scales of collective entrainment to the kinetic energy deposited in the bed by colliding saltators. This lends credence to the hypothesis that saltator–bed collisions play a large role in entrainment (both collective or otherwise). In our experiments, the growth in intermittency in bed-load transport appears to arise primarily from the nonlinear growth in the waiting times between transport events as the driving rate is slowed.
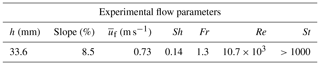
Table 1Mean flow conditions observed during the experiments. All values are means taken around the range of flow conditions observed over all experiments. h is the mean flow depth, is the mean flow velocity, Sh is the Shields number, Fr is the Froude number, Re is the Reynolds number and St is the Stokes number of the large diameter grains. St for the small diameter grains is also much larger than the viscously damped limit.
2.1 Experimental setup
The experiments are conducted using a narrow, quasi 2-dimensional (2-D) flume in which all the grains in the subsurface and surface can be monitored. The flume channel is 2.3 m long and 20 mm wide. For all experiments, two different sized spherical glass beads, D1=12 mm and D2=16 mm in diameter (D), are fed into the channel in an even mixture. The two different sizes are chosen to ensure a randomly packed bed. The “quasi 2-D” nature of the experiment arises from the fact that the small glass beads have significant overlap with one another along the axis orthogonal to the viewing window. All experiments are conducted in a flume slope of 6 % and with a fixed discharge of 37.9 L min−1, while the feed rate at which the particle mixture is introduced to the channel is varied. The feed rate is the control parameter used in the experiments, and throughout the rest of the paper will be referred to as the driving frequency. The driving frequencies used for the experiment were: 40, 60, 80, 160 and 200 marbles per minute. Throughout the paper the abbreviation MPM will be used for marbles per minute.
At the flow rate used, all flows in the channel are turbulent, with Reynolds numbers greater than 104. Flow depths were found to be uniform with the exception of 10–15 cm near the inlet and outlet of the flume. The flow is supercritical with Froude numbers greater than 1, though any bedforms that would be present at these flow conditions are suppressed due to the narrowness of the channel. Experiments are in the high Stokes number regime where collisions are expected to be important, in order to mimic the conditions of gravel-bed rivers. Although collision velocities vary (they are quantified below), they scale roughly with settling velocity, using terminal fall velocity as a scale parameter, St>102 for all experiments. Details about the flow parameters observed during the experiments are given in Table 1. Only mean flow parameters are listed as the flow parameters are kept approximately constant across experiments. This was verified during the experimental runs where the range of flow conditions that occurred during a single experiment was similar to the variability in conditions seen across experiments. This flume is thought to represent the simplest possible physical model of collision-driven bed-load transport. A diagram of the experimental setup can be seen in Fig. 1. The experiment is very similar to that used by Ancey et al. (2008). This is intentional so that their results can guide our study and our findings can be compared to their data.
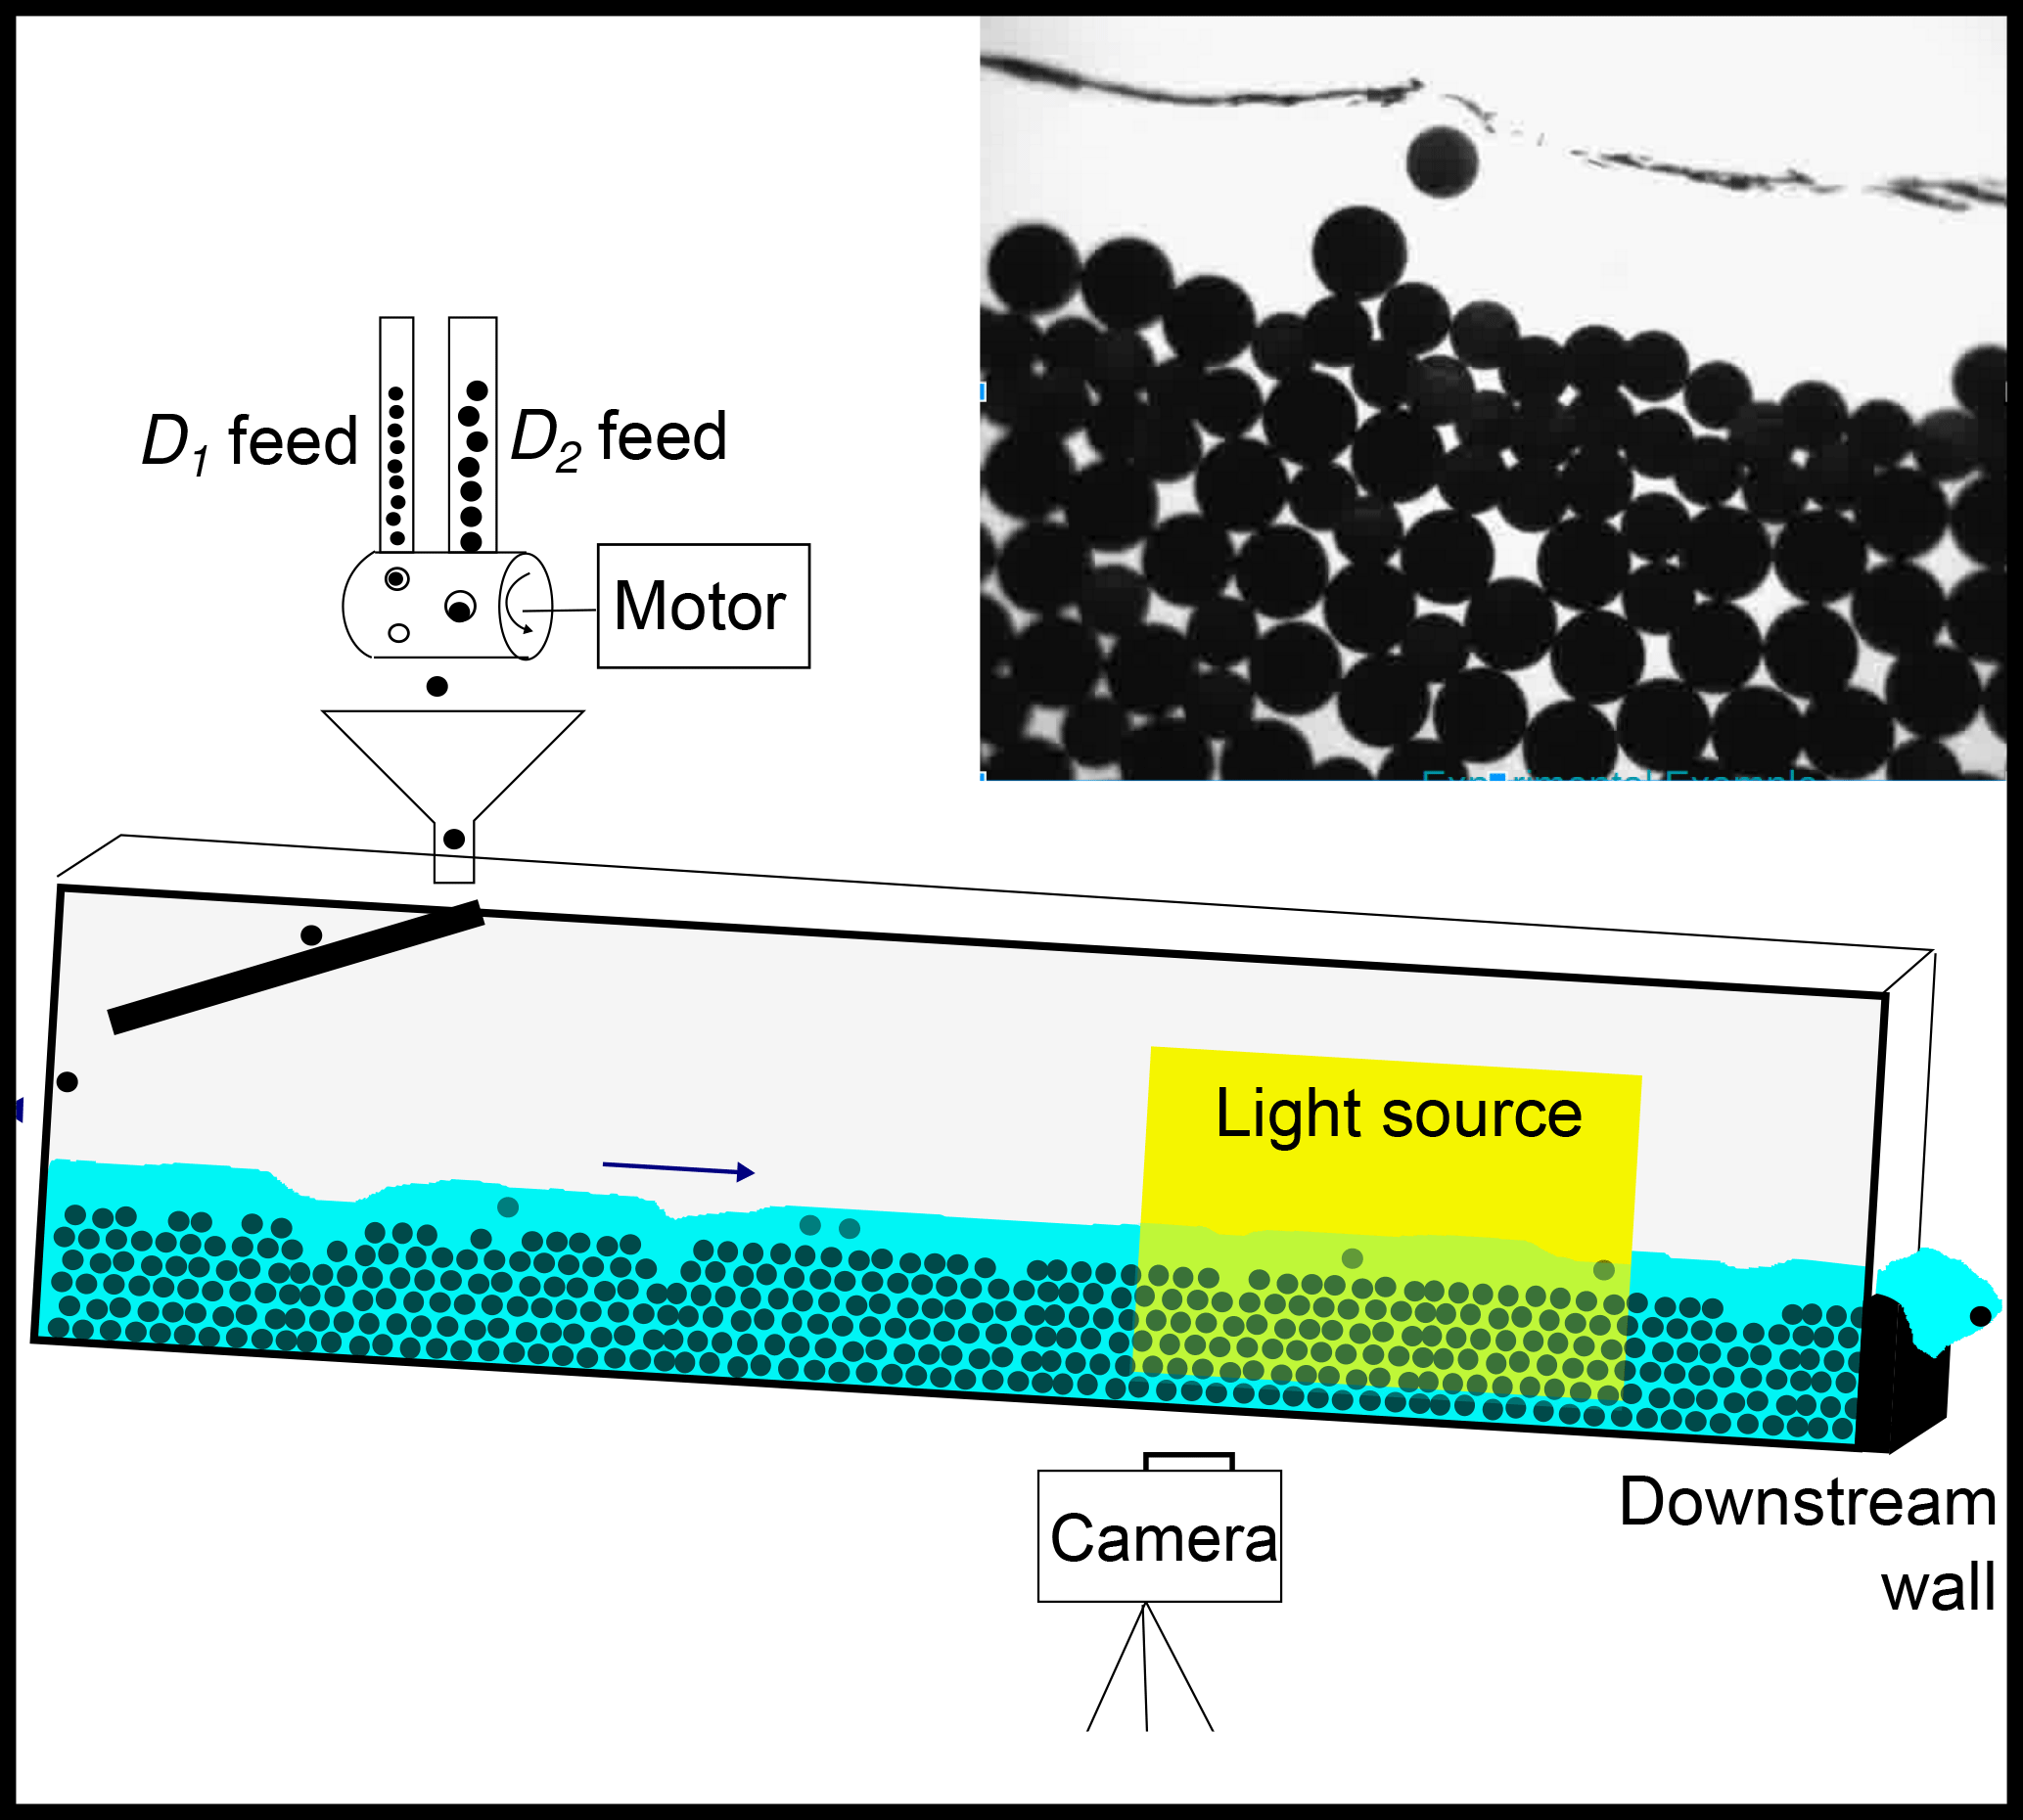
Figure 1Schematic of the experimental setup. The system is 2.3 m long and 20 mm wide. This quasi-two dimensional channel is fed at a constant water discharge for all experiments. The slope is kept constant at 6 %. The sediment feed is uncoupled from the fluid discharge and is introduced from above using a custom-designed feeder built at the Penn Sediment Dynamics Laboratory (PennSeD) laboratory. A viewing window of approximately 35 cm wide by 30 cm high is selected two-thirds of the way down the flume. The window is backlit and the resulting images can be seen in the figure inset.
A camera is situated approximately 100 cm downstream of the flume inlet. The viewing window of the camera is 35 cm for all experiments. This section of the flume is backlit using a white LED panel array that outputs at 300 lumen. This produces a sharp silhouette of all the grains in the viewing window that can then be used to acquire approximate particle centers. Images are acquired at a rate of 120 fps and streamed continuously to a computer. This acquisition rate is necessary to adequately capture the trajectories of individual particles as they move through the viewing window.
2.2 Data acquisition and analysis
Once images are acquired, approximate particle centers are located using a hybrid form of the algorithms outlined in Khan and Maruf (2013) and Parthasarathy (2012). Using this method it is possible to obtain particle centers that are accurate to better than 1 mm. However, the method is highly sensitive to the degree of occlusion that the particles in the bed experience, and thus centers can sometimes be less accurate. Once particle centers are obtained, particles are linked together from image to image to obtain particle trajectories using the method outlined by Crocker et al. (1996). An example trajectory that is the final output of this process can be seen in Fig. 2.
With a particle trajectory affixed to each particle that enters and leaves the viewing window, it becomes possible to analyze the dynamics of mobile particles over a wide variety of timescales. Emigration events sampled in the viewing window are also easy to obtain from these trajectories. Emigration series are obtained by choosing a fixed along-stream distance, x, to sample along the viewing window for all experiments in question. If a particle center crosses this position in the downstream direction, it is counted as a positive emigration event. If it crosses this position in the upstream direction, it is counted as a negative emigration event. This definition is identical to that used in Ma et al. (2014). To study the active particles within the viewing window, it was necessary to set a threshold for particle mobility. To do this, particle trajectories were analyzed over 1∕10 of a second. If the particle was displaced 2.4 mm within this time window, then the particle was deemed to be mobile.
Particle transport is sampled at a fine enough timescale that emigration is binary; there are either 0 or 1 particle(s) passing the sampled line at any instant in time, making the time series of transport highly intermittent. One approach to estimating the intermittency of the series of emigration events obtained during an experiment (see Fig. 4) is to look at how long one needs to sample to arrive at a threshold standard deviation. In the case of a uniform, low-intermittency time series, this sampling timescale will be very short, whereas in the case of a highly intermittent series, a long sampling time will be needed. This timescale is referred to throughout the rest of the paper as tconv. It is computed directly from the obtained emigration series for all of the driving frequencies studied, by incrementally increasing the time, τ, used to sample from the emigration series. For a given τ, 500 samples from the emigration series are randomly resampled from the emigration series in question using a bootstrap technique. The standard deviation of these samples is then computed and normalized by the mean emigration rate for the samples taken from the series. As τ grows, the standard deviation approaches the value chosen as the threshold standard deviation, tconv. When the threshold standard deviation is reached, this value is interpreted as tconv. This approach is identical to that used in Houssais et al. (2015).
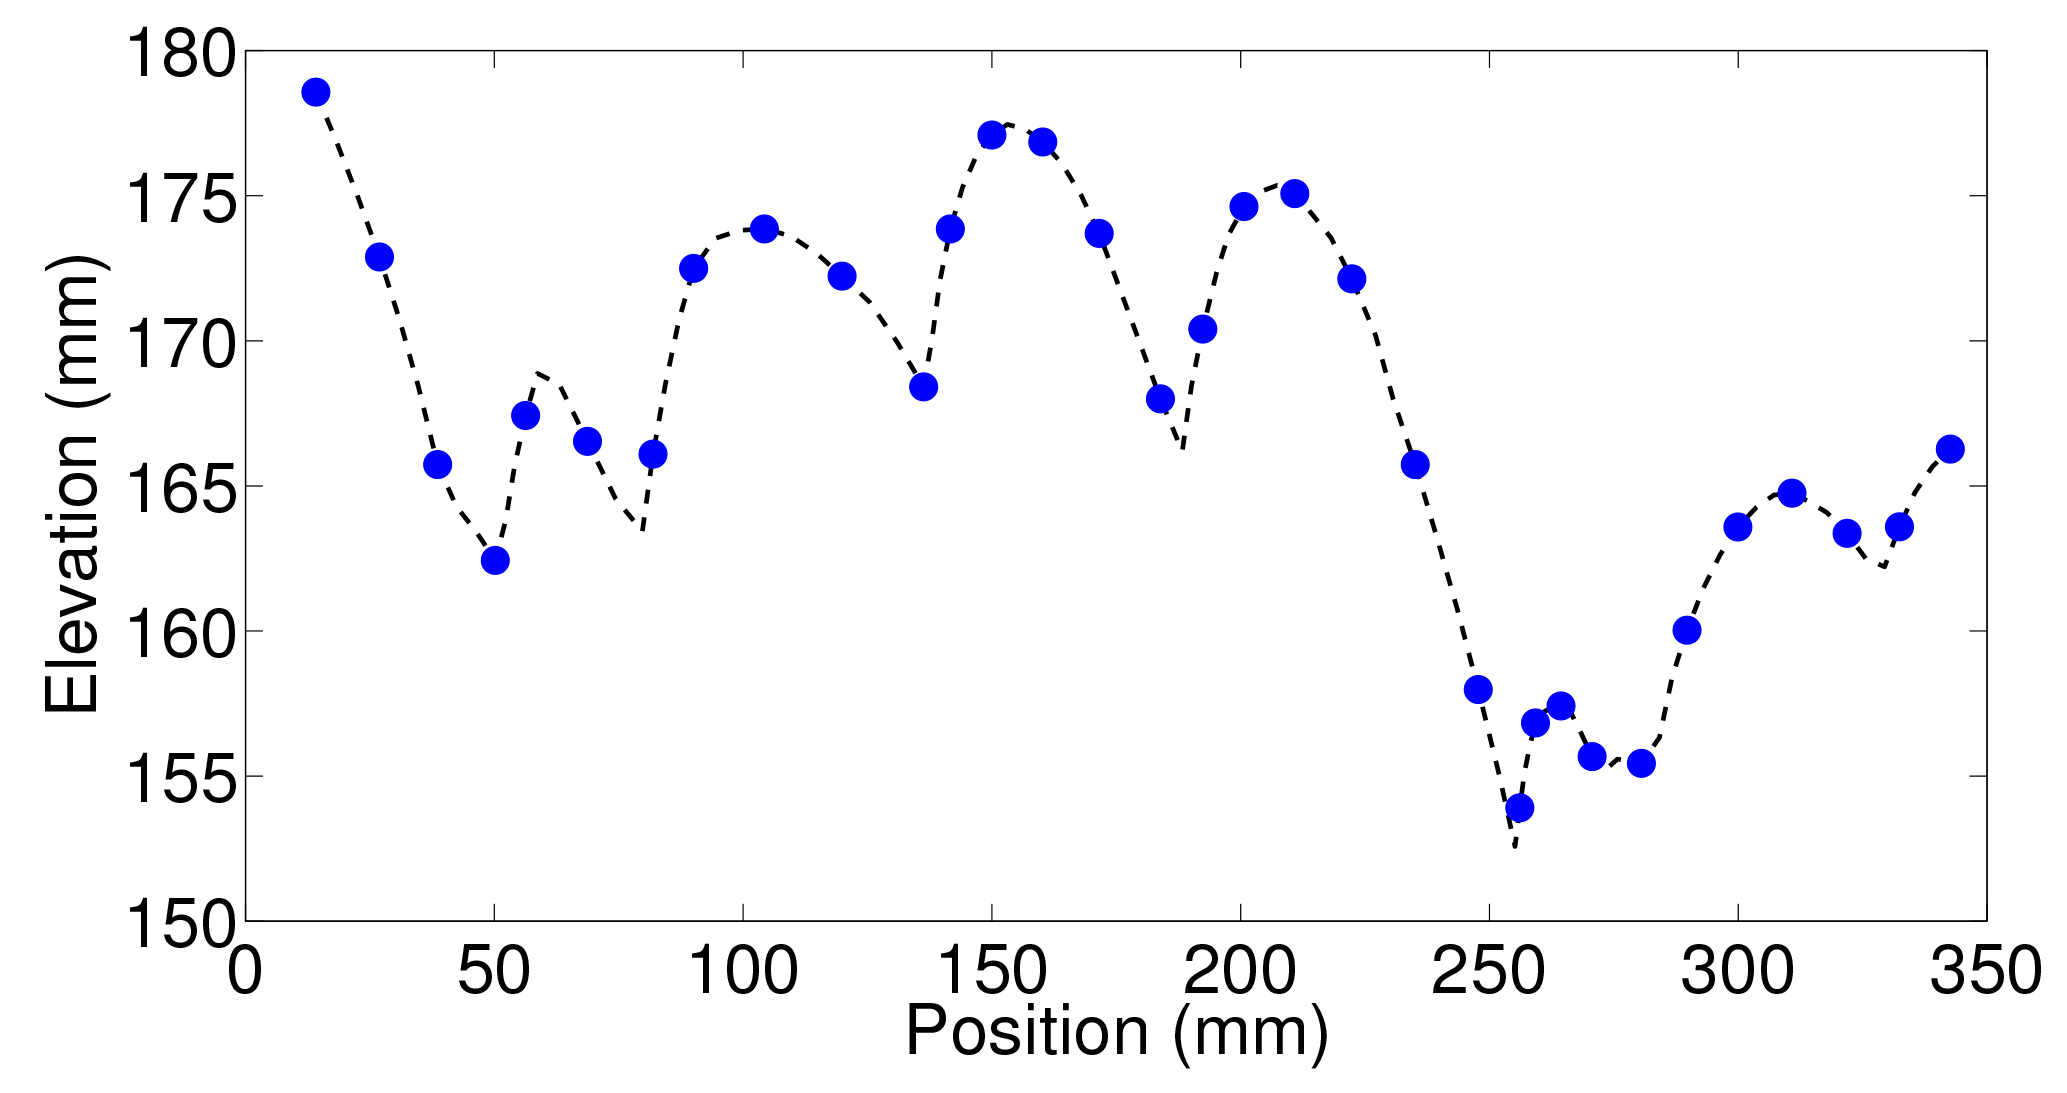
Figure 2An example saltator trajectory obtained during the experimental run with a sediment feed rate of 40 MPM; hydraulic conditions listed in Table 1. Trajectories are created for all particles present in the sampling area of the experiment.
Waiting times are sampled from the emigration series as well. They are interpreted to be the time periods in between active emigration events over position x. A waiting time period is started after an emigration event over position x occurs, and it ends when the next emigration event happens.
Activity within the whole viewing window sampled in the experiments is characterized in the paper through two different event-based metrics. One type of event is referred to specifically as a “collective entrainment event”. This is defined as a group of one or more mobile particles (mobility was determined using the criteria above) moving within one large-grain diameter of each other. This analysis is a simplified version of that used to identify mobile clusters in Keys et al. (2007). An example of a collective entrainment event is given in Fig. 3. In this example, the four large grains that are in color would be considered a collective entrainment event. Collective entrainment events were identified directly from analysis of the mobile particle trajectories sampled in the viewing window for a given experiment. For a given time step, all N mobile grain trajectories were identified. For i=1 to i=N, the distance of the ith mobile grain to all the rest of the mobile grains was computed. A clustering algorithm was then employed to identify clusters of grains that were within a threshold distance of one another. This algorithm is capable of identifying an arbitrary number of mobile clusters occurring at the same time within the viewing window. A single mobile cluster of grains is defined as a collective entrainment event. This cluster analysis was performed for the entirety of the time steps available for a given experiment. This allowed us to gather statistics of all of the collective entrainment events that occurred in the viewing window for a given experiment.
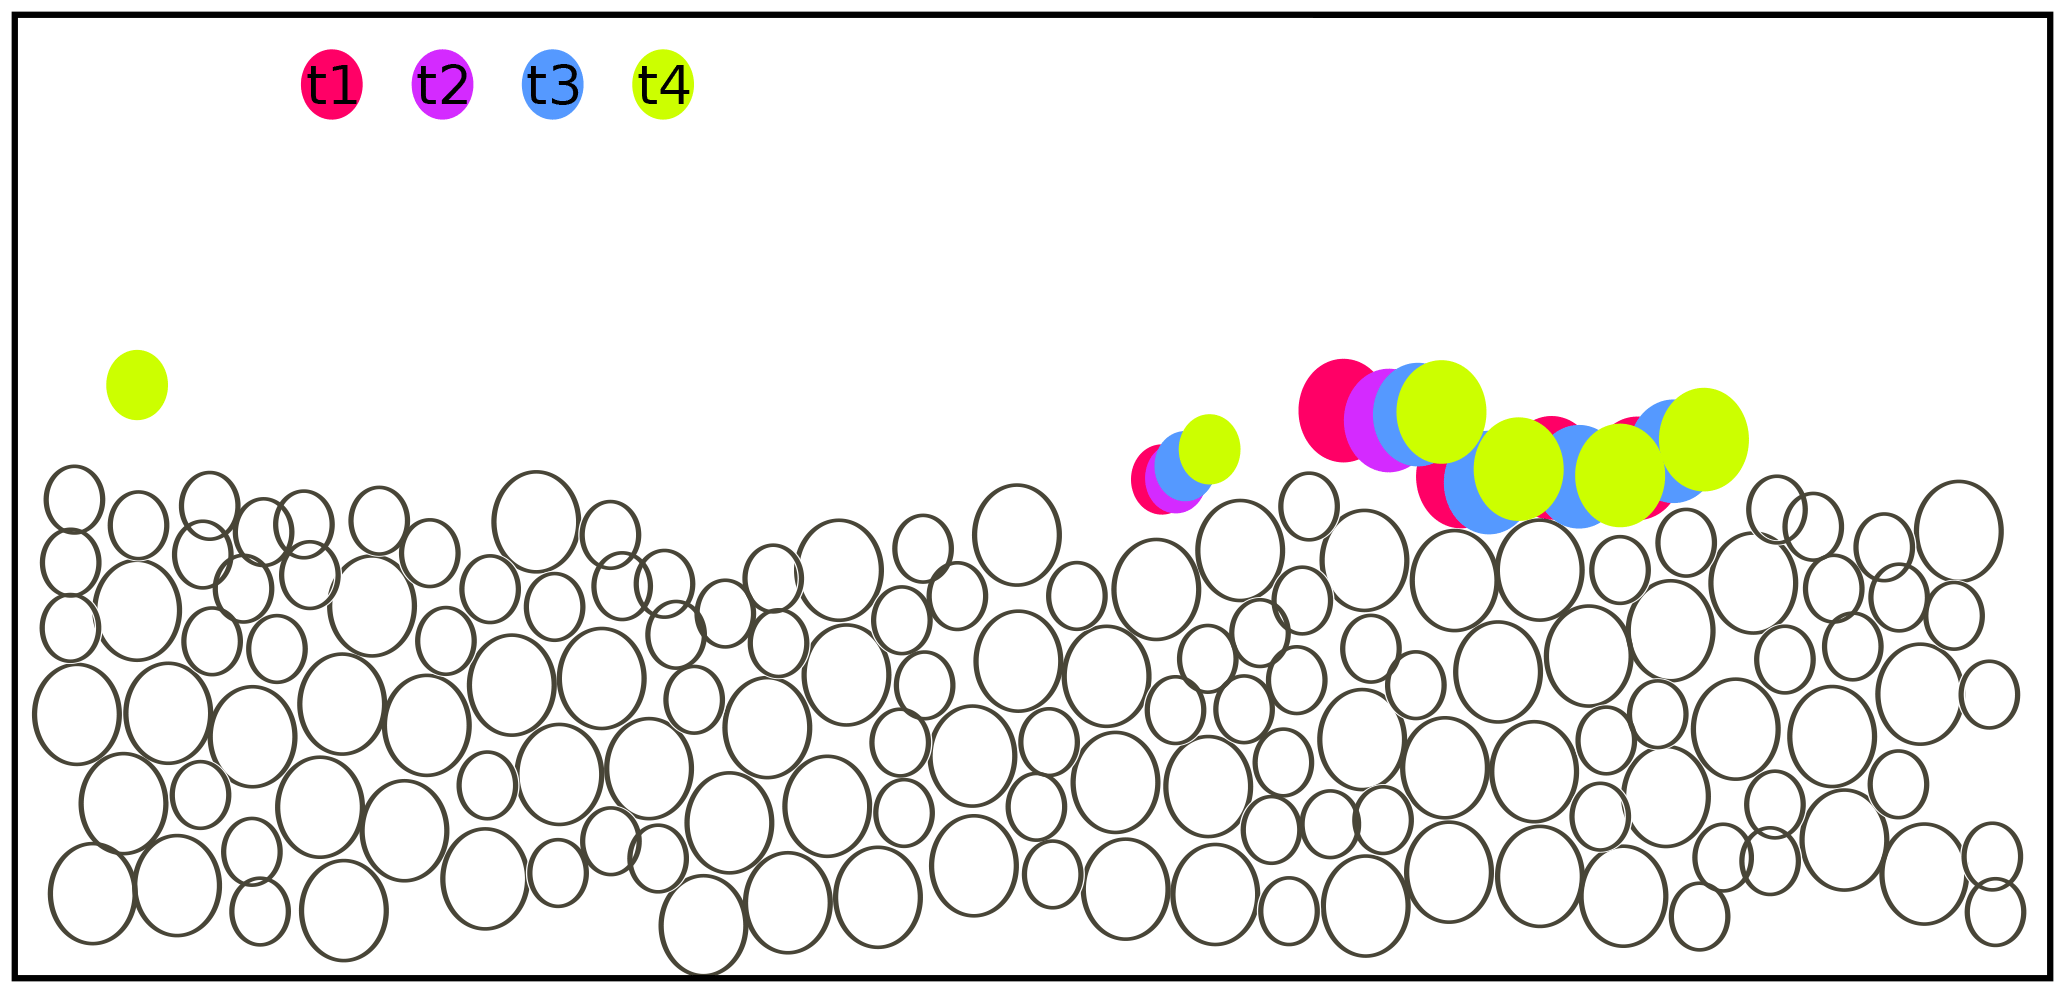
Figure 3Schematic side view of the experiment showing an example of a collective motion event, sampled at four different times during the event. Black circles are outlines of non-moving particles; colors correspond to particles that are displaced actively during the event and are color coded according to their position at the time step (t1, t2, etc.) as shown in the figure. At t1 only two particles are moving. The large particle collides with three particles on the bed at t2, and these three particles are displaced at t3 and t4. The four large particles would be classified as moving together collectively.

Figure 4Example time series of emigration events for Qi=40 MPM. A position x along the bed viewing window (as seen in Fig. 1) is monitored during the experimental run. When a particle passes position x, it is considered an emigration event. This is a simple measure of particle activity that can be converted into a time-averaged flux. Time series of emigration sampled at a fixed position x along the bed were determined for all experimental runs.
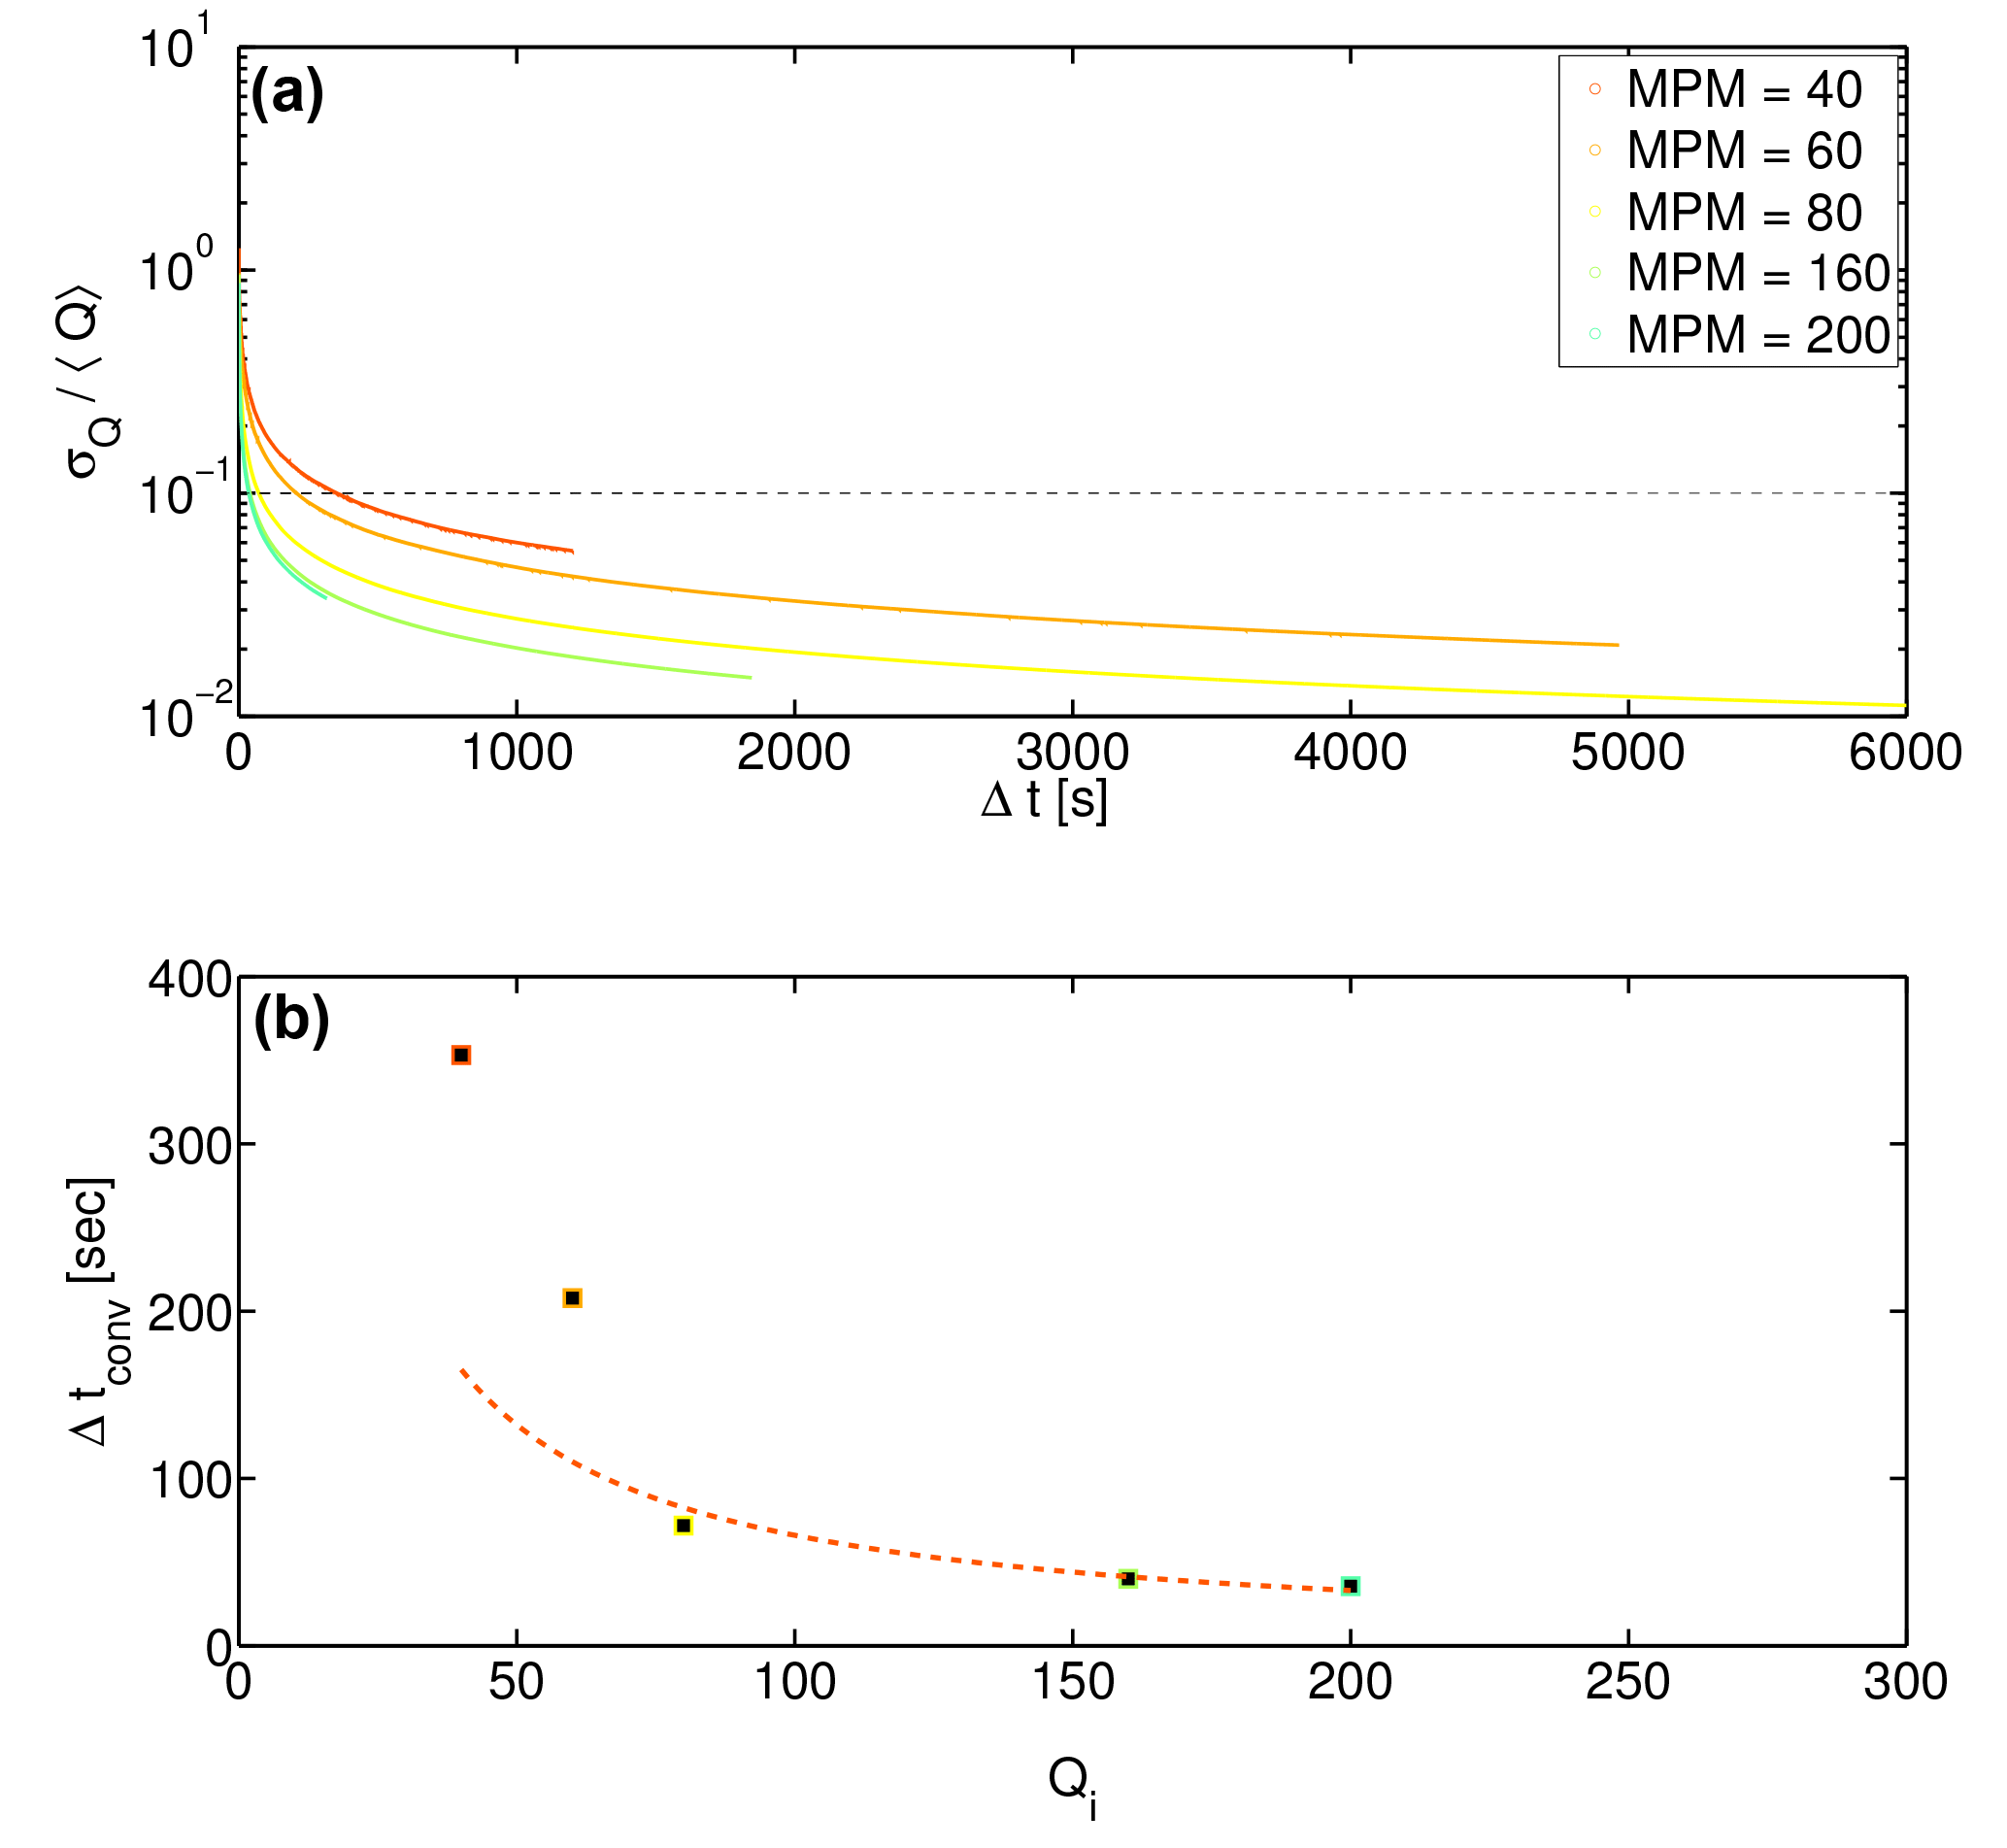
Figure 5Determination of convergence time for experiments at all driving rates. (a) Standard deviation of an ensemble of samples over a given Δt. As Δt grows, the standard deviation decreases and approaches the threshold standard deviation. This value of Δt is interpreted to be the convergence time tconv. The standard deviation is normalized by the mean emigration rate Q. The legend indicates the feed rate in marbles per minute (MPM). (b) The time Δtconv necessary for flux measurements to converge to a threshold standard deviation of 10 %, as a function of the driving frequency in number of marbles per minute. The dotted markers are the actual observed convergence times, while the dashed red line displays the trend that one would expect the convergence time to take if it were simply a function of the feed frequency (; see text for details).
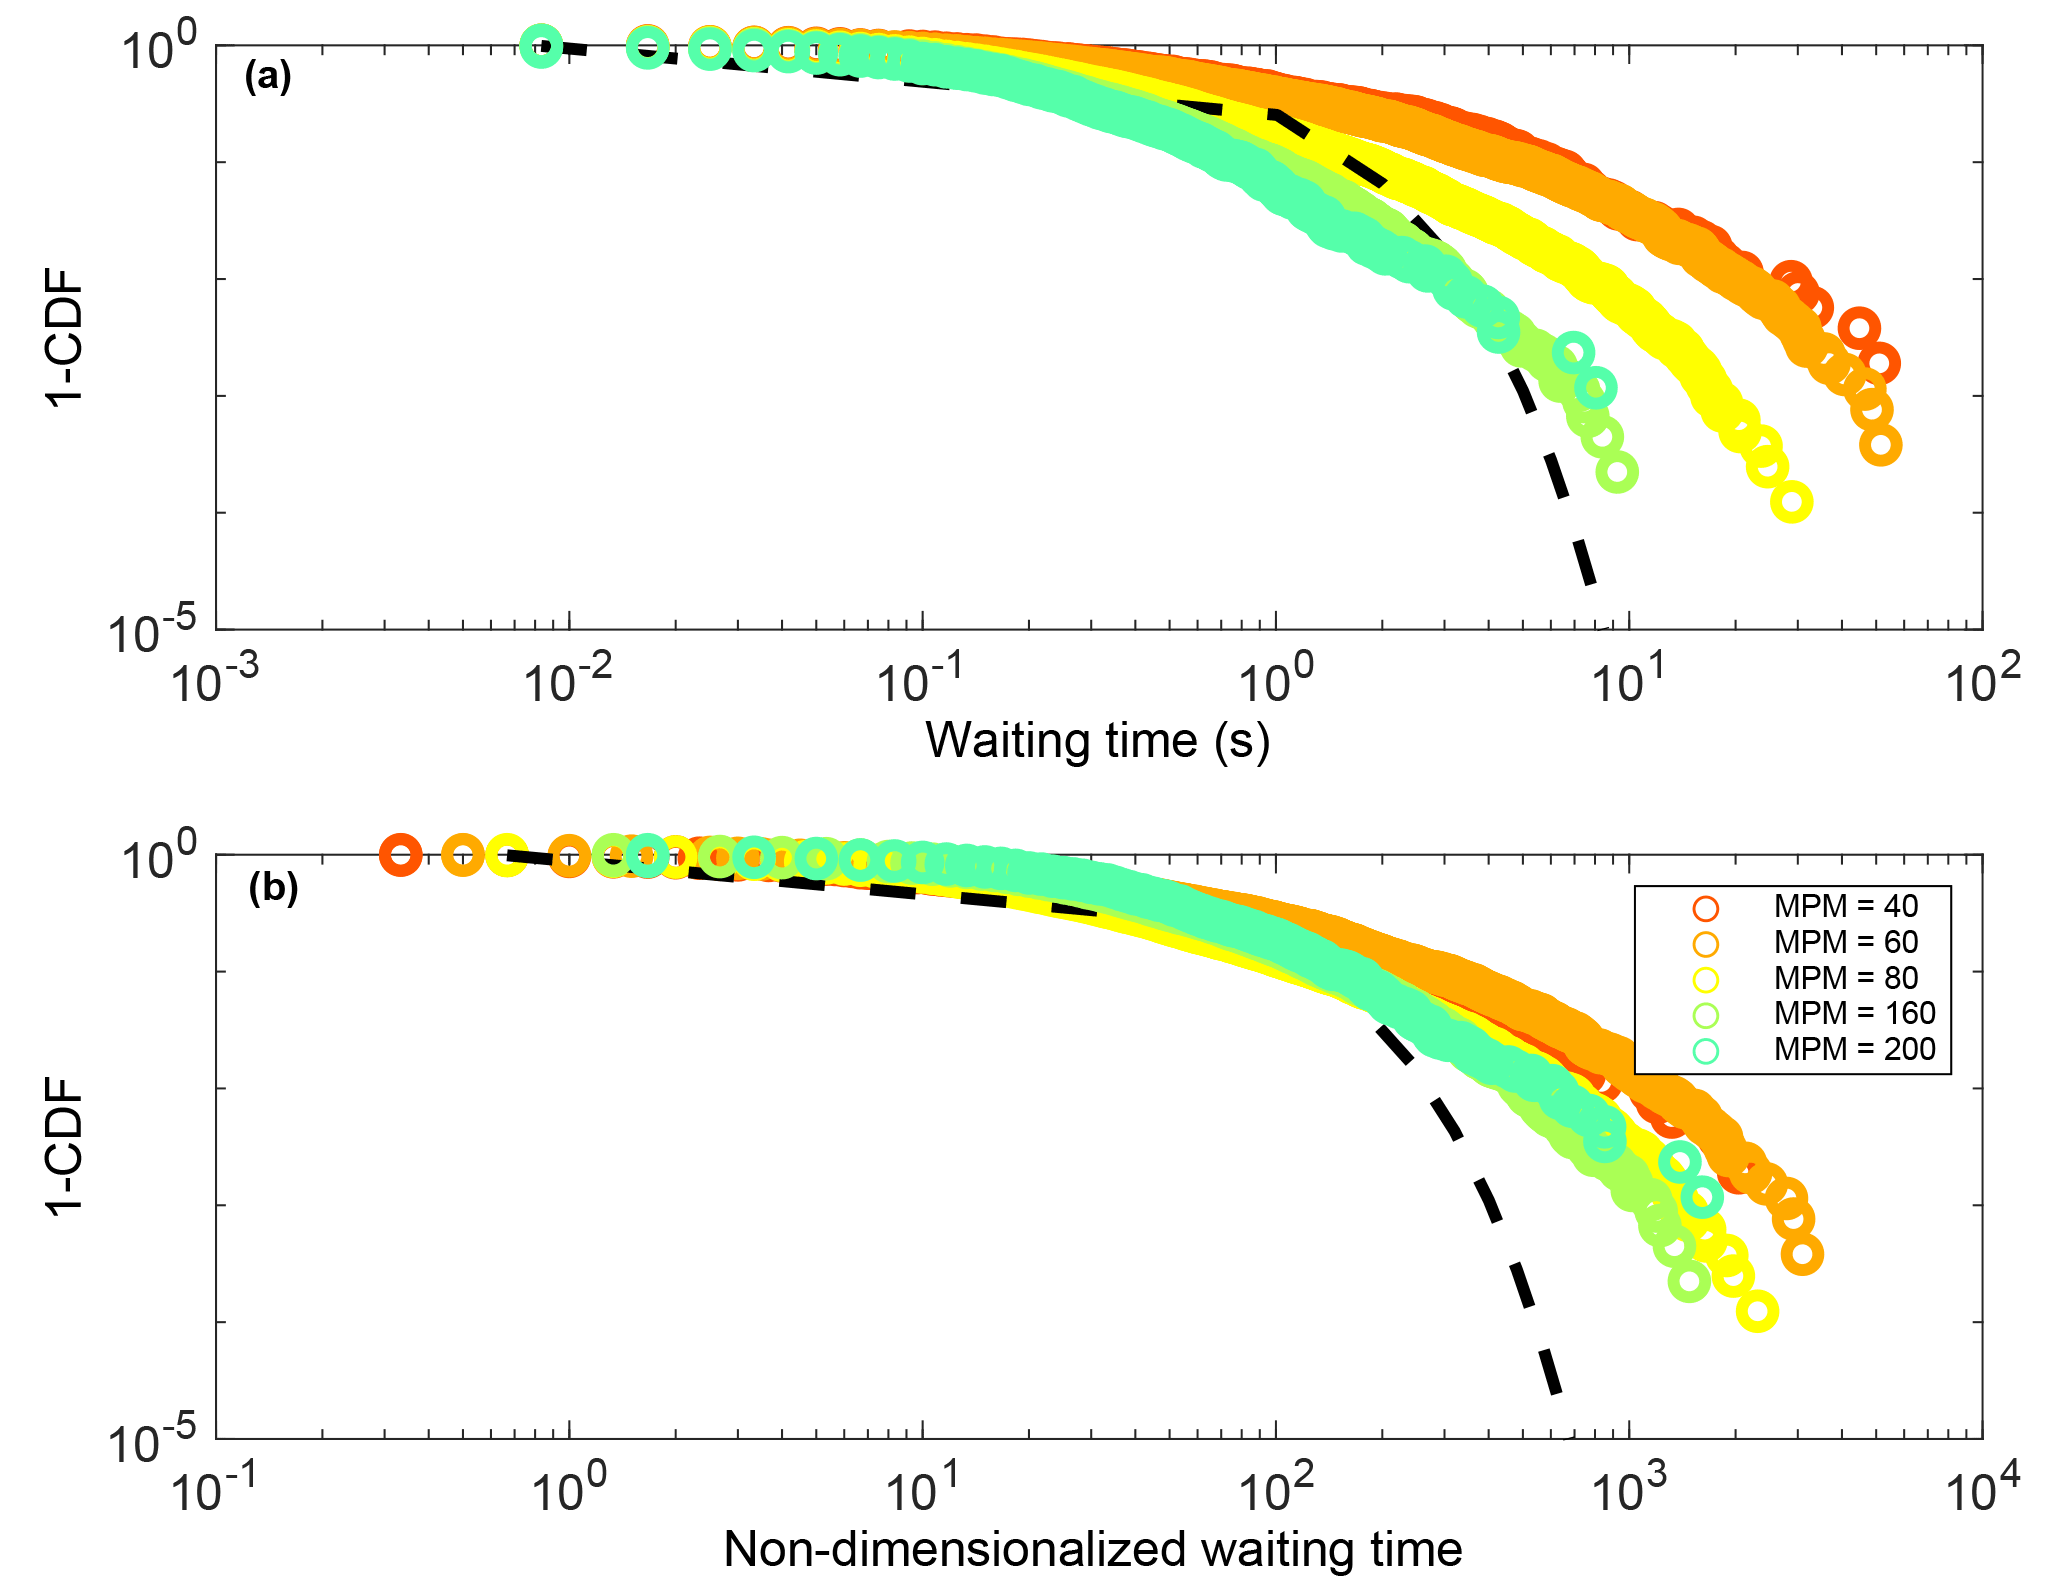
Figure 6Complementary cumulative probability plots of waiting times between emigration events; (a) data for all experiments and (b) the same data normalized by the driving frequency of each respective experiment. Expectation from an exponential distribution is shown for comparison with dashed line. Legend as in Fig. 5.
The other type of event is a “transport event”; it is more general and contains collective entrainment events within it as a subset. It is defined as a time period where there is at least one mobile grain within the viewing window. As long as this is the case, an event is said to be taking place. Once there are no mobile grains within the viewing window, then the transport event has stopped. A portion of a transport event is pictured in Fig. 3. Here, all the grains that are colored are considered to be part of the current transport event that is taking place. It is possible to see that there are time instances in Fig. 3 where collective motion is not occurring but particle activity is still ongoing. These time instances with no collectively moving particles would be counted as part of a transport event but not as part of a collective motion event.
To analyze the effects of impacts during events, saltating grains were separated from the rest of the mobile population for a given event. The x and y components of the saltator trajectories were then numerically differentiated twice to obtain acceleration components which were then converted to magnitudes of grain accelerations through time. A change-point detection algorithm was then employed to identify the spikes in the acceleration series representative of impact events.
We computed Δtconv for all driving rates used in the present study and found that it declines monotonically with increasing feed rate (Fig. 5a). A simple expectation for the decrease in the averaging time is that it should be proportional to the inverse of the driving frequency; that is, , where a is a scaling parameter that depends on the percent standard deviation threshold chosen to determine tconv. This relation can be thought of as marking the growth in time required to count a fixed number of particles emigrating past a line if driving frequency were the only thing that mattered. This should be the case at high transport rates where we expect smoother transport; accordingly, we choose a=110 such that the relation matches the observed data for the highest feed-rate experiment. We see that the inverse relation describes the convergence time reasonably well for the three highest feed-rate experiments (Fig. 5). For the two slowest feed rates in the study, however, the actual increase in averaging time with a reduction in Qi is more rapid than this expectation.
The waiting times between all observed emigration events for a given experiment were sampled and used to compute empirical complementary cumulative distributions (Fig. 6a). We compare these distributions to an exponential distribution with a value λ=1, which is on the order of the mean waiting times seen in the experiments. The exponential distribution is expected for a Poisson process and was chosen for comparison because of the extensive body of literature showing its fitness for modeling uncorrelated random processes (Lawler and Limic, 2010). If the waiting times were uncorrelated and truly random, they should follow an exponential distribution; however, the measured waiting times decay much more slowly (Fig. 6a). As expected, the waiting times between emigration events seem to be a function of the driving frequency. When the former are non-dimensionalized by the latter, the variance among the experiments is significantly reduced (Fig. 6b). Moderate dispersion remains among the different experiments, however, indicating that driving rate is not the only factor controlling the waiting times. We compute the average waiting time for each experiment; the naive expectation is that this waiting time is precisely the inverse of the driving frequency. The data follow this expectation for the three highest driving frequencies; however, the mean waiting times for the two slowest-driven experiments are significantly larger than expected (Fig. 7).
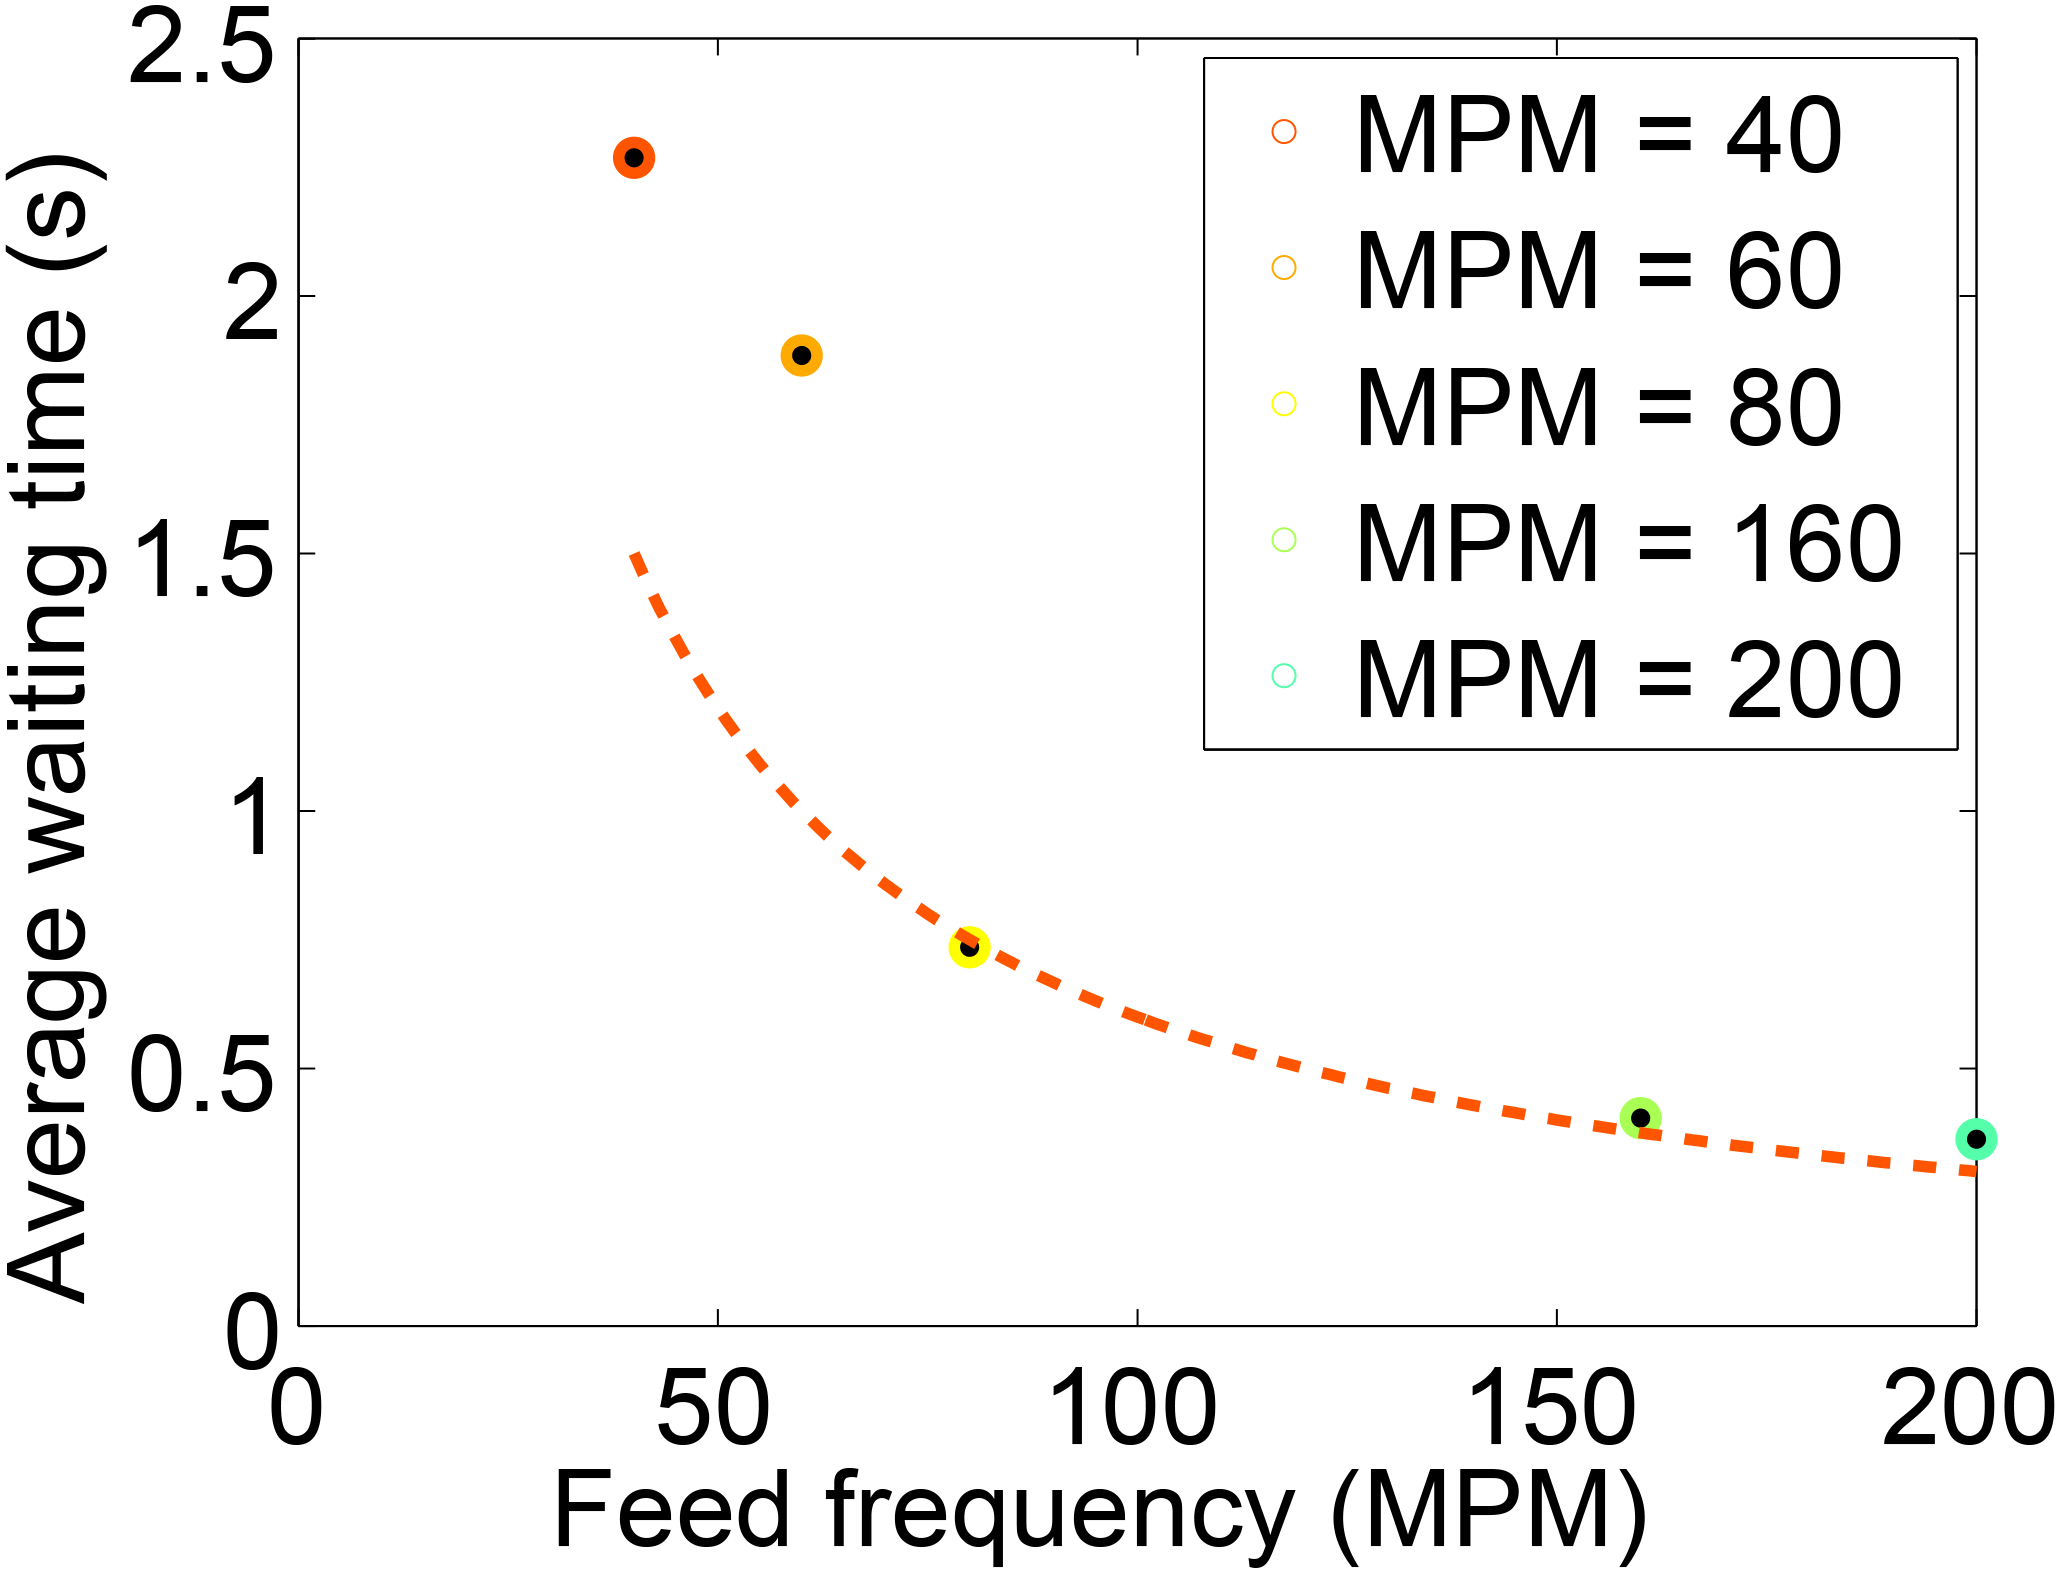
Figure 7Relation between the driving frequency finput and mean waiting time between observed emigration events W for each experimental run. Note the full waiting time distributions for all experiments are shown in Fig. 6. The dashed red line shows the expected relation that the mean waiting time is the inverse of the driving frequency, .
The above results demonstrate that driving frequency has a strong effect on the timing of emigration events and the timescale required for averaging. To determine if this frequency also effects how particles are transported, it is necessary to look at the particle kinematics during times when particle activity is present. We examine here the complementary cumulative distributions of particle speed for all experiments (Fig. 8). The speed of a given particle is computed as , where up and wp are the respective horizontal and vertical components of the particle velocity. The tails of the speed distributions do not vary strongly as a function of driving frequency. This is sensible as the slow speeds (<0.1 mm s−1) are associated with essentially immobile particles, while the fast speeds (>100 mm s−1) are almost exclusively associated with saltators. As the fluid discharge is kept constant across experiments, we do not expect to see large differences in the speed of saltating grains. We do see an effect of driving frequency, however, for the intermediate speeds (Fig. 8). As the driving frequency declines, the transition between mobile (fast) and immobile (slow) particles appears to grow more abrupt; this is manifest as a growing kink in the curves. In other words, the distribution of particle speeds is more continuous at high driving frequencies and becomes more bimodal at low driving frequencies as motion separates more distinctly into slow and fast particles.
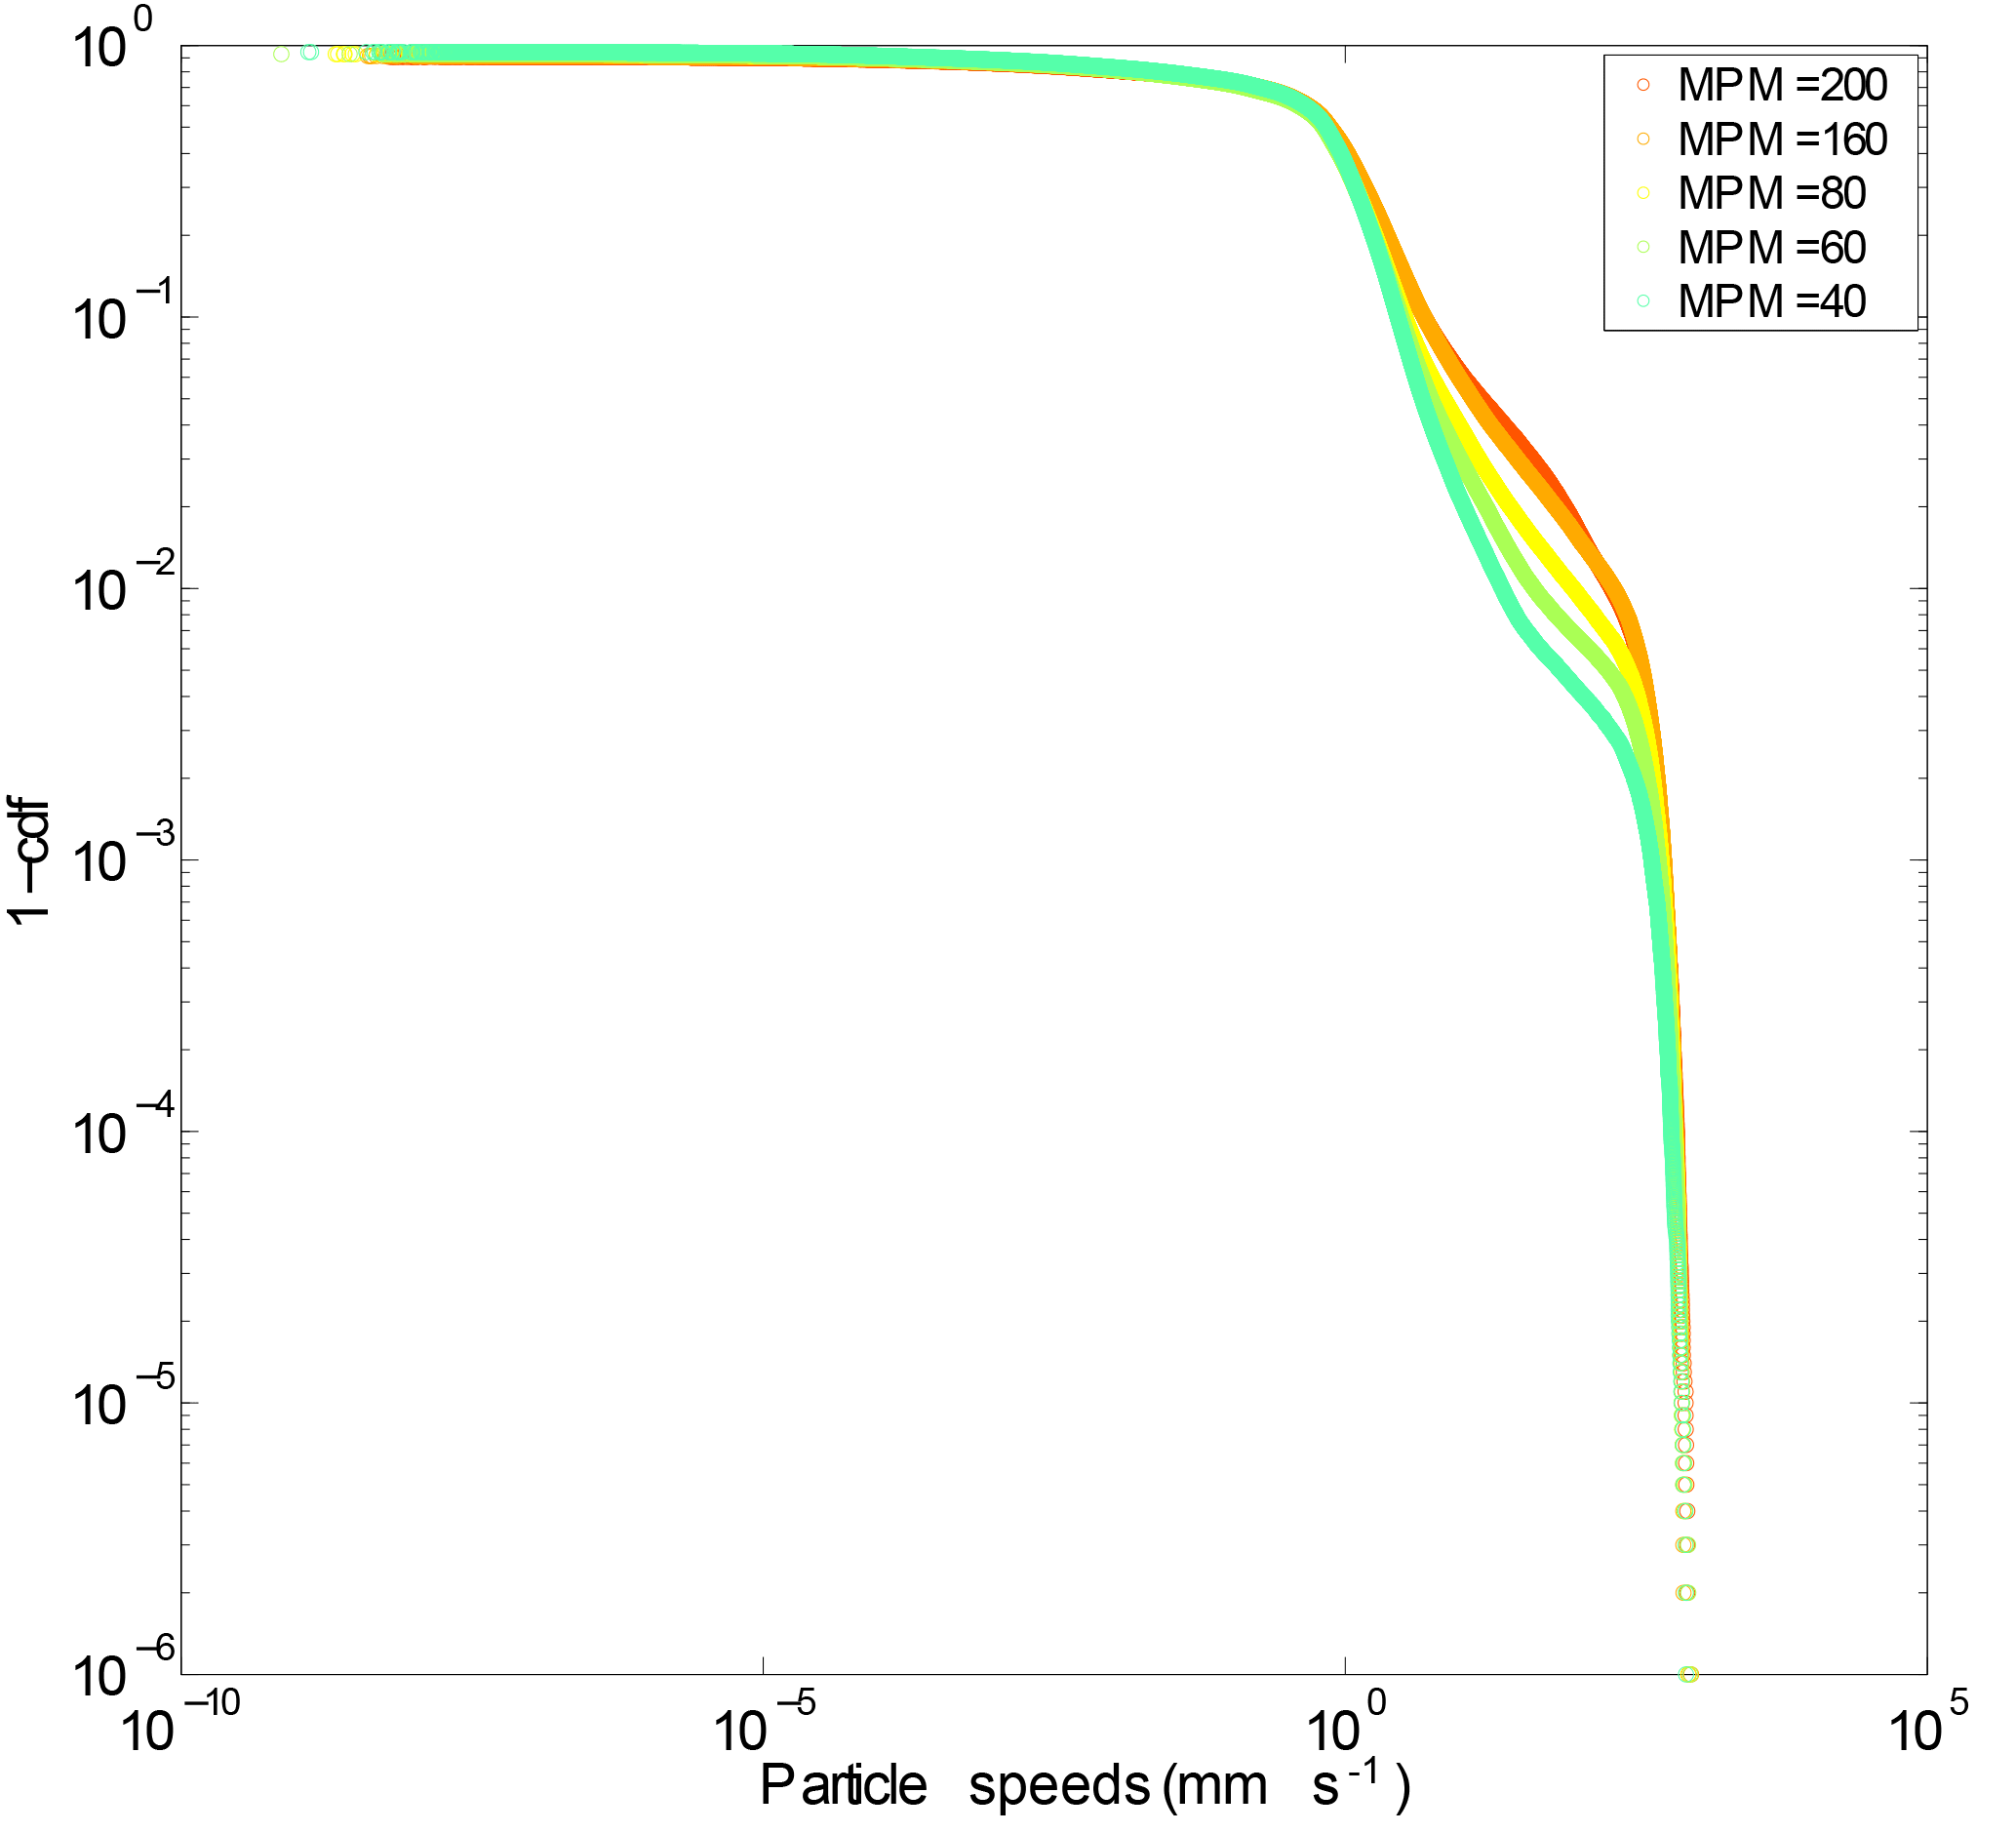
Figure 8Complementary cumulative distributions of active particle speeds for all experiments. Legend as in Fig. 5.
Thus far, we have examined the motion of individual particles. Here, we consider collective entrainment events – in particular, the size distribution of particles that have been determined to be moving together. These mobile clusters are analogous to avalanches in other granular systems, although here they are restricted to a thin surficial layer of grains. Interestingly, the distribution of mobile clusters does not vary significantly with driving frequency (Fig. 9). All experiments show a roughly exponential distribution of cluster sizes, with a mean size that varies only slightly with driving frequency.
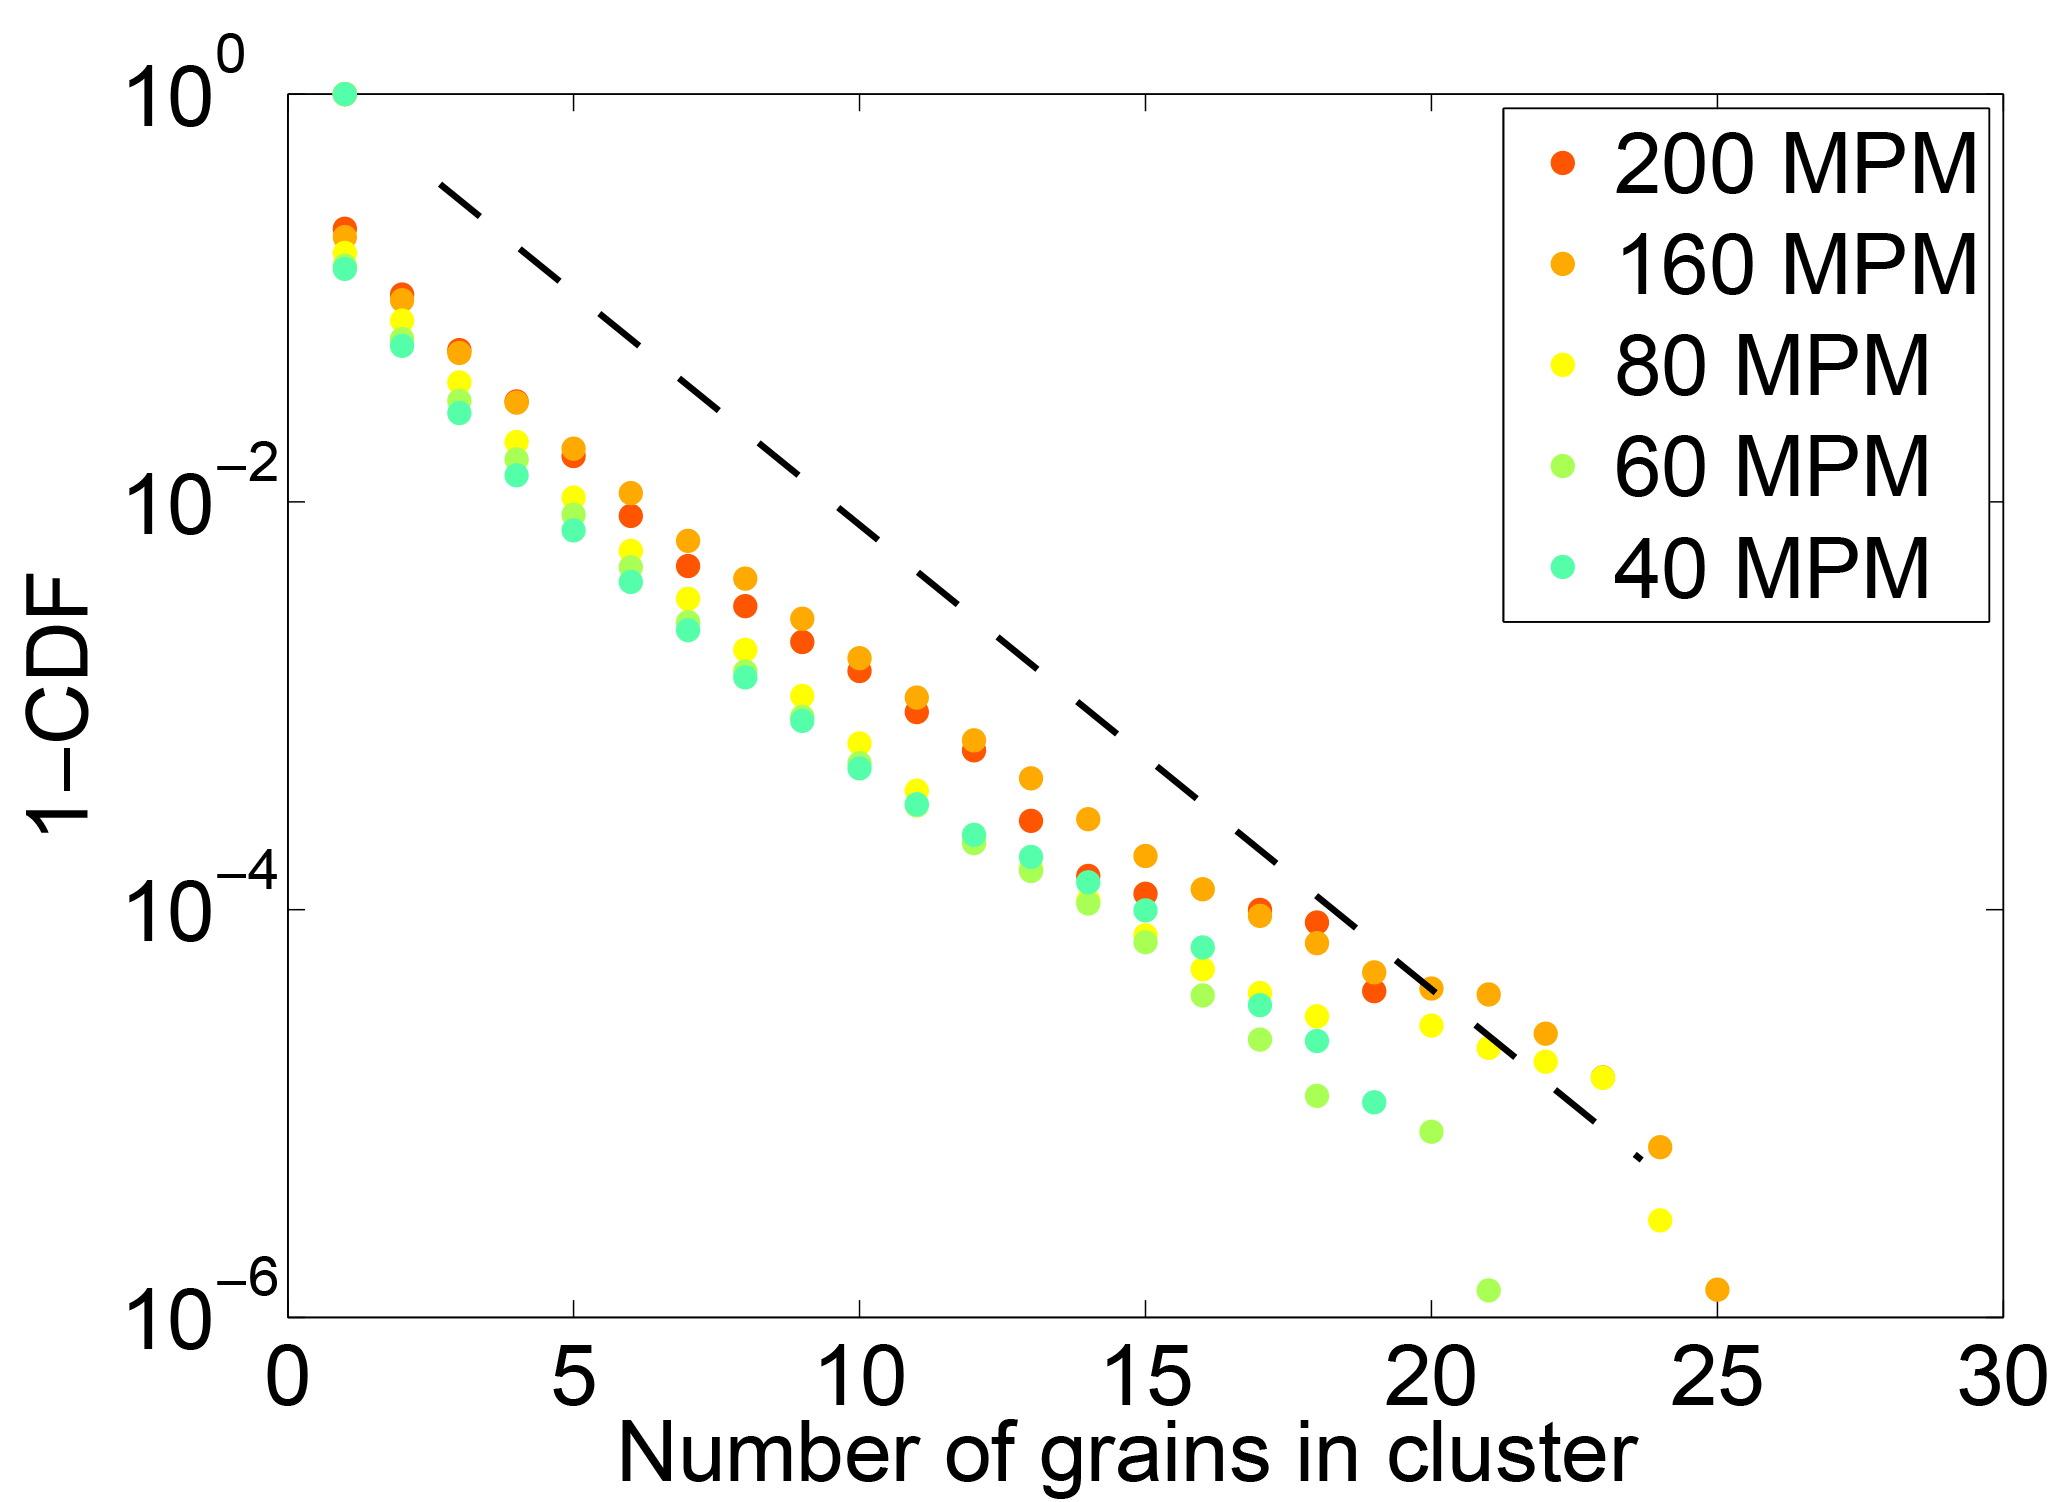
Figure 9Complementary cumulative distributions of mobile cluster sizes, for each experiment at a different driving frequency. A cluster is defined as a group of mobile particles moving together in space. The dashed black line is an exponential trend, plotted for the sake of comparison. Note logarithmic y axis.
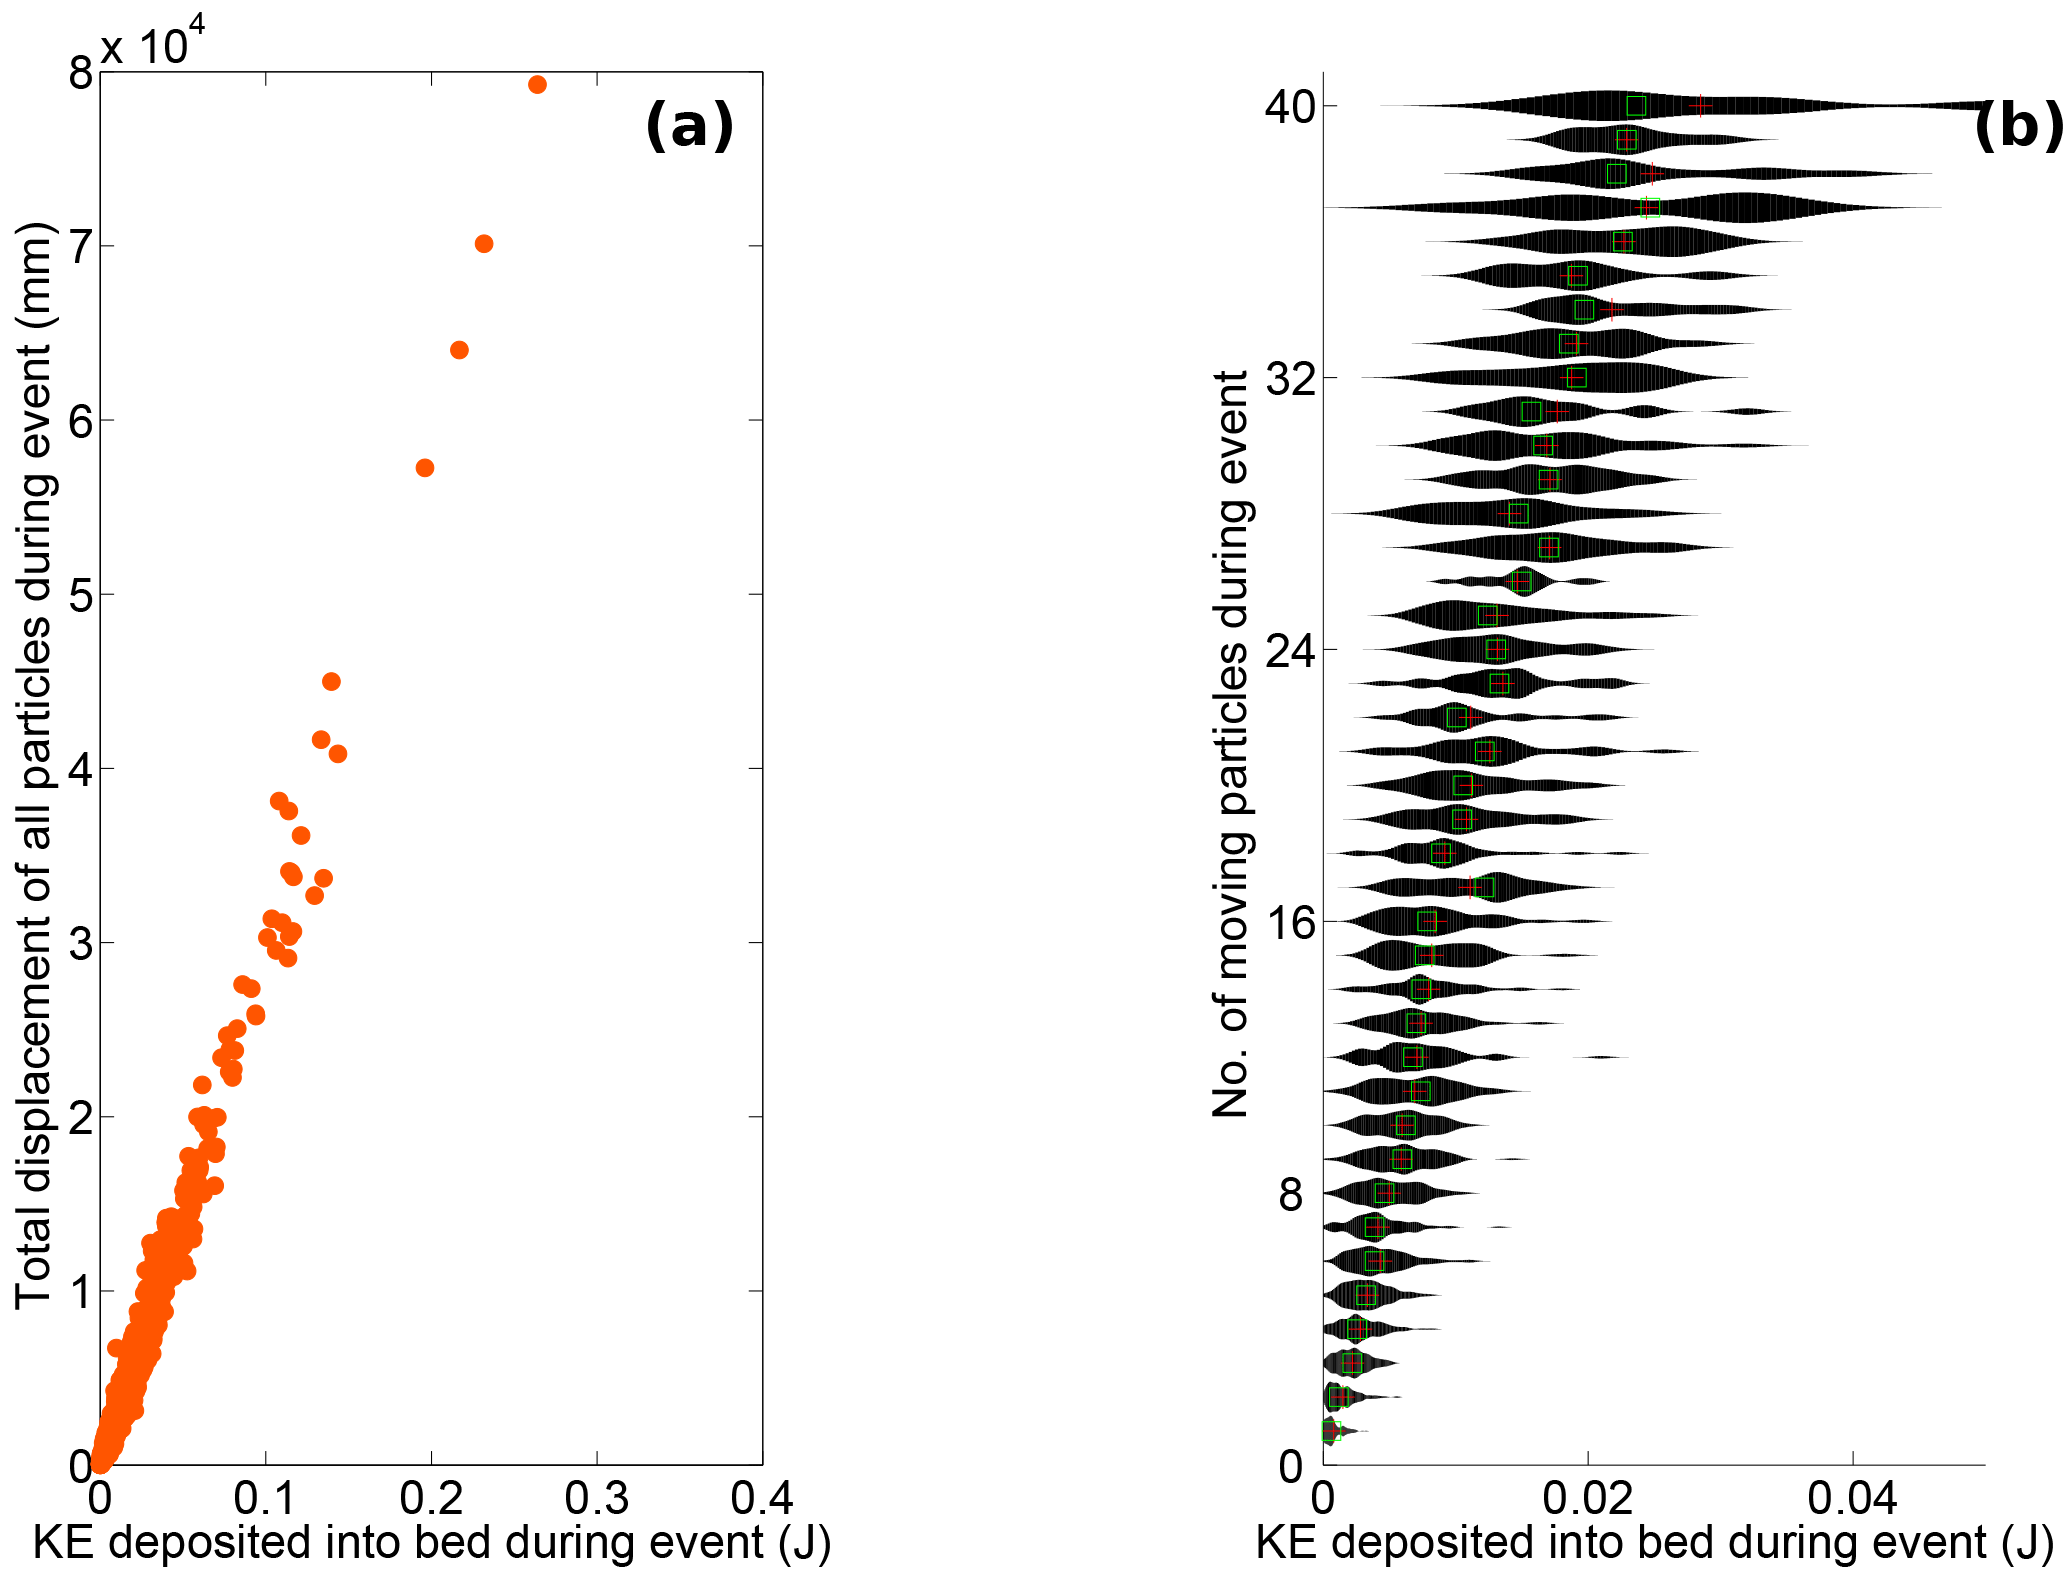
Figure 10Particle mobility as a function of kinetic energy (KE) deposited in the bed for an event. (a) Cumulative displacement for all mobile particles during an event increases linearly with KE deposited. (b) Probability distribution of the amount of deposited KE necessary to entrain a given number of mobile particles. The mean of the distribution is displayed as a red cross, and the medians are shown as green squares.
We observe qualitatively that almost all entrainment is associated with impacts. However, the exact nature of this relationship is extremely difficult to untangle for individual entrainment events. Entrainment can happen immediately after an event or after an unpredictable time delay. In addition, because the disordered bed absorbs and transmits momentum in a complex way, a particle can be entrained as a result of an impact that happened a significant distance (≫D) upstream. To avoid these issues, while still gaining insight into the effects of impacts on entrainment, an attempt to look at all impacts for a given period of particle activity in the observational window of an experiment was performed. An event was defined as a period where at least one particle was always mobile. Once all particles in the observation window become immobilized, the event is deemed to be over (see above). For a given event we computed (i) the amount of kinetic energy (KE) deposited in the observed section of the bed, (ii) the cumulative displacement of all mobilized particles and (iii) the number of particles mobilized. Here, the cumulative displacement of all mobilized particles includes the displacement of impacting saltators, which are considered to be part of the mobile population. Deposited KE was determined by identifying the points in time when an entrained saltator collided with the bed. The saltator velocities immediately before and after the collision were used to obtain the difference in KE of the saltating particle that occurs as a result of the collision. This difference in KE was interpreted as occurring because of the inelastic collision of the saltator with the bed and can be interpreted as being the kinetic energy transferred (or deposited) by the saltator into the bed. The total deposited KE for each event is the sum of the deposited KE associated with each impact observed during that event. Deposited KE is a positive value in all observed impacts; in other words, all observed impacts resulted in the impacting particle losing KE into the bed. The KE deposited, the cumulative displacement and the number of particles mobilized were compiled for all events and for all driving rates, in order to determine the extent to which particle mobility may be understood from collision energetics. The data reveal a remarkably clear, linear relation between the total KE deposited and the cumulative displacement of mobilized particles (Fig. 10a). We also see that the number of mobilized particles systematically increases with KE deposited, though there is significant variability (Fig. 10b).
For all driving frequencies, both the magnitude of collective entrainment events (Fig. 9) and the speed of saltating (fast) particles (Fig. 8) are similar. This indicates that collision dynamics do not vary significantly across the range of sediment feed rates probed here. Roughly, the intermittency of transport is controlled by the growth in the mean waiting time as the driving frequency is slowed (see Fig. 7). Changing the driving rate appears to primarily affect how quickly events happen and not the fundamental nature of entrainment. In the slowly driven limit, (collective) entrainment events are infrequent and may be considered discrete bursts in transport. As the system is driven harder, events occur more frequently and begin to overlap with one another. At the fastest driving rates, events become indistinguishable from one another and continuous transport emerges. This picture aligns with behavior seen in avalanching systems that display an intermittent to continuous transition (Hwa and Kardar, 1992; Rajchenbach, 1990). A sand pile model by Hwa and Kardar (1992) showed that overlapping avalanches may interact, introducing correlations in the flux output of the system. The observed changing distribution of particle speeds with driving rate in our experiments may be an indication of this kind of complex behavior.
While much of the difference in entrainment rate and intermittency can be related simply to the driving rate, some of it cannot. In particular, at low driving rates we see waiting and averaging times that are significantly longer than expected, suggesting that the first-order kinematic avalanching model described above is incomplete. One timescale that has not been considered is the relaxation time of avalanches, which for our experiments would be the deposition timescale of mobile clusters following an entrainment event. This timescale may not be independent of driving rate, and it becomes impossible to measure when avalanches overlap in time. Another complicating factor at low driving rates is the influence of creep, which has been demonstrated to drive bursty bed-load transport in the viscous flow regime (Houssais et al., 2015). Movies of our experiments reveal the presence of slow creep also, but quantifying its significance is beyond the scope of the present paper.
Indeterminate, complex behavior (such as the possible scenario outlined above) is often an inherent feature of many-bodied, driven and strongly dissipative systems (Regev et al., 2013). For our system of a turbulent fluid driving marbles that collide with a bed, it is not possible to predict the response of a collision. Some collisions result in a strong rebound of the saltator and no (observable) response of the bed; others drive an immediate splash as several grains are entrained; and yet others lead to a delayed response, in which a large number of grains become destabilized and slowly accelerate to become entrained. Knowledge of the kinetic energy of an impact is not sufficient to understand entrainment, due to the complicated nature of energy dissipation. Knowledge of energy dissipation, however, allows for significant predictive power. The strong relations between energy deposited and the size and cumulative displacement of entrained particles provide some mechanistic basis for understanding collective entrainment and burstiness in collision-driven bed load.
The similar size distributions of collective entrainment events across varying driving rates show that, while collective entrainment is present, its associated length scale does not vary as a function of intermittency. While more analysis remains to be done, it is likely that collision-induced momentum transfer into the bed is what sets the scale of collective entrainment. Since fluid discharge did not vary in our experiments, the velocity of saltating grains (and hence impact energy) remained roughly constant for all driving rates. The approximately constant exponential trend (Fig. 9) aligns with the expectation that momentum transfer due to saltator–bed impacts should be a primary driver of entrainment in this system. Ancey et al. (2008) were correct in positing a length scale for collective entrainment; we see definite evidence for a length scale of particle motion that is larger than that of a single particle. While this length scale does not vary in these experiments, it is challenging to extrapolate to other systems. At smaller Stokes numbers, collisions are damped and turbulence becomes an important driver of collective entrainment (Diplas et al., 2008; Nelson et al., 1995; Papanicolaou et al., 2001; Schmeeckle and Nelson, 2003; Sumer et al., 2003). The shapes and size distributions of natural particles and the roughness of the river bed (e.g., bed forms) will also likely influence collective entrainment in ways that are difficult to anticipate. Nevertheless, collision-driven entrainment should be the norm for gravel-bed rivers (Jerolmack and Brzinski, 2010), and collective entrainment has already been observed in the field (Drake et al., 1988). Incorporating this length scale into the general probabilistic framework proposed by Furbish (e.g., Furbish et al., 2012, 2017) will be important in the effort to build statistical–mechanical models of bed-load transport that start with correct assumptions of the underlying dynamics that govern bed-load particle trajectories. Understanding the scales of bursty bed-load transport will also inform the requisite times for bed-load sampling in the field and laboratory (Singh et al., 2009).
The principle data product derived from images of the experiments is particle trajectories: horizontal and vertical coordinates of particle centers through time. All trajectories used for this paper, as well as the data products generated to produce the plots in this paper, are freely available at https://doi.org/10.6084/m9.figshare.7356569.v1 (Lee and Jerolmack, 2018).
DBL conducted, analyzed and interpreted the experiments and wrote the paper. DJ supervised the research and assisted in interpreting the results and writing the paper.
The authors declare that they have no conflict of interest.
We thank Carlos Ortiz and Morgane Houssais for discussion and help with data
analysis and David Furbish and Christoph Ancey for very helpful reviews that
clarified and improved the text. This research was partially supported by the
US National Science Foundation (NSF) grant EAR-1224943 and the US Army
Research Office, Division of Earth Materials and Processes grant
64455EV.
Edited by: Jens
Turowski
Reviewed by: David J. Furbish and Christophe Ancey
Ancey, C. and Heyman, J.: A microstructural approach to bed load transport: mean behaviour and fluctuations of particle transport rates, J. Fluid Mech., 744, 129–168, 2014. a
Ancey, C., Davison, A., Böhm, T., Jodeau, M., and Frey, P.: Entrainment and motion of coarse particles in a shallow water stream down a steep slope, J. Fluid Mech., 595, 83–114, 2008. a, b, c, d, e, f, g
Bagnold, R. A.: The physics of wind blown sand and desert dunes, Methuen, London, 1941. a
Charru, F., Mouilleron, H., and Eiff, O.: Erosion and deposition of particles on a bed sheared by a viscous flow, J. Fluid Mech., 519, 55–80, 2004. a
Crocker, J., Crocker, J., and Grier, D.: Methods of Digital Video Microscopy for Colloidal Studies, J. Colloid Interf. Sci., 179, 298–310, https://doi.org/10.1006/jcis.1996.0217, 1996. a
Dade, W. B. and Friend, P. F.: Grain-size, sediment-transport regime, and channel slope in alluvial rivers, J. Geol., 106, 661–676, 1998. a
Dinehart, R. L.: Correlative velocity fluctuations over a gravel river bed, Water Resour. Res., 35, 569–582, 1999. a
Diplas, P., Dancey, C. L., Celik, A. O., Valyrakis, M., Greer, K., and Akar, T.: The role of impulse on the initiation of particle movement under turbulent flow conditions, Science, 322, 717–20, https://doi.org/10.1126/science.1158954, 2008. a, b
Drake, T. G., Shreve, R. L., Dietrich, W. E., Whiting, P. J., and Leopold, L. B.: Bedload transport of fine gravel observed by motion-picture photography, J. Fluid Mech., 192, 193–217, 1988. a, b
Einstein, H. A.: The Bed-Load Function for Sediment Transportation in Open Channel Flows, Soil Conservation Service, US Department of Agriculture Washington, DC, 1–31, 1950. a
Fathel, S., Furbish, D., and Schmeeckle, M.: Parsing anomalous versus normal diffusive behavior of bedload sediment particles, Earth Surf. Proc. Land., 41, 1797–1803, 2016. a
Frette, V., Christensen, K., Malthe-Sørenssen, A., Feder, J., Jøssang, T., and Meakin, P.: Avalanche dynamics in a pile of rice, Nature, 379, 49 pp., 1996. a
Frey, P. and Church, M.: Bedload: a granular phenomenon, Earth Surf. Proc. Land., 36, 58–69, https://doi.org/10.1002/esp.2103, 2011. a
Furbish, D. J., Haff, P. K., Roseberry, J. C., and Schmeeckle, M. W.: A probabilistic description of the bed load sediment flux: 1. Theory, J. Geophys. Res.-Earth, 117, F03031, https://doi.org/10.1029/2012JF002352, 2012. a
Furbish, D. J., Fathel, S. L., Schmeeckle, M. W., Jerolmack, D. J., and Schumer, R.: The elements and richness of particle diffusion during sediment transport at small timescales, Earth Surf. Proc. Land., 42, 214–237, 2017. a, b
Ganti, V., Meerschaert, M. M., Foufoula-Georgiou, E., Viparelli, E., and Parker, G.: Normal and anomalous diffusion of gravel tracer particles in rivers, J. Geophys. Res.-Earth, 115, F00A12, https://doi.org/10.1029/2008JF001222, 2010. a
Gomez, B. and Phillips, J. D.: Deterministic uncertainty in bed load transport, J. Hydraul. Eng., 125, 305–308, 1999. a
Heyman, J., Mettra, F., Ma, H., and Ancey, C.: Statistics of bedload transport over steep slopes: Separation of time scales and collective motion, Geophys. Res. Lett., 40, 128–133, 2013. a, b
Heyman, J., Ma, H., Mettra, F., and Ancey, C.: Spatial correlations in bed load transport: Evidence, importance, and modeling, J. Geophys. Res.-Earth, 119, 1751–1767, 2014. a
Houssais, M., Ortiz, C. P., Durian, D. J., and Jerolmack, D. J.: Onset of sediment transport is a continuous transition driven by fluid shear and granular creep, Nat. Commun., 6, 6527, https://doi.org/10.1038/ncomms7527, 2015. a, b, c, d
Houssais, M., Ortiz, C. P., Durian, D. J., and Jerolmack, D. J.: Rheology of sediment transported by a laminar flow, Phys. Rev. E, 94, 062609, https://doi.org/10.1103/PhysRevE.94.062609, 2016. a
Hwa, T. and Kardar, M.: Avalanches, hydrodynamics, and discharge events in models of sandpiles, Phys. Rev. A, 45, 7002–7023, 1992. a, b, c
Jerolmack, D. J. and Brzinski, T. A.: Equivalence of abrupt grain-size transitions in alluvial rivers and eolian sand seas: A hypothesis, Geology, 38, 719–722, 2010. a, b
Keys, A. S., Abate, A. R., Glotzer, S. C., and Durian, D. J.: Measurement of growing dynamical length scales and prediction of the jamming transition in a granular material, Nat. Phys., 3, 260–264, 2007. a, b
Khan, H. A. and Maruf, G. M.: Counting clustered cells using distance mapping, 2013 International Conference on Informatics, Electronics and Vision, ICIEV 2013, https://doi.org/10.1109/ICIEV.2013.6572677, 2013. a
Lawler, G. F. and Limic, V.: Random walk: a modern introduction, Vol. 123, Cambridge University Press, Cambridge, UK, 2010. a
Lee, D. B. and Jerolmack, D.: MarbleData, https://doi.org/10.6084/m9.figshare.7356569.v1, 2018. a
Lemieux, P.-A. and Durian, D.: From avalanches to fluid flow: A continuous picture of grain dynamics down a heap, Phys. Rev. Lett., 85, 4273–4276, 2000. a
Liu, A. J. and Nagel, S. R.: The jamming transition and the marginally jammed solid, Annu. Rev. Conden. Ma. P., 1, 347–369, 2010. a
Ma, H., Heyman, J., Fu, X., Mettra, F., Ancey, C., and Parker, G.: Bed load transport over a broad range of timescales: Determination of three regimes of fluctuations, J. Geophys. Res.-Earth, 119, 2653–2673, 2014. a, b
Martin, R. L. and Kok, J. F.: Field measurements demonstrate distinct initiation and cessation thresholds governing aeolian sediment transport flux, arXiv preprint arXiv:1610.10059, 2016. a
Martin, R. L., Purohit, P. K., and Jerolmack, D. J.: Sedimentary bed evolution as a mean-reverting random walk: Implications for tracer statistics, Geophys. Res. Lett., 41, 6152–6159, 2014. a
Maurin, R., Chauchat, J., and Frey, P.: Dense granular flow rheology in turbulent bedload transport, J. Fluid Mech., 804, 490–512, 2016. a, b
Nelson, J. M., Shreve, R. L., McLean, S. R., and Drake, T. G.: Role of near-bed turbulence structure in bed load transport and bed form mechanics, Water Resour. Res., 31, 2071–2086, 1995. a, b
Nikora, V., Habersack, H., Huber, T., and McEwan, I.: On bed particle diffusion in gravel bed flows under weak bed load transport, Water Resour. Res., 38, 17-1–17-9, https://doi.org/10.1029/2001WR000513, 2002. a
Pähtz, T. and Durán, O.: Fluid forces or impacts: What governs the entrainment of soil particles in sediment transport mediated by a Newtonian fluid?, Phys. Rev. Fluids, 2, 074303, https://doi.org/10.1103/PhysRevFluids.2.074303, 2017. a, b
Papanicolaou, A., Diplas, P., Dancey, C., and Balakrishnan, M.: Surface roughness effects in near-bed turbulence: Implications to sediment entrainment, J. Eng. Mech., 127, 211–218, 2001. a, b
Parker, G., Wilcock, P. R., Paola, C., Dietrich, W. E., and Pitlick, J.: Physical basis for quasi-universal relations describing bankfull hydraulic geometry of single-thread gravel bed rivers, Journal of Geophysical Research: Earth Surface (2003–2012), 112, 2007. a, b
Parthasarathy, R.: Rapid, accurate particle tracking by calculation of radial symmetry centers, Nat. Methods, 9, 724–726, https://doi.org/10.1038/nmeth.2071, 2012. a
Phillips, C. B. and Jerolmack, D. J.: Self-organization of river channels as a critical filter on climate signals, Science, 352, 694–697, 2016. a
Phillips, C. B., Martin, R. L., and Jerolmack, D. J.: Impulse framework for unsteady flows reveals superdiffusive bed load transport, Geophys. Res. Lett., 40, 1328–1333, https://doi.org/10.1002/grl.50323, 2013. a
Prancevic, J. P. and Lamb, M. P.: Unraveling bed slope from relative roughness in initial sediment motion, J. Geophys. Res.-Earth, 120, 474–489, 2015. a
Rajchenbach, J.: Flow in powders: From discrete avalanches to continuous regime, Phys. Rev. Lett., 65, 2221, https://doi.org/10.1103/PhysRevLett.65.2221, 1990. a, b
Recking, A.: A comparison between flume and field bed load transport data and consequences for surface-based bed load transport prediction, Water Resour. Res., 46, W03518, https://doi.org/10.1029/2009WR008007, 2010. a
Regev, I., Lookman, T., and Reichhardt, C.: Onset of irreversibility and chaos in amorphous solids under periodic shear, Phys. Rev. E, 88, 062401, https://doi.org/10.1103/PhysRevE.88.062401, 2013. a
Schmeeckle, M. W. and Nelson, J. M.: Direct numerical simulation of bedload transport using a local, dynamic boundary condition, Sedimentology, 50, 279–301, 2003. a, b
Schmeeckle, M. W., Nelson, J. M., Pitlick, J., Bennett, J. P., and Elastohydrodynamic, A.: Interparticle collision of natural sediment grains in water, Water Resour. Res., 37, 2377–2391, 2001. a, b
Singh, A., Fienberg, K., Jerolmack, D. J., Marr, J., and Foufoula-Georgiou, E.: Experimental evidence for statistical scaling and intermittency in sediment transport rates, J. Geophys. Res., 114, F01025, https://doi.org/10.1029/2007JF000963, 2009. a, b, c, d
Sumer, B. M., Chua, L. H., Cheng, N.-S., and Fredsøe, J.: Influence of turbulence on bed load sediment transport, J. Hydraul. Eng., 129, 585–596, 2003. a, b
Tucker, G. E. and Bradley, D. N.: Trouble with diffusion: Reassessing hillslope erosion laws with a particle-based model, J. Geophys. Res.-Earth, 115, F00A10, https://doi.org/10.1029/2009JF001264, 2010. a
Yager, E., Kirchner, J., and Dietrich, W.: Calculating bed load transport in steep boulder bed channels, Water Resour. Res., 43, W07418, https://doi.org/10.1029/2006WR005432, 2007. a