the Creative Commons Attribution 4.0 License.
the Creative Commons Attribution 4.0 License.
 | 23 Nov 2018
Geomorphic regulation of floodplain soil organic carbon concentration in watersheds of the Rocky and Cascade Mountains, USA
Ellen E. Wohl
Mountain rivers have the potential to retain OC-rich soil and store large quantities of organic carbon (OC) in floodplain soils. We characterize valley bottom morphology, floodplain soil, and vegetation in two disparate mountain river basins: the Middle Fork Snoqualmie in the Cascade Mountains and the Big Sandy in the Wind River Range of the Rocky Mountains. We use this dataset to examine variability in OC concentration between these basins as well as within them at multiple spatial scales. We find that although there are some differences between basins, much of the variability in OC concentration is due to local factors, such as soil moisture and valley bottom geometry. From this, we conclude that local factors likely play a dominant role in regulating OC concentration in valley bottoms and that interbasin differences in climate or vegetation characteristics may not translate directly into differences in OC storage. We also use an analysis of OC concentration and soil texture by depth to infer that OC is input to floodplain soils mainly by decaying vegetation, not overbank deposition of fine, OC-bearing sediment. Geomorphology and hydrology play strong roles in determining the spatial distribution of soil OC in mountain river corridors.
- Article
(2162 KB) - Full-text XML
-
Supplement
(120 KB) - BibTeX
- EndNote


Terrestrial carbon storage plays an important role in regulating the global carbon cycle and the distribution of carbon between oceans, the atmosphere, long-term (105–109 years) storage in rock, and short- to moderate-term storage in the biosphere (101–104 years, including vegetation and soil) (Aufdenkampe et al., 2011; Battin et al., 2009). Soils, in particular, are a large organic carbon (OC) reservoir with significant spatial variability (Jobbágy and Jackson, 2000; Schmidt et al., 2011), making them difficult to characterize in the context of global carbon cycling. It is essential to quantify the spatial variability of OC stored in the biosphere to constrain the effects of climate change on feedbacks between biospheric and atmospheric carbon storage (Ballantyne et al., 2012). To provide a more complete understanding of how the biospheric carbon pool may change in the future and guide management of soil OC, we seek to provide a better constraint on where carbon is stored in the biosphere and the processes that regulate that storage.
We focus here on river corridors, defined as channels, fluvial deposits, riparian zones, and floodplains (Harvey and Gooseff, 2015), which process, concentrate, transport, and store carbon (Wohl et al., 2017b). In the context of the carbon cycle, floodplains can act as a major component of the biospheric carbon pool (Aufdenkampe et al., 2011; Battin et al., 2009). Floodplain soils can act as a substantial pool of OC despite their relatively small aerial extent, indicating that floodplains may be disproportionately important compared to uplands in terms of carbon storage (D'Elia et al., 2017; Hanberry et al., 2015; Sutfin et al., 2016; Sutfin and Wohl, 2017; Wohl et al., 2012, 2017a). Mountainous regions, due to their high primary productivity (Schimel and Braswell, 2005; Sun et al., 2004), may play a substantial role in the freshwater processing and storage of OC whereby they retain sediment and water along the river network (Wohl et al., 2017b). Even laterally constrained floodplains in mountainous drainages can store significant quantities of OC that can be mobilized during floods (Rathburn et al., 2017). However, we lack a comprehensive characterization of how floodplain soil OC varies throughout watersheds. It is important to understand the spatial distribution of OC to predict its fate during floods and inform management to increase floodplain OC storage (Bullinger-Weber et al., 2014).
Floodplain OC enters river corridor soils via litterfall from vegetation and the erosion of OC-bearing bedrock (Hilton et al., 2011; Leithold et al., 2016; Sutfin et al., 2016). OC inputs are either allochthonous from upstream deposition of soil, particulate, and dissolved OC or autochthonous from riparian vegetation (Omengo et al., 2016; Ricker et al., 2013; Sutfin et al., 2016). As such, OC input can be regulated by vegetation dynamics and resulting litter input, hydrologic and sediment transport regimes, and water chemistry. However, it is unclear which OC inputs dominate under various conditions, hampering the prediction of changes in OC delivery to soils under a changing climate that may have significant effects on vegetation dynamics and hydrology.
OC concentration in soil is controlled by processes acting at multiple spatial scales. At broad, intra-basin scales, OC concentration in soil is regulated by the ability of carbon to sorb to soil particles and the ability of microbes and other organisms to respire soil OC, which can be controlled by rhizosphere dynamics, moisture, and temperature. Sorption of OC to soil particles reduces OC lability and is controlled by grain size and resulting available surface area as well as the availability of calcium, iron, and aluminum (Kaiser and Guggenberger, 2000; Rasmussen et al., 2018). Microbial respiration represents the primary pathway by which soil OC returns to the atmosphere. In general, low temperatures and frequent saturation inhibit microbial activity and promote OC storage (Falloon et al., 2011; Jobbágy and Jackson, 2000; Sutfin et al., 2016). At smaller, interbasin scales, the hydroclimatic regime controls vegetation dynamics, moisture, and temperature such that soil OC concentration in disparate regions can be approximately characterized by these predictors (Aufdenkampe et al., 2011; Schimel and Braswell, 2005). However, at the scale of a single watershed, hydrology, ecology, and geomorphology play strong roles in determining soil texture, moisture, and microbial dynamics, in turn controlling OC storage in valley bottoms (Scott and Wohl, 2017; Sutfin and Wohl, 2017; Wohl and Pfeiffer, 2018). We currently lack a comprehensive field-based examination of how processes acting at interbasin and intra-basin scales interact to regulate floodplain soil OC concentrations.
To address this knowledge gap, we quantify spatial variations in the OC concentration of floodplain soil across the entirety of two disparate mountain river networks. This allows us to examine interbasin hydroclimatic variation and intra-basin geomorphic and vegetation variation to understand the multi-scale controls on OC concentration. We use this multi-scale approach to draw inferences regarding the spatial distribution of floodplain OC, controls on that spatial distribution, and the dominant source of OC to mountain river floodplains.
Objectives and hypotheses
Across a basin, it is uncertain whether OC concentration in floodplain soils follows predictable longitudinal variation or is controlled by local factors. Similarly, in a vertical floodplain soil profile, it is uncertain whether OC concentration follows a trend similar to uplands, with declining OC concentration with depth, or exhibits vertical heterogeneity as a result of OC-rich layers deposited by floods. It is also unclear whether OC in floodplain soils is dominantly autochthonous or allochthonous. Floodplain soil OC source may be evident from the vertical heterogeneity of OC concentration: dominantly autochthonous OC profiles should decline with depth, whereas dominantly allochthonous OC profiles should exhibit vertical heterogeneity, reflecting episodic deposition. Our primary objective here is to understand spatial variations in OC concentration both with depth in a soil profile and across a basin. By quantifying these variations, we hope to infer the processes that regulate OC deposition in floodplain soil.
By examining two mountain river basins that differ in terms of hydroclimatic regime and vegetation characteristics, we can quantify both interbasin variation in OC storage and variation within each basin. We hypothesize that at an interbasin scale, the hydroclimatic regime and resulting rate of litterfall inputs in the riparian zone (Benfield, 1997) will dominantly regulate OC concentration (H1). We define hydroclimatic regime as the combination of precipitation and temperature dynamics that result in the vegetation characteristics of a basin. At an intra-basin scale, we expect that valley bottom geometry and river lateral mobility will regulate floodplain sediment characteristics and vegetation dynamics. Thus, we hypothesize that soil OC concentration does not vary along predictable longitudinal trends within mountain river basins, instead being more dominantly controlled by local fluvial processes and valley bottom form (H2a). We hypothesize that geomorphic process and form determine soil texture and moisture, which in turn set the boundary conditions that regulate the sorption of OC to mineral grains (promoting stabilization) and the potential of OC to be respired by microbes (H2b). In terms of OC inputs to floodplain soils, we hypothesize that the source of OC is dominated by autochthonous vegetation and litter inputs in these basins (H3). As such, we expect OC to dominantly decline with depth, only rarely exhibiting vertical heterogeneity that would represent allochthonous deposition from flooding.
This work was done alongside work presented in Scott and Wohl (2018b) and hence shares field sites, study design, GIS, and sampling techniques.
2.1 Field sites
We quantified soil organic carbon concentrations to a depth of approximately 1 m in the Big Sandy basin in the Wind River Range of Wyoming and the Middle Fork Snoqualmie basin in the central Cascade Mountains of Washington (Fig. 1). These basins represent distinct bioclimatic and geomorphologic regions ranging from the wet, high-relief Cascades to the semiarid, moderate-relief Middle Rockies.
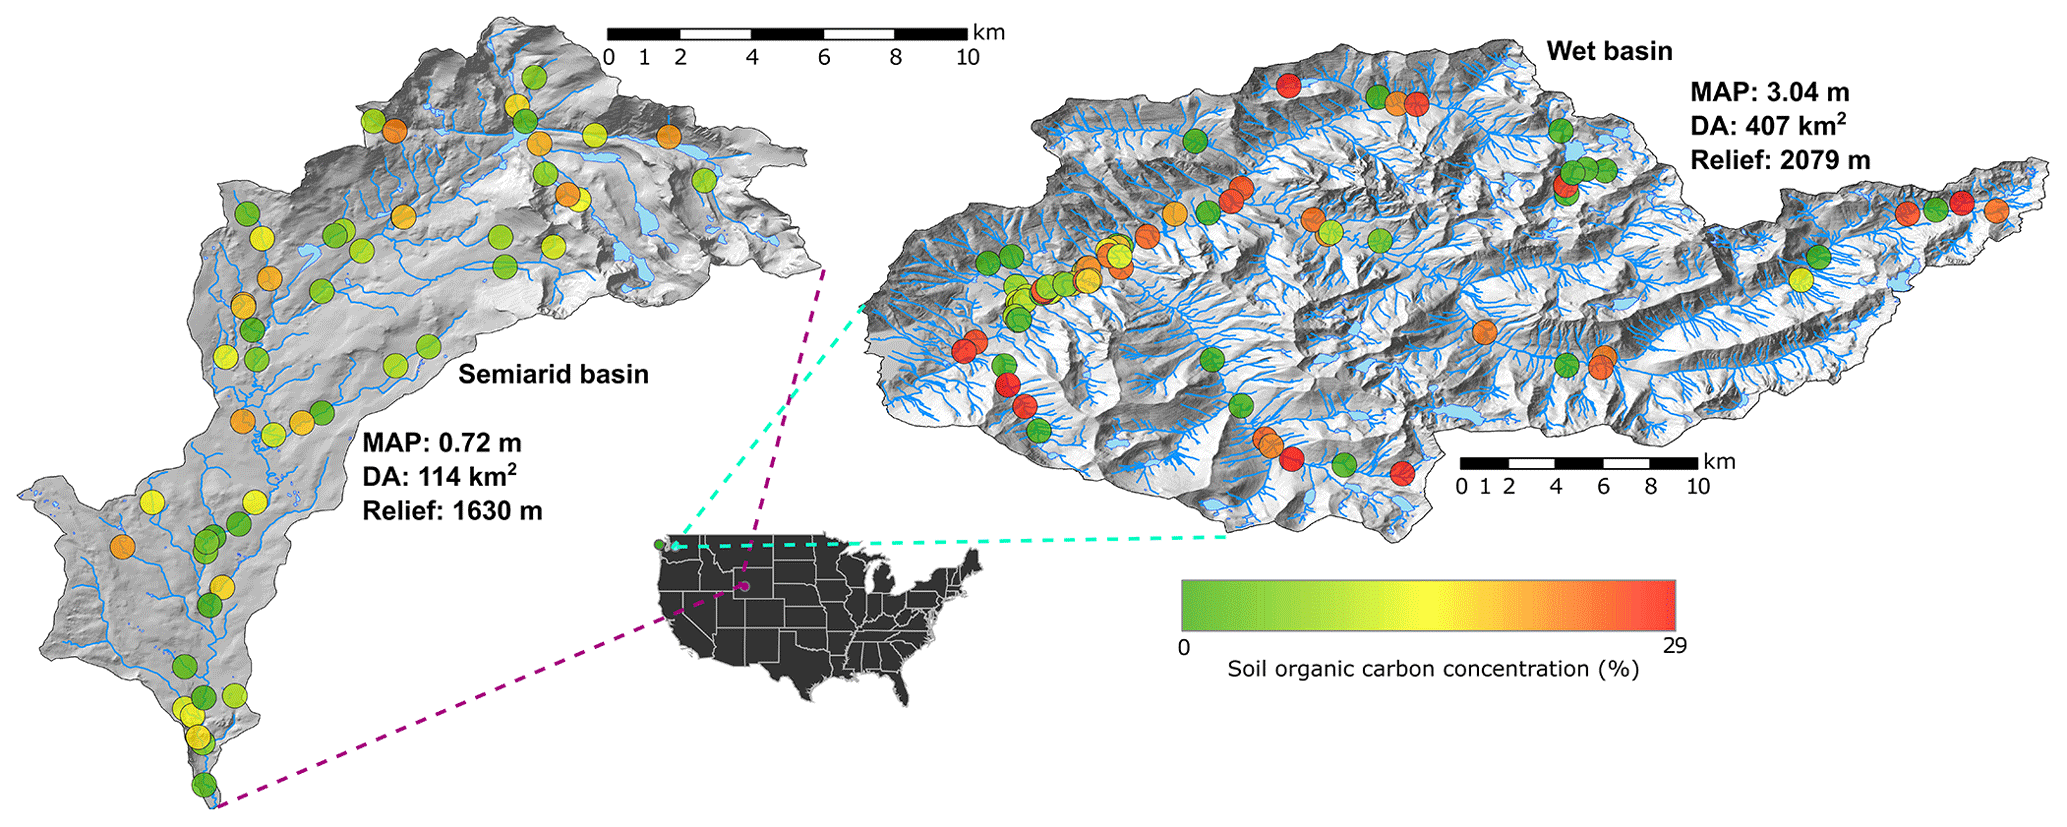
Figure 1Hillshade showing the location, sampling sites, and stream network of the sampled basins. Big Sandy, Wyoming (42.69∘, −109.25∘), is on the left and MF Snoqualmie, Washington (47.53∘, −121.52∘), is on the right. Circles represent sampling locations at which floodplain soil OC was measured. Sample sites are colored by OC concentration. Mean annual precipitation (MAP), drainage area (DA), and relief are given for each basin.
The MF Snoqualmie has a mean annual precipitation of 3.04 m (Oregon State University, 2004), 2079 m of total relief over a 407 km2 drainage area, and a mean basin slope of 60 %. Topography in the MF Snoqualmie is largely glaciogenic, with wide, unconfined valleys at both high and low elevations. Streams range from steep, debris-flow-dominated headwater channels to lower-gradient, wide, laterally unconfined channels in its lower reaches. The lower reaches of the MF Snoqualmie have been clear-cut extensively since the early 1900s, although there is little logging activity today. Vegetation follows an elevation gradient. The talus, active glaciers, and alpine tundra at the highest elevations transition to subalpine forests dominated by mountain hemlock (Tsuga mertensiana) (above approximately 1500 m), but also including Pacific silver fir (Abies amabilis) and noble fir (Abies procera) in the lower subalpine and montane zones (above approximately 900 m). Below the montane zone, uplands and terraces are covered by Douglas fir (Pseudotsuga menziesii) and western hemlock (Tsuga heterophylla), whereas active riparian zones are dominated by red alder (Alnus rubra) and bigleaf maple (Acer macrophyllum).
The semiarid Big Sandy is considerably drier than the MF Snoqualmie, but also exhibits broad, glacially carved valleys, especially in headwater reaches. It has a mean annual precipitation of 0.72 m (Oregon State University, 2004), 1630 m of total relief over a 114 km2 drainage area, and a mean basin slope of 25 %. The lower reaches of the Big Sandy are anthropogenically impacted by moderate grazing use and an access road that crosses through part of the basin. Herbaceous alpine tundra dominates higher elevations (above approximately 3100 m), while the subalpine zone (approximately 2900 to 3100 m) is characterized by forests of whitebark pine (Pinus albicaulis), Engelmann spruce (Picea engelmannii), and subalpine fir (Abies lasiocarpa). The montane zone (approximately 2600 to 2900 m) is comprised dominantly of lodgepole pine (Pinus contorta). Only a small portion of this basin (approximately 1 %) resides below 2500 m, where shrub steppe begins to dominate (Fall, 1994). Parklands and meadows are abundant in this basin, creating a patchy forest structure. Comparing this basin to the MF Snoqualmie provides bioclimatic contrast that allows us to examine how floodplain soil OC concentrations vary across a range of stream morphologies and floodplain morphologic types in regions with differing precipitation, forest characteristics, and basin morphology. To simplify comparison of these two basins, we henceforth refer to them by their dominant climate. The Middle Fork Snoqualmie is the wet basin and the Big Sandy is the semiarid basin (Fig. 1).
2.2 Study design and sampling
We sampled the semiarid basin in summer 2016 and the MF Snoqualmie in summer 2017. During each sampling campaign, no large floods occurred and we observed no floodplain erosion or deposition. Across both basins, we cored a total of 128 floodplain sites to determine soil OC concentration. Cores were collected as a series of individual soil samples at both regular and irregular depth increments.
2.2.1 Semiarid basin (Big Sandy)
The sparse vegetation in the semiarid basin enabled us to use a combination of a 10 m DEM and satellite imagery to manually map the extent of the valley bottom along the entire stream network and delineate valley bottoms based on confinement. We defined unconfined valley bottoms as those in which channel width occupied no more than half the valley bottom, and confined valley bottoms as those in which channel width occupied greater than half the valley bottom. Within each confinement stratum, we stratified the stream network by five drainage area classes to produce a total of 10 strata, ensuring even sampling across the basin. Within each of the resulting 10 strata, we randomly selected 5 reaches, producing a total of 50 sample sites throughout the basin. Due to access issues, we sampled 48 out of the 50 randomly located sites. We supplemented these with 4 subjectively located sites that we felt enhanced our ability to capture variation throughout the drainage based on observations in the field, resulting in a total of 52 sampled sites.
2.2.2 Wet basin (Middle Fork Snoqualmie)
The wet basin is larger than the semiarid basin and has extensive, low-gradient floodplains in its downstream reaches. These extensive floodplains display high spatial variability in vegetation, surface water, grain size, and estimated surface age based on aerial imagery and ground reconnaissance. To ensure an unbiased characterization of these heterogeneous floodplains, we used aerial imagery, a 10 m DEM, and pictures from field reconnaissance to delineate the floodplain into patch categories: fill channels (abandoned channels that have had enough sediment deposited to prevent an oxbow lake from forming), point bars (actively accreting surfaces on the inside of bends), wetlands (areas with standing water in imagery that are not obviously oxbows), oxbow lakes (abandoned channels dammed at the upstream and downstream ends to form a lake), and general floodplain surfaces (surfaces that cannot be classified into any of the above categories). Within each of these five categories, we randomly selected six points at which to take soil cores.
We also stratified the entire wet basin stream network by channel slope into four strata. Within each channel slope strata (hereafter referred to as slope strata), we randomly selected 10 reaches to collect a single floodplain soil core, resulting in 40 randomly located sample sites.
To supplement randomly sampled sites and accommodate the infeasibility of accessing two of the randomly sampled sites along the stream network, we also subjectively selected sample sites in places that we felt enhanced the degree to which our sampling captured the variability present among streams in the basin. This resulted in a total of 46 sites stratified by slope, 38 of which were randomly sampled, in addition to 30 sites stratified by floodplain type.
2.3 Reach-scale field measurements
At each sampled reach (100 m or 10 channel widths, whichever was shorter), we measured channel geometry and other characteristics, although our measurements were not consistent across all basins because field protocol evolved during the course of the study. In both basins, we measured confinement, valley bottom width, and channel bed slope. We additionally measured bankfull width and depth in the wet basin. We did not measure channel characteristics for sites stratified by floodplain type in the wet basin, since they did not correspond to a single reach of channel as sites stratified by slope did in much more confined valleys.
In the wet basin, we also categorized channels by planform and dominant bedform (Montgomery and Buffington, 1997). We defined planforms as follows: straight, in which the channel was generally confined and significant lateral migration was not evident; meandering, in which lateral migration was evident but only a single channel existed; anastomosing, in which vegetated islands separated multiple channels; and anabranching, in which a single dominant channel existed with relict channels separated by vegetated islands. We further classified channels as being either multithread (anastomosing or anabranching) or single thread (straight or meandering). Because logging records are inconsistent and likely inaccurate in the wet basin (based on the frequent observation of past logging activity that was not recorded in Forest Service records), we noted whether signs of logging, such as cut stumps, cable, decommissioned roads or railroads, or other logging-associated tools, were found near the reach.
We chose a representative location on the floodplain for each sampled site based on visual examination of vegetation type, soil surface texture, surface water presence, and elevation relative to the bankfull channel elevation (floodplain sites stratified by type in the wet basin were sampled as close to the randomly sampled point as possible). Once a location was chosen, we extracted a 32 mm diameter soil core using an open-sided corer (JMC Large Diameter Sampling Tube). Due to our adaptive methodology, we sampled soil OC slightly differently in the semiarid versus the wet basin. In the semiarid basin, we cored in irregular increments, generally 25–30 cm. After analyzing data from the semiarid basin, we realized that sampling in regular increments would make analysis more versatile. As a result, we switched to extracting soil samples at regular 20 cm increments in the wet basin. Cores were taken to refusal (i.e., coarse gravel or other obstructions preventing further soil collection) or a depth of approximately 1 m. Five cores in the semiarid basin, 12 cores in the wet basin sites stratified by slope, and 11 cores in the wet basin sites stratified by floodplain type did not reach refusal. When no sand or finer sediment was present in the valley bottom (only occurred in headwater channels of the wet basin), we recorded negligible OC concentration. Once soil samples were removed from the ground, they were placed in ziplock bags, frozen within 72 h (most samples were frozen within 8 h), and kept frozen until analysis.
2.4 Measuring soil OC and texture
To measure the concentration of organic carbon in soil samples, we used loss on ignition (LOI). We first defrosted samples for 24–48 h at room temperature. Once defrosted, we thoroughly mixed samples to ensure the most homogenous sample possible. We then subsampled 10–85 g of soil from each sample for analysis. Using crucibles in a muffle furnace, we dried samples in batches of 30 for 24 h at 105 ∘C to determine moisture content and remove all nonstructurally held water. Following the guidelines suggested by Hoogsteen et al. (2015), we then burned samples for 3 h at 550 ∘C to remove organic matter. By comparing the weight of the burned samples with that of the dried samples, we obtained an LOI weight.
After performing LOI, we used burned samples to perform texture by feel to determine the USDA soil texture class and estimated clay content (Thien, 1979). To convert LOI weight to OC concentration, we used the structural water loss correction of Hoogsteen et al. (2015) using clay content estimated from soil texture. This correction considers water held by clay that may not evaporate during drying but will evaporate during burning. It also estimates the proportion of the LOI weight that is OC. This correction, represented as a percent of the estimated sample OC content after the correction, ranged from 0.90 % to 495.76 % (95 % confidence interval of the median between 16.17 % and 24.25 %) for the wet basin, and ranged from 5.54 % to 570.53 % (95 % confidence interval of the median between 19.76 % and 32.11 %) for the semiarid basin.
One potential confounding factor in LOI is carbonates that may burn off during ignition, adding to the LOI weight while not being organic matter. In lithologies where carbonates are rare (e.g., granitoid rocks like those found in the upper part of the wet basin and entire semiarid basins), this is a relatively negligible issue. However, some of our soil samples came from parts of the wet basin draining rocks of the western mélange belt, including argillite, greywacke, and marble. We tested samples for the presence of carbonates to determine whether our LOI methods would be sufficient to accurately determine OC concentration. We randomly chose 10 soil samples of a total of 110 drained rocks that could include carbonates and submitted them to the Colorado State University soil testing laboratory for CHN furnace analysis (Sparks, 1996), which yielded data on the proportion of carbonates by mass in those samples. The median calcium carbonate concentrations of those 10 samples was 0.98 % (95 % confidence interval between 0.70 % and 1.03 %), and the median percentage of the total carbon in samples comprised of inorganic carbon was 5.05 % (95 % confidence interval between 1.97 % and 18.9 %). From this, we concluded that the amount of carbonate in the samples draining potentially carbonate-bearing rocks was low enough that LOI was likely to still be accurate. Consequently, we analyzed all soil samples using LOI to obtain OC concentration. The median difference between the LOI and CHN OC estimates for these 10 samples was 0.45 % (95 % confidence interval between −0.83 % and 1.47 %), indicating no systematic bias in LOI estimates of OC concentration.
2.5 GIS and derivative measurements
After fieldwork in each basin, we collected the following data for each reach using a GIS platform: elevation, drainage area, land cover classification and canopy cover from the National Land Cover Database (Homer et al., 2015), and the mean slope of the basin draining to each reach (including hillslopes and channels). Utilizing drainage area at each reach and field-measured channel gradient, we calculated an estimated stream power as the product of drainage area, channel gradient, and basin-averaged precipitation. We utilized a 10 m DEM for all GIS topographic measurements. To estimate clay content for each sample, we used median values for assigned USDA texture classes. To obtain estimated clay content, moisture, and OC for each core, we calculated an average weighted by the percentage of core taken up by each soil sample. We categorized wet basin samples stratified by floodplain type into those with standing water (wetlands and oxbow lakes) and those with no standing water (all other types).
2.6 Statistical analyses
All statistical analyses were performed using the R statistical computing software (R Core Team, 2017). We conducted all analyses on three modeling groups based on the variables measured in each group. In the wet basin, we grouped observations by stratification type, separating observations stratified by channel slope from observations stratified by floodplain type. We separated these two groups from all observations in the semiarid basin, which were measured consistently. We modeled OC concentration and soil texture with a mixed-effects linear regression using individual soil samples (i.e., the individual samples that make up a core) as sample units (n=103 for wet basin stratified by slope, 89 for wet basin stratified by floodplain type, and 101 for semiarid basin). We modeled the sampled site as a random effect, acknowledging that individual soil samples within a single core are likely nonindependent. We used profiled 95 % confidence intervals on effect estimates (β) for fixed effects to evaluate variable importance in mixed-effects models.
To gain further insight at the reach scale, we also modeled average OC concentration and soil moisture at each measured site using multiple linear regression. We modeled soil moisture at the reach scale because we felt that our single snapshot of moisture conditions was better represented as a site-level average. We first performed univariate analysis between each hypothesized predictor and the response, utilizing mainly comparative Wilcoxon rank-sum tests (Wilcoxon, 1945) or correlational Spearman correlation coefficient statistics. We utilized a Holm multiple-comparison correction (Holm, 1979) for pairwise comparisons. During this filtering, we also viewed box plots or scatterplots as appropriate to discern which variables appear to have anything other than a completely random relationship with the response. We then utilized the multiple linear regression of all subsets using the corrected Akaike information criterion as a model selection criterion (Wagenmakers and Farrell, 2004). We iteratively transformed response variables to ensure the homoscedasticity of error terms. To select a single best model, we utilized both Akaike-weight-based importance and parsimony to select a final reduced model. We considered sample sizes, p values, and effect magnitudes in determining variable importance.
We also analyzed each core to determine whether there were buried high-OC-concentration layers at depth. We compared each buried soil sample to the sample above it using the criterion that a peak in OC at depth should have an OC concentration 1.5 times that of the overlying sample and be above 0.5 % (Appling et al., 2014).
Model results are presented in Table 1. Comparisons between basins and summaries of OC concentration, moisture, and estimated clay content are shown in Fig. 2.
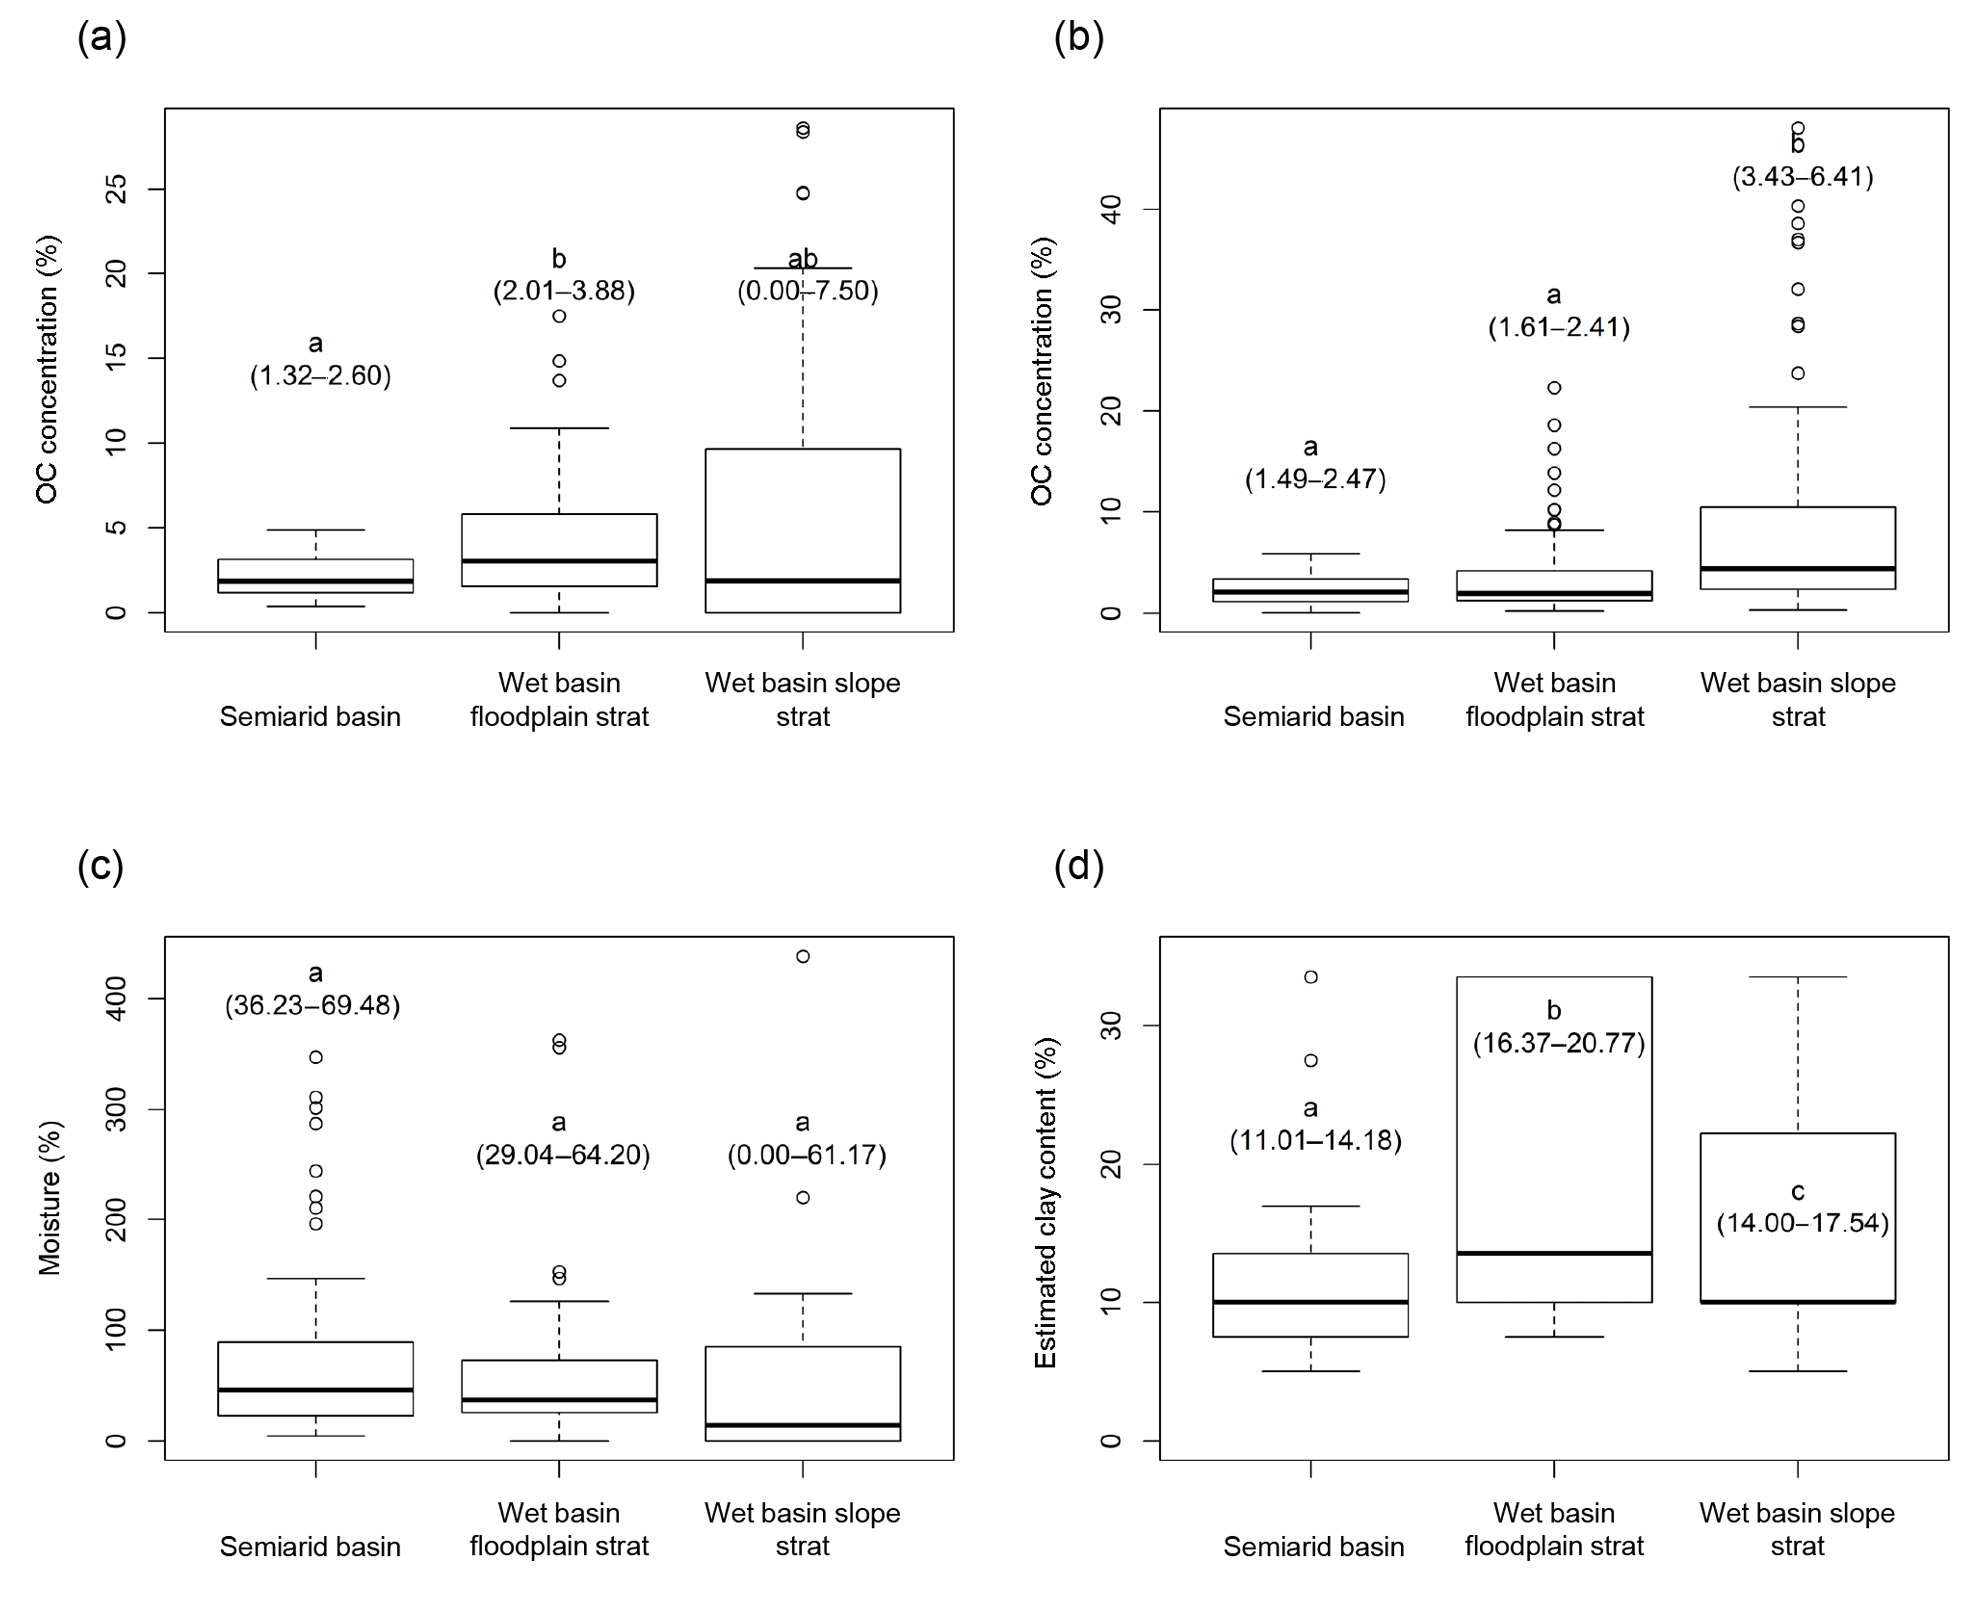
Figure 2Box plots showing comparisons between model groups of OC concentration at the reach scale (a), OC concentration at the scale of individual soil samples (b), moisture at the reach scale (c), and estimated clay content at the scale of individual soil samples (d). Ends of dotted lines represent 1.5 times the interquartile range, which is represented by boxes. Bold line represents median. Circles represent outliers. Letters indicate probable differences between groups based on pairwise Wilcoxon (a–c) or t tests (d) with a Holm correction. Ranges in parentheses below letters show the 95 % confidence interval of the median value for the group (a–c) or the mean value for the group (d) in which median confidence intervals were overly constrained due to the categorical nature of our estimated clay content data.
Table 1Matrix of all models presented in the text. Each model is listed by model group, response variable, and scale. Scale refers to the sample unit of the model, and site refers to a core, with the response averaged over all the individual soil samples in the core. For each variable and model, an asterisk (*) indicates that the variable was included in model selection but not the full mixed-effects model. A minus (−) indicates that the variable was selected as important in predicting the response and denotes an indirect correlation, whereas a plus (+) indicates a direct correlation. In the case of confinement, a plus indicates that unconfined streams display a higher-magnitude response variable. In the case of bed material, a plus indicates that samples with sand exhibit a higher value of the response. NA indicates that either the variable was not measured for that basin or model group or that it is the model response.
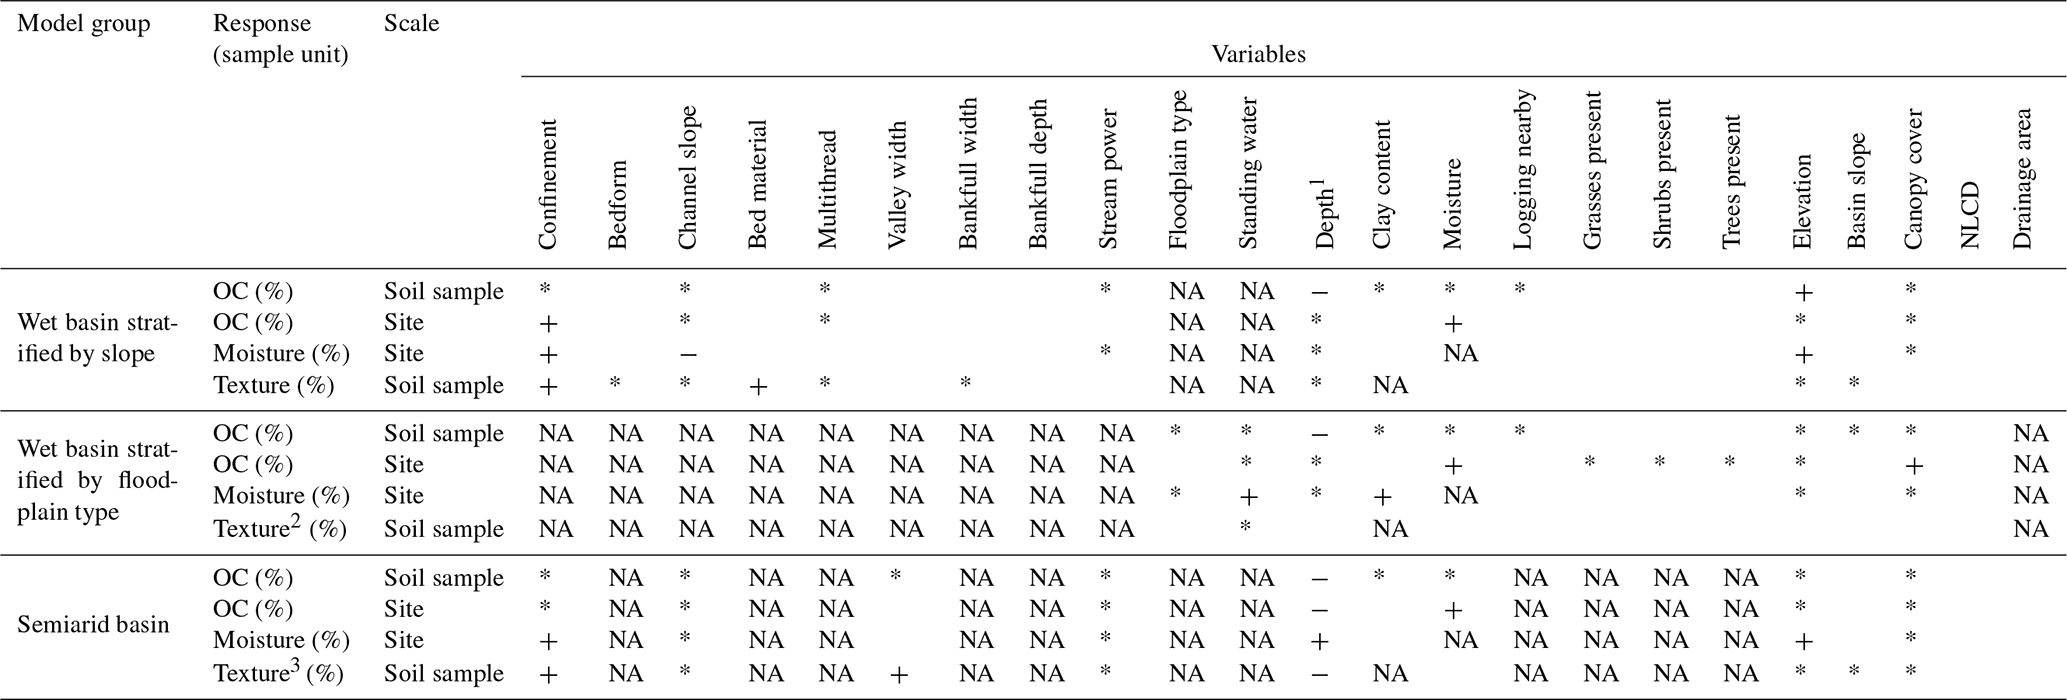
1 Depth refers to either the soil sample depth below the ground or the
total depth of the core, depending on the sample unit.
2 No significant results were observed for this model.
3 For this model, both valley width and
confinement predict texture and
can be interpreted interchangeably. However, including both in the same
model would yield problems due to multicollinearity.
3.1 OC concentration
Most cores display a decrease in OC concentration with depth (Fig. 3). Of cores with more than a single sample, 32 % (7∕22) of cores stratified by slope in the wet basin, 32 % (8∕25) of cores stratified by floodplain type in the wet basin, and 6 % (2∕31) of cores in the semiarid basin exhibit OC concentration peaks at depth. Whether a soil sample was classified as an OC peak has no relation to estimated clay content in sites stratified by floodplain type (p=0.28) or those stratified by slope (p=0.89) in the wet basin. In the semiarid basin, soil samples classified as buried OC peaks have significantly higher estimated clay contents (p=0.05) than those that were not classified as peaks.
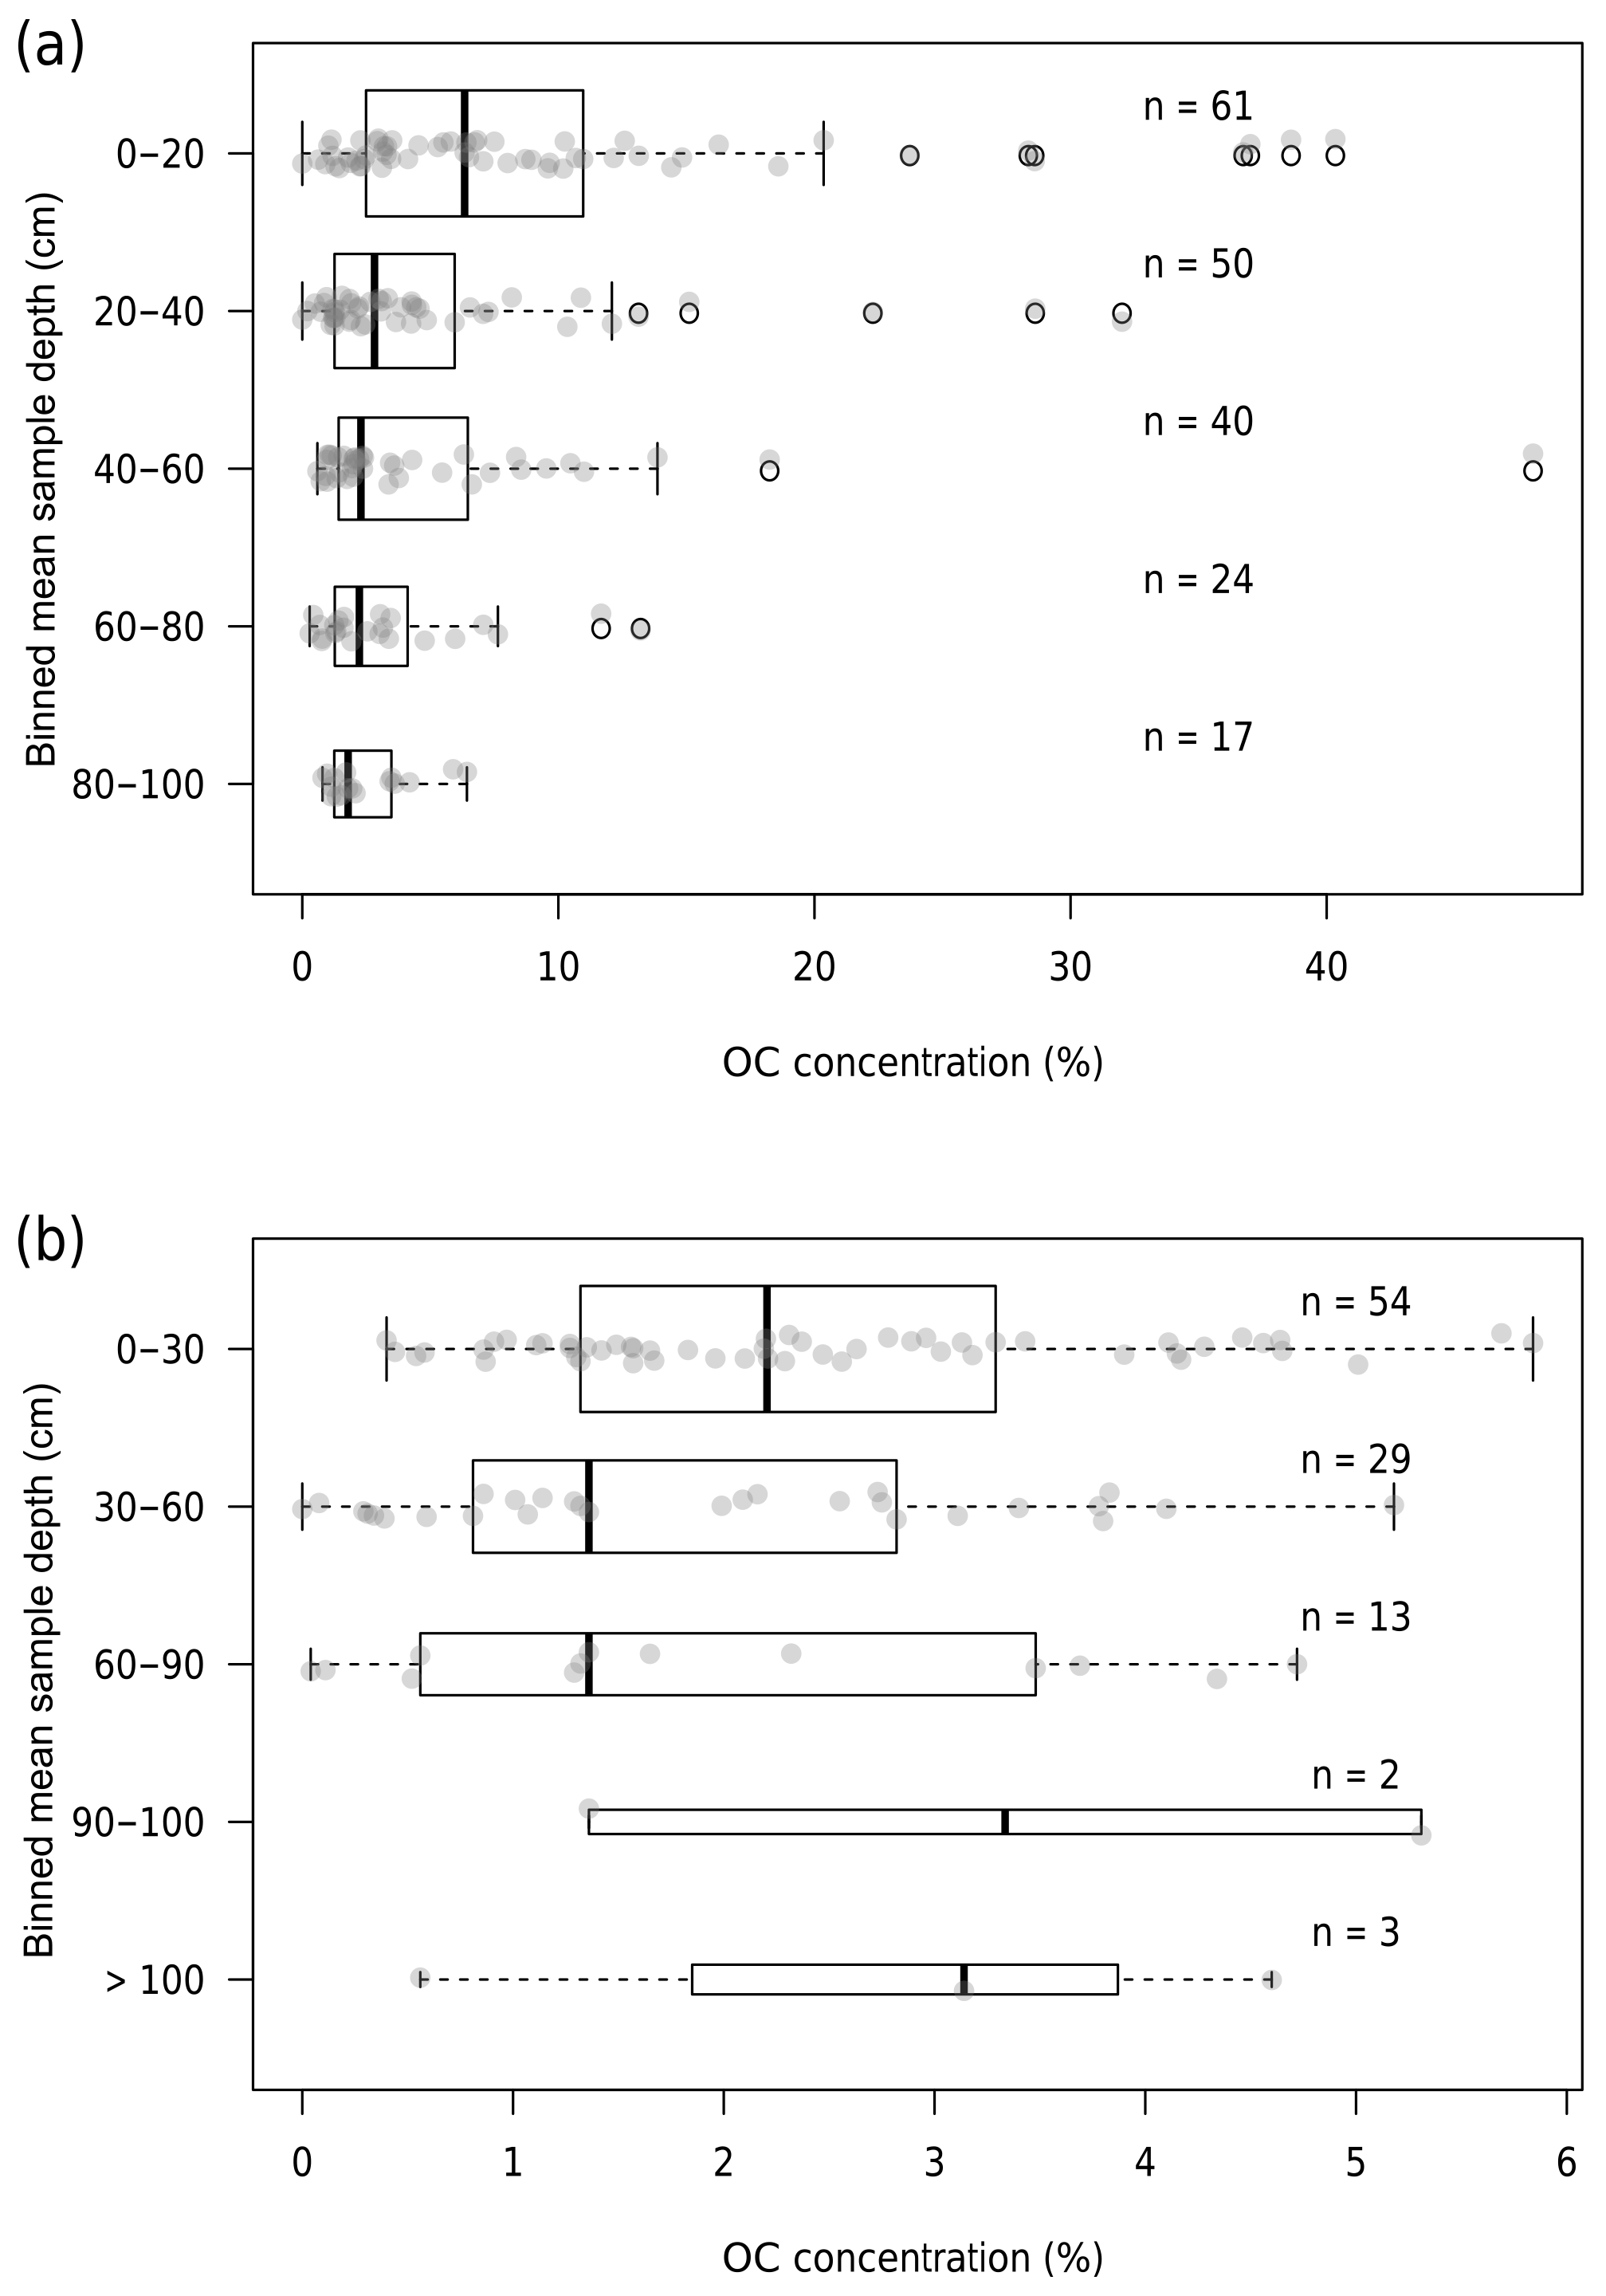
Figure 3Box plots of sample OC concentration binned by mean sample depth for the wet (a) and semiarid (b) basins. Ends of dotted lines represent 1.5 times the interquartile range, which is represented by boxes. Bold line represents median. Black circles represent outliers. Transparent grey points show all data for each bin. Sample size for each bin is denoted by n.
In general, the floodplain-stratified sites in the wet basin store higher densities of OC than the semiarid basin (Fig. 2a, b). Figure 2a includes zero values (i.e., sites with no OC-bearing sediment; only present in the wet basin slope-stratified group), whereas Fig. 2b does not because sample units in Fig. 2b are individual soil samples. Comparing these two groups, it appears that soils in the wet basin exhibit much higher OC concentrations than those in the semiarid basin, but in general, there are many more reaches with no fine sediment available to store OC in the wet basin. At the scale of individual soil samples, the depth below ground surface is by far the dominant control on OC concentration across all modeling groups. We used a cube root transform for all three mixed-effects models of OC concentration. For wet basin sites stratified by slope, deeper soil samples contain less OC (), whereas soil samples at higher elevations tend to contain more OC (). Depth is the only significant predictor of OC content for both wet basin soil samples stratified by floodplain type () and soil samples in the semiarid basin ().
Modeling wet basin slope-stratified sites at the reach scale, we found that moisture () and whether the reach was unconfined () control soil OC (cube root transformation, model adjusted R2=0.54, p<0.0001). Modeling wet basin floodplain-stratified sites at the site scale, we found that canopy cover () and moisture () are controls on soil OC (cube root transformation, model adjusted R2=0.67, p<0.0001). Modeling Big Sandy sites at the reach scale, we found that soil depth () and moisture () are dominant controls on soil OC concentration (no transformation, model adjusted R2=0.69, p<0.0001).
In general, moister, deeper soils store more OC at the reach scale, whereas OC tends to vary dominantly with depth at the scale of individual soil samples. Although estimated clay content did not emerge as a significant predictor of OC concentration, it is used to calculate clay-held water to correct our LOI-based OC concentration measurements, making it important in determining OC for each sample.
3.2 Soil texture
In general, soil texture follows a predictable trend with river size between model groups (Fig. 2d). Floodplain type-stratified sites in the wet basin store the most clay, followed by slope-stratified sites and then sites in the semiarid basin.
Modeling soil texture at the individual soil sample scale across slope-stratified sites in the wet basin, we found whether the reach was confined () and whether the bed material was dominantly sand () to be dominant controls on estimated clay content. Modeling soil texture for sites stratified by floodplain type in the wet basin yielded no significant trends. In the semiarid basin, we found that either valley width () or whether the stream was unconfined () as well as depth below ground surface ( for model with valley width but not confinement) significantly control soil texture.
To summarize, sites from unconfined, lower-energy reaches in the wet basin and sites from reaches with wider valley bottoms and at lower depths in the semiarid basin exhibited more finely textured soils.
3.3 Soil moisture
Soil moisture is less variable between basins than either texture or OC concentration (Fig. 2c). All model groups exhibit similar soil moisture conditions, although there was significant variability within each model group.
Soil moisture at wet basin sites stratified by slope is dominantly controlled by channel slope (), elevation (), and whether the stream is unconfined (; model adjusted R2=0.38, p<0.0001). At wet basin sites stratified by floodplain type, estimated clay content () and whether the floodplain unit had standing water () significantly control soil moisture (model adjusted R2=0.46, p<0.0001). In the semiarid basin, soil depth (), elevation (), and whether the reach was unconfined () significantly control soil moisture (model adjusted R2=0.35, p<0.0001).
4.1 Understanding spatial variability in OC concentration in floodplain soils (H1 and H2)
Comparing the wet basin to the semiarid basin shows that the wetter, higher primary productivity basin is capable of storing greater concentrations of OC in floodplain soils, but that both regions generally store similar OC concentrations in floodplain soils. This result partially agrees with the examination of subalpine lake deltas by Scott and Wohl (2017). In that study, subalpine lake deltas in the wet basin were compared to deltas in the drier Colorado Front Range. Subalpine lake deltas displayed similar OC concentrations, likely due to competing but complementary OC stabilization and loss mechanisms in each region. Those deltas represent a subset of the broader valley bottom soils studied here. This more expansive study points to both geomorphic controls, such as valley bottom geometry, and factors influenced by climate, such as canopy cover, as controls on OC storage in valley bottoms. These results also agree with the results of Lininger et al. (2018), which indicate that geomorphic context and vegetation dynamics control OC concentration on floodplain soils along large lowland rivers in Alaska, USA.
At the reach or site scale, wetter soil profiles consistently yield higher OC concentrations in all model groups. However, moisture does not differ significantly between model groups (Fig. 2c), indicating that this alone cannot explain differences between basins. Soils tend to be finer in the wet basin, but clay content was not an important predictor of OC concentration in studied soils. Clay content likely influences OC concentration based on previous research (Hoffmann et al., 2009), although the inclusion of coarse soil material (including particulate organic matter) in our samples may explain the lack of an observed correlation here. Variability in soil redox conditions (i.e., the presence of anaerobic microsites) may also introduce variability in respiration rate between basins and among individual soil samples (Keiluweit et al., 2017). That is, variability in groundwater hydrology may result in a heterogeneous mix of aerobic (favoring microbial activity) and anaerobic (suppressing microbial activity) conditions within floodplain soils. We did not record redoximorphic features of our soil samples, so we are unable to determine whether this influence contributes to the error in our models. Although confinement plays a strong role in determining OC concentration in wet basin sites stratified by slope, it does not differ significantly between basins (52 % of semiarid basin reaches are unconfined compared to 63 % of wet basin reaches). The major differences between these basins are their hydroclimatic and disturbance regimes. The wet basin is at a lower elevation and has denser and higher biomass forests (Smithwick et al., 2002) compared to the sparser parkland forests of the semiarid basin, which likely also experiences more frequent fires based on fire histories of nearby regions (recurrence interval on the order of 101–102 years; Houston, 1973; Loope and Gruell, 1973). In addition, the volcanic soils present in the wet basin may suppress soil OC respiration (Matus et al., 2014), leading to a higher soil OC storage capacity there.
Between basins, it is likely that the hydroclimatic regime influencing primary production plays some role in the wet basin's higher maximum OC concentrations in floodplain soils compared to those of the semiarid basin. However, smaller-scale factors such as soil texture and moisture also likely play a role and are not related to drainage area (Table 1), indicating that neither OC concentration nor its controlling factors vary continuously along a river network, thus supporting H2a and H2b. This also indicates that local factors, set largely by geomorphic and hydrologic dynamics, play a significant role in modulating the effect of climate on OC concentrations. If the wet and semiarid basins displayed significantly different OC concentrations, our first hypothesis regarding the interbasin controls on OC concentration would be supported. However, we instead found that climate and primary productivity only partially determine OC concentrations, especially when viewed in the context of geomorphic and hydrologic variability. Thus, the results do not support H1.
Each basin (or model group) is slightly different in terms of the controls on soil OC concentration, moisture, and texture. In the wet basin sites stratified by slope, higher-elevation sites display higher OC concentrations. This is contrary to the general trend in primary productivity, which decreases with increasing elevation. However, it is important to note that the headwaters of the wet basin are dominated by lakes, deltas, and other depositional features in relatively broad, glacially carved valleys. Subalpine lake deltas have been shown to store high OC concentrations in this basin (Scott and Wohl, 2017), and many of the highest OC concentrations we measured were located in broad, wet meadows, subalpine lake deltas, or other unconfined high-elevation reaches. Such unconfined sites also likely have significantly cooler temperatures and tend to have higher soil moisture contents, as shown by our modeling (Table 1). As such, although high-elevation wet basin sites may receive less OC input, they likely have a low rate of OC respiration, resulting in higher OC concentrations on the whole, which agrees with the result of Bao et al. (2017). In the semiarid basin, our modeling suggests that the lower temperatures and higher moisture (Table 1) at higher elevations do not compensate for the lower primary productivity, as elevation does not correlate with OC concentration.
In both basins, unconfined reaches contain wetter and finer-textured soils, which may result in a higher soil OC capacity. Although confinement only relates directly to OC content in wet basin sites, it does play a strong role in determining moisture, which in turn plays a role in regulating OC concentration in both basins, likely via inhibiting microbial activity (Howard and Howard, 1993). The relevance of channel slope in determining soil moisture in the wet basin but not semiarid basin may reflect the prevalence of high-gradient, debris-flow-dominated channels in the wet basin that largely exhibit only gravel to boulder substrate, which we assume stores minimal fine sediment, moisture, or OC.
In the semiarid basin, higher soil depths correlate with moister and finer-textured soils, but less OC concentration. This indicates the trend in OC with depth likely dominates the signal of OC concentration, with deeper sites containing a higher proportion of OC-depleted deep samples.
4.2 Inferring sources of OC to floodplain soils (H3)
OC can be input to floodplain soils by two primary mechanisms. First, dissolved and particulate OC (including large wood) can be deposited on floodplain surfaces by overbank deposition, thus integrating fluvial sedimentary OC into the floodplain soil profile or, in the case of large wood, depositing discrete but potentially large concentrations of OC that can later be integrated into the soil profile. Second, litter and decomposing vegetation on the floodplain surface can act as autochthonous inputs of OC to floodplain soil.
Our modeling of OC concentration yielded results consistent with previous investigations of controls on soil OC storage capacity (Jobbágy and Jackson, 2000; Sutfin and Wohl, 2017). Sites in the heterogeneous floodplain of the wet basin display a direct correlation between canopy cover and OC concentration, indicating that increased litter inputs lead to increased floodplain soil OC concentration. Sediment inputs likely differ between floodplain depositional unit types (e.g., coarser sediment may deposit on point bars compared to filled secondary channels), although floodplain type does not predict OC concentration. This indicates that vegetation inputs may be more dominant than fluvial sediment inputs at these sites.
The finding that buried OC peaks in the wet basin do not have abnormally high clay contents supports the interpretation that wood and litter inputs to soil are the dominant source of OC in the floodplain soils we examined. Buried peaks can be layers created by overbank deposition and subsequent burial of fine, OC-bearing sediments (Blazejewski et al., 2009; Ricker et al., 2013), buried pieces of wood (Wohl, 2013), or buried organic horizons that are now capped by sediments that prevent OC respiration. If overbank deposition of fine sediment caused OC peaks, we would expect to see the soil samples classified as peaks exhibiting high clay contents, indicating finer sediment. Instead, our results suggest that in the wet basin, buried peaks are likely the result of either buried organic horizons or buried wood. We observed large pieces of decaying, buried wood in floodplain cut banks in the wet basin, supporting this inference. Overbank deposition of wood on the floodplain was only observed rarely in this basin, indicating that the OC measured in these soils is likely dominantly autochthonous.
In the semiarid basin, the two cores that exhibit peaks were collected from the same meadow, just downstream of a now-filled former lake that is a potential source of fine sediment. The channels draining this meadow exhibit an anabranching planform, indicating the potential to deposit and bury packets of potentially OC-rich, fine sediments. However, the majority of cores do not exhibit OC peaks, indicating OC input mainly from vegetation at the surface and continuing OC respiration at depth.
OC variation within each core is dominantly a function of depth. We observe a negative correlation between depth below ground surface and OC concentration, which has been observed in other studies, including mountain wetlands and floodplains (Jobbágy and Jackson, 2000; Scott and Wohl, 2017; Sutfin and Wohl, 2017; Zhao et al., 2017). In general, this indicates that at least in mountain river floodplains, OC is enriched at the surface and decomposes with depth, similar to upland soils. This fits with our finding that the majority of our cores do not exhibit significant OC peaks at depth and supports the dominance of litter and wood OC inputs to floodplain soils. These results support our hypothesis that decaying litter and wood, not overbank sediment deposition, dominate the input of OC to floodplain soils in our study basins (H3). We note that floodplain wood may also act as a trapping site for overbank fine organic matter, facilitating the deposition and input of OC from decaying vegetation. While these study basins likely accumulate soil OC mainly autochthonously, other basins that experience overbank flows, accompanying deposition of fine sediment, and burial of organic layers exhibit OC storage that is likely dominated by fluvial sediment deposition (e.g., Blazejewski et al., 2009; D'Elia et al., 2017; Ricker et al., 2013). Thus, it is likely that flow regime, lateral connectivity, and sediment transport dynamics regulate whether floodplain soil OC is dominantly input by the overbank deposition of fine material or litter and wood decay.
4.3 Conceptual model of soil OC concentration in floodplain soils
We present a conceptual model to summarize our results and place them in the context of work examining the controls on OC storage in soils (Fig. 4). OC is input to floodplains either through the decay of vegetation or the deposition of fine, OC-rich sediment. This input of OC only determines OC concentrations insofar as floodplain soils are capable of storing OC. That storage is effectively determined by a balance between processes that remove OC from floodplains, namely respiration or erosion followed by respiration (Berhe et al., 2007), and processes that regulate OC availability to microbes, namely the capability of the mineral fraction of the soil to sorb OC.
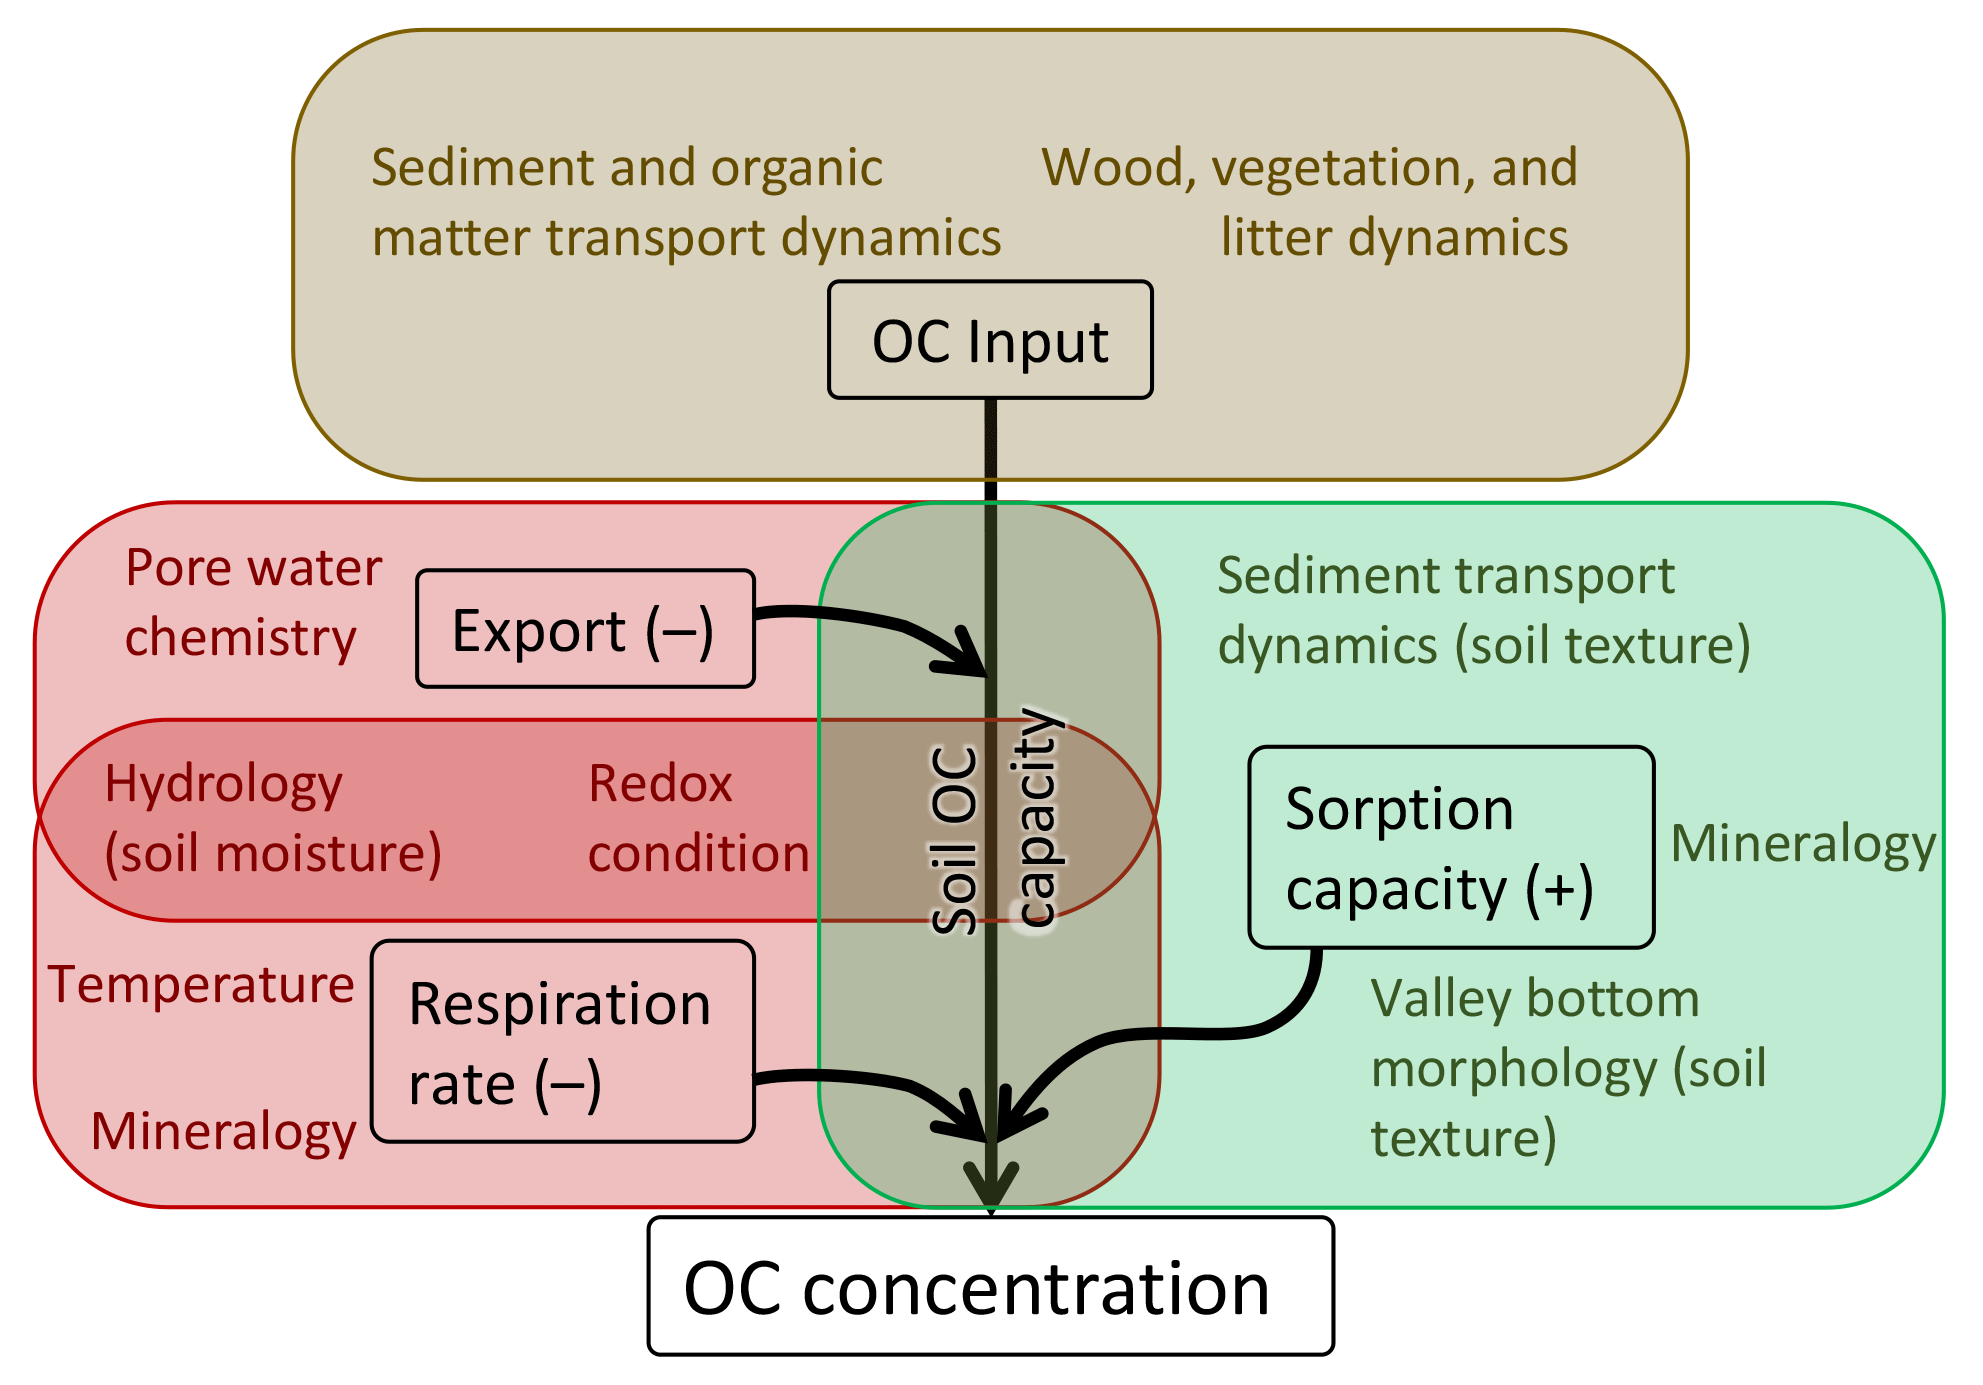
Figure 4Conceptual model of physical processes that influence OC concentration in floodplain soils based on this study and other literature. Each box corresponds to a major factor that influences OC concentration. Colored text within each box denotes factors that influence OC inputs, sorption capacity, OC export, or respiration rate (note that some processes influence both OC export and respiration rate). As sorption capacity increases, so does the OC capacity of the soil. Conversely, as the rate of respiration and/or OC export increases, the soil OC capacity decreases. Floodplain soils can only develop high concentrations of OC if there are high rates of OC input. However, the capacity of the soils to store OC regulates that input, and is determined by the competing influences of sorption capacity and the combination of respiration rate and OC export. See the text for further details.
OC sorption capacity reflects a few specific processes. Although soil texture generally relates to the ability of OC to sorb to mineral grains and resulting OC availability, soil chemistry also plays a strong and potentially dominant role in regulating OC sorption capacity (Rasmussen et al., 2018). Soil texture is largely determined by valley morphology according to our modeling (Table 1), placing valley morphology and resulting sediment transport dynamics (Gran and Czuba, 2017; Wohl et al., 2017b) as indirect controls on sorption capacity.
Respiration rate is largely determined by microbial activity and the availability of OC to microbes. Erosion can rapidly expose soil OC to microbial respiration (Berhe et al., 2007), whereas soils that reside in largely anoxic conditions can exhibit low rates of microbial respiration (Boye et al., 2017). In addition, soil mineralogy, chemistry, and redox conditions (Keiluweit et al., 2017) can regulate microbial activity (e.g., andic soils may limit microbial respiration; Matus et al., 2014). Our results suggesting that moisture controls OC content support the idea that drier soils likely have higher rates of microbial respiration of OC. Moisture is a function of texture, valley bottom morphology, and elevation (a proxy for temperature) in our modeling (Table 1). Comparing floodplain types in the wet basin, we find that types with standing water exhibit significantly higher soil moisture contents than those without standing water. This indicates spatial variability in moisture content and likely microbial activity (Howard and Howard, 1993). In our modeling, this effect translates to spatial variability in OC concentration within floodplains and across entire basins.
OC export from soils refers specifically to leaching of dissolved OC, mainly from shallow soils. While we do not directly consider OC export in this study, it likely introduces variability in soil OC concentration and is regulated dominantly by hydrology (Ågren et al., 2014; Mcdowell and Likens, 1988), soil pore water chemistry (including pH and ionic strength; Brooks et al., 1999; Evans et al., 2006), and redox conditions (Knorr, 2013). OC export as DOC can act in conjunction with respiration to remove OC from soils and, like respiration rate, is countered by sorption capacity.
To summarize, OC inputs, regulated by the capacity of soils to store OC and suppress microbial respiration and OC export, determine OC concentrations in floodplain soils (Fig. 4). OC inputs to floodplain soils come from either autochthonous litter accumulation on the floodplain surface, allochthonous wood deposition, or allochthonous deposition of fine, OC-bearing sediments. Our results from the mountainous basins we studied suggest that deposition of fine material in overbank flows is rare, leading us to infer that autochthonous litter and allochthonous wood inputs to floodplains dominate OC input in mountain rivers. Where soils are more moist, microbial respiration is inhibited and more OC is stored. Although soil texture is likely not a limiting factor on OC concentration in these floodplains, finer-textured soils likely have a higher sorption capacity, retaining more of the OC input from decaying plant material. Our results indicate that geomorphic and hydrologic characteristics act as boundary conditions that regulate soil texture and moisture, in turn regulating sorption capacity, respiration rate, and resulting OC concentrations in floodplain soils.
We present floodplain soil OC concentration data from two disparate watersheds to compare how interbasin variability between the two watersheds compares with intra-basin variability in geomorphic and hydrologic characteristics in determining OC concentration. Our results indicate that OC concentration in mountain floodplain soils does not vary predictably along a longitudinal gradient, nor does it vary substantially between basins with differing climatic and vegetation characteristics. Instead, geomorphic and hydrologic characteristics, such as valley bottom morphology and soil moisture, dominantly determine floodplain OC concentration.
In our study basins, decaying litter and wood, and not overbank deposition of fine, OC-bearing sediment, is the main source of OC to floodplain soils. It is unclear whether that decaying vegetation is dominated by autochthonous litter inputs or transported downed wood. In comparing our basin to other studied floodplain soils, it seems that vegetation dynamics play a strong role in determining OC concentrations when fine sediment is not regularly deposited on floodplain surfaces. However, we suggest that floodplain soil characteristics, set by geomorphic and hydrologic conditions, regulate how OC inputs translate to the spatial distribution of OC along a river network.
This implies that OC storage in floodplains likely cannot be predicted using consistent downstream trends and that management prioritization designed to facilitate floodplain OC storage should be based on local geomorphic and hydrologic process variability within each basin. For instance, management to increase OC sequestration in floodplain soils will likely be more effective where floodplains are unconfined and soils already experience high moisture conditions for much of the year. Along these lines, our results show that modeling the floodplain biospheric OC pool to predict its response to warming and subsequent effects on climate based on regional factors such as climate and net primary productivity likely misses the substantial interbasin variability in OC concentration and storage resulting from variability in valley bottom geometry and both geomorphic and hydrologic processes (e.g., Doetterl et al., 2015).
Although our results provide some insights, the question of whether OC stored in floodplain soil comes dominantly from allochthonous versus autochthonous sources remains open. Our results imply that more productive, spatially heterogeneous floodplains likely input more OC to soils. Floodplain OC concentration, while mediated largely by moisture dynamics, likely depends mainly on OC inputs from productive riparian forests. This implies that management of OC storage in mountain river floodplains should focus on the restoration of riparian zones to maintain OC input to soil (e.g., Bullinger-Weber et al., 2014). More detailed studies in regions with varying sediment transport and hydrologic regimes are needed to determine what conditions favor autochthonous versus allochthonous OC inputs, but our results suggest that autochthonous sources dominate floodplain OC storage in basins with relatively low rates of vertical accretion and high channel–floodplain connectivity that promotes floodplain wetlands.
Data to support the analyses presented here can be found in Table S1 and in the Colorado State University Digital Repository (Scott and Wohl, 2018a).
The supplement related to this article is available online at: https://doi.org/10.5194/esurf-6-1101-2018-supplement.
Field data collection was conducted primarily by DNS with assistance from EEW at some sites in the Middle Fork Snoqualmie basin. DNS performed data analysis and drafted the initial version of the paper, which was then edited and rewritten by DNS and EEW.
The authors declare that they have no conflict of interest.
This work was funded by NSF grant EAR-1562713. We thank Ellen Daugherty for
extensive assistance in fieldwork and discussion that improved the
conceptual model. We thank Katherine Lininger for stimulating discussion that
improved the paper. Detailed and constructive comments from two
anonymous reviewers and Robert Hilton improved the paper. We thank Sara
Lowe for assistance in processing and analyzing soil samples.
Edited by: Robert Hilton
Reviewed by: two anonymous referees
Ågren, A. M., Buffam, I., Cooper, D. M., Tiwari, T., Evans, C. D., and Laudon, H.: Can the heterogeneity in stream dissolved organic carbon be explained by contributing landscape elements?, Biogeosciences, 11, 1199–1213, https://doi.org/10.5194/bg-11-1199-2014, 2014.
Appling, A. P., Bernhardt, E. S., and Stanford, J. A.: Floodplain biogeochemical mosaics: A multi-dimensional view of alluvial soils, J. Geophys. Res.-Biogeo., 119, 1538–1553, https://doi.org/10.1002/2013JG002543, 2014.
Aufdenkampe, A. K., Mayorga, E., Raymond, P. A., Melack, J. M., Doney, S. C., Alin, S. R., Aalto, R. E., and Yoo, K.: Riverine coupling of biogeochemical cycles between land, oceans, and atmosphere, Front. Ecol. Environ., 9, 53–60, https://doi.org/10.1890/100014, 2011.
Ballantyne, A. P., Alden, C. B., Miller, J. B., Tans, P. P., and White, J. W. C.: Increase in observed net carbon dioxide uptake by land and oceans during the past 50 years, Nature, 488, 70–73, https://doi.org/10.1038/nature11299, 2012.
Bao, H., Kao, S., Lee, T., Zehetner, F., Huang, J., Chang, Y., Lu, J., and Lee, J.: Distribution of organic carbon and lignin in soils in a subtropical small mountainous river basin, Geoderma, 306, 81–88, https://doi.org/10.1016/j.geoderma.2017.07.011, 2017.
Battin, T. J., Luyssaert, S., Kaplan, L. A., Aufdenkampe, A. K., Richter, A., and Tranvik, L. J.: The boundless carbon cycle, Nat. Geosci., 2, 598–600, https://doi.org/10.1038/ngeo618, 2009.
Benfield, E. F.: Comparison of Litterfall Input to Streams, J. N. Am. Benthol. Soc., 16, 104–108, https://doi.org/10.2307/1468242, 1997.
Berhe, A. A., Harte, J., Harden, J. W., and Torn, M. S.: The significance of the erosion-induced terrestrial carbon sink, Bioscience, 57, 337–346, https://doi.org/10.1641/B570408, 2007.
Blazejewski, G. A., Stolt, M. H., Gold, A. J., Gurwick, N., and Groffman, P. M.: Spatial Distribution of Carbon in the Subsurface of Riparian Zones, Soil Sci. Soc. Am. J., 73, 1733, https://doi.org/10.2136/sssaj2007.0386, 2009.
Boye, K., Noël, V., Tfaily, M. M., Bone, S. E., Williams, K. H., Bargar, J. R., and Fendorf, S.: Thermodynamically controlled preservation of organic carbon in floodplains, Nat. Geosci., 10, 415–419, https://doi.org/10.1038/NGEO2940, 2017.
Brooks, P. D., Mcknight, D. M., and Bencala, K. E.: The relationship between soil heterotrophic activity, soil dissolved organic carbon (DOC) leachate, and catchment-scale DOC export in headwater catchments, Water Resour. Res., 35, 1895–1902, 1999.
Bullinger-Weber, G., Le Bayon, R.-C. C., Thébault, A., Schlaepfer, R., and Guenat, C.: Carbon storage and soil organic matter stabilisation in near-natural, restored and embanked Swiss floodplains, Geoderma, 228–229, 122–131, https://doi.org/10.1016/j.geoderma.2013.12.029, 2014.
D'Elia, A. H., Liles, G. C., Viers, J. H., and Smart, D. R.: Deep carbon storage potential of buried floodplain soils, Sci. Rep.-UK, 7, 8181, https://doi.org/10.1038/s41598-017-06494-4, 2017.
Doetterl, S., Stevens, A., Six, J., Merckx, R., Van Oost, K., Pinto, M. C., Casanova-katny, A., Muñoz, C., Boudin, M., Venegas, E. Z., and Boeckx, P.: Soil carbon storage controlled by interactions between geochemistry and climate, Nat. Geosci., 8, 780–783, https://doi.org/10.1038/NGEO2516, 2015.
Evans, C. D., Chapman, P. J., Clark, J. M., Monteith, D. T., and Cresser, M. S.: Alternative explanations for rising dissolved organic carbon export from organic soils, Glob. Change Biol., 12, 2044–2053, https://doi.org/10.1111/j.1365-2486.2006.01241.x, 2006.
Fall, P. L.: Modern Pollen Spectra and Vegetation in the Wind River Range, Wyoming, USA, Arctic Alpine Res., 26, 383–392, 1994.
Falloon, P., Jones, C. D., Ades, M., and Paul, K.: Direct soil moisture controls of future global soil carbon changes: An important source of uncertainty, Global Biogeochem. Cy., 25, 1–14, https://doi.org/10.1029/2010GB003938, 2011.
Gran, K. B. and Czuba, J. A.: Sediment pulse evolution and the role of network structure, Geomorphology, 277, 17–30, https://doi.org/10.1016/j.geomorph.2015.12.015, 2017.
Hanberry, B. B., Kabrick, J. M., and He, H. S.: Potential tree and soil carbon storage in a major historical floodplain forest with disrupted ecological function, Perspect. Plant Ecol., 17, 17–23, https://doi.org/10.1016/j.ppees.2014.12.002, 2015.
Harvey, J. W. and Gooseff, M.: River corridor science: Hydrologic exchange and ecological consequences frombedforms to basins, Water Resour. Res., 51, 6893–6922, https://doi.org/10.1002/2015WR017617, 2015.
Hilton, R. G., Galy, A., Hovius, N., Horng, M. J., and Chen, H.: Efficient transport of fossil organic carbon to the ocean by steep mountain rivers: An orogenic carbon sequestration mechanism, Geology, 39, 71–74, https://doi.org/10.1130/G31352.1, 2011.
Hoffmann, T., Glatzel, S., and Dikau, R.: A carbon storage perspective on alluvial sediment storage in the Rhine catchment, Geomorphology, 108, 127–137, https://doi.org/10.1016/j.geomorph.2007.11.015, 2009.
Holm, S.: A Simple Sequentially Rejective Multiple Test Procedure, Scand. J. Stat., 6, 65–70, 1979.
Homer, C. G., Dewitz, J. A., Yang, L., Jin, S., Danielson, P., Xian, G., Coulston, J., Herold, N. D., Wickham, J. D., and Megown, K.: Completion of the 2011 National Land Cover Database for the conterminous United States-Representing a decade of land cover change information, Photogramm. Eng. Rem. S., 81, 345–354, 2015.
Hoogsteen, M. J. J., Lantinga, E. A., Bakker, E. J., Groot, J. C. J., and Tittonell, P. A.: Estimating soil organic carbon through loss on ignition: Effects of ignition conditions and structural water loss, Eur. J. Soil Sci., 66, 320–328, https://doi.org/10.1111/ejss.12224, 2015.
Houston, D. B.: Wildfires in Northern Yellowstone National Park, Ecology, 54, 1111–1117, https://doi.org/10.2307/1935577, 1973.
Howard, D. M. and Howard, P. J. A.: Relationships between CO2 evolution, moisture content and temperature for a range of soil types, Soil Biol. Biochem., 25, 1537–1546, https://doi.org/10.1016/0038-0717(93)90008-Y, 1993.
Jobbágy, E. G. and Jackson, R. B.: The vertical distribution of soil organic carbon and its relation to climate and vegetation, Ecol. Appl., 10, 423–436, https://doi.org/10.1890/1051-0761(2000)010[0423:TVDOSO]2.0.CO;2, 2000.
Kaiser, K. and Guggenberger, G.: The role of DOM sorption to mineral surfaces in the preservation of organic matter in soils, Org. Geochem., 31, 711–725, https://doi.org/10.1016/S0146-6380(00)00046-2, 2000.
Keiluweit, M., Wanzek, T., Kleber, M., Nico, P., and Fendorf, S.: Anaerobic microsites have an unaccounted role in soil carbon stabilization, Nat. Commun., 8, 1–8, https://doi.org/10.1038/s41467-017-01406-6, 2017.
Knorr, K.-H.: DOC-dynamics in a small headwater catchment as driven by redox fluctuations and hydrological flow paths – are DOC exports mediated by iron reduction/oxidation cycles?, Biogeosciences, 10, 891–904, https://doi.org/10.5194/bg-10-891-2013, 2013.
Leithold, E. L., Blair, N. E., and Wegmann, K. W.: Source-to-sink sedimentary systems and global carbon burial: A river runs through it, Earth-Sci. Rev., 153, 30–42, https://doi.org/10.1016/j.earscirev.2015.10.011, 2016.
Lininger, K. B., Wohl, E., and Rose, J. R.: Geomorphic Controls on Floodplain Soil Organic Carbon in the Yukon Flats, Interior Alaska, From Reach to River Basin Scales, Water Resour. Res., 54, 1934–1951, https://doi.org/10.1002/2017WR022042, 2018.
Loope, L. L. and Gruell, G. E.: The ecological role of fire in the Jackson Hole area, northwestern Wyoming, Quatenary Res., 3, 425–443, https://doi.org/10.1016/0033-5894(73)90007-0, 1973.
Matus, F., Rumpel, C., Neculman, R., Panichini, M., and Mora, M. L.: Soil carbon storage and stabilisation in andic soils: A review, Catena, 120, 102–110, https://doi.org/10.1016/j.catena.2014.04.008, 2014.
Mcdowell, W. H. and Likens, G. E.: Origin, Composition, and Flux of Dissolved Organic Carbon in the Hubbard Brook Valley, Ecol. Monogr., 58, 177–195, 1988.
Montgomery, D. R. and Buffington, J. M.: Channel-reach morphology in mountain drainage basins, Bull. Geol. Soc. Am., 109, 596–611, 1997.
Omengo, F. O., Geeraert, N., Bouillon, S., and Govers, G.: Deposition and fate of organic carbon in floodplains along a tropical semiarid lowland river (Tana River, Kenya), J. Geophys. Res.-Biogeo., 121, 1131–1143, https://doi.org/10.1002/2015JG003288, 2016.
Oregon State University: PRISM Climate Group, 2004.
Rasmussen, C., Heckman, K., Wieder, W. R., Keiluweit, M., Lawrence, C. R., Berhe, A. A., Blankinship, J. C., Crow, S. E., Druhan, J. L., Hicks Pries, C. E., Marin-Spiotta, E., Plante, A. F., Schädel, C., Schimel, J. P., Sierra, C. A., Thompson, A., and Wagai, R.: Beyond clay: towards an improved set of variables for predicting soil organic matter content, Biogeochemistry, 137, 297–306, https://doi.org/10.1007/s10533-018-0424-3, 2018.
Rathburn, S., Bennett, G. L., Wohl, E., Briles, C., McElroy, B., and Sutfin, N.: The fate of sediment, wood, and organic carbon eroded during an extreme flood, Colorado Front Range, USA, Geology, 45, 1–14, https://doi.org/10.1130/G38935.1, 2017.
R Core Team: R: A Language and Environment for Statistical Computing, 2017.
Ricker, M. C., Stolt, M. H., Donohue, S. W., Blazejewski, G. A., and Zavada, M. S.: Soil Organic Carbon Pools in Riparian Landscapes of Southern New England, Soil Sci. Soc. Am. J., 77, 1070–1079, https://doi.org/10.2136/sssaj2012.0297, 2013.
Schimel, D. S. and Braswell, B. H.: The role of mid-latitude mountains in the carbon cycle: Global perspective and a Western U.S. case study, in: Global Change and Mountain Regions, edited by: Huber, U. M., Bugmann, H. K. M., and Reasoner, M. A., Springer, 449–456, 2005.
Schmidt, M. W. I. I., Torn, M. S., Abiven, S., Dittmar, T., Guggenberger, G., Janssens, I. A., Kleber, M., Kögel-Knabner, I., Lehmann, J., Manning, D. A. C. C., Nannipieri, P., Rasse, D. P., Weiner, S., and Trumbore, S. E.: Persistence of soil organic matter as an ecosystem property, Nature, 478, 49–56, https://doi.org/10.1038/nature10386, 2011.
Scott, D. N. and Wohl, E.: Evaluating Carbon Storage on Subalpine Lake Deltas, Earth Surf. Proc. Land., 42, 1472–1481, https://doi.org/10.1002/esp.4110, 2017.
Scott, D. and Wohl, E.: Dataset for Geomorphic regulation of floodplain soil organic carbon concentration in watersheds of the Rocky and Cascade Mountains, USA, https://doi.org/10.25675/10217/187762, 2018a.
Scott, D. N. and Wohl, E.: Natural and Anthropogenic Controls on Wood Loads in River Corridors of the Rocky, Cascade, and Olympic Mountains, USA, Water Resour. Res., https://doi.org/doi.org/10.1029/2018WR022754, 2018b.
Smithwick, E., Harmon, M. E., Remillard, S. M., Acker, S. A., and Franklin, J. F.: Potential upper bounds of carbon stores in forests of the Pacific Northwest, Ecol. Appl., 12, 1303–1317, https://doi.org/10.1890/1051-0761(2002)012[1303:PUBOCS]2.0.CO;2, 2002.
Sparks, D. L.: Methods of Soil Analysis. Part 3, Chemical Methods, edited by: Sparks, D. L., Page, A. L., Helmke, P. A., Loeppert, R. H., Soltanpour, P. N., Tabatabai, M. A., Johnston, C. T., Sumber, M. E., Bartels, J. M., and Bingham, J. M., Soil Science Society of America, Inc., Madison, Wisconsin, 1996.
Sun, O. J., Campbell, J., Law, B. E., and Wolf, V.: Dynamics of carbon stocks in soils and detritus across chronosequences of different forest types in the Pacific Northwest, USA, Glob. Change Biol., 10, 1470–1481, https://doi.org/10.1111/j.1365-2486.2004.00829.x, 2004.
Sutfin, N. A. and Wohl, E.: Substantial soil organic carbon retention along floodplains of mountain streams, J. Geophys. Res.-Earth, 122, 1325–1338, https://doi.org/10.1002/2016JF004004, 2017.
Sutfin, N. A., Wohl, E., and Dwire, K. A.: Banking carbon: A review of organic carbon storage and physical factors influencing retention in floodplains and riparian ecosystems, Earth Surf. Proc. Land., 60, 38–60, https://doi.org/10.1002/esp.3857, 2016.
Thien, S. J.: A flow diagram for teaching texture-by-feel analysis, J. Agron. Educ., 8, 54–55, 1979.
Wagenmakers, E.-J. and Farrell, S.: AIC model selection using Akaike weights, Psychon. B. Rev., 11, 192–196, https://doi.org/10.3758/BF03206482, 2004.
Wilcoxon, F.: Individual Comparisons by Ranking Methods, Biometrics Bull., 1, 80–83, https://doi.org/10.2307/3001946, 1945.
Wohl, E.: Floodplains and wood, Earth-Sci. Rev., 123, 194–212, https://doi.org/10.1016/j.earscirev.2013.04.009, 2013.
Wohl, E. and Pfeiffer, A.: Organic carbon storage in floodplain soils of the U.S. prairies, River Res. Appl., 34, 406–416, https://doi.org/10.1002/rra.3269, 2018.
Wohl, E., Dwire, K., Sutfin, N., Polvi, L. and Bazan, R.: Mechanisms of carbon storage in mountainous headwater rivers, Nat. Commun., 3, 1263, https://doi.org/10.1038/ncomms2274, 2012.
Wohl, E., Hall, R. O., Lininger, K. B., Sutfin, N. A., and Walters, D. M.: Carbon dynamics of river corridors and the effects of human alterations, Ecol. Monogr., 87, 379–409, https://doi.org/10.1002/ecm.1261, 2017a.
Wohl, E., Lininger, K. B., and Scott, D. N.: River beads as a conceptual framework for building carbon storage and resilience to extreme climate events into river management, Biogeochemistry, 1–19, https://doi.org/10.1007/s10533-017-0397-7, 2017b.
Zhao, B., Li, Z., Li, P., Xu, G., Gao, H., Cheng, Y., Chang, E., Yuan, S., Zhang, Y., and Feng, Z.: Spatial distribution of soil organic carbon and its influencing factors under the condition of ecological construction in a hilly-gully watershed of the Loess Plateau, China, Geoderma, 296, 10–17, https://doi.org/10.1016/j.geoderma.2017.02.010, 2017.