the Creative Commons Attribution 3.0 License.
the Creative Commons Attribution 3.0 License.
Establishing a sediment budget in the newly created “Kleine Noordwaard” wetland area in the Rhine–Meuse delta
Eveline Christien van der Deijl
Marcel van der Perk
Hans Middelkoop
Many deltas are threatened by accelerated soil subsidence, sea-level rise, increasing river discharge, and sediment starvation. Effective delta restoration and effective river management require a thorough understanding of the mechanisms of sediment deposition, erosion, and their controls. Sediment dynamics has been studied at floodplains and marshes, but little is known about the sediment dynamics and budget of newly created wetlands. Here we take advantage of a recently opened tidal freshwater system to study both the mechanisms and controls of sediment deposition and erosion in newly created wetlands. We quantified both the magnitude and spatial patterns of sedimentation and erosion in a former polder area in which water and sediment have been reintroduced since 2008. Based on terrestrial and bathymetric elevation data, supplemented with field observations of the location and height of cut banks and the thickness of the newly deposited layer of sediment, we determined the sediment budget of the study area for the period 2008–2015. Deposition primarily took place in channels in the central part of the former polder area, whereas channels near the inlet and outlet of the area experienced considerable erosion. In the intertidal area, sand deposition especially takes place at low-lying locations close to the channels. Mud deposition typically occurs further away from the channels, but sediment is in general uniformly distributed over the intertidal area, due to the presence of topographic irregularities and micro-topographic flow paths. Marsh erosion does not significantly contribute to the total sediment budget, because wind wave formation is limited by the length of the fetch. Consecutive measurements of channel bathymetry show a decrease in erosion and deposition rates over time, but the overall results of this study indicate that the area functions as a sediment trap. The total contemporary sediment budget of the study area amounts to 35.7×10³ m3 year−1, which corresponds to a net area-averaged deposition rate of 6.1 mm year−1. This is enough to compensate for the actual rates of sea-level rise and soil subsidence in the Netherlands.
- Article
(1932 KB) - Full-text XML
- BibTeX
- EndNote


Many deltas in the world cope with drowning and loss of delta land due to flood-protected polders, dams, and embankments of channels, which result in accelerated soil subsidence and sediment starvation (Ibáñez et al., 1997, 2014; Syvitski and Saito, 2007). The urgency of this problem is enhanced by sea-level rise (Syvitski, 2008) or increasing river discharge. Most deltas are valuable and densely populated because of their ideal location for harbors, agriculture, aquaculture, and tourism (Ibáñez et al., 2014; Kirwan and Megonigal, 2013). Moreover, they encompass vast wetland areas of great ecological value. Traditional approaches in river management aim at reducing flood risks by constructing dikes and dams. Although such constructions are often effective in reducing flood risks, they disrupt the morphodynamic processes and ecological functioning of the system, increase sediment starvation, and involve high costs for construction and maintenance (Hudson et al., 2008). Therefore, river delta management has recently been shifting from the implementation of these strong regulations towards the control of a more natural system where dynamic processes are restored and the system becomes multifunctional. Examples include the Tidal River Management project in Bangladesh (Khadim et al., 2013), the diversion projects in the Mississippi deltaic plain (Day et al., 2007; DeLaune et al., 2003; Paola et al., 2011), the Plan Integrale de Protección del Delta Ebro in the Ebro Delta (Calvo-Cubero et al., 2013), and the Room for the River initiative in the Netherlands (Rijke et al., 2012).
Paola et al. (2011) defined river delta restoration as diverting sediment and water from major channels into adjoining drowned areas, where the sediment can build new land and provide a platform for regenerating wetland ecosystems. Delta restoration is effective when sedimentation compensates for sea-level rise and soil subsidence. Table 1 summarizes sedimentation rates determined in various types of delta compartments representing different depositional environments. Sedimentation is variable and complex. This table suggests that sedimentation is positively related to the suspended sediment concentration. Furthermore, it is widely known from the literature that sedimentation is controlled by the frequency and duration of inundation (French and Spencer, 1993; Middelkoop and van der Perk, 1998; Reed et al., 1999; Temmerman et al., 2003; Thonon et al., 2007), the suspended sediment concentration in the feeding channel (Asselman and Middelkoop, 1998; French and Spencer, 1993), and the ability of sediment to settle, which is in turn controlled by vegetation (Darke and Megonigal, 2003; Mitsch et al., 2014; Schile et al., 2014; Temmerman et al., 2005b), the flow paths to or within the wetland/compartment (French and Spencer, 1993; Siobhan Fennessy et al., 1994; Reed et al., 1999; Davidson-Arnott et al.,2002; Temmerman et al., 2003; Anderson and Mitsch, 2007; Mitsch et al., 2014), and the residence time within the compartment (Asselman and Van Wijngaarden, 2002). Although considerable research has been devoted to sedimentation in wetlands in coastal deltas and river floodplains, remarkably few empirical field studies have been reported on the initial formation and evolution of newly created wetlands.
In the present study, we take advantage of a recently opened tidal freshwater system to study the sediment deposition or erosion in newly created tidal wetlands. In the framework of the Room for the River (RfR) initiative in the Netherlands, water and sediment have been reintroduced in previously embanked areas in the Biesbosch, a tidal freshwater wetland (TFW) in the south-west of the Netherlands. This paper presents the first results of a larger field research project examining mechanisms and controls of sediment deposition and erosion in the Biesbosch TFW.
Craft and Casey (2000)Craft and Casey (2000)Craft and Casey (2000)Reed et al. (1997)Bleuten et al. (2009)Middelkoop and Asselman (1998)Middelkoop (1997)Gell et al. (2009)Day et al. (2016)French and Spencer (1993)Anderson and Mitsch (2006)Neubauer et al. (2002)van Wijnen and Bakker (2001)Hung et al. (2014a, b)Reed et al. (1999)Siobhan Fennessy et al. (1994)Pasternack and Brush (2001)van Proosdij et al. (2006a, b)Darke and Megonigal (2003)Calvo-Cubero et al. (2013)Mitsch et al. (2014)Calvo-Cubero et al. (2013)Pethick (1981)Leonard (1997)Darke and Megonigal (2003)Islam et al. (1999)Auerbach et al. (2015)Table 1Net sedimentation and deposition in various types of delta compartments. When a source only gives deposition in volume, the concomitant change in height is calculated using a sediment density of 1150 kg m−3.
The aim of this paper is to quantify both the magnitude and the spatial patterns of sediment deposition and erosion in one of the formerly embanked areas, referred to as the “Kleine Noordwaard”. For this, different sources of data were combined. Net sedimentation rates were determined from existing bathymetric data collected by a multibeam echosounder, existing lidar digital elevation models, supplemented by field observations of the thickness of the newly deposited sediment layer and field observations of the location and height of cut banks. From this, we developed a medium-to long-term sediment budget for the Kleine Noordwaard. In this paper, we compare the rates and patterns of sedimentation and erosion in the study area to those in other wetlands, assess the relative contribution of geomorphological processes in the study area, and discuss practical implications for the management of newly created tidal freshwater wetlands.
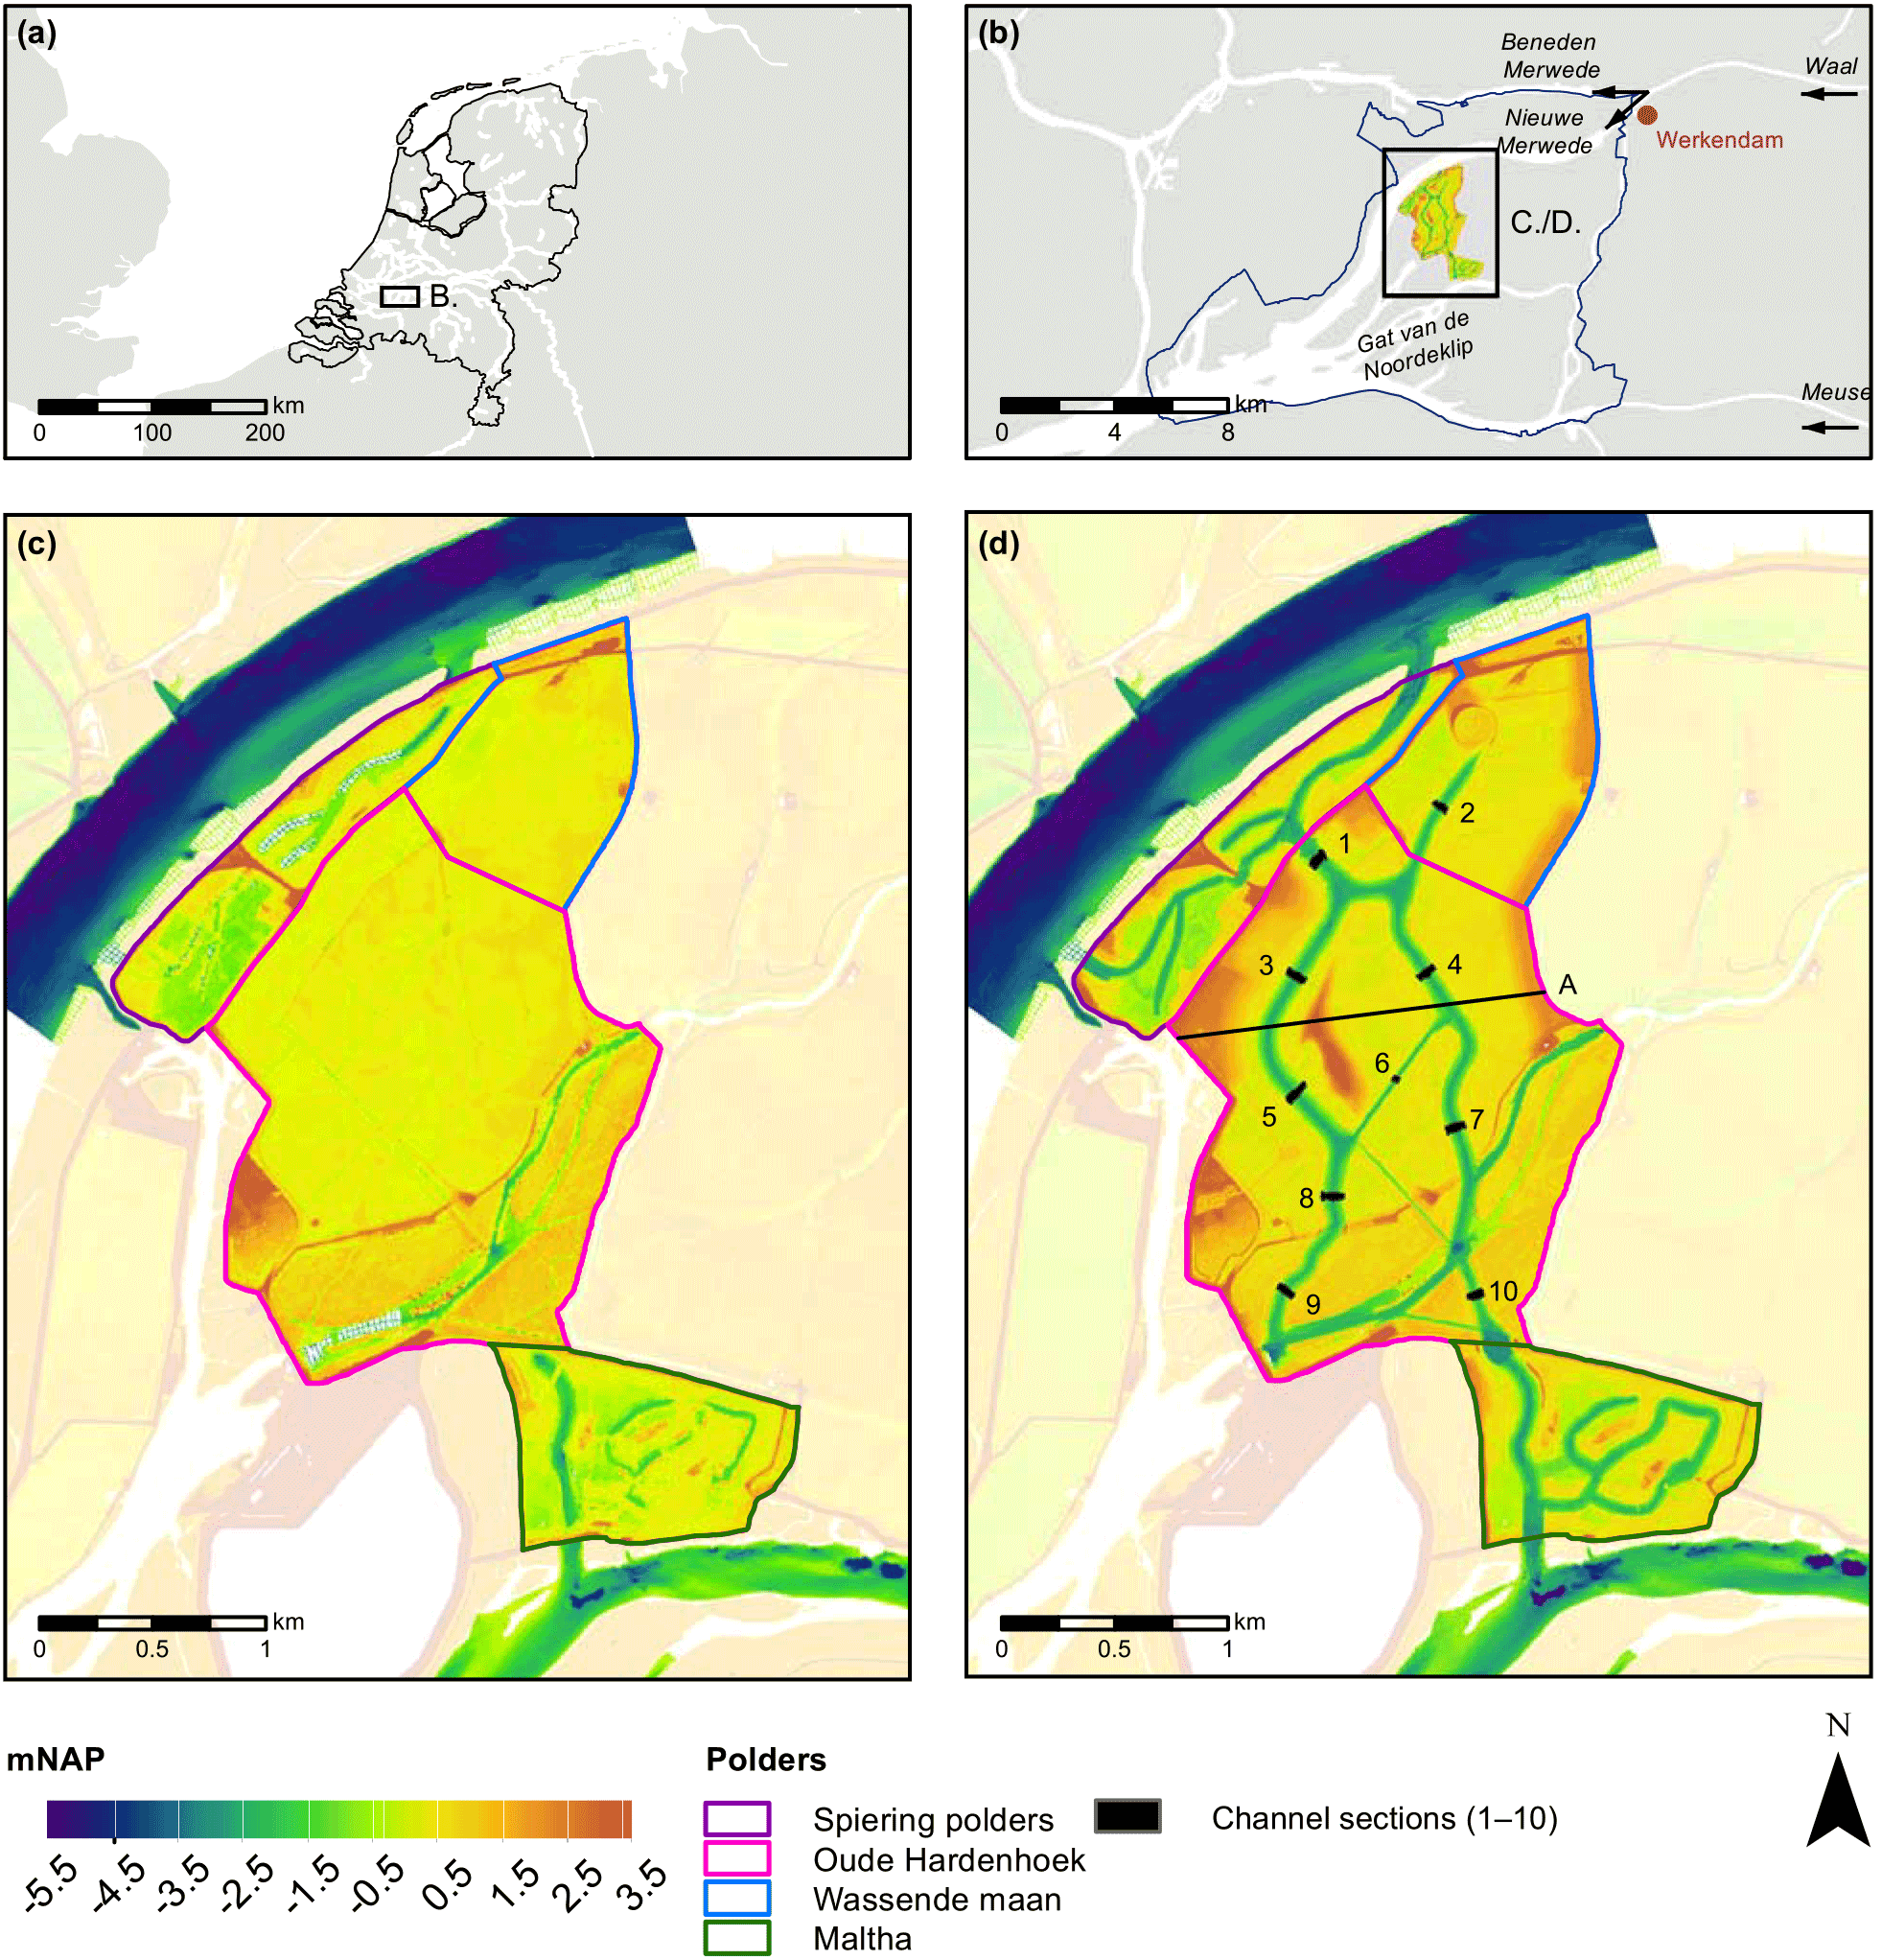
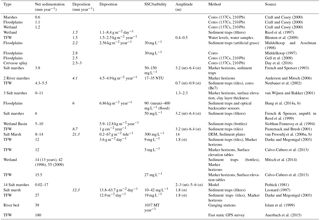
Figure 1The study area of the Kleine Noordwaard, which is located within the Biesbosch tidal freshwater wetland, in the lower Rhine–Meuse delta in the southwest of the Netherlands (a, b). Elevation is shown in meters, with respect to the Dutch Ordnance Datum (NAP) for the period before (c) and after depoldering (d).
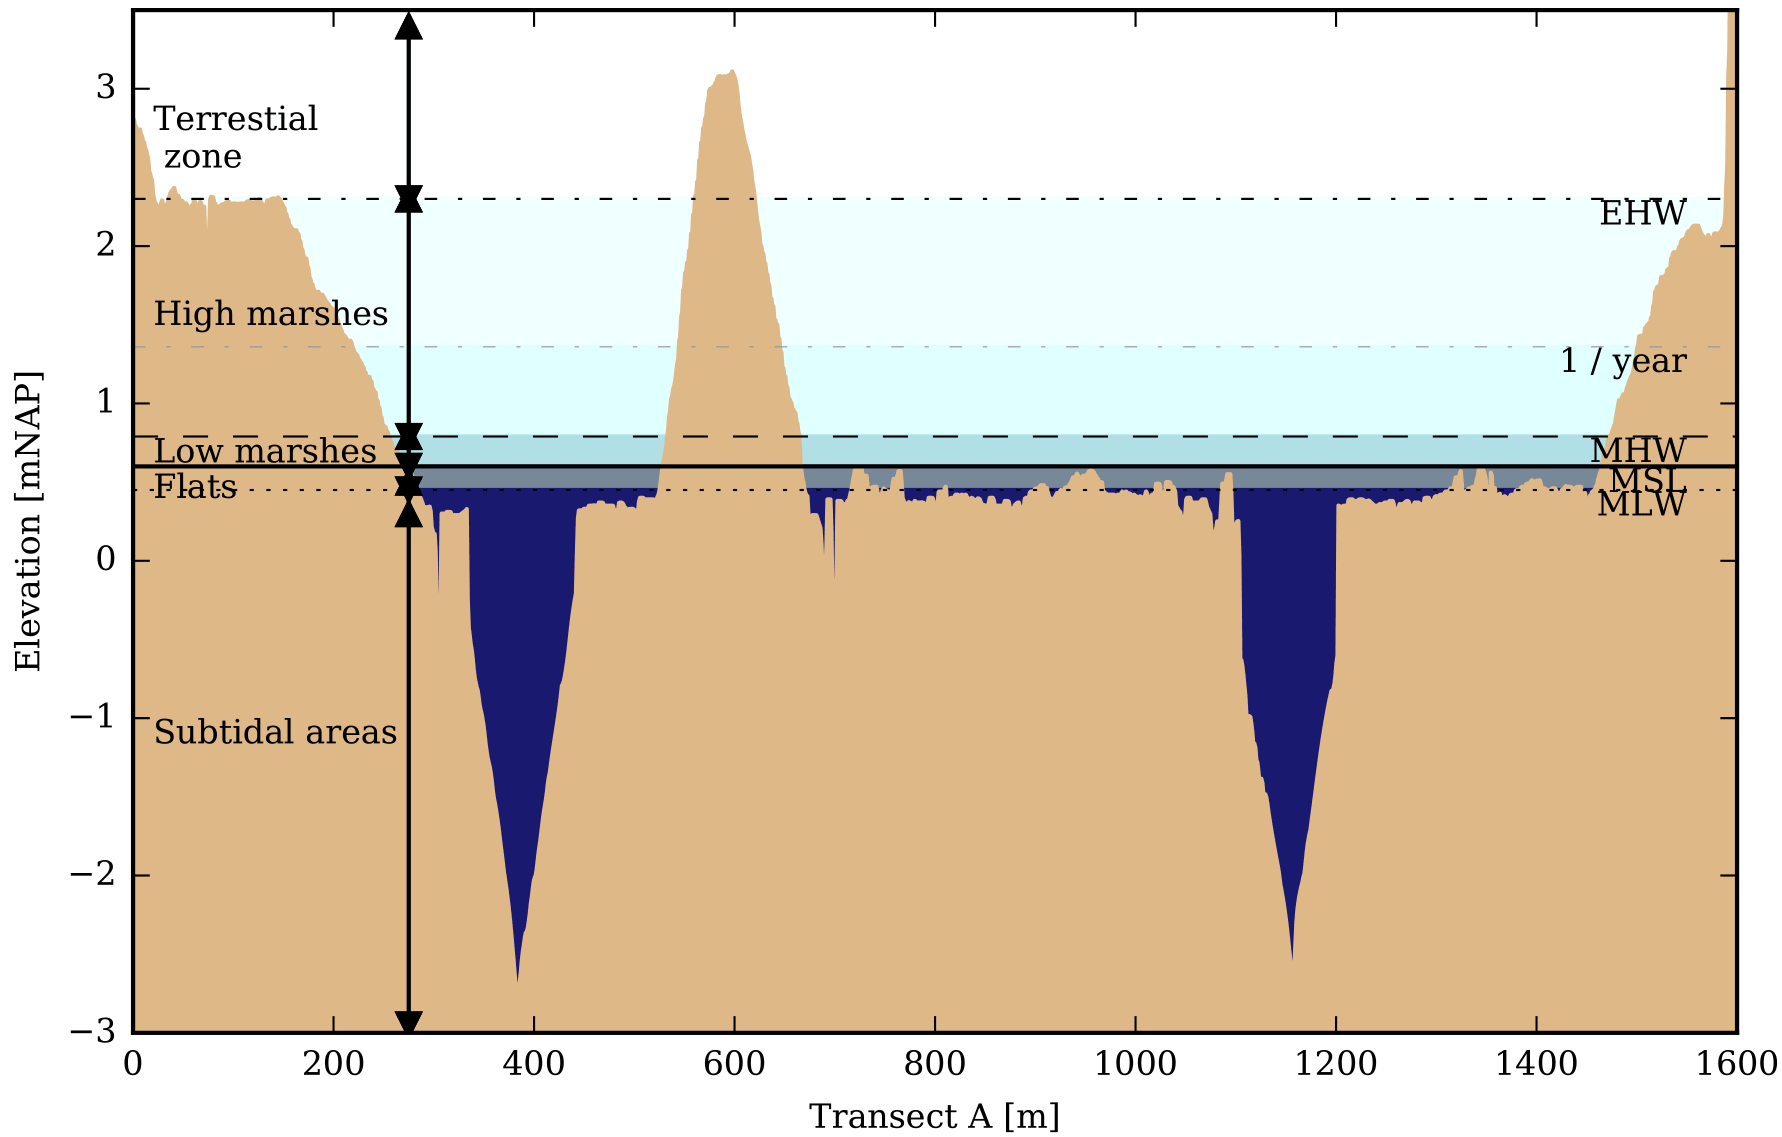
Figure 2Elevation of Transect A (see Fig. 1) with respect to the Dutch Ordnance Datum (m NAP) with subdivision of the area into subtidal areas, flats, low and high marshes, and terrestrial zone relative to mean low water (MLW), mean sea level (MSL), mean high water (MHW), the maximum observed water level (EHW) and the water level for a peak discharge or storm with return period of 1 year, which were used to divide the study area in.
2.1 Study area
The Biesbosch National Park is a 9000-hectare tidal freshwater wetland in the lower Rhine–Meuse delta in the southwest of the Netherlands (see Fig. 1a and b). The area was reclaimed in medieval times, but it became completely inundated by the St. Elisabeth flood, which was a combination of two storm surges and two floods of the river Rhine between 1421 and 1424 (Zonneveld, 1959). In the subsequent two centuries, an approximately six-meter thick deltaic splay developed (Kleinhans et al., 2010). The lower 4 m of this splay is sand, covered by 2 m of clay (De Bont et al., 2000). In AD 1861, the Nieuwe Merwede, an artificial branch of the river Rhine, was excavated through the area. As a consequence, water levels dropped and large parts of the wetland were embanked and reclaimed as polders for agriculture during the second half of the 19th century (De Bont et al., 2000; Rijsdorp et al., 2006). However, since 2008, several of these polder areas have been depoldered (i.e., reopened) for river water to increase the discharge capacity of the river Rhine. The study area of the Kleine Noordwaard was among the first polder areas that have been depoldered.
The Kleine Noordwaard study area comprises the former Spiering, Oude Hardenhoek, and Maltha polders (Fig. 1). Maps (c) and (d) represent the surface elevation before and after depoldering of the study area. In 2008, several channels with a width of 120 m, a maximum depth of 3 m, and a side slope of 1:20 (Fig. 2) were dug throughout the area. The sandy material was used to create islands and extra protection along the embankments (Grontmij, 2002). The original clayey polder soil remained conserved, except in the former Spiering and Maltha polders, where the upper layer of clay had already been removed for reinforcement of embankments. On 7 May 2008, the embankments were opened and the channels were connected to the river Nieuwe Merwede in the north and to the Gat van de Noorderklip in the south. The major flow direction is from north to south, and water and sediment are supplied by the river Nieuwe Merwede, which is a branch of the River Waal, the major distributary of the river Rhine (Fig. 1). The river Rhine has an average discharge of 2200 m3 s−1 and an average suspended sediment concentration of 15 mg L−1 at the German-Dutch border located 85 km upstream from the Kleine Noordwaard. Peak discharges typically occur during the winter season and they range between 5800 (1-year return) and 9670 m3 s−1 (10-year return) with maximum concentrations between 120 and 260 mg L−1 (Rijkswaterstaat, 2016).
Van der Deijl et al. (2017) have shown that water is in general imported in the north. Their field measurements in the period between July 2014 and March 2015 indicated that the time-averaged inflow of water from the Nieuwe Merwede through the former Spiering polder into the Oude Hardenbroek polder amounted to 89 m3 s−1 with a maximum of 191 m3 s−1. The time-averaged suspended sediment concentrations amounted to 26 mg L−1 with a maximum of 114 mg L−1 during a raised discharge event (4500 m3 s−1 at the German-Dutch border). The water flow direction at the northern inlet of the Oude Hardenbroek polder reverses during short periods at the onset of ebb tide, which occurred only during 2.2 % of the time. During this time, the outgoing average discharge was on average 11 m3 s−1. In the south, water is generally exported, but under conditions of a rapid rise of the water level at the onset of a flood tide, the flow reverses. In the observed period, this occurred only during 0.3 % of the time with a maximum discharge of 16 m3 s−1. Van der Deijl et al. (2017) determined the sediment trapping efficiency to be 0.29 during the above measurement period.
The water level is influenced by the tide, which is mixed semidiurnal with a range of approximately 0.2 to 0.4 m (Rijkswaterstaat, 2016), the wind direction and speed, the discharge of the river Rhine, and the artificially controlled discharge through the gates of the downstream Haringvliet barrier into the North Sea. Water levels are on average 0.63 m above Dutch Ordnance Datum (NAP), with a mean low water (MLW) of 0.45 m NAP and a mean high water (MHW) of 0.79 m NAP (Rijkswaterstaat, 2016). Approximately 29 % of the area is comprised of subtidal area (surface elevation <0.125 m NAP, always submerged), 36 % of intertidal flats (0.125–0.63 m NAP, submerged >44 % of the time), 6 % of low marshes (0.63–0.79 m NAP, submerged for 19–44 % of the time), 22 % of high marshes (0.79–2.3 m NAP, whereby areas >1.1 m NAP are only submerged for less than 5 % of the time), and 7 % of a terrestrial zone (see Fig. 2). In order to reduce the hydraulic roughness, the marshes and terrestrial zone are mown before the winter period, and most of the vegetation is effectively shortened through grazing by birds, horses, and cows. The vegetation can be classified as dry and wet grasslands with some Mentha aquatica, Schoenoplectus triqueter and Bolboschoenus maritimus at the shoreline. The mud flats are almost bare with some pioneer species such as Hydrodictyon reticulatum, Limosella aquatica, Veronica anagallis-aquatica and Pulicaria vulgaris. In the summer, some Myriophyllum spicatum grows locally in the open water (De la Haye, 2011).
2.2 Field methods
The sediment budget of the study area is established from the average net sedimentation in navigable channels (approximately 25 % of the study area), the average sedimentation in the subtidal area (<0.125 m NAP, excluding channels), sedimentation in the intertidal area (flats and marshes), and the eroded volume of the marsh edge. We first determined the volumetric budgets, which were subsequently converted to mass budgets using sediment densities measured from field samples.
2.2.1 Channels
The change in surface elevation over multiple years was used to determine the sediment budget and the spatial pattern of sedimentation and erosion in the navigable channels. Surface elevation was measured by Rijkswaterstaat during consecutive bathymetric surveys in all channels in 2009, 2010, 2012, and 2015. In 2011, 2013, and 2014, additional channel sections were surveyed (see Fig. 1d). The 2009–2015 measurement period was hydrologically characterized by a major flood between 8 and 19 January 2011 with a peak river discharge of 8315 m3 s−1 and an elevated suspended sediment concentration (SSC) of up to 260 mg L−1 at Lobith. Channel bed elevation was measured with a multi-beam Simrad EM3002d echosounder, combined with Netpos/long-range kinematic (LRK), and processed in Quality Positioning Services (QPS) QUINSy 8.0 (Ad Schipperen (Rijkswaterstaat CIV), personal communication, 2015). The total volumetric channel sediment budget was calculated from the difference in channel bed elevation between 2009 and 2015. Some channel sections (approximately 14 % of the total channel area) were dredged in 2015 and were therefore excluded from the 2015 bathymetric map. The sediment budget for the monitoring intervals 2009–2015 and 2012–2015 was corrected for this exclusion by using a correction factor of 0.99. For this, a linear relationship without intercept was established between the total channel sediment budget and the channel sediment budget without the dredged area, for the monitoring intervals 2009–2010, 2010–2011, and 2011–2012.
To analyze rates of net sedimentation and erosion of sediment over time, we used only areas from which data were collected during all surveys of 2009, 2010, 2012, and 2015. Survey data collected in the years of 2011, 2013, and 2014 were only used to assess whether changes in bed level had been consistent throughout the years.

Figure 3The difference in channel bed level and the cumulative channel bed volume for each monitoring period. The cumulative channel bed volume is shown along a N–S transect starting from the Spiering polders (purple in Fig. 1). The budget of the Wassende Maan (blue in Fig. 1) is added at the second black line. The channel in the southwest of the study area was dredged in the monitoring period 2012–2015. The dredged area is excluded in the analysis and not shown in the cumulative channel bed volume.
2.2.2 Subtidal and intertidal area
We determined the sediment budget of both the subtidal and the intertidal area by measuring the sedimentation on top of the former polder soil during field campaigns in July and October 2014. The former polder soil consists of a compact non-erodible layer of clay, which was used as marker horizon, since its color and density are clearly distinguishable from the recently deposited sediment (sand and mud). Transparent Perspex core samplers with a diameter of 59 mm and different lengths were used to collect 126 samples of the newly deposited sediment layer in nine transects across the central part of the Kleine Noordwaard (pink aligned area in Fig. 1). The Spiering and Maltha polders were not sampled because the non-erodible layer of clay was removed before depoldering. The thickness of the newly deposited sediment layer was measured using a ruler. In the field the texture of the sediment was classified visually as clay, sandy clay, coarse sand, fine sand, silty sand, sandy silt, or silt. Based on these texture classes, the sediment layers were classified into former polder bed (clay, sandy clay), newly deposited sand (coarse sand, fine sand, silty sand), and newly deposited mud (sandy silt or silt). Since channels were dug and sand was replaced by depoldering of the area, we selected only samples with a base of former polder clay for further analysis. Furthermore, samples with sand on top of the base of former polder clay were corrected for the replacement of sand for depoldering. The elevation at the sample location was used to separate the samples in datasets for the subtidal and intertidal area. The total sediment budget of the subtidal area was calculated by multiplying the average thickness of the recently deposited sediment layer from samples located below 0.125 m NAP by the total subtidal area. The total sediment budget of the intertidal area was calculated using a negative exponential relation between the measured sediment deposition and surface elevation, obtained from the AHN digital elevation model of the Netherlands (Actueel Hoogtebestand Nederland, 2017). For this process, ordinary least-square regression was performed between the logarithmic transformed measured sediment deposition and the surface elevation of the samples taken in the intertidal area. The back-transformed sediment deposition was bias-corrected using the Ferguson (1986) correction factor.
2.2.3 Marsh erosion
To determine the contribution of marsh erosion to the budget of the channels and intertidal area, we measured the height and position of cut banks using a ruler and a Trimble R8 RTK GPS during field campaigns in July and October 2014. The current cut bank position and height were compared to the 2011 50 cm resolution AHN2 digital elevation model of the Netherlands (Actueel Hoogtebestand Nederland, 2017), to calculate the volume of eroded land over the period 2011–2014.
2.2.4 Sediment budget
The total sediment budget of the study area was calculated by taking into account the different periods for which the individual budgets of the channels, the subtidal and intertidal area, and the eroded marshes were established. To obtain the total mass of the deposited sediment in the area, the volumetric sediment budget of the area was multiplied by the bulk density of the deposited sediment. Bulk density of sand, deposited in the channels, was determined gravimetrically by the weight of the terrestrial sediment in a pF-ring with a volume of 98.125 cm3. To determine the bulk density of the mud, a 59 mm diameter transparent Perspex core sampler was used to collect a 7 cm core with 4 cm of organic rich mud and the underlying former polder clay at the intertidal flat because a pF-ring could not be applied to mud. The core was subsampled at a 1 cm interval in the laboratory, and bulk density was determined by the weighted average sediment particle density and the volumetric moisture content of the samples. Moisture and organic matter content were determined from the difference in mass after oven drying at 105 ∘C and loss-on-ignition analysis at 550 ∘C, according to the standard techniques described by Heiri et al. (2001).
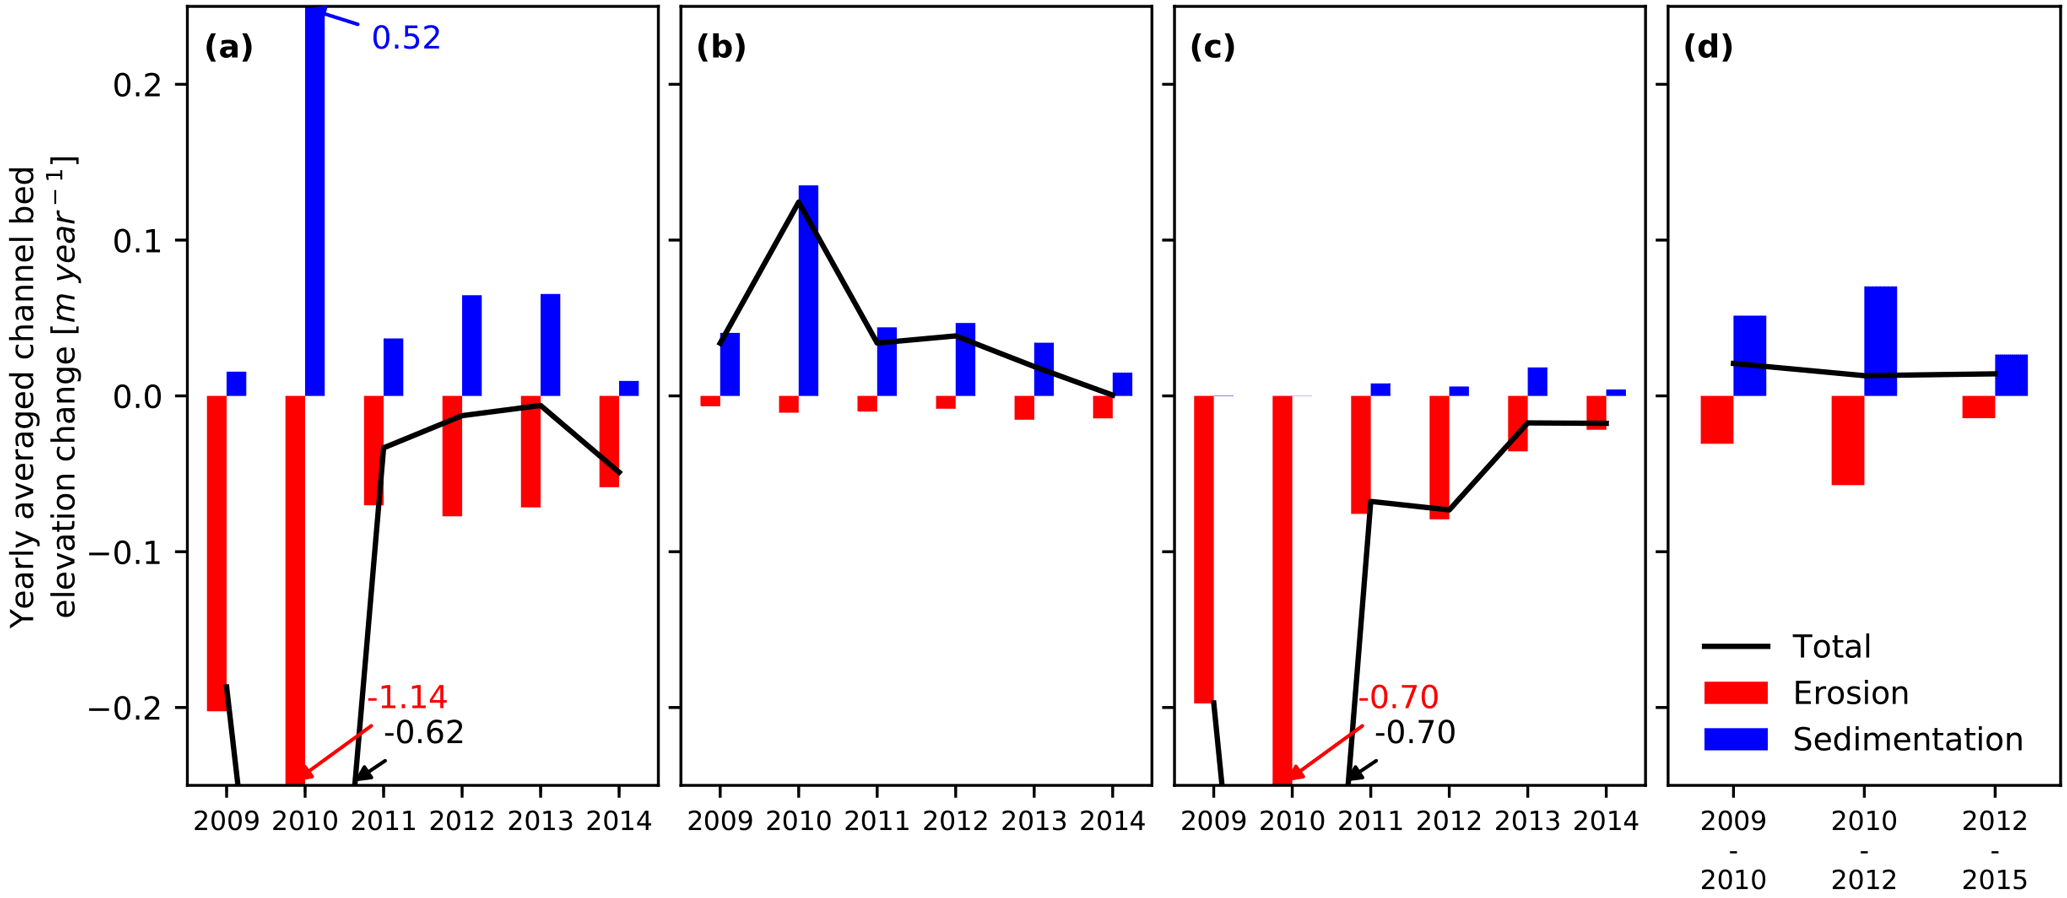
Figure 5The yearly averaged channel section sedimentation (blue bars), erosion (red bars) and total change in height (black lines) for the inlet (a), the center (b), the outlet (c) and the entire study area (d), which was opened 7 May 2008 and experienced a peak discharge event from 8 to 19 January 2011. Yearly averaged channel section sedimentation erosion and total change in height sedimentation rates for the entire area are only available for the periods 2009–2010, 2010–2012, and 2012–2015, since bathymetric measurements were only executed in all channels in 2009, 2010, 2012, and 2015; and in channel sections (see Fig. 1d) in 2011, 2013, and 2014.
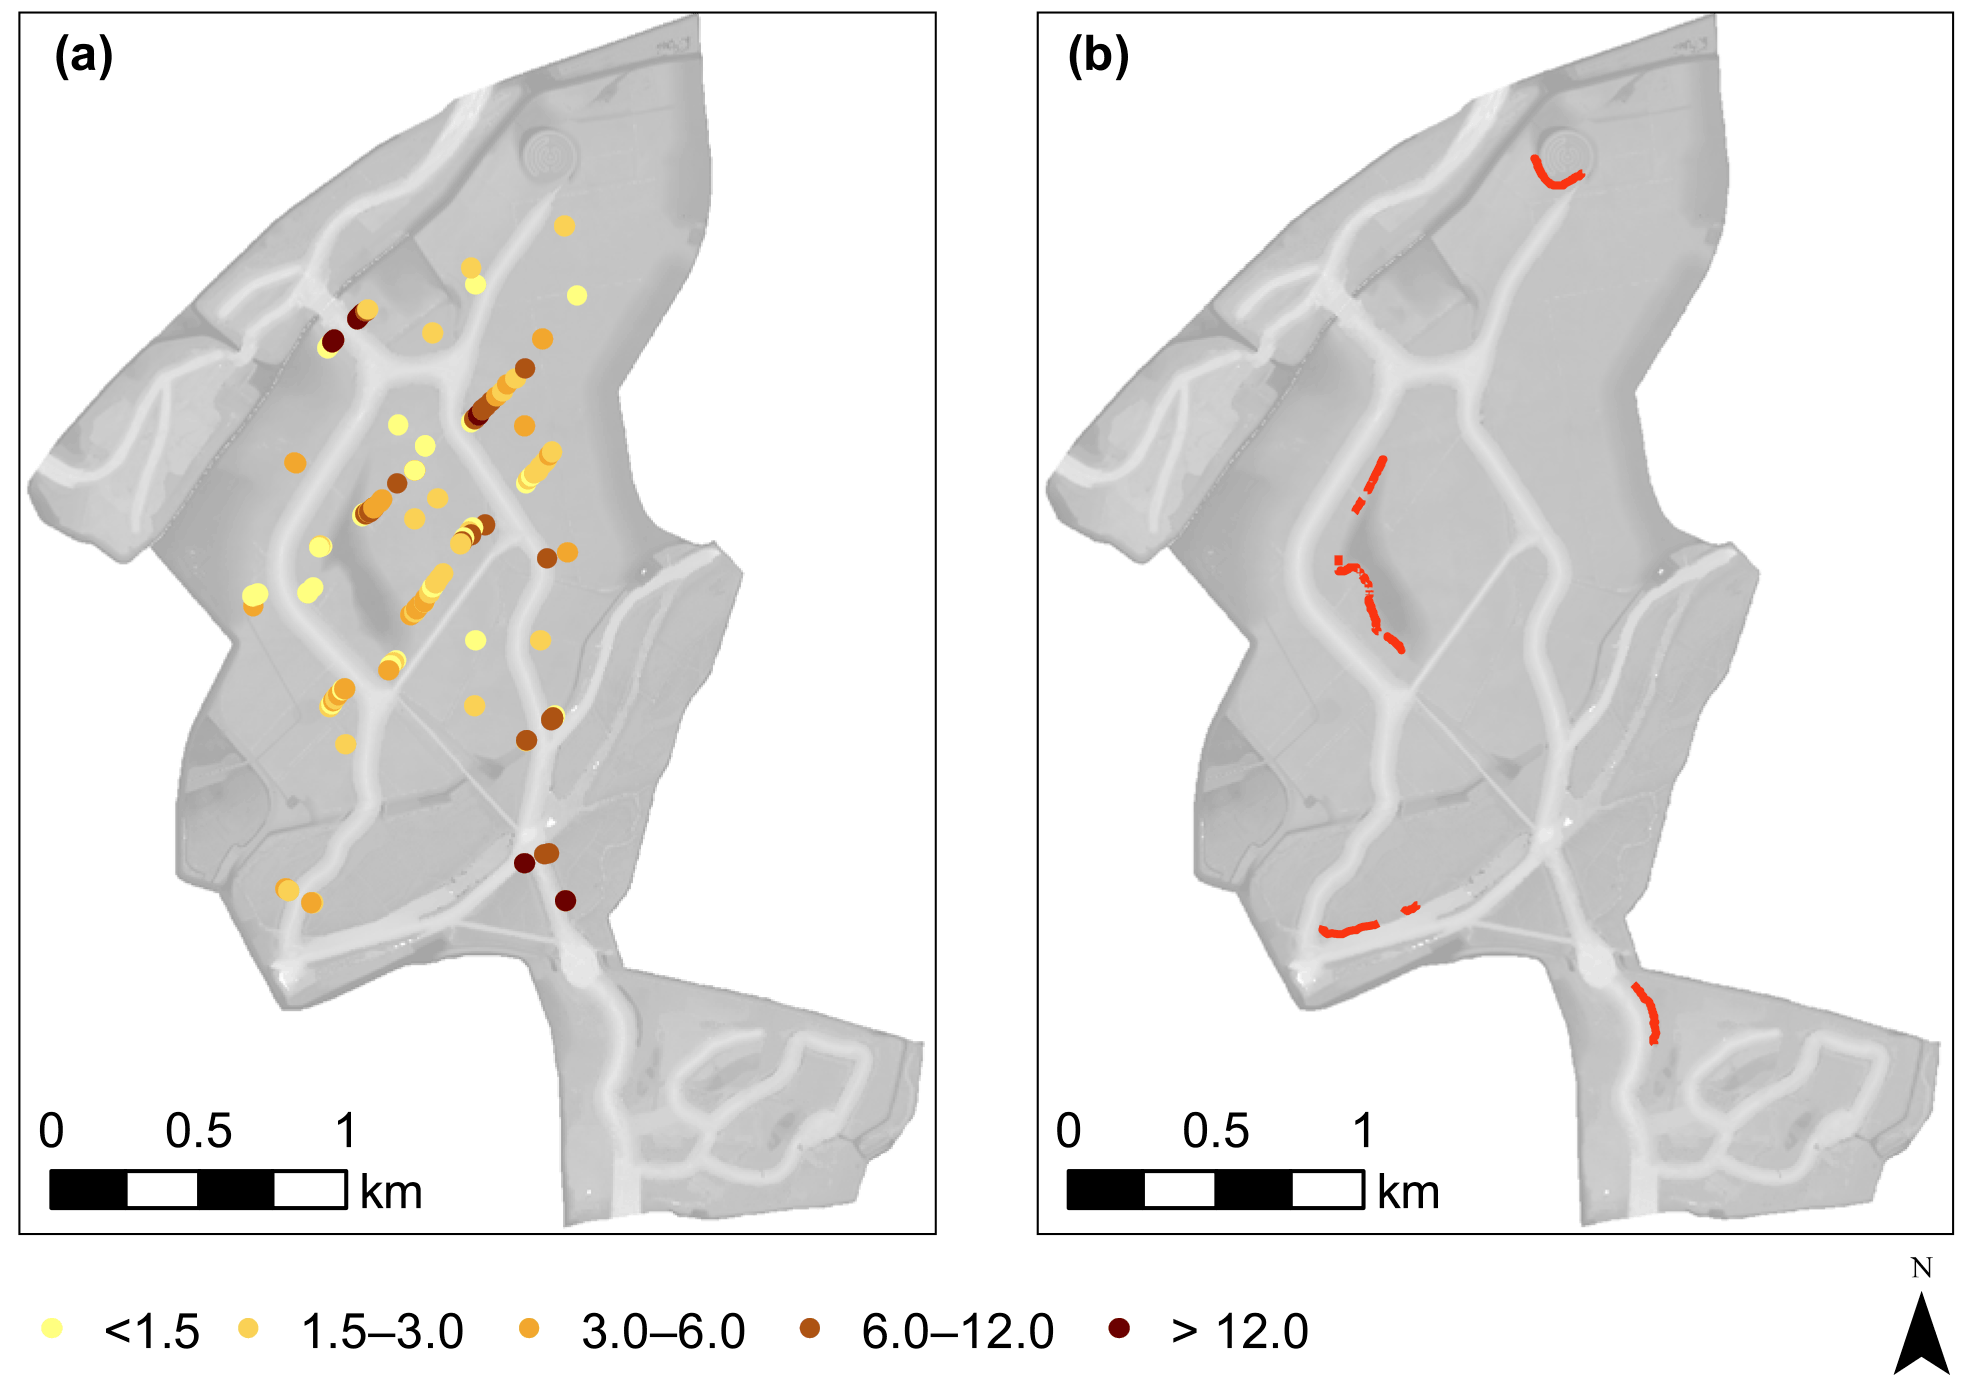
Figure 6The total sedimentation (cm) in the subtidal and intertidal area (a) and the location of the cut banks (b) as measured during field campaigns of 2014.
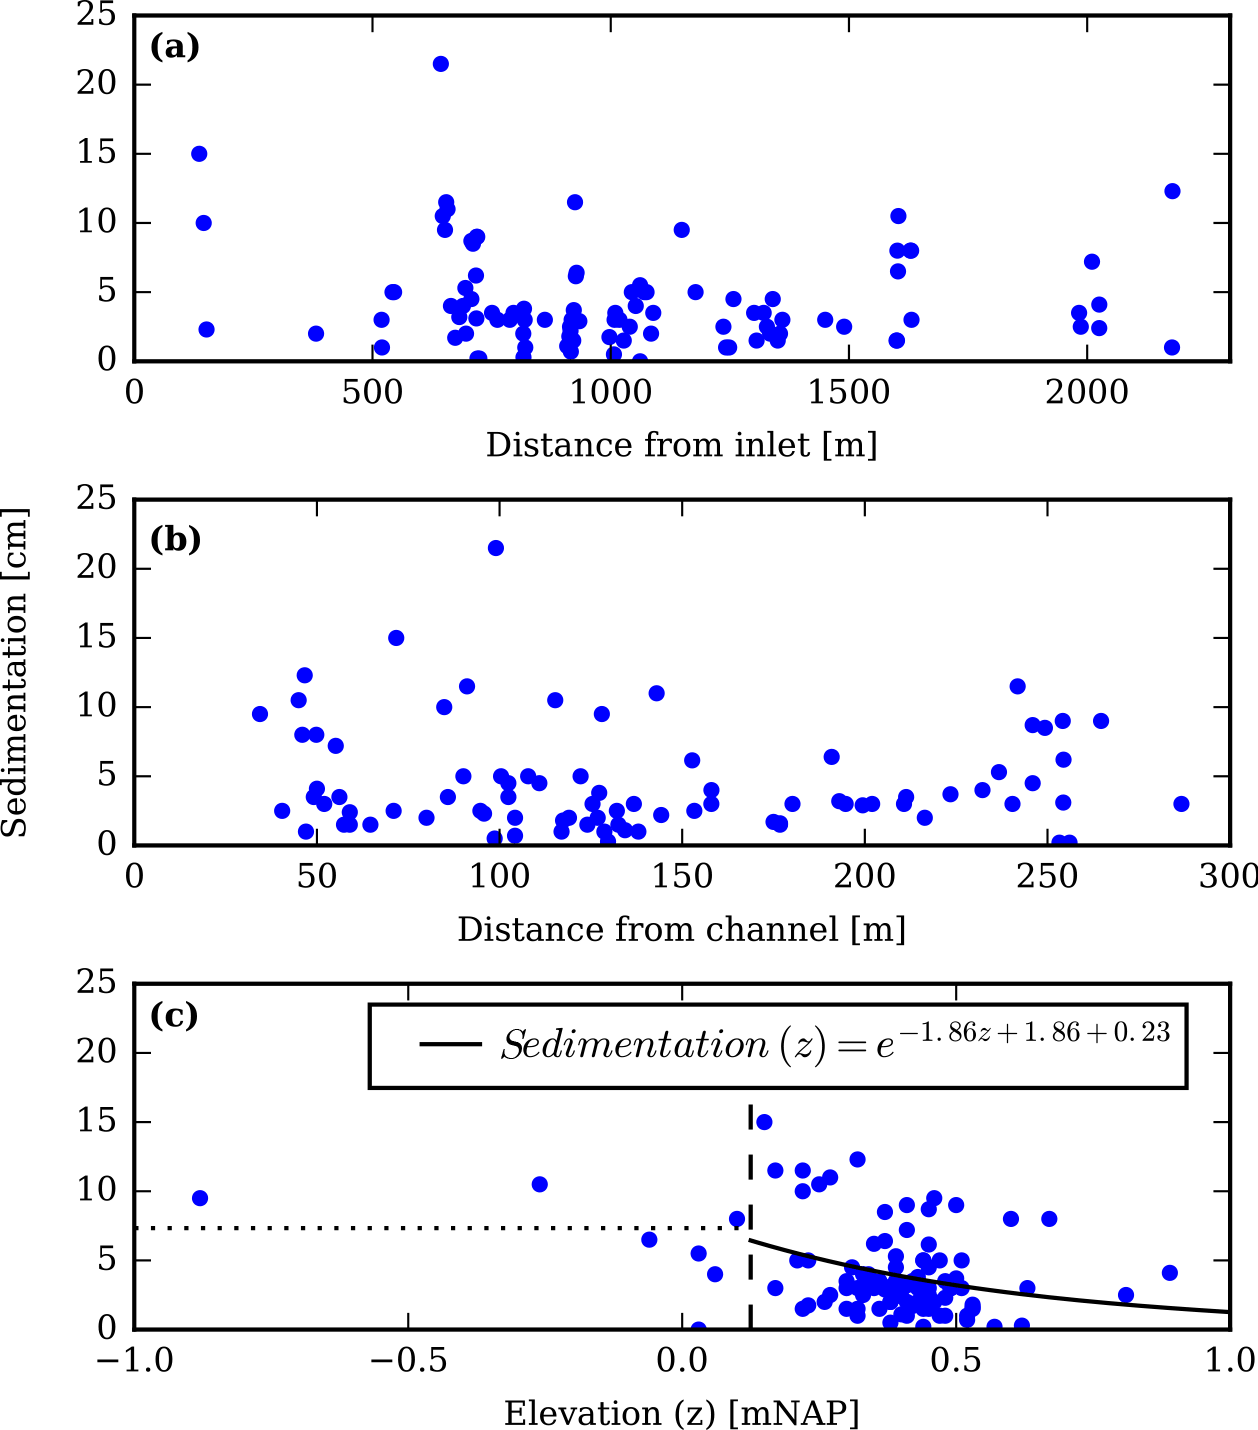
Figure 7Total sedimentation during the period 2008–2014 in the subtidal and intertidal area, with respect to the distance from the inlet of the system (a), distance from the channel (b), and the elevation (c). The dotted and thick lines show the models for sedimentation in the subtidal and intertidal area. The second intercept represents the bias correction factor of Ferguson (1986).
3.1 Bulk density
Sediment samples indicate a bulk density of 1.47 g cm−3 for sand and a logarithmic increase with depth from 0.75 to 1.27 g cm−3 for the 3 cm of mud at the intertidal flat. A maximum density of 1.5 g cm−3 was found in the compacted former polder clay at the bottom of the core. To convert the sediment thickness to sediment mass per unit area, bulk density values of 0.75, 0.94, 1.27, and 1.34 g cm−3 were assigned to the respective 0–1, 1–2, 2–3, and > 3 cm depth intervals. For the sandy sediment deposited in channels or eroded from the island, we used a bulk density of 1.47 g cm−3. The organic matter content varied between 3.9 and 4.3 % for the former polder clay and between 2.9 and 4.3 for the mud at the intertidal flats.
3.2 Channels
Figure 3 shows the change in channel bed level and the yearly averaged cumulative change in channel bed volume in the central part of the Kleine Noordwaard (pink and green areas in Fig. 1) from north to south both for the successive monitoring campaigns (a, b, c and d) and for the entire period (e). The northern part of the area (the inlet) is characterized by a negative sediment budget, due to the loss of sediment within the Spiering polders (purple in Fig. 1). Figure 4a shows the bathymetric development of channel section 1, which represents the development of the channel near the inlet of the study area. The cross-sectional area of the inlet has increased by bank erosion in the outer bend of the channel to the depth of the river Nieuwe Merwede at the inlet of the study area. The maps in Fig. 3 show that outer bend erosion has occurred in the majority of the channels and that bars have developed at the end of these bends. The first outer bend of the single channel at the outlet of the study area has migrated by approximately 35–40 m in eastern direction. A steep cut bank has developed and concomitant sedimentation of a point bar occurred at the convex inner bend and at the end of the bend. Consequently, the second bend has migrated by approximately 20–30 m in western direction. Although the channel at the outlet of the study area has become 5–10 m wider, the width-to-depth ratio decreased from 22.9 to 18.3 due to channel deepening. However, the channels are not able to migrate freely due to steep banks of dikes armored by riprap, and the average width-to-depth ratio of the channel has decreased from 17.9 to 15.2.
Within 500 m from the inlet of the central part of the Kleine Noordwaard, the cumulative change in bed volume turns positive. Thus, the amount of sediment eroded in the Spiering polders and near the inlet of the central part of the Kleine Noordwaard is deposited in this area. Further downstream, the cumulative change in channel bed volume increases further reflecting the positive sediment budget of the Wassende Maan area (blue in Fig. 1). In contrast to the area near the inlet of the study area, the channels in the central part of the area have become shallower (see Fig. 4b) and width-to-depth ratios have increased from 20.3 to 21.9 for the through-flowing channels and from 6.4 to 6.8 for dead-ending channels.
The temporal trend in annual average eroded and deposited sediment volumes is shown in Fig. 5 for the inlet (a), the center (b), and the outlet (c) of the study area (represented by channel section 1; sections 2–9; and section 10 in Fig. 1). Both the annual amounts of erosion in the channels near the inlet and outlet and the annual amounts of sedimentation in the center of the area have decreased over time. This suggests that the channels tend to morphodynamic equilibrium. The decrease in the average net erosion at the inlet and outlet (black line in Fig. 5) is caused by the decrease in the average erosion rate (red in Fig. 5), since the average sedimentation rate (blue in Fig. 5) remains constant over time. The erosion rate has decreased over time because the channels reached the same depth as the river Nieuwe Merwede at the inlet of the study area. The response time of the erosion (i.e., the time needed to reduce the net erosion rate by 63 %) is approximately 2.2 years for the entrance and 3.3 years for the outlet. The response time of the net sedimentation for the central part of the system is 3.1 years. The response time for net sedimentation in the entire area is 6.5 years. However, this value is less accurate as it is based on only three instead of six monitoring intervals.
Although the cumulative channel sediment budget decreases from north to south due to erosion at the outlet of the area, the total channel sediment budget is positive for most periods. The total yearly sediment budget was only negative for the period between the monitoring campaigns of September 2010 and March 2011. This monitoring period includes a discharge event that occurred between 8 and 19 January 2011 with a peak river discharge of 8315 m3 s−1 and an elevated SSC of up to 260 mg L−1 at Lobith. Apparently, this event triggered large changes in bed level during this monitoring period. The bathymetric maps in Fig. 3 and the bathymetric development in Fig. 4b show increased rates of sedimentation in the center of the area during the discharge event. This increased sedimentation occurred at both the inner and outer bend of channels, while the bed level of the outer bend was eroded during other periods. The average change in bed level of the channels decreased from 18.5 to 15.4 and 12.6 mm year−1, for the consecutive measurement intervals 2009–2010, 2010–2012, and 2012–2015. These changes in bed level correspond to a net sedimentation of 21.7×10³, 18×103, and 14.8×10³ m3 year−1 and annual average sediment budgets of 32.4, 26.9, and 22.1 kt year−1, respectively. The average channel sediment budget for the entire 2009–2015 monitoring period accounts for a net sedimentation of 14 mm year−1, which corresponds to 16.7×10³ m3 year−1 and 24.9 kt year−1.
3.3 Subtidal and intertidal area
Figure 6a shows the spatial variation of the measured sedimentation in the subtidal and intertidal area, and Fig. 7 shows the sedimentation for increasing distance to the inlet of the polder area (i.e., the source of the sediment) (graph a), distance from the channel (graph b), and elevation (graph c). Although the highest sedimentation was measured along the channels, there is no significant relation between the total sedimentation and the distance from the channel. This is likely partly due to the relatively high sedimentation (> 5 cm) at the transition from the tidal flats to the marshes of the island in the center of the area at a distance of approximately 240–270 m from the channel. These high sedimentation rates are probably caused by the redistribution of sediment eroded from the marshes of the island. Although there is no significant relation between the total sedimentation and the distance to the channel, field observations of the texture of the sediment layers indicated that the percentage of mud increases and the percentage of sand decreases with increasing distance from the channel. Furthermore, Fig. 7c shows that the total sedimentation generally decreases with increasing height of the tidal area. This relation is significant but it explains only 9 % of the variation in sedimentation. However, local variation in sedimentation is large and is probably resulting from local topographic irregularities as mudflat runnels and old furrows, which are not accounted for in the digital elevation model of the area, which has a resolution of 1 m.
Between May 2008 and October 2014 an average of 73 ± 9.1 mm (standard error of mean) of mud and sand is deposited in the subtidal area. This corresponds to a sedimentation rate of 11.3 ± 1.4 mm year−1 and an annual average sediment budget of 5.21×10³ m3 year−1 and 6.24 kt year−1. The sediment budget of the intertidal area amounts 15.7×10³ m3 year−1 and 22.4 kt year−1.
3.4 Marsh erosion
Figure 6b shows all cut banks observed in the study area in 2014. Cut banks are most abundant along the marshes of the island in the center of the system. These cut banks are located in line to those channels with a relatively long fetch for waves formed by the abundant south-westerly winds. The only cut bank formed by channel migration due to outer bend erosion is located along the channel in the Maltha polder. Comparison of the observed cut bank position and the 2011 digital elevation model of the area indicates that only 31 m3 of the island eroded between 2011 and 2014. The eroded volume is −10.3 m3 year−1, which corresponds to an erosion of 15.4 t year−1.
3.5 Sediment budget
Between 2008 and 2015, the total sediment budget for the Kleine Noordwaard area amounted to 37.3×10³ m3 year−1, which corresponds to a net area-averaged sedimentation rate of 6.4 mm year−1 and an import of 46.8 kt year−1 for the first 6.5 years after depoldering. Sedimentation of 16.7×10³ m3 year−1 in the channels accounts for approximately 44 percent of the total budget. The vast majority of the remaining 56 % comprises the annual sedimentation of 5.2×10³ and 15.7×10³ m3 year−1 in the subtidal and intertidal area. Remobilization of sediment by erosion of marshes occurred at a negligible rate of about −10.3 m3 year−1. Consecutive measurements of channel bathymetry indicate that deposition has occurred in all years, but the actual channel deposition rate has decreased over the years, and the channels have almost reached morphodynamic equilibrium (see Fig. 5). The contemporary sediment budget calculated for the 2012–2015 period amounts to 35.7×10³ m3 year−1. This corresponds to a net area-averaged sedimentation rate of 6.1 mm year−1.
4.1 Patterns in sedimentation
Most previous studies on patterns of sedimentation and erosion in tidal wetlands either focused on marshes, tidal flats or tidal channels. The largest sedimentation rates in the Kleine Noordwaard were found in the channels. This is in agreement with the findings by Siobhan Fennessy et al. (1994), Anderson and Mitsch (2006), and Mitsch et al. (2014), who showed that in deep open-water areas, more sediment accumulates than in shallow open-water areas that are more easily subjected to resuspension by wind-driven and biological sediment disturbances.
Consecutive bathymetric measurements showed that the channels tend towards morphodynamic equilibrium. Channel bed erosion and an associated decrease in width-to-depth ratio mainly took place near the inlet and outlet of the system, where only one channel is present. Sedimentation at the bed and an increase in the width-to-depth ratio occurred in the center of the system, due to the increased cross-sectional area and associated decreased flow velocities. The application of the hydraulic geometry relations of Klaassen and Vermeer (1988) and the Engelund and Hansen predictor (1967) for the total sediment transport capacity in channels, as described by Marra et al. (2014), indicates that the transport capacity of the two main channels in the center of the area is approximately 46 % of the capacity of the single channel near the inlet and outlet of the system.
Observations of freshly deposited material show a trend of declining sand deposition and increasing mud deposition at the channels, which is in line with previous studies of Neubauer et al. (2002), Reed et al. (1999), Temmerman et al. (2003), French and Spencer (1993), Siobhan Fennessy et al. (1994), and Anderson and Mitsch (2007). Furthermore, a significant negative trend between sedimentation and the height of the location was found, which has also been reported by French and Spencer (1993), Middelkoop and van der Perk (1998), Reed et al. (1999), Temmerman et al. (2003), and Thonon et al. (2007). Although the height and distance from the channel do control sedimentation, their influence is not as strong as observed in most marshes or river floodplains. There are three likely causes for the weak relations established between the height and sedimentation and the distance and sedimentation that we found in the Kleine Noordwaard study area: (1) the small gradient in surface topography and a large variation in micro-relief by the presence of mudflat runnels, old furrows, and ditches (Fagherazzi and Mariotti, 2012; Takekawa et al., 2010; Whitehouse et al., 2000); (2) the absence of vegetation (Darke and Megonigal, 2003; Neubauer et al., 2002; Vandenbruwaene et al., 2015), and (3) the small tidal range and water depths (Mariotti and Fagherazzi, 2013). These three factors result in a uniform sediment distribution by micro-topographic flow paths during low water levels (Hupp et al., 2008; Temmerman et al., 2005a); sheet flow during high water levels (Temmerman et al., 2005a; Vandenbruwaene et al., 2015); or a relatively large impact of shear stress (Fagherazzi and Mariotti, 2012) of wind waves and currents, which hamper sediment settling and/or promote sediment redistribution across the tidal flats. However, it could also be argued that the absence of a clear relation between the total mud sedimentation and the distance to the channel is due to the fact that sedimentation is not limited by sediment depletion from the flow over the intertidal flats. This would imply that the water and sediment remain well-mixed across the intertidal flats or that the residence time of water above the flats is relatively short.
In contrast to studies of van de Koppel et al. (2005), Fagherazzi and Wiberg (2009), Tonelli et al. (2010), and van Proosdij et al. (2006b), marsh erosion does not significantly contribute to the total sediment budget of the Kleine Noordwaard study area, where except for one cut bank that was formed by channel migration, all cut banks are formed by wind wave erosion. A fetch of 400 m and an average water depth of 0.2 m are typical for the study area. According to the approach of Fagherazzi and Wiberg (2009), which estimates the maximum wave height and accompanying bed shear stress, wind waves do not exceed a height of 8 cm for wind speeds up to 15 m s−1 under these conditions of water depth and fetch length. In accordance with Leonardi et al. (2016), who have shown that bank deterioration is linearly related to wave energy, the low rate of cut bank retreat in the study area can be attributed to the low wave height. Higher wind waves and an inherent larger rate of cut bank retreat can only occur at the boundary of the terrestrial zone in the northeast of the area and at the southwest edge of the island. Both locations are exposed perpendicular to the southwest- oriented channels, which are relatively deep and have a long fetch for the most abundant southwesterly winds. This demonstrates that a short wind fetch length effectively reduces cut bank erosion and the short fetch is probably the major reason for the low rates of marsh erosion in the majority of the study area.
In spite of their low height, wind waves cause erosion on tidal flats when the wave-generated shear stress exceeds the critical bed shear stress for erosion. A critical bed shear stress of 0.35 N m−2 (Mitchener and Torfs, 1996) for sand is only exceeded for typical conditions of fetch, water depth, and very high wind speeds >13 m s−1. However, resuspension of unconsolidated mud with a critical shear stress of 0.05 N m−2 (Mitchener and Torfs, 1996) already takes place at a wind speed greater than 5.5 m s−1, which was the case during approximately 20 % of the total study period. This suggests that resuspension of the newly deposited material at the intertidal flats takes place regularly.
4.2 Sediment budget
The results of this study indicate that the Kleine Noordwaard area functions as a sediment trap. Both the net area-averaged sedimentation of 6.4 mm year−1 for the period since the opening of the polder area and the estimated actual net area-averaged sedimentation rate of 6.1 mm year−1 are well within the reported ranges for net sedimentation on floodplains, wetlands, fresh- and salt-water marshes (see Table 1). Furthermore, the sedimentation in the Kleine Noordwaard is within the range of the mean overbank sedimentation rates over the last century (0.18–11.55 mm year−1 with a mean of 2.78 mm year−1) on the upstream river floodplains along the River Waal as reconstructed by Middelkoop (1997) from heavy metal profiles in floodplain soils of the river Rhine. However, the net sedimentation is larger than the 1–2 mm year−1, reported by Bleuten et al. (2009) for the Mariapolder, a re-opened polder area located north of the river Nieuwe Merwede, close to the Kleine Noordwaard. This is likely due to the fact that the Kleine Noordwaard study area receives a larger supply of water and sediment from the river Nieuwe Merwede than the Mariapolder that has only a single inlet/outlet and is only subject to tidal in- and outflow. This also confirms the findings of van der Deijl et al. (2017) and Verschelling et al. (2017) that the supply of water and sediment is a major factor for the sediment budget of wetlands
The consecutive measurements of channel bathymetry indicate that net sedimentation has occurred every year, but the actual sedimentation rate varies over the years. Although the largest rates of erosion and sedimentation occurred during the 2011 peak discharge event of the river Rhine, the total erosion and sedimentation rates have decreased to 37 % of their initial value within 2 to 3.5 years. This is confirmed by the slightly lower sedimentation of 4.2 mm year−1, for the period 2014–2015, as determined from the field measurements of water levels, flow velocities, and suspended sediment concentrations at both the in- and outlet of the study area (van der Deijl et al., 2017). The trend of a decrease in erosion and sedimentation in newly created wetlands was also found by Vandenbruwaene et al. (2012), who found a decrease in the net channel erosion and sedimentation rates toward zero in a newly created wetland after 4 years. These findings suggest a further decrease in the contribution of the sedimentation in the channels to the total sediment budget in the Kleine Noordwaard study area.
4.3 Implications for management
The findings of this study have a number of practical implications for future river delta restoration. The current net area-averaged sedimentation of 6.1 mm year−1 is just enough to compensate the actual rate of sea-level rise and soil subsidence in the Netherlands, which are 2 mm year−1 (Ligvoet et al., 2015) and 0–0.25 mm year−1 respectively for the Biesbosch (Kooi et al., 1998). However, sedimentation in the area cannot compensate the high-end scenarios for a sea-level rise of 0.4 to 10.5 mm year−1 as calculated for the Netherlands by Katsman et al. (2011), especially since freshly deposited sediment will compact over the years and thus result in a lower net sedimentation. According to van der Deijl et al. (2017), the trapping efficiency of the area amounted to 0.29 from July 2014 to March 2015. This low trapping efficiency well matches the purpose of opening the Kleine Noordwaard polder, which was to function as an overflow area to divert floodwater from the river Nieuwe Merwede towards the south. A rapid silting up of the channel and tidal area is then undesired as it would reduce the flow capacity of the wetland. When the objective of opening the polder would shift to using natural sedimentation as a measure for compensating sea-level rise, there is room to enhance the sediment trapping and increase the deposition rate of the area. This might be achieved in a few ways. One way is to enhance the deposition in the study area by increasing the supply of water and sediment to the area by modifying the inlet geometry. Another way would be to lower the wave-generated shear stresses, reducing resuspension at the intertidal flats. This could be achieved by reducing the wind fetch length by the establishment of vegetation or by the construction of topographic irregularities. Lastly, a large proportion of incoming sediment leaves the area without deposition via the channels through the downstream outlet. Reducing this direct pass-through transfer by increasing the residence time of the incoming water through adapting the channel course through the wetland, or reducing the outlet size might also increase trapping efficiency and deposition. Such measures to increase the sediment trapping efficiency and sedimentation rates might also be considered for other wetlands, especially those where current sedimentation rates are not sufficient to compensate sea-level rise and soil subsidence. Overall, conversion of delta polders into wetlands may be an effective strategy of delta restoration, since sedimentation compensates at least partly for sea-level rise and land subsidence.
Field measurements on water and sediment flow, topography, and channel depth carried out over an 8-year period (2008–2015) allowed us to quantify both the amount and the spatial patterns in deposition and erosion in the formerly embanked area of the Kleine Noordwaard in the lower Rhine–Meuse delta. The main conclusions of this study are as follows.
-
During this period the total sediment budget of the Kleine Noordwaard study area amounted to 37.3×10³ m3 year−1, which corresponds to a net area-averaged sedimentation rate of 6.4 mm year−1 and an import of 46.8 kt year−1.
-
Largest rates of sedimentation (14.3 mm year−1) took place in the channels, and channel sedimentation contributed approximately 44 % to the total sediment budget. Wide intertidal flats and oversized parallel channels resulted in enhanced sedimentation in the channels during the first years after opening. Over time, both channel deposition and erosion rates have decreased, resulting in a net sedimentation that decreased from 18.5 to 12.6 mm year−1, which implies that the filling-up of the channels tends towards morphodynamic equilibrium.
-
In the intertidal area sand deposition occurs primarily at low-lying locations close to the channels, while mud deposition occurs primarily further away from the channels and inlet. Wind-driven resuspension of the newly deposited material at the intertidal flats takes place regularly due to small water depths and the absence of vegetation.
-
A short wind fetch length is probably the major reason for the low rates of marsh erosion in the majority of the study area.
-
The current net sedimentation is enough to compensate for the actual rate of sea-level rise and land subsidence, but not for the high end scenarios of sea-level rise. The net sedimentation in the Kleine Noordwaard study area, and the wetlands in general, could be enhanced by altering the layout of the polder channels and the size of the upstream and downstream openings, increasing the supply of sediment into the area and the residence time within the polder.
-
The conversion of polders in delta areas into wetlands where renewed sediment deposition occurs may be an effective strategy of delta restoration, since sedimentation compensates at least partly for sea-level rise and land subsidence.
The data for this publication are available via 4TU.Centre for Reseach Data repository at http://doi.org/10.4121/uuid:bd1c52a1-74d7-481b-a363-46c29f97c67b (Van der Deijl and van der Perk, 2018).
It contains
1. Difference in channel bed level for each monitoring period (TIF) (Figs. 3–5)
2. Initial Digital Elevation Model of the study area (TIF) (Figs. 1, 3, and 6)
3. Locations of inlet center and outlet (TIF)
4. Location of dredged area (TIF)
5. Total sedimentation at the intertidal flats (ascii xyz) (Fig. 6a)
6. Location and height of the cut banks (asci xyz) (Fig. 6b)
HM and MvdP designed the research proposal. ECvdD collected and analyzed the data. ECvdD, MvdP, and HM interpreted the data. Lastly, ECvdD prepared the manuscript with the contributions, revisions, and final approval from all co-authors.
The authors declare that they have no conflict of interest.
This project is financed by the Dutch Technology Foundation STW (project no.
12431). We thank Staatsbosbeheer, Rijkswaterstaat, Hans de Boois, Eelco
Verschelling, Wim Hoek, Renske Visser, Nanda Kik, and Wouter Zonneveld for
the provided data, assistance, logistic support, and knowledge.
Edited by: Orencio Duran Vinent
Reviewed by: Tom Maris, William Kearney, and one anonymous referee.
Actueel Hoogtebestand Nederland: Actueel Hoogtebestand Nederland, available at: http://www.ahn.nl/ (last access: October 2016), 2017. a, b
Anderson, C. J. and Mitsch, W. J.: Sediment, carbon, and nutrient accumulation at two 10-year-old created riverine marshes, Wetlands, 26, 779–792, 2006. a, b
Anderson, C. J. and Mitsch, W. J.: Erratum to: Sediment, carbon, and nutrient accumulations at two 10-year-old created riverine marshes, Wetlands, 27, 774–774, 2007. a
Asselman, N. E. M. and Middelkoop, H.: Temporal variability of contemporary floodplain sedimentation in the Rhine-Meuse Delta, the Netherlands, Earth Surf. Proc. Land, 23, 595–609, 1998. a
Asselman, N. E. M. and Van Wijngaarden, M.: Development and application of a 1D floodplain sedimentation model for the River Rhine in the Netherlands, J. Hydrol., 268, 127–142, 2002. a
Auerbach, L. W., Goodbred Jr., S. L., Mondal, D. R., Wilson, C. A., Ahmed, K. R., Roy, K., Steckler, M. S., Small, C., Gilligan, J. M., and Ackerly, B. A.: Flood risk of natural and embanked landscapes on the Ganges-Brahmaputra tidal delta plain, Nature Climate Change, 5, 153–157, 2015. a
Bleuten, W., Borren, W., Kleinveld, E., Oomes, L. B., and Timmermann, T.: Water and nutrient balances of the experimental site Mariapolder, The Netherlands, in: Tidal Freshw Wetl, edited by: Barendrecht, A., Whigham, D. F., and Baldwin, A. H., chap. 18, 167–206, Backhuys Publishers, Leiden, 2009. a, b
Calvo-Cubero, J., Ibáñez, C., Rovira, A., Sharpe, P. J., and Reyes, E.: Mineral versus organic contribution to vertical accretion and elevation change in restored marshes (Ebro Delta, Spain), Ecol. Eng., 61, 12–22, 2013. a, b, c
Craft, C. B. and Casey, W. P.: Sediment and nutrient accumulation in floodplain and depressional freshwater wetlands of Georgia, USA, Wetlands, 20, 323–332, 2000. a, b, c
Darke, A. and Megonigal, J.: Control of sediment deposition rates in two mid-Atlantic Coast tidal freshwater wetlands, Estuar. Coast. Shelf Sci., 57, 255–268, 2003. a, b, c, d
Davidson-Arnott, R. G., van Proosdij, D., Ollerhead, J., and Schostak, L.: Hydrodynamics and sedimentation in salt marshes: examples from a macrotidal marsh, Bay of Fundy, Geomorphology, 48, 209–231, 2002.
Day, J., Cable, J., Lane, R., and Kemp, P.: Sediment Deposition at the Caernarvon Crevasse during the Great Mississippi Flood of 1927: Implications for Coastal Restoration, Water, 8, 38, 2016. a
Day, J. W., Boesch, D. F., Clairain, E. J., Kemp, G. P., Laska, S. B., Mitsch, W. J., Orth, K., Mashriqui, H., Reed, D. J., Shabman, L., Simenstad, C. A., Streever, B. J., Twilley, R. R., Watson, C. C., Wells, J. T., and Whigham, D. F.: Restoration of the Mississippi Delta: Lessons from Hurricanes Katrina and Rita, Science, 315, 1679–1684, 2007. a
De Bont, C., Dirkx, G., Maas, G., Wolfert, H., Odé, O., and Polman, G.: Aardkundige en cultuurhistorische landschappen van de Biesbosch; Beschrijving en waardering als bouwstenen voor het landschapsontwikkelingsconcept en de effectevaluatie voor rivierverruiming, Tech. rep., Alterra, Research Instituut voor de Groene Ruimte, Wageningen, RIZA-rapport 2000.053, available at: http://edepot.wur.nl/119881 (last access: September 2015), 2000. a, b
De la Haye, M. A. A.: Jaarrapportage 2010 projectgebonden monitoring RWS Zuid-Holland, Noordwaard, Sliedrechtse Biesbosch, Oeverlanden Hollandsch Diep (APL-polder) en Het Gors en De Aanwas, Tech. rep., Grontmij, 2011. a
DeLaune, R. D., Jugsujinda, A., Peterson, G. W., and Patrick, W. H.: Impact of Mississippi River freshwater reintroduction on enhancing marsh accretionary processes in a Louisiana estuary, Estuar. Coast. Shelf Sci., 58, 653–662, 2003. a
Fagherazzi, S. and Mariotti, G.: Mudflat runnels: Evidence and importance of very shallow flows in intertidal morphodynamics, Geophys. Res. Lett., 39, L14402, https://doi.org/10.1029/2012GL052542, 2012. a, b
Fagherazzi, S. and Wiberg, P. L.: Importance of wind conditions, fetch, and water levels on wave-generated shear stresses in shallow intertidal basins, J. Geophys. Res., 114, F03022, https://doi.org/10.1029/2008JF001139, 2009. a, b
Ferguson, R. I.: River loads underestimated by rating curves, Water Resour. Res., 22, 74–76, https://doi.org/10.1029/WR022i001p00074, 1986. a, b
French, J. R. and Spencer, T.: Dynamics of sedimentation in a tide-dominated backbarrier salt marsh, Norfolk, UK, Mar. Geol., 110, 315–331, 1993. a, b, c, d, e
Gell, P., Fluin, J., Tibby, J., Hancock, G., Harrison, J., Zawadzki, A., Haynes, D., Khanum, S., Little, F., and Walsh, B.: Anthropogenic acceleration of sediment accretion in lowland floodplain wetlands, Murray–Darling Basin, Australia, Geomorphology, 108, 122–126, 2009. a
Grontmij: Natuurontwikkeling Noordwaard – Inrichtingsplan, Tech. rep., Grontmij Advies & Techniek bv, eindhoven, 2002. a
Heiri, O., Lotter, A. F., and Lemcke, G.: Loss on ignition as a method for estimating organic and carbonate content in sediments: Reproducibility and comparability of results, J. Paleolimnol., 25, 101–110, 2001. a
Hudson, P. F., Middelkoop, H., and Stouthamer, E.: Flood management along the Lower Mississippi and Rhine Rivers (The Netherlands) and the continuum of geomorphic adjustment, Geomorphology, 101, 209–236, 2008. a
Hung, N. N., Delgado, J. M., Güntner, A., Merz, B., Bárdossy, A., and Apel, H.: Sedimentation in the floodplains of the Mekong Delta, Vietnam. Part I: Suspended sediment dynamics, Hydrol. Process., 28, 3132–3144, 2014a. a
Hung, N. N., Delgado, J. M., Güntner, A., Merz, B., Bárdossy, A., and Apel, H.: Sedimentation in the floodplains of the Mekong Delta, Vietnam Part II: Deposition and erosion, Hydrol. Process., 28, 3145–3160, 2014b. a
Hupp, C. R., Demas, C. R., Kroes, D. E., Day, R. H., and Doyle, T. W.: Recent sedimentation patterns within the central Atchafalaya Basin, Louisiana, Wetlands, 28, 125–140, 2008. a
Ibáñez, C., Canicio, A., Day, J. W., and Curco, A.: Morphologic development, relative sea level rise and sustainable management of water and sediment in the Ebro Delta, Spain, J. Coast. Consv., 3, 191–202, 1997. a
Ibáñez, C., Day, J. W., and Reyes, E.: The response of deltas to sea-level rise: Natural mechanisms and management options to adapt to high-end scenarios, Ecol. Eng., 65, 122–130, 2014. a, b
Islam, M. R., Begum, S. F., Yamaguchi, Y., and Ogawa, K.: The Ganges and Brahmaputra rivers in Bangladesh: basin denudation and sedimentation, Hydrol. Process., 13, 2907–2923, 1999. a
Katsman, C. A., Sterl, A., Beersma, J. J., van den Brink, H. W., Church, J. A., Hazeleger, W., Kopp, R. E., Kroon, D., Kwadijk, J., Lammersen, R., Lowe, J., Oppenheimer, M., Plag, H. P., Ridley, J., von Storch, H., Vaughan, D. G., Vellinga, P., Vermeersen, L. L. A., van de Wal, R. S. W., and Weisse, R.: Exploring high-end scenarios for local sea level rise to develop flood protection strategies for a low-lying delta – the Netherlands as an example, Climatic Change, 109, 617–645, 2011. a
Khadim, F. K., Kar, K. K., Halder, P. K., Rahman, M. A., and Morshed, A. M.: Integrated Water Resources Management (IWRM) impacts in south west coastal zone of Bangladesh and fact-finding on Tidal River Management (TRM), J. Water Resour. Prot., 05, 953–961, 2013. a
Kirwan, M. L. and Megonigal, J. P.: Tidal wetland stability in the face of human impacts and sea-level rise., Nature, 504, 53–60, 2013. a
Kleinhans, M. G., Weerts, H. J., and Cohen, K. M.: Avulsion in action: Reconstruction and modelling sedimentation pace and upstream flood water levels following a Medieval tidal-river diversion catastrophe (Biesbosch, The Netherlands, 1421–1750AD), Geomorphology, 118, 65–79, 2010. a
Kooi, H., Johnston, P., Lambeck, K., and Smither, C.: Geological causes of recent (100 yr) vertical land movement in the Netherlands, Tectonophysics, 299, 297–316, 1998. a
Leonard, L. A.: Controls of sediment transport and deposition in an incised mainland marsh basin, southeastern North Carolina, Wetlands, 17, 263–274, 1997. a
Leonardi, N., Ganju, N. K., and Fagherazzi, S.: A linear relationship between wave power and erosion determines salt-marsh resilience to violent storms and hurricanes, P. Natl. Acad. Sci., 113, 64–68, 2016. a
Ligvoet, W., Bregman, B., Dorland, R., ten Brinke, W., de Vos, R., Petersen, A., and Visser, H.: Klimaatverandering. Samenvatting van het vijfde IPCC-assessment en een vertaling naar Nederland, http://www.stowa.nl/Upload/nieuws/Klimaatverandering_ Samenvatting van het vijfde IPCC-assessment en een vertaling naar Nederland.pdf, 2015. a
Mariotti, G. and Fagherazzi, S.: Wind waves on a mudflat: The influence of fetch and depth on bed shear stresses, Cont. Shelf Res., 60, S99–S110, 2013. a
Marra, W. A., Kleinhans, M. G., and Addink, E. A.: Network concepts to describe channel importance and change in multichannel systems: test results for the Jamuna River, Bangladesh, Earth Surf. Proc. Land, 39, 766–778, 2014. a
Middelkoop, H.: Embanked floodplains in the Netherlands. Geomorphological evolution over various time scales., Phd thesis, Utrecht University, the Netherlands, Netherlands Geographical Studies 224, 1997. a, b
Middelkoop, H. and Asselman, N. E. M.: Spatial variability of floodplain sedimentation at the event scale in the Rhine–Meuse delta, the Netherlands, Earth Surf. Proc. Land, 23, 561–573, 1998. a
Middelkoop, H. and van der Perk, M.: Modelling spatial patterns of overbank sedimentation on embanked floodplains, Geogr. Ann., 80A, 95–109, 1998. a, b
Mitchener, H. and Torfs, H.: Erosion of mud/sand mixtures, Coast. Eng., 29, 1–25, 1996. a, b
Mitsch, W. J., Nedrich, S. M., Harter, S. K., Anderson, C., Nahlik, A. M., and Bernal, B.: Sedimentation in created freshwater riverine wetlands: 15 years of succession and contrast of methods, Ecol. Eng., 72, 25–34, 2014. a, b, c
Neubauer, S. C., Anderson, I. C., Constantine, J. A., and Kuehl, S. A.: Sediment deposition and accretion in a Mid-Atlantic (U.S.A.) tidal freshwater marsh, Estuar. Coast. Shelf Sci., 54, 713–727, 2002. a, b, c
Paola, C., Twilley, R. R., Edmonds, D. A., Kim, W., Mohrig, D., Parker, G., Viparelli, E., and Voller, V. R.: Natural processes in delta restoration: application to the Mississippi Delta, Annu. Rev. Mar. Sci., 3, 67–91, 2011. a, b
Pasternack, G. and Brush, G.: Seasonal variations in sedimentation and organic content in five plant associations on a Chesapeake Bay tidal freshwater delta, Estuar. Coast. Shelf Sci., 53, 93–106, 2001. a
Pethick, J. S.: Long-term accretion rates on tidal salt marshes, J, Sediment Res,, 51, 571–577, 1981. a
Reed, D. J., de Luca, N., and Foote, a. L.: Effect of hydrologic management on marsh surface sediment deposition in coastal Louisiana, Estuaries, 20, 301, 1997. a
Reed, D. J., Spencer, T., Murray, A. L., French, J. R., and Leonard, L.: Marsh surface sediment deposition and the role of tidal creeks: Implications for created and managed coastal marshes, J. Coast Consv., 5, 81–90, 1999. a, b, c, d
Rijke, J., van Herk, S., Zevenbergen, C., and Ashley, R.: Room for the River: delivering integrated river basin management in the Netherlands, Int. J. River Basin Manage., 10, 369–382, 2012. a
Rijkswaterstaat: Water data, available at: http://www.watergegevens.rws.nl/ (last access: September 2016), 2016. a, b, c
Rijsdorp, A., Adegeest, A., de Kuijer, O., de Koning, R., and Gaastra, R.: Ontwerpvisie ontpoldering noordwaard, Tech. rep., Bureau Noordwaard, Rotterdam, 2006. a
Schile, L. M., Callaway, J. C., Morris, J. T., Stralberg, D., Thomas Parker, V., and Kelly, M.: Modeling tidal marsh distribution with sea-level rise: Evaluating the role of vegetation, sediment, and upland habitat in marsh resiliency, PLoS One, 9, e88760, https://doi.org/10.1371/journal.pone.0088760, 2014. a
Siobhan Fennessy, M., Brueske, C. C., and Mitsch, W. J.: Sediment deposition patterns in restored freshwater wetlands using sediment traps, Ecol. Eng., 3, 409–428, 1994. a, b, c
Syvitski, J. P. M.: Deltas at risk, Sustain Sci, 3, 23–32, 2008. a
Syvitski, J. P. M. and Saito, Y.: Morphodynamics of deltas under the influence of humans, Glob Planet Change, 57, 261–282, 2007. a
Takekawa, J. Y., Woo, I., Athearn, N. D., Demers, S., Gardiner, R. J., Perry, W. M., Ganju, N. K., Shellenbarger, G. G., and Schoellhamer, D. H.: Measuring sediment accretion in early tidal marsh restoration, Wet. Ecol. Manag., 18, 297–305, 2010. a
Temmerman, S., Govers, G., Wartel, S., and Meire, P.: Spatial and temporal factors controlling short-term sedimentation in a salt and freshwater tidal marsh, scheldt estuary, Belgium, SW Netherlands, Earth Surf. Proc. Land, 28, 739–755, 2003. a, b, c
Temmerman, S., Bouma, T. J., Govers, G., and Lauwaet, D.: Flow paths of water and sediment in a tidal marsh: Relations with marsh developmental stage and tidal inundation height, Estuaries, 28, 338–352, 2005a. a, b
Temmerman, S., Bouma, T. J., Govers, G., Wang, Z. B., De Vries, M. B., and Herman, P. M. J.: Impact of vegetation on flow routing and sedimentation patterns: Three-dimensional modeling for a tidal marsh, J. Geophys. Res., 110, 1–18, 2005b. a
Thonon, I., Middelkoop, H., and Perk, M. V. D.: The influence of floodplain morphology and river works on spatial patterns of overbank deposition, Neth. J. Geosci., 81, 63–75, 2007. a, b
Tonelli, M., Fagherazzi, S., and Petti, M.: Modeling wave impact on salt marsh boundaries, J. Geophys. Res., 115, C09028, https://doi.org/10.1029/2009JC006026, 2010. a
van de Koppel, J., van der Wal, D., Bakker, J. P., and Herman, P. M. J.: Self-organization and vegetation collapse in salt marsh ecosystems., The American Naturalist, 165, E1–12, 2005. a
van der Deijl, E. C., van der Perk, M., and Middelkoop, H.: Factors controlling sediment trapping in two freshwater tidal wetlands in the Biesbosch area, The Netherlands, J. Soil Sediment, 17, 2620–2636, https://doi.org/10.1007/s11368-017-1729-x, 2017. a, b, c
van Proosdij, D., Davidson-Arnott, R. G., and Ollerhead, J.: Controls on spatial patterns of sediment deposition across a macro-tidal salt marsh surface over single tidal cycles, Estuar. Coast. Shelf Sci., 69, 64–86, https://doi.org/10.1016/j.ecss.2006.04.022, 2006a. a
van Proosdij, D., Ollerhead, J., and Davidson-Arnott, R. G.: Seasonal and annual variations in the volumetric sediment balance of a macro-tidal salt marsh, Mar. Geol., 225, 103–127, 2006b. a, b
van Wijnen, H. and Bakker, J.: Long-term surface elevation change in salt marshes: a prediction of marsh response to future sea-level rise, Estuar. Coast. Shelf Sci., 52, 381–390, 2001. a
Vandenbruwaene, W., Meire, P., and Temmerman, S.: Formation and evolution of a tidal channel network within a constructed tidal marsh, Geomorphology, 151–152, 114–125, 2012. a
Vandenbruwaene, W., Schwarz, C., Bouma, T., Meire, P., and Temmerman, S.: Landscape-scale flow patterns over a vegetated tidal marsh and an unvegetated tidal flat: Implications for the landform properties of the intertidal floodplain, Geomorphology, 231, 40–52, 2015. a, b
Van der Deijl, E. C. and van der Perk, M.: Dataset for the paper “Establishing a sediment budget in the newly created `Kleine Noordwaard' wetland area in the Rhine-Meuse delta”, Utrecht University, available at: http://doi.org/10.4121/uuid:bd1c52a1-74d7-481b-a363-46c29f97c67b, 2018.
Verschelling, E., van der Deijl, E., van der Perk, M., Sloff, K., and Middelkoop, H.: Effects of discharge, wind, and tide on sedimentation in a recently restored tidal freshwater wetland, Hydrol. Process., 31, 2827–2841, https://doi.org/10.1002/hyp.11217, 2017. a
Whitehouse, R., Bassoullet, P., Dyer, K., Mitchener, H., and Roberts, W.: The influence of bedforms on flow and sediment transport over intertidal mudflats, Cont. Shelf Res., 20, 1099–1124, 2000. a
Zonneveld, I.: De Brabantse Biesbosch : A study of soil and vegetation of a freshwater tidal delta consisting of three volumes A, B and C, Ph.D. thesis, Verslagen Landbouwkundig onderzoek N0.65.20. Bodemkundige studies deel 4, Wageningen, available at: http://library.wur.nl/WebQuery/wurpubs/487770 (last access: March 2016), 1959. a