the Creative Commons Attribution 4.0 License.
the Creative Commons Attribution 4.0 License.
Identification of stable areas in unreferenced laser scans for automated geomorphometric monitoring
Michael Avian
Daniel Krueger
Frank Neitzel
Current research questions in the field of geomorphology focus on the impact of climate change on several processes subsequently causing natural hazards. Geodetic deformation measurements are a suitable tool to document such geomorphic mechanisms, e.g. by capturing a region of interest with terrestrial laser scanners which results in a so-called 3-D point cloud. The main problem in deformation monitoring is the transformation of 3-D point clouds captured at different points in time (epochs) into a stable reference coordinate system. In this contribution, a surface-based registration methodology is applied, termed the iterative closest proximity algorithm (ICProx), that solely uses point cloud data as input, similar to the iterative closest point algorithm (ICP). The aim of this study is to automatically classify deformations that occurred at a rock glacier and an ice glacier, as well as in a rockfall area. For every case study, two epochs were processed, while the datasets notably differ in terms of geometric characteristics, distribution and magnitude of deformation. In summary, the ICProx algorithm's classification accuracy is 70 % on average in comparison to reference data.
- Article
(12637 KB) - Full-text XML
- BibTeX
- EndNote
Monitoring surface changes in hazardous areas has been an important task of the geodetic community in the last decades. Due to the predicted increase of natural disasters (Anderson and Bausch, 2006), this problem domain will hence gain importance in the future. Potential forms of geomorphic natural hazards are rockfalls or slides, landslides, as well as slow surface movements which may be triggered or enforced by heavy rainfall events. Apart from geomorphic changes the characteristics and geomorphic consequences of glacial retreat are a crucial part of scientific research (Avian et al., 2018). This interest can be justified by, e.g. the function of glaciers as water reservoirs (Bradley et al., 2006) that act as water supply for agriculture and communities downstream (Tirado et al., 2010). A valuable tool for the quantitative analysis of the Earth's surface is represented by geomorphometry. The most common forms of geomorphometric monitoring aim to quantify kinematic (Schwalbe et al., 2008), areal (Lambrecht and Kuhn, 2007) and/or volumetric changes over time. A particularly appropriate measurement technique for this task is terrestrial laser scanning (TLS) due to its combination of high precision and information density (Avian et al., 2009). In order to process the acquired TLS data, an appropriate deformation model has to be chosen (Heunecke and Welsch, 2000). Deformation measurements require the repeated acquisition of a region of interest (ROI) at different points in time that are referred to as epochs. Based on these multi-temporal measurements geometric changes that occurred in between, epochs can be identified. Therefore, a stable reference frame is required that is represented by temporally stable points and their 3-D coordinates, respectively. In order to provide this vital condition, deformed areas within the ROI have to be identified. Stable points or areas within the ROI can then be used to determine transformation parameters. These parameters allow the transformation of a successively captured epoch into the coordinate system of the reference epoch.
1.1 The processing chain of deformation monitoring
For the determination of geomorphometric measures, TLS can be seen as an established acquisition technique (Oppikofer et al., 2008), whose measurements yield so-called point clouds, i.e. 3-D Cartesian coordinates of the captured object in a local coordinate system with its origin in the centre of the laser scanner. In order to quantify geometric differences in different epochs, it is recommended to carry out all steps of the following processing chain:
-
viewpoint planning (Bechtold and Höfle, 2016; Wujanz et al., 2016a),
-
data acquisition at different points in time (van Veen et al., 2017),
-
transformation of individual epochs into a stable reference frame and
-
quantification of deformation (Jaboyedoff et al., 2012; Lindenbergh and Pietrzyk, 2015).
The most delicate step in this processing chain is the transformation of single epochs into a common reference coordinate system, which is also referred to as registration or matching of point clouds. Erroneous effects that occur in this step have an immediate and systematic impact on the quantification of deformation. Thus, all conclusions that are drawn based on the generated results are falsified. The detectability of geometric changes itself is influenced by the precision of the applied laser scanner (Böhler et al., 2003; Wujanz et al., 2017) as well as the chosen algorithm for the actual quantification of deformation; see, e.g. Cignoni et al. (1998), Girardeau-Montaut et al. (2005) or Lague et al. (2013). While random influences onto the results are inevitable, systematic effects, such as usage of uncalibrated sensors (Neitzel, 2006; Salo et al., 2008; Al-Manasir and Lichti, 2015) or the aforementioned problem when computing transformation parameters, have to be avoided at all costs that otherwise yield bogus deformation.
1.2 State of research
Up to now, the transformation into a reference coordinate system has been preferably carried out by usage of artificial targets and/or monumental reference points. Several disadvantages can be associated with this strategy, such as (i) the effort of distributing the targets in the area of interest, (ii) the required survey of the targets in order to determine their 3-D coordinates in a reference system and (iii) the limited extent of the placed targets within the region of interest. In addition, the size of the targets must increase with growing range between scanner and ROI – for ultra-long-range scanners with ranges of up to several kilometres, the targets would have to measure several metres. For built-in systems that monitor a ROI over longer periods of time, rotational deviations of the sensor's home position (Lichti and Licht, 2006) that may occur in between epochs are usually refined by using artificial targets; see, e.g. Adams et al. (2013). For this, the assumption has to be made that the majority of targets remain geometrically stable over the course of the survey campaign – which might not be the case. A geodetic principle in the context of computing transformation parameters is that corresponding points should surround the ROI. If this is not the case, extrapolative effects occur, which quite likely falsify the outcome. The reason why targets are still commonly used in practice despite their numerous drawbacks can be found in the fact that all well-established operational procedures for total stations are directly transferable to TLS. Numerous alternatives for referencing point clouds exist which can be classified as follows:
-
registration based on radiometric features,
-
direct georeferencing of terrestrial laser scanners and
-
use of geometric information.
Point clouds captured by terrestrial scanners also contain radiometric information (Höfle and Pfeifer, 2007), which is also referred to as intensity, in addition to the geometric content. Intensity values are assigned to individual points and are based on the strength of a reflected signal. If the topology of points within a dataset is known, this information can be used to convert a point cloud into an image where intensity values represent the brightness of individual pixels. By doing this, well-established techniques from the field of image matching can be applied to 3-D datasets. As a first step, so-called “keypoints” have to be extracted, which are distinct features within a local neighbourhood in terms of their grey scale values. After keypoint extraction, descriptors are used to establish correspondences between keypoints from different datasets (Lowe, 1999). Based on this information, transformation parameters can be computed. Since the long-term stability of radiometric information captured by TLS has not yet been studied, this strategy is not considered in the following. The successful application over short periods of time has been demonstrated by Böhm and Becker (2007).
Instead of computing transformation parameters based on established correspondences, the relation between different local TLS coordinate systems can also be achieved by observing their location and orientation within a superior coordinate frame. For this, additional sensors are required, while the general concept is well known, for instance, in aerial photogrammetry (Cramer et al., 2000). Methods for direct georeferencing of TLS were initially just of scientific interest (e.g. Paffenholz et al., 2010), while lately several commercial systems emerged (Riegl, 2017; Zoller+Fröhlich, 2017). A significant drawback of direct georeferencing is the extension of a scanner's error budget (Soudarissanane, 2016) due to the use of additional positioning and orientation sensors such as GNSS equipment or electronic compasses. With increasing scanning range, the impact on the relative rotation between two point clouds also increases, which is a result of the limited accuracy of compasses.
A vital prerequisite for deformation measurement is the repeated acquisition of a region of interest at different epochs. Consequently, the corresponding point clouds feature a large degree of overlap that can be used to transform both epochs into a common reference coordinate system. Apart from the aforementioned method of using radiometric features, geometric information can be used in the form of geometric primitives, such as planes (Gielsdorf et al., 2008; Previtali et al., 2014; technet, 2017). As a first step, planar segments have to be extracted from the original point clouds. Then, identical planes are computed instead of matching single points such as in radiometric approaches. By using planes instead of points, the precision of the resulting transformation parameters notably increases. However, the approach relies on the existence of planar areas within a region of interest and is hence mostly applied in urban environments. The most popular registration method uses redundantly captured regions of two point clouds and is called the iterative closest point algorithm (ICP) as proposed by Besl and McKay (1992). A substantial advantage of the last strategy over the aforementioned ones is the actual use of the information present in the point cloud. A drawback of these surface-based algorithms is their dependence to a sufficient pre-alignment of two datasets.
1.3 Motivation
A general aim in point cloud processing is to achieve a fully automatic workflow. Hence, the motivation arose to develop an automatic procedure for deformation monitoring that rules out potential biases provoked by different users. In addition, the desired solution should be versatile in terms of its input data. An algorithm that satisfies the latter aspect is the ICP algorithm that however relies on a satisfactory pre-alignment which leaves a methodical gap to the ideal of full automation. In order to achieve this prerequisite, several strategies appear to be suitable such as direct georeferencing, manual pre-alignment or pre-alignment algorithms. The desired solution should not rely on additional sensors or any form of user interaction. Hence, a two-tiered strategy was chosen that combines different algorithms for the pre-registration (Aiger et al., 2008) as well as the fine registration (Besl and McKay, 1992) of point clouds. It is well known that ICP-based approaches are sensitive to deformed regions, which yield erroneous registrations (Wujanz, 2012). Thus, it is of vital importance to reveal deformations within the captured datasets and to exclude these areas from the computation of transformation parameters. This aspect directly yields the following research questions:
-
Is it possible to automatically reject deformed regions within unreferenced laser scans?
-
Is the outcome biased by the geometric characteristics of the input as well as dependent on magnitude and distribution of deformations?
Kromer et al. (2017) approach the first research question by applying the Fischler and Bolles (1981) random sample consensus (RANSAC) in order to automatically exclude correspondences between two epochs which either arise as a consequence of deformation or false matches. Since Kromer et al. (2017) process data which have been captured by a permanent monitoring system at high temporal resolution, comparably low amounts of deformation can be expected between successive epochs. Thus, the risk of potential falsification of the outcome during the registration step by contaminated data should also be rather low, which otherwise may describe an insuperable hurdle for the parameter-dependent RANSAC. Since we assume to deal with deformation of larger magnitude and extent, an alternative solution is required that will be subject of Sect. 2.
This contribution demonstrates the automatic registration of multi-temporal point clouds as a vital prerequisite for the computation of geomorphometric measures. Therefore, a prototypical implementation of the iterative closest proximity algorithm (ICProx) that was integrated into the software Final Surface (GFaI 2017) was deployed. A brief description of the algorithm will be given in Sect. 2. Three regions of interest have been processed featuring different landforms such as ice glaciers, rock glaciers and a rockfall area. The study areas are described in detail in Sect. 3, while the computed results are the subject of Sect. 4. Section 5 summarises the findings presented in this article and gives an outlook on future endeavours.
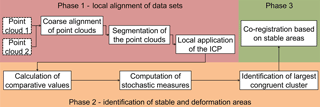
In order to avoid falsification of the deformation measurement process and consequently the analysis of deformation, it is unavoidable to automatically identify deformed areas within point clouds and to exclude them from the computation of transformation parameters. For this task, the ICProx algorithm was deployed, which will be briefly introduced in the following. The ICProx is based on a spatial decomposition of the original datasets and identifies deformation and stable areas, respectively, by comparison of locally computed transformation parameters for individual segments (Wujanz et al., 2016b). Congruent respectively stable areas in terms of geometry are detected by a combinatorial approach termed the maximum subsample method (Neitzel, 2004, p. 109 ff.), which is, in terms of robustness against outliers/deformation, more reliable and hence superior to robust estimators or RANSAC. A detailed description can be found in Wujanz et al. (2016b). The algorithm consists of three essential phases:
-
phase 1: local alignment of datasets;
-
phase 2: identification of both stable and deformation areas; and
-
phase 3: computation of transformation parameters based on stable areas.
Figure 1 illustrates the workflow of the ICProx including the aforementioned phases and all related processing steps.
2.1 Local alignment of datasets
Phase 1 in turn contains three steps, while the first one automatically carries out the pre-alignment of data. Therefore, the 4PCS algorithm as proposed by Aiger et al. (2008) is used in the first step. In the second step, the coarsely aligned data are decomposed in cubes of equal size that are also referred to as octree cells (Samet, 2006, p. 211 ff.). As already shown in Wujanz et al. (2016b), the choice of the octree cell size has notable effects on the outcome. In general, a smaller octree size leads to a higher degree of detecting stable regions, while the computational effort notably increases. Hence, setting the octree size is a balancing act between resolution and computation time. Subsequently, the ICP algorithm is locally applied within each octree cell, which represents the last step of phase 1. Therefore, so-called candidates are sampled in each cell of the reference coordinate system. For all candidates in the reference point cloud, the ICP will determine corresponding points in the second dataset. Thus, every cell receives an individual set of transformation parameters based on the established correspondences.
2.2 Identification of stable and deformation areas
The general idea in decomposing the original data into subsets is to locally increase or decrease the portion of deformation in order to identify geometric changes that occurred between scan acquisitions by means of suitable criteria in phase 2. Therefore, the individual sets of transformation parameters are applied to the corresponding centroid of a cell. Subsequently, distances between centroids before and after the application of the computed transformation parameters are compared. This strategy is in general comparable to the congruence analysis of geodetic networks by usage of combinatorial methods (Neitzel, 2004, p. 109 ff.). Congruent and thus stable regions share the following characteristic which helps to identify them: the distances between centroids before and after application of locally computed transformation parameters remain almost identical. Another unique feature of the algorithm is the automatic computation of uncertainty measures (ISO, 2008) that are calculated for the local registration in every octree cell instead of using fixed thresholds. This information is required in order to determine if an octree cell can be associated with a congruent set of cells or not. The general concept of this feature considers the fact that every scan of a stable object yields different point sampling (Wujanz et al., 2016b). In phase 3, the ICP is again applied to both epochs. This time, however, only stable regions, that were detected in phase 2, serve as input which is processed as a whole and not in segments. The result of phase 3 is a set of transformation parameters that forms the basis for the deformation estimation.

Figure 2(a) Binary change map of a test case. (b) Octree structure that contains the scene. (c) Stable (green cubes) and unstable (red cubes) octree cells after congruence analysis.
2.3 Some remarks on the spatial arrangement of deformation
Figure 2 depicts a test case on the left where stable areas are coloured in green, while deformation is highlighted in yellow. The aim of the ICProx algorithm is to identify these yellow areas and to exclude them from the final registration. The centre of the figure illustrates the decomposition of the input data. An individual set of transformation parameters is assigned to every cube by local application of the ICP algorithm. After congruence analysis, all segments are merged to one continuous dataset as depicted by green areas. Red regions have been classified as deformation and are thus excluded from the registration process.
From a geodetic perspective, the most desirable arrangement would be a more or less connected region that is subject to deformation which is surrounded by stable areas. In addition, the ratio between stable and deformed regions should be rather large in order to be able to compute transformation parameters with the highest possible redundancy. However, the distribution of stable areas, as well as their relative amount, is usually unpredictable in practice since every region of interest has its own individual characteristics. Countermeasures in order to receive favourable arrangements can be achieved by carrying out the surveys more frequently and/or to perform panorama scans which increases the chance of capturing additional stable areas. It is obvious that the result depicted on the right of Fig. 2 may yield imprecise transformation parameters due to the fact that a large amount of octree cells are subject to deformation, while the arrangement of stable cells is unfavourable.
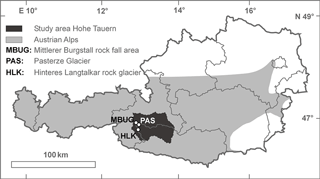
This study comprises three study areas in the Hohe Tauern area of the central Alps, Austria (see Fig. 3), monitoring three distinct geomorphic process groups:
-
Hinteres Langtalkar: rock glacier movement representing permafrost dynamics;
-
Pasterze Glacier: glacier retreat with subsequent proglacial processes; and
-
Mittlerer Burgstall: rockfall activity.
All datasets were captured using a Riegl LMS Z620 laser scanner that applies a wavelength of 1550 nm and is able to measure distances of up to 2000 m; in applications in the study area, 1500 m were achieved. A summary of the characteristics of all epochs is given in Table 1.
Table 1Summary of all used measurements in every study area comprising date of acquisition, number of points (points per epoch) and ground sampling distance (GSD).
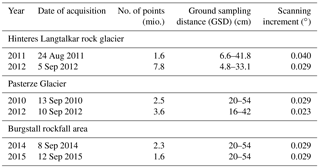
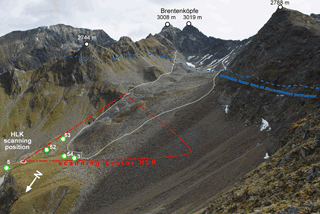
Figure 4Scanner configuration at Hinteres Langtalkar rock glacier. The scanning position Hinteres Langtalkar (HLK) is indicated by a red ellipse with a white edge; the rock glacier outline is indicated by a white dashed line. White circles with green edges highlight reference points.
3.1 The rock glacier Hinteres Langtalkar, Austria
The rock glacier Hinteres Langtalkar (46∘59′ N, 12∘47′ E) is located in the Schober Mountains at an elevation between 2455 and 2720 , and is ∼ 900 m long and ∼ 350 m wide. Using TLS, the rock glacier has been monitored since the year 2000 (Bauer et al., 2003). Extraordinary changes in surface elevation were detected around 2000 (Kaufmann and Ladstädter, 2002; Avian et al., 2005), leading to the assumption of acceleration most likely in 1994 (Avian et al., 2005). In order to geometrically quantify these surface elevation changes, a geodetic network was established in 1998 which has since been surveyed annually (Kienast and Kaufmann, 2004). The rock glacier itself shows distinct patterns of surface elevation changes and surface displacements. In addition, the rock glacier has reported to have a slower upper part and a rapidly moving lower part with maximum horizontal displacements of up to 2.5 m a−1 (Avian et al., 2009). The mean horizontal surface displacement rates vary between 0.10 and 0.18 m year−1, while maximum changes amount up to 3.6 m year−1 (Kaufmann and Ladstädter, 2009). Delaloye et al. (2008) estimate this rock glacier to currently be the fastest moving one in Europe, which underlines its importance for the scientific community.
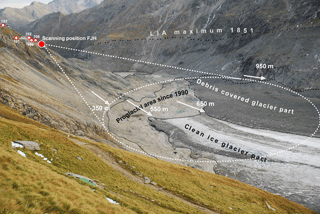
Figure 5Scanning configuration at the Pasterze Glacier terminus area from the scanning position, Kaiser-Franz-Josefs-Höhe (FJH). Dots near the scanning position represent the location of the reference points. Numbers near the arrows indicate the distance from the scanning position.
Despite the multiple use of TLS for monitoring geomorphological processes (see Oppikofer et al., 2008), TLS was rarely used for analysis of periglacial effects such as rock glacier movement patterns until the end of the last decade. First annual TLS observations were undertaken by Avian et al. (2005, 2009) or Bodin et al. (2008). Data acquisition was carried out from one of two known scanning positions (Hinteres Langtalkar – HLK, 2454.709 , on the left in Fig. 4). The lowest and largest ground sampling distances (GSDs) for the 2011 campaign summed up to 6.6 cm and 41.8 cm, respectively, while the corresponding measures for the survey of 2013 are 4.8 and 33.1 cm; see Table 1. These GSD values were computed based on the closest and furthest distances between scanner and scene. In Fig. 4, all applied reference points are highlighted by white circles and the scanner position by a red ellipse with a white edge. These reference points were surveyed by geodetic means and are hence known in a superior coordinate system. It can notably be seen that the distribution is rather unfavourable from a geodetic point of view as the active zone of the glacier, that is highlighted by a white dashed line, is not surrounded by reference points. This may lead to extrapolative and leverage effects, respectively. In order to provide trustable reference transformation parameters, a surface-based registration has been conducted after deformed regions were manually excluded. The scanning sector is marked by red dashed lines. The shown picture was taken in 2012.
3.2 The Pasterze Glacier, Austria
The Pasterze Glacier (47∘04′ N, 12∘44′ E) is located in the central part of the Austrian Alps. The geometric behaviour of this glacier has been of scientific interest since 1878 (Wakonigg and Lieb, 1996), which makes the Pasterze Glacier one of the longest-documented glaciers in the world. The glacier reached its latest maximum around 1852 in the Little Ice Age (Nicolussi and Patzelt, 2000) with a maximum area of 26.5 km2. Since then, the glacier constantly lost substance leading to a recent area of approximately 17.3 km2 in 2009 (Kaufmann et al., 2015). Accordingly, since the end of the Little Ice Age period, the Pasterze Glacier lost approximately 35 % of its area and about 60 % of its volume. The current retreat of the terminus area of the Pasterze Glacier has been observed using TLS since 2001, covering an area of approximately 0.9 km2. On average, the annual elevation change within the debris-covered part sums up to approximately 3.7 m, while 6.3 m vertical loss was detected in the clean ice section between 2011 and 2012. A comprehensive view on the geomorphic consequences of the fast glacier retreat can be found in Avian et al. (2018). The scanning configuration at the Pasterze Glacier terminus area is depicted in Fig. 5, while the picture was taken in 2008.
The view at scanning position Kaiser-Franz-Josefs-Höhe (FJH; 2362.621 ) is excellent for geomorphic applications, whereas the availability of stable areas led to an unfavourable distribution of reference points that do not surround the ROI. As a consequence, the computed transformation parameters based on the reference points can only be seen as an approximate solution, as they can very likely cause extrapolative effects and hence have been refined by surface-based registration. The necessity of revealing deformed regions prior to performing co-registration has already been extensively stated, so the ICProx algorithm is deployed in the following to solve this task for a comparison among the datasets from 2010 and 2012. A summary of quality parameters of TLS measurements at the Pasterze Glacier terminus area is given in Avian et al. (2018).
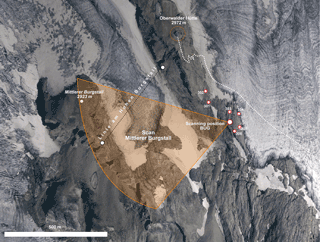
Figure 6Configuration at scanning position Burgstall (“Scanning position BUG”). BUG is serving two objects, Mittlerer Burgstall and Hoher Burgstall rockfall area. Codes: 301–306: reference points; “Linie am Hohen Burgstall” cross section of traditional glacier surveying. Orthoimage from 1998, Hohe Tauern National Park©.
3.3 The Mittlerer Burgstall rockfall area, Austria
The rockfall area Burgstall comprises the two former nunatak mountains (Kellerer-Pirklbauer et al., 2012) of Mittlerer and Hoher Burgstall which were encompassed by the Pasterze Glacier until the beginning of the 20th century. The Mittlerer Burgstall (47∘06′ N, 12∘42′ E; 2933 ) shows a distinct NW–SE trending ridge forming two rock faces which were exposed by glacier shrinkage in the last 100 years. In early summer 2007, a large rockfall at the top of the ridge, released approximately 430 000 m3 (Viktor Kaufmann, Graz University of Technology, personal communication, 2013) from a detachment area of approximately 3100 m2, transported debris to both sides of the ridge. Results from permafrost distribution modelling and ground temperature monitoring indicate (Kellerer-Pirklbauer et al., 2012) that the detachment area is located within or near the lower limit of permafrost. Consequently, in 2010, a geodetic network consisting of one main scanning position (BUG; 2794.958 ) and six reference points was established. From every reference point, each point can be viewed so that several scanning positions can be chosen to vary scanning geometry. The scanning configuration at scanning position Burgstall (BUG) can be seen in Fig. 6. Yet again, the sampling of reference points has to be rated as unfavourable. Hence, initial transformation parameters have been computed based on the reference points. Afterwards, deformed regions were manually excluded, while the remaining points were used to refine the relative alignment between point clouds based on the ICP.
Every algorithm is sensitive to chosen settings as well as to the individual characteristics of the given data. In this section, the three aforementioned regions of interest have been analysed by using the ICProx algorithm. The input for the ICProx algorithm consisted of two unreferenced point clouds per ROI given in different local scanner coordinate systems. Pre-alignment of the epochs was carried out by the 4PCS algorithm, while subsequently the ICProx algorithm was deployed in order to reveal regions that were subject to deformation. The inherent challenges of the datasets presented in Sect. 3.1 and 3.2 can be associated with their sheer extent. A somewhat different degree of difficulty can be assigned to the ROI that was the subject of Sect. 3.3. This scene is demanding due to the scattered distribution of deformation and the comparably small magnitude of geometric changes as a consequence of processes after a huge rockfall.

Figure 7Colour-coded confusion map (a), change map based on a comparison to the reference data outcome by usage of the ICProx (b) and the ICP (c) at Hinterer Langtalkar rock glacier.
Since the task of the ICProx algorithm is essentially a classification problem – to identify stable or deformed regions within a point cloud – the generated outcome can be numerically evaluated in the form of confusion matrices, while a visual inspection is carried out by so-called confusion maps. The reference data for the evaluation process are established by point clouds where deformed areas were manually removed, while the relative alignment of the remaining points was refined by surface-based registration. Based on these data, a point cloud was tinted in two colours representing the two classes of interest, namely deformation and stable region. The comparison between the reference and the results computed by the ICProx algorithm finally yield a confusion matrix and confusion maps, respectively, as depicted, for instance, on the left of Fig. 7. Therefore, the following colour scheme will be used and contains four elements, namely:
-
blue: area is stable, detected as stable (true positive);
-
cyan: area is stable, detected as unstable (false negative);
-
red: area is unstable, detected as stable (false positive); and
-
orange: area is unstable, detected as unstable (true negative).
Note that a perfect result would only contain the first and last colours in the list. Yet, this aim is not achievable due to the applied octree structure.
4.1 Rock glacier Hinteres Langtalkar
After pre-alignment, the entire dataset was decomposed into octree cells of 30 m so that in total 661 cells emerged. In order to locally determine transformation parameters, candidates were sampled with 0.75 m on average. After congruence analysis, the largest subset contains 441 cells that were considered as being stable. Based on these areas, an ICP-based registration was carried out, leading to average residuals of 15.3 cm between the two point clouds. Afterwards, the computed results were compared to the reference, yielding a confusion matrix as well as a colour-coded confusion map which is depicted in Fig. 7. Figure 7a shows octree cells where orange represents the rock glacier and red cells are considered as being stable. This effect occurred predominately in the transition region between the glacier tongue and surrounding areas. The reason why these cells have been falsely assigned to the stable class can be found in the very low magnitude of deformation in the transition zone of the rock glacier which has a similar scale to the uncertainty measures (ISO, 2008). As a consequence, deformations of this size fall below the margin of detectability. The narrow red band on the left side of the scene was falsely assigned as being stable due to its limited spatial expansion.
The remaining parts of Fig. 7 show change maps based on comparisons between the reference dataset and their corresponding versions which were altered in position and orientation before application of the ICProx (Fig. 7b) and ICP (Fig. 7c). Hence, the motivation for conducting this analysis is to reveal differences between the two surface-based approaches against the reference data. A look at Fig. 7b shows that the majority of the scene complies within ±5 cm, while some parts feature deviations between 5 and 14 cm. These differences may be triggered by leverage effects due to an insufficient sampling of artificial targets for georeferencing. This suspicion substantiates if one has a look at Fig. 4b, where it can be seen that all targets do not surround the glacier tongue and are only located in the north-westerly direction (above the glacier tongue in the figure). On average, the differences between the reference and the result computed based on the ICProx sum up to (i) 5.8 cm for points that are located above the reference surface and (ii) 4.5 cm for points below it, while the standard deviation among the two datasets measures 5.7 cm. Figure 7c again confirms that the ICP is not an appropriate algorithm for registration of point clouds that were subject to deformation. Again, the same statistical measures were computed as before where the mean deviation among the datasets sums up to 17.4 cm for points above the reference and 23.9 cm for points below the reference surface, respectively. The corresponding standard deviation of all residuals is 24.2 cm. It has to be mentioned that the listed statistical measures are somewhat whitewashed due to the fact that only deviations within the specified range between ±50 cm were considered but not the grey-coloured areas where the discrepancies exceed these limits.
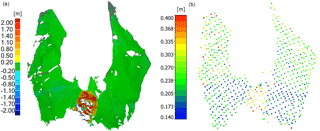
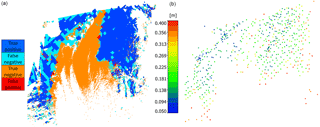
Figure 8Change map of the Hinterer Langtalkar (a) and spatial uncertainties (m) for individual octree cells (b).
The numerical assessment of the generated results is given in Table 2 and reveals that a comparably large part of stable areas was not correctly assigned, as indicated by the numbers in the cyan-coloured cell. The reason for this can be found in the weak geometric characteristics in the corresponding octree cells. The overall classification accuracy sums up to a moderate 60 % = 55 % + 5 % and can mostly be justified by the aforementioned geometric characteristics of the dataset. For the detection rate of stable areas, a value of 60 % = 55 %∕(55 % + 37 %) was achieved. This result can be rated in two ways. On the one hand, it can be seen as a satisfactory result, while on the other hand, a substantial amount of valid information was not used. The corresponding detection rate of deformation is 62.5 % = 5 %∕(5 % + 3 %). After analysing the numbers in Table 2, it appears that the allegedly “simple” dataset with only 8 % of deformation has turned into a challenging task for the algorithm. However, a second look at Fig. 7 reveals that the stable areas surround the major area of deformation. Hence, a stable set of transformation parameters can be expected without extrapolative effects. The influence of 3 % of false positive cells can be expected to be little due to the fact that the magnitude of deformation is comparably low in these parts and due to the low ratio between true positive (55 %) and false positive (3 %) areas.
The change map based on the results of the ICProx algorithm is illustrated in Fig. 8a and describes the basis for deformation analysis by geologists. In Fig. 8b, the uncertainty values computed by the ICProx algorithm for individual octree cells (Wujanz et al., 2016b) can be seen forming the statistic basis to distinguish stable areas and deformation. Hence, small uncertainty values allow detecting deformations of small magnitude. It is obvious that the distribution of uncertainty values is quite heterogeneous, ranging from several centimetres to several decimetres. It can also be seen that the upper parts of the rock glacier have larger uncertainties. This can be explained by the fact that the local sampling rate is lower compared to the regions right below. The uncertainty values on the glacier tongue are also notably increased when compared to its surroundings. This is caused by the unsteady geometric characteristics of the glacier tongue in combination with the scanning configuration, as depicted in Fig. 4.
4.2 Pasterze Glacier terminus area
For this ROI, it can be expected that deformation occurred predominantly directly at the glacier's tongue, so that comparatively large octree cells were defined. Hence, the size of the cells was empirically set to 52.5 m, leading to 923 segments. On average, candidates were sampled every 6 m, which led to approximately 40 700 candidates. After application of the algorithm, a congruent set consisting of 526 octree cells emerged that was finally used to compute the transformation parameters for deformation monitoring. The residuals after registration based on stable regions were 28.8 cm on average. An explanation for this rather large quality measure can be found in the comparably low ground sampling distance in relation to the rugged terrain. Based on expert knowledge, a set of reference transformation parameters was computed featuring undoubtedly stable areas. This procedure is very time consuming, yet crucial in order to avoid falsification of the reference dataset by deformation.
After generating the aforementioned reference dataset, quality assessment was carried out. Figure 9a depicts the confusion map which was coloured according to the colour scheme proposed at the beginning of this section. In the centre of Fig. 9a, the glacier tongue is highlighted in orange, corresponding to large detected geometric changes. On the sides, stable areas can be found which have been predominantly detected by the algorithm. Cyan-coloured areas can be seen predominantly on the left of the tongue. These regions have not been detected as being stable due to the fact that their local geometric characteristics did not feature notable topographic changes. Consequently, the locally applied ICP converged into local minima, as the ICP requires a certain geometric contrast within the datasets. Red areas, however, have to be rated as being critical for the desired results. These regions can be found primarily in transition areas between glacier terminus and adjacent stable parts of the point cloud. The reason why these areas were falsely classified can be explained by their magnitude of deformation – they fall below the margin of detectability. Single red spots in the otherwise stable flanks left and right of the tongue were triggered by single-sliding or mass-wasting processes (Avian et al., 2018). These appearances also fall below the margin of detectability, yet not due to their magnitudes but their limited spatial extent. In Fig. 9b, spatial uncertainty measures for each octree cell are shown, which have been computed by the ICProx algorithm. A heterogeneous distribution is apparent, while an increasing characteristic can be seen towards the lower part of the image due to insufficient local sampling.
The numerical interpretation of the results can be found in Table 3. In total, 19 % of the dataset was falsely classified as deformation despite the fact that it actually remained geometrically stable. This effect does not provoke any substantial disadvantages, yet does simply mean that stable areas remain unused for the final registration. The portion of the critically false positive class, which is coloured in red in all tables and figures, sums up to 2 %. These regions undeniably have an influence on the registration, yet can be rated as uncritical due to their comparably low magnitudes and low fraction in relation to the stable areas.
All in all, the classification has to be rated quite positively with an overall accuracy of 79 % = 43 % + 36 %. The detection rate for stable areas sums up to 69 % = 43 %∕(43 % + 19 %); the one for deformation is even 95 % = 36 %∕(36 % + 2 %). Consequently, the algorithm can be characterised as being “careful” – in case of doubt, areas are rather classified as being deformed.
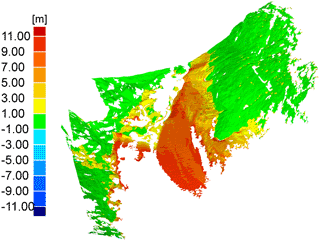
Figure 10 features a point cloud that is coloured according to geometrical differences that occurred in between epochs. Large differences are notably visible at the glacier terminus area. Two regions need to be highlighted in particular. At first, the orange-to-red-coloured part has to be brought to attention with vertical surface elevation changes in the magnitude of −6.5 to −10 m a−1. In this part of the glacier, the terminus area is only sparsely covered by debris. The second notable part is coloured in shades of yellow to green where the glacier tongue is covered by morainic debris. As a consequence, the ablation rates are significantly lower compared to the clean ice part with vertical surface elevation changes in the magnitude of −4 to −6 m a−1 (Kellerer-Pirklbauer et al., 2008).
4.3 Mittlerer Burgstall rockfall area
Just as before, the input for the ICProx algorithm consisted of two unreferenced point clouds, given in different local scanner coordinate systems. In order to decompose the datasets, an octree size of 5 m in all cardinal directions was chosen yielding 3494 cells. Candidates were sampled with an average spacing of 0.5 m so that about 120 000 correspondences had to be iteratively found by the ICP. After application of the ICProx algorithm, a congruent set of 2179 cells arose that was deployed to compute the desired transformation parameters for deformation monitoring. The residuals after registration based on stable regions were 17.2 cm on average. Again, the explanation for this rather large quality measure can be found in the comparably low ground sampling distance in relation to the rugged terrain. As before, expert knowledge was used to create a set of reference transformation parameters by manually selecting undoubtedly stable areas. Based on this information, a binary change map with the two classes, stable area and deformation, was created. These data served as a basis for the confusion map that is depicted in Fig. 11a. In contrast to the two previously shown examples, several red areas are notable, in which deformed regions were falsely classified as being stable. A close look at the red speckles which are located in the major rockfall area highlighted in orange shows that most of them contain some locally restricted blue regions. As a result, a mixture between stable and predominantly deformed areas occurs within the corresponding octree cells and hence lowers the algorithm's margin of detectability. The reverse case can be seen in Fig. 11b, which is mostly tinted in blue where small red spots are notable. Another reason for the comparably frequent occurrence of red regions is the low magnitude of deformations. The right part of the figure shows spatial uncertainties for individual octree cells given in metres. A heterogeneous distribution of uncertainty values is apparent, yet its variation appears to be weaker when compared to the other two examples. Note that the spatial uncertainties in large parts of the deformed region fall into the decimetre range.
The numerical assessment of the generated results is given in Table 4 and shows that a comparably large part of deformed areas was not correctly assigned, as indicated by the numbers in the red-coloured cell. The reason for this is two-fold and can be found both in the ratio among the low magnitude of deformation and the corresponding local spatial uncertainties as well as the heterogeneous occurrence of geometric changes. The overall classification accuracy sums up to 72 % = 43 % + 29 %. For the detection rate of stable regions, a value of 74 % = 43 %∕(43 % + 15 %) was achieved that marks the best value in this contribution. However, the corresponding detection rate of deformation only sums up to 69 % = 29 %∕(29 % + 13 %).
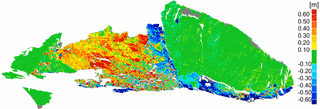
Figure 12Change map based on the detected stable regions – comparison between the datasets from 2014 and 2015.
Based on the reference transformation parameters, a change map was generated that is depicted in Fig. 12. The majority of geometric changes occurred in the centre of the figure as well as on the bottom of the right part. Apart from larger connected regions, local nests of rockfall can be seen especially on the upper right part of the illustration.
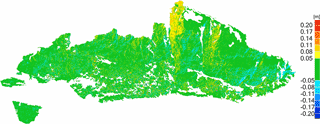
Figure 13Comparison between the reference dataset and results generated based on the ICProx algorithm.
A look at Table 4 shows that 13 % of all points were assigned to the false positive class. Hence, its influence onto the outcome is of interest in the following. Therefore, the computed set of transformation parameters based on the detected stable regions was applied to the second epoch and compared to the generated reference dataset. On average, the absolute deviation between the reference and computed result is 7.37 cm. The corresponding change map in Fig. 13 illustrates the differences in metres. In summary, the processed dataset proved to be challenging and revealed boundaries for the ICProx algorithm. Apart from magnitude and spatial distribution of deformation, the inherent relationship between detectability of geometric changes and local point density had a critical influence onto the outcome, which finally led to the comparably large amount of falsely classified stable regions. Thus, future surveys in this region should be carried out at higher spatial sampling rates.
In this contribution, an algorithm, termed the ICProx, was used to automatically identify and finally exclude deformation from point clouds captured at different points in time. If this diagnostic step is not performed, systematic falsification of the registration is inevitable, and consequently wrong conclusions are drawn during analysis of the deformation pattern or computation of geomorphometric measures. Based on the detected stable regions, transformation parameters were computed as a vital prerequisite for deformation monitoring. The chosen study areas featured a glacier, a rock glacier, as well as a rockfall area. The datasets themselves proved to be demanding due to individual geometric characteristics, extent, relative amount and/or magnitude of deformations. In general, the algorithm performed well for the data presented in Sect. 3.1 and 3.2 where geometric changes occurred in a connected fashion. The most challenging task was represented by the data discussed in Sect. 3.3 due to the fact that deformation was scattered all over the datasets and the deformation rates were comparably low in comparison to the local uncertainty values. All results were numerically and visually evaluated against reference datasets. The mean classification accuracy for stable regions is 68 %, while the corresponding measure for deformation is 76 %. Thus, the results can be rated as quite promising. However, the importance of carefully acquiring data is particularly apparent in Sect. 4.3, as it clearly demonstrates the inherent link between local sampling density and potential detectability of deformation. It is important to point out that the effects provoked by the sampling uncertainty of TLS notably surpass their capabilities in terms of achievable 3-D precision.
Further research will focus on eliminating some existing disadvantages of the algorithm as well as the applied assessment procedure. One of them is the dependency of the outcome to the degree of decomposition of the point clouds by usage of an octree structure. Hence, an extension has to be implemented that is able to determine an optimal octree size under consideration of the local topography. This information could also be used to dismiss certain octree cells due to insufficient geometric properties that would otherwise occur in the algorithm's numerical and visual assessment. In addition, stable cells that border on deformed regions should be split and dismissed from the registration in order to avoid falsification in such transition zones as illustrated in Figs. 7 and 9. An alternative strategy could be to apply the ICProx algorithm in an iterative fashion where the octree size gradually decreases. With this, the boundaries of deformed regions would be detected at a higher resolution. Since geomorphometric monitoring is carried out frequently over long periods, strategies have to be developed in order to process time series that consist of several epochs.
The data are not publicly accessible at the moment; this is planned to be carried out in 2019. In the meantime it is available upon request from the authors.
The authors declare that they have no conflict of interest.
This article is part of the special issue “4-D reconstruction of Earth surface processes: multi-temporal and multi-spatial high-resolution topography”. It is not associated with a conference.
We warmly appreciate the support of several
students of the Graz University of Technology and University of Graz within
the scanning campaigns.
Edited by: Fabian
Neugirg
Reviewed by: Roderik Lindenbergh and two anonymous
referees
Adams, M., Gleirscher, E., and Gigele, T.: Automated Terrestrial Laser Scanner Measurements of Small-Scale Snow Avalanches, Proc. Intern. Snow Science Workshop Grenoble–Chamonix MontBlanc, 2013.
Aiger, D., Mitra, N. J., and Cohen-Or, D.: 4-points congruent sets for robust pairwise surface registration, ACM T. Graphic, 27, 85–95, https://doi.org/10.1145/1399504.1360684, 2008.
Al-Manasir, K. and Lichti, D.: Self–Calibration of a Leica HDS7000 Scanner, Proc., FIG Working Week, International Federation of Surveyors, Copenhagen, Denmark, 2015.
Anderson, J. and Bausch, C.: Climate Change and Natural Disasters: Scientific Evidence of a Possible Relation Between Recent Natural Disasters and Climate Change, Requested study on behalf of the European Parliament's Environment, Public Health and Food Safety Committee, 2006.
Avian, M., Lieb, G. K., and Kaufmann, V.: Recent and Holocene dynamics of a rock glacier system – the example of Langtalkar (Central Alps, Austria), Norsk Geogr. Tidsskr., 59, 1–8, 2005.
Avian, M., Kellerer-Pirklbauer, A., and Bauer, A.: LiDAR for monitoring mass movements in permafrost environments at the cirque Hinteres Langtal, Austria, between 2000 and 2008, Nat. Hazards Earth Syst. Sci., 9, 1087–1094, https://doi.org/10.5194/nhess-9-1087-2009, 2009.
Avian, M., Kellerer-Pirklbauer, A., and Lieb, G. K.: Geomorphic consequences of rapid deglaciation at Pasterze Glacier, Hohe Tauern Range, Austria, between 2010 and 2013 based on repeated terrestrial laser scanning data, Geomorphology, 310, 1–14, 2018.
Bauer, A., Paar, G., and Kaufmann, V.: Terrestrial laser scanning for rock glacier monitoring, 8th International Conference on Permafrost, Proceedings vol. 1, 55–60, 2003.
Bechtold, S. and Höfle, B.: HELIOS: A Multi-Purpose Lidar Simulation Framework For Research, Planning And Training Of Laser Scanning Operations With Airborne, Ground-Based Mobile And Stationary Platforms, ISPRS Ann. Photogramm. Remote Sens. Spatial Inf. Sci., III-3, 161–168, https://doi.org/10.5194/isprs-annals-III-3-161-2016, 2016.
Besl, P. J. and McKay, N. D.: Method for registration of 3-D shapes, Robotics-DL tentative, International Society for Optics and Photonics, 586–606, 1992.
Bodin, X. and Schoeneich, P.: High-resolution DEM extraction from terrestrial LIDAR topometry and surface kinematics of the creeping alpine permafrost: The Laurichard rock glacier case study (Southern French Alps), in: Ninth International Conference on Permafrost, edited by: Kane, D. L. and Hinkel, K. M., Institute of Northern Engineering, University of Alaska Fairbanks, 1, 137–142, 2008.
Böhler, W., Vicent, M. B., and Marbs, A.: Investigating laser scanner accuracy, ISPRS Arch. Photogramm. Remote Sens. Spatial Inf. Sci., 34, 696–701, 2003.
Böhm, J. and Becker, S.: Automatic marker-free registration of terrestrial laser scans using reflectance, Proceedings of 8th Conference on Optical 3-D Measurement Techniques, Zurich, Schweiz, 9–12 July 2007, 338–344, 2007.
Bradley, R. S., Vuille, M., Diaz, H. F., and Vergara, W.: Threats to water supplies in the tropical Andes, Science, 312, 1755–1756, 2006.
Cignoni, P., Rocchini, C., and Scopigno, R.: Metro: measuring error on simplified surfaces, Comput. Graph. Forum, 17, 167–174, 1998.
Cramer, M., Stallmann, D., and Haala, N.: Direct georeferencing using GPS/inertial exterior orientations for photogrammetric applications, Int. Arch. Photogramm. Remote Sens., 33, 98–205, 2000.
Delaloye, R., Perruchoud, E., Avian, M., Kaufmann, V., Bodin, X., Hausmann, H., Ikeda, A., Kääb, A., Kellerer-Pirklbauer, Krainer, K., Lambiel, C., Mihajlovic, D., Staub, B., Roer, I., and Thibert, E.: Recent interannual variations of rock glacier creep in the European Alps, in: Proceedings of the Ninth International Conference on Permafrost (NICOP), University of Alaska, United States of America, 343–348, 2008.
Fischler, M. A. and Bolles, R. C.: Random sample consensus: a paradigm for model fitting with applications to image analysis and automated cartography, Commun. ACM, 24, 381–395, https://doi.org/10.1145/358669.358692, 1981.
GFaI: Official website of the 3-D-Software Final Surface, available at: http://www.final-surface.com, last access: 17 May 2017.
Gielsdorf, F., Gründig, L., and Milev, I.: Deformation analysis with 3-D laser scanning, in: Proceedings of the 13th FIG Symposium, Lisbon, Portugal, 12–15 May, 2008.
Girardeau-Montaut, D., Roux, M., Marc, R., and Thibault, G.: Change detection on points cloud data acquired with a ground laser scanner, ISPRS Arch. Photogramm. Remote Sens. Spatial Inf. Sci., 36, 30–35, 2005.
Heunecke, O. and Welsch, W.: Terminology and classification of deformation models in engineering surveys, J. Geospat. Eng., 2, 35–44, 2000.
Höfle, B. and Pfeifer, N.: Correction of laser scanning intensity data: data and model-driven approaches, ISPRS J. Photogramm., 62, 415–433, 2007.
ISO: Evaluation of Measurement Data – Guide to the Expression of Uncertainty in Measurement, JCGM 100:2008(E), Joint Committee for Guides in Meterology (JCGM), 2008.
Jaboyedoff, M., Oppikofer, T., Abellán, A., Derron, M. H., Loye, A., Metzger, R., and Pedrazzini, A.: Use of LIDAR in landslide investigations: a review, Nat. Hazards, 61, 5–28, 2012.
Kaufmann, V. and Ladstädter, R.: Monitoring of active rock glaciers by means of digital photogrammetry, Proceedings of the ISPRS Commission III Symposium “Photogrammetric Computer Vision”, 9–13 September, Graz, Austria, IAPRS, Vol. 34, Part 3B, 108–111, 2002.
Kaufmann, V. and Ladstädter, R.: Documentation and visualization of the morphodynamics of Hinteres Langtalkar rock glacier (Hohe Tauern Range, Austrian Alps) based on aerial photographs (1954–2006) and geodetic measurements (1999–2007), Proceedings of the 10th International Symposium on High Mountain Remote Sensing Cartography, Kathmandu, Nepal, 2009.
Kaufmann, V., Kellerer-Pirklbauer, A., Lieb, G. K., Slupetzky, H., and Avian, M.: Glaciological Studies at Pasterze Glacier (Austria) Based on Aerial Photographs, Monitoring and Modeling of Global Changes, Springer Netherlands, 173–198, 2015.
Kellerer-Pirklbauer, A., Lieb, G. K., Avian, M., and Gspurning, J.: The response of partially debris-covered valley glaciers to climate change: the example of the Pasterze Glacier (Austria) in the period 1964 to 2006, Geogr. Ann., 90, 269–285, 2008.
Kellerer-Pirklbauer, A., Lieb, G. K., Avian, M., and Carrivick, J.: Climate change and rock fall events in high mountain areas: numerous and extensive rock falls in 2007 at Mittlerer Burgstall, Central Austria, Geogr. Ann. A, 94, 59–78, 2012.
Kienast, G. and Kaufmann, V.: Geodetic measurements on glaciers and rock glaciers in the Hohe Tauern National park (Austria), Proceedings of the 4th ICA Mountain Cartography Workshop, Vall de Núria, Catalonia, Barcelona, Spain, 101–108, 2004.
Kromer, R. A., Abellán, A., Hutchinson, D. J., Lato, M., Chanut, M.-A., Dubois, L., and Jaboyedoff, M.: Automated terrestrial laser scanning with near-real-time change detection – monitoring of the Séchilienne landslide, Earth Surf. Dynam., 5, 293–310, https://doi.org/10.5194/esurf-5-293-2017, 2017.
Lague, D., Brodu, N., and Leroux, J.: Accurate 3-D comparison of complex topography with terrestrial laser scanner: application to the Rangitikei canyon (NZ), ISPRS J. Photogramm., 82, 10–26, 2013.
Lambrecht, A. and Kuhn, M.: Glacier changes in the Austrian Alps during the last three decades, derived from the new Austrian glacier inventory, Ann. Glaciol., 46, 177–184, 2007.
Lichti, D. D. and Licht, M. G.: Experiences with terrestrial laser scanner modelling and accuracy assessment, Int. Arch. Photogramm., 36, 155–160, 2006.
Lindenbergh, R. and Pietrzyk, P.: Change detection and deformation analysis using static and mobile laser scanning, Appl. Geomatics, 7, 65–74, 2015.
Lowe, D.: Object recognition from local scale-invariant features, The Proceedings of the seventh IEEE International Conference on Computer Vision, 2, 1150–1157, 1999.
Neitzel, F.: Identifizierung konsistenter Datengruppen am Beispiel der Kongruenzuntersuchung geodätischer Netze, German Geodetic Commission (DGK), Volume C, Nr. 565, Munich, Germany, 2004.
Neitzel, F.: Investigations of axes errors of terrestrial laser scanners, 5th International Symposium Turkish–German Joint Geodetic Days, Berlin, Germany, 2006.
Nicolussi, K. and Patzelt, G.: Discovery of early-Holocene wood and peat on the forefield of the Pasterze Glacier, Eastern Alps, Austria, Holocene, 10, 191–199, 2000.
Oppikofer, T., Jaboyedoff, M., and Keusen, H. R.: Collapse at the eastern Eiger flank in the Swiss Alps, Nat. Geosci., 1, 531–535, 2008.
Paffenholz, J. A., Alkhatib, H., and Kutterer, H.: Direct geo-referencing of a static terrestrial laser scanner, J. Appl. Geodesy, 4, 115–126, 2010.
Previtali, M., Barazzetti, L., Brumana, R., and Scaioni, M.: Scan registration using planar features, Int. Arch. Photogramm., 40, 501, 2014.
Riegl: Riegl VZ-200i data sheet, available at: http://www.riegl.com/uploads/tx_pxpriegldownloads/RIEGL_VZ-2000i_Datasheet_2017-12-18_Preliminary.pdf (last access: 26 March 2018), 2017.
Salo, P., Jokinen, O., and Kukko, A.: On the calibration of the distance measuring component of a terrestrial laser scanner, in: Proc. in the XXIth ISPRS Congress, Silk Road for Information from Imagery, Vol. 37, p. B5, 2008.
Samet, H.: Foundations of Multidimensional and Metric Data Structures, Kaufmann, San Francisco, California, USA, 2006.
Schwalbe, E., Maas, H. G., Dietrich, R., and Ewert, H.: Glacier velocity determination from multi temporal terrestrial long range laser scanner point clouds, ISPRS Arch. Photogramm. Remote Sens. Spatial Inf. Sci., 37, 457–462, 2008.
Soudarissanane, S.: The geometry of terrestrial laser scanning; identification of errors, modeling and mitigation of scanning geometry, Doctoral dissertation, Delft University of Technology, 2016.
technet: Scantra – High-Precision Scan Registration without Targets, available at: http://technet-gmbh.de/index.php?id=1051&L=1 (last access: 17.05.2017), 2017.
Tirado, M. C., Clarke, R., Jaykus, L. A., McQuatters-Gollop, A., and Frank, J. M.: Climate change and food safety: a review, Food Res. Int., 43, 1745–1765, 2010.
van Veen, M., Hutchinson, D. J., Kromer, R., Lato, M., and Edwards, T: Effects of sampling interval on the frequency-magnitude relationship of rockfalls detected from terrestrial laser scanning using semi-automated methods, Landslides, 14, 1579–1592, 2017.
Wakonigg, H. and Lieb, G. K.: Die Pasterze und ihre Erforschung im Rahmen der Gletschermessungen, Wissenschaft im Nationalpark Hohe Tauern Kärnten – Kärntner 888 Nationalpark-Schriften, 8, 99–115, 1996.
Wujanz, D.: Towards Transparent Quality Measures in Surface Based Registration Processes: Effects of Deformation Onto Commercial and Scientific Implementations, Proceedings of the XXII Congress of the ISPRS, Melbourne, Australia, 2012.
Wujanz, D., Holst, C., Neitzel, F., Kuhlmann, H., Niemeier, W., and Schwieger, V.: Survey configuration for terrestrial laser scanning, Allgemeine Vermessungsnachrichten (AVN), 6, 158–169, 2016a.
Wujanz, D., Krueger, D., and Neitzel, F.: Identification of stable areas in unreferenced laser scans for deformation measurement, Photogramm. Rec., 31, 261–280, 2016b.
Wujanz, D., Burger, M., Mettenleiter, M., and Neitzel, F: An intensity-based stochastic model for terrestrial laser scanners, ISPRS J. Photogramm., 125, 146–155, 2017.
Zoller+Fröhlich: Data sheet, Z+F IMAGER 5010X, available at: http://www.zf-laser.com/fileadmin/editor/Datenblaetter/Z_F_IMAGER_5010X_System_Requirements_E_FINAL.pdf (last access: 21 May 2017), 2017.


