the Creative Commons Attribution 4.0 License.
the Creative Commons Attribution 4.0 License.
 | 21 Jan 2020
Dynamic allometry in coastal overwash morphology
Kirstin L. Davenport
Ana Matias
Allometry refers to a physical principle in which geometric (and/or metabolic) characteristics of an object or organism are correlated to its size. Allometric scaling relationships typically manifest as power laws. In geomorphic contexts, scaling relationships are a quantitative signature of organization, structure, or regularity in a landscape, even if the mechanistic processes responsible for creating such a pattern are unclear. Despite the ubiquity and variety of scaling relationships in physical landscapes, the emergence and development of these relationships tend to be difficult to observe – either because the spatial and/or temporal scales over which they evolve are so great or because the conditions that drive them are so dangerous (e.g. an extreme hazard event). Here, we use a physical experiment to examine dynamic allometry in overwash morphology along a model coastal barrier. We document the emergence of a canonical scaling law for length versus area in overwash deposits (washover). Comparing the experimental features, formed during a single forcing event, to 5 decades of change in real washover morphology from the Ria Formosa barrier system, in southern Portugal, we find differences between patterns of morphometric change at the event scale versus longer timescales. Our results may help inform and test process-based coastal morphodynamic models, which typically use statistical distributions and scaling laws to underpin empirical or semi-empirical parameters at fundamental levels of model architecture. More broadly, this work dovetails with theory for landscape evolution more commonly associated with fluvial and alluvial terrain, offering new evidence from a coastal setting that a landscape may reflect characteristics associated with an equilibrium or steady-state condition even when features within that landscape do not.
- Article
(5677 KB) - Full-text XML
-
Supplement
(549 KB) - BibTeX
- EndNote


In geomorphology, a scaling law is a formalized expression that typically describes how two geometric attributes of a landform relate to each other in a consistent way. Most geomorphic scaling laws take the form of a power relationship. For example, the length (L) of a feature relative to its area (A), as in a fluvial drainage basin (Hack, 1957; Montgomery and Dietrich, 1988), is typically expressed as L∼Ah, where the scaling exponent h defines the slope of the relationship in log-transform space. Geomorphic scaling laws derived from feature dimensions demonstrate allometry: a general physical principle in which geometric (and/or metabolic) characteristics of an object or organism are correlated to its size. Allometric patterns appear in a diversity of geomorphic settings – erosional (river systems; submarine canyons) and depositional (alluvial fans; coastal deltas) – and are a quantitative signature of intrinsic structure, organization, or regularity (Church and Mark, 1980; Dodds and Rothman, 2000; Moscardelli and Wood, 2016; Straub et al., 2007; Paola et al., 2009; Wolinsky et al., 2010; Edmonds et al., 2011; and Lazarus, 2016). Scaling relationships that describe geomorphic allometry can serve as useful predictive tools, even when the processes behind the patterns are complex or unclear (Shreve, 1966; Kirchner, 1993).
Whether, and how, power laws might provide explanatory insight into physical mechanisms has been a recurrent issue in different academic fields for the better part of the last century. A flurry of critical discourse on the utility of geomorphic scaling laws unfolded in scholarly literature of the 1970s. Following Horton's (1945) pivotal observations of mathematical structure in stream networks, a variety of geomorphic scaling relationships gained traction both in drainage (Langbein et al., 1947; Leopold and Maddock, 1953; Hack, 1957; Strahler, 1957, 1958; Melton, 1958; Gray, 1961; and Leopold et al., 1964) and alluvial settings (Bull, 1962; Denny, 1965). Borrowing primarily from biology (Huxley, 1924), as well as from urban geography (Berry and Garrison, 1958) and economics (Simon and Bonini, 1958), Woldenberg (1966) applied the concept of allometric growth – defined as “growth of a part at a different rate from that of a body as a whole” (Huxley and Tessier, 1936) – to the emergence of stream order within a drainage basin (Horton, 1945). This extension of allometric theory triggered an essential, not simply semantic, terminological distinction between allometry versus allometric growth (Mosley and Parker, 1972). The broadest conception of allometry includes all relationships that describe “a size-correlated change in shape” (Gould, 1966). Allometric growth, meanwhile, implies that the rates of size-correlated changes in shape describe an organized relationship. A test of drainage-network evolution in an experimental basin by Mosley and Parker (1972) did not confirm Woldenberg's (1966) supposition of allometric growth; they found no evidence that rates of size-correlated changes in drainage networks conformed to a well-organized pattern. However, the description of their null result did not disparage geomorphic allometry as a subject for further research. Rather, Mosley and Parker (1972) describe their test of Woldenberg's (1966) theorizing with a tone of generosity that further opened the problem, encouraging geomorphologists to consider the inductive challenges posed by “static” versus “dynamic” allometry (Bull, 1975, 1977; Church and Mark, 1980).
The majority of geomorphic scaling laws exemplify static allometry: snapshots of landform examples sampled from a collection of different sites, or from a “population” consisting of many examples at a single site. Aggregating examples in this way enables an objective comparison across a variety of cases and contexts – for example, compiling field data from different physical environments or from new and historical observational records or placing field observations and model results in the same parameter space. But where static allometry reflects the “interrelations of measurements made of an object at one time in its history”, dynamic allometry reflects sequential measurements of shape over time (Bull, 1975). Linking the static allometry of a given shape to its dynamic allometry – observing the progression by which a form emerges – is fundamental to linking overarching pattern to underlying process.
Depending on the landform of interest, directly observing dynamic allometry in real settings can be extraordinarily difficult; consider, for example, that any feature dominated by diffusion will change on a timescale proportional to the square of the feature's length scale, t∼L2. That is, the bigger the landscape feature, the more patient an observer needs to be. Dynamic allometry of other features, like event-triggered fluvial (Millard et al., 2017), coastal (Leatherman and Zaremba, 1987; Lazarus, 2016), and mass-transport-type deposits (Moscardelli and Wood, 2016), may be too violent or dangerous to track in situ. Deposits in the geologic sedimentary record are fossils (Moscardelli and Wood, 2016; Donnelly and Woodruff, 2007), long since active – although glimpses of their past dynamics might be possible to infer from fine-scale stratigraphy, if they are well enough preserved (Shaw et al., 2015). From the comparative safety of controlled experimental or numerical model systems, timescales of physical landscape change are deliberately accelerated, and dynamic allometry can be revealed in high-frequency time series.
Here, presenting new evidence of dynamic allometry from a previously reported physical experiment on coastal barrier overwash morphology (Lazarus, 2016), we document the progressive development of (1) a stable scaling exponent relating length and area in washover deposits and (2) a dominant aspect ratio (or “spacing ratio”) relating washover width to length (Fig. 1). Overwash is a natural fundamental physical process of coastal barrier systems in which shallow overland flow, driven by a storm event, transports sediment from the open-coastal barrier face of the open coast to the barrier floodplain and sheltered back-barrier wetlands (Morton and Sallenge Jr., 2003; Donnelly et al., 2006; and FitzGerald et al., 2008). Overwash occurs even in the absence of sea-level rise, but sediment supply to the floodplain and back-barrier environments through washover deposition is the vital mechanism that allows barriers to maintain elevation and width relative to sea level over timescales of centuries to millennia (FitzGerald et al., 2008). Although essential to coastal barrier evolution (and, by extension, to the function of natural barrier ecosystems), overwash becomes a hazard where it interacts with coastal infrastructure and built environments (Rogers et al., 2015; Lazarus and Goldstein, 2019). Overwash morphology is thus at the crux of understanding current – and anticipated future – coastal environments and risk along low-lying open coastlines (Wong et al., 2014).
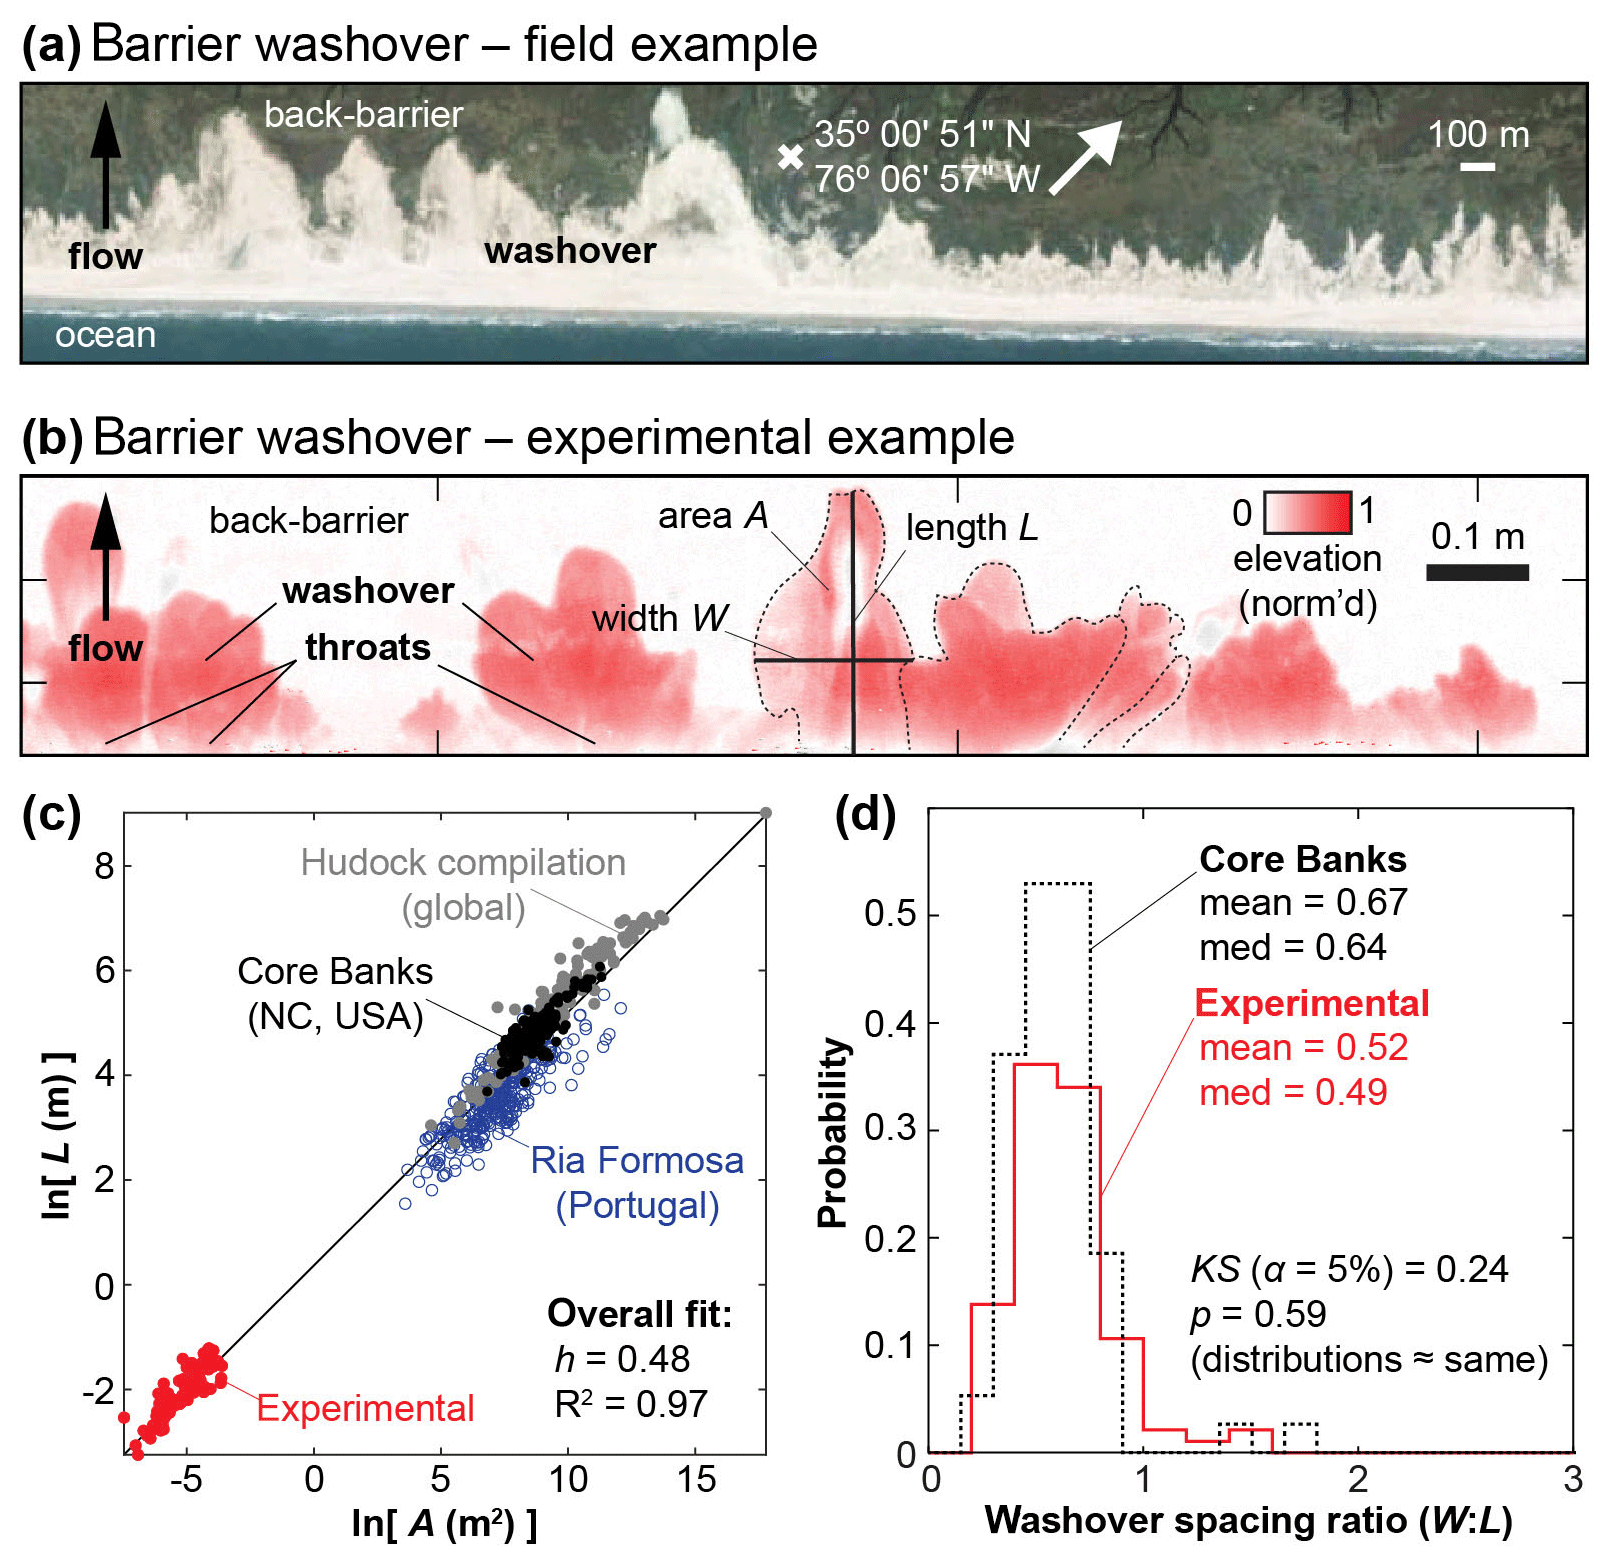
Figure 1This study is motivated by previous work by Lazarus (2016), from which these four panels are adapted, on morphometric relationships in experimental and real coastal overwash morphology. (a) Example of coastal barrier washover morphology on Core Banks (North Carolina, USA; image from 2015, via Google Earth). (b) Details from a topographic laser scan (normalized relative to maximum elevation) of experimental washover morphology, annotated with key morphometric attributes (cross-shore length L, alongshore width W, and area A). (c) Log transform relating length and area in experimental (red) and real washover deposits, including measurements from Core Banks (black dots; Lazarus, 2016), a global sample of washover deposits (grey dots; Hudock, 2013; Hudock et al., 2014), and Ria Formosa, Portugal (blue circles; Matias et al., 2008), examined in this study. Collectively, the datasets demonstrate a power relationship with a scaling exponent h=0.48. (d) Stair plot from Lazarus (2016) comparing the alongshore spacing ratios (W:L) of real (Core Banks) and experimental washover.
From an ensemble of experimental trials that each simulated a single storm event, we measured dynamic allometry in the population of washover features that formed across a generic, spatially extended experimental domain. We also investigated allometry in a sample of individual washover features that we tracked through time as they developed. Furthermore, to begin exploring signatures of dynamic allometry over significantly longer timescales in a real setting, we examined repeated measurements of overwash morphology along the Ria Formosa barrier system, in southern Portugal, from aerial images spanning 5 decades (Matias et al., 2008). We find a motivating correspondence between the experimental and real cases, and our results complement explorations of dynamic allometry in cognate geomorphic systems (Perron and Fagherazzi, 2012). Given that leading process-based models of coastal morphodynamics have embedded in their architectures a host of semi-empirical parameters (Simmons et al., 2019), scaling relationships derived from static and dynamic allometry for overwash morphology may first serve as tests of model predictions en route to integration into predictive models themselves.
2.1 Physical experiment
Experimental data come from orthorectified overhead images of a physical model of a coastal barrier that produced spatial sets of washover deposits formed by overwash flow. The original experiment is detailed in Lazarus (2016). The essential design consideration was geometric: a low barrier (a small difference in relative height between the barrier top and back-barrier platform) with an extended aspect ratio in the alongshore dimension. The experiment was conducted in a sediment tank (500 cm×300 cm×60 cm) at St. Anthony Falls Laboratory (National Center for Earth-surface Dynamics, Minnesota, USA). Using well-sorted coarse river sand (D50∼0.59 mm), a topographically smooth low rectangular barrier with an extended aspect ratio (90 cm×300 cm×2 cm) was constructed across the tank, creating an “ocean” reservoir on one side and a level back-barrier plane on the other.
To run a trial, the water level in the reservoir was raised with a constant infill rate. When the reservoir water level exceeded the barrier height, flow travelled in a continuous front across the barrier top and down onto the back-barrier plane, incising overwash throats and depositing washover lobes along the back-barrier edge. The only hydrodynamic forcing came from the water height relative to the barrier, making the experiment broadly representative of an “inundation regime” in the hierarchy of extreme storm impacts (Sallenger Jr., 2000). Over tens of minutes, competition for available flow meant that overwash morphology developed at different rates along the barrier. Each trial ran until the barrier reached an effective steady state, when little or no sediment movement was evident.
Flow drained at the far boundary of the back-barrier plain. Overwash flow over the barrier was observed to be subcritical, at a flow depth cm but was locally supercritical within the throats; in the field and in large-scale experiments, cross-shore overwash flow tends to be supercritical (Matias et al., 2010, 2016). Despite subtle indications of percolation through the back-barrier face, throats only formed in response to overwash flow, not from back-barrier slope failure or groundwater sapping. Each of the trials reported here used the same barrier height (2 cm) and infill rate (∼0.3 L s−1). Washover size could be increased by increasing the barrier height. A height of 2 cm was chosen because that elevation generated approximately 5 times more overwash features alongshore than a barrier with height 4 cm (see Supporting Information for Lazarus, 2016). The infill rate was the maximum possible for the experimental basin and not so powerful that it would simply obliterate the initial barrier (since a catastrophic storm was not the intention of this experimental design). Although grain size was not directly tested as a control on experimental overwash morphology (working subject to time and labour constraints, we used the sand that was already installed in the basin at the time of its availability), we inferred that a larger grain size would likely result in blunter lobes and a finer grain size in more “finger-like” deposits (Homsy, 1987) that are significantly greater in cross-shore length relative to their alongshore width.
From overhead camera imagery, we used digital geospatial software to analyse the washover morphometry, measuring the following: length L, in the cross-shore dimension; width W, in the alongshore dimension; area A; and alongshore spacing between washovers. Previous work by Lazarus (2016) used laser-scanned topography of the final experimental condition. Experimental washover features were approximately 10–20 cm long (L) in the cross-shore dimension (Fig. 1).
2.2 Field examples spanning multiple decades
Measurements of washover morphology from the Ria Formosa barrier system in southern Portugal are described in detail by Matias et al. (2008). The system includes a group of seven sandy barriers that wrap around a pronounced right-angle bend in the coastline (from approximately north-west–south-east to south-west–north-east), capturing two different wave exposures (to the south-west and south-east). Washover length and area were recorded from sets of orthogonal aerial photographs taken between 1952 and 2001 for a total of 369 washover sites. A subset of persistent washover sites were found in up to four images spanning multiple decades. Washover length (cross-shore distance between barrier crest and back-barrier edge) in the Ria Formosa data reached a maximum of 250 m. Barrier morphology varies substantively within the Ria Formosa system, ranging by an order of magnitude in island width (in some cases along the same island), with differing patterns and extents of dune fields, urban footprint, and proximities to mesotidal inlets. Here we examine the Ria Formosa not because of any direct correspondence to the barrier design in the physical experiments but because the system offers a closely examined source of repeated measurements of persistent washover footprints along its ∼60 km spatial extent. Note that Fig. 1, adapted from Lazarus (2016), shows washover measurements from Core Banks, North Carolina (USA), and a globally distributed dataset from Hudock (2013) and Hudock et al. (2014). Both datasets represent snapshots of population allometry and help motivate this work, but we do not reanalyse them here.
Previous comparative analysis of field and experimental observations of overwash morphology demonstrated a similarity in morphometric scaling (Lazarus, 2016) but only looked at “final” landform configurations (Fig. 1). Here, we present new analyses that examine the evolution of overwash morphology. We aggregated measurements from an ensemble of experimental trials and series of aerial images.
3.1 Population allometry
We confirm at the outset that no single trial or imagery year determines the ensemble scaling relationships that we calculate (Fig. 2a and b), nor do other contextual variables, such as barrier segment or orientation, appear to affect the collective scaling in the field measurements (Fig. S1 in the Supplement). The experimental ensemble scaling relationship between L and A shown in Fig. 2a and b, generated from overhead imagery, yields a smaller scaling exponent h than the equivalent relationship reported by Lazarus (2016), generated from three-dimensional topographic laser scans (Table 1). However, the 95 % confidence intervals around the respective scaling exponents show a reasonable agreement between the different experimental measurements (from overhead imagery versus laser topography), and imagery-based measurements from the experiment and Ria Formosa show closely corresponding scaling exponents (Fig. 2; Table 1).
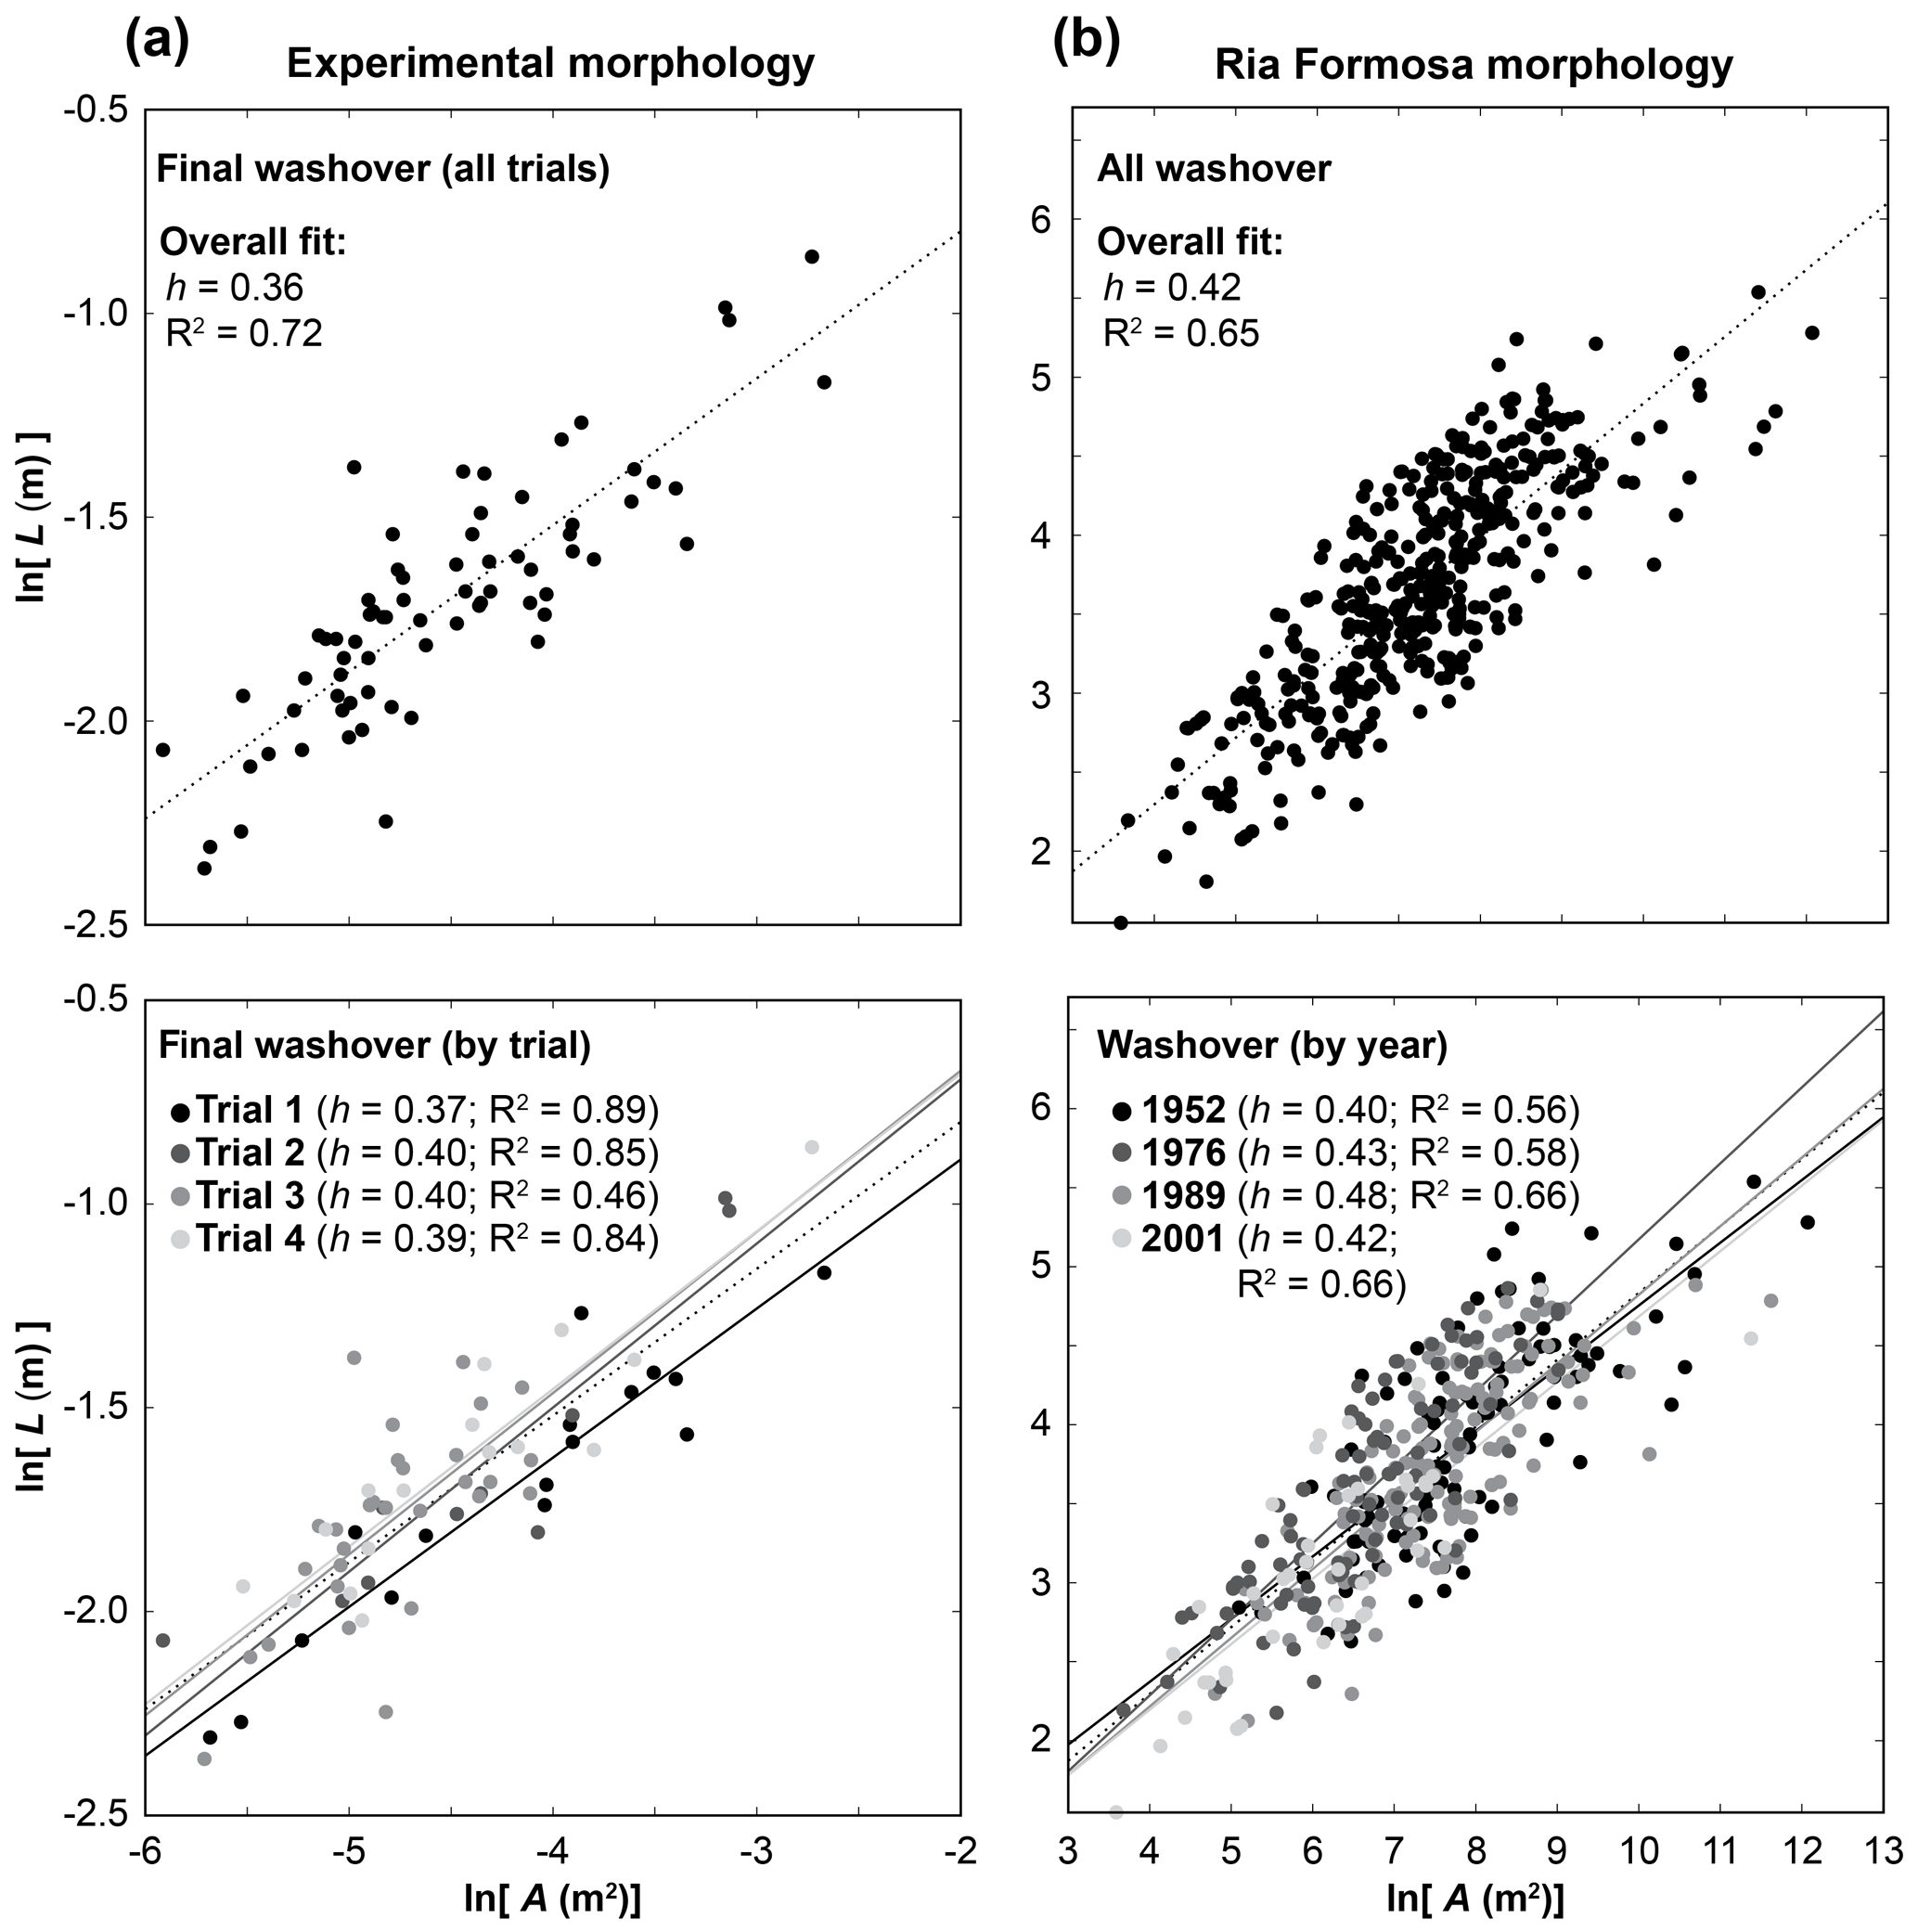
Figure 2Log-transform comparison of length-to-area relationships in (a) final steady-state experimental washover morphology, measured from overhead imagery of the experimental tank and (b) washovers along the Rio Formosa barriers of southern Portugal, measured from four sets of aerial images (taken in 1952, 1976, 1989, and 2001), detailed in Matias et al. (2008). Upper plots in (a) and (b) show all the data points, fitted with a power relationship. Lower plots in (a) and (b) differentiate the data according to experimental trial in (a) and image year in (b), each fitted with its own power relationship (along with the ensemble fits from the upper plots), demonstrating that no single trial or image year dominates the overall pattern of the data – nor does any single barrier or barrier aspect in the Ria Formosa data (see Fig. S1). Note that the negative values for the experimental washover shown in (a) are the result of the log transformation. Experimental and Ria Formosa data are shown in the same plot in Fig. 1c.
Table 1Scaling exponents and distribution statistics.
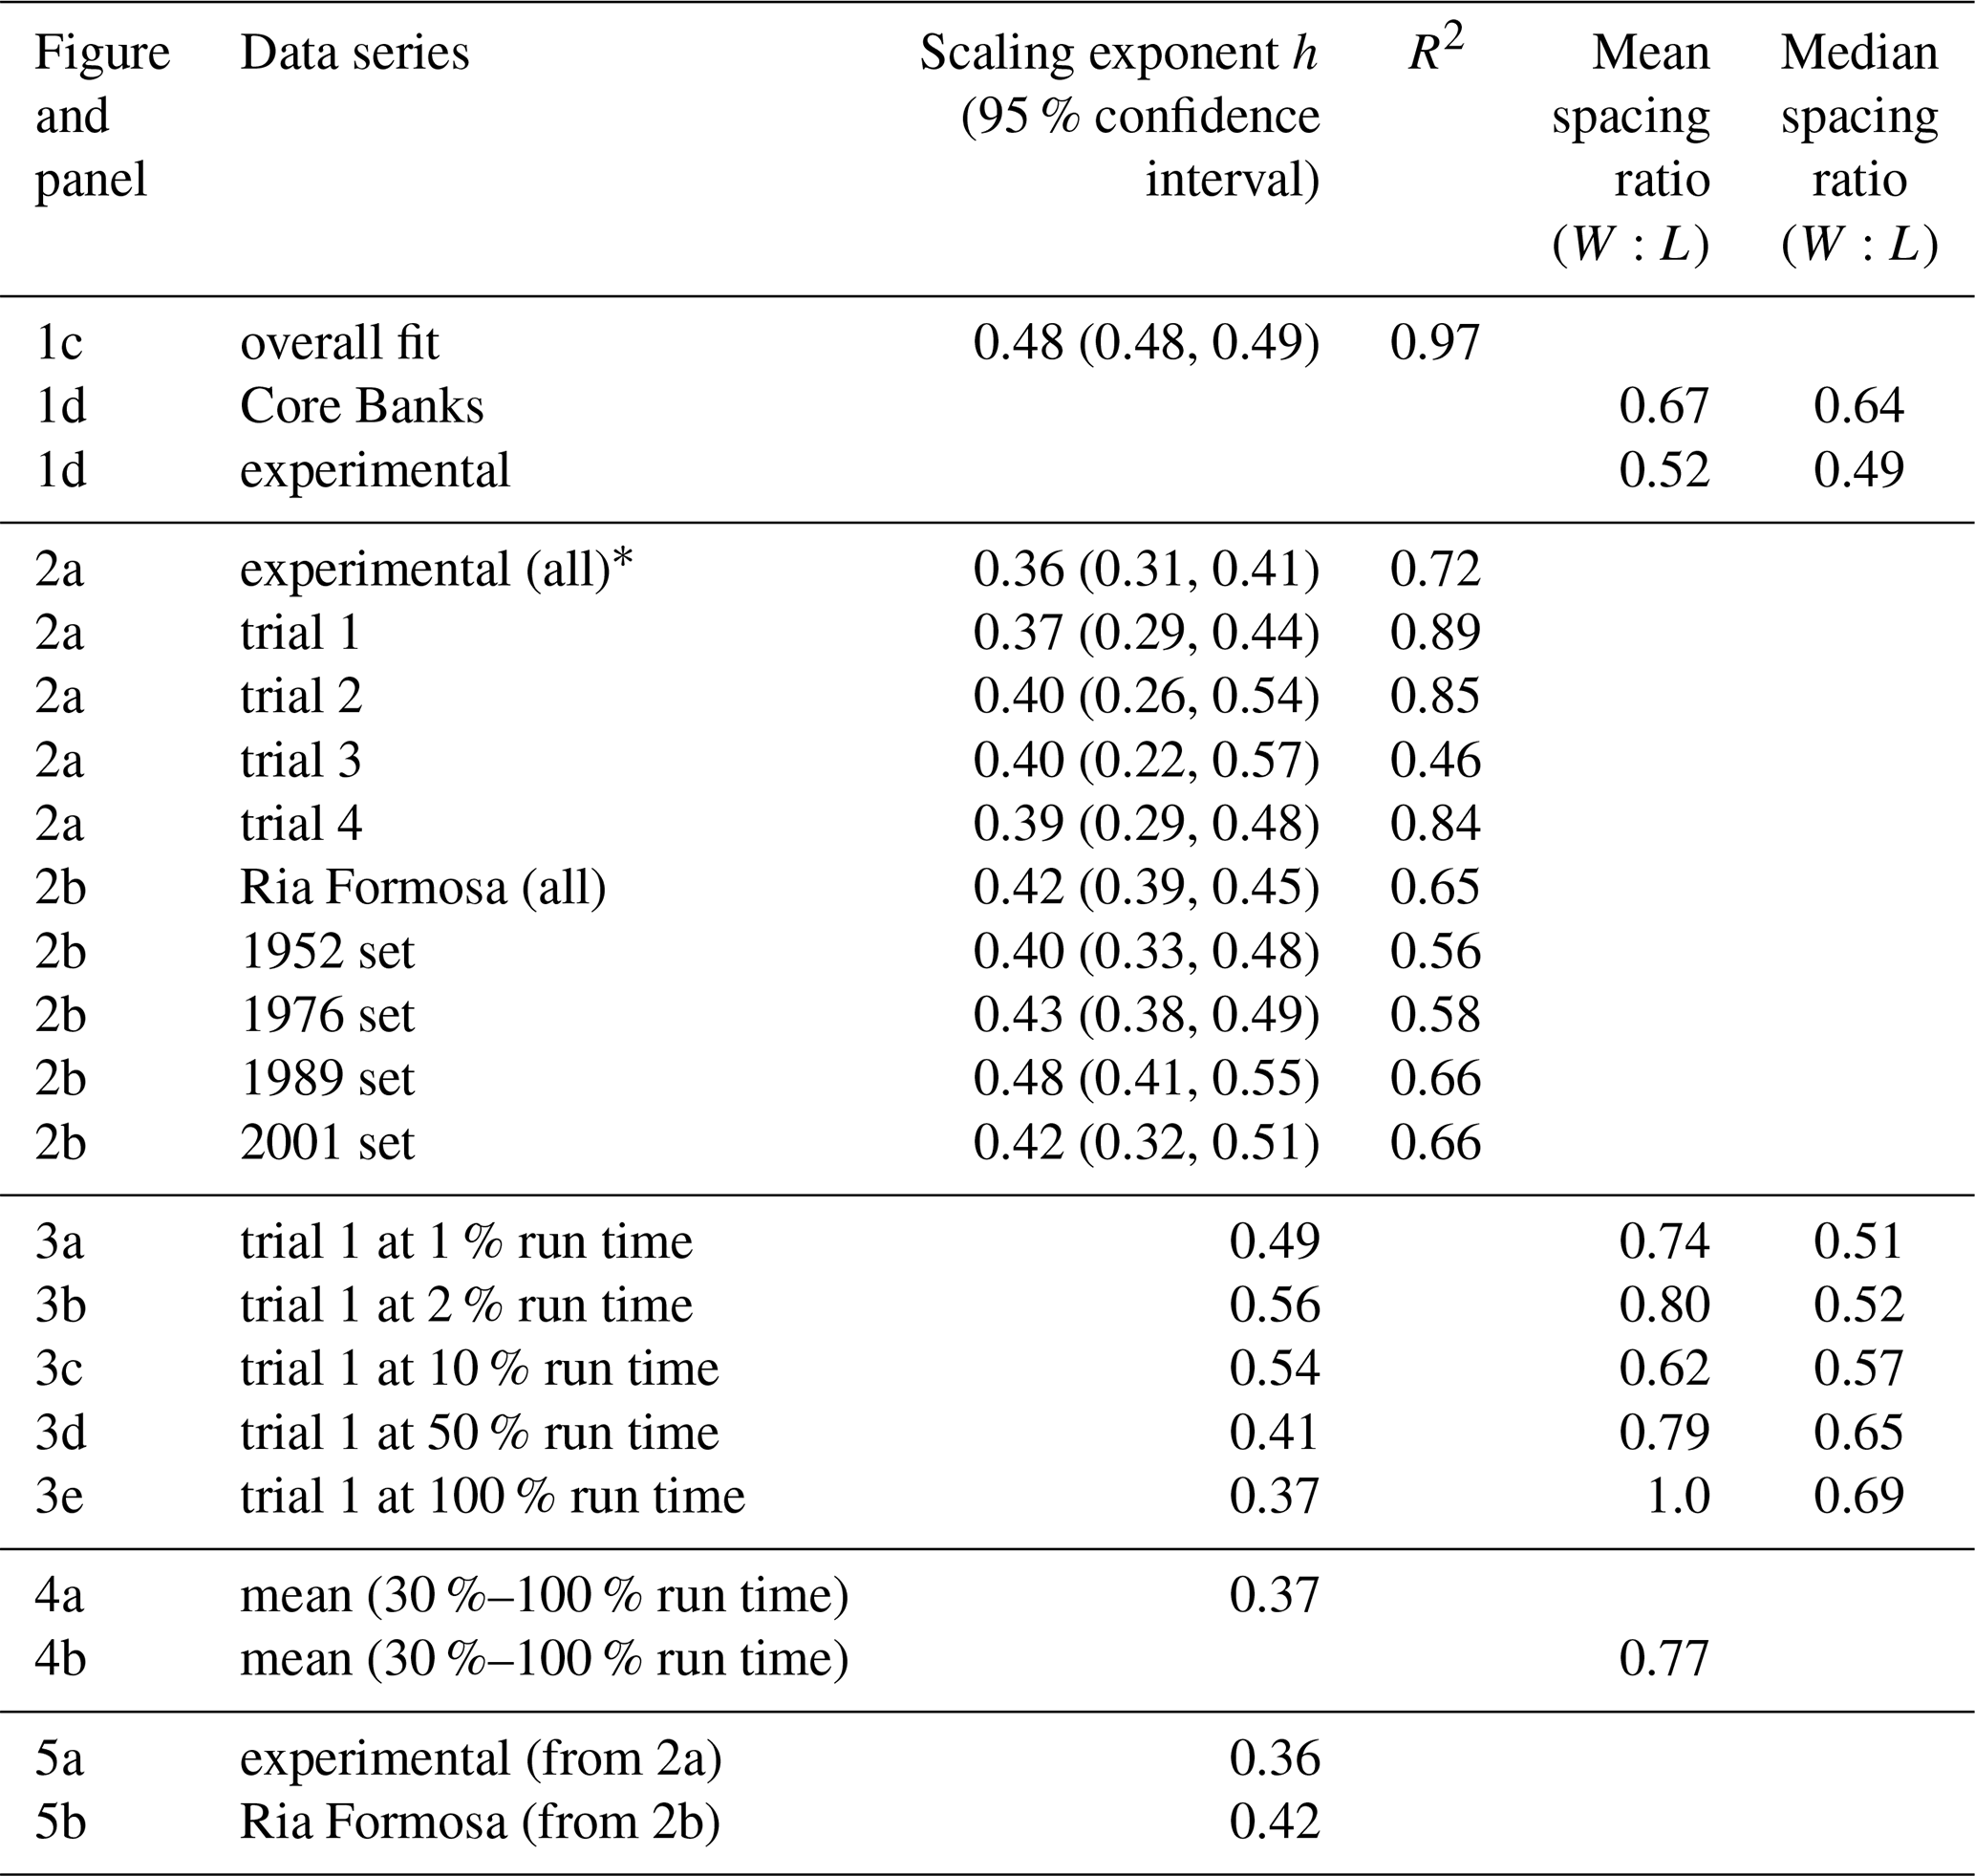
* Note: Lazarus (2016) reported an ensemble fit (for final morphology, based on topographic laser scans) of h=0.48 (0.43, 0.53); R2=0.77.
A sequence of images from an experimental trial illustrates how the scaling exponent relating washover length to area, for a population of related washovers, changes over time during a single forcing event, also capturing the emergence of a dominant width-to-length aspect (or spacing) ratio between washovers alongshore (Fig. 3). Aspect ratio – defined as alongshore width relative to cross-shore length, or W:L – can be calculated for any individual washover. When washovers are arrayed alongshore, such that neighbouring features share an edge, the aspect ratio reflects a normalized measure of spacing between adjacent deposits (Fig. 1). The same principle holds for contiguous drainage basins arrayed along quasi-linear mountain fronts (Hovius, 1996; Talling et al., 1997; and Perron et al., 2009). Here, experimental washovers were initially long and narrow, yielding a high length-to-area scaling exponent (a steeply sloping fit in log–log space) and a low width-to-length aspect ratio. As a trial progressed, washovers rapidly widened – and in many cases merged – growing in area relative to length, causing the length-to-area scaling exponent to decrease and the aspect ratio to increase.

Figure 3A demonstration of dynamic allometry in an experimental trial of overwash morphodynamics. Time is expressed as a percentage of the total run time; 100 % run time reflects the final steady-state morphology. Overhead images of the experimental tank (left column) show, in snapshots, the washover morphology evolving as the trial progresses (a–e). Log transform plots of washover length relative to area (middle column) show how the scaling exponent h changes through time. Data points and the fitted power relationship for a given image are plotted in black; data from previous snapshots are retained in grey. Stair plots (right column) track the related development of a preferred spacing ratio (calculated as W:L), where the distribution at each snapshot is shown in black, and distributions from previous snapshots are retained in grey. Summary statistics are provided in Table 1.
Measuring the length-to-area scaling exponent and aspect ratio from sequential images in each experimental trial yields the evolution of these scaling metrics as a function of per cent trial run time (Fig. 4). The populations in each trial converge on dominant scaling relationships. Because these scaling relationships are quantitative signatures of a predominant morphological expression and preferred spatial arrangement, documenting their spatio-temporal development is a step toward connecting pattern to process. Hypothetically, the final scaling relationships could have been the consequence of each washover conforming to singular dimensional constraints from the outset, resulting in a constant scaling relationship through time. Instead, we find convergence toward a dominant pattern signature, indicative of spatial self-organization (Lazarus and Armstrong, 2015). If washovers are initially too far apart, they widen, and some new deposits fill in between them, until the alongshore pattern reaches a closer spacing configuration. Conversely, if washovers are initially too close, they merge, effectively adjusting their centroids to be farther apart. The spacing ratio converges on a quasi-equilibrium configuration (Fig. 4b) more quickly than the length-to-area relationship does, perhaps because the mean spacing ratio is a more stable metric than the scaling exponent, which is comparatively more sensitive to the influence of larger washover deposits as they grow. That is, a large washover deposit is less likely to markedly shift the centre of a univariate distribution of spacing ratios than it is to affect a best-fit power relationship between length and area.
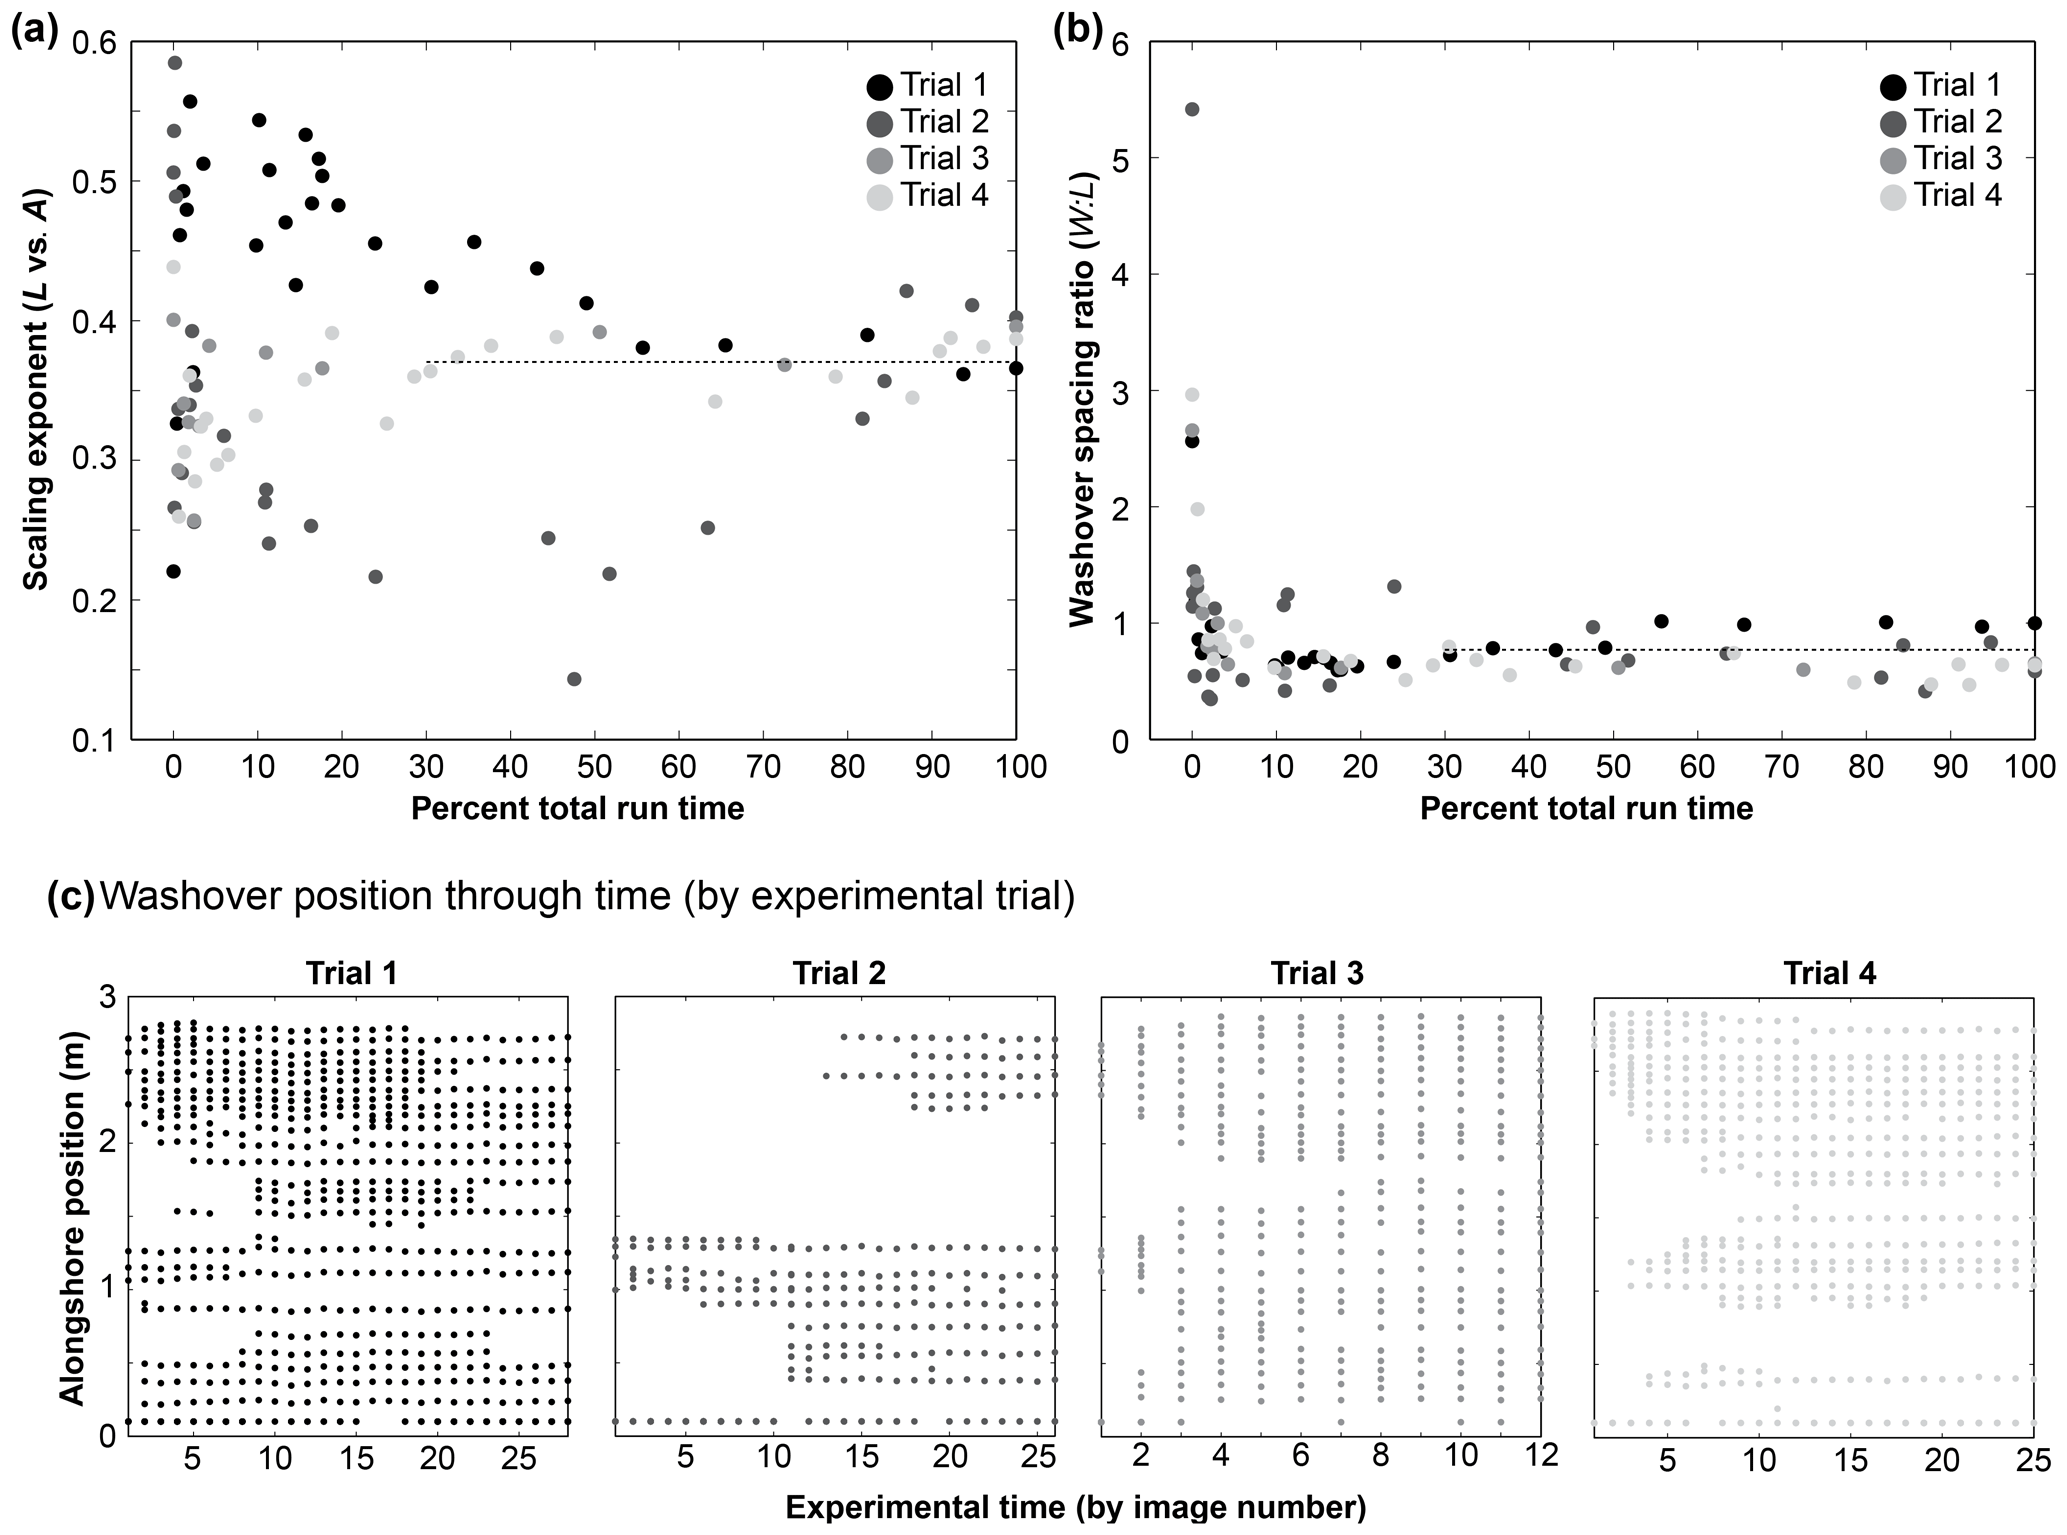
Figure 4Evolution of a (a) mean scaling exponent h and (b) preferred spacing ratio (W:L) compiled from four experimental trials of overwash morphodynamics (detailed in Fig. 3). Dotted lines in (a) and (b) show respective ensemble means calculated between 20 % and 100 % run time. Panels in (c) show progressive washover position in each of the four experimental trials. To emphasize how washover positions shift laterally before finding a morphological steady state – the preferred spacing shown in (b) – the bottom axis reflects image sequence rather than absolute time. In (a), as in Fig. 2a, these experimental data converge on a scaling exponent smaller than the global fit (h=0.48) in Fig. 1c, which spans several orders of magnitude.
Also evident in the experimental results are irregular, persistent gaps between washover sites (Fig. 4c), which are likely a consequence of overwash flow competition and partitioning. The infill rate was never varied, meaning the hydrodynamic forcing was held constant throughout each trial. Moreover, the surface of the upstream, ocean-side reservoir was never perturbed (agitated with a wave paddle, for example). This means that once enough overwash breaches had formed to accommodate and distribute the forcing flow across the barrier, new breaches were either unlikely to develop or would only develop as a consequence of subtle local interactions between adjacent overwash throats. For example, if flow through a throat slowed down, sediment caught in the throat could form a temporary plug. That plug appeared to drive a backwater effect that elevated the upstream water surface just enough to force the overwash flow toward a new path of steepest descent – typically down through a neighbouring throat but sometimes over an otherwise undissected reach of the barrier. These plug-and-backwater dynamics were observed but not measured directly. Over many tens of minutes, the overwash morphology adjusted to flow conditions and the elevation difference between the barrier top and back-barrier plane; sets of neighbouring throats might plug and unplug several times, with corresponding periods of dormancy or growth in their associated washover deposits. Given that they were subject to the same forcing conditions, all breaches in the barrier should have tended to adjust toward the same open-channel geometry. However, because throats had to share (compete for) available overwash flow, closely spaced sets of throats grew more slowly than an isolated throat with no nearby neighbours. In a natural case, flow-limited conditions may mean that for a series of overwash throats, no single throat may ever capture enough flow to reach its equilibrium open-channel configuration. Storm-driven water levels in the field (Shaw et al., 2015; Engelstad et al., 2018; and Wesselman et al., 2019) may rise and fall much faster than the timescales required for overwash morphology to reach a geometric equilibrium.
3.2 Dynamic allometry of individual washovers
The experiments reflect morphometric development in individual washovers during a single forcing event (Fig. 5a). The dynamic allometry of individual washovers shows that their growth trajectories are variable. In general, the washovers all grow over time, moving up the trend of the length-to-area scaling relationship if not necessarily conforming to its slope. Such variability evident at the individual level – likely an indirect reflection of morphodynamic changes occurring simultaneously to neighbouring washovers alongshore (Fig. 4) – suggests that collective convergence to a predominant scaling relationship is an emergent behaviour of the larger barrier system.
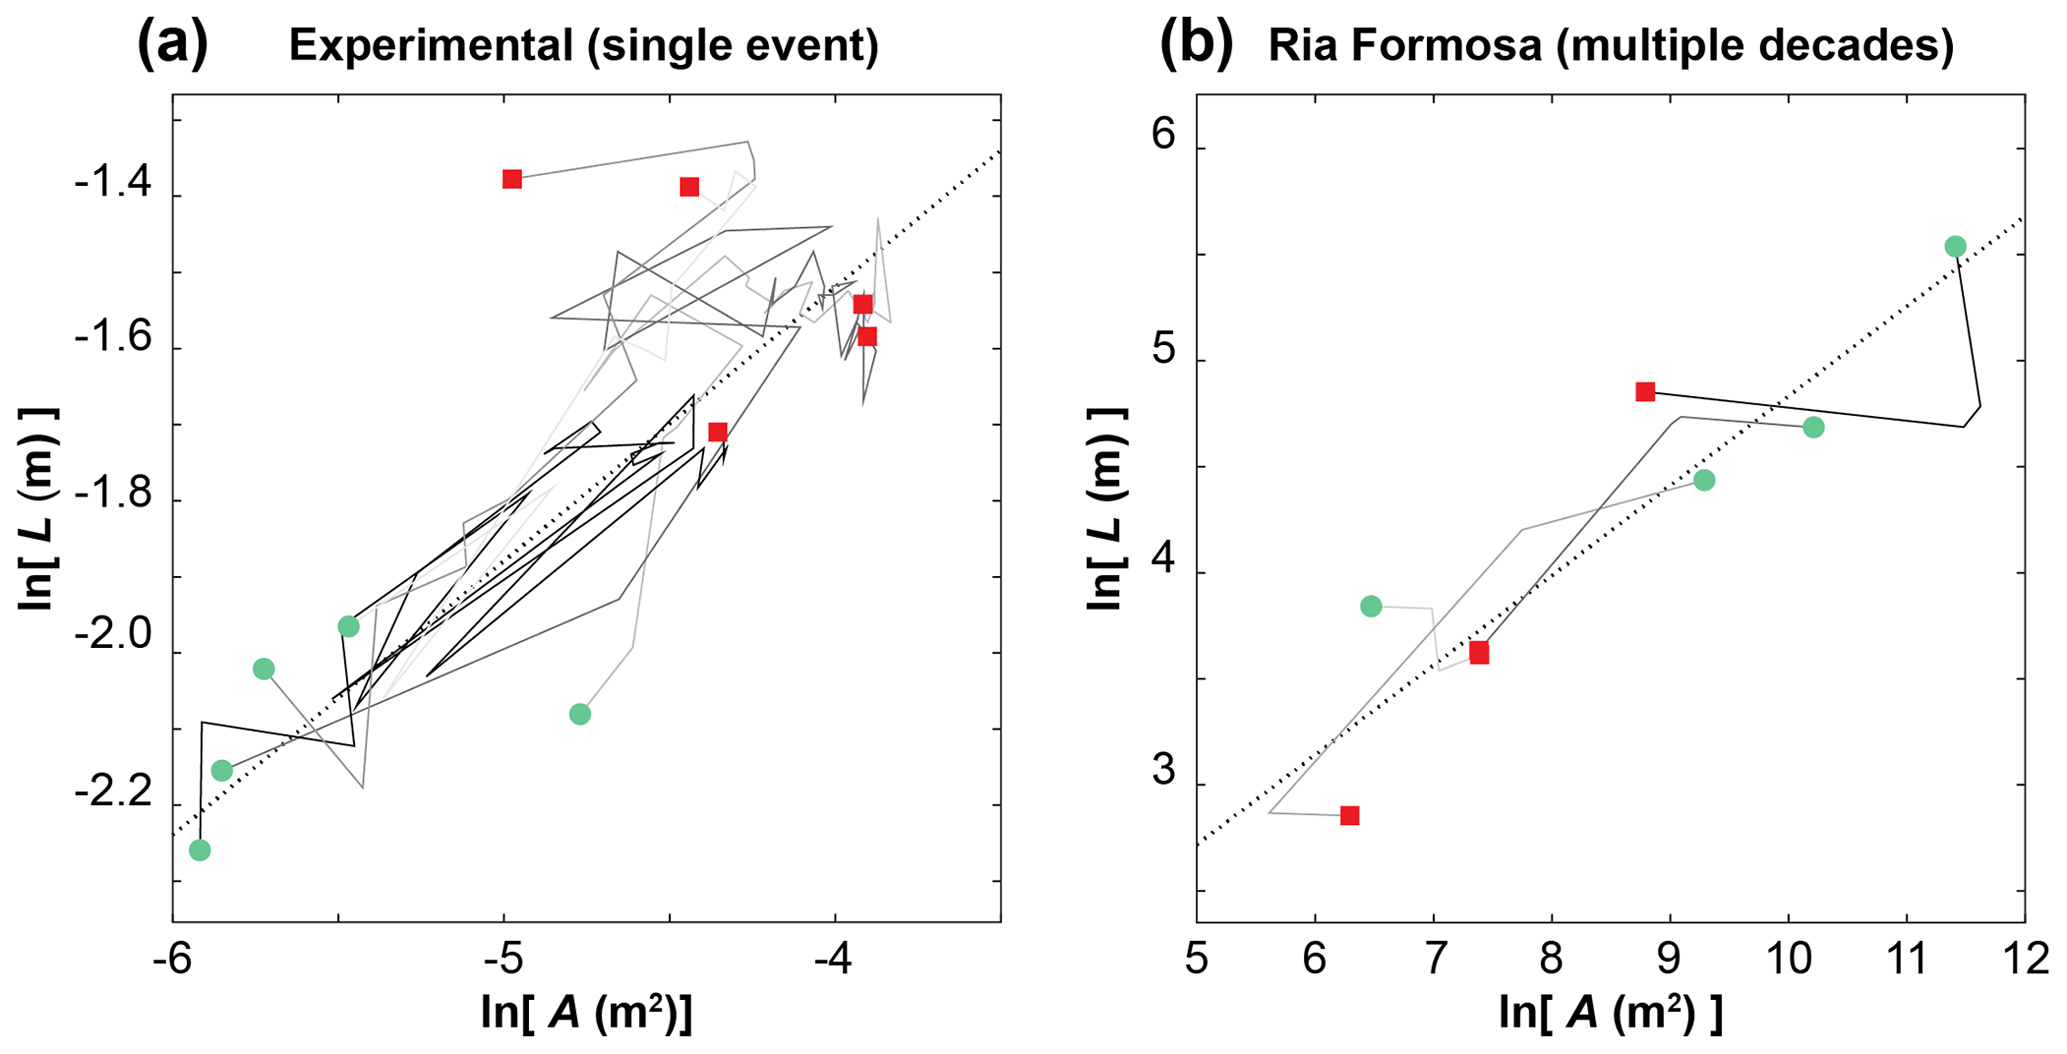
Figure 5Dynamic allometry in a sample of individual washovers (a) tracked during the physical experimental trials, representing a single forcing event (n=5) and (b) identified in the four decades of aerial photographs from Ria Formosa (n=4). Circles and squares indicate first and last measurements in the sequence, respectively. Individual trajectories are differentiated by shade (greyscale). Fits are ensemble means from Fig. 3 and listed in Table 1.
In contrast to the single forcing event of the experiments, measurements of individual washovers at Ria Formosa (Fig. 5b) reflect morphometric changes sustained over multiple decades from many forcing events and long periods of quiescence (Matias et al., 2008). Over time, the washovers shift both up and down along the length-to-area scaling relationship, suggesting that once established, a preferred spatial configuration may exert significant control on subsequent morphological change. Shifting up along the scaling relationship during a decadal interval – indicating washover growth – suggests overwash site reactivation (Hosier and Cleary, 1977). The same washover might intermittently increase its footprint with successive storm strikes, even if its total volume might decrease through aeolian deflation (Leatherman and Zaremba, 1987). Reactivation events may also be partial or incomplete, relative to the maximum footprint at a given site.
Perhaps a more surprising result is where washovers shift down the scaling relationship, to a smaller but still dimensionally consistent size. Such dimensional adjustment could stem from depth-dependent zonation in barrier vegetation. Matias et al. (2008) discuss the potential influence of barrier vegetation on Ria Formosa overwash morphology but do not measure it directly. Storm deposits can drive spatial heterogeneity in vegetation growth rates; vegetation buried too deeply by a storm deposit will die, but for some dune and marsh plant species, shallow to moderate burial can stimulate growth (Maun and Perumal, 1999; Gilbert and Ripley, 2010; and Walters and Kirwan, 2016). Differential plant response to burial can thus determine spatio-temporal patterns in barrier vegetation cover, as the perimeter of a washover deposit may foster an envelope of new plant growth. Those spatio-temporal vegetation patterns in turn facilitate or inhibit pathways of sediment transport across the barrier (Goldstein et al., 2017). If dynamic allometry informs how washover morphology takes shape, then its growth pattern may also work in reverse, informing zonal patterns of depth-dependent vegetation cover that effectively reduce the dimensions of a washover footprint. Furthermore, gradual processes of vegetation recovery and aeolian sand deposition within the washover can progress in irregular ways that are related to natural topographic heterogeneity in barrier and dune morphology, forcing the washover to inherit morphometric characteristics dynamically unrelated to overwash and inundation processes. Scaling controls likely manifest in conjunction with, not in place of, other allogenic factors that affect overwash morphology over multi-decadal timescales, such as relative sea-level rise, changes in shoreline position and sediment supply, and heterogeneity in shoreface lithology (Morton and Sallenger Jr., 2003; Matias et al., 2008). Preferred geometric relationships in overwash morphology may both set a template for faster-forming smaller-scale barrier features and be forced to conform to contextual controls exerted by barrier-scale geography (Werner, 2003; Coco and Murray, 2007).
3.3 Allometric growth
We also looked for evidence of allometric growth in the time series for the five individual washovers tracked in the experiment (Fig. 5a), comparing changes in length to the corresponding changes in area. Echoing Mosley and Parker (1972), who found no clear indication of allometric growth in the evolution of an experimental river network, we find no clear indication of allometric growth in washover (Fig. S2). Again, perhaps the apparent absence of any scaling in the rates of change is because these washovers did not grow in spatial isolation and were instead responding to changes occurring at neighbouring washover sites alongshore.
4.1 Extension to related geomorphic systems
The convergence to a quasi-equilibrium alongshore spacing that we observe in the experimental overwash morphology (Figs. 3 and 4) is an empirical complement to numerical experiments demonstrating the emergence of regular spacing in ridge-and-valley topography (Fig. 7 in Perron and Fagherazzi, 2012). The physical basis for the regular spacing that emerges in the barrier experiment may be closely related to its upland analogue (Lazarus, 2016). In ridge-and-valley topography, a preferred wavelength arises from spatial competition among incipient drainages for drainage area (Perron et al., 2008, 2009). Valleys with greater area have greater flow capture, enabling them to deepen and propagate headward as slightly larger drainages gain a competitive advantage over slightly smaller neighbours. Neighbouring large valleys expand simultaneously, but the drainage area of the divide between them diminishes, ultimately inhibiting further valley growth. Subtle differences in topographic gradients from one valley to the next then determine minor intermittent changes in drainage area.
Perron et al. (2008, 2009) do not mirror this explanation onto depositional patterns; all material exported from their numerical valleys disappears from the model domain. Still, a kind of reversal of the advection–diffusion mechanism that they describe for ridge-and-valley terrain is plausible for its depositional counterpart. Our analysis only addresses the depositional washover patterns, but Lazarus (2016) documented the full domain of the experimental topography, including the spatial array of source drainages (overwash throats) along the barrier. In the experiments, sediment was initially advected to the back-barrier, especially by the first pulse of inundation over the barrier top, tending to create washovers that were long and narrow (Fig. 3). The washovers then grew laterally and gradually, as flow was forced to spread over them, diffusing fresh sediment to their margins.
Voller et al. (2012) offer a theoretical analytical explanation for such a reversal in the flow of geomorphic “information” across erosional–depositional transitions, where information moves downstream in erosional settings and upstream in depositional ones. Their construct is one-dimensional but sets up a two-dimensional thought experiment. In a spatially extended erosional domain, if competition for drainage area is the underlying driver of information downstream, then in a spatially extended depositional domain, competition for accommodation space could be the underlying driver of information upstream. As deposits grow, merge, and avulse into newly available accommodation space, which gets more limited as deposition increases, they transmit that information upstream in the form of channel profiles and backwater gradients. That information, in turn, is registered at the base of the sourcing valley, triggering either a reduction or increase in erosional export.
In real barrier overwash conditions there is no upstream drainage-valley source – but there is a zone of onshore hydrodynamic forcing that, hypothetically, could feel a backwater effect or similar change in water surface gradients along the barrier front that triggers interactions among neighbouring overwash sites (Lazarus and Armstrong, 2015). The concept and construction of the experimental barrier examined here may have much in common with a study of rill formation by Izumi and Parker (1995), who show analytically why a free water surface over an erodible plane will develop backwater effects and Reynolds stresses that inhibit runaway incision of “infinitely narrow, infinitely deep” channels (Perron et al., 2008). The formation of a barrier inlet might be a case in which a positive feedback allows a single cross-shore transport pathway to effectively capture all available forcing flow over a large spatial area. However, at a larger spatial scale, dynamical interactions among groups of inlets suggest the influence of spatial competition on the prism of water created by onshore forcing (Roos et al., 2013).
The dynamic allometry of individual washovers that we recorded (Fig. 5a) bears on an even broader geomorphological question regarding landscape convergence toward an equilibrium state – and, in particular, how such convergence is physically expressed (Bull, 1975; Perron and Fagherazzi, 2012). Describing a numerical modelling example of self-organized valley spacing, Perron and Fagherazzi (2012) remarked that “different landscape features can have very different response times, and that some can be out of equilibrium even while others appear to be close to a steady state”. Bull (1962, 1975, 1977) pursued similar observations for alluvial deposition at the outlet of drainage valleys, and we suggest that the same concept applies to our model system of coastal overwash morphology; we see the population of washovers describing allometric relationships (Figs. 3 and 4), and we see individual washovers reflecting that collective allometry to varying extents.
4.2 A consequence of process, not a direct measure
Geomorphic scaling laws are typically constructed from well-developed steady-state topography or a broad sample of isolated landforms. Opportunities to record stages of dynamic allometry in a landscape, from initial to final morphology, are rare – not only for individual landforms but also for a collective population of spatially related landforms. As Church and Mark (1980) advised:
The most appealing avenue for resolution of the problem, in general, appears to lie in recourse to physical models. Empirical proportional relations take on a crucial role in this strategy, for they will tell us whether or not scale distortion (allometry) occurs between various combinations of the extensive properties of the prototype and model.
Here, we use results from an experimental coastal barrier to demonstrate not only the emergence of collective allometric scaling relationships from spatially related washovers but also the dynamic allometry in individual washovers as they take shape.
Scaling laws are a consequence, not a direct measure, of the physical process. The geomorphology literature includes plenty of remonstrations against the “blind” use of empirical scaling relationships as a kind of codex. In an essay written late in his career, geomorphologist J. Hoover Mackin (1963) remarked that
equations read from the graphs or arrived at by other mechanical manipulations of the data are presented as terminal scientific conclusions. I suggest that the equations may be terminal engineering conclusions, but, from the point of view of science, they are statements of problems, not conclusions. A statement of a problem may be very valuable, but if it is mistaken for a conclusion, it is worse than useless because it implies that the study is finished when in fact it is only begun.
Making a related argument that an allometric relationship is more interesting for what it frames than what it is unto itself, Bull (1977) offered: “Allometric change is not the mere presentation of regression analyses. It is a conceptual framework for the analysis of landforms that may allow one to better understand the static and dynamic interrelations between variables that tend, or do not tend, toward equilibrium.”
A strict conclusion to draw from the abstraction between the geomorphic scaling laws we can observe and the transport laws they imply is that scaling laws are “of scientific interest only if they can provide insight into the underlying mechanisms” (Church and Mark, 1980). Inasmuch as scaling laws for geomorphic features (as opposed to forces) are a manifestation of “geopatterns” – intrinsic spatial patterns that arise in landscapes – such insight into underlying mechanisms speaks to some of the stated grand challenges of Earth-surface processes (NRC, 2010), which include the following: (1) “How do geopatterns on Earth's surface arise, and what do they tell us about process?” (2) “How do local interactions give rise to extensive, organized landscape patterns?” (3) “What does spatial organization tell us about underlying processes?” And beyond those questions, what are the transport laws that govern the evolution of Earth's surface?
Morphometric scaling laws may be more useful for approaching these grand challenges than they seem – and nowhere more directly than in geomorphic experiments. Noting “the observed consistency between experimental and field systems despite large differences in governing dimensionless numbers”, Paola et al. (2009) discuss the underappreciated power of “external similarity”, in which “a small copy of a system is similar to the larger system” – even if the internal physical forces that shape the former are irreconcilably different from those that shape the latter. Paola et al. (2009) argue, as have others since (Kleinhans et al., 2014; Baynes et al., 2018), that experiments that do not conform to the rules of dynamical scaling are in fact the only way to find and test the boundaries of scale dependence and independence. A small modelled system that looks and acts like its larger real system might not be governed by the same transport laws, but it will convey vital information about other scaling relationships that do and do not break (Van Dijk et al., 2012; Kleinhans et al., 2015; Sweeney et al., 2015; Bufe et al., 2016; Lai et al., 2016; and Lazarus, 2016). This advantage is philosophically related to Bull's (1977) interest in using scaling laws to reveal “variables that tend, or do not tend, toward equilibrium”.
In coastal settings, especially, novel methods for measuring hydrodynamics and sediment transport under storm conditions are bringing field, experimental, and numerical studies into ever better alignment (Leatherman, 1976; Leatherman and Zaremba, 1987; Matias et al., 2010; Sherwood et al., 2014; Engelstad et al., 2018; Splinter et al., 2018; Phillips et al., 2019; Simmons et al., 2019; Vos et al., 2019; Wiggins et al., 2019; Dodet et al., 2019; and Wesselman et al., 2019). Within the frame of geomorphology's grand challenges, such advances make dynamic coastlines “process `hot spots' – areas where a high level of activity concentrated in a small location can be identified from relatively simple morphologic measures”, especially when “topographically based estimates … provide field scientists with a set of reference values for key local variables that serve as a starting template for observation” (NRC, 2010). Morphometric scaling relationships can be used to test numerical morphodynamic models (Lesser et al., 2004; Roelvink et al., 2009) to either confirm modelled outputs or identify areas for improvement. Our work thus reiterates the utility of morphometric allometry as a window into dynamical behaviour, especially for geomorphic phenomena – such as those formed during extreme forcing events – that still confound direct observation.
The data for experimental and real washover morphology presented in this work are freely available via Figshare (experimental and Core Banks data: https://doi.org/10.6084/m9.figshare.10259846, Lazarus et al., 2019; Ria Formosa data: https://doi.org/10.6084/m9.figshare.10281902.v1, Matias and Lazarus, 2020). The global compilation of washover data plotted in Fig. 1 (“Hudock compilation”) is available in an Appendix of the master's thesis by Hudock (2013) and described in Hudock et al. (2014).
The supplement related to this article is available online at: https://doi.org/10.5194/esurf-8-37-2020-supplement.
EDL conceived the idea, performed the experiment, and conducted the analysis. KD measured morphometry in the experiment imagery and contributed to the analysis. AM provided the Ria Formosa dataset and contributed to data interpretation. EDL drafted the paper, with contributions from AM and KD.
The authors declare that they have no conflict of interest.
Eli D. Lazarus thanks Chris Paola for his invitation to conduct the original experiment at St. Anthony Falls Laboratory (SAFL) through the National Center for Earth-surface Dynamics Program (NCED2). Eli D. Lazarus also thanks the following people: Chris Ellis, Jim Tucker, Aaron Bufe, Colin Phillips, Ajay Limaye, and SAFL's student work crew for advice and assistance during the experimental trials; Evan Goldstein, Vaughan Voller, Alex Densmore, Sebastian Castelltort, Dylan McNamara, Scott Armstrong, Alida Payson, and Taylor Perron for helpful discussions; and Stuart McLelland for an invitation to the 4th Hydalab+ Workshop Event, “Advanced Workshop on Scaling Morphodynamics in Time” (January, 2018; Grenoble, France). This work was supported by the NCED2 Visitor Program (via NSF grant EAR-1246761), a research grant from the British Society for Geomorphology, the NERC BLUEcoast project (NE/N015665/2), the EPSRC Vacation Bursary scheme (via the University of Southampton), and the Leverhulme Trust (RPG-2018-282). The experimental concept began on a chalkboard at the 2011 NCED Summer Institute for Earth-surface Dynamics (via NSF grant EAR-0120914). Ana Matias acknowledges the EVREST project (PTDC/MAR-EST/1031/2014), funded by the Portuguese national funding agency for science, research, and technology, FCT (Fundação para a Ciência e a Tecnologia).
This research has been supported by the Natural Environment Research Council (grant no. NE/N015665/2) and the Leverhulme Trust (grant no. RPG-2018-282).
This paper was edited by Simon Mudd and reviewed by Katherine Ratliff and two anonymous referees.
Baynes, E. R. C., Van de Lageweg, W. I., McLelland, S. J., Parsons, D. R., Aberle, J., Dijkstra, J., Henry, P. Y., Rice, S. P., Thom, M., and Moulin, F.: Beyond equilibrium: Re-evaluating physical modelling of fluvial systems to represent climate changes, Earth-Sci. Rev., 181, 82–97, https://doi.org/10.1016/j.earscirev.2018.04.007, 2018.
Berry, B. J. L. and Garrison, W. L.: Alternate explanations of urban rank-size relationships, Ann. Assoc. Am. Geogr., 48, 83–91, https://doi.org/10.1111/j.1467-8306.1958.tb01559.x, 1958.
Bufe, A., Paola, C., and Burbank, D. W.: Fluvial bevelling of topography controlled by lateral channel mobility and uplift rate, Nat. Geosci., 9, 706–710, https://doi.org/10.1038/ngeo2773, 2016.
Bull, W. B.: Relations of alluvial-fan size and slope to drainage-basin size and lithology in western Fresno County, California, US Geol. Surv. Prof. Pap. 450-B, US Geological Survey, Washington, D.C., 1962.
Bull, W. B.: Allometric change of landforms, Geol. Soc. Am. Bull., 86, 1489, https://doi.org/10.1130/0016-7606(1975)86<1489:ACOL>2.0.CO;2, 1975.
Bull, W. B.: The alluvial-fan environment, Prog. Phys. Geogr., 1, 222–270, https://doi.org/10.1177/030913337700100202, 1977.
Church, M. and Mark, D. M.: On size and scale in geomorphology, Prog. Phys. Geogr., 4, 342–390, https://doi.org/10.1177/030913338000400302, 1980.
Coco, G. and Murray, A. B.: Patterns in the sand: From forcing templates to self-organization, Geomorphology, 91, 271–290, https://doi.org/10.1016/j.geomorph.2007.04.023, 2007.
Denny, C. S.: Alluvial fans in the Death Valley region, California and Nevada, US Geol. Surv. Prof. Pap. 466, US Geological Survey, Washington, D.C., 1965.
Dodds, P. S. and Rothman, D. H.: Scaling, universality, and geomorphology, Annu. Rev. Earth Planet. Sci., 28, 571–610, https://doi.org/10.1146/annurev.earth.28.1.571, 2000.
Dodet, G., Castelle, B., Masselink, G., Scott, T., Davidson, M., Floc'h, F., Jackson, D., and Suanez, S.: Beach recovery from extreme storm activity during the 2013–14 winter along the Atlantic coast of Europe, Earth Surf. Proc. Land., 44, 393–401, https://doi.org/10.1002/esp.4500, 2019.
Donnelly, C., Kraus, N., and Larson, M.: State of knowledge on measurement and modeling of coastal overwash, J. Coast. Res., 22, 965–991, https://doi.org/10.2112/04-0431.1, 2006.
Donnelly, J. P. and Woodruff, J. D.: Intense hurricane activity over the past 5,000 years controlled by El Niño and the West African monsoon, Nature, 447, 465–468, https://doi.org/10.1038/nature05834, 2007.
Edmonds, D. A., Paola, C., Hoyal, D. C. J. D., and Sheets, B. A.: Quantitative metrics that describe river deltas and their channel networks, J. Geophys. Res.-Earth, 116, F04022, https://doi.org/10.1029/2010JF001955, 2011.
Engelstad, A., Ruessink, B. G., Hoekstra, P., and van der Vegt, M.: Sand suspension and transport during inundation of a Dutch barrier island, J. Geophys. Res.-Earth, 123, 3292–3307, https://doi.org/10.1029/2018JF004736, 2018.
FitzGerald, D. M., Fenster, M. S., Argow, B. A., and Buynevich, I. V.: Coastal impacts due to sea‐level rise, Annu. Rev. Earth Planet. Sci., 36, 601–647, https://doi.org/10.1146/annurev.earth.35.031306.140139, 2008.
Gilbert, M. E. and Ripley, B. S.: Resolving the differences in plant burial responses, Aust. Ecol., 35, 53–59, https://doi.org/10.1111/j.1442-9993.2009.02011.x, 2010.
Goldstein, E. B., Moore, L. J., and Durán Vinent, O.: Lateral vegetation growth rates exert control on coastal foredune hummockiness and coalescing time, Earth Surf. Dynam., 5, 417–427, https://doi.org/10.5194/esurf-5-417-2017, 2017.
Gould, S. J.: Allometry and size in ontogeny and phytogeny, Biol. Rev., 41, 587–640, https://doi.org/10.1111/j.1469-185X.1966.tb01624.x, 1966.
Gray, D. M.: Interrelationships of watershed characteristics, J. Geophys. Res., 66, 1215–1223, https://doi.org/10.1029/JZ066i004p01215, 1961.
Hack, J. T.: Studies of longitudinal stream profiles in Virginia and Maryland, US Geol. Surv. Prof. Pap. 294-B, US Geological Survey, Washington, D.C., 45–97, 1957.
Homsy, G. M.: Viscous fingering in porous media, Annu. Rev. Fluid Mech., 19, 271–311, https://doi.org/10.1146/annurev.fl.19.010187.001415, 1987.
Horton, R. E.: Erosional development of streams and their drainage basins: hydrophysical approach to quantitative morphology, Geol. Soc. Am. Bull., 56, 275–370, https://doi.org/10.1130/0016-7606(1945)56[275:EDOSAT]2.0.CO;2, 1945.
Hosier, P. E. and Cleary, W. J.: Cyclic geomorphic patterns of washover on a barrier island in southeastern North Carolina, Environ. Geol., 2, 23–31, https://doi.org/10.1007/BF02430662, 1977.
Hovius, N.: Regular spacing of drainage outlets from linear mountain belts, Basin Res., 8, 29–44, https://doi.org/10.1111/j.1365-2117.1996.tb00113.x, 1996.
Hudock, J. W.: Barrier island associated washover fan and flood tidal delta systems: A geomorphologic analysis and proposed classification scheme for modern washover fans and examination of a flood tidal delta complex in the Cretaceous upper McMurray Formation, Alberta, Canada, MS thesis, University of Texas at Austin, Austin, USA, 131 pp., 2013.
Hudock, J. W., Flaig, P. P., and Wood, L. J.: Washover fans: A modern geomorphologic analysis and proposed classification scheme to improve reservoir models, J. Sediment. Res., 84, 854–865, https://doi.org/10.2110/jsr.2014.64, 2014.
Huxley, J. S.: Constant differential growth-ratios and their significance, Nature, 114, 895–896, https://doi.org/10.1038/114895a0, 1924.
Huxley, J. S. and Tessier, G.: Terminology of relative growth, Nature, 137, 780–781, https://doi.org/10.1038/137780b0, 1936.
Izumi, N. and Parker, G.: Inception of channelization and drainage basin formation: Upstream-driven theory, J. Fluid Mech., 283, 341–363, https://doi.org/10.1017/S0022112095002357, 1995.
Kirchner, J. W.: Statistical inevitability of Horton's laws and the apparent randomness of stream channel networks, Geology, 21, 591–594, https://doi.org/10.1130/0091-7613(1993)021<0591:SIOHSL>2.3.CO;2, 1993.
Kleinhans, M. G., van Dijk, W. M., van de Lageweg, W. I., Hoyal, D. C., Markies, H., van Maarseveen, M., Roosendaal, C., van Weesep, W., van Breemen, D., Hoendervoogt, R., and Cheshier, N.: Quantifiable effectiveness of experimental scaling of river-and delta morphodynamics and stratigraphy, Earth-Sci. Rev., 133, 43–61, https://doi.org/10.1016/j.earscirev.2014.03.001, 2014.
Kleinhans, M. G., Van Scheltinga, R. T., Van Der Vegt, M., and Markies, H.: Turning the tide: Growth and dynamics of a tidal basin and inlet in experiments, J. Geophys. Res.-Earth, 120, 95–119, https://doi.org/10.1002/2014JF003127, 2015.
Lai, S. Y., Gerber, T. P., and Amblas, D. An experimental approach to submarine canyon evolution, Geophys. Res. Lett., 43, 2741–2747, https://doi.org/10.1002/2015GL067376, 2016.
Langbein, W. B. and others: Topographic characteristics of drainage basins, Water Supply Paper 968C, US Geol. Surv., Washington, D.C., 1947.
Lazarus, E. D.: Scaling laws for coastal overwash morphology, Geophys. Res. Lett., 43, 12113–12119, https://doi.org/10.1002/2016GL071213, 2016.
Lazarus, E. D. and Armstrong, S.: Self-organized pattern formation in coastal barrier washover deposits, Geology, 43, 363–366, https://doi.org/10.1130/G36329.1, 2015.
Lazarus, E. D. and Goldstein, E. B.: Is there a bulldozer in your model? J. Geophys. Res.-Earth, 124, 696–699, https://doi.org/10.1029/2018JF004957, 2019.
Lazarus, E. D., Davenport, K., and Matias, A.: Data (Part I) for `Dynamic allometry in coastal overwash morphology', figshare, https://doi.org/10.6084/m9.figshare.10259846, 2019.
Leatherman, S. P.: Quantification of overwash processes, PhD thesis, University of Virginia, USA, 1976.
Leatherman, S. P. and Zaremba, R. E.: Overwash and aeolian processes on a U.S. northeast coast barrier, Sediment. Geol., 52, 183–206, https://doi.org/10.1016/0037-0738(87)90061-3, 1987.
Leopold, L. B. and Maddock, T.: The hydraulic geometry of stream channels and some physiographic implications, US Geol. Survey Prof. Paper 252, US Geological Survey, Washington, D.C., 1953.
Leopold, L. B., Wolman, M. G., and Miller, J. P.: Fluvial processes in geomorphology, W. H. Freeman, San Francisco, 1964.
Lesser, G. R., Roelvink, J. V., Van Kester, J. A. T. M., and Stelling, G. S.: Development and validation of a three-dimensional morphological model, Coast. Eng., 51, 883–915, https://doi.org/10.1016/j.coastaleng.2004.07.014, 2004.
Mackin, J. H.: Rational and empirical methods of investigation in geology, in: The fabric of geology, edited by: Albritton, C. C., Freeman, Cooper, Stanford, California, USA, 135–163, 1963.
Matias, A. and Lazarus, E. D.: Data (Part 2) for `Dynamic allometry in coastal overwash morphology', figshare, https://doi.org/10.6084/m9.figshare.10281902.v1, 2020.
Matias, A., Ferreira, Ó., Vila-Concejo, A., Garcia, T., and Dias, J. A.: Classification of washover dynamics in barrier islands, Geomorphology, 97, 655–674, https://doi.org/10.1016/j.geomorph.2007.09.010, 2008.
Matias, A., Ferreira, Ó., Vila-Concejo, A., Morris, B., and Dias, J. A.: Short-term morphodynamics of non-storm overwash, Mar. Geol., 274, 69–84, https://doi.org/10.1016/j.margeo.2010.03.006, 2010.
Matias, A., Masselink, G., Castelle, B., Blenkinsopp, C., and Kroon, A.: Measurements of morphodynamic and hydrodynamic overwash processes in a large-scale wave flume, Coast. Eng., 113, 33–46, https://doi.org/10.1016/j.coastaleng.2015.08.005, 2016.
Maun, M. A. and Perumal, J.: Zonation of vegetation on lacustrine coastal dunes: effects of burial by sand, Ecol. Lett., 2, 14–18, https://doi.org/10.1046/j.1461-0248.1999.21048.x, 1999.
Melton, M. A.: Geometric properties of mature drainage systems and their representation in an E4 phase space, J. Geol., 66, 35–56, https://doi.org/10.1086/626481, 1958.
Millard, C., Hajek, E., and Edmonds, D. A.: Evaluating controls on crevasse-splay size: implications for floodplain-basin filling, J. Sediment. Res., 87, 722–739, https://doi.org/10.2110/jsr.2017.40, 2017.
Montgomery, D. R. and Dietrich, W. E.: Where do channels begin?, Nature, 336, 232–234, https://doi.org/10.1038/336232a0, 1988.
Morton, R. A. and Sallenger Jr., A. H.: Morphological impacts of extreme storms on sandy beaches and barriers, J. Coast. Res., 19, 560–573, 2003.
Moscardelli, L. and Wood, L.: Morphometry of mass-transport deposits as a predictive tool, Geol. Soc. Am. Bull., 128, 47–80, https://doi.org/10.1130/B31221.1, 2016.
Mosley, M. P. and Parker, R. S.: Allometric growth: a useful concept in geomorphology?, Geol. Soc. Am. Bull., 83, 3669–3674, https://doi.org/10.1130/0016-7606(1972)83[3669:AGAUCI]2.0.CO;2, 1972.
NRC – National Research Council: Landscapes on the edge: new horizons for research on Earth's surface, National Academies Press, Washington, D.C., USA, 2010.
Paola, C., Straub, K., Mohrig, D., and Reinhardt, L.: The “unreasonable effectiveness”of stratigraphic and geomorphic experiments, Earth Sci. Rev., 97, 1–43, https://doi.org/10.1016/j.earscirev.2009.05.003, 2009.
Perron, J. T. and Fagherazzi, S.: The legacy of initial conditions in landscape evolution, Earth Surf. Proc. Land., 37, 52–63, https://doi.org/10.1002/esp.2205, 2012.
Perron, J. T., Dietrich, W. E., and Kirchner, J. W.: Controls on the spacing of first-order valleys, J. Geophys. Res.-Earth, 113, F04016, https://doi.org/10.1029/2007JF000977, 2008.
Perron, J. T., Kirchner, J. W., and Dietrich, W. E.: Formation of evenly spaced ridges and valleys, Nature, 460, 502–505, https://doi.org/10.1038/nature08174, 2009.
Phillips, M. S., Blenkinsopp, C. E., Splinter, K. D., Harley, M. D., and Turner, I. L.: Modes of berm and beachface recovery following storm reset: observations using a continuously scanning lidar, J. Geophys. Res.-Earth, 124, 720–736, https://doi.org/10.1029/2018JF004895, 2019.
Roelvink, D., Reniers, A., Van Dongeren, A. P., de Vries, J. V. T., McCall, R., and Lescinski, J.: Modelling storm impacts on beaches, dunes and barrier islands, Coast. Eng., 56, 1133–1152, https://doi.org/10.1016/j.coastaleng.2009.08.006, 2009.
Rogers, L. J., Moore, L. J., Goldstein, E. B., Hein, C. J., Lorenzo-Trueba, J., and Ashton, A. D.: Anthropogenic controls on overwash deposition: Evidence and consequences, J. Geophys. Res.-Earth, 120, 2609–2624, https://doi.org/10.1002/2015JF003634, 2015.
Roos, P. C., Schuttelaars, H. M., and Brouwer, R. L.: Observations of barrier island length explained using an exploratory morphodynamic model, Geophys. Res. Lett., 40, 4338–4343, https://doi.org/10.1002/grl.50843, 2013.
Sallenger Jr., A. H.: Storm impact scale for barrier islands, J. Coast. Res., 16, 890–895, 2000.
Shaw, J., You, Y., Mohrig, D., and Kocurek, G.: Tracking hurricane-generated storm surge with washover fan stratigraphy, Geology, 43, 127–130, https://doi.org/10.1130/G36460.1, 2015.
Sherwood, C. R., Long, J. W., Dickhudt, P. J., Dalyander, P. S., Thompson, D. M., and Plant, N. G.: Inundation of a barrier island (Chandeleur Islands, Louisiana, USA) during a hurricane: Observed water-level gradients and modeled seaward sand transport, J. Geophys. Res.-Earth, 119, 1498–1515, https://doi.org/10.1002/2013JF003069, 2014.
Shreve, R. L.: Statistical law of stream numbers, J. Geol., 74, 17–37, https://doi.org/10.1086/627137, 1966.
Simmons, J. A., Splinter, K. D., Harley, M. D., and Turner, I. L.: Calibration data requirements for modelling subaerial beach storm erosion, Coast. Eng., 152, 103507, https://doi.org/10.1016/j.coastaleng.2019.103507, 2019.
Simon, H. and Bonini, C. P.: The size distribution of business firms, Am. Econ. Rev., 48, 607–617, 1958.
Splinter, K., Harley, M., and Turner, I.: Remote sensing is changing our view of the coast: Insights from 40 years of monitoring at Narrabeen-Collaroy, Australia, Remote Sensing, 10, 1744, https://doi.org/10.3390/rs10111744, 2018.
Strahler, A. N.: Quantitative analysis of watershed geomorphology, Am. Geophys. Union Trans., 38, 913–920, https://doi.org/10.1029/TR038i006p00913, 1957.
Strahler, A. N.: Dimensional analysis applied to fluvially eroded landforms, Geol. Soc. Am. Bull., 69, 279–300, https://doi.org/10.1130/0016-7606(1958)69[279:DAATFE]2.0.CO;2, 1958.
Straub, K. M., Jerolmack, D. J., Mohrig, D., and Rothman, D. H.: Channel network scaling laws in submarine basins, Geophys. Res. Lett., 34, L12613, https://doi.org/10.1029/2007GL030089, 2007.
Sweeney, K. E., Roering, J. J., and Ellis, C.: Experimental evidence for hillslope control of landscape scale, Science, 349, 51–53, https://doi.org/10.1126/science.aab0017, 2015.
Talling, P. J., Stewart, M. D., Stark, C. P., Gupta, S., and Vincent, S. J.: Regular spacing of drainage outlets from linear fault blocks, Basin Res., 9, 275–302, https://doi.org/10.1046/j.1365-2117.1997.00048.x, 1997.
Van Dijk, W. M., Van de Lageweg, W. I., and Kleinhans, M. G.: Experimental meandering river with chute cutoffs, J. Geophys. Res.-Earth, 117, F03023, https://doi.org/10.1029/2011JF002314, 2012.
Voller, V. R., Ganti, V., Paola, C., and Foufoula-Georgiou, E.: Does the flow of information in a landscape have direction?, Geophys. Res. Lett., 39, L01403, https://doi.org/10.1029/2011GL050265, 2012.
Vos, K., Harley, M. D., Splinter, K. D., Simmons, J. A., and Turner, I. L.: Sub-annual to multi-decadal shoreline variability from publicly available satellite imagery, Coast. Eng., 150, 160–174, https://doi.org/10.1016/j.coastaleng.2019.04.004, 2019.
Walters, D. C. and Kirwan, M. L.: Optimal hurricane overwash thickness for maximizing marsh resilience to sea level rise, Ecol. Evol., 6, 2948–2956, https://doi.org/10.1002/ece3.2024, 2016.
Werner, B. T.: Modeling landforms as self-organized, hierarchical dynamic systems, in: Prediction in Geomorphology, edited by: Wilcock, P. and Iverson, R. M., AGU Geophys. Monogr., 135, 131–150, 2003.
Wesselman, D., de Winter, R., Oost, A., Hoekstra, P., and van der Vegt, M.: The effect of washover geometry on sediment transport during inundation events, Geomorphology, 327, 28–47, https://doi.org/10.1016/j.geomorph.2018.10.014, 2019.
Wiggins, M., Scott, T., Masselink, G., Russell, P., and McCarroll, R. J.: Coastal embayment rotation: Response to extreme events and climate control, using full embayment surveys, Geomorphology, 327, 385–403, https://doi.org/10.1016/j.geomorph.2018.11.014, 2019.
Woldenberg, M. J.: Horton's laws justified in terms of allometric growth and steady-state in open systems, Geol. Soc. Am. Bull., 77, 431–434, https://doi.org/10.1130/0016-7606(1966)77[431:HLJITO]2.0.CO;2, 1966.
Wolinsky, M. A., Edmonds, D. A., Martin, J., and Paola, C.: Delta allometry: Growth laws for river deltas, Geophys. Res. Lett., 37, L21403, https://doi.org/10.1029/2010GL044592, 2010.
Wong, P. P., Losada, I. J., Gattuso, J.-P., Hinkel, J., Khattabi, A., McInnes, K. L., Saito, Y., and Sallenger, A.: Coastal systems and low-lying areas, in: Climate Change 2014: Impacts, Adaption, 45 and Vulnerability, Part A: Global and Sectoral Aspects, Contribution of Working Group II to the Fifth Assessment Report of the Intergovernmental Panel on Climate Change, edited by: Field, C. B., Barros, V. R., Dokken, D. J., Mach, K. J., Mastrandrea, M. D., Bilir, T. E., Chatterjee, M., Ebi, K. L., Estrada, Y. O., Genova, R. C., Girma, B., Kissel, E. S., Levy, A. N., MacCracken, S., Mastrandrea, P. R., and White, L. L., Cambridge University Press, Cambridge, UK and New York, NY, USA, 361–409, 2014.