the Creative Commons Attribution 4.0 License.
the Creative Commons Attribution 4.0 License.
 | 10 Aug 2020
Scale breaks of suspended sediment rating in large rivers in Germany induced by organic matter
Thomas O. Hoffmann
Yannik Baulig
Helmut Fischer
Jan Blöthe
Understanding the transport of suspended sediment and associated nutrients is of major relevance for sustainable sediment management aiming to achieve healthy river systems. Sediment rating curves are frequently used to analyze the suspended sediments and their potential sources and sinks. Here we use more than 750 000 measurements of suspended sediment concentrations (SSCs) and discharge (Q) collected at 62 gauging stations along 19 waterways in Germany based on the suspended sediment monitoring network of the German water and shipping authority, which started in the 1960s. Furthermore, we analyze more than 2000 measurements of the loss on ignition (LOI) of suspended matter at two stations along the rivers Moselle and Rhine to provide a proxy for the relative contributions of mineral load and organic matter. SSC and LOI are analyzed in terms of the power-law rating curve to identify discharge-dependent controls of suspended matter.
Our results indicate that for most studied gauging stations, rating coefficients are not constant over the full discharge range, but there is a distinct break in the sediment rating curve, with specific SSC–Q domains above and below this break. The transition of the rating exponent likely results from increased supply of mineral suspended sediments from hillslope erosion at high flow and a shift of the organic matter sources from aquatic biomass-derived organic matter (i.e., high % LOI) at low flow, to mineral-associated organic matter with low % LOI eroded from hillslopes at higher flow. Based on these findings we developed a conceptual rating model for large (>10 000 km2) and low-turbidity (SSC < 1000 mg L−1) rivers separating the mineral and organic fraction of the suspended matter in German waterways. This model allows evaluating the sources of the mineral and organic fraction of the suspended matter and facilitates new insights into the first-order control of discharge on the quality and quantity of suspended sediments.
- Article
(5466 KB) - Full-text XML
- Companion paper
- BibTeX
- EndNote


Suspended sediment dominates sediment transport of almost all lowland rivers of the world (Naden, 2010; Walling, 1996) and represents 90 %–95 % of the global riverine sediment load to the coastal oceans (Syvitski et al., 2005). Silt and clay particles, which comprise the dominant grain size fraction of suspended sediments, form an important transport medium for nutrients, pollutants, and contaminants. Sustainable sediment management aiming to achieve healthy river systems therefore requires a sound understanding of the sources and sinks of suspended sediment along riverine flow paths.
Transport of suspended sediment is strongly conditioned by sediment characteristics (Owens et al., 2005; van Rijn, 1984; Walling et al., 2000). The size and density of sediment particles control their propensity to settle within the turbulent flow of the river, counteracting gravitational settling (Naden, 2010; Partheniades, 2009). The size and density of fine suspended particles in turn affect their affinity to form aggregates and flocs due to strong cohesive forces between fine grain particles (Winterwerp and Van Kesteren, 2004). Depending on sediment sources, suspended particles are either mineral, organic, or a combination of both. Erosion of (organic-rich) topsoil from either hillslopes or floodplains represents an important source of suspended sediment (mainly silt and clay) and supplies large amounts of (allochthonous) organic matter with site-characteristic carbon contents (Hoffmann et al., 2009). Sediment supply generated by surface runoff in response to intensive and/or long-lasting rainfall events typically results in increased levels of suspended sediment concentration (SSC) in river channels during higher discharges (e.g., Asselmann, 2000; Gray, 2018).
In addition to allochthonous suspended matter, phytoplankton is an important source of organic suspended matter that is autochthonously produced within rivers. Especially during spring and summer months, when phytoplankton growth is supported by high water temperatures, sufficient light, and high nutrient levels, autochthonous organic matter may dominate the total suspended load in many large lowland rivers and those with intense agricultural land use within the river catchment (Cloern, 1999; Hillebrand et al., 2018; Thorp and Delong, 2002). Water flow velocities regulate the water residence times, which in turn affect the time available for phytoplankton growth in river systems. Low flow conditions with increased residence times provide favorable conditions for phytoplankton biomass accumulation including algal blooms with high organic SSC. In contrast, short residence times can strongly reduce the share of autochthonous biomass in suspended sediments because phytoplankton growth rates cannot compensate for the downstream transport at higher discharges, even if temperature, light availability, and nutrient levels are not limiting phytoplankton growth (Fischer, 2015; Quiel et al., 2011). Additionally, at high flow runoff and erosion supply materials from outside the channel that swamp the within-river production. Thus, a negative relationship between autochthones organic matter load and discharge is observed in many river systems (Gomez et al., 2003; Goñi et al., 2014; Hilton et al., 2012; Moreira-Turcq et al., 2013), in contrast to allochthonous suspended matter.
Besides physical factors controlling the abundance of phytoplankton in river systems, several studies stress the importance of biological controls. For instance, Hardenbicker et al. (2016) suggest that low phytoplankton concentrations in the Rhine are at least partly the result of losses due to grazing by the invasive bivalve mollusk Corbicula fluminea, which has increased in density since the early 1990s, while phytoplankton declined during the same time. Furthermore, predicting the characteristics of the suspended matter is confounded by the heterogeneous and composite structure of flocs and aggregates that are composed of mineral particles as well as living and dead organic matter (Winterwerp et al., 2006). The size of the flocs is a function of the turbulence-induced collision of suspended particles and the cohesive and adhesive forces between the flocs. The latter is strongly controlled by the grain size and the organic matter of the suspended particles. Their size and density, in turn, affect the transport conditions, with large and dense flocs being predominantly deposited, while flocs with a high organic matter content and a low density are transported over long distances (Winterwerp et al., 2006).
Sediment rating curves are frequently used to analyze the transport conditions of suspended sediments and their potential sources and sinks (Asselmann, 2000; Cohn et al., 1992) or to predict suspended sediment yields at ungauged or infrequently gauged stations (Ferguson, 1986; Horowitz, 2003; Morehead et al., 2003; Syvitski et al., 2000). Rating curves plot SSC as a function of water discharge Q. The temporal aggregation (or resolution) depends on the approach and available data and ranges from 15 min to annual averages. In many cases, there is a close link between the two variables that is mostly described by a power law:
where a and b are coefficients that depend on the characteristics of the river system; a represents the SSC at unit discharge and the exponent b has been discussed in terms of sediment availability and the erosivity of the stream (Asselmann, 2000; Syvitski et al., 2000). While a varies over several orders of magnitude depending on the river system characteristics, values of b are typically more confined and range between 0.2 and 2.0 (Syvitski et al., 2000), with lower values in arid environments (i.e., 0.2 to 0.7) and higher values in humid, temperate river systems (i.e., 1.4–2.5; based on Reid and Frostick, 1987). However, small changes in the rating exponent b can cause large changes in SSC, which are of the same order of magnitude as the changes imposed by the (large) variability in a (Syvitski et al., 2000). Using Eq. (1), many studies found a strong negative relationship between a and b (Asselmann, 2000), which is, however, not a matter of the natural balance between the two rating parameters (as proposed by Syvitski et al., 2000) but an artifact of the statistical analysis as the units of a are dependent on b. Warrick (2015) suggests using normalized Q and SSC values to avoid this confusion and provide a statistically sound rating analysis (see also the Method section).
In most cases, observed Q and SSC scatter strongly around the regression line from Eq. (1). Deviations from the simple power law haven been shown to result from (i) hysteresis effects during single flood events (Aich et al., 2014; Zuecco et al., 2016), (ii) seasonal changes in water and sediment sources or flow hydraulics (Asselmann, 2000; Morehead et al., 2003), or (iii) long-term trends of changing sediment supply (Warrick, 2015). Event-based deviations are associated with (i) clockwise hysteresis (i.e., the SSC peak precedes the Q peak), with a rapid SSC increase due to within-channel mobilization of suspended sediment and subsequent sediment exhaustion, or (ii) anticlockwise hysteresis (i.e., maximum Q precedes the SSC peak) due to the long transport distance of sediment sources that are located within the catchment (e.g., arable land on inclined hillslopes with increased soil erosion rates) (Asselmann, 2000), as well as combinations of both within one event (leading to a complex hysteresis pattern). While the general processes affecting a rating relation in specific cases are well known, it is difficult to predict the rating behavior as a result of the many confounding processes and linkages.
Recently, we have learned more about the controlling factors of sediment rating, but so far the effect of organic material on SSC rating is not sufficiently understood. An alternative control on SSC–Q relationships may be the varied contribution of organic matter to river sediment loads. However, many studies that have investigated the composition and loading of organic matter are limited to a relatively narrow window (∼ year) of sample collection and tend to focus on steep upland catchments (e.g., Goñi et al., 2014; Hilton et al., 2012; Smith et al., 2013). In contrast, studies with a large number of samples tend to focus on total suspended sediment without considering their mineral and organic components. In this respect suspended sediment is equivalent to seston, a term used in ecological sciences to describe the total particulate matter including living organisms, organic detritus, and inorganic particles (Naden, 2010; Wetzel, 2001). Consequently, most sediment rating studies, which focus on prediction of total SSC levels in river systems based on water discharge or on hysteresis effects of total SSC during single flood events, lump organic and inorganic particles into sediment rating curves. To the authors' knowledge, there is no study that rigorously investigates the influence of the variable mineral and organic fractions in river systems on the rating of sediment.
Here we hypothesize that the mineral and organic fractions of SSC in large German rivers are controlled by different and independent processes reflected in specific rating coefficients. We test this hypothesis by (i) analyzing the scaling of total suspended sediment with discharge before we (ii) differentiate between the scaling behavior of the mineral and organic fractions of the suspended sediment against discharge. Furthermore, we develop a conceptional sediment rating model for large and low-turbidity rivers considering the mineral and organic fraction of the suspended sediment transport. To perform this study, we used a rich dataset on suspended sediment in German waterways and analyzed more than 750 000 suspended sediment measurements.
2.1 Study sites
In this study we explore discharge and suspended sediment measurements at 62 gauging stations along 19 waterways in Germany. The studied rivers are the Danube, Rhine, Ems, Weser, Elbe, and Oder, including some larger tributaries (Table 1 for details and Fig. 1 for location). The gauging stations cover contributing areas from 2076 to 159 555 km2, with a median of 24 424 km2. The topography of the river catchments includes the steep high mountain terrain of the European Alps (e.g., Alpine Rhine and Danube) as well as mountainous regions with various geological settings in central Europe and the flat terrain of northern Germany, which is mainly composed of glacial and fluvial Quaternary deposits. The long-term average discharge of all stations ranges from 9 to 2289 m3 s−1 (Table 1). The strong control of contributing area on discharge is clearly reflected by the higher specific discharges (i.e., discharge per contributing catchment area) of the rivers Rhine and Danube (Jochenstein station), which are characterized by strong discharge contributions from the Alps (Fig. 2). In contrast, stations in the Elbe and Oder catchments show much lower (specific) discharges at a given catchment area due to lower rainfall in the more continental climate compared to the rivers in western and central Germany, which are fed by the elevated precipitation of the more maritime climate.
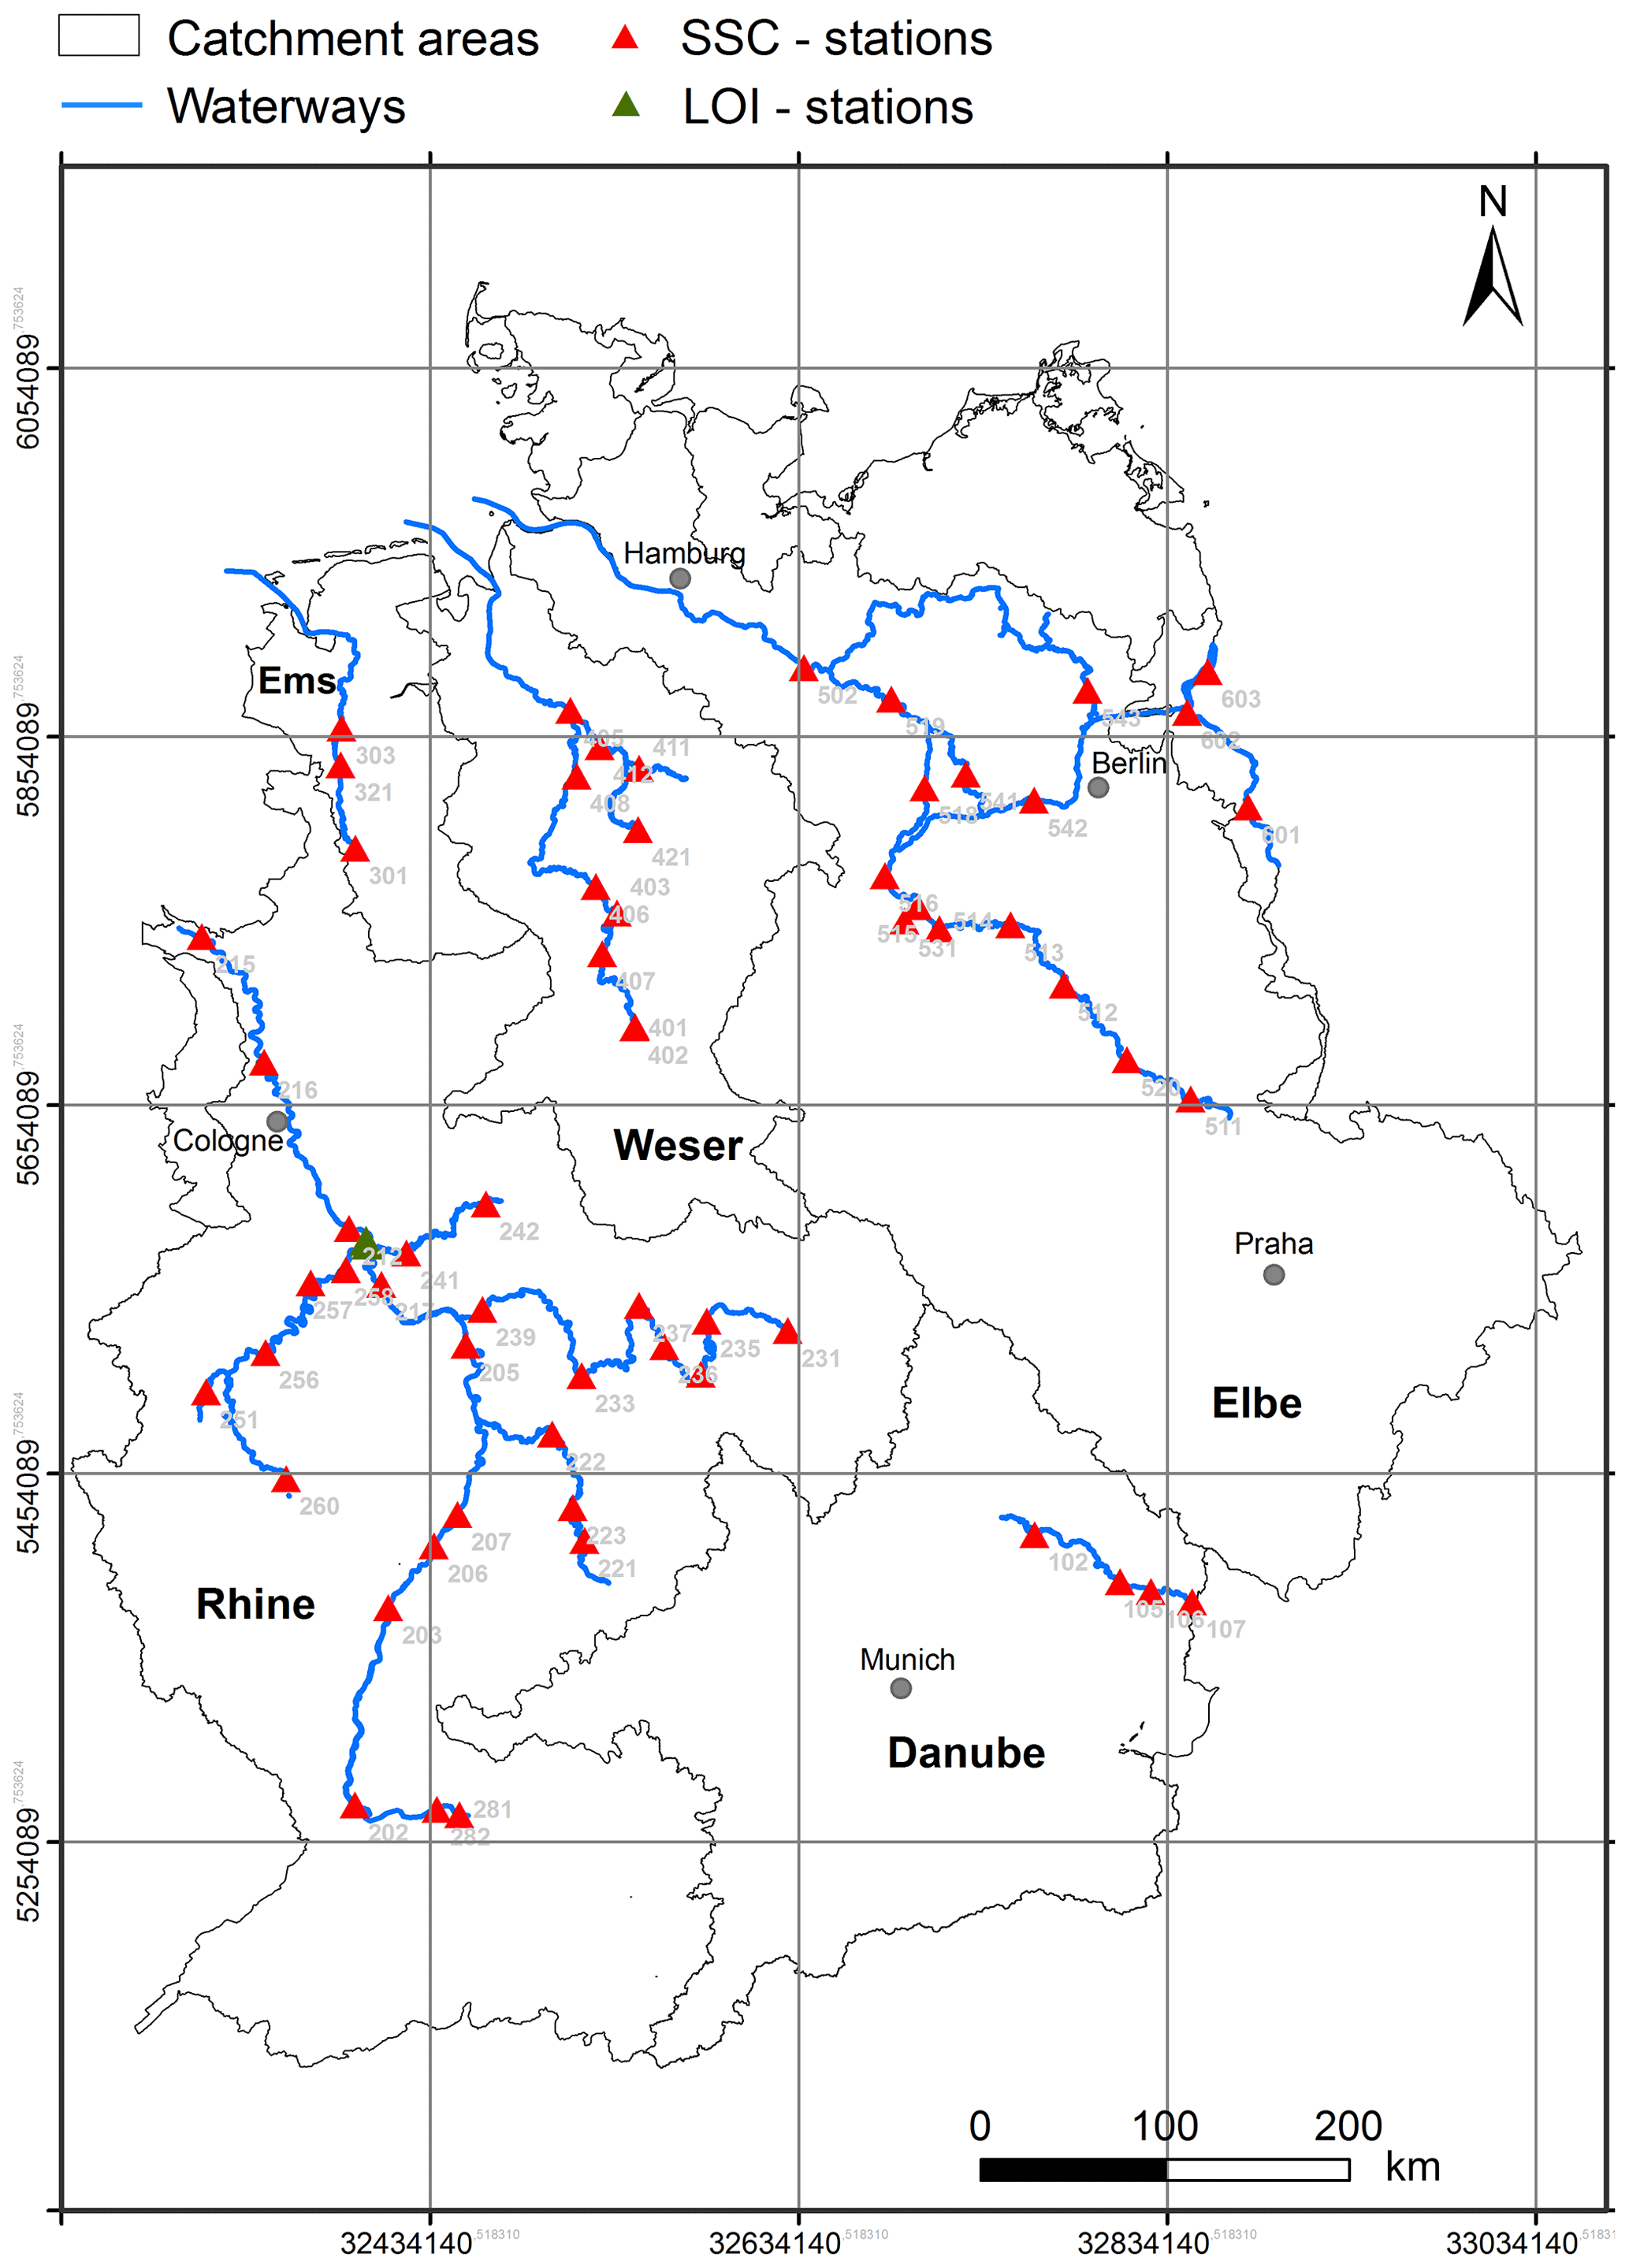
Figure 1Selected sampling locations of the WSV suspended monitoring network used in this study covering the major river basins in Germany as shown. Labels refer to the station codes given in Table 1. Note that the two green triangles of the LOI stations in Koblenz (IDs 998 and 999 in Table 2) overlap due to their proximity.
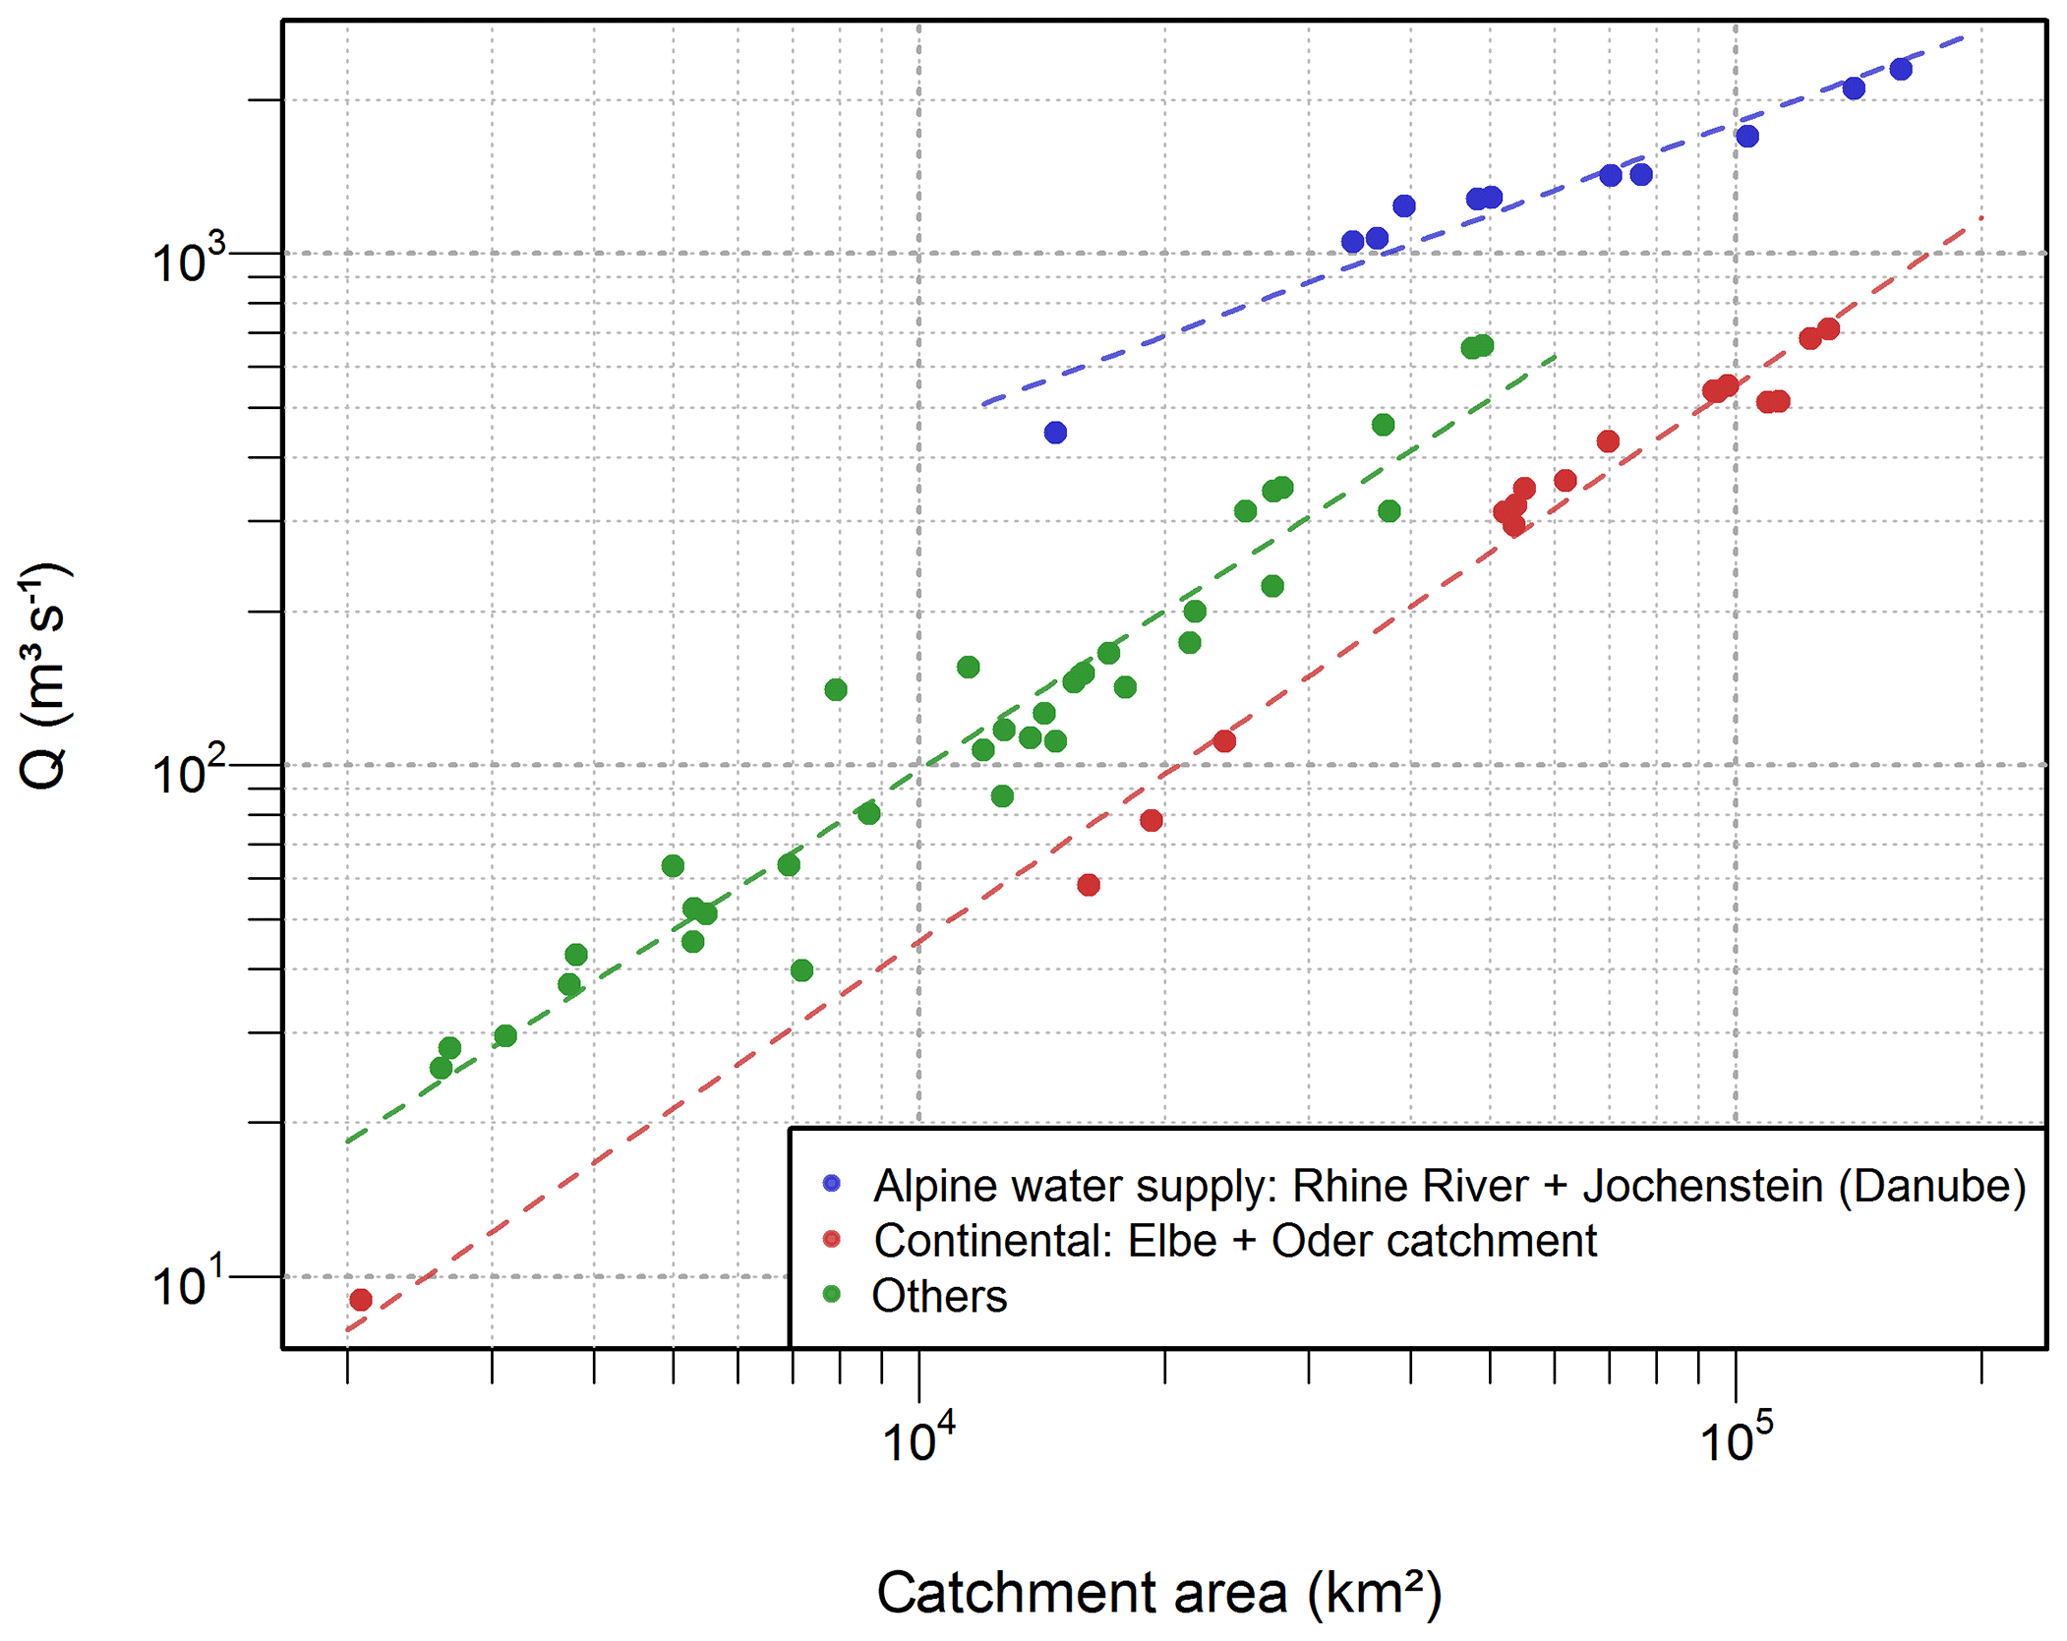
Figure 2Discharge as a function of catchment area for 62 gauging stations that are used as reference stations of the suspended sediment monitoring network.
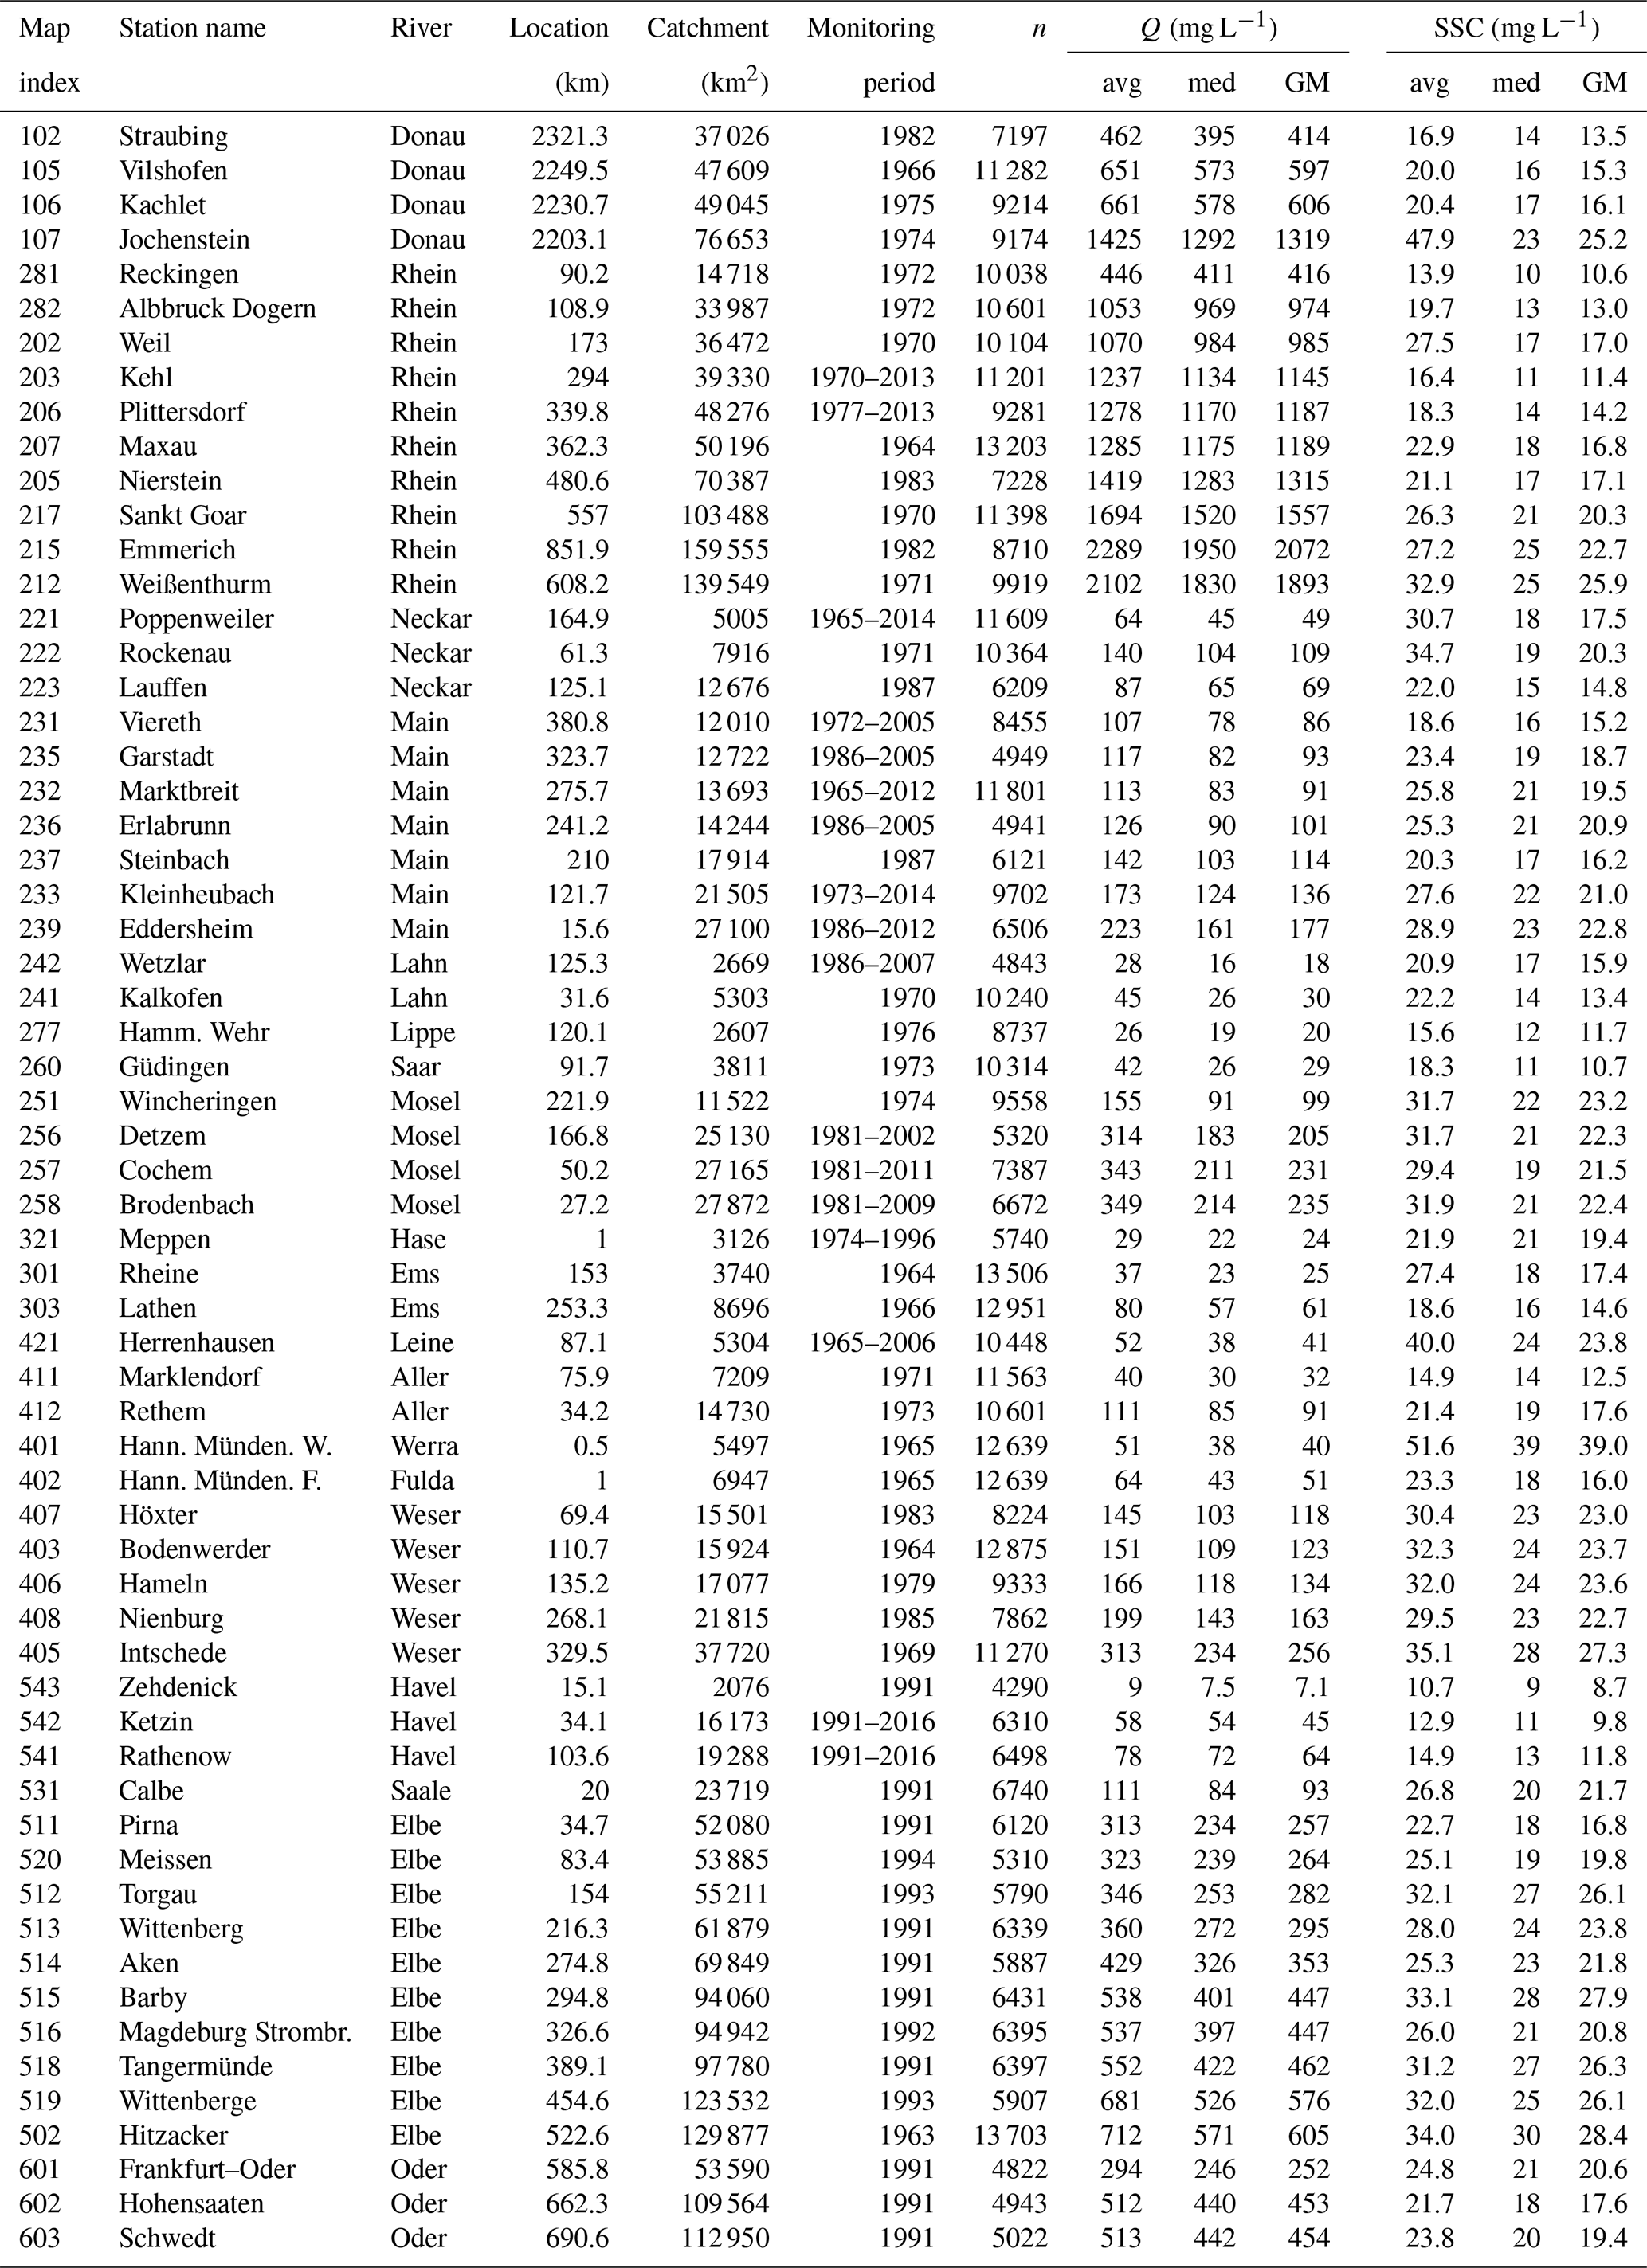
Table 1Overview of sampling locations, contributing catchment size, monitoring period, number of samples (n), and average (avg), median (med), and geometric mean (GM) of discharge Q and suspended sediment concentration (SSC). The map index refers to the numbers in the map (Fig. 1). The location (km) refers to the official kilometer measurement of the German Water and Shipping Authority of the waterways in downstream distance. The monitoring period refers to the start year if only one year is given. In this case monitoring continues until the present.
2.2 Suspended sediment monitoring in German waterways
Suspended sediment in German waterways is monitored daily using instantaneous water samples taken manually by the Federal Waterways and Shipping Administration (Wasserstraßen- und Schifffahrtsverwaltung des Bundes, WSV) at ∼70 sampling locations. SSC monitoring started in 1965 and has accumulated long-term records that cover >30 years for many stations. Here, we selected only those stations from the monitoring network that are not located at artificial channels (with different flow regimes) and that cover periods longer than 10 years (Table 1 and Fig. 1), resulting in a total of 62 stations. Periods with more than 10 years were chosen to have sufficient data for the statistical analysis. Data from Maxau station at the river Rhine and from some tributaries haven been formerly presented by Asselmann (2000) and Horowitz (2003) in terms of a rating analysis and by Frings et al. (2014) and Frings et al. (2019) in terms of sediment budget calculations.
At each monitoring site, 5 L bucket water samples were taken once each workday (excluding weekends and legal holidays) roughly in the top 30 cm of the water surface. During floods, the sampling frequency was increased up to three samples per day unless sampling was stopped due to safety reasons. If more than one sample per day was taken, we used the mean SSC of all samples of that day. Limiting the water sampling to the top 30 cm slightly underestimates the average SSC in a channel cross section (and thus the suspended sediment load). However, we argue that the rating behavior does not significantly change compared to depth-integrated measurements (Morin et al., 2018).
Water samples were filtered using commercial coffee filters, which were weighed before and after filtering (under constant climatic conditions in the lab with 20 ∘C air temperature and 50% air moisture) to calculate the daily SSC (mg L−1) (Hillebrand et al., 2015, 2018). The use of coffee filters is cost-efficient and facilitates measuring SSC for a large number of samples (i.e., 70 samples per day at the national scale) with sufficient quality. However, these filters do not have a well-defined pore diameter and a significant fraction of clay is lost. In general, suspended sediment mainly contains silt (approx. 75 %) and only a small fraction of clay (mostly 10 %–20 %) and fine sand (mostly below 10 %) (for a detailed particle size analysis of the suspended sediment of the river Rhine, see Hillebrand and Frings, 2017). Thus, clays are expected to comprise less than 20 % of the suspended sediment, which agrees with comparisons of the suspended loads estimated using cellulose acetate filters (with pore diameter of 0.45 µm) and coffee filters. The latter underestimate loads by approximately 20 % (Hillebrand et al., 2015). For each SSC monitoring station, discharge is either measured at the station or nearby, without major tributaries entering the river between the SSC station and the discharge station. Water level is typically measured every 15 min, and discharge is calculated using a rating curve. In this study, we used daily average discharge, which is then related to the daily SSC samples.
As shown in Table 1, long-term averages of SSC for all stations range between 10.7 and 51.6 mg L−1, with an average of 25 mg L−1. Long-term discharge-weighted averages of SSC are somewhat higher, ranging between 11.8 and 84.4 mg L−1, with a mean of 36 mg L−1. Higher discharge-weighted SSC reflects higher SSC at high discharge, which results in higher weights of increased SSC. Similar to other national monitoring systems (e.g., Diplas et al., 2008; Habersack and Haimann, 2010; Spreafico et al., 2005; Thollet et al., 2018), SSC values for most stations used in this study include both the mineral and organic material of suspended sediment. Loss on ignition (LOI) and chlorophyll a (Chl a) have been monitored since 1997 at two sampling locations immediately upstream of the confluence of the rivers Moselle and Rhine in Koblenz. At both stations, water samples of 2 to 5 L were taken at a weekly interval (in contrast to the daily sampling of the stations for the suspended sediment monitoring), resulting in a total of 1033 and 1056 samples from the Rhine and the Moselle, respectively (until the end of 2017). Similar to SSC water samples, sampling for LOI was limited to the upper 50 cm of the water surface using a bucket water sampler.
To measure the LOI at both stations, the water samples were filtered using a glass-fiber filter with a pore size of about 1 µm (Whatman GF 6, GE Healthcare, Germany). The filter was weighted empty (after heating at 500 ∘C for 1 h to combust organic remains on the filter) and after filtration. Between filtration and weighting the full filter was dried at 105 ∘C for 24 h to obtain the total suspended sediment SSCtot (including the mineral and organic components). The whole samples was heated at 500 ∘C for 1 h with the aim of combusting the organic fraction of the suspended matter and measuring the LOI. In our study LOI is given as the ratio of the mass of organic matter (the mass LOI) to the total suspended sediment mass (ranging from 0 to 1). Here we use LOI as a proxy for the organic matter content of the suspended sediments, despite the challenges that are related to this method (i.e., different protocols regarding the temperature and combustion length result in various LOIs, and combustion may originate not only from organic matter but also from clay-bound water and carbonate decomposition).
Based on the LOI, we segregated the mineral (SSCmrl) and organic (SSCorg) fraction of the SSC: SSC and SSC.
For both stations, Chl a was analyzed in parallel with the LOI samples. Chl a was used as a proxy for phytoplankton biomass in the rivers Rhine and Moselle. Chl a concentrations were determined using German Standard Methods (DEW, 2007). Briefly, phytoplankton was filtered on glass-fiber filters and pigments were extracted with hot ethanol. Chlorophyll concentrations were determined photometrically (DR 2800, Hach Lange, Germany). Chl a concentration (µg L−1) was transferred to living phytoplankton biomass using a C : Chl a ratio of 40 and a particulate organic matter (POM) to particulate organic carbon (POC) ratio of 0.42 (Geider, 1987; Hardenbicker et al., 2014; Hillebrand et al., 2018). The applied ratios represent global average conditions of C in Chl a and POC in POM and allow only a first-order estimate of living phytoplankton biomass. Therefore, we did not use this value to calculate the contribution of living phytoplankton biomass to the SSCorg. However, we used the ratio as a plausibility check to give a first-order estimate of the origin of the suspended organic matter based on a comparison of seasonal changes.
2.3 Rating analysis
To analyze suspended sediment as a function of discharge, we calculate sediment rating curves following Eq. (1). The interpretation of the coefficients a and b in Eq. (1) is impeded by their interdependence as illustrated by units of a that depend on the exponent b: with SSC having the dimension M∕L3 (M and L represent the dimensions mass and length, and L3 is equal to volume) and Qb having the dimension L3b∕Tb (where T represents the dimension of time), the units of a are given by MTbL (note the direct dependency on the exponent b). To avoid this complication and to facilitate the comparison of rating curves between various stations, SSC and Q values are normalized by the geometric means (SSCGM and QGM, respectively) computed for each station according to Warrick (2015):
In Eq. (2), a and b are dimensionless. The exponent b can be linked to the response of SSC to changing discharge, and a represents the normalized SSC at QGM. The normalization using Eq. (2) does not have any effect on the exponent b (i.e., the slope of the regression line does not change) but changes the absolute value of a.
For most studied gauging stations included in this study, a and b are not constant over the full discharge range, but there is a distinct break in the sediment rating curve, with specific SSC–Qw domains above and below this break. To estimate the discharge at which this break occurs (Qbr), we used three approaches. The first approach is based on the locally weighted scatter smoothing (lowess) regression curve (the red dotted line in Fig. 3), which was calculated using the gplot package in R according to Cleveland (1979). We defined Qbr to be located at the maximum curvature of the lowess regression curve. In the second approach, we used a sequence of n equally log-spaced discharges (Qi∕QGM, with and constant width of ΔQ=100.025) between Qmin∕QGM and Qmax∕QGM and extracted for each Qi∕QGM the corresponding SSCi∕SSCGM value of the lowess regression curve. For each i ( we build two subsets: (i) the low flow subset with data pairs smaller than or equal to Qi∕QGM and the high flow subset with discharge larger than Qi∕QGM. We than applied a piecewise nonlinear least-squares (NLS) regression to both subsets, which were both forced through the data pair (Qi∕QGM, SSCi∕SSCGM). As i increases (from Q1∕QGM to Qn∕QGM), the mean absolute error (MAE) of the NLS regression of the low flow subset increases (first slowly while the break point is approached and then more rapidly as the break point is exceeded), and the MAE of the high flow decreases in a similar fashion (first rapidly and then slowly). As Qi∕QGM approaches the break point Qbr, the MAEs of both NLS regressions are small and their sum is at a minimum. Thus, Qbr was set to the Qi∕QGM with the minimum of the sum of the MAE. The third approach is similar to the dual regression of the low and high flow subsets as applied in the second approach. However, the third approach does not use the SSC values of the lowess curve but uses the log-binned median SSC∕SSCGM of equally spaced discharge bins at the log scale (the yellow points in Fig. 3). The median SSC∕SSCGM values and the midpoint of each Q class were split into low flow and high flow subsets and used for the piecewise regression analysis to identify Qbr at which the sum of the MAE of both subsets was minimized.
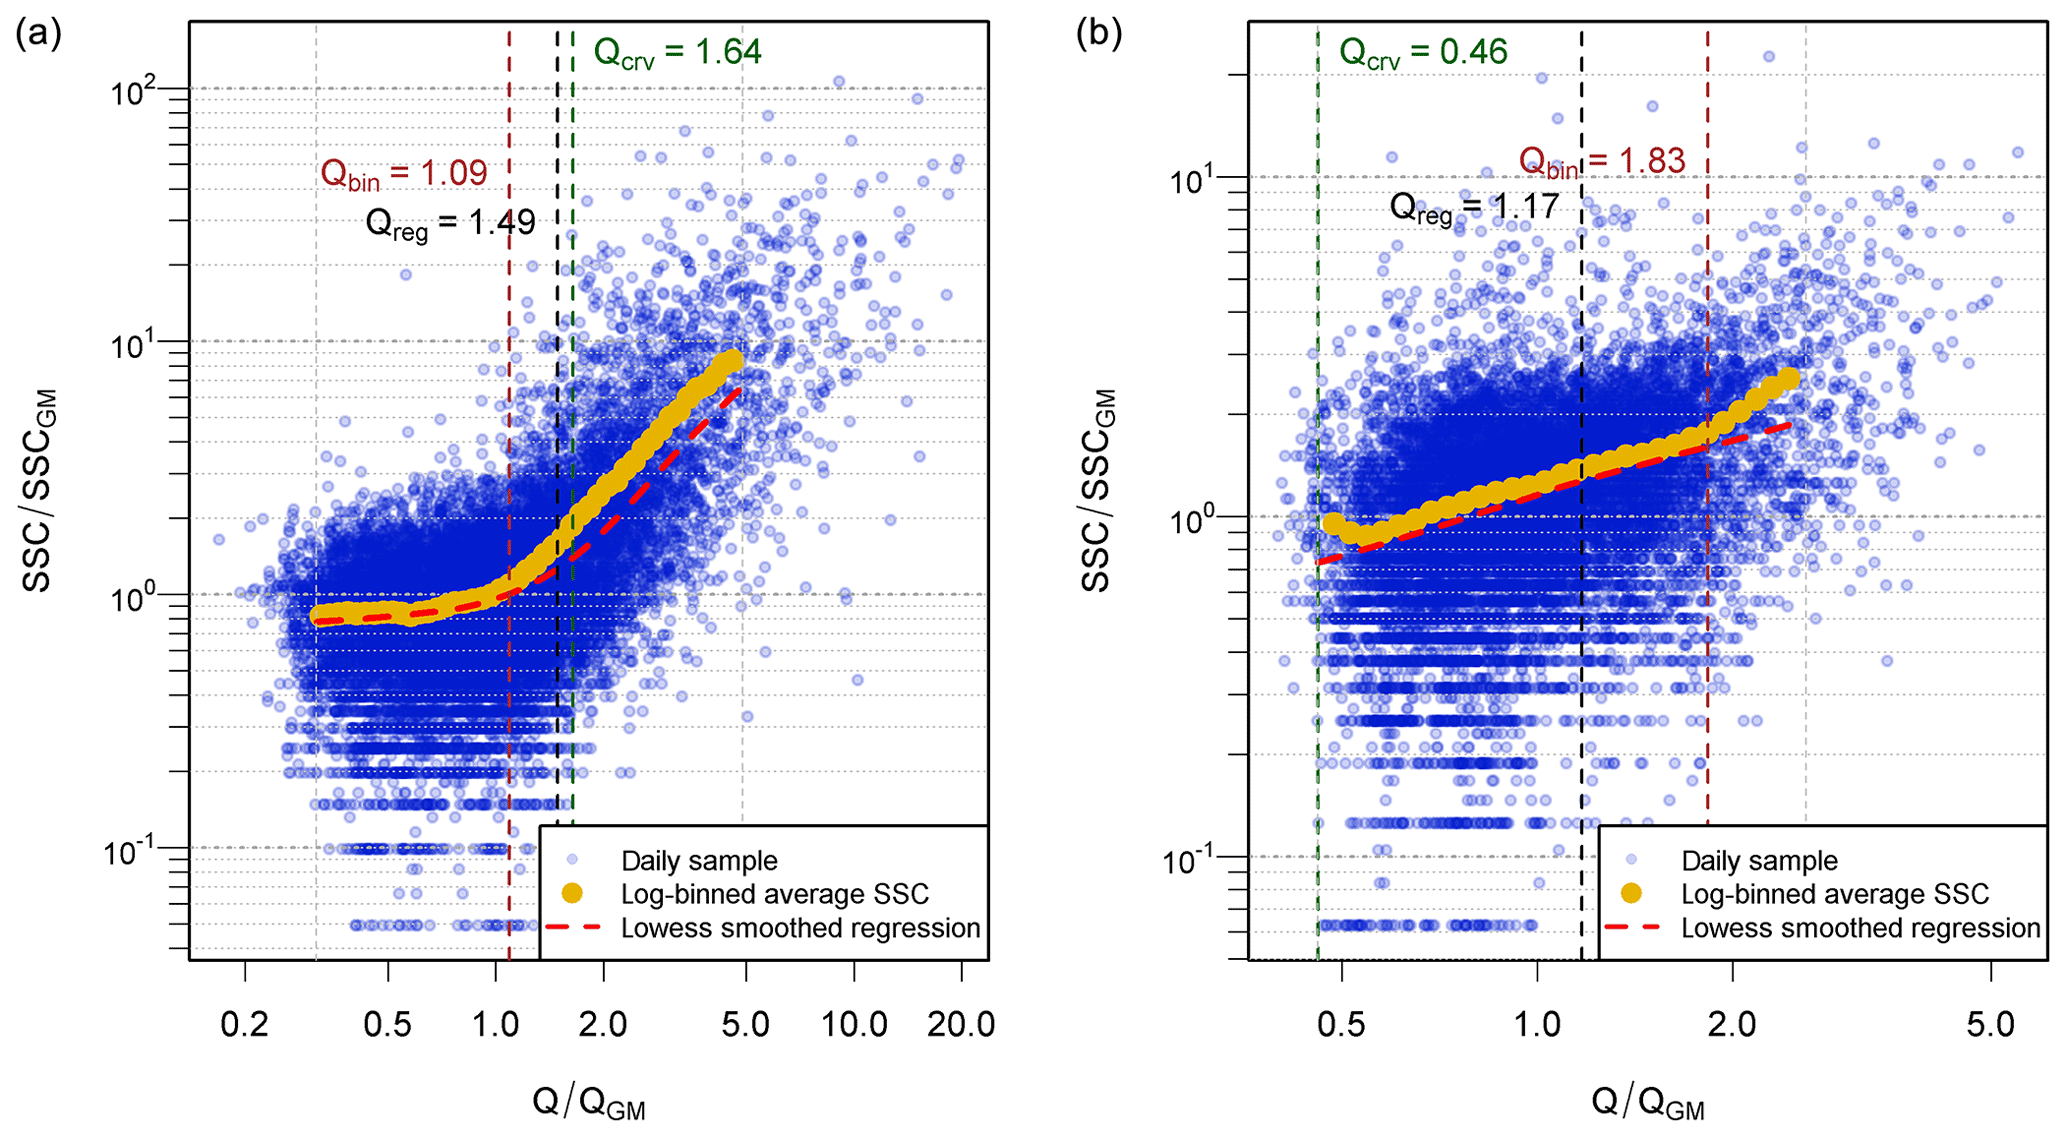
Figure 3Rating curves of the stations at Rockenau (river Neckar, ID 222) (a) and Kachlet (river Danube, ID 103) (b). For locations, see Fig. 1. Qcrv, Qreg, and Qbin refer to the rating breaks derived using the maximum curvature of the lowess curve, the regression of the data points of the loess curve, and the regression of the binned averages (for more details, see the text).
At extreme discharges, rating relationships tend to be strongly scattered due to the low density of SSC–Q data pairs. To estimate the Qbr, we thus excluded measurements with Q smaller than 1 % and larger than 99 % discharge at each station.
After the identification of Qbr for each station, the coefficients in Eq. (2) were estimated for the low flow regime (i.e., all measured SSC–Q data pairs with Q<Qbr) and the high flow regime (i.e., all measured SSC–Q data pairs with Q>Qbr) using log-linear and nonlinear least-squares regression (see Table 2). Coefficients for the low flow regime are denoted by al and bl and for the high flow regime by ah and bh. To estimate the confidence intervals and thus to test for significant differences between rating exponents for the low flow and high flow regimes, we used a bootstrapping approach with 1000 replications (resulting in normal distributions of bl and bh with 1000 estimates) and compared the distributions of bl and bh using a t test with a 95 % confidence level.
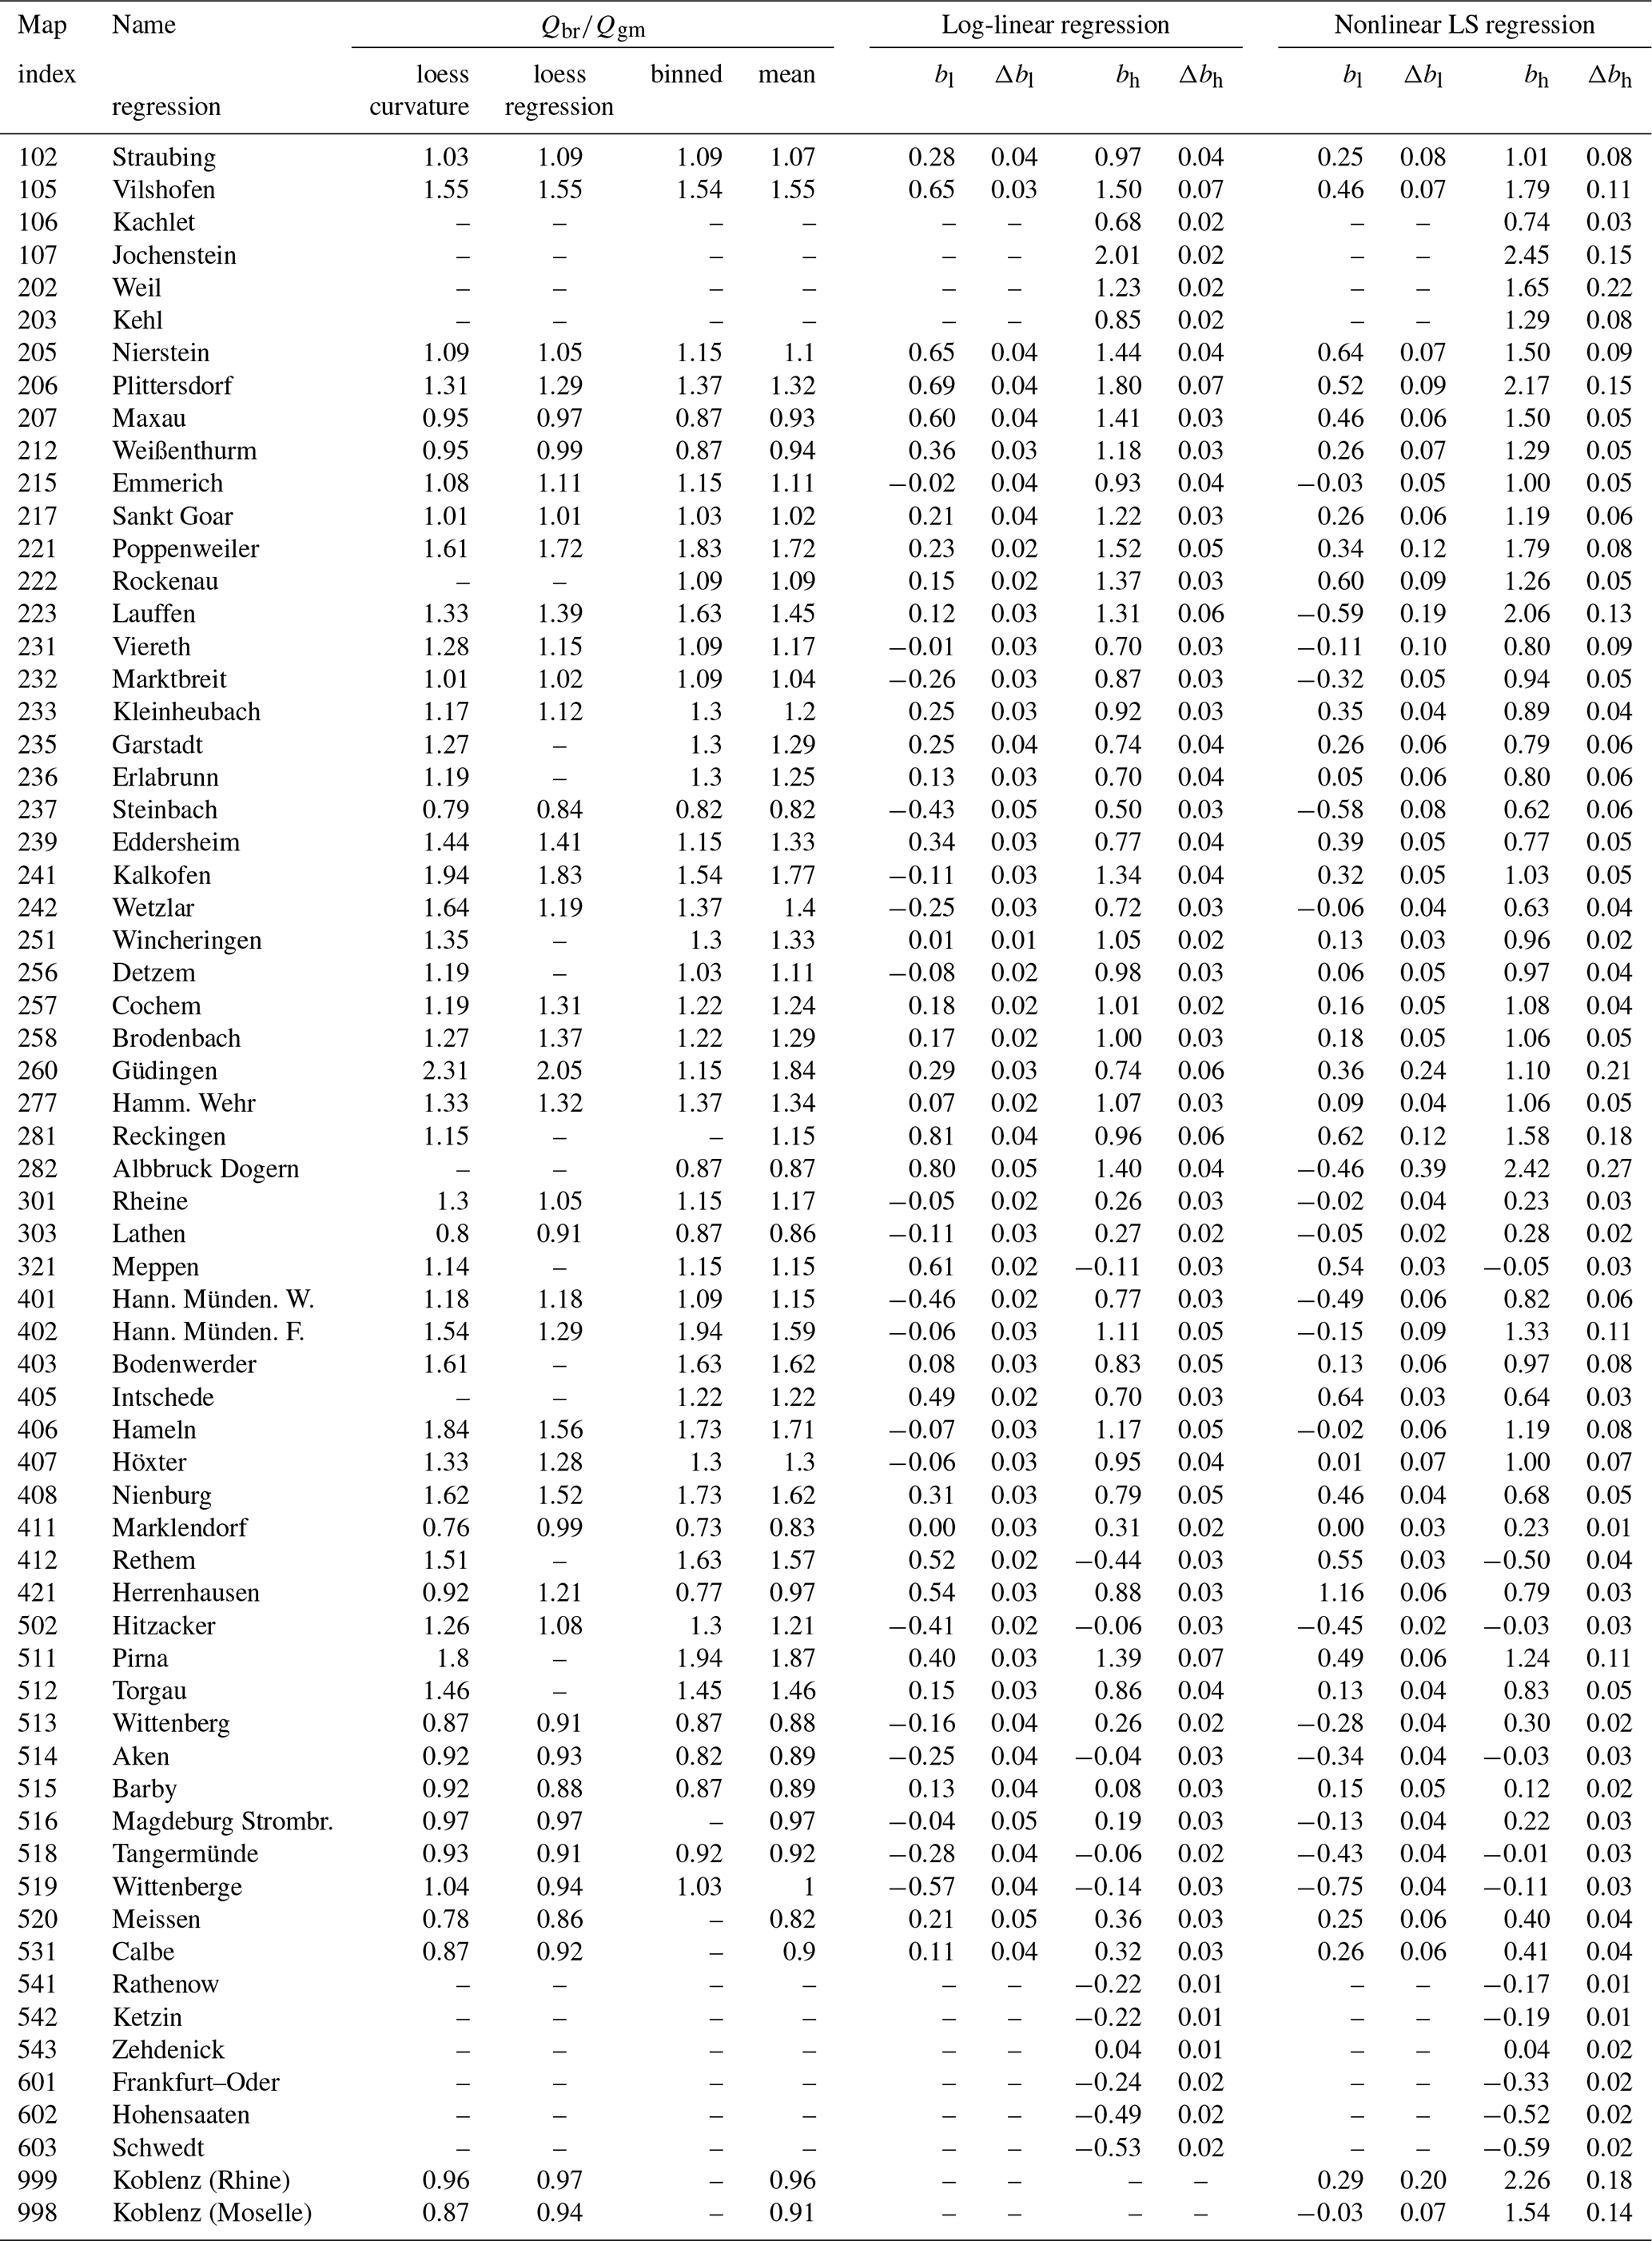
Table 2Results from rating break analysis and log-linear and nonlinear least-squares regression of the rating exponent (Eq. 2) above (bh) and below (bl) rating break (Qbr∕Qgm). Δbl and Δbh refer to the uncertainty of the rating breaks derived from the bootstrap analysis.
The rating relations for LOI, SSCorg, and SSCmin of the two stations at the rivers Moselle and Rhine in Koblenz were analyzed the same way (similar to Eq. 2) as the SSC at the 62 stations from the suspended sediment monitoring network.
3.1 Rating of the total suspended sediment
For 52 out of 62 stations, SSC–Q rating curves show a distinct break in scaling relation (for examples, see Fig. 3), with similar values for Qbr estimated from three different approaches (Table 2). For the remaining 10 stations, no distinct break point is detectable (Fig. 3). After visual inspection and removal of non-plausible break points of each station, we calculated the average Qbr for each station. In general, break points of the SSC–Q relation range , with 50 % of all values ranging between 0.9 and 1.3 (Fig. 4) (the mean Qbr over all stations is 1.2), indicating that the break points of many stations are slightly larger than the geometric mean discharge.
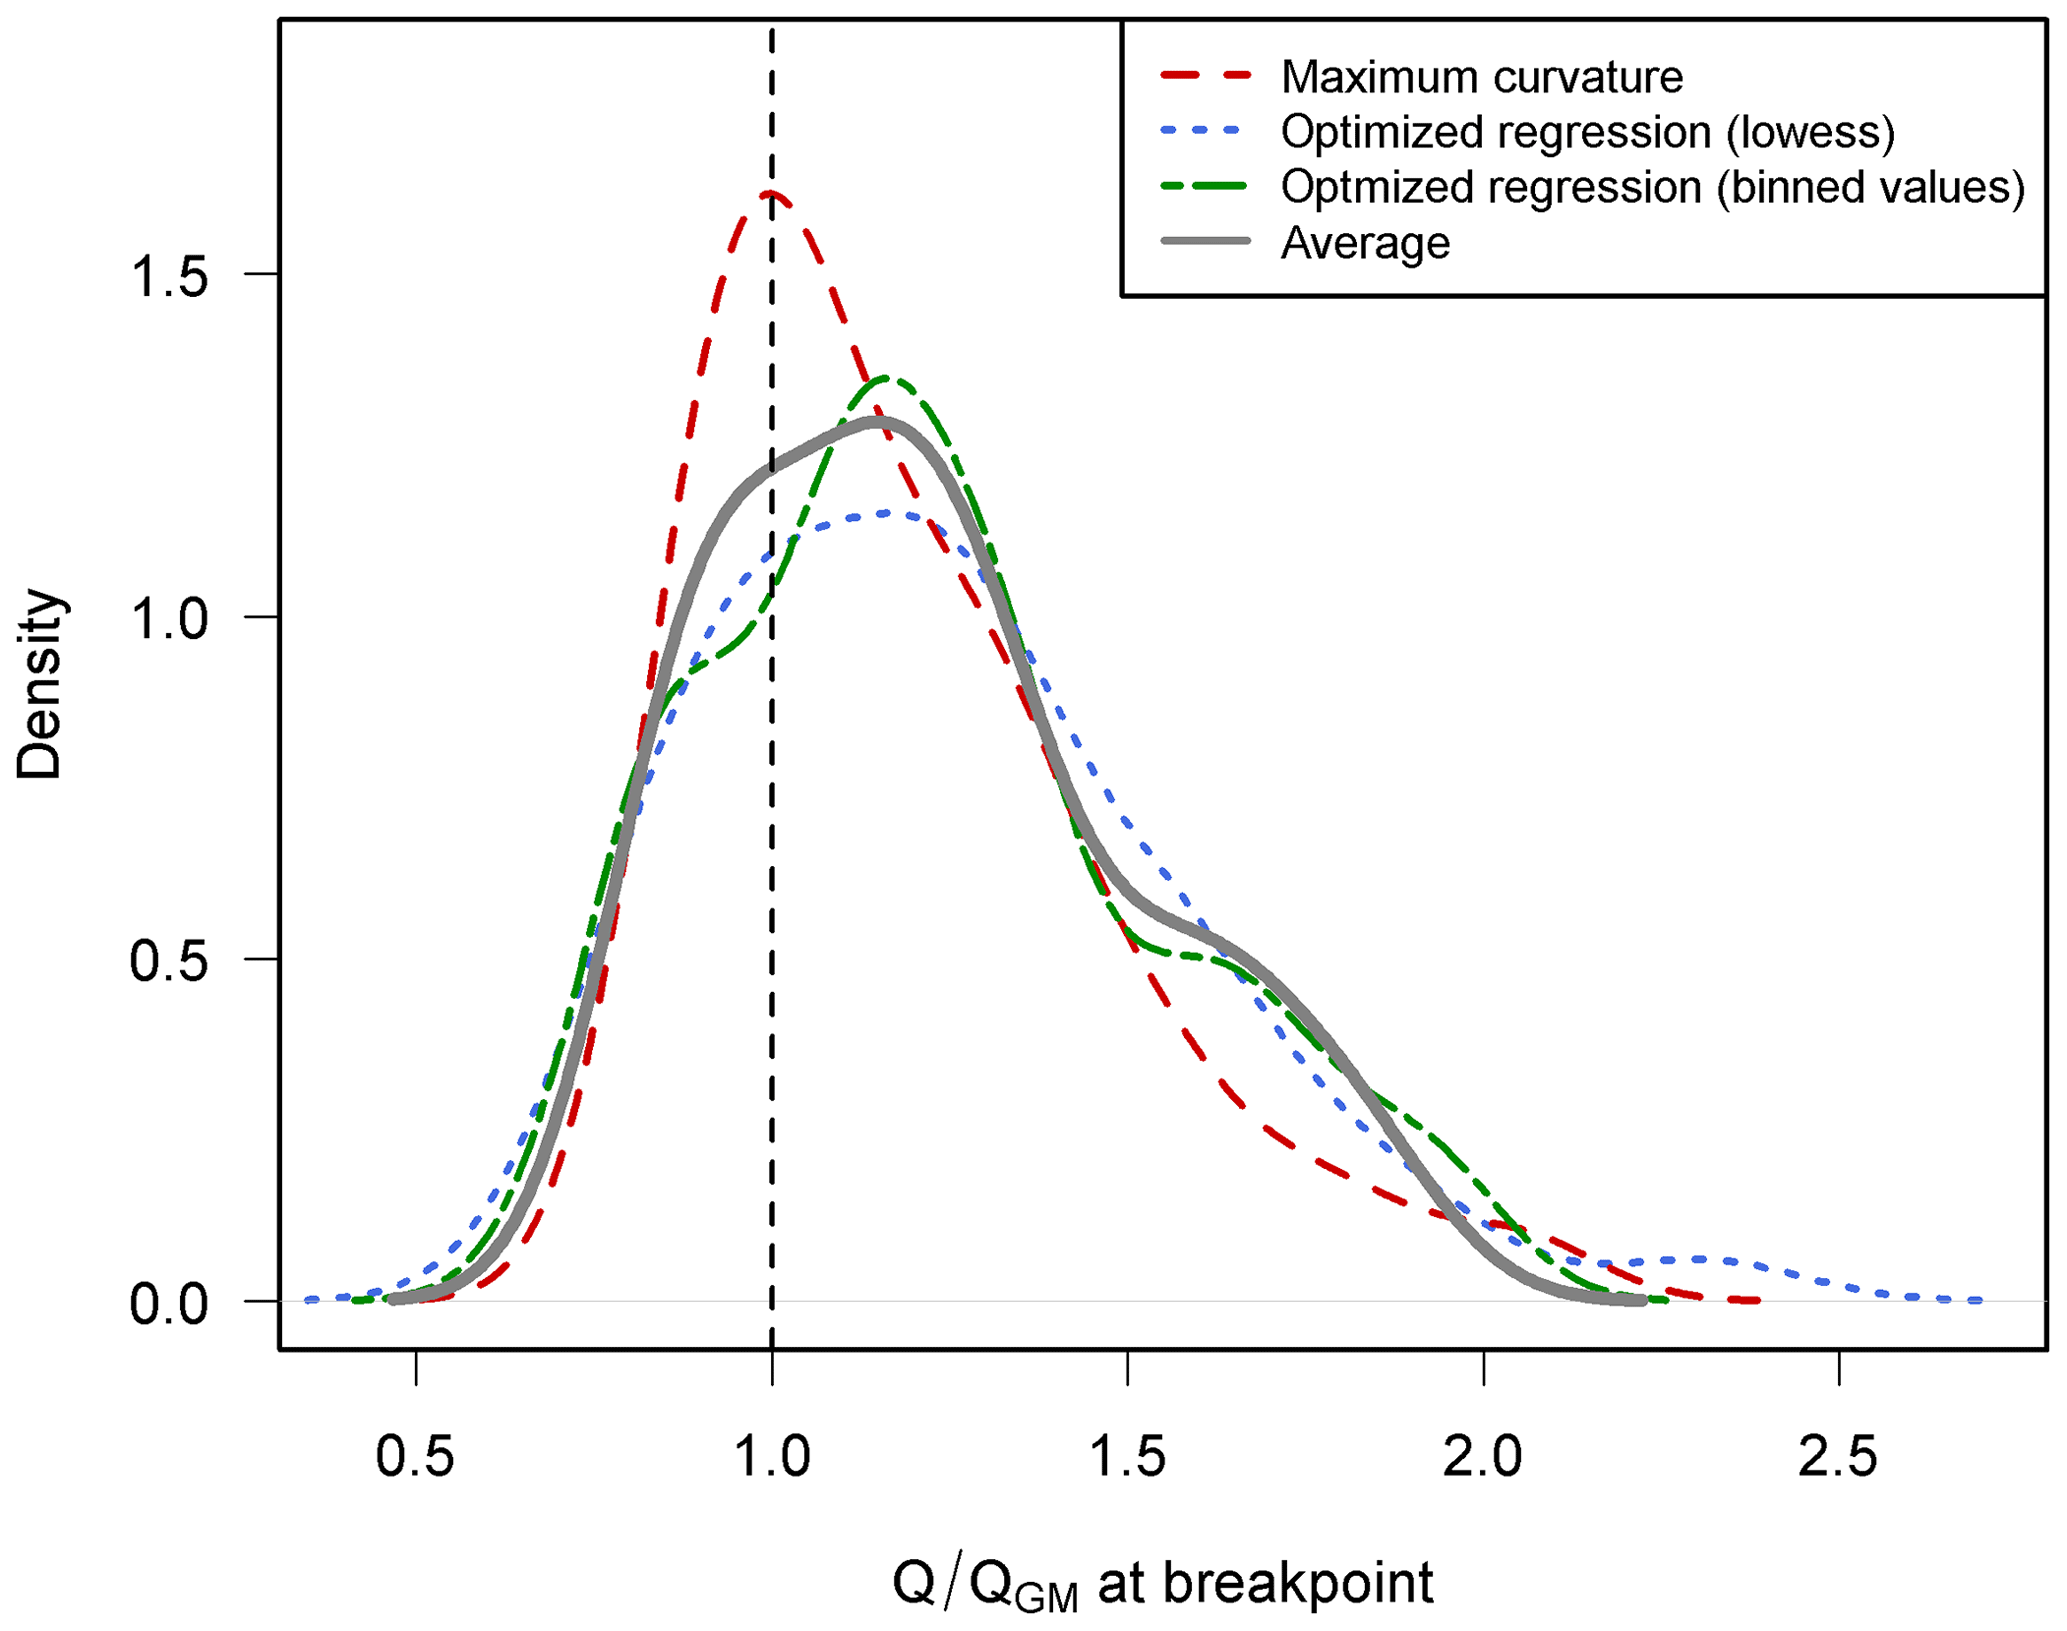
Figure 4Density distribution of rating breaks (Qbr) derived from the scaling analysis of the suspended sediment concentration. For detailed results, see also Table 2.
Rating exponents for the low flow regime (bl) range between −0.75 and 1.15 and for the high flow regime (bh) between −0.6 and 2.45. In general, the distribution of bl peaks close to the median bl=0.14 (see Fig. 5). SSC decreases as a function of Q (i.e., bl<0) at 19 stations and increases with Q at 33 stations; bh is <0 at 11 stations and >0 at 51 stations, with a median bh=0.83 (Fig. 5). A total of 23 stations are characterized by strong increases in SSC under high flow conditions (i.e., bh>1).

Figure 5Density distribution of rating exponents (following Eq. 2) for the low flow (bl) and high flow (bh) regime. The blue and red vertical dashed lines indicate the median values; the blue and red shaded areas indicate the 25th and 75th percentile of both rating coefficients.
Patterns of spatial distribution become apparent (Fig. 6) for the rating coefficients bl and bh. The highest bh values (positive rating in the high flow regime) are found along the Rhine and its tributaries, the Danube, and Upper Weser, while the rivers in northern lowland Germany (mainly the Ems, Elbe, and Oder rivers) show low bh values. This control is highlighted in Fig. 7b, which plots bh with respect to the fraction of hillslopes steeper than 10 % in the contributing catchment area. Catchments with a higher fraction of steep slopes generate higher bh values compared to the lowland rivers, indicating higher sediment supply in catchments with more extensive hillslopes with slope gradients > 10 %. Furthermore, the majority of the stations at the rivers Elbe and Oder, which are characterized by low annual rainfall in the contributing catchment, plot below the regression line. In contrast to bh, bl does not show a clear spatial pattern nor any relationship to the fractions of steep catchment areas (Fig. 7a).

Figure 6Maps representing the spatial distribution of the rating exponents. Panel (a) indicates bl and panel (b) indicates bh. Empty circles in (a) denote stations without a significant rating break.
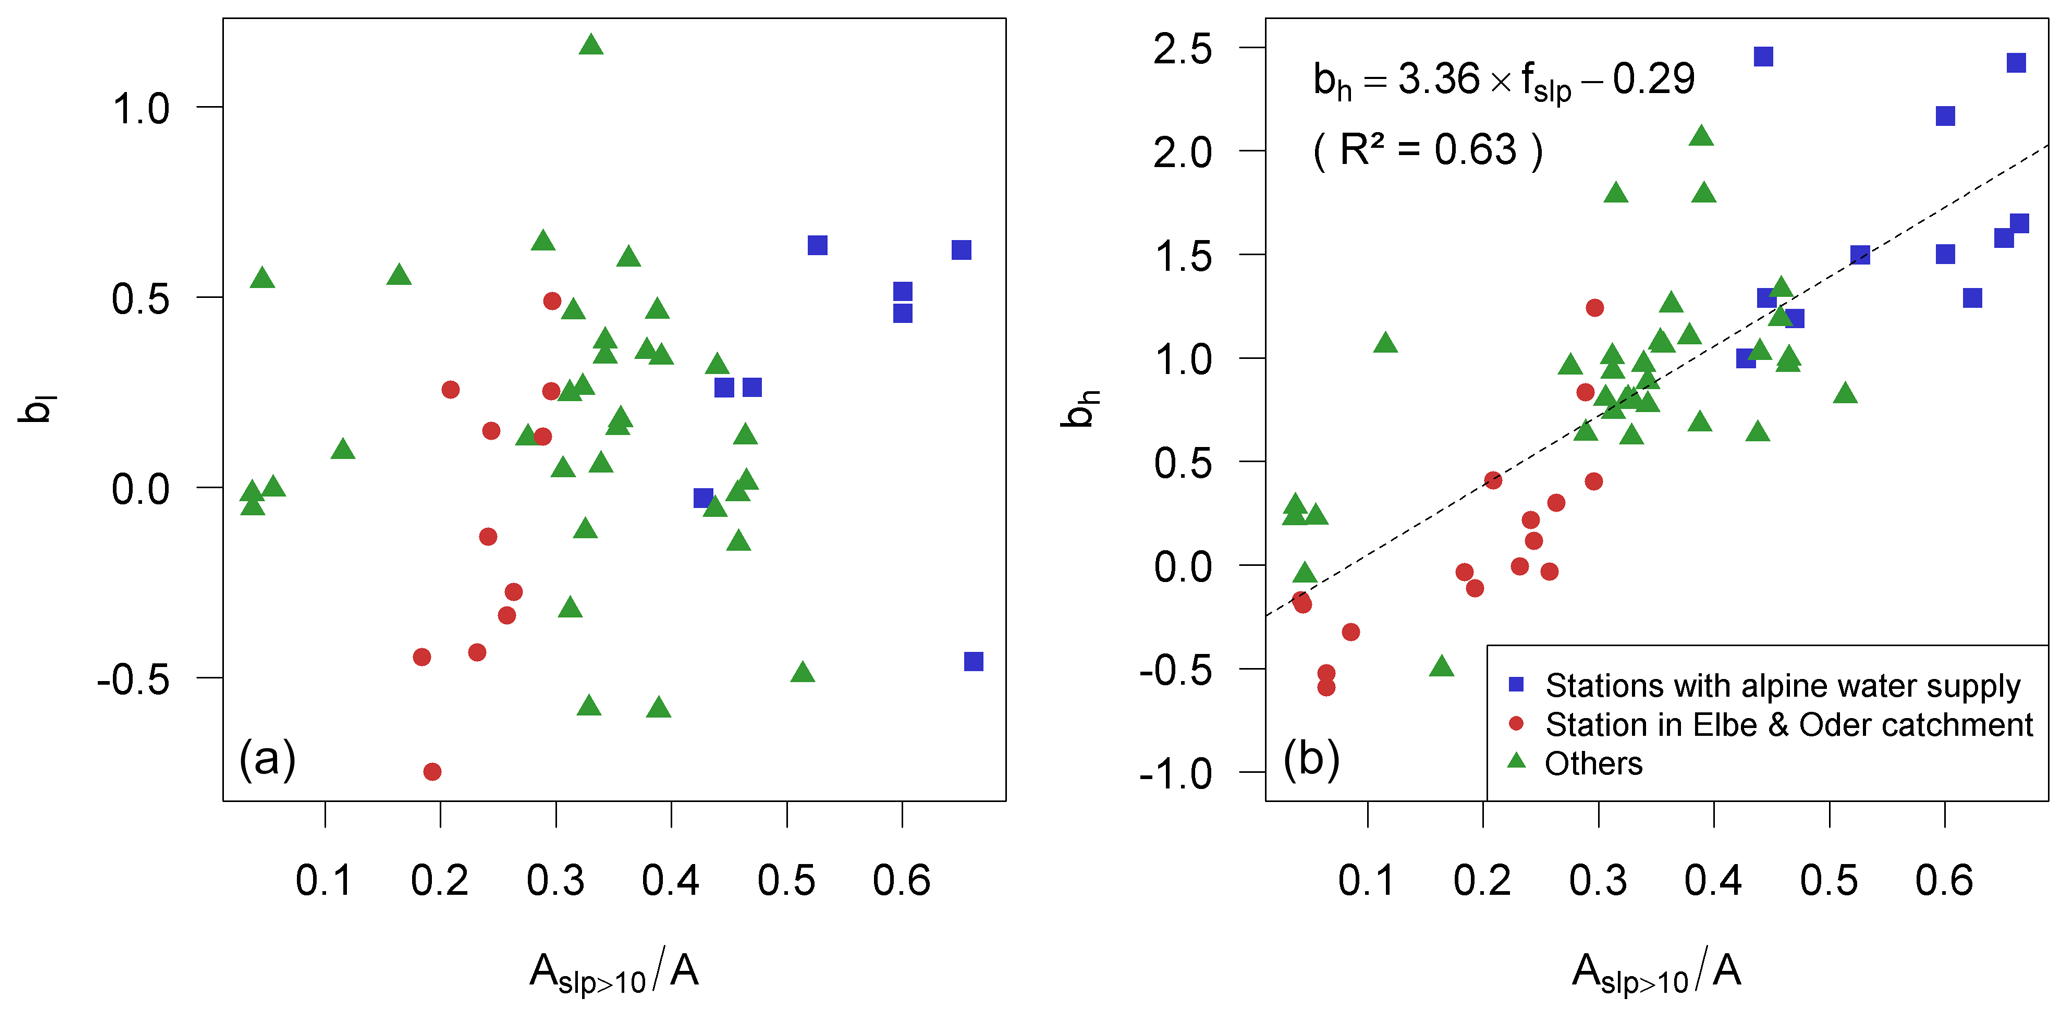
Figure 7Relation of rating coefficients (bl in a and bh in b) and the ratio of the catchment area with hillslopes steeper than 10 % (Aslp>10) vs. total catchment area (A).
3.2 Rating curves for the mineral and organic fraction
As noted above, LOI and Chl a were measured at the Moselle and the Rhine just upstream from their confluence in Koblenz based on weekly sampling from 1997 to 2017. Despite the lower sampling frequency (samples at the suspended sediment stations are taken on each working day), the shorter monitoring period (SSC monitoring started in 1964; Table 1), and a slightly different lab protocol, the rating behavior of total SSC for both stations is similar to the rating curves for the other SSC stations along the rivers Rhine and Moselle (Fig. 8a–d and Table 2): (i) rating breaks occur at 0.96 and 0.91 of the normalized discharge (Q∕QGM) for the Rhine and the Moselle, respectively, and (ii) the rating exponents bl (0.29±0.20 and for the rivers Rhine and Moselle, respectively) and bh (2.26±0.18 and 1.54±0.14 for the Rhine and Moselle, respectively) are similar to the other stations along the Rhine and the Moselle. However, the lower number of measurements at the LOI stations (approx. 1000 at each of the two stations) resulted in larger standard deviations of the parameter estimates (Δbl and Δbh) based on the bootstrap regression.
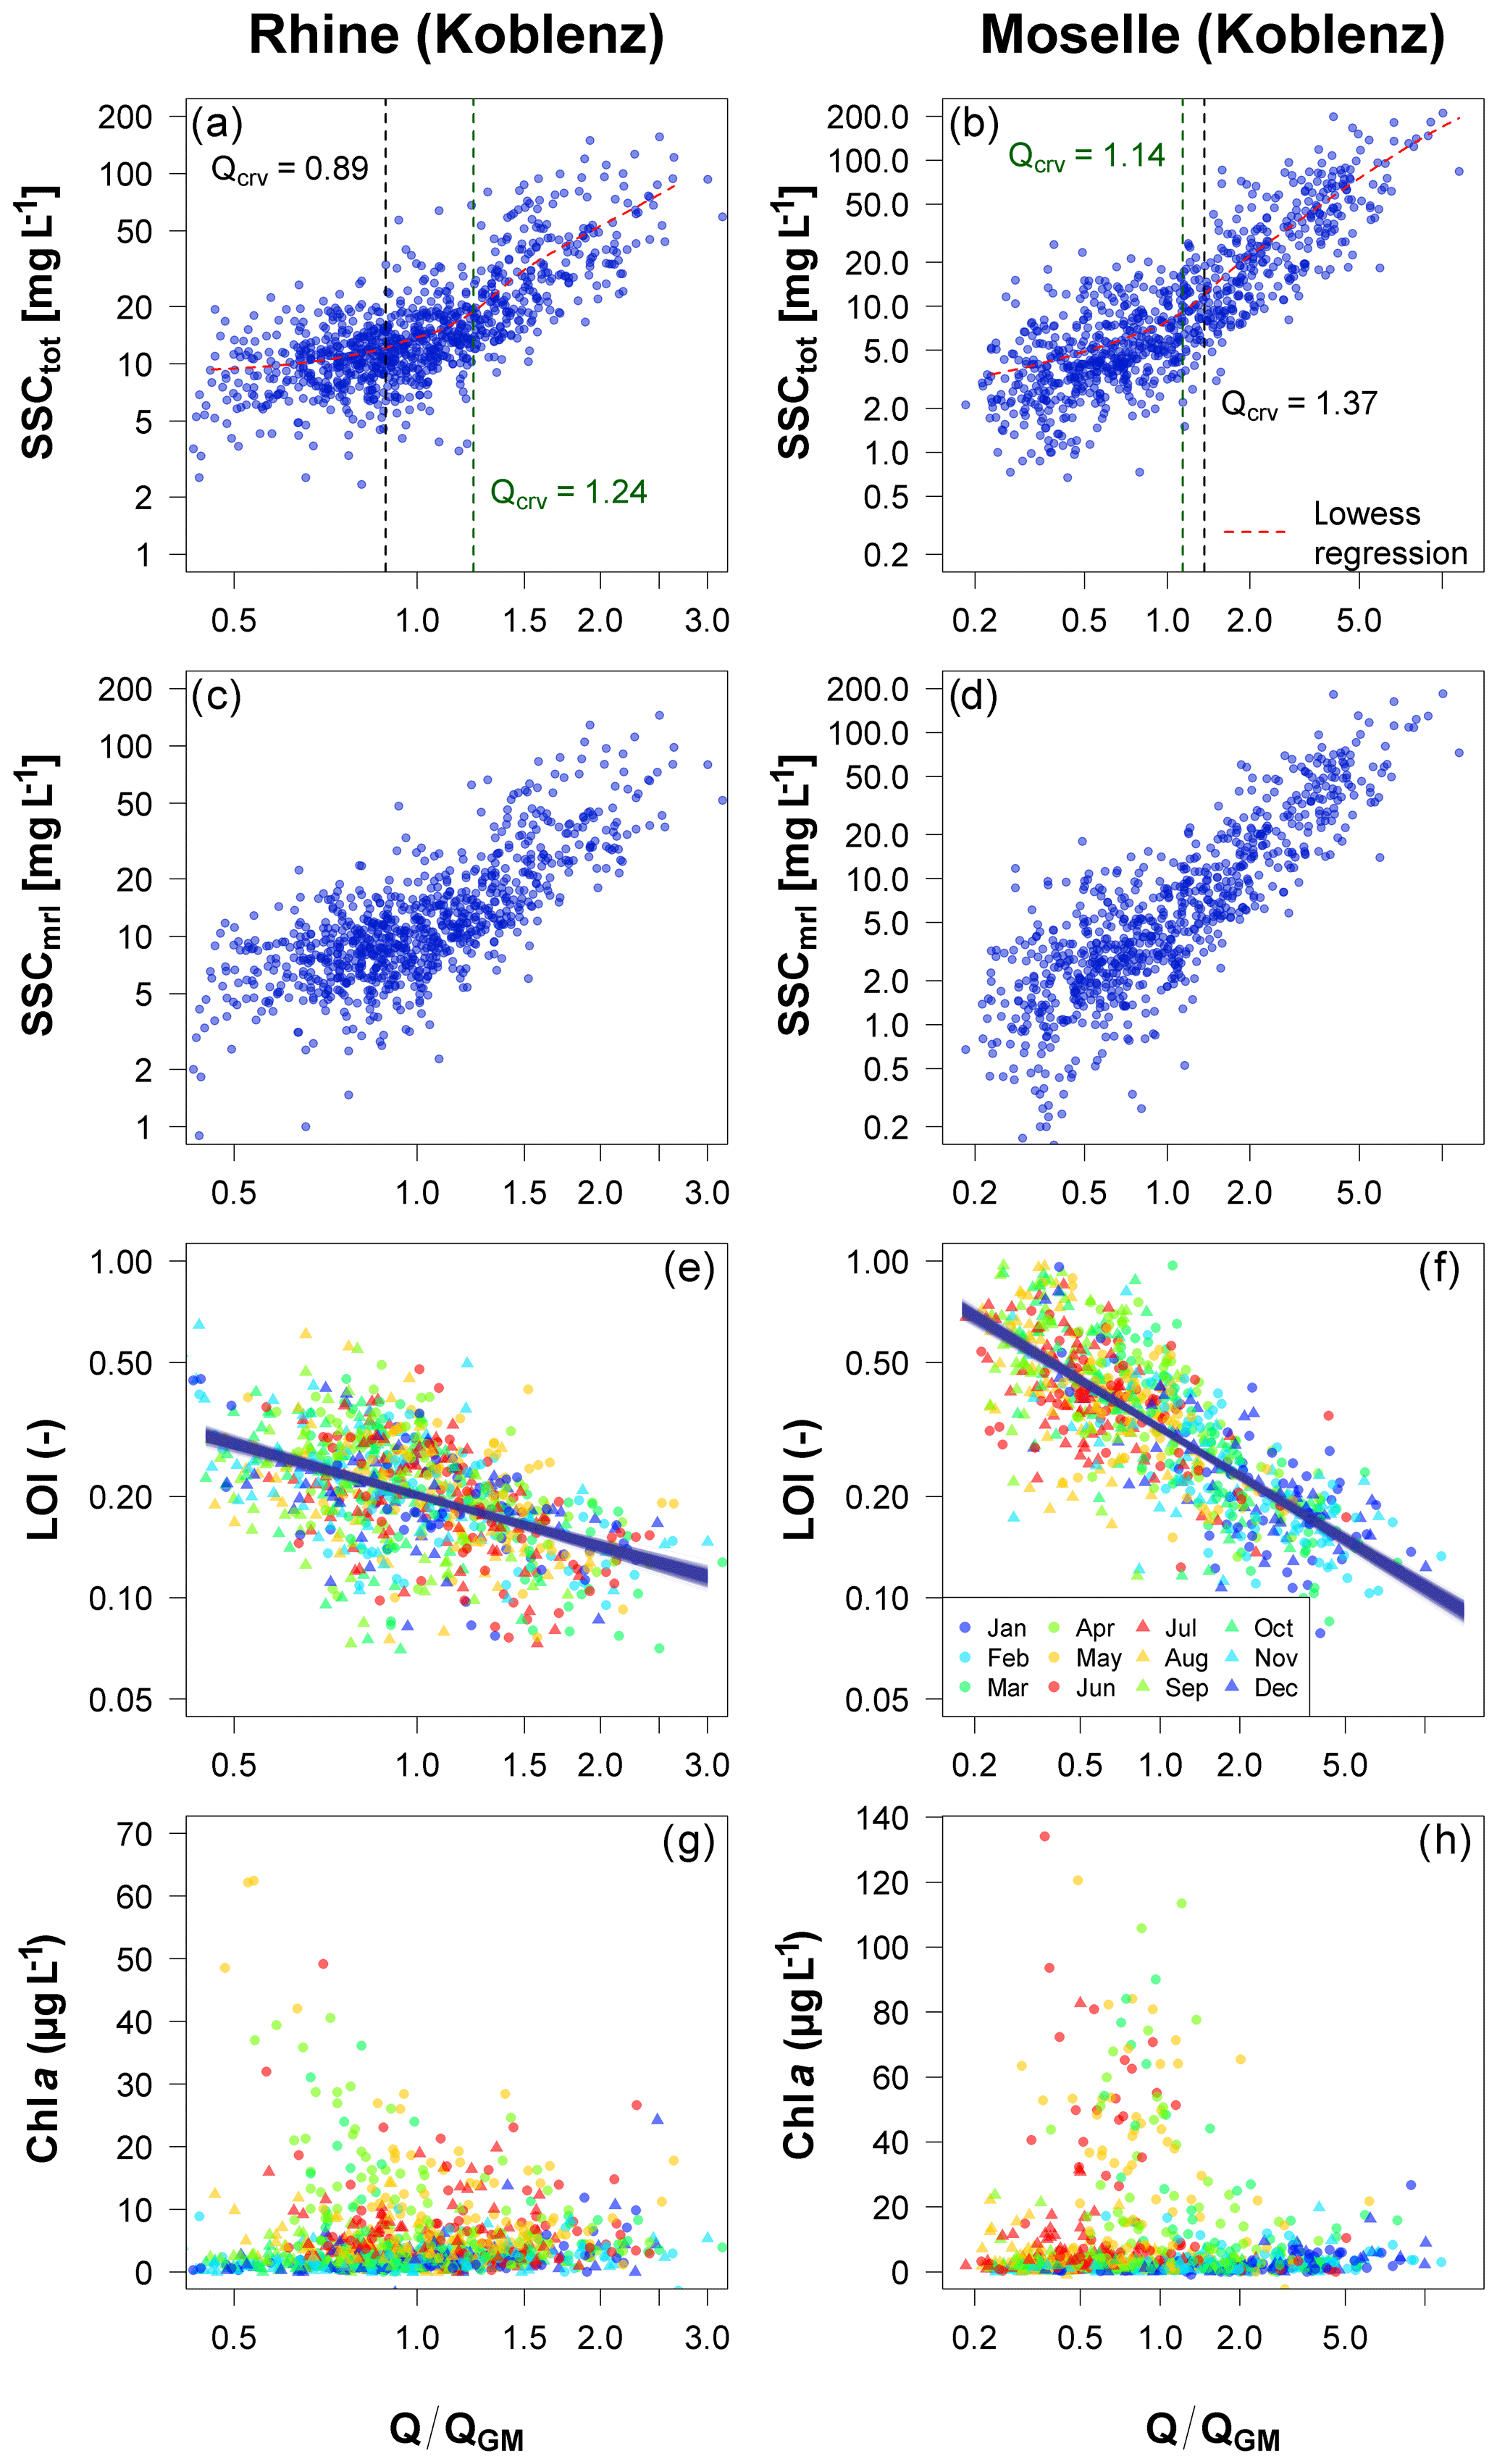
Figure 8Rating of total SSC (a, b), mineral SSC (c, d), loss on ignition (LOI, e, f), and chlorophyll a (Chl a, g, h) for the station Koblenz Rhine (a, c, e, g) and Koblenz Moselle (b, d, f, h). Blue lines on LOI scatterplots show regression results using 1000 bootstrap replicates.
Results from the LOI measurements of both stations show higher organic matter contents in the Moselle (mean LOI = 0.385) compared to the Rhine (mean 0.237). LOI negatively correlates with discharge at both stations (Fig. 8e and f). However, the relationship for the Moselle is much better constrained. High LOI values cluster during the summer months (April–September), while low LOI values are more prominent during winter months (Figs. 8e, f and 9). Based on the bootstrap regression, a single power law () was fitted to the LOI data, resulting in rating exponents b of and and a coefficients of 0.202±0.003 and 0.319±0.006 for the Rhine and the Moselle, respectively.
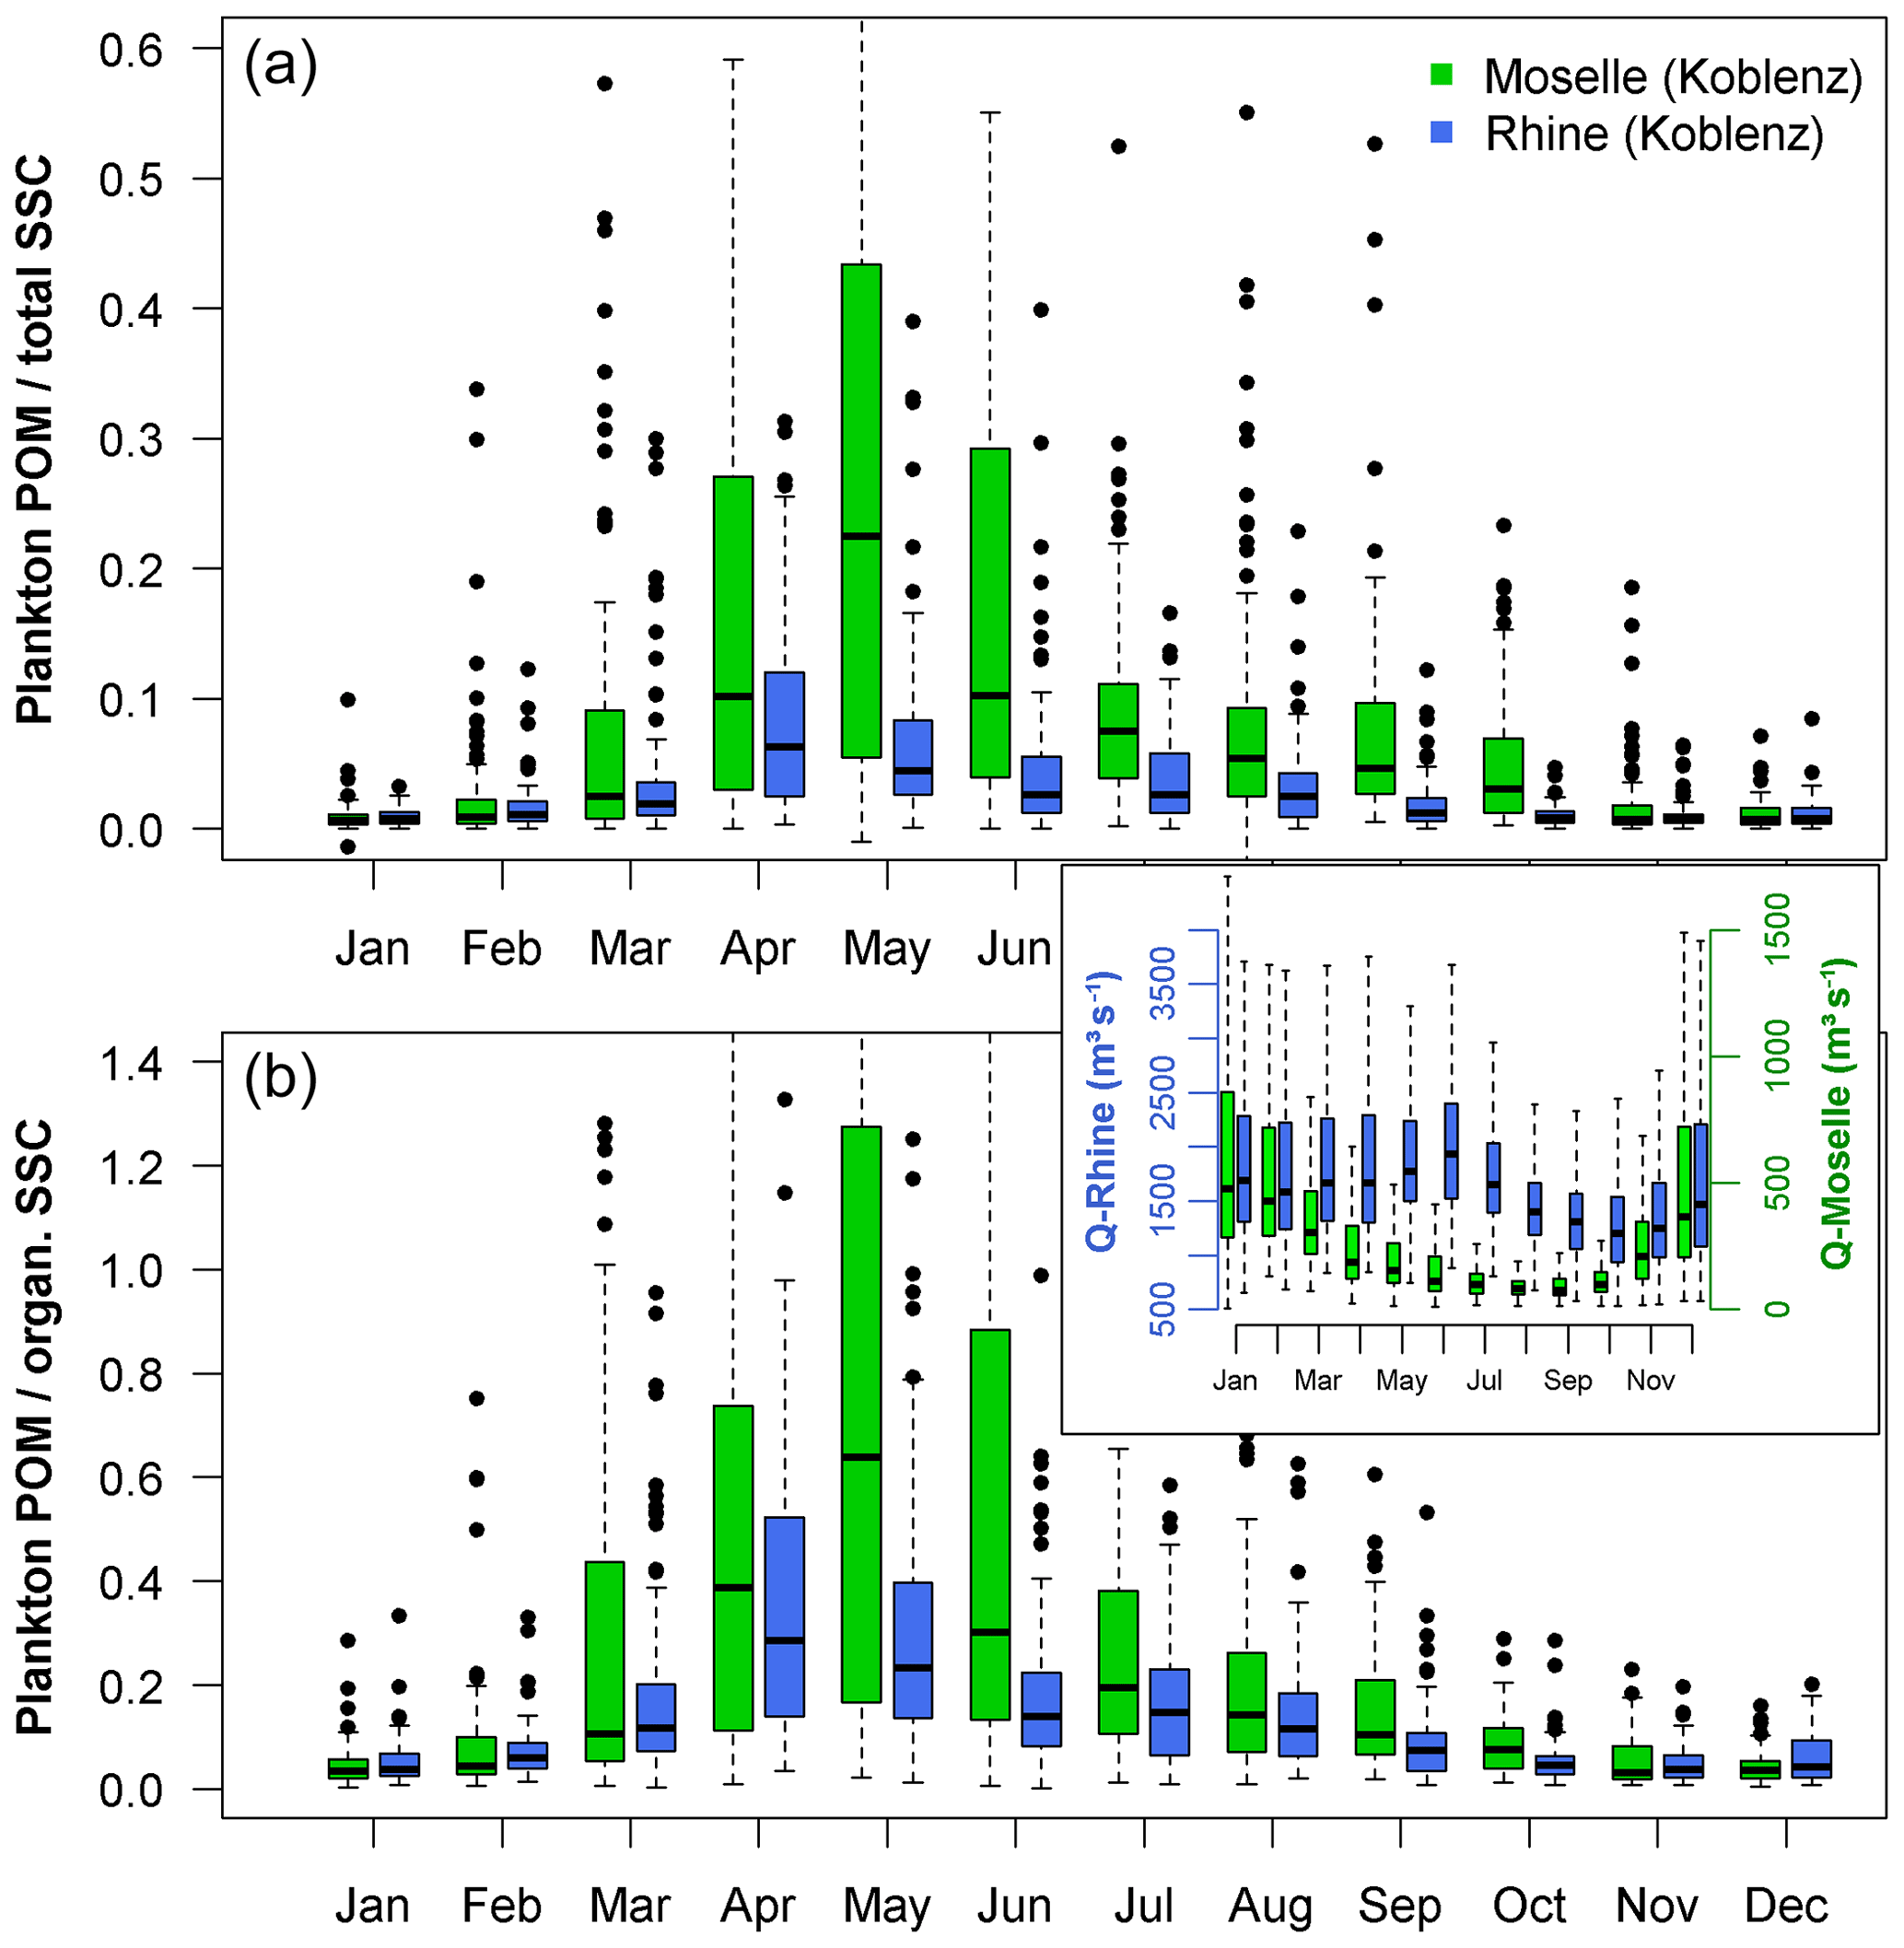
Figure 9Box plot of the seasonal variation of plankton POM with respect to total SSC (a) and organic SSC (b) for the stations Koblenz Rhine (blue) and Koblenz Moselle (green) from 1990 to 2017. Organic SSC is derived from LOI measurements, and plankton POM is calculated from Chl a measurements using a POC ∕ Chl a ratio of 40 and a POC ∕ POM ratio of 0.42. Plankton POM ∕ organic SSC ratios > 1 are due to measurement errors of Chl a, and those for LOI are due to simplified conversion ratios. The inset shows the box plot of seasonal discharge variations at both stations.
Based on the total SSC and LOI, the mineral fraction of suspended sediment () was calculated. SSCmrl increases with discharge for both stations (Fig. 8c and d). Yet the variability for any given discharge is large (ranging approximately an order of magnitude) and increases at lower discharges.
In contrast to the LOI, Chl a does not show significant changes with discharge. Figure 8g and h show dominantly low Chl a values for the Rhine and Moselle. Increased Chl a values are mainly limited to lower discharges (). Higher Chl a values occur only during moderate flows in spring and summer. Chl a values in the Rhine peak in April and in May at the Moselle (Figs. 8 and 9).
Sediment rating analysis is challenged by the large scatter of single SSC measurements, which frequently range 1 order of magnitude around the regression lines. The scatter arises from hysteresis effects during single floods and from seasonal variations of discharge and suspended sediment supply as well as long-term changes. Regression lines calculated in this study represent the average conditions at the gauging stations during the monitoring period (covering at least 10 years and at maximum 55 years; see Table 1). Therefore, we ignore long-term changes in Q and SSC, which could be caused by climate and land use change or by changes in river management. Long-term trends of SSC likely involve declines in SSC for many stations along German waterways (see, for instance, Hillebrand et al., 2018). This change will likely have an impact on the a coefficient (which represents the normalized SSC at QGM). However, from work in progress, we know that the rating exponent b (which is the focus of this paper) is not affected by the long-term changes, but only the uncertainty in the estimate of b will increase.
The use of commercial coffee filters, with a rather large and not clearly defined mean pore diameter, is certainly not optimal for the measurement of SSC. Comparisons of annual suspended sediment load estimated based on the coffee filters and cellulose acetate filters, with a well-defined pore diameter of 0.45 µm, indicate that measurements based on coffee filters are underestimated by 20%, which is on the order of the clay fraction of the suspended sediment (Hillebrand et al., 2015). Since the clay fraction does not change as a function of discharge (Hillebrand and Frings, 2017), we assume that the rating analysis is not affected by the choice of the filters; the limitations that are associated with the larger uncertainty of single SSC estimates are compensated for by the larger number of measurements, which were feasible due to the low-cost filter system. This assumption is supported by the use of the glass-fiber filters for the two LOI stations at the Rhine and the Moselle, which show the same rating behavior as the suspended monitoring stations (see Sect. 4.2). Furthermore, the monitoring approach did not change during the monitoring period, and therefore long-term changes due to the sampling and lab analysis can be discarded.
4.1 Controls on rating behavior of suspended sediment
The sediment rating concept, which expresses suspended sediment concentration (SSC) or suspended sediment load (Qs) as a function of discharge (Q), is based on the assumption that factors controlling the generation of runoff in the catchment are closely linked with factors controlling the sediment supply to the river channel (Gray, 2018). This is certainly the case if rainfall produces erosive surface runoff, which in turn results in sheet, rill, and/or gully erosion (e.g., Poesen, 2018); the presence of this process chain is supported by the majority of the rating curves presented in this study: 51 of 62 stations show a clear increasing trend with a positive rating exponent in the high flow regime, which is attributed to the production of surface runoff and strong sediment supply through sheet and rill erosion. A positive rating exponent of the SSC–Q relation implies that the sediment load increases “faster” than the discharge (e.g., sediment load increases more than twofold if discharge doubles). This follows from the following equation:
which indicates a rating exponent > 1 for the Qs–Q relation for b>0, as shown for most stations. However, if sediment load increases “faster” than the discharge, additional sediment sources (either external or internal) must be mobilized as discharge increases. Rivers showing rapid increases in SSC (and thus Qs) are termed “reactive” rivers by Syvitski et al. (2000). The (re)activation of sediment sources can be mainly explained by the extension of areas of water-saturated soils, which contribute to surface runoff and discharge and thus increase the connectivity during rainstorm events (Bracken et al., 2013; Fryirs, 2013). Since topography (especially hillslope gradient, path lengths, and surface roughness) exerts a dominant control on hydrological and sediment connectivity (Baartman et al., 2013; Heckmann et al., 2018; Hoffmann, 2015), a strong relationship between the rating exponent and the topographic characteristics of the catchments can be anticipated (Gray, 2018; Syvitski et al., 2000). Our results show a clear trend of increasing bh as the fraction of steep hillslope (i.e., slope gradients > 10 %) increases, thus confirming the expectation. Thus, high bh values are observed at gauging stations with discharge contributions from the European Alps (e.g., the Danube below Jochenstein and the Rhine) and from tributaries with mountainous catchment topography (e.g., the Neckar and Moselle catchments). The strong control of the slope gradient of the contributing catchments indicates that additional sediment sources, which are mobilized during increasing discharges, are primarily located on hillslopes (i.e., external sediment sources), and sediment sources within the river play a minor role. Our results that show steeper rating curves for the Rhine tributaries than the Rhine itself are confirmed by the results by Asselmann (2000), which were obtained from a limited number of stations, with tributaries showing steeper rating curves than the larger river Rhine. In Taiwan, Hilton et al. (2012) observed a similar trend for the gradient of the relationship between particulate organic carbon (POC) concentration and discharge, which increased with the proportion of catchment area steeper than 35∘. This hillslope gradient is frequently considered a threshold for mass-wasting and erosion process, indicating that additional sources in mountain systems are provided as threshold hillslopes become more widespread.
While bh is dominantly controlled by topography, Fig. 7b also indicates a climatic control on the rating exponent in the high flow regime. Interestingly, most stations from the Elbe and Oder catchments plot below the regression line in Fig. 7b. This indicates that the Elbe and Oder show lower bh values for a similar fraction of slopes steeper than 10 % compared to the general trend. Assuming similar catchment topographies for a specified percentage of catchment area steeper than 10 %, the lower bh values are mainly explained by climatic differences. The dry continental climate in the Elbe and Oder catchments likely reduces the reactivity of the river systems, requiring larger increases in rain and discharge to increase the specific sediment supply in these basins compared to basins with higher and/or more frequent precipitation in the western part of Germany. The lower reactivity may be explained by the general tendency of lower antecedent soil moisture in more continental climates, and thus a slower increase in water-saturated soils, that increases the sediment connectivity during rainstorm events (Bracken et al., 2013; Fryirs, 2013). Furthermore, sandstone in the Thuringia Forest in the Elbe headwater and extensive glacio-fluvial deposits along the Elbe and the Oder may be more porous and generate less runoff than the schists in mountains and highlands along the Rhine and in central western Germany.
The break of the rating behavior, which is observed for 52 of the 62 suspended sediment stations along German waterways, implies a change in processes and/or factors controlling suspended sediment in river channels at the transition from low to high flow regimes. A similar scale break has been shown along the Rhone river in France by Poulier et al. (2019). Interestingly, the break for most stations in this study occurs at , which is roughly equivalent to or . The fact that the break is close to the median discharge implies that river discharge is occurring approximately 50 % of the time in the low flow rating regime and 50 % in the high flow rating regime.
In contrast to bh, there is no simple relation of the low flow rating exponent bl to the topographic characteristics of the contributing catchment (Fig. 7a). This result is not unexpected, given the fact that hillslopes during low flow conditions do not contribute significantly to runoff and suspended sediment in the river channel, but discharge mainly results from groundwater supply. Thus, the transition from bl to bh likely reflects a change in the factors controlling suspended sediment supply, which is likely associated with the transition from high autochthonous organic matter content at low flow to dominantly allochthonous mineral content at high flow (compare also Sect. 4.2 and 4.3).
Many of the tributary waterways of the Rhine, and the Upper Rhine itself, are controlled by barrages to support navigation during low flow and to supply energy. Thus, the operation of barrages and the management of water flow are potential factors controlling the rating break. Reservoirs upstream of the barrages act as sediment sinks for cohesive fines during low flow conditions (Hoffmann et al., 2017). During high flows, weir shutters are opened to prevent damage to the barrages and to control floods. Significant amounts of fine cohesive sediments can be potentially remobilized during high flows if critical shear stresses at the reservoir bed can exceed the shear strength of the cohesive fines. However, in most cases weir shutters are only opened during floods, implying resuspension of cohesive sediments only at discharges much higher than Qavg. Furthermore, preliminary evidence indicates that reservoirs upstream of weirs act as sediment sinks, especially during high flows when large amounts of sediment are transported (Hoffmann et al., 2017). Given that the prominent rating break occurs at lower discharges (i.e., at or ) than those discharges which potentially resuspend cohesive sediments in the upstream reservoirs, barrage operation does not seem to control the rating break. Furthermore, the rating break is also observed in free-flowing waterways (without barrages), pointing to controlling factors not related to the management of the weirs or reservoirs.
Therefore, the question of which factors control the rating exponent at low flows and the transition of the rating behavior at average discharge remains. Our data show that the contribution of organic suspended matter to total SSC may play a crucial role in the SSC rating at low flows.
4.2 Controls of the mineral vs. organic fraction of the suspended sediment
Here we use LOI as a measure of the organic fraction of the total suspended solids. Results from the LOI measurements at the two stations in Koblenz show generally higher LOI values at the Moselle (where LOI > 0.5 is frequently observed) compared to the Rhine, where LOI rarely exceed 0.5 (less than 1 % of all measurements). Both stations reveal a significant control of discharge on LOI. Negative rating exponents of and for the rivers Rhine and Moselle, respectively, indicate a declining organic matter fraction with increasing discharge (Fig. 8). At the Moselle, declining trends are partially explained by seasonal effects, with low discharges and high LOI dominating in summer and high discharges and low LOI dominating in winter months (Figs. 8 and 9). However, along the Rhine, seasonal trends are much less pronounced, and LOI values scatter more strongly around the regression line in Fig. 8e compared to those of the River Moselle (Fig. 8f). The decline of LOI with Q (Fig. 8e and f) is equivalent to a decline of LOI with SSC, as Q and SSC are strongly related (Fig. 8a and b). These results are similar to those from global compilations of riverine POC (Meybeck, 1982; Ludwig and Probst, 1996), wherein the strong decline of POC with SSC reflects the degradation of soils that increases with the mechanical erosion of the catchments (which is associated with high SSC). However, the rating relation of LOI or POC to SSC or Q for single river systems is more likely linked to shifts of OC sources at various discharges (see, for instance, Gomez et al., 2003; Goñi et al., 2014; Hilton et al., 2012; Moreira-Turcq et al., 2013). In the Erlenbach catchment (Switzerland), Smith et al. (2013) found declining POC levels with increasing discharge, which are related to the dilution of POC for . Above this threshold additional POC is supplied through the erosion of organic-rich topsoils (from wetlands and alpine meadows), and the percent of POC increases with Q. This shift from a negative to a positive rating curve of POC is related to a dominant supply of low-OC bedrock during low flow and a supply of OC-rich topsoils at high flow through surface runoff.
The organic carbon content of topsoils in the Moselle and Rhine catchments typically ranges between 2 % and 12 % (Jones et al., 2005). The values are similar to the LOI values at high flows in both rivers, on the order of 0.1. Thus, negative rating exponents of LOI indicate that suspended matter at low flow is enriched in organic carbon and diluted when it is swamped by mineral and catchment-derived OC (with low LOI ∼ 0.1) at high flow. Enrichment of OC at low flow highlights the primary control of low flow dynamics, with increased water and plankton residence time, on LOI. In addition to the controlling flow dynamics, higher LOI during spring and summer months shows the positive effect of water temperature and light availability on plankton growth (Cloern, 1999), which may dominate the total suspended organic matter in the river Moselle at Koblenz, especially during April and May (Fig. 9) (Hardenbicker et al., 2014). Under warm low flow conditions, increasing discharges rapidly dilute high concentrations of autochthonous carbon, causing a decline of total suspended sediment (which is dominated by the organic fraction under warm low flow conditions) as evidenced in early summer 2011, which was characterized by exceptionally low discharge of the Rhine in May and June (Hardenbicker et al., 2016). While a positive correlation between SSCtot and Q was observed for most of the year in 2011 in the Rhine at Koblenz, SSCtot relates negatively with discharge during these low flow months, indicating a shift in the SSC regime as phytoplankton dominates the organic suspended fraction.
At stations where the organic fraction of SSC generally adds a substantial share to the total SSC (e.g., as in the case of the Moselle, where LOI reaches 60 % at low flows), the rating exponent bl is negative. For instance, Hardenbicker et al. (2016) reported for the Elbe that LOI and Chl a contributions to SSC increased with distance downstream, which is associated with a downstream decrease in bl (Fig. 6a). Furthermore, low LOI levels in the upper and middle Rhine are characterized by higher bl values (∼0.5). Thus, our results indicate that the suspended sediment rating at low flows is strongly controlled by intrinsic (within-channel) processes that govern the formation of organic matter within the river channel: organic-rich streamflows are generally characterized by bl values close to 0 or <0, while organic-poor channels typically show bl>0.5.

Figure 10Statistical modeling of the total suspended sediment concentration (SSCtot, c) based on the positive and negative power-law rating of the mineral fraction of SSC (SCmrl, a) and the loss on ignition (LOI, b), respectively.
4.3 Modeling of the total suspended sediment
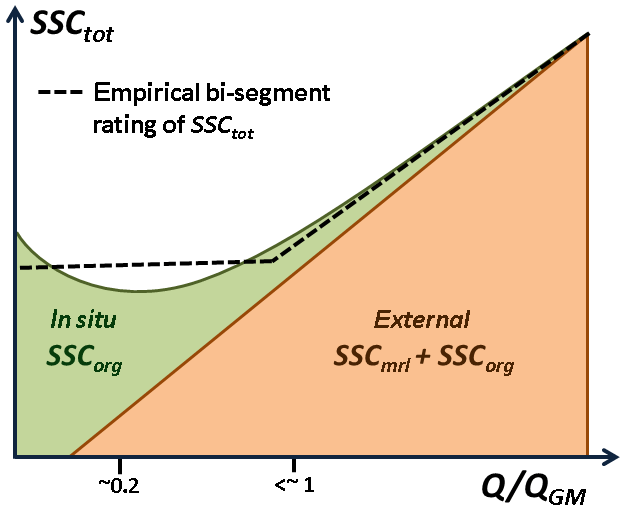
The presented data indicate that the observed rating break of the total suspended sediment concentration is mainly controlled by the transition from the autochthonous production of organic suspended matter at low flows to the allochthon supply of (dominantly mineral) suspended matter during high flows. Our results suggest that SSCmrl and LOI can be modeled separately using a power-law rating relation. If the rating behavior of SSC and is known, the organic and total suspended sediment concentration can be estimated separately:
Using the bootstrap regression of the LOI station at the river Moselle, with SSC and , the modeled SSCtot (Fig. 10) shows the following features: (i) at very low discharges (, which is rarely observed at the Moselle), SSCtot typically declines with increasing Q; (ii) at higher discharges, SSCtot increases with discharge; and (iii) the gradient of the modeled SSCtot lines continuously increases with Q and approaches the rating exponent of the mineral SSC fraction at high Q∕Qgm. This model result generally agrees with the measured SSCtot values. The decrease in the modeled SSCorg values at very low discharges supports the notion that the organic fraction of the suspended matter is affected by dilution effects. The dilution effect of autochthonous organic matter is outpaced by an increased (allochthon) supply of organic matter, which leads to increasing SSCorg at higher discharges as a result of a strong supply of organic-rich topsoils through surface runoff and soil erosion.
Empirical sediment rating curves show distinct rating breaks slightly above for most stations. In contrast, the suspended sediment rating relation of the modeled SSCtot based on Eq. (4) changes more gradually (i) from negative relations at very low discharges, (ii) to slight increases in SSCtot at low to medium (average) discharge, and (iii) to strong increases in SSCtot with Q∕Qgm at high discharges. The gradient of the modeled SSCtot at high discharges approaches the rating exponent of SSCmrl, which is similar to the rating exponent bh in the high flow domain above the rating break. Assuming that ah and bh are mainly controlled by the mineral fraction of the suspended sediment, we argue that the rating of the high flow regime can be used as a first-order approximation of the SSCmrl at low flow conditions and that the excess of SSCtot compared to the modeled SSCmrl is primarily explained by the organic fraction of the suspended sediment (compare Figs. 10 and 11). Differences between bh (i.e., the rating at high discharge) and the rating of SSCmrl may be partially explained by the organic fraction of suspended sediment that is not derived from in situ (autochthonous) organic matter but is supplied from hillslopes through the erosion of organic-rich topsoils.
In the case of the river Moselle, our results indicate that SSCtot exceeds SSCmrl by a factor of ∼1.5 to 2 at discharges smaller than QGM. Thus, monitored suspended sediment yields, which are mostly based on estimates of the total SSC, overestimate the mineral fraction of SSC at low to moderate flows. The frequency analysis of the long-term suspended monitoring data at the Rhine station at Koblenz, which integrates the organic and mineral fraction of the suspended matter, shows that roughly 50 % of the total annual suspended load is transported in 10 % of the time during floods. Due to the inclusion of organic matter and the resulting overestimate of the (mineral) suspended sediment at low to medium flows, floods are likely to be more important in the transport of the mineral fraction of the suspended load than otherwise estimated. In the case of a clear rating break, our conceptual model separating the rating at low and high flows due to the shift of the process regime can be used to separate the organic and mineral fraction and give a first-order estimate of the autochthonous organic fraction of the total SSC.
In the case of a substantial contribution of organic SSC to the total SSC, our results suggest that the common practice of using a continuous sediment rating relation results in large errors that can be reduced. These errors potentially influence regression results at high SSCs, generally leading to an underestimate of SSC based on continuous rating curves. Much better results for the prediction of SSC and hence sediment load can be achieved by applying rating relationships that include rating breaks.
The findings are likely to be representative for other large river systems, with similar suspended sediment and nutrient loadings. However, more work is needed to see if the conceptual rating model can be applied to other large river systems with strong human interference in the sediment and nutrient supply.
Using more than 750 000 suspended sediment and discharge measurements at 62 gauging stations along 19 waterways in Germany and more than 2000 measurements of the loss on ignition of suspended matter at two stations along the rivers Moselle and Rhine, we performed a detailed rating analysis of suspended matter and its organic content. Our main findings may be summarized as follows.
-
For most studied gauging stations, rating coefficients are not constant over the full discharge range but show a distinct break in the sediment rating curve, with specific SSC–Q domains above and below this break. Typically, the rating break occurs slightly above the geometric mean discharge.
-
The transition of the rating exponent (from bl to bh) is likely a result of a change in controlling factors of suspended sediment from intrinsic (within the river system) to extrinsic (outside the river channel but within the catchment) sources. Our results suggest that in large, low-turbidity rivers the formation of organic matter within the river channel is an important control of the rating behavior at low discharges, while the extrinsic control is related to the supply of suspended sediment due to topsoil erosion in the catchment. This hypothesis is supported by the relationship between the rating exponent and the fraction of hillslopes steeper than 10 % within the contributing catchment area and LOI values of roughly 0.1 at high flow, which resemble typical topsoil organic carbon concentrations ranging between 2 % and 12 % in the Moselle and Rhine catchment.
-
Based on these findings we developed a conceptual rating model for large (>10 000 km2) and low-turbidity (SSC < 1000 mg L−1) rivers separating the mineral and organic fraction of suspended matter in German waterways. The model assumes a positive power-law rating of the mineral fraction of the SSC with Q and a negative power-law rating of the LOI with Q and can be used to model the rating behavior of the total SSC as frequently measured by suspended monitoring networks. More work is needed to see if the conceptual rating model can be applied to other large river systems that are controlled by strong human-induced sediment and nutrient supply.
Monitoring data on suspended sediment can be provided by the German Federal Institute on request. Therefore, contact the corresponding author.
HF provided OC data from both stations in Koblenz and provided feedback on data analysis and discussion of results. YB provided SSC data and analyzed the spatial distribution of the rating coefficients. JB contributed to the rating analysis and supported discussion on the results. TH performed rating analysis of all stations and prepared the paper with the cooperation of all co-authors.
The authors declare that they have no conflict of interest.
The data used in this paper were provided by the suspended sediment monitoring network of German waterways that was established in the 1960s by the Federal Waterways and Shipping Administration (Wasserstraßen- und Schifffahrtsverwaltung des Bundes, WSV). We acknowledge the WSV for maintaining the monitoring network and for suspended sediment sampling. Furthermore, we thank Kristin Bunte, one anonymous reviewer, and the associate editor Robert Hilton for their helpful comments and suggestions that greatly improved the quality of this paper.
This paper was edited by Robert Hilton and reviewed by Kristin Bunte and one anonymous referee.
Aich, V., Zimmermann, A., and Elsenbeer, H.: Quantification and interpretation of suspended-sediment discharge hysteresis patterns: How much data do we need?, Catena, 122, 120–129, 2014.
Asselmann, N.: Fitting and interpretation of sediment rating curves, J. Hydrol., 234, 228–248, 2000.
Baartman, J. E. M., Masselink, R., Keesstra, S. D., and Temme, A. J. A. M.: Linking landscape morphological complexity and sediment connectivity, Earth Surf. Proc. Land., 38, 1457–1471, 2013.
Bracken, L. J., Wainwright, J., Ali, G. A., Tetzlaff, D., Smith, M. W., Reaney, S. M., and Roy, A. G.: Concepts of hydrological connectivity: Research approaches, pathways and future agendas, Earth-Sci. Rev., 119, 17–34, 2013.
Cleveland, W. S.: Robust Locally Weighted Regression and Smoothing Scatterplots, J. Am. Stat. Assoc., 74, 829–836, 1979.
Cloern, J. E.: The relative importance of light and nutrient limitation of phytoplankton growth: a simple index of coastal ecosystem sensitivity to nutrient enrichment, Aquat. Ecol., 33, 3–16, 1999.
Cohn, T. A., Caulder, D. L., Gilroy, E. J., Zynjuk, L. D., and Summers, R. M.: The validity of a simple statistical model for estimating fluvial constituent loads: An Empirical study involving nutrient loads entering Chesapeake Bay, Water Resour. Res., 28, 2353–2363, 1992.
Diplas, P., Kuhnle, R., Gray, J., Glysson, D., and Edwards, T.: Sediment transport measurements. In: Sedimentation engineering: processes, measurements, modeling, and practice, edited by: Marcelo, H. G., American Society of Civil Engineers, Reston, 2008.
Ferguson, R. I.: River Loads Underestimated by Rating Curves, Water Resour. Res., 22, 74–76, 1986.
Fischer, H.: Zur Steuerung der Trophie großer Flüsse, Korrespond. Wasserwirt., 8, 225–230, 2015.
Frings, R. M., Gehres, N., Promny, M., Middelkoop, H., Schüttrumpf, H., and Vollmer, S.: Today's sediment budget of the Rhine River channel, focusing on the Upper Rhine Graben and Rhenish Massif, Geomorphology, 204, 573–587, 2014.
Frings, R. M., Hillebrand, G., Gehres, N., Banhold, K., Schriever, S., and Hoffmann, T.: From source to mouth: Basin-scale morphodynamics of the Rhine River, Earth-Sci. Rev., 196, 102830, https://doi.org/10.1016/j.earscirev.2019.04.002, 2019.
Fryirs, K.: (Dis)Connectivity in catchment sediment cascades: a fresh look at the sediment delivery problem, Earth Surf. Proc. Land., 38, 30–46, 2013.
Geider, R. J.: Light and Temperature Dependence of the Carbon to Chlorophyll a Ratio in Microalgae and Cyanobacteria: Implications for Physiology and Growth of Phytoplankton, New Phytologist, 106, 1–34, 1987.
Gomez, B., Trustrum, N. A., Hicks, D. M., Rogers, K. M., Page, M. J., and Tate, K. R.: Production, storage, and output of particulate organic carbon: Waipaoa River basin, New Zealand, Water Resour. Res., 39, 1161, https://doi.org/10.1029/2002wr001619, 2003.
Goñi, M. A., Moore, E., Kurtz, A., Portier, E., Alleau, Y., and Merrell, D.: Organic matter compositions and loadings in soils and sediments along the Fly River, Papua New Guinea, Geochim. Cosmochim. Ac., 140, 275–296, 2014.
Gray, A. B.: The impact of persistent dynamics on suspended sediment load estimation, Geomorphology, 322, 132–147, 2018.
Habersack, H. and Haimann, M.: Schwebstoffmessungen in Österreich, ADCP-Messung – Bericht, Department für Wasser – Atmosphäre – Umwelt, Institut für Wasserwirtschaft, Hydrologie und konstruktiven Wasserbau, Wien, 2010.
Hardenbicker, P., Rolinski, S., Weitere, M., and Fischer, H.: Contrasting long-term trends and shifts in phytoplankton dynamics in two large rivers, Int. Rev. Hydrobiol., 99, 287–299, 2014.
Hardenbicker, P., Weitere, M., Ritz, S., Schöll, F., and Fischer, H.: Longitudinal Plankton Dynamics in the Rivers Rhine and Elbe, River Res. Appl., 32, 1264–1278, 2016.
Heckmann, T., Cavalli, M., Cerdan, O., Foerster, S., Javaux, M., Lode, E., Smetanová, A., Vericat, D., and Brardinoni, F.: Indices of sediment connectivity: opportunities, challenges and limitations, Earth-Sci. Rev., 187, 77–108, 2018.
Hillebrand, G., Otto, W., Schmegg, J., Vollmer, S., and Gehres, N.: Neuausrichtung des WSV-Messstellennetzes Schwebstoffmonitoring, BfG report 1799, Bundesanstalt für Gewässerkunde, Koblenz, 2015.
Hillebrand, G. and Frings, R.: Von der Quelle zur Mündung: Die Sedimentbilanz des Rheins im Zeitraum 1991–2010, Bericht KHR/CHR II-22, Internationale Kommission für die Hydrologie des Rheingebietes, Lelystad, ISBN 978-90-70980-39-9, https://doi.org/10.5675/KHR_22.2017, 2017.
Hillebrand, G., Hardenbicker, P., Fischer, H., Otto, W., and Vollmer, S.: Dynamics of total suspended matter and phytoplankton loads in the river Elbe, J. Soils Sediment., 18, 3104–3113, 2018.
Hilton, R. G., Galy, A., Hovius, N., Kao, S.-J., Horng, M.-J., and Chen, H.: Climatic and geomorphic controls on the erosion of terrestrial biomass from subtropical mountain forest, Global Biogeochem. Cy., 26, GB3014, https://doi.org/10.1029/2012gb004314, 2012.
Hoffmann, T.: Sediment residence time and connectivity in non-equilibrium and transient geomorphic systems, Earth-Sci. Rev., 150, 609–627, 2015.
Hoffmann, T., Glatzel, S., and Dikau, R.: A carbon storage perspective on alluvial sediment storage in the Rhine catchment, Geomorphology, 108, 127–137, 2009.
Hoffmann, T., Hillebrand, G., and Noack, M.: Uncertainty analysis of settling, consolidation and resuspension of cohesive sediments in the Upper Rhine, Int. J. River Basin Manage., 15, 401–411, 2017.
Horowitz, A. J.: An evaluation of sediment rating curves for estimating suspended sediment concentrations for subsequent flux calculations, Hydrol. Process., 17, 3387–3409, 2003.
Jones, R. J. A., Hiederer, R., Rusco, E., and Montanarella, L.: Estimating organic carbon in the soils of Europe for policy support, Eur. J. Soil Sci., 56, 655–671, 2005.
Morehead, M. D., Syvitski, J. P., Hutton, E. W. H., and Peckham, S. D.: Modeling the temporal variability in the flux of sediment from ungauged river basins, Global Planet. Change, 39, 95–110, 2003.
Moreira-Turcq, P., Bonnet, M.-P., Amorim, M., Bernardes, M., Lagane, C., Maurice, L., Perez, M., and Seyler, P.: Seasonal variability in concentration, composition, age, and fluxes of particulate organic carbon exchanged between the floodplain and Amazon River, Global Biogeochem. Cy., 27, 119–130, 2013.
Morin, G. P., Lavé, J., France-Lanord, C., Rigaudier, T., Gajurel, A. P., and Sinha, R.: Annual Sediment Transport Dynamics in the Narayani Basin, Central Nepal: Assessing the Impacts of Erosion Processes in the Annual Sediment Budget, J. Geophys. Res.-Earth, 123, 2341–2376, 2018.
Naden, P. S.: The Fine-Sediment Cascade, in: Sediment cascades: an integrated approach, edited by: Burt, T. and Allison, R., Wiley-Blackwell, Chichester, West Sussex, UK, 2010.
Owens, P. N., Batalla, R. J., Collins, A. J., Gomez, B., Hicks, D. M., Horowitz, A. J., Kondolf, G. M., Marden, M., Page, M. J., Peacock, D. H., Petticrew, E. L., Salomons, W., and Trustrum, N. A.: Fine-grained sediment in river systems: environmental significance and management issues, River Res. Appl., 21, 693–717, 2005.
Partheniades, E.: Chapter 4 – The Hydrodynamic Transport Processes of Cohesive Sediments and Governing Equations, in: Cohesive Sediments in Open Channels, edited by: Partheniades, E., Butterworth-Heinemann, Boston, 2009.
Poesen, J.: Soil erosion in the Anthropocene: Research needs, Earth Surf. Proc. Land., 43, 64–84, 2018.
Poulier, G., Launay, M., Le Bescond, C., Thollet, F., Coquery, M., and Le Coz, J.: Combining flux monitoring and data reconstruction to establish annual budgets of suspended particulate matter, mercury and PCB in the Rhône River from Lake Geneva to the Mediterranean Sea, Sci. Total Environ., 658, 457–473, 2019.
Quiel, K., Becker, A., Kirchesch, V., Schöl, A., and Fischer, H.: Influence of global change on phytoplankton and nutrient cycling in the Elbe River, Reg. Environ. Change, 11, 405–421, 2011.
Reid, I. and Frostick, L. E.: Discussion of conceptual models of sediment transport in streams, in: Sediment Transport in Gravel-Bed Rivers, edited by: Thorne, C. R., Bathurst, J. C., and Hey, R. D., John Wiley, New York, 1987.
Smith, J. C., Galy, A., Hovius, N., Tye, A. M., Turowski, J. M., and Schleppi, P.: Runoff-driven export of particulate organic carbon from soil in temperate forested uplands, Earth Planet. Sc. Lett., 365, 198–208, 2013.
Spreafico, M., Lehmann, C., Jakob, A., and Grasso, A.: Feststoffbeobachtung in der Schweiz. Ein Tätigkeitsgebiet der Landeshydrologie, Bundesamt für Wasser und Geologie, Bern, 2005.
Syvitski, J. P., Morehead, M. D., Bahr, D. B., and Mulder, T.: Estimating fluvial sediment transport: The rating parameters, Water Resour. Res., 36, 2747–2760, 2000.
Syvitski, J. P., Vörösmarty, C., Kettner, A., and Green, P.: Impact of Humans on the Flux of Terrestrial Sediment to the Global Coastal Ocean, Science, 308, 376–380, 2005.
Thollet, F., Le Bescond, C., Lagouy, M., Gruat, A., Grisot, G., Le Coz, J., Coquery, M., Lepage, H., Gairoard, S., Gattacceca, J. C., Ambrosi, J.-P., and Radakovitch, O.: Observatoire des Sédiments du Rhône, INRAE, https://doi.org/10.17180/OBS.OSR, 2018.
Thorp, J. H. and Delong, M. D.: Dominance of autochthonous autotrophic carbon in food webs of heterotrophic rivers, Oikos, 96, 543–550, 2002.
van Rijn, L.: Sediment Transport, Part II: Suspended load transport, J. Hydraul. Eng.-ASCE, 11, 1613–1641, 1984.
Walling, D. E.: Erosion and sediment yield: a global overview, IAHS Publ., 236, 3–19, 1996.
Walling, D. E., Owens, P. N., Waterfall, B. D., Leeks, G. J. L., and Wass, P. D.: The particle size characteristics of fluvial suspended sediment in the Humber and Tweed catchments, UK, Sci. Total Environ., 251, 205–222, 2000.
Warrick, J. A.: Trend analyses with river sediment rating curves, Hydrol. Process., 29, 936–949, 2015.
Wetzel, R.: Limnology. Lake and River Ecosystems, Elsevier, San Diego, 2001.
Winterwerp, J. and Van Kesteren, W. G. M.: Introduction to the physics of cohesive sediment in the marine environment, Elsevier, Amsterdam, 2004.
Winterwerp, J. C., Manning, A. J., Martens, C., de Mulder, T., and Vanlede, J.: A heuristic formula for turbulence-induced flocculation of cohesive sediment, Estuar. Coast. Shelf Sci., 68, 195–207, 2006.
Zuecco, G., Penna, D., Borga, M., and van Meerveld, H. J.: A versatile index to characterize hysteresis between hydrological variables at the runoff event timescale, Hydrol. Process., 30, 1449–1466, 2016.