the Creative Commons Attribution 4.0 License.
the Creative Commons Attribution 4.0 License.
 | 13 Aug 2020
Alluvial cover on bedrock channels: applicability of existing models
Takuya Inoue
Several studies have demonstrated the importance of alluvial cover; furthermore, several mathematical models have also been introduced to predict the alluvial cover on bedrock channels. Here, we provide an extensive review of research exploring the relationship between alluvial cover, sediment supply and bed topography of bedrock channels, describing various mathematical models used to analyse the deposition of alluvium. To test one-dimensional theoretical models, we performed a series of laboratory-scale experiments with varying bed roughness under simple conditions without bar formation. Our experiments show that alluvial cover is not merely governed by increasing sediment supply and that bed roughness is an important controlling factor of alluvial cover. A comparison between the experimental results and the five theoretical models shows that (1) two simple models that calculate alluvial cover as a linear or exponential function of the ratio of the sediment supplied to the capacity of the channel produce good results for rough bedrock beds but not for smoother bedrock beds; (2) two roughness models which include changes in roughness with alluviation and a model including the probability of sediment accumulation can accurately predict alluvial cover in both rough and smooth beds; and (3), however, except for a model using the observed hydraulic roughness, it is necessary to adjust model parameters even in a straight channel without bars.
- Article
(7237 KB) - Full-text XML
- BibTeX
- EndNote


Economic growth worldwide has fuelled the demand for the construction of straightened river channels, sabo dams, the collection of gravel samples for various research, etc., leading to a decline in sediment availability and alluvial bed cover. Sumner et al. (2019) reported that the straightening of the Yubari River, which was carried out to improve the drainage of farmland, caused the bedrock to be exposed and the knickpoint to migrate upstream. Furthermore, the construction of a dam in the upstream section of the Toyohira River in Hokkaido, Japan, decreased the sediment availability to the downstream section contributing to the formation of a knickpoint (Yamaguchi et al. 2018). Sediment availability plays a very important role in controlling landscape evolution and determining the morphology of rivers over geologic time (Moore 1926; Shepherd 1972) and has two contradicting effects on the bedrock bed, which is known as the tools and cover effects (Gilbert, 1877; Sklar and Dietrich, 1998). Sediment acts as a tool for erosion by increasing the number of impacting particles that erode the bedrock bed, which is known as the tools effect. As sediment availability increases, the sediment starts settling down on the river bed providing a cover for the bed underneath from further erosion, which is known as the cover effect. In the last 20 yr, various field-scale (Turowski et al., 2008b; Turowski and Rickenmann, 2009; Johnson et al., 2010; Jansen et al., 2011; Hobley et al., 2011; Cook et al., 2013; Inoue et al., 2014; Beer and Turowski, 2015; Beer et al., 2017), laboratory-scale (Sklar and Dietrich, 2001; Chatanantavet and Parker, 2008; Finnegan et al., 2007; Johnson and Whipple, 2007, 2010; Hodge and Hoey, 2016a, b; Hodge et al., 2016; Turowski and Bloem, 2016; Inoue et al., 2017b, Mishra et al., 2018; Fernandez et al., 2019; Inoue and Nelson, 2020), and theoretical and numerical studies (Hancock and Anderson, 2002; Sklar and Dietrich, 2004, 2006; Lague, 2010; Nelson and Seminara, 2011, 2012; Johnson, 2014; Nelson et al., 2014; Zhang et al., 2015; Inoue et al., 2016, 2017a; Turowski and Hodge, 2017; Turowski, 2018) have been performed to reveal the effects of tools and cover on bedrock erosion and erosional morphology.
Sediment availability strongly affects vertical bedrock incision including knickpoint propagation. Reach-scale studies at the Erlenbach performed by Turowski et al. (2013) showed how extreme flood events can contribute to incision by ripping off the channel's alluvial cover. Yanites et al. (2011) studied the changes in the Beigang (also known as Peikang) River in central Taiwan triggered by the thick sediment cover introduced by landslides and typhoons during the 1999 Chi-Chi earthquake. Their results show slowed or no incision in high transport capacity and low transport capacity channels. Cook et al. (2013) suggested that rapid knickpoint propagation is dominantly controlled by the availability of bed load. Their field surveys of the bedrock gorge cut by the Daan River in Taiwan showed that the channel bed was not eroded in the absence of coarse bed load despite floods and available suspended sediment. Izumi et al. (2017) showed that sediment transport and bedrock abrasion lead to the formation of cyclic steps, and Scheingross et al. (2019) suggested that undulating bedforms like cyclic steps grow to become waterfalls and knickpoints.
Sediment availability also controls the width of the bedrock channel. Finnegan et al. (2007) conducted laboratory-scale experiments and studied the interdependence between incision, bed roughness and alluvial cover. Their results indicated that alluvial deposition on the bed shifted bedrock erosion to higher regions of the channel or bank of the channel and suggested that the sediment supply rate controls the thalweg width of the bedrock channel. Similar findings were noted in flume studies conducted by Johnson and Whipple (2010). They have shown the importance of alluvial cover in regulating the roughness of the bedrock bed by providing a cover for the local lows and thereby inhibiting erosion and focusing erosion on local highs. Field observations also show that channels with a higher sediment supply to capacity ratio are expected to be wider as alluvial cover shifts erosion from the bed to the banks of the channel (Beer et al., 2016; Turowski et al., 2008a, Whitbread et al., 2015). Inoue et al. (2016) and Inoue and Nelson (2020) showed the formation of several longitudinal grooves (LGs) at a low sediment supply to capacity ratio. As the sediment supply increases, one of the grooves attracts more sediment supply and progresses into a comparatively straight, wide and shallow inner channel which further progresses into a more sinuous, deeper inner channel (Wohl and Ikeda, 1997; Shepherd and Schumm, 1974).
Some studies have credited the seasonally and climatically driven higher sediment supplies during floods to be the driving force for bedrock meander and strath terrace formation (De Vecchio et al., 2012; Hancock and Anderson, 2002). Periods of higher sediment supply promote lateral erosion and strath terrace formation, whereas periods of lower sediment supply lead to vertical erosion and steep slip-off slopes (e.g. Fuller et al., 2009; Inoue et al., 2017a). Mishra et al. (2018) showed that, in the bend, lateral abrasion followed a monotonically increasing linear relationship with sediment feed rate. Fuller et al. (2016) performed laboratory-scale experiments and established the importance of bed roughness in determining lateral erosion rates because high roughness scatters the direction of bed load transport increasing the frequency with which it collides with the wall.
There have been advances in theoretical and numerical methods mimicking, reproducing and predicting the morphodynamics of laboratory-scale and field-scale observations. A majority of traditional bed-erosion models are classified as the stream power and shear stress family of models (cf. Shobe et al., 2017; Turowski, 2018) (e.g. Howard, 1994; Whipple and Tucker, 1999), in which bed erosion is a function of discharge and bed slope. These models, however, cannot describe the role of sediment in controlling the bed dynamics. Several models remedy this shortcoming by considering the tools and cover effect of sediment supply (Sklar and Dietrich, 1998, 2004; Turowski et al., 2007; Chatanantavet and Parker, 2009; Hobley et al., 2011; Inoue et al., 2017a, b; Shobe et al., 2017).
Predicting the tools and cover effects is essential for better understanding the bedrock landscape evolution. In this study, we review the advances of alluvial cover models in the past 2 decades and test several major models. In Sect. 1.1, we introduce previous theoretical and numerical models that take into account sediment cover in the bedrock channel. In Sect. 1.2 to 1.6, we describe in detail the governing equations of the five models dealt with in this study.
1.1 Previous models for sediment cover
The sediment cover models predict cover by taking into account factors like sediment flux, roughness, discharge, grain size, etc. One of the simplest and first models to incorporate effects of sediment availability and transport capacity of the channel was introduced by Sklar and Dietrich (1998, 2004). According to the saltation-abrasion model proposed by Sklar and Dietrich (1998, 2004), the alluvial cover Pc increases linearly with the ratio of sediment supply to sediment transport capacity qbs∕qbc. In contrast, Turowski et al. (2007) proposed a model that considered the cover effect as an exponential function of the ratio of sediment flux to sediment transport capacity. The model uses a probabilistic argument; i.e. when sediment supply is less than the capacity of the channel, grains have an equal probability of settling down over any part of the bed. The deposited grains can also be static or mobile.
The erosion formula including the above model was able to reproduce the relationship between the sediment mass and the erosion rate observed in the rotary-abrasion mill experiment performed by Sklar and Dietrich (2001). However, subsequent experiments using a straight channel pointed out a phenomenon that cannot be reproduced by the above models. Chatanantavet and Parker (2008) conducted laboratory-scale experiments in straight concrete bedrock channels with varying bedrock roughness and evaluated bedrock exposure with respect to sediment availability. In their experiments, alluvial cover increased linearly with increasing sediment supply in the case of higher bed roughness, whereas in the case of lower bed roughness and higher slopes, the bed shifted abruptly from being completely exposed to being completely covered. This process of the bedrock bed suddenly becoming completely alluvial from being completely exposed is known as rapid alluviation, also known as run-away alluviation (Hodge and Hoey, 2016a). Rapid alluviation was also observed in the laboratory-scale experiment conducted by Hodge and Hoey (2016a, b) in a three-dimensional printed flume of the natural stream Trout Beck, North Pennines, United Kingdom. Their first set of experiments focused on quantifying hydraulic change with varying discharge, suggesting that hydraulic properties fluctuate more during higher discharge. Their second set of experiments (Hodge and Hoey, 2016b) concentrated on quantifying the sediment dynamics for varying discharge and sediment supply. They supplied 4 and 8 kg sediment pulses to the channel and observed a similar alluvial pattern in both cases, suggesting that the deposition of sediment on the bed may not only depend on the amount of sediment supplied but may be strongly influenced by the bed topography and roughness. Inoue et al. (2014) conducted experiments by excavating a channel into natural bedrocks in the Ishikari River in Asahikawa, Hokkaido, Japan. They conducted experiments with different combinations of flow discharge, sediment supply rate, grain size and roughness. Their experiments showed that the dimensionless critical shear stress for sediment movement on bedrock is related to the roughness of the channel. Their experiments also showed that in the case when the alluvial cover is smoother than the bedrock, with an increase in alluvial cover, the hydraulic roughness in a mixed bedrock–alluvial bed decreases.
In addition, the simple models described above cannot capture the sediment mass in a channel that changes due to sediment supply and runoff because they do not conserve sediment mass. Lague (2010) employed the Exner equation to calculate alluvial thickness with respect to average grain size d. Their model, however, lacks the tools effect for bed erosion. Recently, Johnson (2014) and Inoue et al. (2014) proposed reach-scale physically based models that encompass the effects of bed roughness in addition to mass conservation. Inoue et al. (2014) also conceptualized “clast rough” and “clast smooth” bedrock surfaces. A bedrock surface is clast rough when bedrock hydraulic roughness is greater than the alluvial bed hydraulic roughness (supplied sediment); otherwise, a surface is clast smooth, i.e. when the bedrock roughness is lower than the alluvial roughness. Inoue et al. (2014) and Johnson (2014) clarified that the areal fraction of alluvial cover exhibits a hysteresis with respect to the sediment supply and transport ratio in a clast smooth bedrock channel. They described that, along with rapid alluviation, perturbations in sediment supply can also lead to rapid entrainment. Whether the bed undergoes rapid alluviation or rapid entrainment is determined by the bed condition when perturbations in sediment supply occur. If the perturbations occur on an exposed bed, it undergoes rapid alluviation; conversely, when perturbations happen on an alluviated bed, it undergoes rapid entrainment. Zhang et al. (2015) proposed a macro-roughness saltation-abrasion model (MRSA) in which cover is a function of alluvial thickness and macro-roughness height. Nelson and Seminara (2012) proposed a linear stability analysis model for the formation of alternate bars on the bedrock bed. Inoue et al. (2016) expanded Inoue et al. (2014) to allow variations in the depth and width of alluvial thickness in the channel cross section. They further modified the numerical model (Inoue et al., 2017a) and implemented the model to observe changes in a meander bend.
Turowski and Hodge (2017) generalized the arguments presented by Turowski et al. (2007) and Turowski (2009) and proposed a reach-scale probability-based model that can deal with the evolution of cover residing on the bed and the exposed bedrock. Turowski (2018) proposed a model and linked the availability of cover in regulating the sinuosity of the channel. Shobe et al. (2017) proposed the SPACE 1.0 model for the simultaneous evolution of an alluvium layer and a bedrock bed. These models utilize the entrainment and deposition flux for sediment mass conservation.
Hodge and Hoey (2012) introduced a reach-scale cellular automaton model that assigned an entrainment probability to each grain. The assigned probability of each grain was decided by the number of neighbouring cells containing a grain. If five or more of a total of eight neighbouring cells contained grain, the grain was considered to be a part of the cover; otherwise, it was considered an isolated grain. They suggested that rapid alluviation occurred only in cases when isolated grains were more than the cover on the bed. They also advised a sigmoidal relationship between qbs∕qbc and 1−Pc. Aubert et al. (2016) proposed a discrete-element model in which they determined Pc from the velocity distribution of the grains. If the velocity of a grain is one tenth or lower than the maximum velocity, the grain settles as cover on the bedrock surface. The model, however, cannot deal with non-uniform velocity fields and hence cannot predict results for varying alluvial cover.
Except for the Lagrangian description models that track individual particles (i.e. Hodge and Hoey, 2012; Aubert et al., 2016), the Eulerian description models are roughly classified into four categories; the linear model proposed by Sklar and Dietrich (1998, 2004), the exponential model proposed by Turowski et al. (2007), the roughness models proposed by Nelson and Seminara (2012), Inoue et al. (2014), Johnson (2014), and Zhang et al. (2015), and the probabilistic model proposed by Turowski and Hodge (2017). In this study, we focus on a detailed study of the similarities and differences among the Eulerian description models proposed by Sklar and Dietrich (2004), Turowski et al. (2007), Inoue et al. (2014), Johnson (2014), and Turowski and Hodge (2017). These one-dimensional models have already been compared to experiments with bars (Chatanantavet and Parker, 2008) and experiments with irregular roughness arrangements (Hodge and Hoey, 2016a, b; Inoue et al., 2014), but a test in one-dimensional flow fields has not been performed. In this study, we compare the efficacy of these models from comparisons with our experimental results without bars with a relatively regular roughness distribution. In addition, we apply the roughness models (Inoue et al., 2014; Johnson, 2014) to the experiments conducted by Chatanantavet and Parker (2008) in order to discuss the effect of bar formation on alluvial cover in a mixed bedrock–alluvial river.
1.2 Linear model
When the sediment supply is larger than the transport capacity, the bedrock eventually becomes completely covered by alluvial material, and the alluvial cover ratio Pc is equal to 1. If there is no sediment supply, the sediment deposit disappears and eventually the bedrock bed becomes completely exposed and Pc is equal to 0. Sklar and Dietrich (2004) linearly connected these two situations and proposed a linear model to include the cover effect in their saltation-abrasion model:
where Pc is the mean areal fraction of alluvial cover and qbs and qbc are the volume sediment supply rate per unit width and transport capacity, respectively.
1.3 Exponential model
When the dimensionless mass of sediment on the bed is increased by a small amount, , a fraction of this amount will fall on exposed bedrock and cover it. Hence, , where φ is a dimensionless cover factor parameter and determines whether sediment deposition is more likely on covered areas for φ<1 and deposition on uncovered areas for φ>1. Integration gives . Turowski (2007) assumed that the is equal to the ratio of sediment supply to capacity and derived the following exponential model using a probabilistic argument:
1.4 Macro-roughness model
The experimental results of Inoue et al. (2014) motivated their mathematical model formulating the interaction between alluvial cover, dimensionless critical shear stress, transport capacity and the ratio of bedrock hydraulic roughness to alluvial hydraulic roughness. They calculated the total hydraulic roughness height (ks) as a function of alluvial cover:
where ks is the total hydraulic roughness height of the bedrock channel and Pc is the cover fraction calculated as proposed by Parker et al. (2013) that depends on the ratio ηa∕L, where ηa is the alluvial cover thickness and L is the bedrock macro-roughness height (i.e. topographic unevenness of the bed). ksb and ksa(equals 1∼4 d, here set to 2) represent the hydraulic roughness height of bedrock and alluvial bed, respectively. The total transport capacity per unit width qbc in the model of Inoue et al. (2014) is calculated as follows:
where α is a bed load transport coefficient taken as 2.66 in this study, τ∗ and τ∗c are the dimensionless shear stress and dimensionless critical shear stress, R is the specific gravity of the sediment in water (1.65), g is the gravitational acceleration, and d is the particle size. In this model, Pc is back calculated from Eqs. (3)–(5) under the assumption that the sediment supply rate qbs and the sediment transport capacity qbc are balanced in a dynamic equilibrium state (i.e. in Exner's mass conservation equation).
The sensitivity analysis of bedrock roughness and sediment supply rate conducted by Inoue et al. (2014) showed that for a given sediment supply, the deposition (Pc) is higher when bedrock roughness is larger. They also showed that if the sediment supply rate is larger than the transport capacity of bedrock bed, the clast-smooth surface shows a sudden transition from a completely exposed bedrock to a completely alluvial bedrock; i.e. clast-smooth surfaces show rapid alluviation.
1.5 Surface-roughness model
Johnson (2014) proposed a roughness model using the median diameter grain size. They also calculated the hydraulic roughness using the aerial alluvial cover fraction:
where rd=2 is a coefficient and k#D is called a non-dimensional alluvial roughness representing variations in topography. For a fully alluviated bed, ksa=2d. The bedrock hydraulic roughness ksb equals rdrbrσbr, where rbr is a scaling parameter for bedrock roughness to grain roughness and σbr is the bedrock surface roughness (this method for estimating ksb applies only to Johnson's model. The method of calculating the observed value of ksb is explained in Sect. 2.3). Their model calculates bedrock shear stress using the hiding/exposure function (br) of Wilcock and Crowe (2003), modified to depend on a standard deviation of bedrock elevations and a bedrock roughness scaling parameter. Johnson (2014) calculated the total transport capacity using bed load equations proposed by Meyer-Peter and Müller (1948) and Wilcock and Crowe (2003). Here we introduce Johnson's model that employs Meyer-Peter and Müller (MPM) equation:
where qbca is the transport capacity per unit width for sediment moving on a purely alluvial bed and qbcb is the transport capacity per unit width for sediment moving on a purely bedrock bed. τ∗cb is the dimensionless critical shear stress for grains on bedrock portions of the bed.
The models proposed by Inoue et al. (2014) and Johnson (2014) may seem rather similar in that they estimate the transport capacity of a mixed alluvial–bedrock surface. However, both models opt for different approaches when it comes to estimating hydraulic roughness. The model by Inoue et al. (2014) uses the observed hydraulic roughness, but the model by Johnson (2014) calculates the hydraulic roughness from the roughness (topographic unevenness) of the bed surface. The model by Inoue et al. (2014) needs measurements of observed bedrock hydraulic roughness, and the model by Johnson (2014) needs topographic bedrock roughness. In the model by Inoue et al. (2014), the macro roughness of the bed acts only when converting the alluvial layer thickness to the alluvial cover ratio. The macro roughness affects the temporal change in the alluvial cover ratio but does not affect the alluvial cover ratio in the dynamic equilibrium state. In addition, in the model by Johnson (2014), first, the sediment transport capacities for the bedrock and alluvial bed are separately calculated, then the total transport capacity is estimated using Pc; in contrast, in the model by Inoue et al. (2014), the total hydraulic roughness height is first calculated using Pc, then total transport capacity is estimated using the total hydraulic roughness.
1.6 Probabilistic model
Turowski and Hodge (2017) proposed a probability-based model for the prediction of cover on bedrock channels and investigated the distribution of sediment on the bedrock. Because they mainly focused on the transformation between a point of view considering sediment masses and one considering sediment fluxes, they did not investigate the interaction between the alluvial cover and the bed roughness. However, there is a possibility to capture the effects of bedrock roughness on the alluvial cover by adjusting the probability of grain entrainment and deposition included in the model. They defined P as the probability that a grain will settle on the exposed bed and used a power-law dependence of P on the exposed area (1−Pc), taking the form ; here ω is a model parameter. Similar to the exponential model (Turowski, 2007), , when integrated, gives
They further introduced the mass conservation equation and derived the following equation:
where is the dimensionless characteristic sediment mass obtained as follows:
Their model also provides two other analytical solutions and potentially other variables (Eqs. 30 and 31 in Turowski and Hodge, 2017); however, we employed Eq. (13) in this study as the equation has the highest flexibility of P and is likely to be able to include roughness feedbacks.
We hereafter refer to the model of Sklar and Dietrich (2004) as the linear model, the model of Turowski et al. (2007) as the exponential model, the model of Inoue et al. (2014) as the macro-roughness model, the model of Meyer-Peter and Müller (MPM) based on that of Johnson (2014) as the surface-roughness model, and the model of Turowski and Hodge (2017) as the probabilistic model.
2.1 Experimental flume
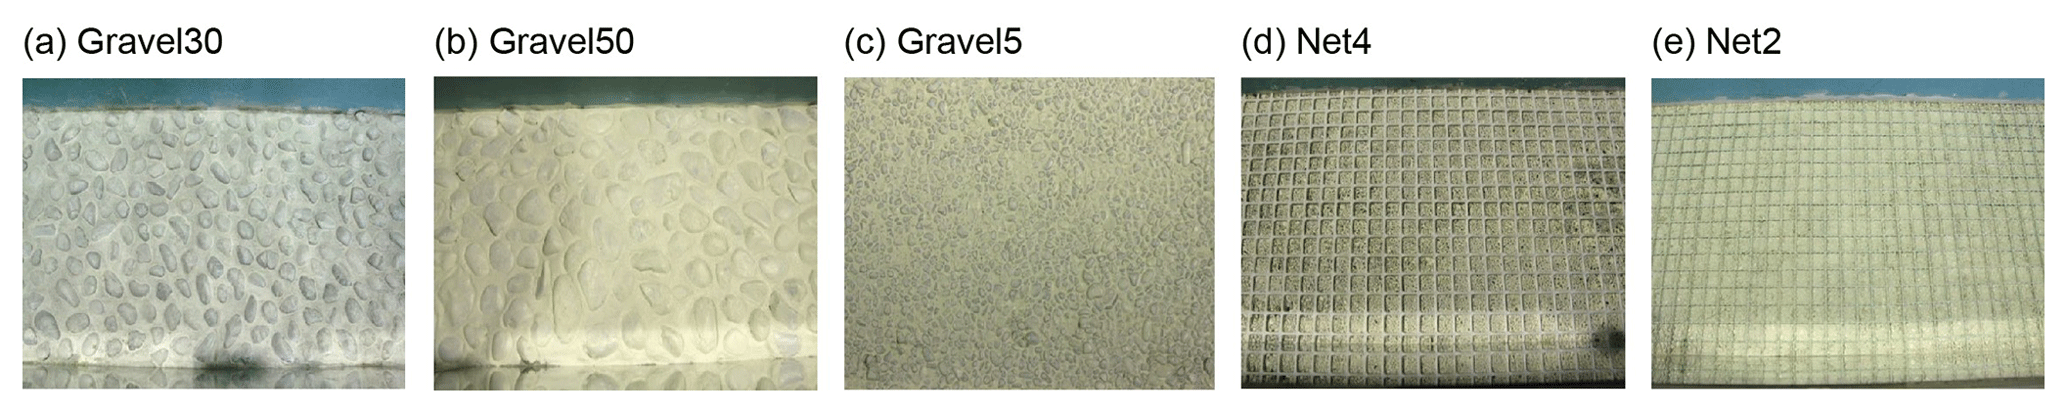
Figure 1Initial channel bed for each run. (a) Gravel30 is embedded with 30 mm gravel. (b) Gravel50 is embedded with 50 mm gravel. (c) Gravel5 is embedded with 5 mm gravel. (d) Net4 is installed with a net of height 4 mm. (e) Net2 is installed with a net of height 2 mm.
We conducted experiments to measure how sediment cover developed over surfaces of different roughnesses and different sediment fluxes. The experiments were conducted in a straight channel at the Civil Engineering Research Institute for Cold Region, Sapporo, Hokkaido, Japan. The experimental channel was 22 m long, 0.5 m wide and had a slope of 0.01. The width–depth ratio was chosen to achieve a no-sandbar condition (i.e. small width–depth ratio, 6.1 to 8.3 in our experiments). Chatanantavet and Parker (2008) conducted several flume experiments with sandbar conditions (i.e. large width–depth ratio, 11 to 30 in their experiments) and suggested that the alluvial cover increases linearly to the ratio of sediment supply and transport capacity of the channel when the slope is less than 0.015. The formation of bars strongly depends on the width–depth ratio (e.g. Kuroki and Kishi, 1984; Colombini et al., 1987). Generally, neither alternate bars nor double-row bars are formed under conditions with width–depth ratios <15.
In this study, we investigated the influence of bedrock roughness on the alluvial cover under conditions where the slope and width–depth ratios were small compared to the experiments of Chatanantavet and Parker (2008).
2.2 Bed characteristics and conditions
The channel bed consisted of hard mortar that was not eroded by the bed load supplied in this experiment. In order to achieve different roughness conditions, the bed in Gravel30 was embedded with gravel of particle size 30 mm, Gravel50 was embedded with 50 mm gravel, and Gravel5 was embedded with 5 mm gravel.
We performed an additional two cases with the installation of a net on the riverbed. The net was made of plastic. A net installed on the riverbed can trap sediment during high flow, eventually protecting the bed from further erosion from abrading sediment (Mutsuura et al., 2015). A net of mesh size 30 mm×30 mm was installed on the bed in Net4 and Net2. The height of the net was 4 mm and 2 mm, respectively. Figure 1 shows the experimental channel bed of all five runs.
For each bed roughness (for example, Gravel50 series), a group of experiments with varying sediment supply were performed for different time durations.
2.3 Measurement of observed bedrock roughness
In order to measure the initial bed roughness (before supplying sand), a water discharge of 0.03 m3s−1 was supplied, and the water level was measured longitudinally at every 1 m at the centre of the channel. The hydraulic roughness height for bedrock (ksb) was calculated using the Manning–Strickler relation and Manning's velocity formula:
where nm is the Manning's roughness coefficient, U is the average velocity ( where U is the water discharge, w is the channel width and D is the water depth) and Se is the energy gradient. Several previous studies have suggested that in bedrock rivers the Manning's nm value can depend on the discharge (Heritage et al., 2004; Hodge and Hoey, 2016a), but in our experiments the discharge is held constant between the different runs.
In order to compare the hydraulic roughness height and the riverbed–surface unevenness height, the riverbed height before water flow was measured along a 1 m length (12 to 13 m) with a laser sand gauge. The measurements were taken longitudinally at every 5 mm. The measurements were taken at three points: 0.15 m away from the right wall, the centre of the channel and 0.15 m away from the left wall. The standard deviation representing the topographic roughness σbr was obtained by subtracting the mean slope from the riverbed elevation and then calculating the standard deviation of the remaining elevations (Johnson and Whipple, 2010).
2.4 Measurement of dimensionless critical shear stress on bedrock
Table 1Experimental conditions
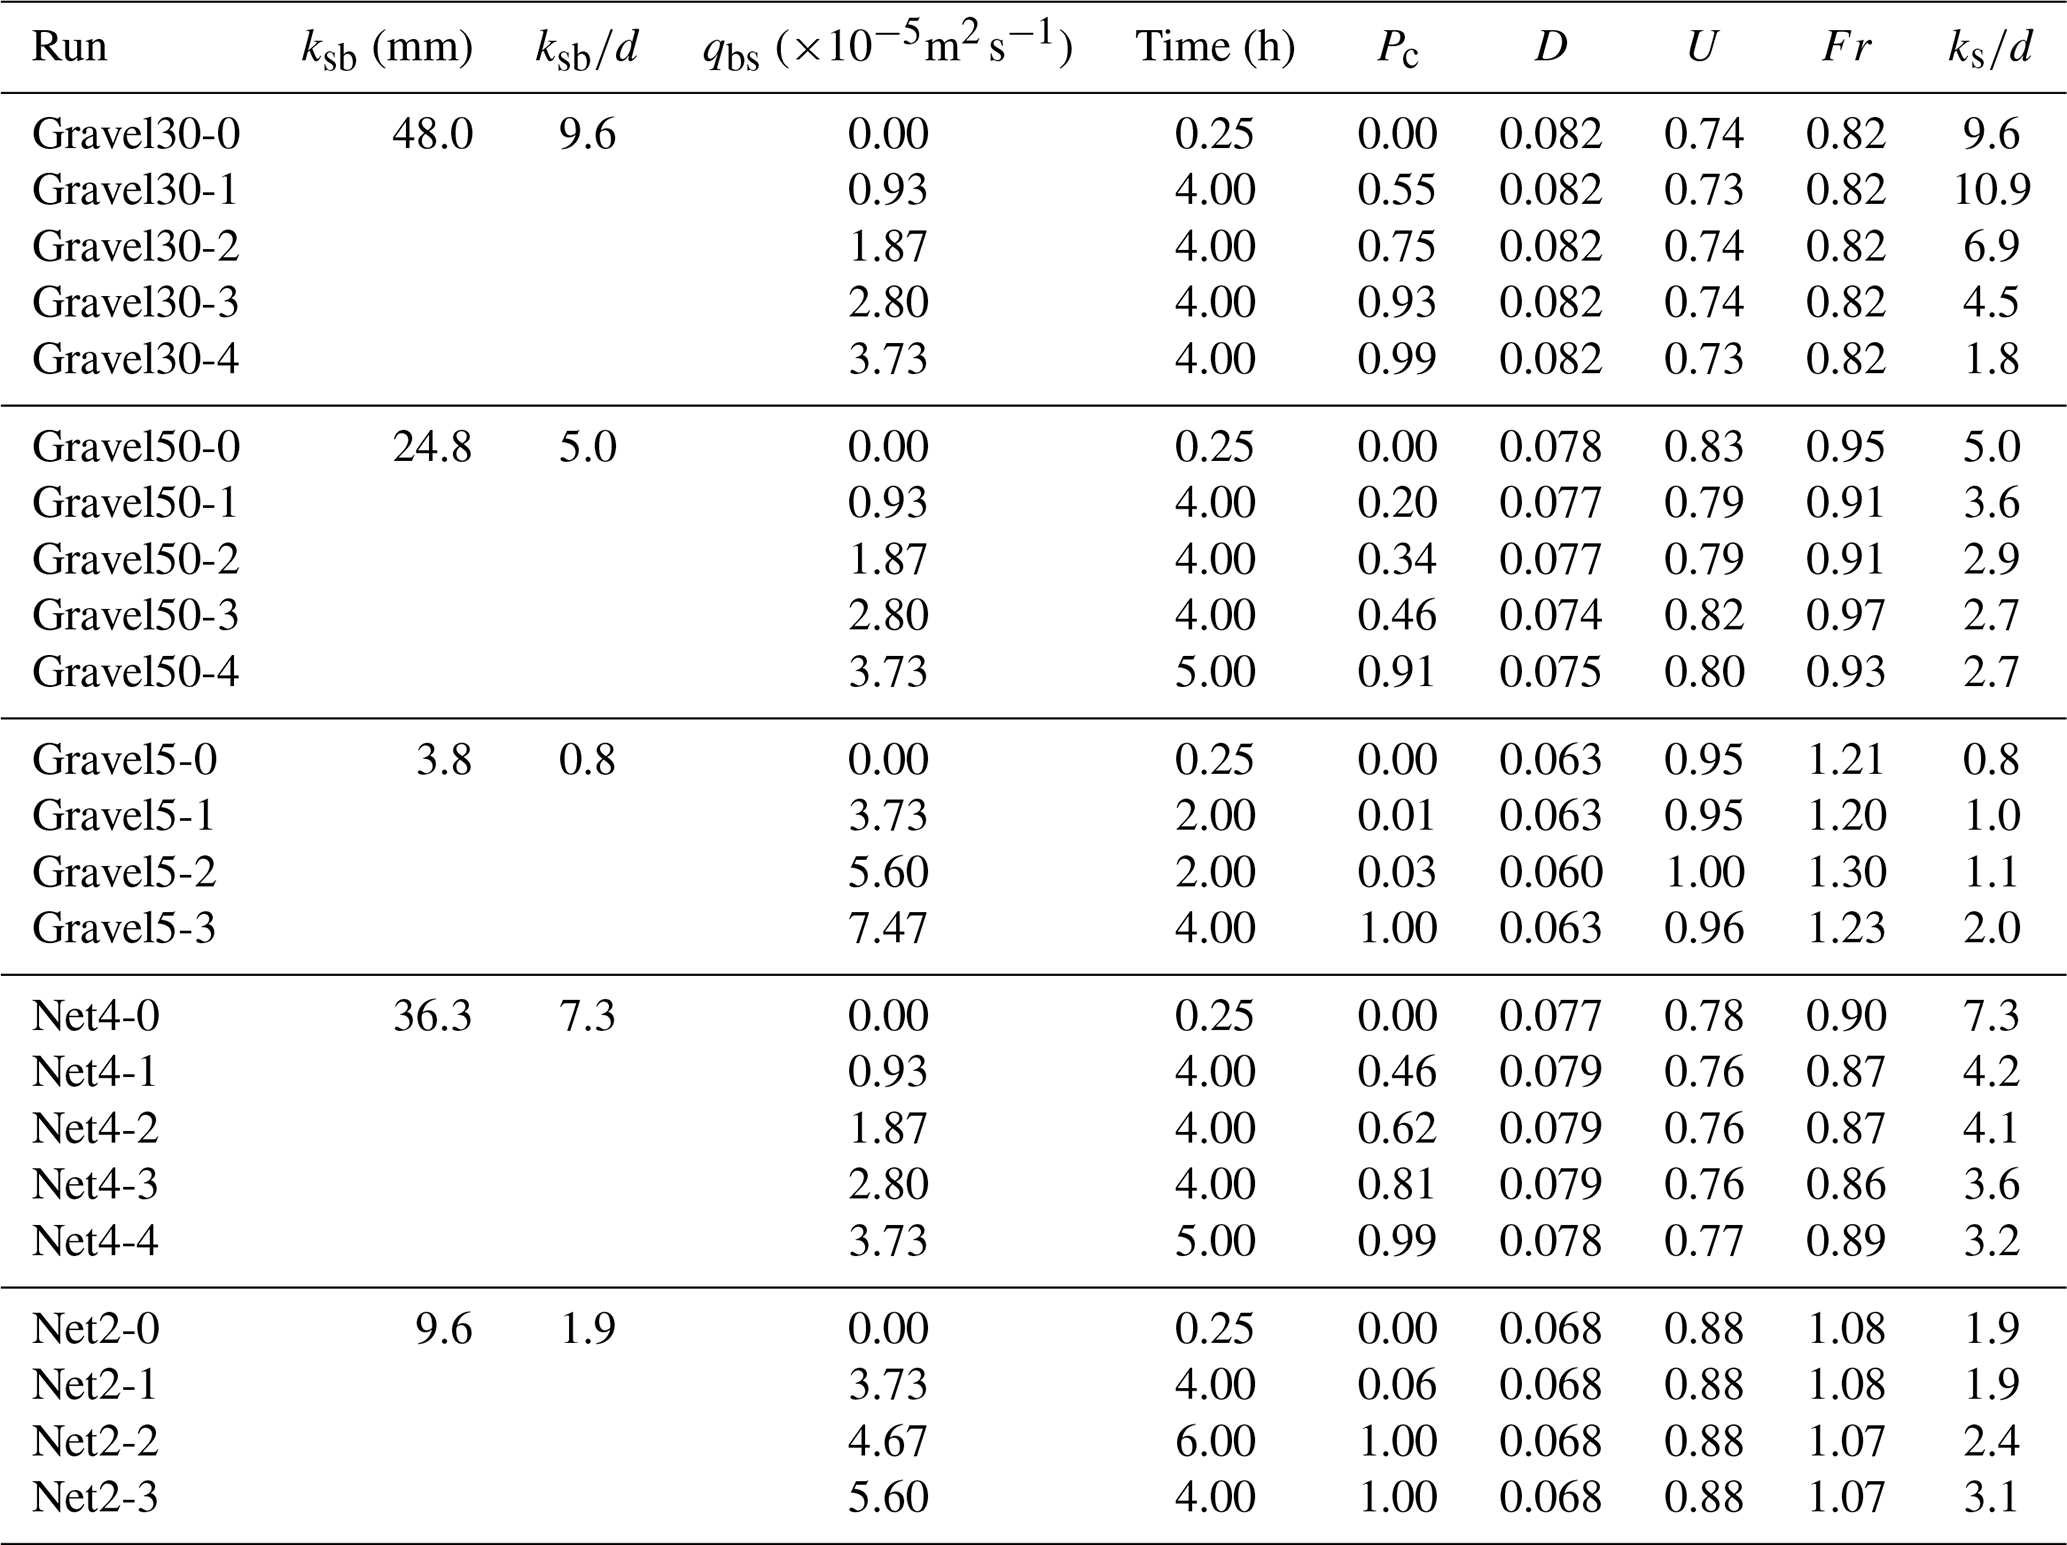
Here, ksb represents the hydraulic roughness height of purely bedrock bed, ksb∕d is the relative roughness of the bedrock bed, qbs represents sediment supply rate, Pc is the alluvial cover, D is the water depth, U is the depth-averaged velocity, Fr is the Froude number (u∕(gD)0.5) and ks∕d is the ratio of hydraulic roughness height to grain size.
To measure the dimensionless critical shear stress of grains on a completely bedrock portion, i.e. τ∗cb, 30 grains of gravel of 5 mm diameter each were placed on the flume floor at intervals of 10 cm or more to make sure that there was no shielding effect between the grains of gravel (there was shielding effect due to unevenness of the bedrock). Next, water flow was supplied at a flow discharge so that no gravel moved and was slowly increased to a flow discharge at which all the grains of gravel moved. The water level and the number of grains of gravel displaced were measured and recorded for each flow discharge. These measurements were performed for all five bedrock surfaces.
We calculated the dimensionless shear stress ; here, R is the specific gravity of the submerged sediment (1.65). We defined the critical shear stress τ∗cb as the weighted average of τ∗ using the number of displaced grains of gravel.
2.5 Measurement of alluvial cover
In order to perform the main set of experiment, different amounts of gravel (5 mm; hereafter called sediment) were supplied manually at a constant rate, while the flow rate was kept constant at 0.03 m3s−1. The alluvial cover ratio was measured once the equilibrium state was achieved. Once the areal fraction became stable in qualitative observations and the variation of hydraulic roughness of mixed alluvial–bedrock bed ks calculated from the observed water depth decreased despite sediment being supplied, we considered that the experiment had reached its equilibrium state. Equilibrium conditions were achieved after 2–4 h of sediment supply. The sediment supply amounts and other experimental conditions for various cases are provided in Table 1. Each run has multiple cases each with a different sediment supply and time duration. Each case was performed until the Pc became constant. The grains of gravel were supplied from Run-0 of no sediment to Run-4–5 of a completely alluvial cover. The Run-0 with no sediment supply in each run represents the bedrock-roughness measurement experiment explained in Sect. 2.3.
For each roughness condition, initially, we supplied sediment at the rate of m2 s−1 and observed the evolution of Pc. A sediment supply rate of m2 s−1 is used as it was measured in the flume with complete alluvial bed, and it is in good agreement with the calculated value obtained from Eq. (4). If P equals approximately 1, the sediment supply was approximately reduced by 1.5 times in the subsequent run, and then the sediment supply was further reduced by 2 times and 4 times in subsequent runs (for example, Gravel30, Gravel50 and Net4). In roughness conditions where sediment supply of m2 s−1 resulted in Pc≈0, the sediment supply was increased by 1.25 or 1.5 times and 2 times in the subsequent runs (for example, Gravel5 and Net2). However, for ease of understanding, we will present each experimental run in ascending order of sediment supply rate.
The alluvial cover was calculated at the end of the experiment using black and white photographs of the flume by taking the ratio of the number of pixels. The dark or black colour represented sediment cover, while white represented exposed bedrock. The water level was measured and recorded every hour at the centre of the channel to calculate the hydraulic roughness during and at the end of the experiment. The cross-sectional profile of the channel bed was measured with a laser sand gauge at longitudinal intervals of 1 m from 10 to 15 m from the downstream end before and after each run. We calculated the alluvial thickness from the difference between the two collections of data.
3.1 Initial topographic roughness and hydraulic roughness
Figure 2 shows the relationship between the hydraulic roughness height of bedrock bed ksb and the topographic roughness height of bedrock bed σbr. This figure suggests that Gravel30 with 30 mm sized embedded gravel has the largest hydraulic roughness and that Gravel5 with 5 mm sized embedded gravel has the lowest hydraulic roughness. Gravel50 embedded with 50 mm gravel has large topographical roughness error bars for the reason that the large grains of gravel were embedded randomly in the bed, resulting in unintended longitudinal spatial variation in the unevenness of the channel bed. The error bars here represent the minima, average and maxima of the calculated standard deviation of measurements taken along the left wall, centre and right wall of the channel, as mentioned in Sect. 2.3. Although the hydraulic roughness tends to increase with an increase in topographical roughness, it has a large variation. This variation is due to the fact that the hydrological roughness height does not depend only on the topographical roughness but also on the arrangement of the unevenness.
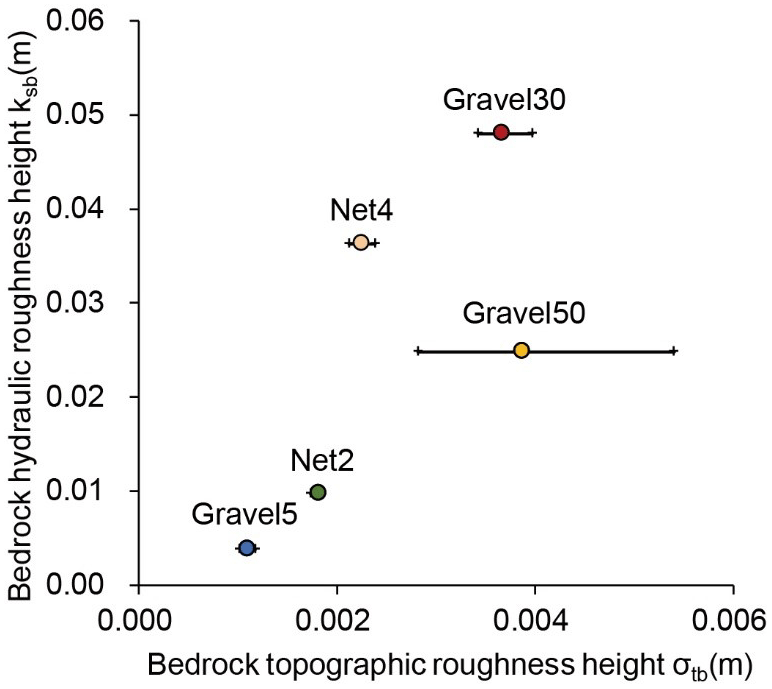
Figure 2Relationship between initial bed hydraulic roughness height and topographic roughness height. The black circles in the image represent the average values measured on the three data collection lines, and the error bars represent the minimum and maximum value.
3.2 Relative roughness of the bedrock bed, sediment supply and alluvial cover
Figure 3 shows the channel bed after the experiments of the Gravel30 series (Gravel30-1, Gravel30-2, Gravel30-3 and Gravel30-4) with the highest relative roughness of the bedrock bed (ksb∕d). Figure 4 shows the channel bed after the experiments of the Gravel5 series (Gravel5-1, Gravel5-2, Gravel5-3) which has the lowest relative roughness of the bedrock bed. In these two figures, we can compare Gravel30-4 and Gravel5-1 with equal sediment supply rates. The bed in Gravel30-4 is completely covered with sediment, whereas the bed in Gravel5-1 has almost no accumulated sediment on the bed.
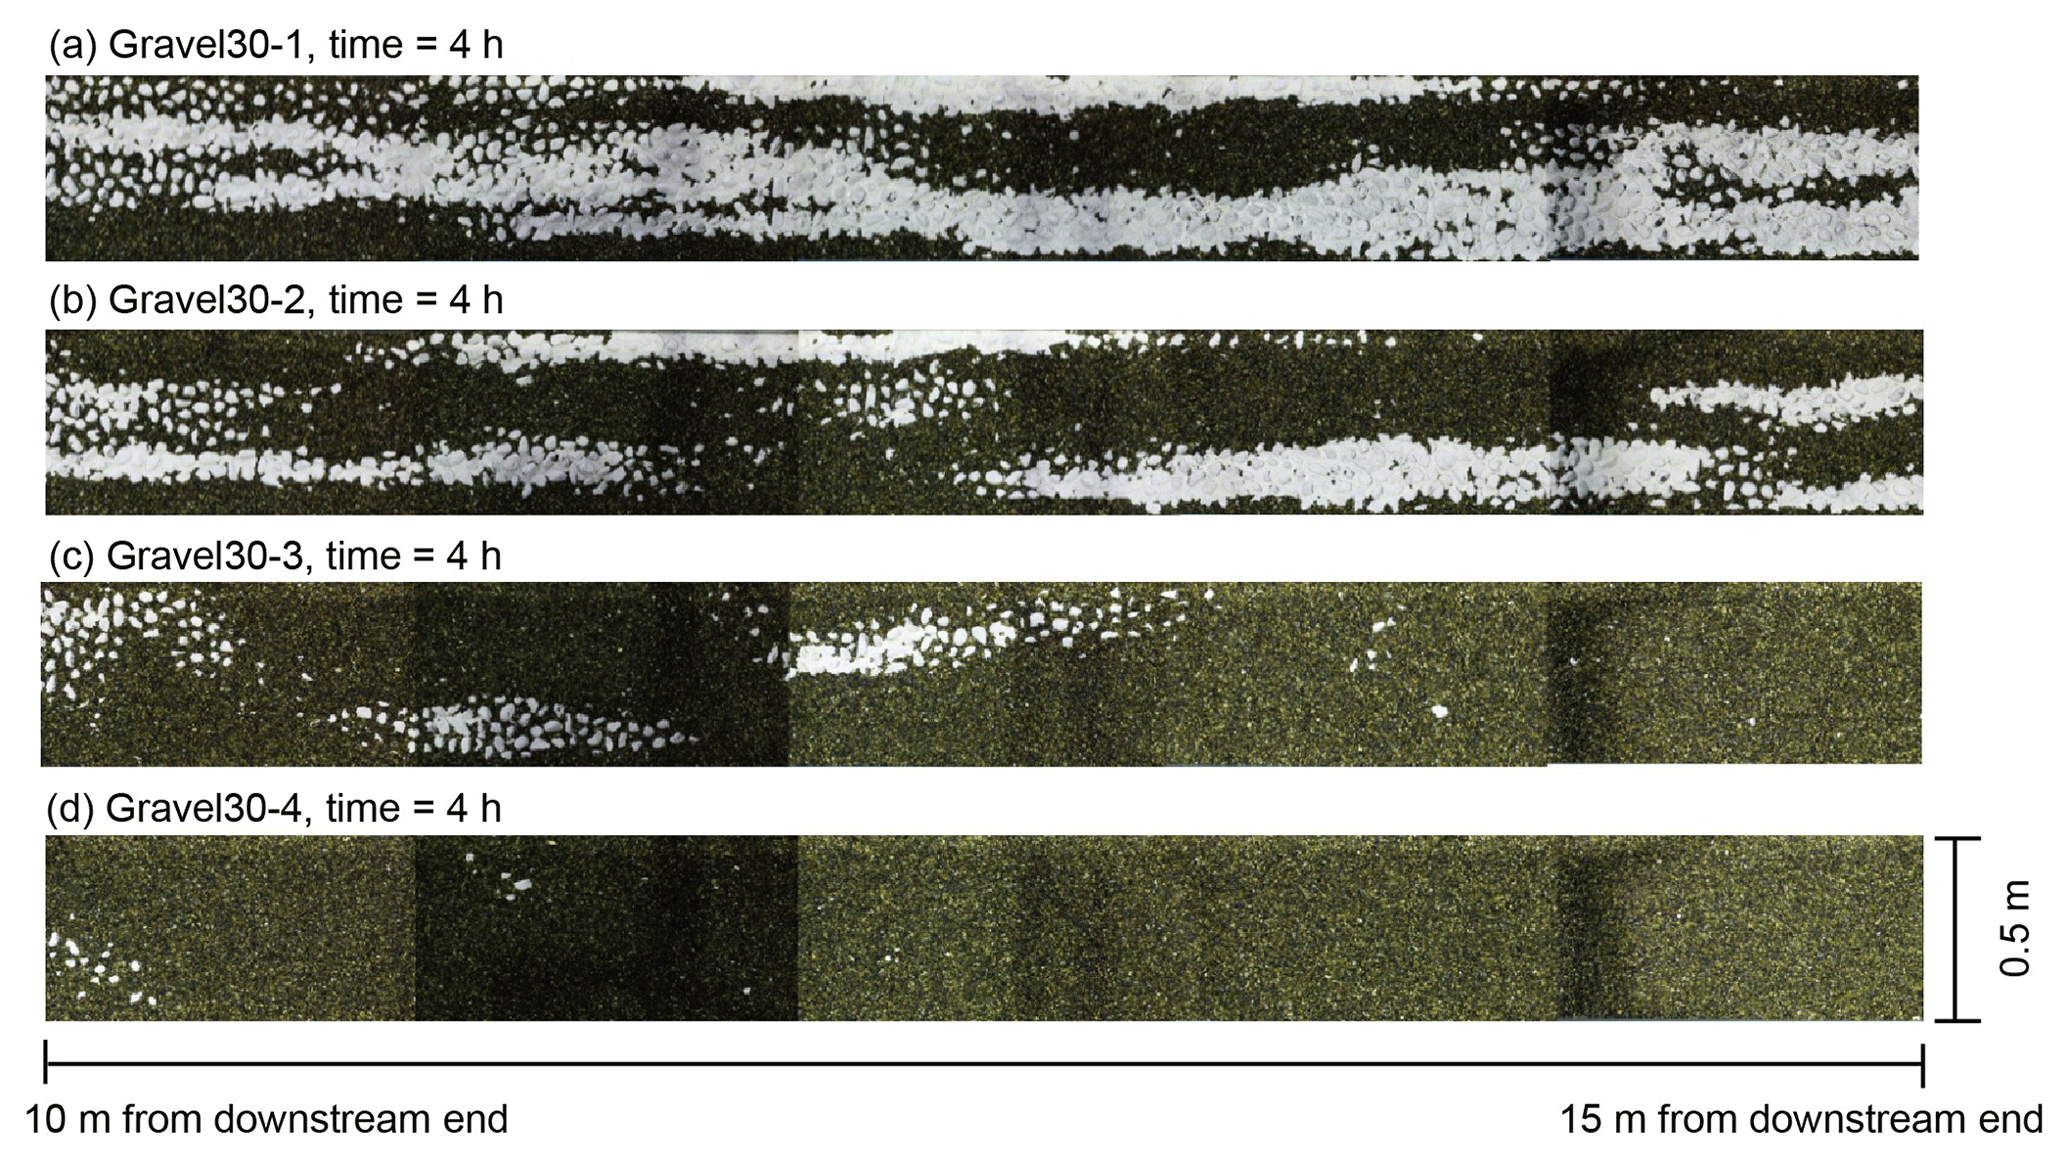
Figure 3Bedrock exposure in Gravel30 series at the end of the experiment. The initial bed had 30 mm embedded particles. The white bed represents exposed bedrock. The dark bed represents sediment covered bed.
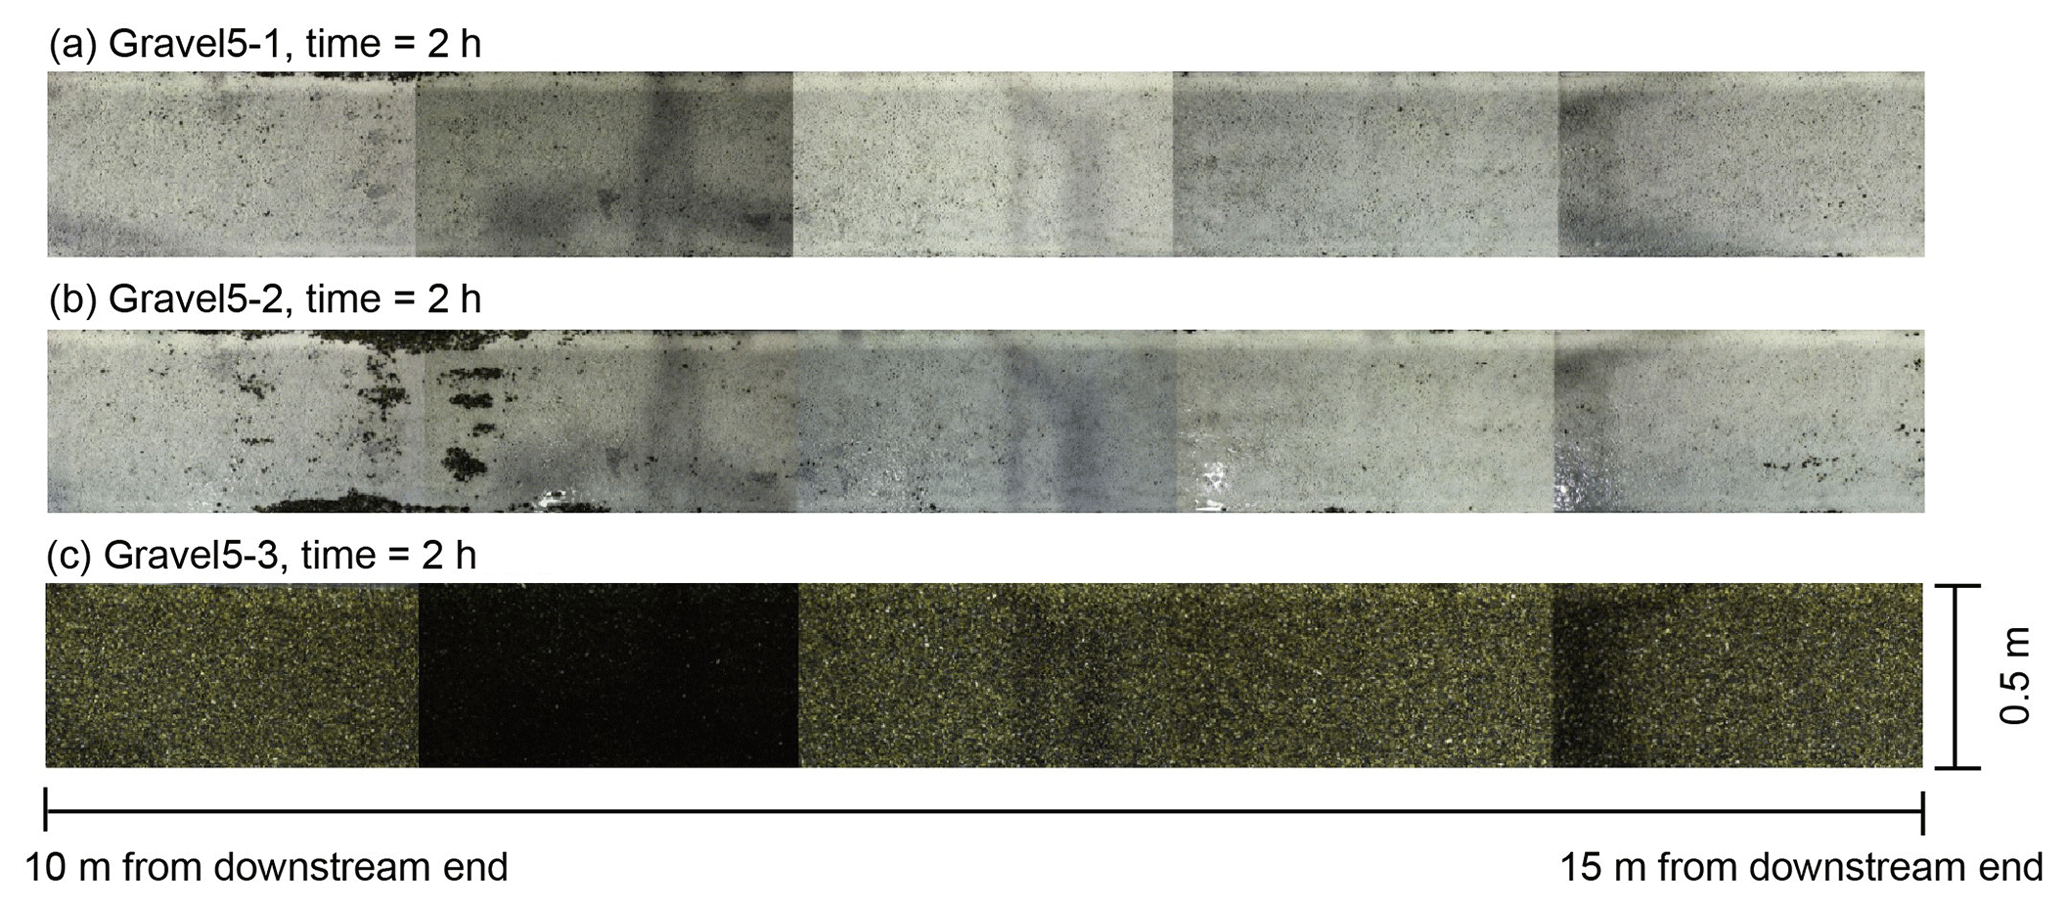
Figure 4Bedrock exposure in Gravel5 series at the end of the experiment. The initial bed had 5 mm embedded particles.
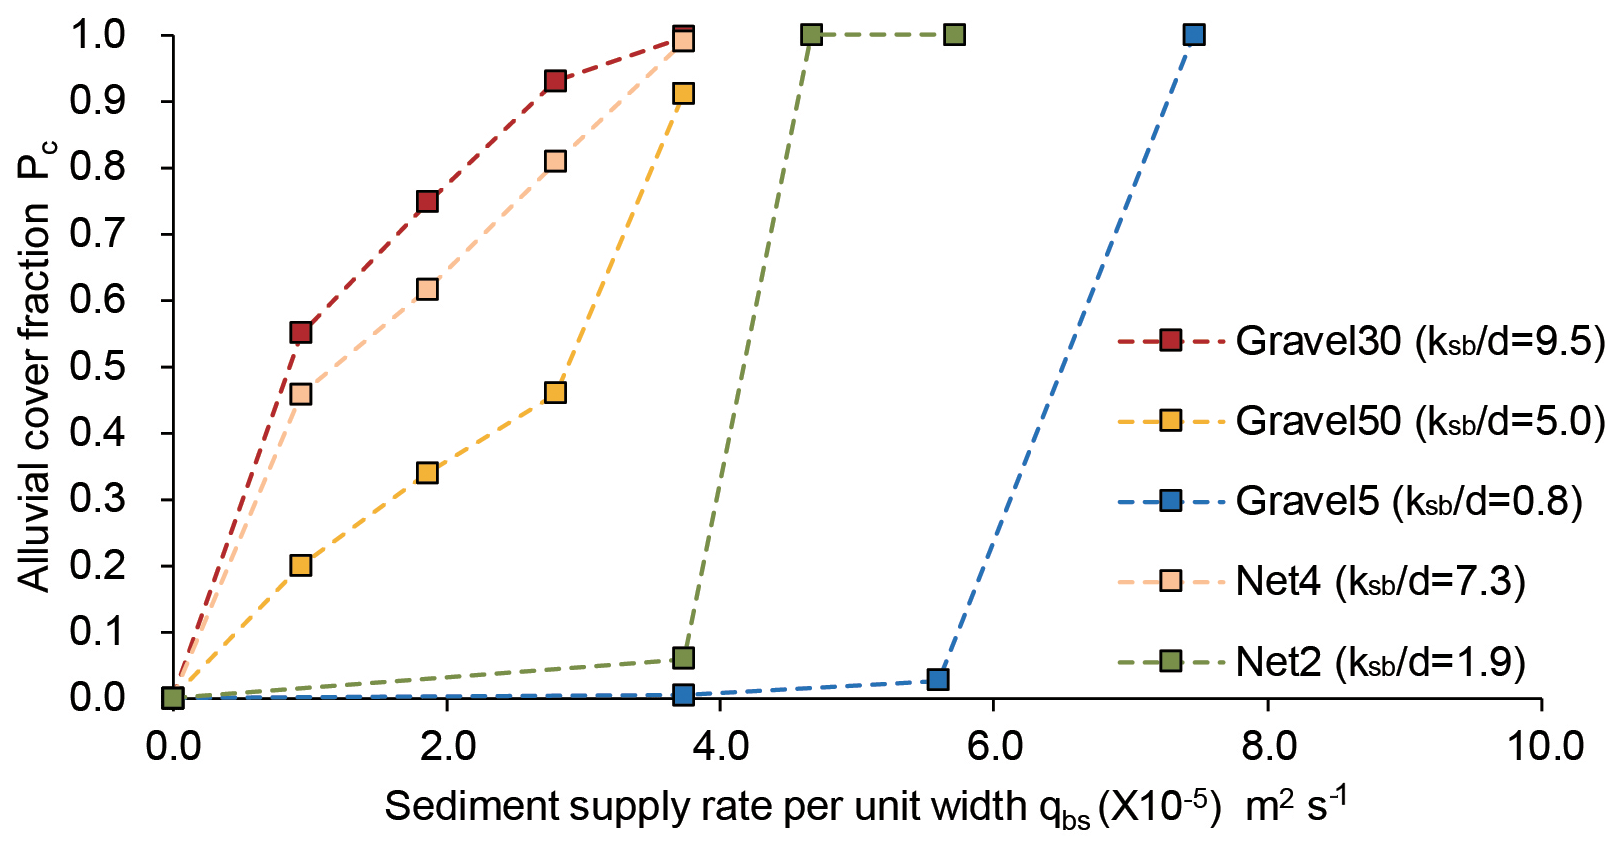
Figure 5 shows the relationship between the alluvial-cover fraction Pc and sediment supply per unit width, qbs. Pc is obtained by dividing the sediment-covered area by the total area of the channel from photographs. The value of Pc is 1 for a completely covered channel and 0 for a completely exposed bedrock bed. In Fig. 5, if we compare Gravel30-4, Gravel50-4, Gravel5-1, Net4-4 and Net2-1, the cases with equal sediment supply rate of m2 s−1, it can be observed that the alluvial-cover fraction is increasing with an increase in the bedrock roughness. Moreover, in the Gravel30, Gravel50 and Net4 series with high relative roughness of the bedrock bed ksb∕d (ratio of the hydraulic roughness height of bedrock bed ksb to the grain size d), Pc is roughly proportional to the sediment supply rate qbs. However, in the Gravel5 and Net2 series, which have lower ksb∕d (relative roughness of the bedrock bed), Pc shows hardly any increase when qbs is low (Gravel5-0, Gravel5-1, Gravel5-2, Net2-0, Net2-1), and when sediment supply (qbs) increases (Gravel5-3, Net2-2), the bedrock suddenly transitions to a completely alluvial bed. In clast-smooth bedrock (i.e. Gravel5 and Net2), it is possible to supply more sediment flux than qbca because qbcb (transport capacity on a completely bedrock bed) is larger than qbca(transport capacity on a completely alluvial bed).
3.3 Time series change in relative roughness
Figure 6 shows the change in relative roughness in a mixed alluvial–bedrock channel, i.e. ks∕d, with time in Gravel30 and Gravel5 series. In Gravel30 series with a higher initial relative roughness, relative roughness decreased due to the increase in alluvial deposition and cover. In Gravel5 series which has a lower initial relative roughness, relative roughness increased due to the increase in alluvial deposition and cover. The relative roughness nears ≈2 for both Gravel30-4 and Gravel5-3 in which the alluvial cover fraction approaches 1.
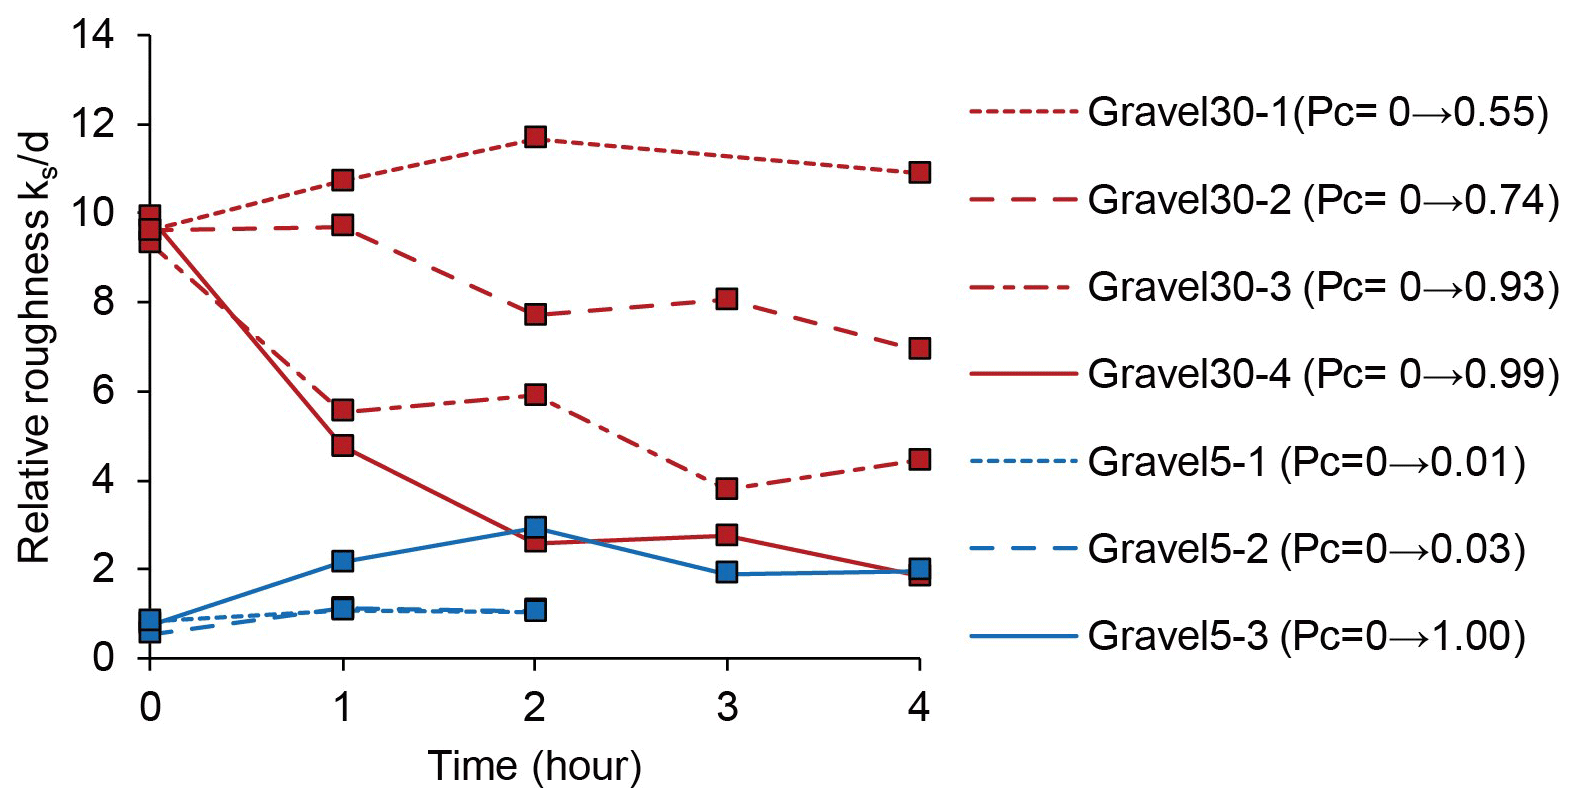

Figure 7 shows the variation in Pc with respect to relative roughness. In cases with lower initial relative roughness, for example, Gravel50 and Net2, the relative roughness is increasing with an increase in Pc; in contrast, in cases with higher initial relative roughness – Gravel30, Gravel5 and Net4 – an increase in Pc reduces the relative roughness. In addition, irrespective of the initial relative roughness, the bed becomes completely alluvial as Pc≈ 1 and its relative roughness becomes a similar value (i.e. 1 to 4). Several studies in the past have suggested that when the bed consists of uniform grain size, the hydraulic roughness height ks for such a gravel bed is 1 to 4 times the grain diameter d (Inoue et al., 2014; Kamphuis, 1974; Parker, 1991), which is also the case in our experiments as shown in Fig. 7.
4.1 Relationship between gravel layer thickness and alluvial cover fraction
The ratio of the alluvial thickness ηa to macro roughness L is not used in the model comparison in this study. However, we experimentally investigate ηa∕L because various numerical and theoretical models have predicted alluvial cover as a function of relative alluvial thickness (Zhang et al., 2015; Inoue et al., 2014; Parker et al., 2013; Tanaka and Izumi, 2013; Nelson and Seminara, 2012):
where ηa is the average thickness of the alluvial layer calculated from the total flume area instead of the area of sediment patches, and L is the macro-roughness height of the bedrock bed. Parker et al. (2013) define L as the macroscopic asperity height of rough bedrock rivers Lb (≈2σbr). Tanaka and Izumi (2013) and Nelson and Seminara (2012) define L as the surface unevenness of alluvial deposits on smooth bedrock river La (≈d). In this study, we define so that it can cope with both smooth and rough bedrocks. Figure 8 shows the relationship between relative gravel layer thickness ηa∕L and alluvial cover ratio. The figure confirms that the alluvial cover ratio of the experimental result can be efficiently evaluated by Eq. (17).
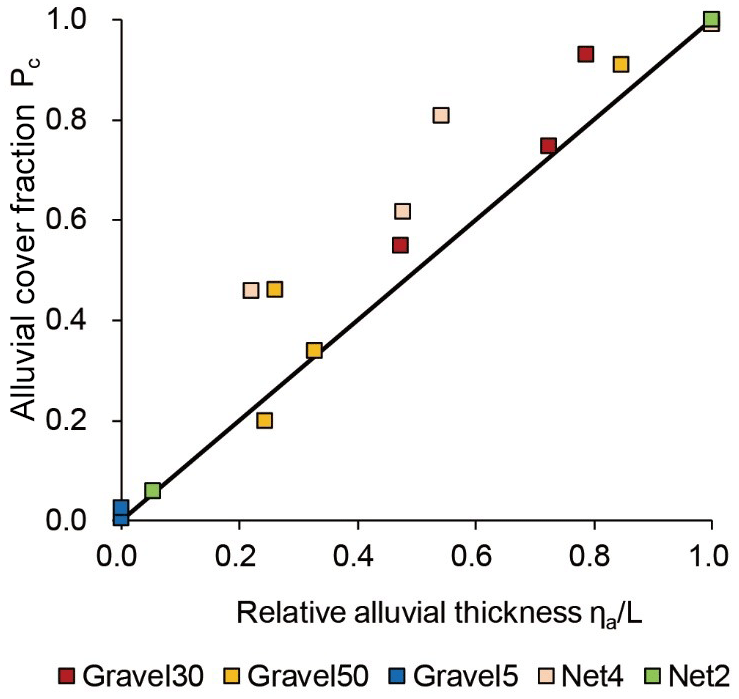
Figure 8Relationship between relative gravel layer thickness and alluvial cover. The black line represents the 1 / 1 line.
4.2 Relative roughness of the bedrock bed and dimensionless critical shear stress
Figure 9 shows the relationship between the ratio of the hydraulic roughness height of bedrock bed ksb to the grain size d (ksb∕d; referred to as the relative roughness of the bedrock bed in Sect. 3.2) and the dimensionless critical shear stress over bedrock bed τ∗cb. In this figure, we compare the results obtained from Inoue et al. (2014) (Eq. 5) and Johnson (2014) (Eq. 10) with the experimental results in this study, experimental results of Inoue et al. (2013) (the same channel and grain size as this study but with a smoother bedrock bed), and Inoue et al. (2014) (the channel excavated in Ishikari River).
According to Fig. 9, the non-dimensional critical shear stress depends on the relative roughness of the bedrock bed to the power of 0.6. In addition, the results obtained from Eq. (5) of the macro-roughness model are not compatible with the experimental results in the region where relative roughness of the bedrock bed is small. In this study, we used the power approximation shown below instead of Eq. (5) in the macro-roughness model by Inoue et al. (2014):
Likewise, the results obtained from Johnson's model (2014) (Eq. 10) (surface-roughness model) are roughly consistent with our experimental results (i.e. ) but inconsistent with the experimental results of Inoue et al. (2013) (i.e. ).
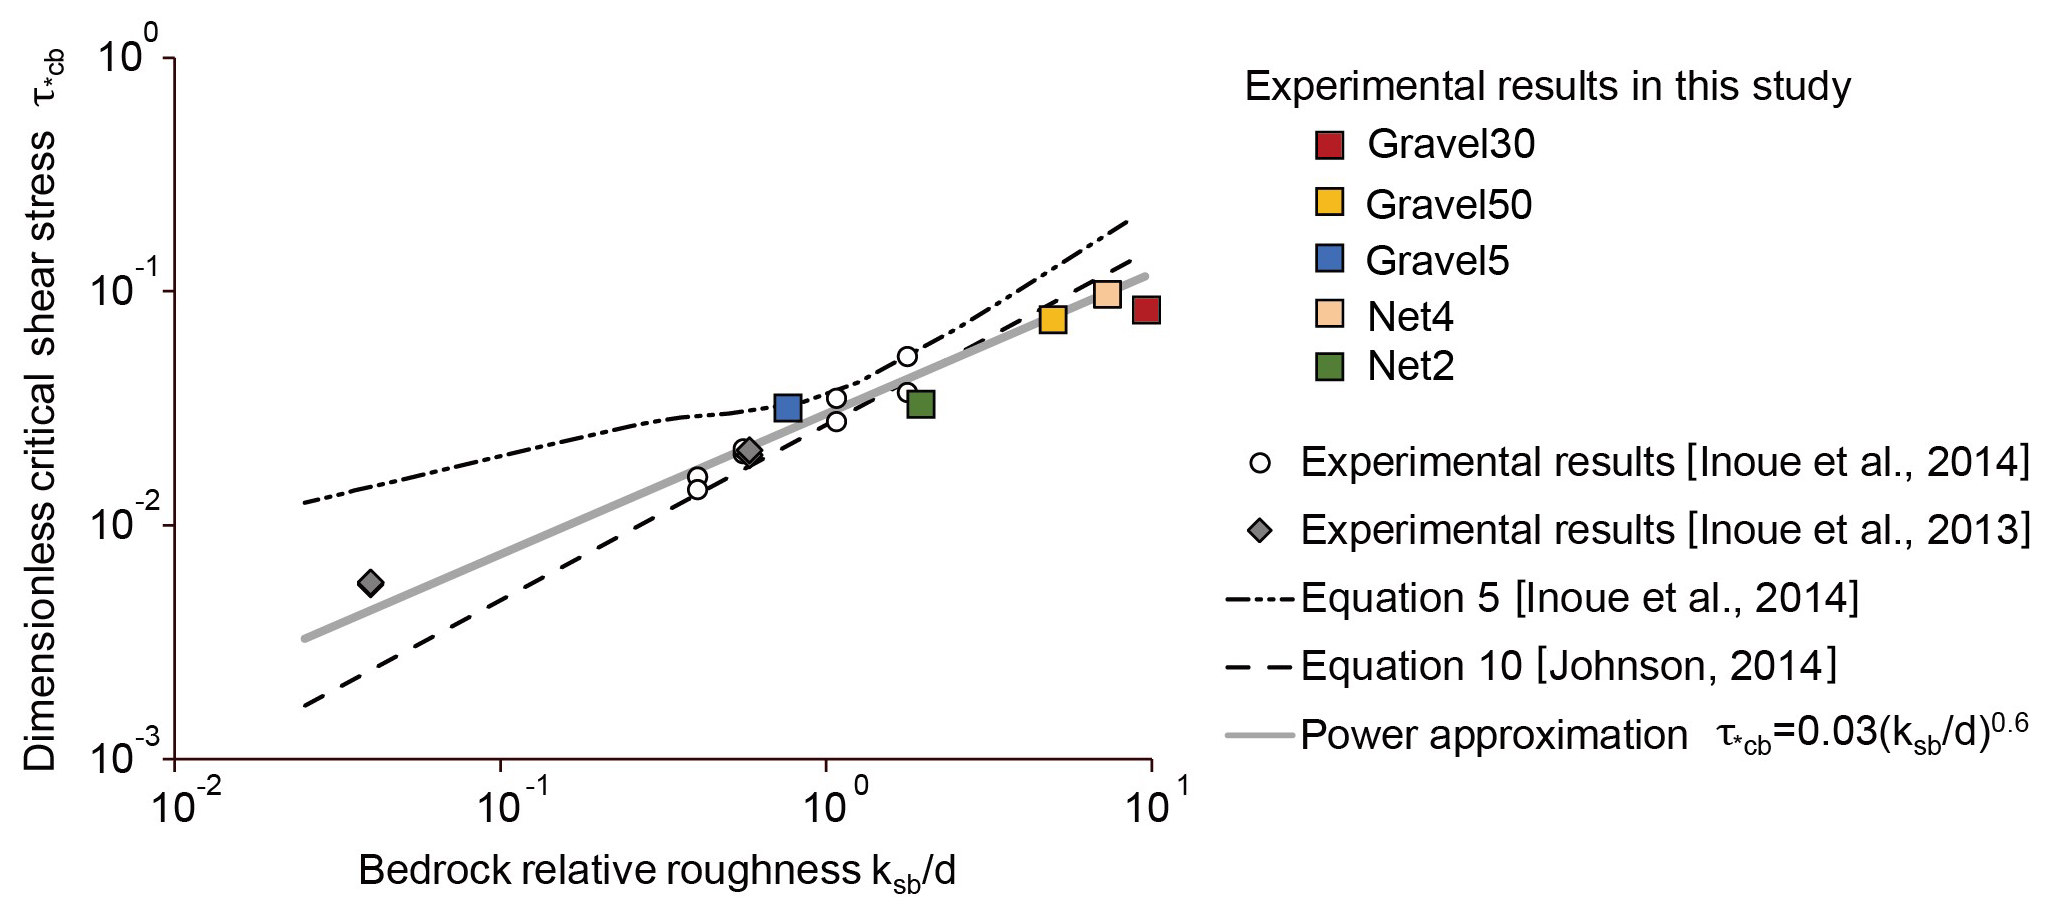
Figure 9Relationship between relative roughness of the bedrock bed and dimensionless critical shear stress. The black squares show the results of this experiment, the white circles show the results of an investigation using the bedrock of Ishikari River in 2011 (Inoue et al., 2014), the grey rhombus represents a smooth aquifer floor (Inoue and Ito, 2013), and the grey line shows the power approximation of all the experimental results. The dotted line shows the results from Eq. (5) proposed by Inoue et al. (2014). The black double dotted lines show the results obtained by Eq. (10) (Johnson, 2014). The grain size (d) in the case of Inoue et al. (2013) is 5 mm. Inoue et al. (2014) used gravel sized 12 and 28 mm.
4.3 Predicting experimental results of alluvial cover ratio using the models
For the purpose of model comparisons with experimental results, we first calibrate the model parameters included in the exponential model, the surface-roughness model and the probabilistic model to minimize RMSD (root mean square deviation) of cover between experimental data and the model. We do not calibrate the linear and macro-roughness models as they do not include free model parameters.
The parameter φ in the exponential model implies that the probability of sediment deposition in uncovered areas (Turowski et al., 2007) can vary with the roughness of the bedrock. The parameter k#D in the surface-roughness model (Johnson, 2014) represents the change in alluvial roughness that varies with the cover. When k#D equals 1, it means the alluvial hydraulic roughness is proportional to the grain diameter size and is independent of the cover fraction. For our calculations, we have used k#D=4 as applied in Johnson (2014). The parameter rbr in the surface-roughness model is used to calculate the hydraulic bedrock roughness ksb from the topographic roughness σbr. This value can be back calculated from the experimental results (Fig. 2), but using the back-calculated value (i.e. using the observed ksb instead of the calculated ksb) did not minimize the RMSD of cover. Hence we adjusted rbr to minimize the RMSD of cover. The parameter ω is introduced to express the relation between the deposition probability and the cover ratio exponentially and can vary with bedrock roughness. The parameter represents the dimensionless value of sediment mass at sediment transport capacity. Although this parameter is calculated from Eq. (14), the experimental results could not be reproduced only by adjusting ω. Hence we adjusted both ω and by trial and error to minimize the RMSD of cover. Table 2 provides the calibration values.
Table 2rbr and φ values for comparison with the experimental results.
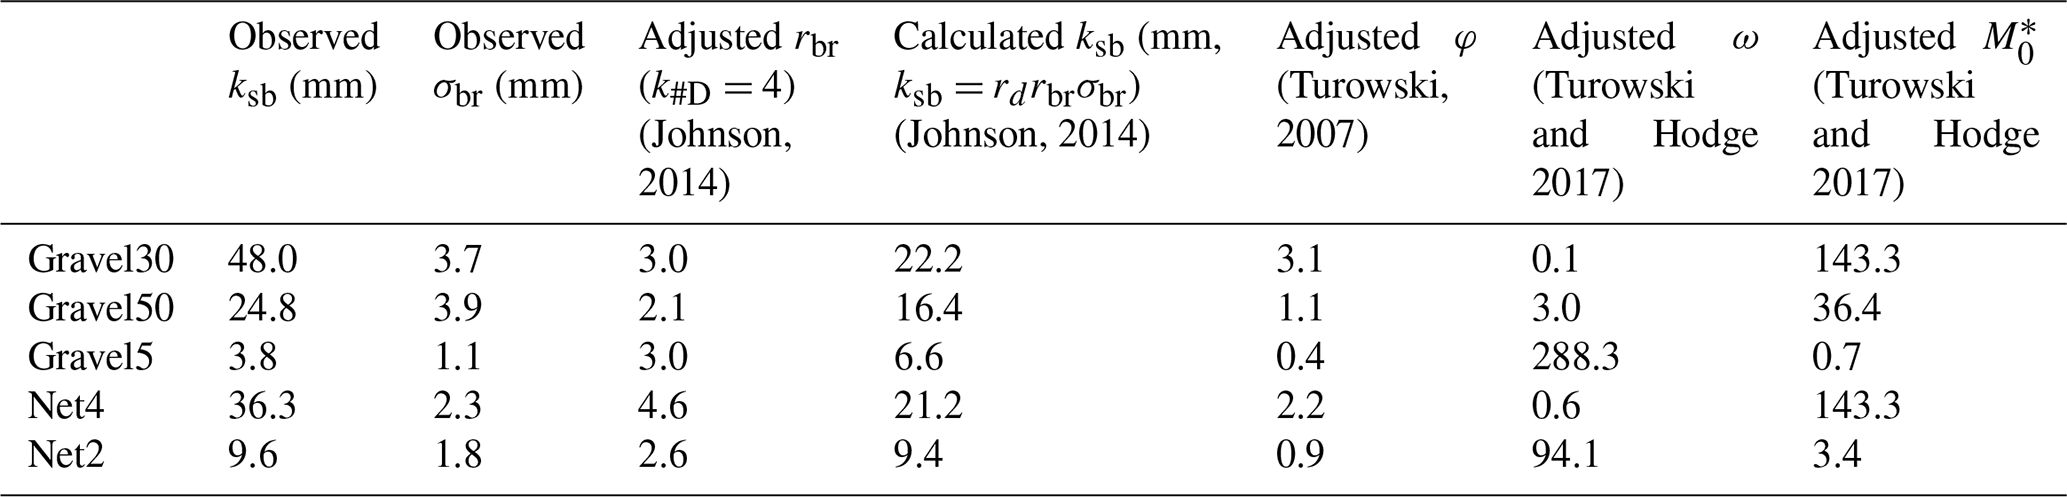
Figure 10 shows the comparison among experimental results presented in this paper, the linear model of Sklar and Dietrich (2014), and the exponential model of Turowski et al. (2007). In order to calculate the model results for Fig. 10, we altered the ratio of qbs∕qbca by 0.01, 0.02, 0.03 and so on. This figure suggests that the linear model is generally applicable to rough bed with relative roughness of the bedrock bed (ksb∕d) of two or more but not to smooth bed with relative roughness of the bedrock bed (ksb∕d) less than two (Gravel30, Gravel50 and Net4). As suggested by Inoue et al. (2014), in this study, “clast-smooth bed” refers to the bed with roughness less than the roughness of supplied gravel, and “clast-rough bed” stands for the bed with roughness more that the roughness of the supplied gravel. The exponential model is also more suitable for a clast-rough bed.
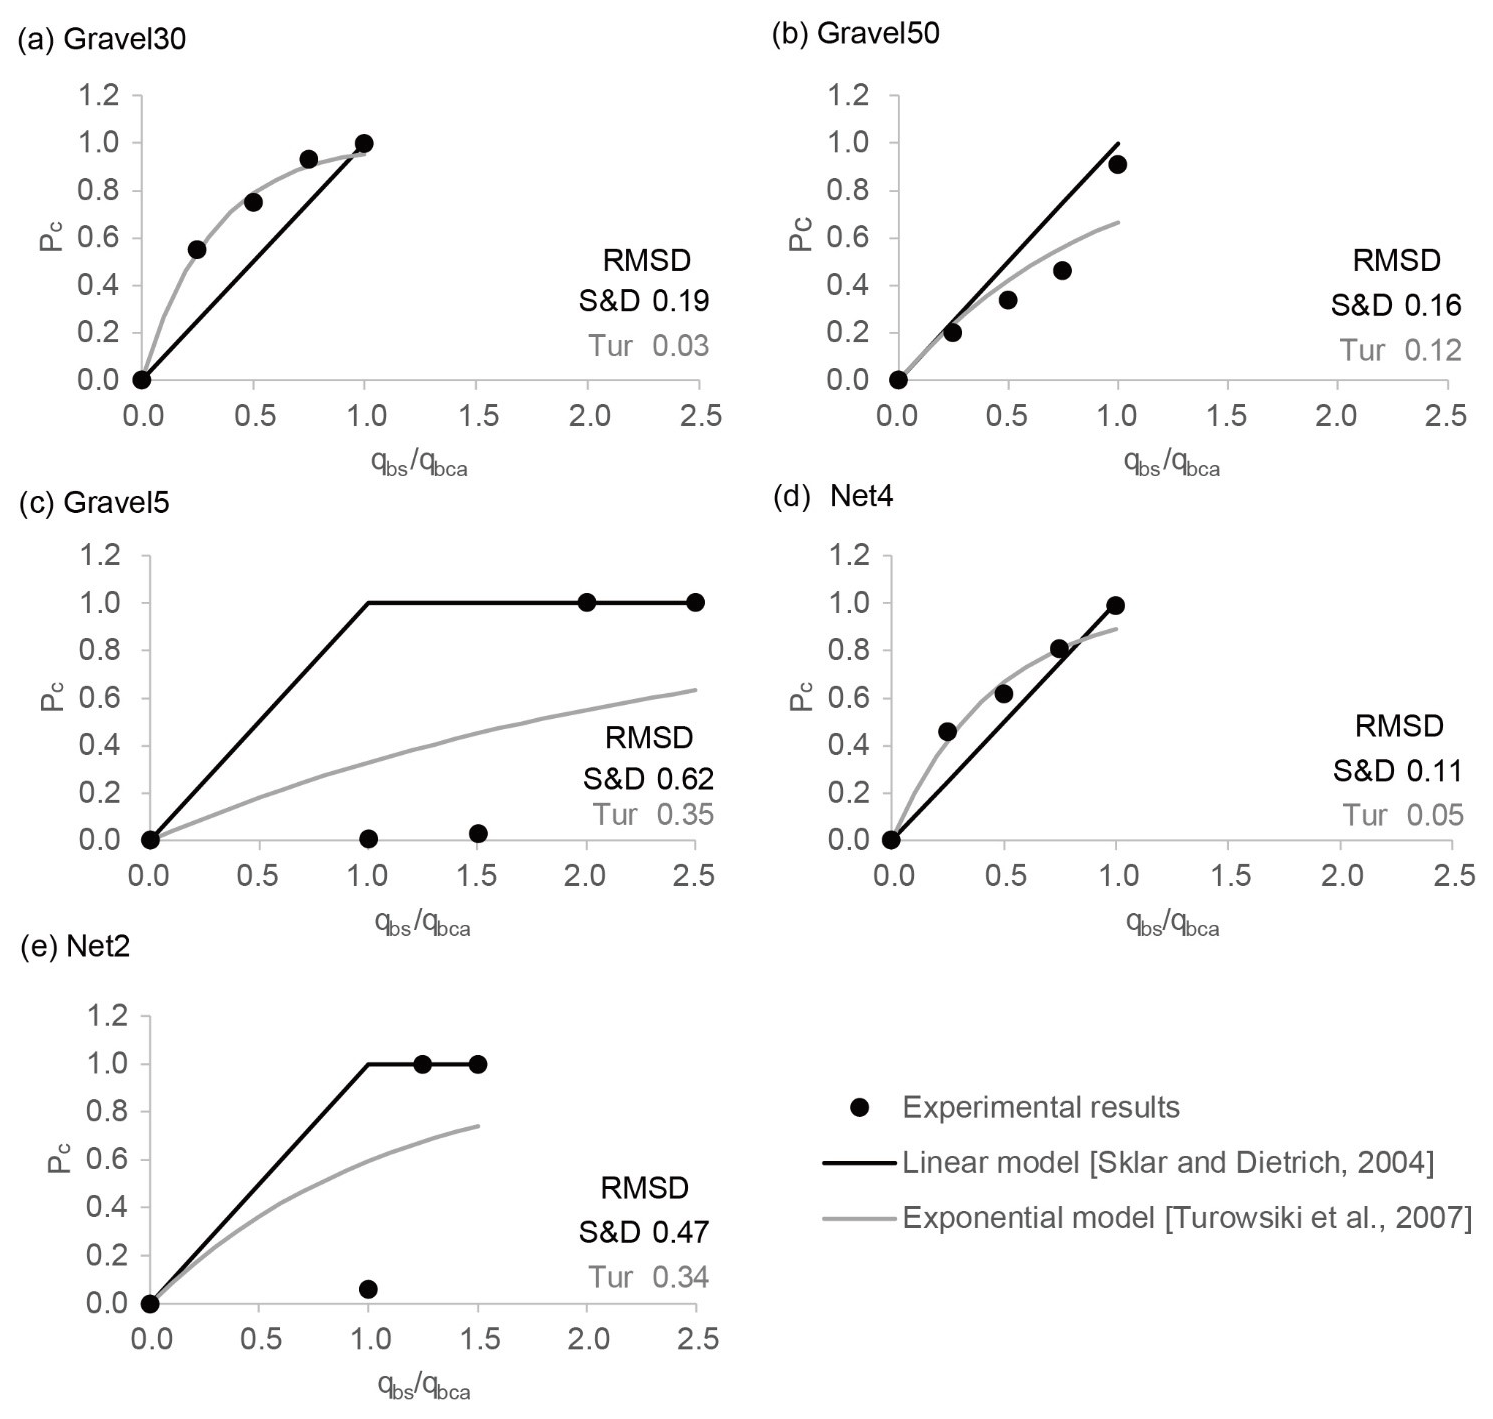
Figure 10Comparison of our experimental results, the linear model by Sklar and Dietrich (2004), and the exponential model by Turowski et al. (2007).
Figure 11Comparison of our experimental results with roughness models by Inoue et al. (2014) and Johnson (2014). The rbr for the surface-roughness model and the φ for the exponential model are adjusted to minimize RMSD of the alluvial cover (see Table 2). Note that there is no adjustment of ksb in the macro-roughness model.

Figure 12Comparison of our experimental results with the probabilistic model proposed by Turowski and Hodge (2017).
Figure 11 shows the comparison of our observed experimental values with the macro-roughness model of Inoue et al. (2014) and the surface-roughness model of Johnson (2014). In roughness models, qbc∕qbca ( in dynamic equilibrium state in the roughness models) is calculated with a given Pc at intervals of 0.01. It shows that the macro-roughness model proposed by Inoue et al. (2014) can predict the increasing alluvial cover for cases with high relative roughness of the bedrock bed (ksb∕d), as well as the rapid alluviation and hysteresis (green shaded region) for cases with lower relative roughness of the bedrock bed (Gravel5 and Net2), without adjusting the roughness. The surface-roughness model proposed by Johnson (2014) also shows good agreement in predictions of alluvial cover and rapid alluviation and hysteresis if rbr are adjusted.
As mentioned earlier, the major difference between the macro-roughness model (Inoue et al., 2014) and the surface-roughness model (Johnson, 2014) is the way the transport capacity is calculated. In the case of the surface-roughness model (Johnson, 2014), first, the transport capacities for bedrock (qbcb) and alluvial bed (qbca) are separately calculated, then the total transport capacity (qbc) is calculated for a range of cover fractions (Pc). Hence, in cases when , the transport capacity over bedrock portion qbcb equals 0, and thereby the bedrock roughness hardly affects the alluvial cover fraction which can also be the reason for inconsistency between the surface-roughness model (Johnson, 2014) results and experimental study for Gravel30 and Net4 in Fig. 11. In contrast, in the case of the macro-roughness model (Inoue et al., 2014), the critical shear stress takes into account the value of total hydraulic roughness, which depends on cover fraction, alluvial hydraulic roughness and bedrock hydraulic roughness. Hence, even when τ∗ is smaller than τ∗cb , the bedrock roughness tends to affect the cover fraction. The macro-roughness model (Inoue et al., 2014) is more capable of dealing with clast-rough surfaces.
Figure 12 shows the comparison of experimental results with the probabilistic model of Turowski and Hodge (2017), here we altered the ratio of qbs∕qbca by 0.01, 0.02, 0.03 and so on. The model produces favourable results following some parameter adjustments. Because the probabilistic model (Turowski and Hodge, 2017) does not consider the effect of bedrock roughness on entrainment and deposition, the model parameter ω and characteristic sediment mass need to be adjusted by trial and error to minimize the RMSD of cover. The value of ω can be as high as 94 or 288 for runs with rapid alluviation hysteresis, whereas it is as low as ≈3 for other runs.
In Fig. 11, in Gravel5 and Net2 series with relatively smooth beds, rapid alluviation occurred because the transport capacity over bedrock qbcb is larger than that over alluvial bed qbca. The reverse-line slopes produced by macro-roughness and surface-roughness models depict similar hysteresis relationship between alluvial cover and sediment supply. The shaded portion shows that as qbs∕qbca increases, the cover does not increase unless it reaches a threshold (, i.e. sediment supply rate is higher than transport capacity over fully exposed bed), after which the cover increases abruptly, showing rapid alluviation. The shaded portion, however, is unstable between Pc=0 and Pc=1; i.e. it shows the hysteresis of rapid alluviation and rapid entrainment. If qbs becomes smaller than qbca, Pc will decrease until Pc equals 0 (rapid entrainment). For the bed to become alluviated again, qbs must reach a condition where , in which case rapid alluviation will happen again. This phenomenon has also been observed in sufficiently steep channels for slopes greater than 0.015 by Chatanantavet and Parker (2008). Hodge and Hoey (2016b) also suggested a similar relationship between sediment cover and sediment supply. However, our study shows that rapid alluviation occurs irrespective of the slope steepness if roughness of the bed is less than the roughness of supplied gravel, i.e. when relative roughness of the bedrock bed is less than 2.
In a channel without bars and with a relatively regular roughness distribution (i.e. a channel close to a one-dimensional flow field), the macro-roughness model (Inoue et al., 2014) is the most suitable because it can predict alluvial cover ratio without adjusting the parameters. When the observation of hydraulic roughness is difficult, it is useful to obtain the hydraulic roughness from the topographical roughness like the surface-roughness model (Johnson, 2014). However, accurate prediction of hydraulic roughness should take into account not only the bedrock topographic roughness but also the arrangement of bed unevenness. For example, in Fig. 2, the topographic roughness of Gravel50 is higher than that of Gravel30, but the hydraulic roughness of Gravel50 is lower than that of Gravel30. Ferguson et al. (2019) argued that the standard deviation of exposed bed is an effective way of estimating roughness; however, their finding is for a relatively smooth bedrock. Furthermore, in order to deploy models on a field scale, they must take into account bank roughness and its effects on shear stress and other hydraulic parameters (Ferguson et al., 2019). The prediction of hydraulic roughness from topographic roughness requires further work.
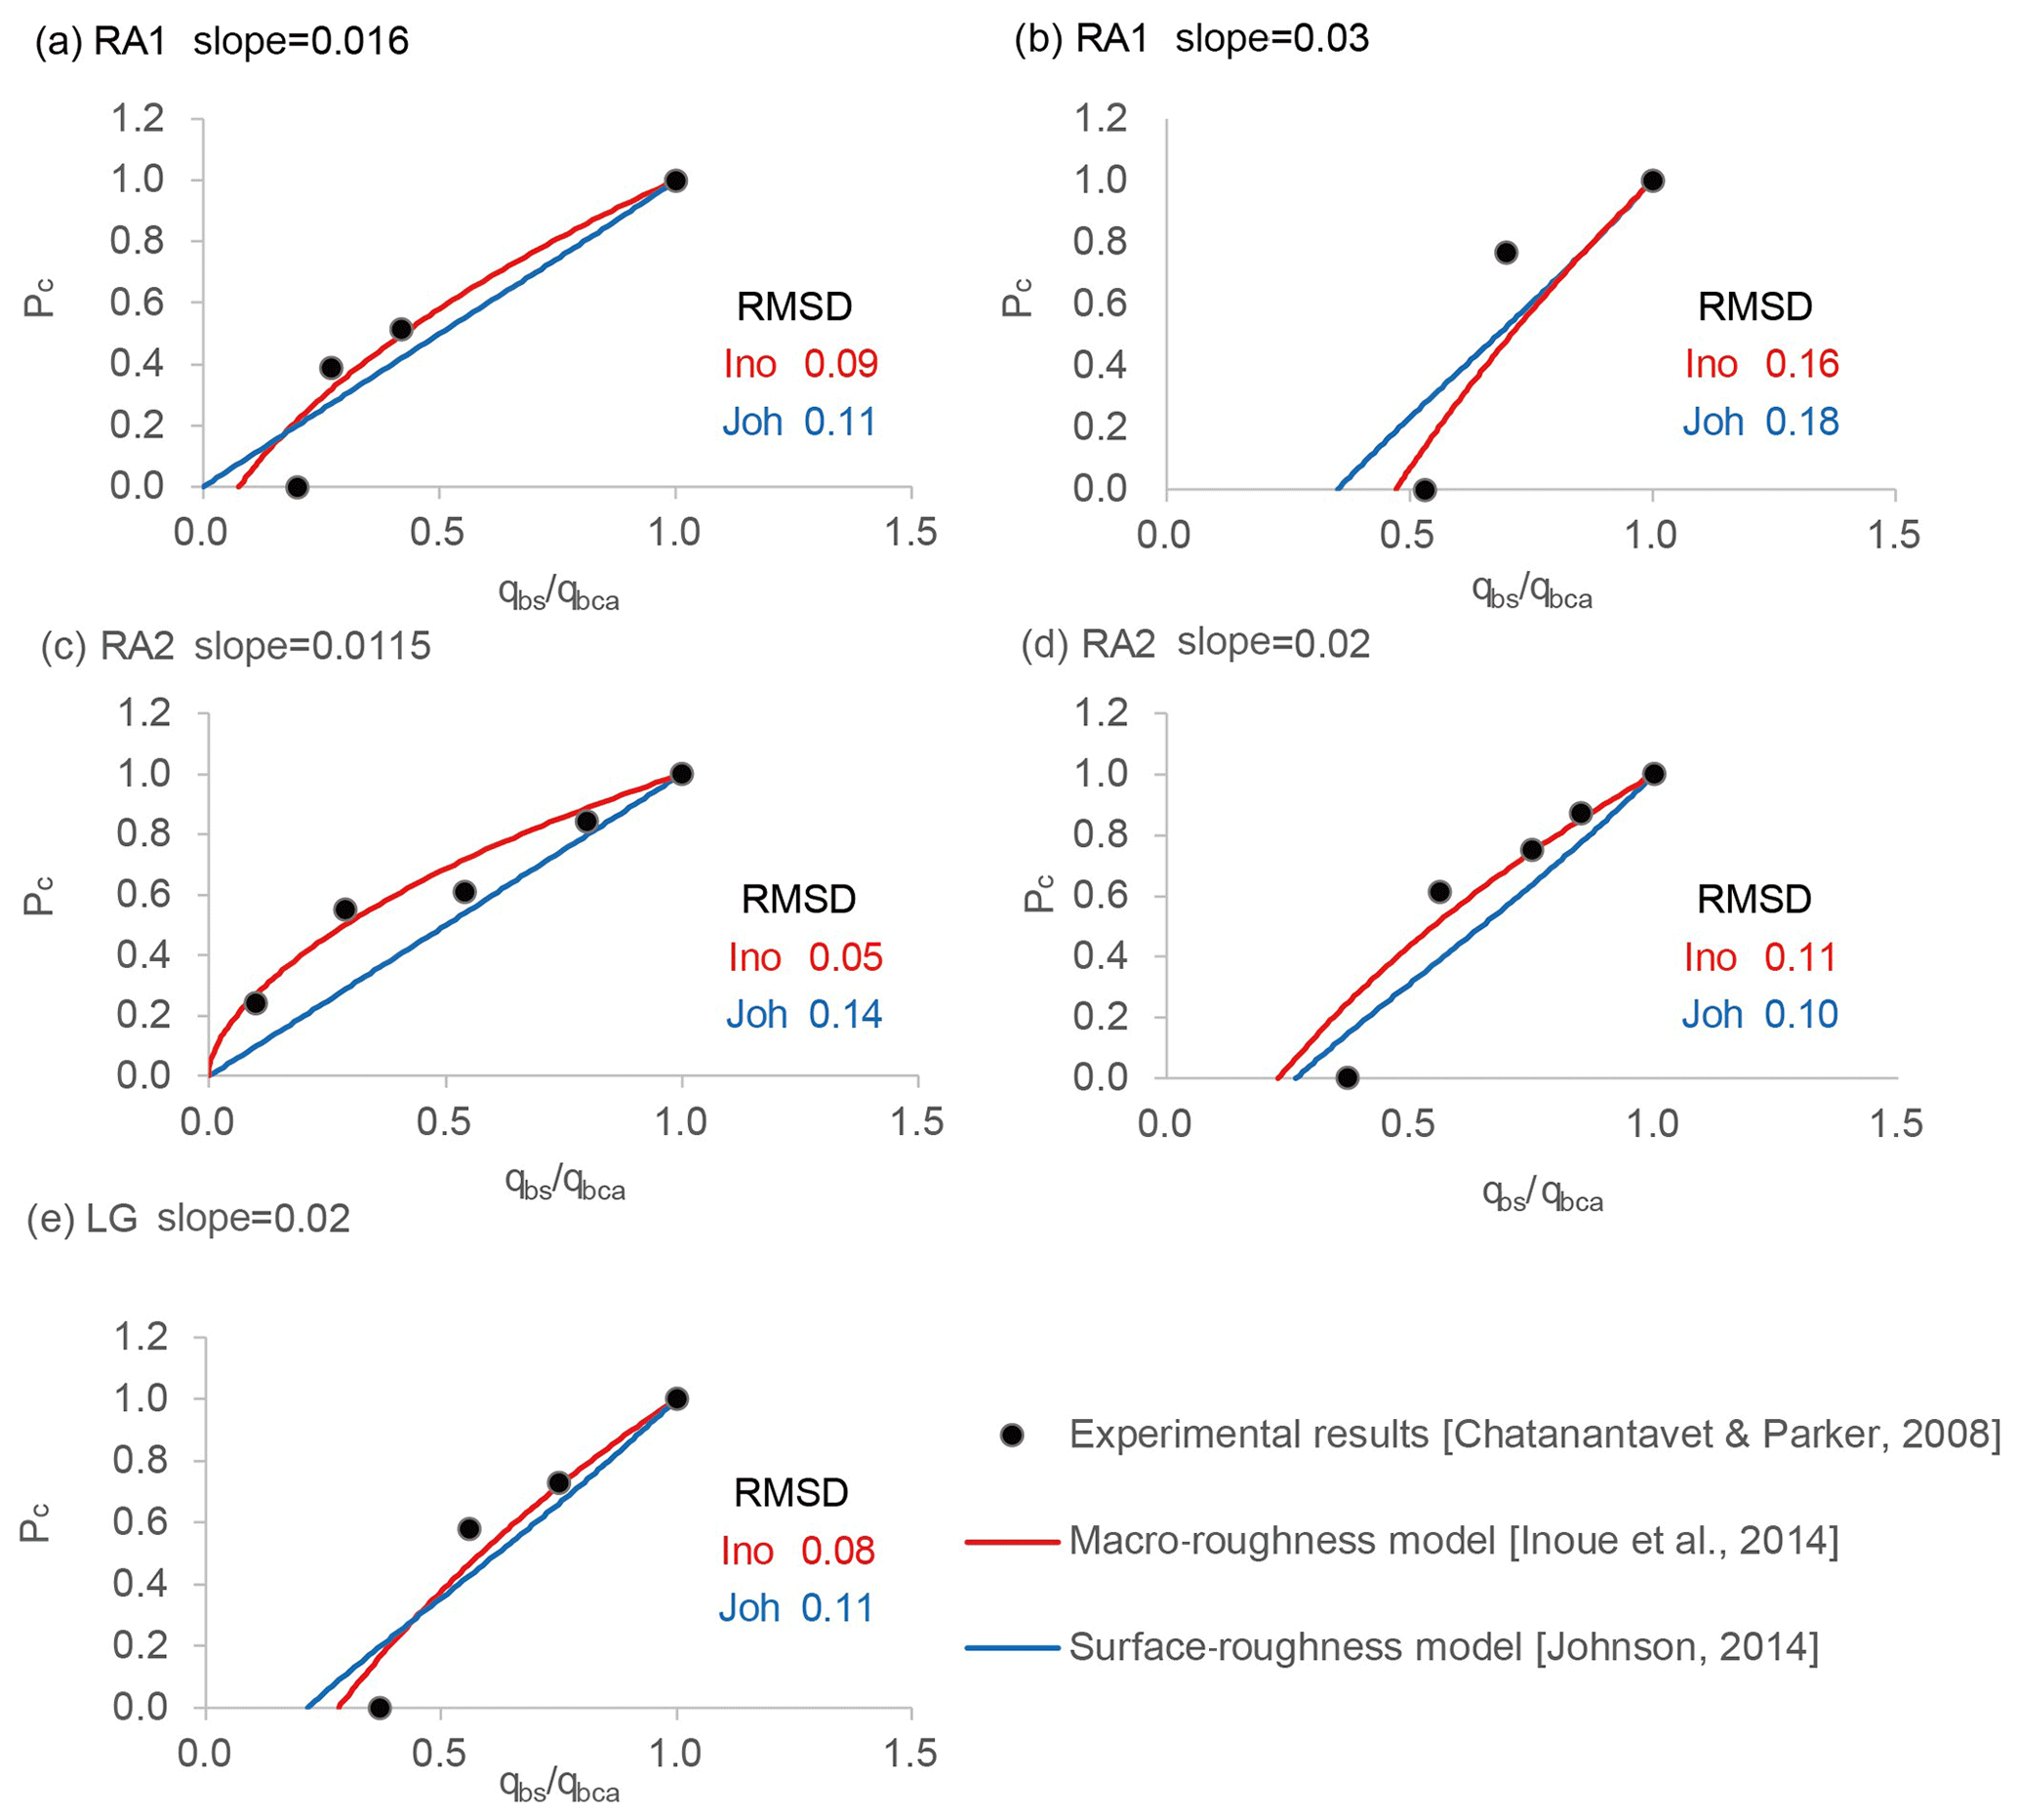
Figure 13Comparison of the experimental results (Chatanantavet and Parker, 2008) with the macro-roughness model (Inoue et al., 2014) and the surface-roughness model (Johnson, 2014). RA1, RA2 and LG represent the type of bedrock surface in the experiments conducted by Chatanantavet and Parker (2008); RA1 is random abrasion type 1, RA2 is random abrasion type 2 and LG is longitudinal grooves, respectively. The rbr for the surface-roughness model and the ksb for macro-roughness model are adjusted to minimize RMSD of the alluvial cover (see Table 3). Representations of (a) runs 2-C1 to 2-C4, (b) runs 2-E1 to 2-E3, (c) runs 3-A1 to 3-A5, (d) runs 3-B1 to 3-B5, and (e) runs 1-B1 to 1-B4 (Chatanantavet and Parker, 2008; Table 1).
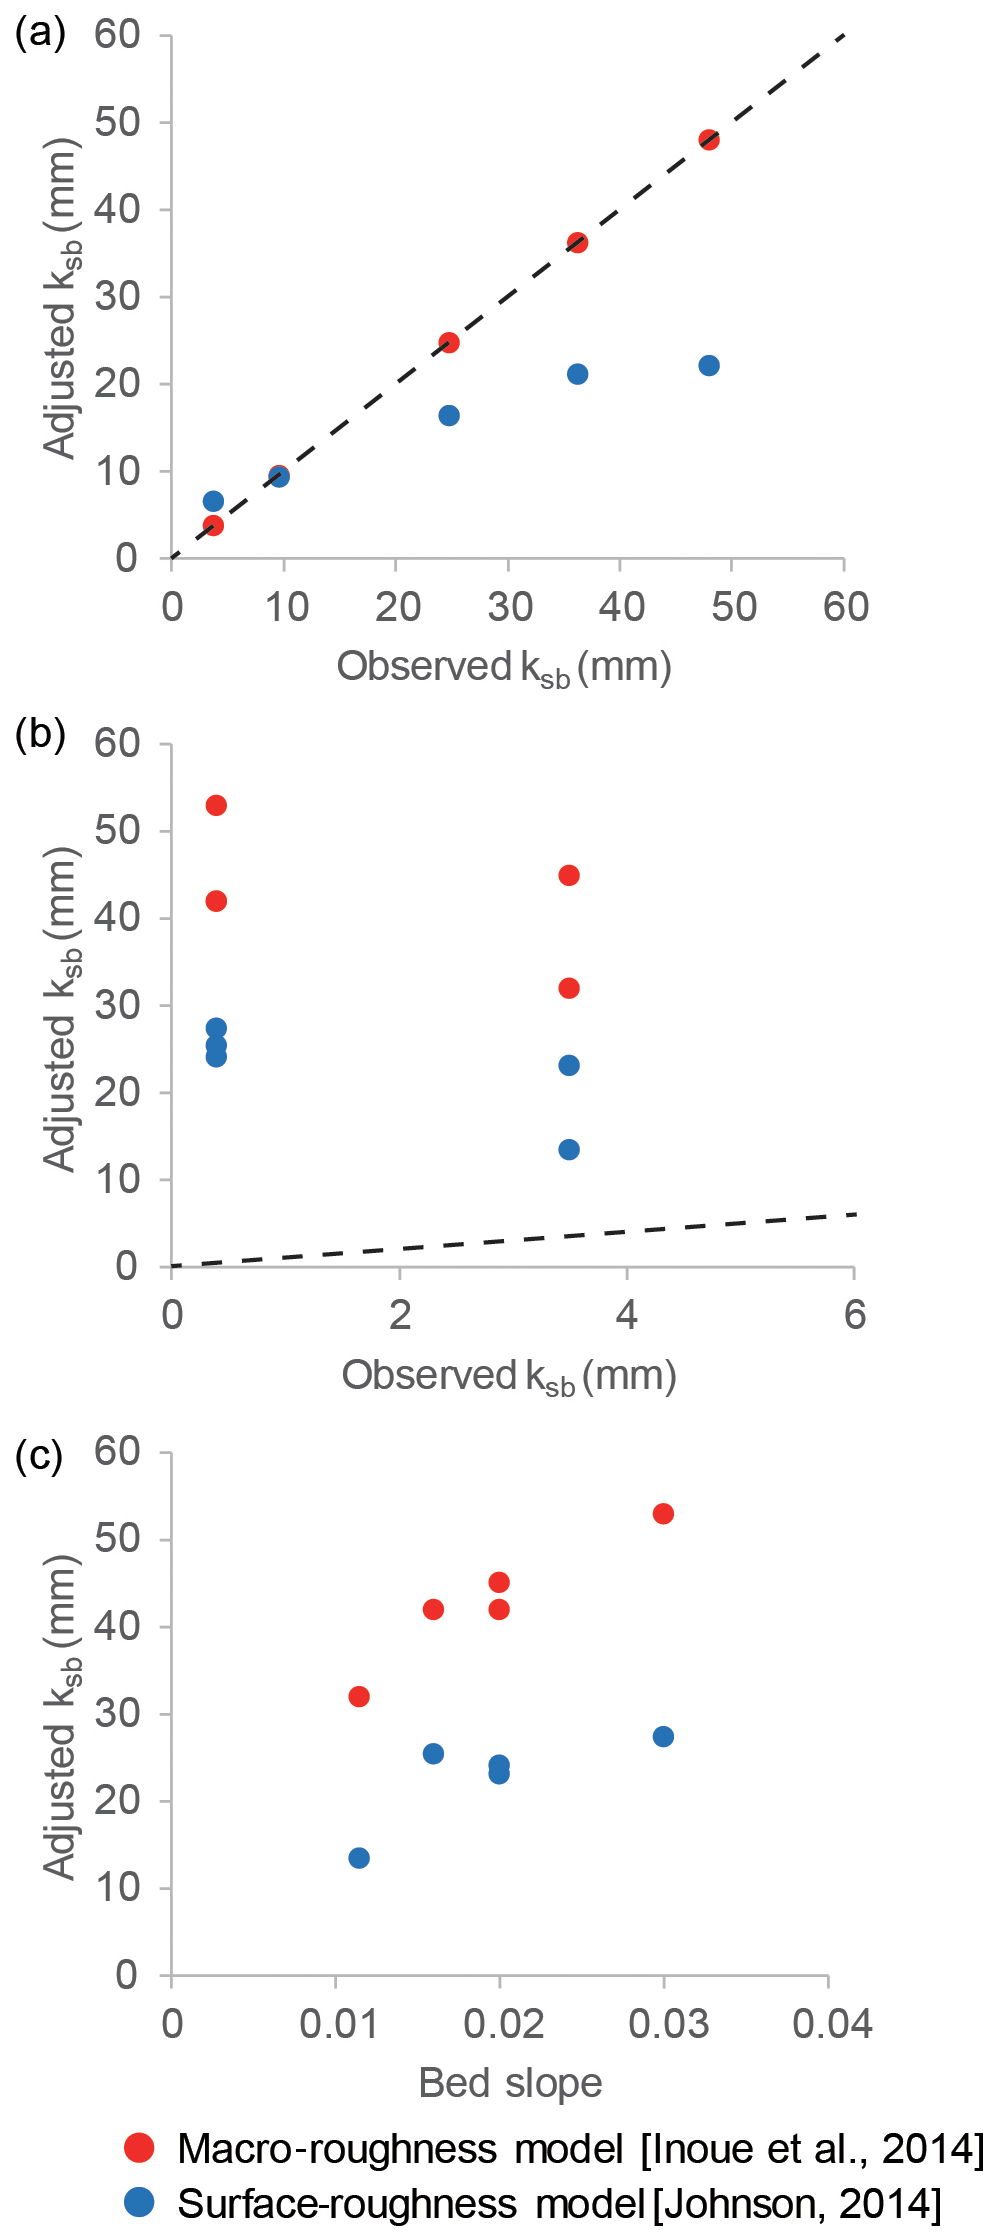
Figure 14(a) Comparison between adjusted and observed hydraulic roughness height of bedrock bed for our experiments. ksb for the macro-roughness model is equal to the observed values because there was no need for adjustment. (b) Comparison between adjusted and observed hydraulic roughness height of bedrock bed for the experiments conducted by Chatanantavet and Parker (2008). (c) Sensitivity of adjusted ksb to bed slope S for experiments conducted by Chatanantavet and Parker (2008). Note: The black dotted line is the 1:1 line.
Another solution is to use the probabilistic model (Turowski and Hodge, 2017). The probabilistic model proposed by Turowski and Hodge (2017) could reproduce experimental results, but the model needed optimization of ω and to minimize the RMSD. Small ω means that the deposition probability gradually decreases with increasing alluvial cover; in contrast, large ω means that the deposition probability rapidly approaches zero with increasing alluvial cover. The model, however, does not emulate the hysteresis for clast-smooth beds. In this case, we may need to use different probability functions for entrainment and deposition. In addition, calculated physically from Eq. (14) is 0.04 (alluvial bed) to 0.06 (smoothest bedrock, i.e. Gravel5) in this experiment, which is significantly different from the adjusted Because the model does not include the effects of bed roughness yet, further alterations to take into account the effect of the probability of grain entrainment and deposition can greatly extend the applicability of the model. How to link ω and with topographic roughness is a future issue.
4.4 The effects of bar formation on alluvial cover
For investigating the influence of bed roughness and bar formation on the alluvial cover, we also compared the experimental results of Chatanantavet and Parker (2008) with the model results of the physically based models including interaction between roughness and alluvial cover (i.e. Inoue et al., 2014; Johnson, 2014). Chatanantavet and Parker (2008) conducted experiments in a metallic straight channel with three different types of bedrock bed surfaces, namely longitudinal grooves (LGs), random abrasion type 1 (RA1) and random abrasion type 2 (RA2); RA1 is smoother than RA2. They performed various cases for each type with a varying slope range of 0.0115–0.03. They also varied the sediment supply rate and grain size (2 and 7 mm). The major difference between their experiment and our experiments is the width–depth ratio. The width–depth ratios of their experiments were 11–30 and thus allowed for the formation of alternate bars. In contrast, the width–depth ratios of our experiments were 6.1–8.3, and, as a result, alternate bars usually cannot develop. Although we can see alternate alluvial patches in Fig. 5, their thickness was less than 1 cm, and the patches did not progress to alternate bars with large wave height.
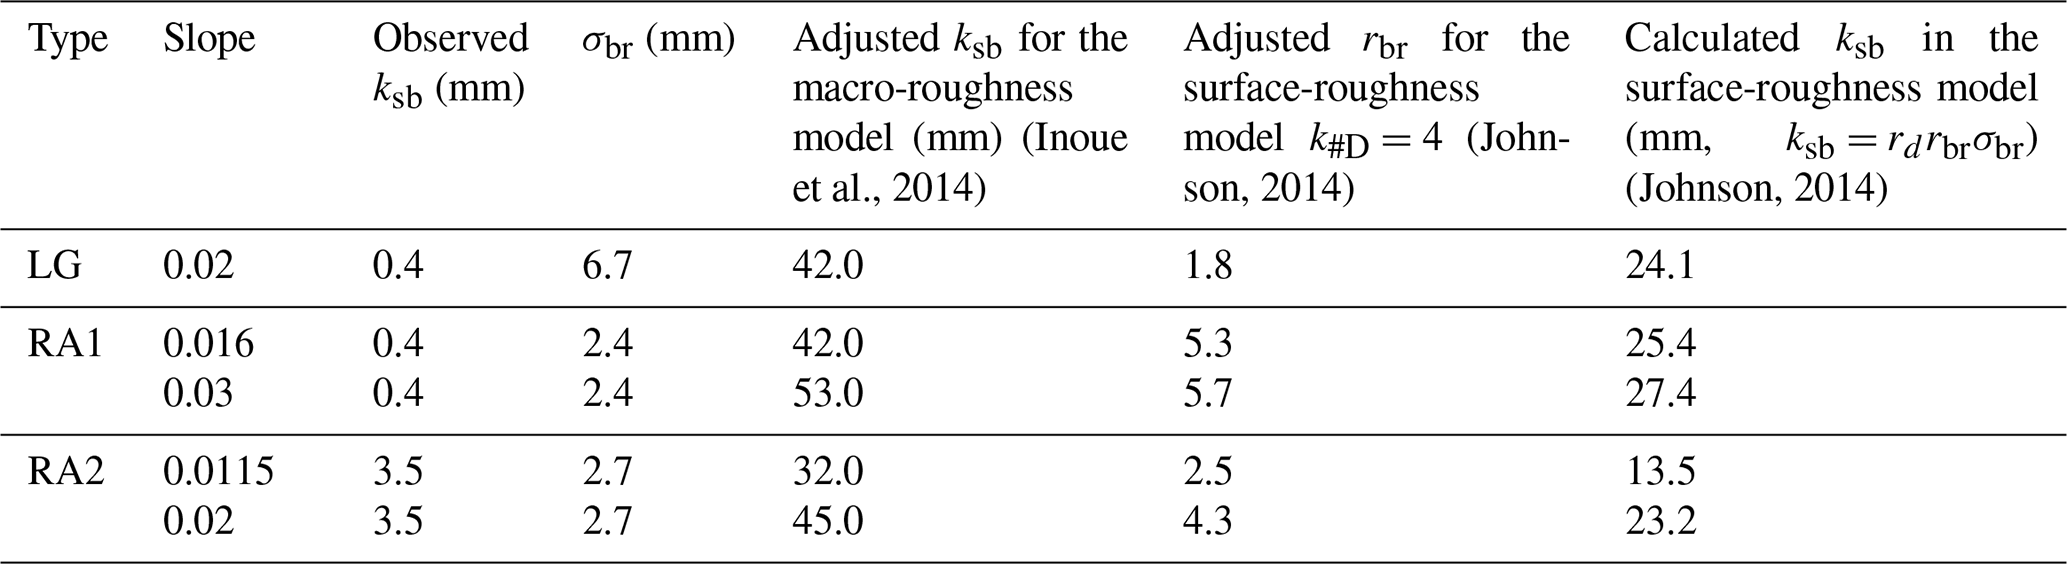
Figure 13 shows the comparison among the two models and the experiment of Chatanantavet and Parker (2008). The experimental conditions are taken from Table 1 of Chatanantavet and Parker (2008). Because the two models do not include the two-dimensional effects caused by bar formation, we adjusted ksb in the macro-roughness model in addition to rbr in the surface model. In the case of the surface-roughness model, k#D=4 is used, the bedrock surface roughness required for calculations is taken as mentioned in Table 1 (Johnson, 2014), rbr is adjusted to minimize RMSD of cover between experiments and the model. In the case of the macro-roughness model by Inoue et al. (2014), ksb is adjusted to minimize RMSD of cover. The two models can accurately predict the cover fraction and rapid alluviation for the experimental study conducted by Chatanantavet and Parker (2008). However, the adjusted roughnesses were significantly different from the observed value. In the case of the experiment of Chatanantavet and Parker (2008), ksb equals approximately 0.4 to 3.5 mm (Chatanantavet and Parker, 2008; Table 1), whereas in Johnson's surface-roughness model (2014), ksb (=rdrbrσbr) can be as much as 13–27 mm. Furthermore, in the case of the macro-roughness model of Inoue et al., ksb is adjusted to 32–53 mm (Table 3).
In Table 3, when we compare the observed ksb with the adjusted ksb in the roughness models proposed by Inoue et al. (2014) and Johnson (2014), the adjusted ksb strongly depends on observed ksb in our experiments without alternate bars (Fig. 14a). In contrast, the adjusted ksb is not dependent on the observed ksb in the case of the experiments with alternate bars conducted by Chatanantavet and Parker (2008) (Fig. 14b). This suggests that bedrock roughness has a weaker effect on the alluvial cover in the case of mixed alluvial–bedrock rivers with alternate bars. In such rivers, the bed slope may affect the alluvial cover fraction (Fig. 11c) because the bar formation process depends on the slope, as well as the width–depth ratio (e.g. Kuroki and Kishi, 1984).
Table 3Parameter calibration values for comparison with experimental results of Chatanantavet and Parker (2008)
The roughness models are adjusted to produce the experimental results with alternate bars by fine-tuning rbr and ksb values which must be determined by the trial and error method. While this method can be applicable to laboratory-scale experiments, the model calibration is unfeasible for a large-scale channel or natural rivers. In general, the formation of alternate bars is barely reproduced with a one-dimensional model as introduced in this study. In the future, research to incorporate the effects of bars into a one-dimensional model or analysis using a two-dimensional planar model (e.g. Nelson and Seminara, 2012; Inoue et al., 2016, 2017) is expected.
Here we provide a review of models and studies focused on discovering the interaction between alluvial cover and bed roughness. For evaluating the previous models, we conducted laboratory-scale experiments with multiple runs of varying bed roughness and sediment supply. The experimental results show that the change in alluvial cover with the sediment supply rate is controlled by bedrock roughness to a great extent. When the bedrock hydraulic roughness is higher than the hydraulic roughness of the alluvial bed (i.e. clast-rough bedrock), the alluvial cover increases proportionally with the increase in sediment supply and then reaches an equilibrium state. However, in cases where bedrock roughness is lower than the roughness of the alluvial bed (i.e. clast-smooth bedrock), the deposition is insignificant unless sediment supply exceeds the transport capacity of the bedrock bed. When sediment supply exceeds transport capacity, the bed is abruptly covered by sediment and quickly reaches a completely alleviated bed.
We have also implemented the previous models for alluvial cover, i.e. the linear model proposed by Sklar and Dietrich (2004), the exponential model by Turowski et al. (2007), the macro-roughness model by Inoue et al. (2014), the surface-roughness model by Johnson (2014), and the probabilistic model by Turowski and Hodge (2017) to predict the experimental results. The linear model and exponential model are inefficient for cases with a clast-smooth bedrock; specifically, they cannot predict the rapid alluviation. The macro-roughness model (Inoue et al., 2014) and surface-roughness model (Johnson, 2014) can predict the rapid-alluviation and hysteresis for clast-smooth bedrock, as well as the proportionate increase in alluvial cover for clast-rough bedrock. Although the macro-roughness model (Inoue et al., 2014) was able to reproduce the observed alluvial cover ratio without adjusting the parameters, the surface-roughness model needs parameter adjustments. The probabilistic model by Turowski and Hodge (2017) also needs parameter adjustments to make it sensitive to rapid alluviation in clast-smooth bed; however, it does not reproduce the hysteresis. Connecting model parameters with roughness parameters is an exciting challenge in the future.
We also tested the macro-roughness model (Inoue et al., 2014) and surface-roughness model (Johnson, 2014) for their capability to predict the experimental results observed by Chatanantavet and Parker (2008), in which the bedrock surface has alluvial alternate bar formations. Both models required significant parameter adjustments to reproduce the alluvial cover fraction. The two models do not include the two-dimensional effects caused by variable alluvial deposition and formation of bars on bedrock. Although models that extended the roughness model into two-dimensional planes (e.g. Nelson and Seminara, 2012; Inoue et al., 2016) will be able to capture bar formation in a bedrock river, these models require a long calculation time. Building a simpler model that can predict alluvial cover fraction with bar formation represents another exciting challenge in the future which would contribute to a better understanding of the long-time evolution of natural bedrock channels.
Data used in this publication are available in this paper itself or available in the papers referred to by Chatanantavet and Parker (2008) and Johnson (2014).
JM and TI did the conceptualization of the paper. TI conducted the laboratory experiments. Model analysis was performed by JM and TI. Writing, review and editing were performed by JM and TI.
The authors declare that they have no conflict of interest.
In proceeding with this research, we received valuable comments from Yasuyuki Shimizu, Norihiro Izumi and Gary Parker. We would like to express our gratitude here. The authors would also like to thank Jens M. Turowski, Rebecca Hodge and an anonymous referee for their constructive feedback that helped improve the earlier version of this paper.
This paper was edited by Jens Turowski and reviewed by Rebecca Hodge and one anonymous referee.
| α | Bed load transport coefficient |
| br | Exposure function by Johnson (2014) |
| d | Particle size (m) |
| D | Water depth (m) |
| g | Gravitational acceleration (9.81 m s−2) |
| ks | Hydraulic roughness height (m) |
| ksa | Hydraulic roughness height of purely alluvial bed (m) |
| ksb | Hydraulic roughness height of purely bedrock bed (m) |
| k#D | Dimensionless alluvial roughness |
| κ | Karman constant |
| l | Flume length (m) |
| L | Macro-roughness height of bedrock bed (m) |
| Dimensionless characteristic sediment mass | |
| Dimensionless mass of sediment on the bed | |
| nm | Manning's roughness coefficient () |
| ηa | Average thickness of alluvial layer (m) |
| Pc | Mean areal fraction of alluvial cover |
| φ | Cover factor proposed by Turowski et al. (2007) |
| qbs | Sediment supply rate per unit width (m2 s−1) |
| qbc | Transport capacity per unit width (m2 s−1) |
| qbca | Transport capacity per unit width for sediment moving on purely alluvial bed (m2 s−1) |
| qbcb | Transport capacity per unit width for sediment moving on purely bedrock bed (m2 s−1) |
| Q | Water discharge (m3 s−1) |
| rd | Scaling coefficient for d and hydraulic roughness length |
| rbr | Fitting parameter that scales bedrock roughness to d |
| R | Specific gravity of sediment in water (1.68) |
| S | Bed slope |
| Se | Energy gradient |
| τ∗ | Dimensionless shear stress |
| τ∗c | Dimensionless critical shear stress |
| τ∗ca | Dimensionless critical shear stress for grains on purely alluvial bed |
| τ∗cb | Dimensionless critical shear stress for grains on purely bedrock bed |
| U | Depth averaged velocity (m s−1) |
| w | Flume width (m) |
| ω | Exponent by Turowski and Hodge (2017) |
| σbr | Topographic roughness height of purely bedrock bed (m) |
Aubert, G., Langlois, V. J., and Allemand, P.: Bedrock incision by bedload: insights from direct numerical simulations, Earth Surf. Dynam., 4, 327–342, https://doi.org/10.5194/esurf-4-327-2016, 2016.
Beer, A. R. and Turowski, J. M.: Bedload transport controls bedrock erosion under sediment-starved conditions, Earth Surf. Dyn., 3, 291–309, https://doi.org/10.5194/esurf-3-291-2015, 2015.
Beer, A. R., Kirchner, J. W., and Turowski, J. M.: Graffiti for science – erosion painting reveals spatially variable erosivity of sediment-laden flows, Earth Surf. Dynam., 4, 885–894, https://doi.org/10.5194/esurf-4-885-2016, 2016.
Beer, A. R., Turowski, J. M., and Kirchner, J.W.: Spatial patterns of erosion in a bedrock gorge, J. Geophys. Res.-Earth, 122, 191–214, https://doi.org/10.1002/2016JF003850, 2017.
Chatanantavet, P. and Parker, G.: Experimental study of bedrock channel alluviation under varied sediment supply and hydraulic conditions, Water Resour. Res., 44, W12446, https://doi.org/10.1029/2007WR006581, 2008.
Colombini, M., Seminara, G., and Tubino,: M. Finite-amplitude alternate bars, J. Fluid Mech., 181, 213–232, https://doi.org/10.1017/S0022112087002064, 1987
Cook, K. L., Turowski, J. M., and Hovius, N.: A demonstration of the importance of bedload transport for fluvial bedrock erosion and knickpoint propagation, Earth Surf. Proc. Land., 38, 683–695, https://doi.org/10.1002/esp.3313, 2013.
Ferguson, R. I., Hardy, R. J., and Hodge, R. A. : Flow resistance and hydraulic geometry in bedrock rivers with multiple roughness length scales. Earth Surf. Process. Landforms, 44, 2437–2449, https://doi.org/10.1002/esp.4673, 2019.
Fernández, R., Parker, G., and Stark, C. P.: Experiments on patterns of alluvial cover and bedrock erosion in a meandering channel, Earth Surf. Dynam., 7, 949–968, https://doi.org/10.5194/esurf-7-949-2019, 2019.
Finnegan, N. J., Sklar, L. S., and Fuller, T. K.: Interplay of sediment supply, river incision, and channel morphology revealed by the transient evolution of an experimental bedrock channel, J. Geophys. Res., 112, F03S11, https://doi.org/10.1029/2006JF000569, 2007.
Fuller, T. K., Perg, L. A., Willenbring, J. K., and Lepper, K.: Field evidence for climate-driven changes in sediment supply leading to strath terrace formation, Geology, 37, 467–470, https://doi.org/10.1130/G25487A.1, 2009.
Fuller, T. K., Gran, K. B., Sklar, L. S., and Paola, C.: Lateral erosion in an experimental bedrock channel: The influence of bed roughness on erosion by bed load impacts. J. Geophys. Res.-Earth, 121, 1084–1105, https://doi.org/10.1002/2015JF003728, 2016.
Gilbert, G. K.: Report on the Geology of the Henry Mountains: Geographical and Geological Survey of the Rocky Mountain Region, US Gov. Print. Off., Washington, D.C., 160 pp., https://doi.org/10.5962/bhl.title.51652, 1877.
Hancock, G. S. and Anderson, R. S.: Numerical modeling of fluvial strath-terrace formation in response to oscillating climate, Geol. Soc. Am. Bull., 114, 1131–1142, https://doi.org/10.1130/0016-7606(2002)114{<}1131:NMOFST{>}2.0.CO;2, 2002.
Heritage, G. L., Moon, B. P., Broadhurst, L. J., and James, C. S.: The frictional resistance characteristics of a bedrock-influenced river channel. Earth Surf. Proc. Land., 29, 611–627, https://doi.org/10.1002/esp.1057, 2004.
Hobley, D. E. J., Sinclair, H. D., Mudd, S. M., and Cowie, P. A.: Field calibration of sediment flux dependent river incision, J. Geophys. Res., 116, F04017, https://doi.org/10.1029/2010JF001935, 2011.
Hodge, R. A. and Hoey, T. B.: Upscaling from grain-scale processes to alluviation in bedrock channels using a cellular automaton model, J. Geophys. Res., 117, F01017, https://doi.org/10.1029/2011JF002145, 2012.
Hodge, R. A. and Hoey, T. B.: A Froude-scaled model of a bedrock-alluvial channel reach: 1. Hydraulics, J. Geophys. Res.-Earth, 121, 1578–1596, https://doi.org/10.1002/2015JF003706, 2016a.
Hodge, R. A. and Hoey, T. B.: A Froude-scaled model of a bedrock alluvial channel reach: 2. Sediment cover, J. Geophys. Res.-Earth, 121, 1597–1618, https://doi.org/10.1002/2015JF003709, 2016b.
Hodge, R. A., Hoey, T. B., Maniatis, G., and Leprêtre, E.: Formation and erosion of sediment cover in an experimental bedrock-alluvial channel, Earth Surf. Proc. Land., 41, 1409–1420, https://doi.org/10.1002/esp.3924, 2016.
Inoue, T. and Ito, A.: The relationship between roughness, critical Shear stress and sediment transport capacity on soft bedrock surface, in: Proceedings of the 68th Annual Conference of the Japan Society of Civil Engineers, 4–6 September 2013, Chiba, Japan, II-072, 2013.
Inoue, T. and Nelson, J. M.: An experimental study of longitudinal incisional grooves in a mixed bedrock–alluvial channel, Water Resour. Res., 56, e2019WR025410, https://doi.org/10.1029/2019WR025410, 2020.
Inoue, T., Izumi, N., Shimizu, Y., and Parker, G.: Interaction among alluvial cover, bed roughness, and incision rate in purely bedrock and alluvial-bedrock channel. J. Geophys. Res.-Earth, 119, 2123–2146, https://doi.org/10.1002/2014JF003133, 2014.
Inoue, T., Iwasaki, T., Parker, G., Shimizu, Y., Izumi, N., Stark, C. P., and Funaki, J.: Numerical Simulation of Effects of Sediment Supply on Bedrock Channel Morphology. J. Hydraul. Eng., 142, 04016014-1-11, https://doi.org/10.1061/(asce)hy.1943-7900.0001124, 2016.
Inoue, T., Parker, G., and Stark, C. P.: Morphodynamics of a bedrock-alluvial meander bend that incises as it migrates outward: approximate solution of permanent form, Earth Surf. Proc. Land., 42, 1342–1354, https://doi.org/10.1002/esp.4094, 2017a.
Inoue, T., Yamaguchi, S, and Johnson, J. M.: The effect of wet-dry weathering on the rate of bedrock river channel erosion by saltating gravel, Geomorphology, 285, 152–161, https://doi.org/10.1016/j.geomorph.2017.02.018, 2017b.
Izumi, N., Yokokawa, M., and Parker, G.: Incisional cyclic steps of permanent form in mixed bedrock-alluvial rivers, J. Geophys. Res.-Earth, 122, 130–152, https://doi.org/10.1002/2016JF003847, 2017.
Jansen, J. D., Fabel, D., Bishop, P., Xu, S., Schnabel, C., and Codilean, A. T.: Does decreasing paraglacial sediment supply slow knickpoint retreat?, Geology, 39, 543–546, https://doi.org/10.1130/G32018.1, 2011.
Johnson, J. P. and Whipple, K. X.: Feedbacks between erosion and sediment transport in experimental bedrock channels, Earth Surf. Proc. Land., 32, 1048–1062, https://doi.org/10.1002/esp.1471, 2007.
Johnson, J. P. L.: A surface roughness model for predicting alluvial cover and bed load transport rate in bedrock channels, J. Geophys. Res., 119, 2147–2173, https://doi.org/10.1002/2013JF003000, 2014.
Johnson, J. P. L. and Whipple, K. X.: Evaluating the controls of shear stress, sediment supply, alluvial cover, and channel morphology on experimental bedrock incision rate, J. Geophys. Res., 115, F02018, https://doi.org/10.1029/2009JF001335, 2010.
Johnson, J. P. L., Whipple, K. X., and Sklar, L. S.: Contrasting bedrock incision rates from snowmelt and flash floods in the Henry Mountains, Utah, Geol. Soc. Am. Bull., 122, 1600–1615, https://doi.org/10.1130/b30126.1, 2010.
Kamphius, J. W.: Determination of sand roughness for fixed beds, J. Hydraul. Res., 12, 193–203, https://doi.org/10.1080/00221687409499737, 1974.
Kazuaki, M., Inoue, T., Shimizu, Y.: Suppression method of soft rock erosion by using “net cover effect” and verification in real river, Adv. River Eng., 21, 165–170, 2015.
Kuroki, M. and Kishi, T.: Regime criteria on bars and braids in alluvial straight channels, Proc. Jpn. Soc. Civ. Eng., 342, 87–96, https://doi.org/10.2208/jscej1969.1984.342_87, 1984.
Lague, D.: Reduction of long-term bedrock incision efficiency by short term alluvial cover intermittency, J. Geophys. Res.-Earth, 115, F02011, https://doi.org/10.1029/2008JF001210, 2010.
Meyer-Peter, E. and Müller, R.: Formulas for bed-load transport, in Proceedings, Second Congress, International Association for Hydraulic Structures Research, Stockholm, 39–64, 1948.
Mishra, J., Inoue, T., Shimizu, Y., Sumner, T., and Nelson, J. M.: Consequences of abrading bed load on vertical and lateral bedrock erosion in a curved experimental channel, J. Geophys. Res.-Earth, 123, 3147–3161, https://doi.org/10.1029/2017JF004387, 2018.
Moore, R. C.: Origin of inclosed meanders on streams of the Colorado Plateau, J. Geol. 34, 29–57, 1926.
Nelson, P. A. and Seminara, G.: Modeling the evolution of bedrock channel shape with erosion from saltating bed load, Geophys. Res. Lett., 38, L17406, https://doi.org/10.1029/2011GL048628, 2011.
Nelson, P. A. and Seminara, G.: A theoretical framework for the morphodynamics of bedrock channels, Geophys. Res. Lett., 39, L06408, https://doi.org/10.1029/2011GL050806, 2012.
Nelson, P. A., Bolla Pittaluga, M., and Seminara, G.: Finite amplitude bars in mixed bedrock-alluvial channels, J. Geophys. Res.-Earth, 119, 566–587, https://doi.org/10.1002/2013JF002957, 2014.
Parker, G.: Selective sorting and abrasion of river gravel. 1: Theory, J. Hydraul. Eng., 117, 131–149, https://doi.org/10.1061/(ASCE)0733-9429(1991)117:2(131), 1991.
Parker, G., Fernández, R., Viparelli, E., Stark, C. P., Zhang, L., Fu, X., Inoue, T., Izumi, N., and Shimizu, Y.: Interaction between waves of alluviation and incision in mixed bedrock-alluvial rivers, Advances in River Sediment Research, in: Proc. of 12th International Symposium on River Sedimentation, ISRS, 2–5 September 2013, Kyoto, Japan, 615–622, 2013.
Scheingross, J. S., Lamb, M. P., and Fuller, B.: Self-formed bedrock waterfalls, Nature, 567, 229–233, https://doi.org/10.1038/s41586-019-0991-z, 2019.
Shepherd, R. G.: Incised river meanders: Evolution in simulated bedrock, Science, 178, 409–411, https://doi.org/10.1126/science.178.4059.409, 1972.
Shepherd, R. G. and Schumm, S. A.: Experimental study of river incision, Geol. Soc. Am. Bull., 85, 257–268, 1974.
Shobe, C. M., Tucker, G. E., and Barnhart, K. R.: The SPACE 1.0 model: a Landlab component for 2-D calculation of sediment transport, bedrock erosion, and landscape evolution, Geosci. Model Dev., 10, 4577–4604, https://doi.org/10.5194/gmd-10-4577-2017, 2017.
Sklar, L. S. and Dietrich, W. E.: River longitudinal profiles and bedrock incision models: Stream power and the influence of sediment supply, in Rivers Over Rock: Fluvial Processes in Bedrock Channels, Geophys. Monogr. Ser., vol. 107, edited by: Tinkler, K. and Wohl, E. E., AGU, Washington, D.C., 237–260, https://doi.org/10.1029/GM107p0237, 1998.
Sklar, L. S. and Dietrich, W. E.: Sediment and rock strength controls on river incision into bedrock, Geology, 29, 1087–1090, https://doi.org/10.1130/0091-7613(2001)029{<}1087:SARSCO{>}2.0.CO;2, 2001.
Sklar, L. S. and Dietrich, W. E.: A mechanistic model for river incision into bedrock by saltating laboratory-scale, Water Resour. Res., 40, W06301, https://doi.org/10.1029/2003WR002496, 2004.
Sklar, L. S. and Dietrich, W. E.: The role of sediment in controlling bedrock channel slope: Implications of the saltation-abrasion incision model, Geomorphology, 82, 58–83, https://doi.org/10.1016/j.geomorph.2005.08.019, 2006.
Sumner, T., Takuya, I., Yasuyuki, S.,: The influence of bed slope change on erosional morphology, J. JSCE, 7, 15–21, https://doi.org/10.2208/journalofjsce.7.1_15, 2019.
Tanaka, G., and Izumi, N.: The Bedload Transport Rate and Hydraulic Resistance in Bedrock Channels Partly Covered with Gravel, J. Jpn. Soc. Civ. Eng. B1, 69, I_1033–I_1038, 2013.
Turowski, J. M.: Stochastic modeling of the cover effect and bedrock erosion, Water Resour. Res., 45, W03422, https://doi.org/10.1029/2008WR007262, 2009.
Turowski, J. M.: Alluvial cover controlling the width, slope and sinuosity of bedrock channels, Earth Surf. Dynam., 6, 29–48, https://doi.org/10.5194/esurf-6-29-2018, 2018.
Turowski, J. M. and Bloem, J.-P.: The influence of sediment thickness on energy delivery to the bed by bedload impacts, Geodin. Acta, 28, 199–208, https://doi.org/10.1080/09853111.2015.1047195, 2016.
Turowski, J. M. and Hodge, R.: A probabilistic framework for the cover effect in bedrock erosion, Earth Surf. Dynam., 5, 311–330, https://doi.org/10.5194/esurf-5-311-2017, 2017.
Turowski, J. M., and Rickenmann, D.: Tools and cover effects in bedload transport observations in the Pitzbach, Austria, Earth Surf. Proc. Land., 34, 26–37, https://doi.org/10.1002/esp.1686, 2009.
Turowski, J. M., Lague, D., and Hovius, N.: Cover effect in bedrock abrasion: A new derivation and its implications for the modeling of bedrock channel morphology, J. Geophys. Res., 112, F04006, https://doi.org/10.1029/2006JF000697, 2007.
Turowski, J. M., Hovius, N., Meng-Long, H., Lague, D., and Men-Chiang, C.: Distribution of erosion across bedrock channels, Earth Surf. Proc. Land. 33, 353–363, https://doi.org/10.1002/esp.1559, 2008a.
Turowski, J. M., Hovius, N., Wilson, A., and Horng, M.-J.: Hydraulic geometry, river sediment and the definition of bedrock channels, Geomorphology, 99, 26–38, https://doi.org/10.1016/j.geomorph.2007.10.001, 2008b.
Turowski, J. M., Badoux, A., Leuzinger, J., and Hegglin, R.: Large floods, alluvial overprint, and bedrock erosion, Earth Surf. Proc. Land., 38, 947–958, https://doi.org/10.1002/esp.3341, 2013.
Whitbread, K., Jansen, J., Bishop, P., and Attal, M.: Substrate, sediment, and slope controls on bedrock channel geometry in postglacial streams, J. Geophys. Res., 120, 779–798, https://doi.org/10.1002/2014JF003295, 2015.
Wilcock, P. R. and Crowe, J. C.: Surface-based transport model for mixed-size sediment, J. Hydraul. Eng.-ASCE, 129, 120–128, https://doi.org/10.1061/(asce)0733-9429(2003)129:2(120), 2003.
Yamaguchi, S., Inoue, T., Akahori, R., Sato, D., Shimizu, Y., Izumi, N.: Analysis of bedload collision velocity near a knickpoint using PTV Method, J. Jpn. Soc. Civ. Eng. B1, 74, I_1153–I_1158, https://doi.org/10.2208/jscejhe.74.5_I_1153, 2018.
Yanites, B. J., Tucker, G. E., Hsu, H. L., Chen, C. C., Chen, Y. G., and Mueller K. J.: The influence of sediment cover variability on long-term river incision rates: An example from the Peikang River, central Taiwan, J. Geophys. Res., 116, F03016, https://doi.org/10.1029/2010JF001933, 2011.
Zhang, L., Parker, G., Stark, C. P., Inoue, T., Viparelli, E., Fu, X., and Izumi, N.: Macro-roughness model of bedrock–alluvial river morphodynamics, Earth Surf. Dynam., 3, 113–138, https://doi.org/10.5194/esurf-3-113-2015, 2015.