the Creative Commons Attribution 4.0 License.
the Creative Commons Attribution 4.0 License.
The formation and geometry characteristics of boulder bars due to outburst floods triggered by overtopped landslide dam failure
Haiguang Cheng
Lei Gao
Weiming Liu
Boulder bars are a common form of riverbed morphology that could be affected by landslide dams. However, few studies have focused on the formation and geometry characteristics of boulder bars due to outburst floods triggered by landslide dam failure. In such a way, eight group landslide dam failure experiments with a movable bed length of 4 to 7 times the dam length with 25 boulder bars were carried out. In addition, 38 boulder bars formed in the field triggered by four landslide dam failures were investigated. The aim of this paper is to study the formation and geometry characteristics of boulder bars along the riverbeds. The results show that boulder bars are formed after peak discharge of outburst flow. The number of boulder bars is 0.4 to 1.0 times the ratio of riverbed length to dam bottom length. Besides, boulder bars have the characteristic of lengthening upstream during the failure process. A boulder bar's upstream edge has a more extensive development than a boulder bar's downstream edge. The length of a boulder bar along the channel changes faster than the boulder bar's width and height. After the dam failure, the boulder bar's length is about 8 to 14 times its width. The relationship between the ratio of boulder bar length to width and the boulder bar's dimensionless length could be described with a hyperbolic equation. The dimensionless area of the boulder bar increases linearly with the dimensionless area of the river section, and the linear ratio is about 0.5. With the field data, this demonstrates that the formation and geometry characteristics of boulder bars in tests are consistent with the field boulder bars. Therefore, the results in this paper are credible and can be applied to the riverbed's geomorphological characteristics analysis triggered by overtopped landslide dam failure. The plentiful experimental and field data could contribute to the community boulder bar research.
- Article
(7469 KB) - Full-text XML
- BibTeX
- EndNote
Occurrences such as rainfalls and earthquakes often cause landslides, which block the river to form a water-retaining body similar to a reservoir dam, called a landslide dam (Takahashi, 2007; Costa and Schuster, 1988; Casagli, 2003). According to statistics, 85 % of the dams failed within 1 year after formation, and more than 50 % of the dams were breached by overtopping (Costa and Schuster, 1988). When the dam is breached, the storage water erupts and flows carrying the dam materials to the downstream riverbed, which may change the original riverbed geomorphology.
Many studies on the influence of flood geomorphology and sedimentary characteristics have proved that the outburst flood energy is huge, and it can entrain and transport materials of various sizes, from clay to boulders. A large number of boulders gather in the river to form bars, namely boulder bars. The downstream riverbed's geomorphology will be significantly affected and undergo significant changes (Lamb and Fonstad, 2010; Maizels, 1997; Russell and Knudsen, 1999; Marren and Schuh, 2009; Benito and O'Connor, 2003; Carling, 2013; Wu et al., 2020). Boulder bars are one common landform formed during the outburst flood evolution (Turzewski et al., 2019; Jiang and Wei, 2020; Wu et al., 2020). For example, in the year 2000, the Yigong outburst flood, due to its huge lake storage, formed many huge boulder bars on the riverbed. The boulder bars had a significant impact on the development of the river bedform. And Wu et al. (2020) investigated the impact of this event on river morphology and analyzed the shapes and geometric characteristics of the boulder bars caused by the overtopping flood. And they found that the boulder bar components are poorly sorted. Turzewski et al. (2019) studied the particle gradation of the boulder bars during the Yigong River landslide dam failure process. They found that the boulder bars' particle sizes decrease along the lower reaches of the riverbed. But they did not analyze the evolution characteristics of a boulder bar's size in detail. Lamb and Fonstad (2010) suggested that the rising and falling stages of the outburst flood had a greater impact on riverbed geomorphology and analyzed the characteristics of the median diameter of material in a boulder bar.
The boulder bars triggered by landslide dam failure are formed under nonequilibrium sediment transport conditions. Sediment pulses delivered downstream are dispersive under this condition. It is very different from river dunes under steady-flow conditions, which is an equilibrium sediment transport condition, and the sandbars maintain their geometry when they migrate downstream. It means that the boulder bars' shape and geometry size are varied during its formation process. Furthermore, the formation of boulder bars is different from sandbars which formed by translative depositional processes (Mohrig and Smith, 1996; Ashworth et al., 2000; Shaw and McElroy, 2016).
Because lack of investigations about the growth characteristics of boulder bars during the landslide dam failure process in the field, some researchers had conducted landslide dam failure experiments in the lab (Ashworth, 1996; Jiang and Wei, 2020). Ashworth (1996) used flume experiments to study the boulder bar's growth. However, in their experiments, the inflow conditions are quite different from the outburst flood. Therefore, the research results' applicability to the boulder bar formed by the outburst flood remains uncertain. Jiang and Wei (2020) qualitatively analyzed the formation process of boulder bar in the evolution of overtopping outburst floods using dam failure experiments and initially discussed the characteristics of geometric size of boulder bars after dam failure. However, the characteristics of the boulder bar's distribution and geometric size characteristics during the dam failure process have not been analyzed.
Above all, there is a common academic consensus that outburst flow triggered by landslide dam failure could change the geomorphology of the downstream riverbed. Although the failure process of the dam and the hydraulic characteristics of the outburst flood, such the characteristics of the breaching hydraulic graph, erosion rate, and peak discharge (Morris et al., 2009; Jiang and Wei 2018; Jiang, 2019), are clear, the impact of the outburst flood triggered by landslide dam failure on the geomorphology of the downstream riverbed during the failure process and after failure is still lacking research. A boulder bar is the substance that occurs during the dam failure process which is an indicator of the variation of riverbed geomorphology. What are the formation characteristics of boulder bars during the dam failure process? And what geometry characteristics of boulder bars exist during the dam failure process and after the dam failure? These questions are still not clear and should be answered. Understanding these questions is helpful for the prediction of riverbed landform influenced by landslide dam failure and benefits the assessment of stream restoration and river navigation.
This paper focuses on the formation processes and the geometrical size characteristics of boulder bars in the downstream channel during and after the overtopping failure process. Firstly, through flume experiments, boulder bars' formation processes on the downstream channel under the dammed lake failure condition were reproduced. Then, based on the experimental data, the development characteristics of boulder bars' upstream and downstream edges were analyzed. Furthermore, statistical analysis of boulder bars' geometrical sizes at each moment during and after the failure process, such as length, width, height, volume, and area of the boulder bar, has been carried out to obtain boulder bars' size characteristics. Finally, we compare the distribution and geometry characteristics of the boulder bar formed in the experiment and field to verify the experiment results' reliability. The results can be applied to research on riverbed geomorphological characteristics affected by the outburst flood triggered by landslide dam failure. And also, this paper provides a large number of experimental and field boulder bars' data references to the analysis of the erosion and accumulation characteristics of the downstream river channel.
2.1 Model design and experimental materials
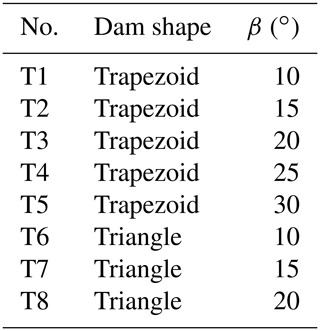
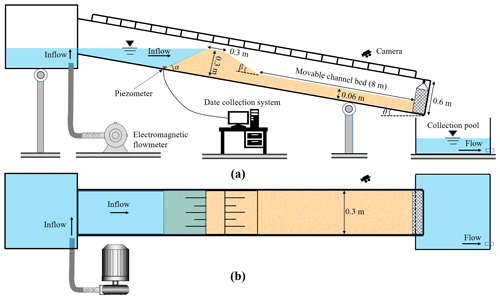
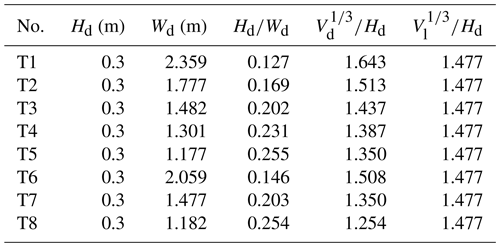
The longitudinal profiles of experimental landslide dams were trapezoidal and triangular. The trapezoidal dam height and crest width were both 0.3 m, and the triangular dam height was also 0.3 m. In the experiment, the riverbed slope angle θ was fixed at 10∘, and the landslide dam upstream slope angle α was set to 40∘, and the landslide dam downstream slope angles β were set to five different values. The moveable bed was set downstream of the model dam, which had a length of 8 m. The downstream channel bed's length was about 4 to 7 times the dam length along the channel. The test parameters are shown in Table 1.
Peng and Zhang (2012) proposed that landslide dam height (Hd), dam bottom width parallel to the channel (Wd), dam volume (Vd), and reservoir volume (Vl) are the key geometric parameters of a landslide dam and proposed a set of dimensionless numbers – , , and – to verify whether the established dam model is consistent with the landslide dam in the field (Zhou et al., 2019). The field data show that the , , and range from about 0.001 to 2, 0 to 40, and 0 to 20 for a field landslide dam (Zhou et al., 2019). Table 2 shows the dimensionless numbers of the experimental dams, which are all within the acceptable range of the field landslide dams, indicating that the dams in the experiments are relatively close to field landslide dams.
Table 2Landslide dam parameters. The value of ranges from 0.1 to 0.3, and and both range from 1 to 2, which all fall within the acceptable range of values of the field landslide dams (Zhou et al., 2019).
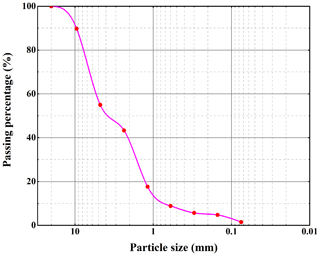
In the field, the landslide dam and the boulder bars all mostly consisted of mixtures. The dam materials used in this study were mixtures of sand and gravels. Considering the grain size effect and the flume space limitation, the maximum sediment particle size was set to 20 mm. The materials used in the tests had a median particle size of D50=3.8 mm. A dimensionless parameter measure of the spread in the grain size distribution, , represents a wide grain size range of granular materials for landslide dams. While the materials of the riverbed are different from that of the landslide dam, it is hard to find a general description of the difference. Thus, we designed the materials of the riverbed and the landslide dam the same as for the present experiments. Moreover, the compositions of the field dam and riverbed can be heterogeneous; i.e., the distribution of coarse particle within the landslide dam is inhomogeneous, and there is still no quantitative representation of the heterogeneity. Therefore, the coarse particles and fine ones were mixed to be uniform, which means the distribution of coarse particles was homogeneous. The channel morphology in nature is complex and diverse, which was not considered in the experiments. Instead, a straight, aequilate, and flat channel was set up, which is helpful to reveal the fundamental mechanism of the formation process and geometric characteristics of boulder bars. The thickness of the riverbed was set to 0.06 m. The gradation curve of material particles' sizes is shown in Fig. 1.
2.2 Experimental apparatus
The experimental setups are shown in Fig. 2. The flume was 15 m long, 0.3 m wide, and 0.6 m high. The flume slope was adjustable from 10 to 30∘. One side of the flume was transparent glass, and scale lines were drawn on the glass to facilitate observation and recording of experimental phenomena. The inflow discharge upstream of the dam was set to 1.0 L s−1. Under the control of the electromagnetic flowmeter, the error range could be controlled within ±0.01 L s−1. During the tests, the toe of the dam upstream slope was set at 4.5 m away from the water supply tank. A baffle with a height of 6 cm was set at the flume end as a boundary condition. Seven cameras were placed on the transparent glass side of the flume, one camera was placed on the top of the dam, and one camera was placed directly behind the flume. A total of nine cameras recorded all of the experimental phenomena.
2.3 Measurements
In the experiment, using the scale lines on the transparent glass on the side of the flume, we can accurately read the boulder bars' positions at each moment. The boulder bars' lengths, widths, and heights could be obtained from the screen. According to the actual boulder bars' geometric characteristics, the boulder bars were divided into several parts, and then the volume calculation formula of the similar geometric body was used to calculate the volume of each part, respectively, and finally, the boulder bars' volumes were obtained by summing. The method of obtaining the boulder bar area was the same as that of the volume. After the dam failed completely, we collected all the boulder bar materials. We then dried and screened silt to obtain the boulder bar material gradation information.
3.1 Formation processes of boulder bars
The formation processes of boulder bars are similar for all the tests. Therefore, we analyze the T7 test as an example below in this section, as shown in Fig. 3. When the flow overtopped the dam crest, the outburst flood carried the dam materials to the dam downstream slope (T=5 s) and then to the channel bed (T=19 s) with outburst flow discharge increasing. It should be noted that although a large number of sediments were transported on the channel bed before the peak discharge, no boulder bar formed on the downstream channel bed. After the moment of peak discharge, the flow discharge gradually weakened, and dam materials were transported to the position near the dam toe. The flow could not transport all the sediments away, and some sediments gradually silted down; then the first boulder bar occurred near the dam toe (T=30 s) (the boulder bar in the figure is marked with a blue dotted line). After the first boulder bar was formed, the flow direction was changed when water flow bypassed the boulder bar. And the moving sediments still moved along the original direction due to inertia, which causes sediments that are piled up to form the second boulder bar on the opposite side of the first boulder bar (T=33 s).
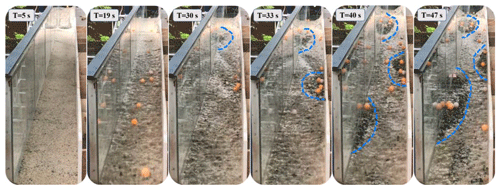
Figure 3The riverbed morphology at six different moments during the boulder bars' formations and growth process for the T7 experiment. The boulder bars in the figure are marked with blue dotted lines.
Similarly, the first and second boulder bars affected the formation of the boulder bar downstream. Eventually, boulder bars were scattered on both sides of the channel, forming a meandering channel downstream (T=40 and 47 s). This phenomenon is in good agreement with the field boulder bars along the Yigong River (Wu et al., 2020). In addition, the Froude number of flows downstream were all larger than 2.5 during the bars' formation process, indicating that these bars were formed in a supercritical flow (diffusive) condition. It suggests that boulder bars were formed on dispersive sediment pulses which they delivered from upstream during the landslide dam failure process. (Shaw and McElroy, 2016).
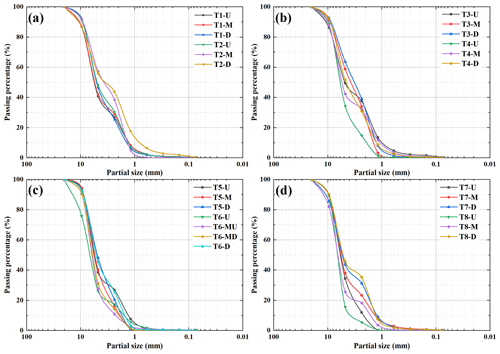
Figure 4Gradation curve of the boulder bar materials: (a) for T1 and T2 tests; (b) for T3 and T4 tests; (c) for T5 and T6 tests; (d) for T7 and T8 tests. Notation: U, M, D, MU, and MD represent the boulder bar near the upstream reaches, the boulder bar near the middle reaches, the boulder bar near the downstream reaches, the boulder bar near the middle-upstream reaches, and the boulder bar near the middle-downstream reaches, respectively.

Figure 5The boulder bars' locations during the dam failure process. Notation: (a–h) represent the boulder bars' locations for T1–T8 tests, respectively. The red lines in the figure represent the boulder bars, and the orange rectangles represent the channels. Moreover, the purple arrow represents the direction of flow. The numbers at both ends of the red lines represent the distances between the upstream and downstream edges of boulder bars and the dam toe.
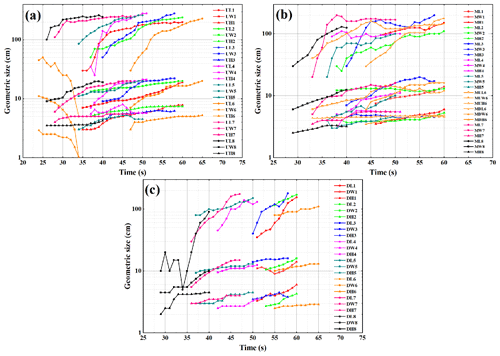
Figure 6The lengths, widths, and heights of the boulder bars: (a) sizes of the boulder bars near the upstream reaches; (b) sizes of the boulder bars near the middle reaches; (c) sizes of the boulder bars near the downstream reaches. Notation: L, W, and H represent the length, width, and height of the boulder bar, respectively. Digits 1 to 8 indicate T1 to T8 tests, respectively. For example, MUL6 indicates the length of the boulder bar near the middle-upstream reaches for the T6 test.
Turzewski et al. (2019) measured the sizes of field boulder bars. They found that grain sizes of boulder bars decrease downstream. In this experiment, sediments in boulder bars after dam failure from different locations were collected. After sieving the sediments, the gradation curves of the materials were obtained as shown in Fig. 4. The figures show that the contents of fines in the compositions become much less and their mean diameters become larger than the initial sediments. It means that in the boulder bars, coarse sediment tends to comprise much of the bar material. Meanwhile, the figure indicates that as the distance between the boulder bar and the dam increases, the particle diameter in the bars shows a decreasing trend. This feature is consistent with the description of Turzewski et al. (2019).
3.2 Evolution characteristics of the boulder bars during dam failure process
Figure 5 shows boulder bars' locations on the channel bed during the dam failure process. The red lines in the figure represent the boulder bars' outlines, and the orange rectangles represent the channels. It clearly shows the formation sequences of boulder bars at different locations. That is, boulder bars were formed first near the dams (upstream reaches of the riverbed), and the farther from the dam toe, the later the boulder bar was formed, which is consistent with the content of Sect. 3.1. Boulder bars near the downstream dam toes are all located on the dam breach side across the river. This characteristic has also been found in Chen et al. (2015).
According to the boulder bars' formation sequences, the channel bed's boulder bars were divided into three types: (I) the boulder bar near the upstream reaches, that is, the boulder bar near the dam toe; (II) the boulder bar at the middle reaches; and (III) the boulder bar near the downstream reaches. Figure 5 shows that the upstream edges of the boulder bars of type I for all the tests basically moved toward the dams with time development. The movement directions of the downstream edges of boulder bars of type I showed a little difference: for T1, T2, and T5, the boulder bars' downstream edges moved toward the dam toes, from a distance from the downstream toe of 3.6 to 2.55, 3.3 to 2.9, and 3.7 to 3.4 m, respectively, as shown in Fig. 5a, b, and e; for T6, T7, and T8, the boulder bars' downstream edges first moved away from the dam toes and then moved toward the dam toes, and the downstream edges move forward compared to the original location. However, the distance they moved is 0.1 to 0.2 m, as shown in Fig. 5f–h; for T3 and T4, the boulder bars' downstream edge positions remained almost unchanged; see Fig. 5c and d. No matter how the downstream edge positions of the boulder bar type I changed, there is a common feature: compared with the initial positions of the boulder bars, the downstream edges almost remained original locations, and the movement distances were much smaller than those of boulder bars' upstream edges. The lengths of the boulder bars of type I increased with failure time. It can be seen that the sediments on the boulder bars' upstream edges played a great role in the length developments of type I boulder bars.
The positions of the upstream edges of type II and III boulder bars moved toward the dam toe during dam failure, but the downstream edges' positions could move toward or away from the dam. The distances of the movement of the downstream edge positions were smaller than those of upstream edge positions. Compared with the boulder bars of type I, the movements of type II and III boulder bars were smaller. The distance between the boulder bars in the middle and downstream reaches is smaller than the distance between boulder bars near the upstream reaches and adjacent boulder bars.
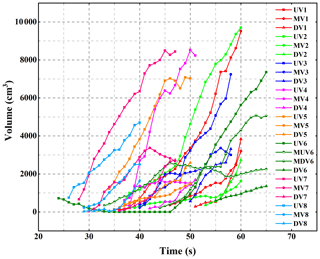
Figure 7Volumes of boulder bars. Notation: UV, MV, DV, MUV, and MDV represent the volume of the boulder bar near the upstream reaches, the boulder bar near the middle reaches, the boulder bar near the downstream reaches, the boulder bar near the middle-upstream reaches, and the boulder bar near the middle-downstream reaches, respectively. Digits 1 to 8 indicate the T1 to T8 texts, respectively. For example, UV1 means the volume of the boulder bar near the upstream reaches of the T1 test.
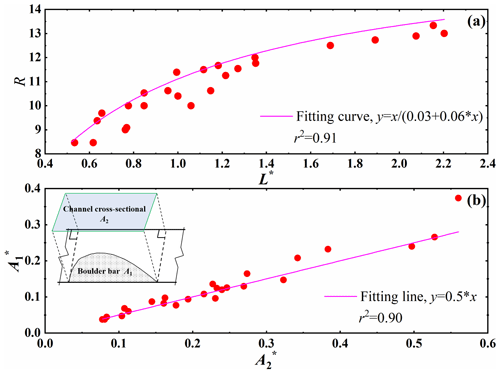
Figure 8Geometry characteristics of boulder bars after the dam failed in the experiments. (a) The relationship between length to width ratio (R) and dimensionless length (L∗); (b) the relationship between a boulder bar's dimensionless area () and the cross-sectional dimensionless area of the river channel along the boulder bar ().
3.3 Geometry size of the boulder bar during dam failure process
Corresponding to Sect. 3.2, Fig. 6 shows that the lengths of the boulder bars of type I were longer than other types of boulder bars' lengths due to the sufficient incoming materials from the upstream dam. For all the boulder bars, their lengths along the channel were largest, followed by widths and lastly the heights. Boulder bars' lengths had a growing trend, and their growth rates were larger than widths and heights.
We recorded in detail the lengths, widths, and heights of the boulder bars during the dam failure process at each moment (Fig. 6). The figure shows that boulder bars' heights changed less drastically than widths because boulder bars' heights were significantly affected by outburst flow depth. In most cases, flow depth was less than the heights of boulder bars. The sediments mainly accumulated at the boulder bars' edges and middle and could not “climb up” the boulder bars' tops. Besides, the reduction in flow depth was not large enough, so the boulder bars' heights did not change seriously. The boulder bars' widths were significantly affected by the discharge of the outburst flow. When the discharge was enough, the sediments around the boulder bars were taken away by the flow and the widths decreased. The variations in widths and heights both increased slowly with time and then tended to be stable.
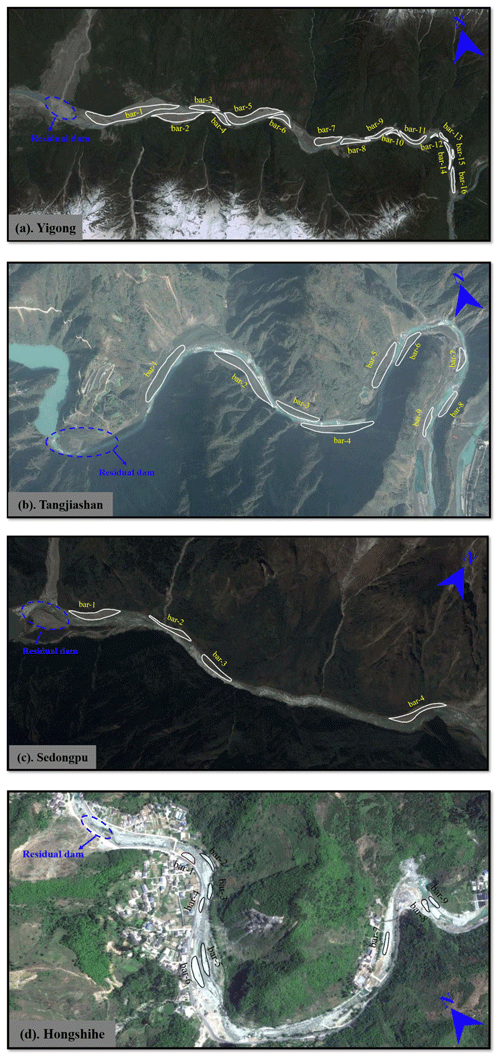
Figure 9Thirty-eight boulder bars of four cases caused by outburst flood events from Google Earth satellite images, © Google Earth.
When the amounts of sediments deposited on boulder bars were larger than the quantities of eroded sediments, boulder bars' volumes became larger. Otherwise, boulder bars' volumes would decrease or remain at a stable level. Figure 7 reveals boulder bars' volume characteristics during the dam failure. Most of the 25 boulder bars gradually increased in volume, indicating that the amounts of outburst flow erosions in the boulder bars' vicinities were less than the amounts of siltation during the entire outburst process. Referred to Figs. 6 and 7, the boulder bars' volume characteristics were consistent with the boulder bars' length characteristics. And because the widths and heights developed slightly, boulder bars' volumes were mainly controlled by boulder bars' lengths.
In the Sect. 3, we introduced formation characteristics and the geometry characteristics of the boulder bars during the dam failure processes. In this section, we will introduce the geometry characteristics of the boulder bar after the dam failure. After the dam failure, 25 boulder bars formed along the channel for all the tests. And it was shown that the number of boulder bars was 0.4 to 1.0 times the ratio of riverbed length to dam bottom length. The parameter R is defined as the ratio of boulder bar length L to width W in Eq. (1). And the dimensionless length L∗ is calculated with Eq. (2), where Ld is dam bottom length.
Figure 8a shows the relationship between R and the L∗ of the 25 boulder bars after the dams' failure in the experiments. The figure indicates that the values of R of the boulder bars all fell within the range of 8 to 14. And, the R increases with the increasing of L∗. However, the growth rate of Rdecreases as L∗ goes by. The figures show that there is a hyperbola relationship between R and L∗. The hyperbolic function means that R would not sharply increase and even become stable with the increasing of L∗.
Two dimensionless parameters and are defined to reflect the boulder bar's area and channel cross-sectional area where the boulder bar was located. They could be obtained by Eqs. (2) and (3), respectively. The relationship between and is shown in Fig. 8b. It can be seen that increases as increases. And there is a linear relationship between and . The figure suggests that the ratio of a boulder bar's area to the river channel cross-sectional area is approximately constant and equals 0.5.
In this paper, eight groups of landslide dam failure tests were conducted to investigate the formation characteristics of boulder bars during the dam failure process, and the geometry characteristics of boulder bars during and after the dam failure, which are the main scientific objective of this paper. The experimental results are analyzed and explained to meet the scientific objective. It should be noted that the materials of the riverbed and landslide dam were the same in the experiments. And the present experiments are limited to homogeneous riverbeds and dams.
In order to verify the results of the experiments, data of 38 boulder bars in the field formed by four landslide dam failures were used to compare to the experimental data. It was noted that the data of boulder bars during the landslide dam failure process are still unavailable since the landslide dams mostly occurred in inaccessible places and people could not get there to record the field data in time. Therefore, the field data in this paper are all concerned with data after the dam failure.
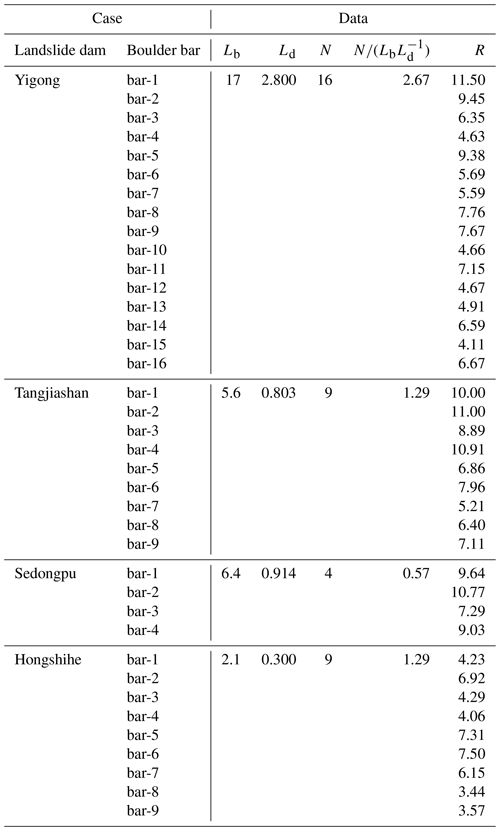
In this section, four field cases were used to verify the reliability of the boulder bar distribution and geometry characteristics in this paper. In Fig. 9, boulder bars were formed in the downstream riverbed after the Yigong landslide dam ( N, E), Tangjiashan landslide dam ( N, E), Sedongpu landslide dam ( N, E), and Hongshihe landslide dam ( N, E) failed. The geometric data of boulder bars of the four cases were obtained from Google Earth. The length of the riverbed section we selected was about 7 times the dam bottom length. The detailed statistical data of boulder bars are shown as Table 3. They indicate that the number of boulder bars on the 17 km downstream riverbed of the Yigong landslide dam was 2.67 times the ratio of the riverbed length to the dam bottom length; the number of boulder bars on the 5.6 km downstream riverbed of the Tangjiashan landslide dam was 1.29 times the ratio of the riverbed length to the dam bottom length; the number of boulder bars on the 6.4 km downstream riverbed of the Sedongpu landslide dam is 0.57 times the ratio of the riverbed length to the dam bottom length; and the number of boulder bars on the 1.8 km downstream riverbed of the Hongshihe landslide dam was 1.29 times the ratio of the riverbed length to the dam bottom length. Generally, the number of boulder bars on the riverbed for the four field cases is 0.57 to 2.67 times the ratio of the riverbed length to the dam bottom length. These values are almost the same as the experimental values.
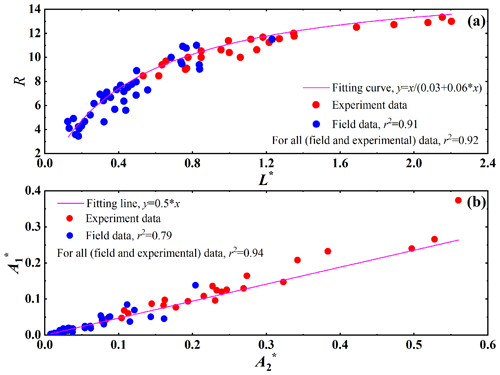
Figure 10Geometry characteristics of boulder bars after the dam failed in the field. The experimental data are also plotted in the figure to compare to the field data. (a) The relationship between boulder bar length to width ratio (R) and dimensionless length (L∗); (b) the relationship between a boulder bar's dimensionless area () and the cross-sectional dimensionless area of the river channel along the boulder bar ().
In addition, we also analyzed the data on R, L∗, , and of the field boulder bars. Figure 10a shows that the values of R of field boulder bars all fall within the range of 2 to 12, which is approximately the range of values of the experimental boulder bars. Furthermore, the hyperbola relationship in Fig. 8a is also suitable for the field data in Fig. 10a. And, both the experimental and field data points are all close to the fitting curve, whose coefficient of determination (r2) is 0.92. For the boulder bars in the field, and show a linear relationship, and the fitting equation of the experimental data (Fig. 8b) is very suitable for the field data in Fig. 10b. It means that the fitting line could predict the relationship between and for both experimental and field boulder bars well (the coefficient of determination is 0.94).
Based on the above points, it can be seen that the experimental results in this paper are consistent with the actual boulder bars in the field. Therefore, the experimental results can provide references for the field study of the boulder bar formed by the outburst flood triggered by landslide dam failure. The results in this paper can help researchers deepen their understanding of a river channel's geomorphological variation characteristics affected by the outburst flood and provide a data reference for the analysis of the erosion and accumulation characteristics of the downstream river channel. Especially, with these two relationships, i.e., R–L∗ and –, the boulder bars' geometry size could be predicted after a landslide dam formation in the future. Then the new landform after the dam failure could be evaluated. These presentations could contribute to stream restoration planning, river navigation, and even utilization planning of the boulder bars.
In this paper, a downstream moveable bed for 4 to 7 times the length of landslide dam length along the channel was set up, and through eight flume experiments, 25 boulder bars were formed in the downstream channel caused by overtopping flow. The boulder bar's formation process and geometry characteristics are studied. The main conclusions are as follows.
-
Boulder bars first appear near dam toes (upstream reaches located on the dam's initial breach sides). The inertia force made sediment accumulate on the opposite banks of the channel bed, resulting in boulder bars' formations downstream. During the landslide dam failure process, the boulder bars' upstream edges are mainly in siltation states. The boulder bars' lengths increase with failure time, mainly caused by boulder bars' upstream edges moving upstream. The downstream edges develop slowly and basically near the initial positions. And the developments of boulder bars' downstream edges are much smaller than the developments of boulder bars' upstream edges.
-
During the dam failure process, the lengths varied faster than the widths and heights of boulder bars. And the boulder bars' lengths along the river are the largest, followed by widths and lastly the heights when the dam failed completely. The volumes of the boulder bars increase with dam failure, and boulder bars' volume characteristics are consistent with boulder bars' length characteristics.
-
In the experiments, the ratio (R) of boulder bar length to width falls in the range of 8 to 14. There is a nonlinear relationship between length to width ratio (R) and the dimensionless length of the boulder bar (L∗), which could be described as a hyperbolic equation. The dimensionless area () of boulder bar has a linear relationship with the dimensionless area () of the channel cross section, whose slope is about 0.5.
-
In this paper, 38 boulder bars in the field triggered by four landslide dams' failures were investigated. By comparing the data of boulder bars in the field with the boulder bars in the experiments, the distribution and geometric size characteristics of the boulder bars in the field are more consistent with the boulder bars in the experiments, indicating that the experimental results are more reliable.
The codes and data that support the findings of this study are available from the corresponding author upon reasonable request.
XJ was responsible for the experiments, article planning, and writing. HC was responsible for calculating the article parameters. LG was responsible for the figures, and WL was responsible for checking the full article.
The authors declare that they have no conflict of interest.
Publisher's note: Copernicus Publications remains neutral with regard to jurisdictional claims in published maps and institutional affiliations.
This research has been supported by The National Natural Science Foundation of China (nos. 41807289 and 42177149) and Key Laboratory of Ministry of Education for Geomechanics and Embankment Engineering, Hohai University (no. 202020) and the Open Fund of the Key Laboratory of Mountain Hazards and Surface Processes, Chinese Academy of Sciences (no. KLMHESP-20-05). The authors thank the editor Lina Polvi Sjöberg and three anonymous referees for their valuable suggestions.
This research has been supported by the The National Natural Science Foundation of China (grant nos. 41807289 and 42177149), the Key Laboratory of Ministry of Education for Geomechanics and Embankment Engineering, Hohai University (grant no. 202020), and the Open fund of the Key Laboratory of mountain hazards and surface processes, Chinese Academy of Sciences (grant no. KLMHESP-20-05).
This paper was edited by Lina Polvi Sjöberg and reviewed by three anonymous referees.
Ashworth, P. J.: Mid-channel bar growth and its relationship to local flow strength and direction, Earth Surf. Proc. Land., 21, 103–123, 1996.
Ashworth, P. J., Best, J. L., Roden, J. E., Bristow, C. S., and Klaassen, G. J.: Morphological evolution and dynamics of a large, sand braid-bar, Jamuna River, Bangladesh, Sedimentology, 47, 533555, https://doi.org/10.1046/j.1365-3091.2000.00305.x, 2000.
Benito, G. and O'Connor, J. E.: Number and size of last glacial Missoula floods in the Columbia River valley between the Pesco Basin, Washington, and Portland, Oregon, Geol. Soc. Am. Bull., 115, 624–638, https://doi.org/10.1130/0016-7606(2003)115<0624:NASOLM>2.0.CO;2, 2003.
Carling, P. A.: Freshwater megaflood sedimentation: what can we learn about generic processes?, Earth-Sci. Rev., 125, 87113, https://doi.org/10.1016/j.earscirev.2013.06.002, 2013.
Casagli, N., Ermini, L., and Rosati, G.: Determining grain size distribution of the material composing landslide dams in the Northern Apennines: Sampling and processing methods, Eng. Geol., 69, 83–97, https://doi.org/10.1016/S0013-7952(02)00249-1, 2003.
Chen, S. C., Lin, T. W., and Chen, C. Y.: Modeling of natural dam failure modes and downstream riverbed morphological changes with different dam materials in a flume test, Eng. Geol., 188, 148–158, https://doi.org/10.1016/j.enggeo.2015.01.016, 2015.
Costa, J. E. and Schuster, R. L.: The formation and failure of natural dams, Geol. Soc. Am. Bull., 100, 1054–1068, https://doi.org/10.1130/0016-7606(1988)100<1054:TFAFON>2.3.CO;2, 1988.
Jiang, X. G.: Laboratory Experiments on Breaching Characteristics of Natural Dams on Sloping Beds, Advances in Civil Engineering, 5064093, 14, https://doi.org/10.1155/2019/5064093, 2019.
Jiang, X. G. and Wei, Y. W.: Natural dam breaching due to overtopping: effects of initial soil moisture, B. Eng. Geol. Environ., 78, 4821–4831, https://doi.org/10.1007/s10064-018-01441-7, 2018.
Jiang, X. G. and Wei, Y. W.: Erosion characteristics of outburst floods on channel beds under the conditions of different natural dam downstream slope angles, Landslides, 17, 1823–1834, https://doi.org/10.1007/s10346-020-01381-y, 2020.
Lamb, M. and Fonstad, M.: Rapid formation of a modern bedrock canyon by a single flood event, Nat. Geosci., 3, 477–481, https://doi.org/10.1038/ngeo894, 2010.
Maizels, J. K.: Jökulhlaup deposits in proglacial areas, Quaternary Sci. Rev., 16, 793–819, https://doi.org/10.1016/S0277-3791(97)00023-1, 1997.
Marren, P. M. and Schuh, M.: Criteria for identifying jökulhlaup deposits in the sedimentary record, in: Megaflooding on Earth and Mars, edited by: Burr, D. M., Carling, P. A., and Baker, V. R., Cambridge University Press, Cambridge, 225–242, https://doi.org/10.1017/CBO9780511635632, 2009.
Mohrig, D. and Smith, J. D.: Predicting the migration rates of subaqueous dunes, Water Resour. Res., 32, 3207–3217, https://doi.org/10.1029/96WR01129, 1996.
Morris, M., Hassan, M., Kortenhaus, A., Geisenhainer, G., Visser, P. J., and Zhu, Y.: Modelling breach initiation and growth, HR Wallingford, Munich, 1, 175–185, 2009.
Peng, M. and Zhang, L. M.: Breaching parameters of landslide dams, Landslides, 9, 13–31, https://doi.org/10.1029/2018WR024107, 2012.
Russell, A. J. and Knudsen, O.: Controls on the sedimentology of the November 1996 jökulhlaup deposits, Skeiðarársandur, Iceland, in: Fluvial sedimentology VI. Special Publication of the International Association of Sedimentologists, edited by: Smith, N. D. and Rogers, J., 28, 315–329, https://doi.org/10.1002/9781444304213.ch23, 1999.
Shaw, J. B. and McElroy, B.: Backwater number scaling of alluvial bed forms, J. Geophys. Res.-Earth, 121, 1436–1455, https://doi.org/10.1002/2016JF003861, 2016.
Takahashi, T.: Debris flow Mechanics, Prediction and Countermeasures, Taylor and Francis Group, London, 35–38, https://doi.org/10.1201/9780203946282, 2007.
Turzewski, M. D., Huntington, K. W., and LeVeque, R. J.: The Geomorphic Impact of Outburst Floods: Integrating Observations and Numerical Simulations of the 2000 Yigong Flood, Eastern Himalaya, J. Geophys. Res.-Earth, 124, 1056–1079, https://doi.org/10.1029/2018JF004778, 2019.
Wu C. H., Hu, K. H., Liu, W. M., Wang, H., Hu, X. D., and Zhang, X. P.: Morpho-sedimentary and stratigraphic characteristics of the 2000 Yigong River landslide dam outburst flood deposits, eastern Tibetan Plateau, Geomorphology, 367, 107293, https://doi.org/10.1016/j.geomorph.2020.107293, 2020.
Zhou, G. G. D., Zhou, M. J., Shrestha, M. S., Song, D. R., Choi, C. E., Cui, K. F. E., Peng, M., Shi, Z. M., Zhu, X. H., and Chen, H. Y.: Experimental investigation on the longitudinal evolution of landslide dam breaching and outburst floods, Geomorphology, 334, 29–43, https://doi.org/10.1016/j.geomorph.2019.02.035, 2019.


