the Creative Commons Attribution 4.0 License.
the Creative Commons Attribution 4.0 License.
Breaking down chipping and fragmentation in sediment transport: the control of material strength
Douglas J. Jerolmack
As rocks are transported, they primarily undergo two breakdown mechanisms: fragmentation and chipping. Fragmentation is catastrophic breakup by fracture in the bulk – either by subcritical crack growth under repeated collisions, or from a single high-energy (supercritical) collision – and produces angular shards. Chipping is a distinct low-energy mechanism of impact attrition that involves shallow cracking; this process rounds river pebbles in a universal manner under bed-load transport. Despite its geophysical significance, the transition from chipping to fragmentation is not well studied. Here, we examine this transition experimentally by measuring the shape and mass evolution of concrete particles of varying strength, subject to repeated collisions in a rotating drum. For sufficiently strong particles, chipping occurred and was characterized by the following: attrition products were orders of magnitude smaller than the parent; attrition rate was insensitive to material strength; and particles experienced monotonic rounding toward a spherical shape. As strength decreased, we observed the onset of a subcritical cracking regime associated with fragmentation: mass of attrition products became larger and more varied; attrition rate was inversely proportional to material strength; and shape evolution fluctuated and became non-monotonic. Our results validate conceptual and numerical models for impact attrition: chipping follows “Sternberg's law” of exponential mass loss through time; for fragmentation, the lifetime of particles increases nonlinearly with material strength, consistent with “Basquin's law” of fatigue failure. We suggest that bedrock erosion models must be clarified to incorporate distinct attrition mechanisms, and that pebble or bedrock-channel shape may be utilized to deduce the operative mechanism in a given environment.
- Article
(7023 KB) - Full-text XML
- BibTeX
- EndNote
The energy associated with transporting sediment influences the shape of the particles being moved and also the shape and erosion rate of bedrock channels impacted by those particles. Events such as rockfalls, landslides, or debris flows tend to be highly energetic and cause rocks to fragment into large, angular pieces (Bernd et al., 2010; Arabnia and Sklar, 2016). Bed-load transport is of lower energy and causes river rocks to round into smooth pebbles (Krumbein, 1941; Kuenen, 1956; Attal and Lavé, 2009; Domokos et al., 2014). The attrition mechanism that occurs during transport depends on impact energy and material properties, including size, shape, and material strength (Yashima et al., 1987; Tavares and King, 1998; Sklar and Dietrich, 2004; Salman et al., 2004a; Tavares and das Neves, 2008; Domokos et al., 2015; Pál et al., 2021). These attrition mechanisms have been classified in the mechanics literature using the terms “frictional abrasion”, “chipping”, and “fragmentation” (Bemrose and Bridgwater, 1987; Ghadiri and Zhang, 2002), each with distinct micro-mechanical failure modes. Models for bedrock river erosion by “saltation abrasion” (Sklar and Dietrich, 2001, 2004; Lamb et al., 2015) – which we prefer to call “saltation attrition” to avoid confusion regarding mechanism – implicitly assume that rock breakdown occurs by fragmentation due to subcritical crack growth (Atkinson, 1984; Atkinson and Meredith, 1987; Pugno et al., 2006). On the other hand, models for mass loss and rounding of river pebbles explicitly describe attrition as chipping. The boundary between chipping and fragmentation has not been examined experimentally, and the assumed mechanisms of attrition in the models above have not been explicitly demonstrated. Our study aims to do just that and to show how material strength influences attrition mechanism (Fig. 1).
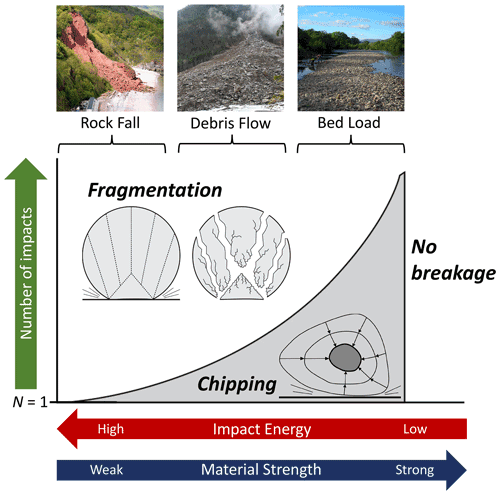
Figure 1Schematic phase diagram delineating attrition mechanism as a function of impact energy (influenced by collision velocity and particle mass) or material strength, and number of impacts; adapted from the proposed diagram of Zhang and Ghadiri (2002). For extremely weak materials or high-impact energies (left), explosive fragmentation can occur from a single collision. As material strength increases or impact energy decreases (center), fragmentation occurs through fatigue failure, where cracks grow progressively through the material with each collision. In the limit of pure chipping, which applies to low-impact energies or strong materials (right), the number of impacts required to produce fragmentation increases toward infinity. Examples of transport mechanisms associated with fragmentation, fatigue failure, and pure chipping are rockfalls, debris flows, and bed-load transport, respectively. Fragmentation figure is adapted from Salman et al. (2004b); chipping figure is adapted from Szabó et al. (2013); photographs of transport mechanisms are reproduced from Wikimedia Commons.
The process of subcritical crack growth is well studied in the rock mechanics literature (Atkinson, 1984; Atkinson and Meredith, 1987; Brantut et al., 2013). At intermediate impact energies, fatigue failure may occur as fractures gradually grow into the rock as a result of repeated impacts (Bitter, 1963; Moss et al., 1973; Salman et al., 2004a; Pál et al., 2021). A fundamental finding underlying theories for subcritical cracking is the celebrated “Paris' law” for cyclic loading: the crack growth per cycle shows a power-law dependence on the range of stress intensity applied during the cycle, where the exponent depends on material properties (Paris and Erdogan, 1963). A related finding is “Basquin's law” (Kim, 2019): the lifetime of an object undergoing fatigue failure exhibits a power-law dependence on the amplitude of an external load, where the exponent again depends on material properties (Kun et al., 2008). Both Paris' law (Pugno et al., 2006) and Basquin's law (Kun et al., 2008) have theoretical justification; we consider the latter here as it is easier to measure particle lifetime in experiments. Recasting Basquin's law in terms of repeated particle collisions implies that the number of collisions required to induce fragmentation should grow as a power-law function of material strength (or decay as a function of impact energy) (Fig. 1). Whether fragmentation occurs from one or many collisions, it ultimately results from cracks that propagate radially into the bulk from the impact site. These radial cracks can split the parent rock into irregularly shaped attrition products whose size is a significant fraction of the parent, in addition to smaller fragments (Moss et al., 1973; Adams, 1979; Bernd et al., 2010; Arabnia and Sklar, 2016; Perfect, 1997; Kun and Herrmann, 1999; Salman et al., 2004b; Grady, 2010). The mass and shape distributions of particles formed purely by fragmentation have universal characteristics that make them easily distinguishable in the field (Domokos et al., 2015, 2020), such as talus piles created by rockfalls (Verdian et al., 2021).
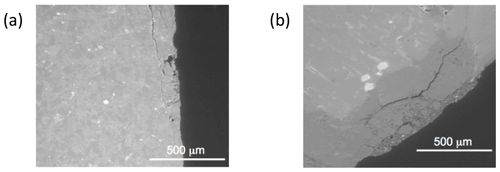
Figure 2Scanning electron microscope images depicting subsurface lateral cracks, formed after repeated binary collisions of rocks at energies representative of bed-load transport. We speculate that these cracks, and the shattered region bounded by them, are the result of compressive fracture cones formed by impulsive collisions. Images show thin sections of (a) quartz diorite and (b) volcanoclastic rock. Figure reproduced from Miller and Jerolmack (2020).
Low-energy collisions produce a qualitatively distinct behavior from that anticipated by Basquin's law. Compression crack cones generically form at the contact zone for a wide range of materials (Salman et al., 2004a). In brittle glasses and ceramics, this mode of cracking corresponds to Hertzian fracture (Wilshaw, 1971; Greeley and Iversen, 1987; Mohajerani and Spelt, 2010; Wang et al., 2017). For sufficiently brittle materials (including rocks and many building materials), plastic deformation and yielding in a localized region generally occur on unloading of the compressive impact stress (Rhee et al., 2001; Ghadiri and Zhang, 2002; Wilshaw, 1971; Salman et al., 2004a); in collisions, this corresponds to rebound. The net result is shallow lateral cracking, which produces chipping in natural rock and other materials (Rogers and Schubert, 1963; Wilshaw, 1971; Ghadiri and Zhang, 2002; Jerolmack and Brzinski, 2010; Miller and Jerolmack, 2020; Pál et al., 2021) (Fig. 2). Each collision produces a shower of fine particles that are orders of magnitude smaller than the parent (Miller and Jerolmack, 2020; Pál et al., 2021). In this limit, the shape evolution of both natural and artificial pebbles can be modeled purely geometrically. Essentially, areas that protrude from the pebble have a positive curvature and are more likely to strike another particle or the bed surface, and chip off. Thus, the shape of particles undergoing curvature-driven attrition initially evolves toward a sphere (Firey, 1974; Domokos et al., 2009; Várkonyi and Domokos, 2011; Domokos et al., 2014). Moreover, mass loss decays smoothly and exponentially as a function of time (or collision number) (Domokos et al., 2014), reproducing the so-called “Sternberg's law” (Sternberg, 1875). For the typical case of bed load with gravels impacting a streambed, it has been found that initially angular river pebbles round in a universal manner (Szabó et al., 2013; Miller et al., 2014; Szabó et al., 2015; Novák-Szabó et al., 2018) and that mass loss follows Sternberg's law (Sternberg, 1875; Kodama, 1994; Lewin and Brewer, 2002; Novák-Szabó et al., 2018). We caution the reader that in situ weathering has also been observed to produce rounded clasts in a wide variety of rock types (e.g., Chapman and Greenfield, 1949; Simpson, 1964; Ollier, 1967; Okumura, 1982; Sak et al., 2010). Nevertheless, sediments delivered to steep headwater regions tend to be fragmented through landslides or debris flows (e.g., Beschta, 1983; van Steijn, 1996; Hovius et al., 1997, 2000), and thus the shape change from angular to smooth can be attributed to the chipping process (Szabó et al., 2013; Miller et al., 2014; Szabó et al., 2015; Novák-Szabó et al., 2018).
Few studies have attempted to bridge the transition from chipping to fragmentation. Ghadiri and Zhang (2002) proposed a conceptual model that envisioned a continuous phase transition as a function of impact energy. Only recently has this idea been tested in a remarkable study that simulated impact attrition with the high-fidelity discrete element method (DEM) (Pál et al., 2021). In the low-energy limit, these simulations produced chipping as characterized by Sternberg's law and the universal rounding pattern associated with bed load. Fragmentation by fatigue failure did not occur. Beyond a critical energy, they found a damage regime (which they termed “cleavage”) that corresponded to fatigue failure and reproduced Basquin's law. The average size of attrition products grew rapidly with collision energy, with large fragments resulting from progressive crack growth over several collisions. In this intermediate regime, particle shape evolution became more erratic and departed from the universal chipping trend (Pál et al., 2021). Finally, for sufficiently large energies, they observed explosive fragmentation, in which the size of attrition products actually declined because the particles were pulverized. In this high-energy limit, particle mass and shape distributions followed universal trends expected for fragments.
The results demonstrated by the Pál et al. (2021) simulation clearly delineate chipping from fragmentation and show that the signatures of each process are encoded in shape and mass loss trends. The main purpose of our paper here is to provide the first experimental validation of a continuous phase transition from chipping to fragmentation. A secondary goal is to demonstrate that this transition can be forced by changes in material strength and to examine impact energies and material strengths that are relevant for sediment particles in nature. We perform laboratory experiments in which artificial particles with varying strength are repeatedly dropped in a rotating drum. The nature of the collisions is intentionally simplified – idealized particles created from cement–sand mixtures are utilized in order to isolate and tune material control, thus determining its influence on attrition mechanics. By measuring attrition rate, particle shape, and material strength under a known collision energy, we are able to characterize the relevant quantities that govern attrition rates and the transition from chipping to fragmentation.
2.1 Choosing material strength parameters
It is common to cast the impact attrition process in terms of the mass lost per collision, Δm. This mass loss is presumed to be proportional to collision energy, ΔE, such that
where Ab is a material susceptibility parameter (Anderson, 1986) that Miller and Jerolmack (2020) called the “brittle attrition number” [s2 m−2], and C1 is an experimentally determined constant (following the nomenclature of Miller and Jerolmack, 2020). Since collision energy is a function of the mass of the particle, m, and impact velocity, vi, where , this relation implies Sternberg's law (Sternberg, 1875) – i.e., that mass should decrease exponentially with number of impacts (or, similarly, transport distance) (Novák-Szabó et al., 2018). It has been proposed that susceptibility to fracture in brittle materials depends on a material's ability to store energy elastically (Engle, 1978; Wang et al., 2011). From mechanical considerations and dimensional analysis, several studies have arrived at a similar parameter (Sklar and Dietrich, 2004; Wang et al., 2011; Miller and Jerolmack, 2020):
where σs is yield strength [N m−2], Y is Young's modulus [N m−2], and ρs is the density of the material [kg m−3]. The parameter Ab was found to reasonably describe the control of material properties on the attrition rate of natural rocks undergoing low-energy collisions (Miller and Jerolmack, 2020). For this reason, we use Ab to characterize material strength in our study.
2.2 Preparation of experimental particles
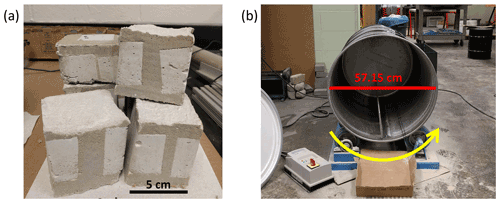
The use of concrete as a synthetic, brittle rock is common in experiments of fluvial bedrock erosion, and its mechanical behavior compares well to natural rocks (e.g., Sklar and Dietrich, 2001; Johnson and Whipple, 2007). We created concrete blocks by pouring a mixture of concrete mix (Quikrete product no. 1101) and coarse sand into 6 cm cubical molds (Fig. 3a). While concrete mixes meant for general construction purposes usually consist of gravel, sand, and Portland cement, the concrete mix used in the experiments was sieved to remove all clasts larger than coarse sand. The ratio of concrete mix to sand was varied in order to create particles of different strength with varying material susceptibility parameters (Ab) that would undergo chipping, fragmentation, or a combination of the two breakdown mechanisms in the rotating drum. A total of 10 different mixtures were created – 80 %, 75 %, 66.7 %, 50 %, 33.3 %, 25 %, 20 %, 16.7 %, 14.3 %, and 12.5 % – where percentage indicates volume of concrete mix in the mixture (VCM). There were five particles created for each mixture, resulting in a total of 50 concrete particles tested. For all sand and concrete mixtures, water was added for an approximately 0.4–0.6 water-to-sand and cement mixture ratio. Efforts were taken to ensure that the sand and cement mix were uniformly combined before water was added. Particles were left to cure for 10 to 15 d before being used in experiments.
2.3 Measuring material strength parameters
An Instron Universal Testing System (model 2406) was utilized to conduct uniaxial compression tests of the prepared cement particles. These particles were prepared independently of those used in rounding experiments (see below) using the same protocols; however, slight variations in water content and curing time did occur. Efforts were taken to ensure that cube surfaces in contact with the Instron were smooth and parallel, although this was not always achieved. A 25 kN load cell was used for the particles made of 12.5 % to 50 % VCM, and a 150 kN load cell was used for particles with 66.7 % to 80 % VCM. During the compression tests, the upper plate was driven down at a constant rate of 3 mm min−1 with maximum deformation set at 6 mm. Compression experiments produced a series of stress–strain curves, which were used to determine material properties of the various concrete mixtures. Yield strength – the transition from (linear) elastic behavior to plastic deformation on a stress–strain curve – is frequently used as a measure of material strength. However, our stress–strain curves were variable, especially for weaker materials that did not follow classic brittle failure (Fig. 5a). Accordingly, here we use ultimate strength, the greatest stress withstood by a material. This procedure is analogous to the point load test method that is often used to estimate yield stress, since the latter is proportional to ultimate strength (Perras and Diederichs, 2014). Young's modulus is typically determined from a linear fit to the stress–strain plot – i.e., in the elastic regime before failure. Due to the variable shapes of our stress–strain curves, we utilized a modified Young modulus (Y∗), which was estimated as the ultimate strength divided by the associated strain (Fig. 5a), in order to avoid ambiguity of how to choose an approximately linear regime over which to fit.
2.4 Attrition experiments in a rotating drum
Each concrete particle was individually placed in a 208.2 L (55 gal) open-head carbon steel drum with a lid fastened by a bolt ring closure (Fig. 3b). The drum was 57.15 cm in diameter and 83.31 cm long; all experiments were run with the drum rotating in the counterclockwise direction at 20 rotations min−1. A steel paddle was attached to the interior of the drum to ensure that the particle would collide with the side of the drum, as opposed to sliding along the bottom during the experiment. It was assumed that the particle impacted the side of the drum once per rotation; impact velocity was estimated to be 3.35 m s−1. Each particle was rotated in specific intervals – and thus experienced a certain number of impacts – in accordance with its composition. Weaker particles (12.5 %–20 % VCM) were removed after every impact and were significantly diminished at the conclusion of experiments; intermediate particles (25 %–50 % VCM) were rotated in intervals from 5 to 20 drops, and stronger particles (66.7 %–80 % VCM) remained in the drum for intervals ranging from 50 to 500 drops. After each interval, the particle was removed from the drum, weighed, and photographed before being returned to the drum to undergo another series of impacts. Camera resolution was 12.2 MP, and particles were photographed perpendicular to their initial orientation as long as the original sides were able to be distinguished.
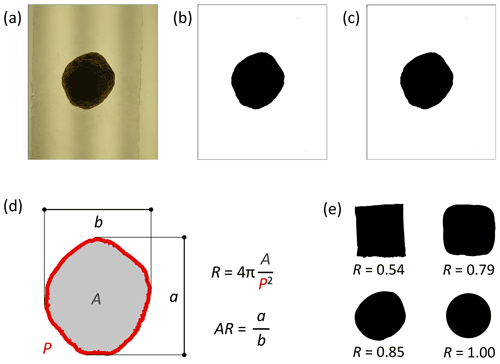
Figure 4A visual depiction of the ImageJ macro used to determine shape parameters. First, a photograph was taken of the particle at a fixed distance over an LED light table. The macro (a) cropped the image to include only the particle, (b) converted the original image into a binary image, then (c) filled any holes within the particle shape. The macro then (d) measured the area (A), perimeter (P), major axis (a), and minor axis (b) of the particle. These measurements were used to calculate circularity (R) and aspect ratio (AR), parameters that were used to quantify shape change over the course of the rounding experiments. Circularity measures how closely a shape approaches that of a circle, where R=1 indicates a perfect circle and R<1 indicates deviations from a circle. Panel (e) shows circularity measurements for particles of different shapes.
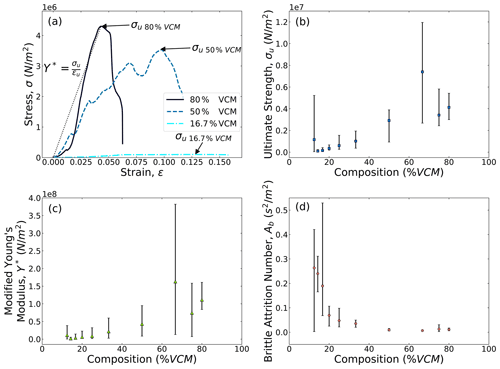
Figure 5Material strength properties determined by uniaxial compression tests. (a) Stress–strain curves for concrete particles with varying proportions of concrete mix, as indicated by volume concrete mix (VCM). Ultimate strength, σu [N m−2], is defined as the greatest stress withstood by the particle and is indicated on the stress–strain figure. Modified Young's modulus, Y∗ [N m−2], is calculated as the ultimate strength divided by the corresponding strain (Y∗ = ). (b) Average ultimate strength for each particle composition, where error bars indicate the range of values produced by experiments (n=5). (c) Average modified Young's modulus for each particle composition, where error bars indicate the range of values produced by experiments (n=5). (d) Average brittle attrition number, Ab [s2 m−2], for each particle composition, where error bars indicate the range of values produced by experiments (n=5).
At the conclusion of the rotating drum experiments, all images were analyzed using ImageJ. The image processing program converted the original photograph into a binary image in order to isolate the shape of the particle and measure shape parameters, including area, perimeter, circularity, and aspect ratio (Fig. 4). To verify the circularity measurements calculated by the image processing program, the shape measurement algorithm was applied to computer-generated circles and squares of known shape. While measured circularity was found to be resolution dependent, the maximum error was 10 % over the resolution range that is relevant for our experiments due to pixelation inherent in even idealized synthetic shapes.
3.1 Material properties
There was significant variation in the ultimate strengths and modified Young's moduli recorded for each set of particles, as well as the shapes of the stress–strain curves (Fig. 5); nevertheless, we are able to deduce significant trends from the data. An analysis of uniaxial compression test results revealed that particles with a higher percentage of concrete mix generally had a greater ultimate strength, σu (Fig. 5b). Mechanically strong particles could withstand loads ranging from 2.9 × 10⁶ to 7.3 × 10⁶ N m−2, although the strongest particle (66.7 % VCM) held up to 1.2 × 10⁷ N m−2. Mechanically weaker particles could hold loads ranging from 9.7 × 10⁴ to 1.2 × 10⁶ N m−2, although the weakest material (12.5 % VCM) withstood as little as 4.3 × 10⁴ N m−2 before failing (Fig. 5b). For cement mixtures, it is commonly observed that strength increases with increasing concrete content until a maximum is reached, beyond which strength drops because sand or aggregate grains lose contact with each other and no longer bear the load (Lan et al., 2010). Our results are consistent with this behavior. A similar trend was observed in particles' resistance to deformation, as measured through the modified Young modulus parameter, Y∗. Mechanically strong particles had modified Young's moduli ranging from 4.3 × 10⁷ to 1.6 × 10⁸ N m−2, although the strongest particle (66.7 % VCM) had a modified Young modulus measured at 3.8 × 10⁸ N m−2. Mechanically weaker particles had modified Young's moduli ranging from 1.5 × 10⁶ to 1.1 × 10⁷ N m−2, although the weakest material (12.5 % VCM) had a modified Young modulus measured at 2.7 × 10⁵ N m−2 (Fig. 5c).
The density of each type of concrete particle was also calculated from measured weight and volume for each cube, estimated from axis dimensions of the molds. Density did not vary systematically with material strength; however, the average density was approximately ρs=2000 kg m−3, with a range of approximately ± 35 %. This variation in density is significant and is likely related to lack of control in the sample preparation procedure. The brittle attrition number, Ab, was calculated using the measured values of ultimate strength, modified Young's modulus, and density for each particle (Eq. 2). Brittle attrition number values ranged from 1.3 × 10⁻² to 6.6 × 10⁻³ s2 m−2 for mechanically strong materials. Despite variability in the data, a clear trend is apparent between Ab and composition; Ab drops rapidly with increasing cement content, and appears to reach a roughly constant value for cement contents of 50 % VCM or greater (Fig. 5d). Results show that our samples span an order of magnitude of susceptibility to impact, as quantified by Ab, and thus that there is a significant dynamic range for exploring the control of material properties on attrition mechanism and rates. For the rest of the paper, we use Ab to represent material properties, and terms such as “strong” and “weak” refer to relatively small and large values of Ab, respectively. The average measured values of σu and Y∗, as well as the average calculated values of Ab, for each particle composition are reported in Fig. 9.
It is important to acknowledge that the significant variation in measured ultimate strength, modified Young's modulus, and density is likely related to lack of control in the preparation protocol. Some of our stress–strain curves do not follow the typical linear-elastic to sublinear-plastic pattern but instead display a series of peaks in the transition from the elastic to the plastic regime (Fig. 5a). This variation in particle strength and behavior, in response to compressional stress, is likely due to inconsistencies inherent in the process of making these concrete particles. It is possible that inhomogeneities produced during particle creation, including air bubbles, caused the curves to deviate from industrially produced concrete (e.g., Lan et al., 2010). Furthermore, molds used to create the concrete particles varied in size from 6 to 8 cm, and asperities were observed to form on the concrete along the open side of the mold. These asperities may have influenced compression testing by reducing the ultimate strength of each particle. The compressing plates should come into contact with flat surfaces; asperities would cause the force to load unevenly and may result in premature failure and the observed peaks in the stress–strain curves (e.g., Vasconcelos and Lourenço, 2009). While these caveats make us hesitant to interpret the trends between composition and measured material properties too finely given the noise, results are generally consistent with expectations for cement.
3.2 Mass loss
The mass of each particle decreased with each drop resulting from rotation in the drum. To quantify and characterize mass loss, we utilize the following parameters: mass fraction (M), cumulative mass loss (μ), and fractional mass loss per impact (Δm∗). Mass fraction is defined as the ratio of the mass of the particle during a given rotation to the initial particle mass (). Cumulative mass loss is the ratio of remaining mass to the initial particle mass (). Fractional mass loss per impact is the ratio of the mass lost during a given impact to the particle mass just prior to that impact ().
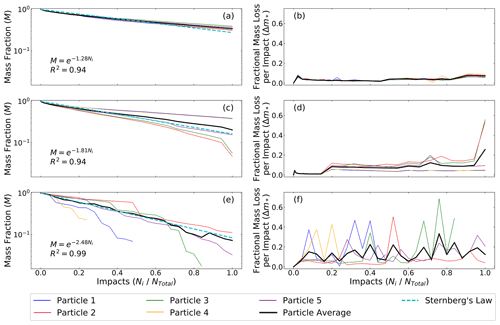
Figure 6Mass loss parameters over the course of rotation experiments. Figures to the left show changes in mass fraction, M, for (a) Ab = 1.1 × 10⁻² s2 m−2 (80 % VCM), (c) Ab = 9.3 × 10⁻³ s2 m−2 (50 % VCM), and (e) Ab = 1.9 × 10⁻³ s2 m−2 (16.7 % VCM). Figures to the right show fractional mass loss per impact, Δm∗, for the same materials in panels (b), (d), and (f). All five particles of a given composition are represented on each plot, with the average (n=5) depicted as a thicker black line. The number of impacts undergone by each particle has been normalized by the total number of impacts to allow comparison – mechanically strong particles in panels (a, b) underwent 4400 drops, panels (c, d) underwent 3500 drops, and mechanically weak particles in panels (e, f) underwent 25 drops. These weak particles, represented at the bottom of the figure, lost significant amounts of mass during each rotation and continued to be placed in the drum until very little of the original particle remained. Additionally, Sternberg's law – denoted by the dashed cyan line – was fit to each plot of mass fraction. Mass fraction scales exponentially with the number of impacts in the rotating drum.
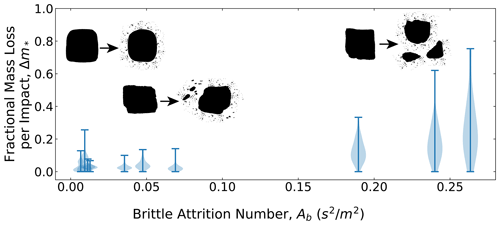
Figure 7Violin plots illustrating the size distribution of resulting particle fragments. The fractional mass loss per impact (Δm∗) was measured for all impacts; this result is displayed as a violin plot for each material strength. Example parent and daughter particles are displayed for strong, intermediate, and weak materials to illustrate typical breakdown products after an impact or series of impacts. Mechanically weak particles (higher Ab) produced fragments in a wide range of sizes and weights, while mechanically strong particles (lower Ab) generated a narrow distribution of chip sizes. This transition occurs around Ab = 0.1 s2 m−2.
Mass fraction for all particles generally decreased exponentially with impact number – i.e., data followed Sternberg's law (Fig. 6a, c, and e). For strong particles (small Ab), this exponential decay was smooth and repeatable. Moreover, fractional mass loss per impact remained very small, with approximately constant (Fig. 6b, d, and f) averages and little variability (Fig. 7). In other words, strong materials exhibited attrition behavior consistent with chipping. As strength decreased (Ab increased), mass loss became more erratic (Fig. 6) and the fractional mass loss per impact became increasingly large and variable (Figs. 6b, d, and f and 7). The weakest particles sustained the greatest fluctuations in mass loss, indicating that these particles experienced multiple fragmentation events as they rotated in the drum.
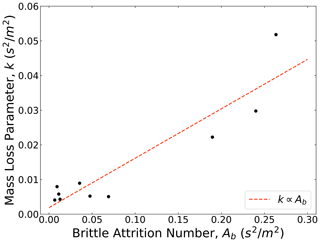
Figure 8Relation between the empirically determined mass loss parameter, k, and the brittle attrition number determined from material properties, Ab (Miller and Jerolmack, 2020); the best-fit linear relation is , where R2=0.85. Thus, the experimental constant C1=0.14.
While fractional mass loss per impact generally increased and became more variable with increasing Ab (Fig. 7), data suggest that there is a range of sufficiently strong materials (Ab<0.1) for which mass loss was insensitive to changes in material strength. Following Miller and Jerolmack (2020), we define an empirical mass loss parameter, , and compute the average value for each material from all measured drops in the drum of all particles. Although collision energy decreased through time in the experiments due to attrition, the mass loss parameter k accounts for this change in energy and thus is expected to be controlled only by material properties. Miller and Jerolmack (2020) proposed that k=AC1 – i.e., that the rate of mass loss depends linearly on Ab, and confirmed that relation for their experiments in natural rocks. Our results confirm a positive correlation between k and Ab that could be consistent with a linear relation (Fig. 8). However, data again indicate a regime of sufficiently strong materials (Ab<0.1) for which mass loss is roughly constant – or, at least, is not sensitive to changes in material properties.
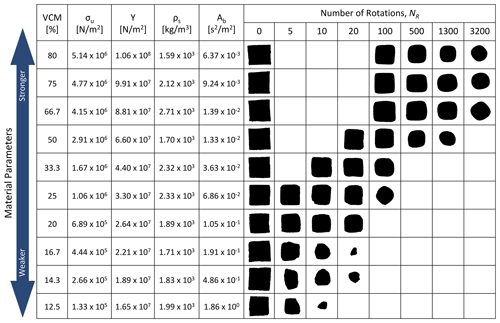
Figure 9Progression of particle breakdown according to material parameters and approximate number of impacts; Ni=0 indicates the initial shape of the particle. The material parameters of each particle type are indicated using VCM, average ultimate strength (σu) and modified Young's modulus (Y∗) as measured through Instron compression tests, and average brittle attrition number (Ab). Also shown is particle density (ρs), which does not vary systematically with material strength. Mechanically strong particles achieved highly rounded shapes over thousands of rotations, while mechanically weak particles quickly fragmented into irregular shapes over 10–20 impacts. Intermediate particles exhibited both behaviors.
3.3 Particle shape
Particles of differing mechanical properties experienced different shape evolution trajectories. Mechanically strong particles smoothly evolved from a cuboid block toward a sphere. The mechanically weak particles began with the same cuboid shape but fragmented into several angular pieces during their time in the rotating drum (Fig. 9). The strong particles could withstand thousands of impacts, while the weakest particles experienced 10–20 impacts before disintegrating. Particles of intermediate strength, Ab = 6.9 × 10⁻² to Ab = 3.6 × 10⁻² s2 m−1 (20 %–33.3 % VCM), evolved from a cuboid block toward a spherical shape but experienced several large breakage events along the trajectory toward a sphere. These intermediate particles remained in the rotating drum for several hundred impacts.
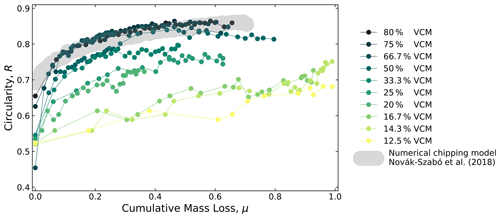
Figure 10Circularity as a function of cumulative mass loss for all material strengths tested, where circularity measurements are averaged for all particles of a given composition (n=5). Mechanically strong particles (50 %–80 % VCM) with Ab≤0.013 s2 m−2 fall within the pure chipping regime and conform to the universal curve described by Novák-Szabó et al. (2018), which is identified by the gray region.
Circularity, R, a measure of how closely a shape approaches a circle, increased over the course of the experiments for all materials. While the rate of change in particle shape is controlled by attrition rate, this dependence can be removed by examining particle shape as function of cumulative mass loss, μ (Domokos et al., 2014; Szabó et al., 2015; Novák-Szabó et al., 2018). The circularity of mechanically strong particles increased smoothly and monotonically with μ toward a spherical shape (R=1). For intermediate and weak particles, circularity increased but exhibited significant fluctuations associated with fragmentation events. Mechanically strong particles reached circularity values around 0.85, while weak particles reached values around 0.65 (Fig. 10). In the chipping limit associated with bed load, there is a single relation between R and μ that depends only on the initial shape of particles (Domokos et al., 2014; Szabó et al., 2015; Novák-Szabó et al., 2018; Pál et al., 2021). For our strong materials associated with Ab≤0.013 s2 m−2, we find that shape evolution is independent of material properties and closely follows the trend expected for chipping. For weaker materials, however, data exhibit a progressive departure from the expected chipping curve with increasing Ab (decreasing material strength) (Fig. 10).
We begin this section by reminding the reader of several caveats that should be kept in mind when interpreting the experimental results. Our particles, especially the weaker ones, may not have behaved strictly as brittle materials in terms of their failure. The high proportion of sand in mechanically weak particles frequently caused fragments to disintegrate on impact, producing a large population of sand and fine concrete fragments. The population of fine fragments was not collected or measured, as this pattern of disintegration differs from fragmentation in natural rocks under comparable conditions. Weaker particles sometimes exhibited complex stress–strain curves, resulting in potentially large error in estimating the material parameters required to compute Ab. Clearly, future experiments would benefit from better control in the cement preparation and testing process. Nevertheless, there are many aspects of fracture dynamics that are insensitive to the details of material properties (Oddershede et al., 1993; Ghadiri and Zhang, 2002). For example, experiments with balls of gypsum aggregate represent a canonical system for studying impact fragmentation and are often used to benchmark numerical simulations of brittle fracture (Oddershede et al., 1993; Kun and Herrmann, 1996; Åström et al., 2004). Our weak cements behave similarly to gypsum aggregates and weak sandstones, while the strongest cement mixtures are comparable to limestone. Furthermore, although direct comparisons cannot be drawn, our measured values for the ultimate strength of concrete particles are comparable to the tensile strength values of natural and artificial materials determined by Sklar and Dietrich (2001).
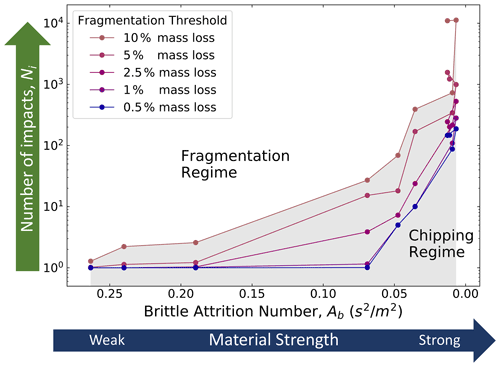
Figure 11Experimentally determined phase space for attrition showing the approximate number of impacts required to fragment particles of different material strength. The fragmentation threshold, or boundary between the chipping and fragmentation regimes, is defined by the fraction of mass lost during a given impact (e.g., fragmentation occurs if 10 % of a particle's current mass is lost).
The most important result from our study is the first experimental delineation of the transition from chipping to fragmentation. Our observations support the recent numerical simulations conducted by Pál et al. (2021) that map the attrition mechanisms of chipping and fragmentation to distinct patterns of mass loss and shape evolution. The chipping limit is defined by (i) a small fractional mass loss (Figs. 7 and 8) and (ii) the smooth evolution of particle shape toward a sphere (Fig. 10), both of which depend only weakly on material strength (or collision energy). In other words, experiments and simulations characterize the parameter space where pure chipping lives; here, mass loss follows Sternberg's law and shape evolution follows a universal rounding that is purely geometric (Novák-Szabó et al., 2018). The transition to fatigue failure (or “cleavage”; cf. Pál et al., 2021) occurs at a critical value for Ab (or collision energy), beyond which mass loss rapidly increases with decreasing material strength (or increasing collision energy) (Figs. 7 and 8). In this fatigue failure regime, mass loss and shape evolution trends become more erratic, and progressively depart from Sternberg's law and universal rounding, respectively, with decreasing material strength (increasing collision energy). Pál et al. (2021) noted that the cleavage regime of impact attrition in their simulations followed Basquin's law of subcritical failure: material failure occurs at a finite timescale, which decreases as a power-law function of the stress amplitude. By translating this law to our experiments, we would predict that the critical number of collisions required to fragment a particle, Ni, increases as a power law with increasing material strength (decreasing Ab). While we are cautious in drawing quantitative conclusions from our data given the noise and limitations described above, our results are qualitatively consistent with Basquin's law (Fig. 11).
Our findings suggest a bi-partite relation between Ab and attrition mass loss (Fig. 8), which differs from the linear relation between Ab and k that was suggested by the experiments of Miller and Jerolmack (2020). While this difference may be the result of variation and/or error in our measurements – and we cannot directly compare values for Ab since material properties were measured using different techniques – we note that the range of Ab explored in this study is roughly 3 times larger than that of Miller and Jerolmack (2020). In addition, the mass loss rates in the Miller and Jerolmack (2020) study were much lower than here due to both stronger materials and smaller collision energies. The simplest explanation is that there are two distinct mass loss regimes corresponding to the two distinct attrition mechanisms, as seen in the simulations of Pál et al. (2021). The well-controlled Miller and Jerolmack (2020) experiment, with stronger particles at lower energies, probed only the chipping regime. We speculate that the large variation in our material parameter measurements obscures the more subtle trend of k and Ab that is expected in the chipping regime; instead, only the rapid nonlinear increase of mass loss in the fatigue failure regime is resolved in our data (Fig. 8).
It is natural for the reader to wonder if and how our findings may be applied to the field, either directly by some appropriate scaling or indirectly through a numerical model. Collisions of particles with each other and the bed are more complicated in nature than our simplified experiments, and will vary among environments (bed load, debris flow, or rockfall). Miller and Jerolmack (2020) outline some of the differences between single-impact and bed-normal collisions in experiments such as ours, and the multi-body and tangential collisions that occur for the specific case of bed load. Quite simply, attrition rates measured from drop experiments cannot and should not be scaled directly to the field. The utility of our experiments, instead, lies in testing the fundamentals of impact attrition and dynamic fracture, which is an essential component of models for pebble and bedrock erosion. Our findings, which corroborate numerical simulations (Pál et al., 2021), point to the importance in distinguishing attrition mechanisms when modeling collision-driven erosion. Saltation attrition models for bedrock erosion typically encode some version of Eq. (1), and are most appropriate for the chipping regime – although our results here and in Miller and Jerolmack (2020) indicate that Ab should be determined, rather than simply using tensile strength as is commonly done (Sklar and Dietrich, 2004; Lamb et al., 2015). Determining the threshold energy and material strength associated with the transition from chipping to fatigue failure, for materials of interest in natural settings, becomes of critical importance for selecting an attrition relation. We recommend that future work begin with a more controlled experimental approach – using a wide range of natural rock materials, more stringent material property measurements, a wide range of collision energies, and a full analysis of attrition product sizes and shapes. In this manner, the universal phase transition from chipping to fragmentation that was proposed by Pál et al. (2021) could be quantitatively vetted for geologic materials and across the entire ranges of energies and material strengths that are relevant for geophysical flows. Given the universality of pebble mass and shape evolution in the chipping regime (Novák-Szabó et al., 2018; Miller and Jerolmack, 2020), the Basquin law for fatigue failure in the subcritical cracking regime (Kun et al., 2008; Pál et al., 2021), and the generic nature of fragmentation (Domokos et al., 2015, 2020), we are reasonably confident that future experiments will confirm and extend our findings.
By simulating transport over a wide range of material strengths in the laboratory, we were able to populate a phase space for attrition. Concrete particles were rotated in a metal drum to simulate transport, and results indicate that mechanically strong particles evolved smoothly and monotonically toward a spherical shape, while weak particles rapidly broke apart into irregular, angular pieces. Particles of intermediate strength experienced fatigue failure and erratically evolved toward a more rounded shape. These results demonstrate that chipping and subcritical cracking are distinctly different modes of impact attrition, with distinctly different patterns for mass and shape evolution.
Chipping is distinct from fatigue failure in that large-scale fragmentation does not occur; this corresponds to a limit of infinite sample lifetime. In this regime, mass loss follows Sternberg's law of exponential decay, and particle shape follows universal geometric rounding. Based on previous research, the chipping regime in nature corresponds to river pebbles and wind-blown sands undergoing saltation. The fatigue failure regime can be thought of as representing a continuous phase transition from pure chipping to pure fragmentation, where the number of collisions required to break a particle decreases as material strength weakens. Fragmentation due to subcritical cracking clearly occurs in some rivers, especially in steeper headwater channels (Adams, 1979; Miller et al., 2014). This picture bridges classic findings from subcritical cracking (Paris and Erdogan, 1963; Atkinson, 1984; Atkinson and Meredith, 1987; Kim, 2019) and from chipping (Rogers and Schubert, 1963; Wilshaw, 1971; Ghadiri and Zhang, 2002; Pál et al., 2021), and confirms recent direct numerical simulations of impact attrition (Pál et al., 2021) where this transition was cast as a function of impact energy. Sufficiently weak materials (or large collision energies) will catastrophically fail with a single impact; this limit is likely reached in nature for rockfalls and landslides. This work suggests that the parameter grouping AbΔE may serve to predict the attrition regime, which would allow one to constrain the energy associated with sediment transport from particle shape in the field (Novák-Szabó et al., 2018).
The transition from chipping to fatigue failure marks the limit of applicability for the geometric model of pebble rounding (Novák-Szabó et al., 2018). This is important because, in the chipping limit, this model may be used to infer the transport distance of river pebbles from their shape (Szabó et al., 2015; Novák-Szabó et al., 2018). The chipping–fragmentation threshold is also important for models of bedrock erosion by saltation attrition, as they implicitly assume that there is only one regime of impact attrition (Sklar and Dietrich, 2004; Lamb et al., 2015). These models may be most appropriate for the chipping regime, yet they cannot predict the onset of fatigue failure or the rapid increase in mass loss associated with it. While we urge caution in applying saltation erosion models until the thresholds for fatigue failure of relevant materials are determined, the morphology of bedrock-channel beds may provide helpful qualitative information. In particular, the chipping regime of bed-load erosion should produce bedrock-channel morphologies that are smooth down to the scale of impactors (Sipos et al., 2011), while fatigue failure would drive fragmentation of the channel and create rough and angular features.
All relevant data used to generate the figures in this paper are deposited in figshare, a free and open repository. These datasets can be accessed using the following link: https://doi.org/10.6084/m9.figshare.14069105 (Bodek and Jerolmack, 2021).
SB conducted the experiments, led data analysis, and wrote the paper. DJJ supervised the research, assisted in analysis and interpretation of data, and edited the paper.
The contact author has declared that neither they nor their co-author have any competing interests.
Publisher's note: Copernicus Publications remains neutral with regard to jurisdictional claims in published maps and institutional affiliations.
The authors would like to thank Kimberly Miller for supplying images and for helpful discussions.
This research has been supported by the University of Pennsylvania Center for Undergraduate Research and Fellowships and the Hayden Scholars program of the Department of Earth and Environmental Science.
This paper was edited by Rebecca Hodge and reviewed by Alexander Beer and two anonymous referees.
Adams, J.: Wear of unsound pebbles in river headwaters, Science, 203, 171–172, 1979. a, b
Anderson, R. S.: Erosion profiles due to particles entrained by wind: Application of an eolian sediment-transport model, Geol. Soc. Am. Bull., 97, 1270–1278, 1986. a
Arabnia, O. and Sklar, L. S.: Experimental study of particle size reduction in geophysical granular flows, Int. J. Erosion Control Eng., 9, 122–129, 2016. a, b
Åström, J., Linna, R., Timonen, J., Møller, P. F., and Oddershede, L.: Exponential and power-law mass distributions in brittle fragmentation, Phys. Rev. E, 70, 026104, https://doi.org/10.1103/PhysRevE.70.026104, 2004. a
Atkinson, B. K.: Subcritical crack growth in geological materials, J. Geophys. Res.-Sol. Ea., 89, 4077–4114, 1984. a, b, c
Atkinson, B. K. and Meredith, P. G.: The theory of subcritical crack growth with applications to minerals and rocks, in: Fracture Mechanics of Rock, edited by: Atkinson, B. K., 2, 111–166, 1987. a, b, c
Attal, M. and Lavé, J.: Pebble abrasion during fluvial transport: Experimental results and implications for the evolution of the sediment along rivers, J. Geophys. Res., 114, F04023, https://doi.org/10.1029/2009JF001328, 2009. a
Bemrose, C. R. and Bridgwater, J.: A review of attrition and attrition test methods, Powder Technol., 49, 97–126, 1987. a
Bernd, I., Laue, J., and Springman, S. M.: Fractal fragmentation of rocks within sturzstroms: insight derived from physical experiments within the ETH geotechnical drum centrifuge, Granul. Matter, 12, 267–285, https://doi.org/10.1007/s10035-009-0163-1, 2010. a, b
Beschta, R. L.: Channel changes following storm-induced hillslope erosion in the Upper Kowai Basin, Torlesse Range, New Zealand, Journal of Hydrology (New Zealand), 22, 93–111, 1983. a
Bitter, J. G. A.: A study of erosion phenomena, part I, Wear, 6, 5–21, https://doi.org/10.1016/0043-1648(63)90003-6, 1963. a
Bodek, S. and Jerolmack, D.: Particle Shape Evolution from Rotating Drum Experiments, figshare [data set], https://doi.org/10.6084/m9.figshare.14069105.v1, 2021. a
Brantut, N., Heap, M., Meredith, P., and Baud, P.: Time-dependent cracking and brittle creep in crustal rocks: A review, J. Struct. Geol., 52, 17–43, 2013. a
Chapman, R. W. and Greenfield, M. A.: Spheroidal weathering of igneous rocks, Am. J. Sci., 247, 407–429, 1949. a
Domokos, G., Sipos, A. Á., Szabó, G. M., and Várkonyi, P. L.: Formation of sharp edges and planar areas of asteroids by polyhedral abrasion, Astrophys. J., 699, L13–L16, https://doi.org/10.1088/0004-637X/699/1/L13, 2009. a
Domokos, G., Jerolmack, D. J., Sipos, A. Á., and Török, Á.: How river rocks round: resolving the shape size paradox, PLoS One, 9, e88657, https://doi.org/10.1371/journal.pone.0088657, 2014. a, b, c, d, e
Domokos, G., Kun, F., Sipos, A. Á., and Szabó, T.: Universality of fragment shapes, Sci. Rep., 5, 9147, https://doi.org/10.1038/srep09147, 2015. a, b, c
Domokos, G., Jerolmack, D. J., Kun, F., and Török, J.: Plato's cube and the natural geometry of fragmentation, P. Natl. Acad. Sci. USA, 117, 18178–18185, 2020. a, b
Engle, P. A.: Impact Wear of Materials, Elsevier, Sci., New York, 1978. a
Firey, W. J.: Shapes of worn stones, Mathematika, 21, 1–11, https://doi.org/10.1112/S0025579300005714, 1974. a
Ghadiri, M. and Zhang, Z.: Impact attrition of particulate solids. Part 1: A theoretical model of chipping, Chem. Eng. Sci., 57, 3659–3669, 2002. a, b, c, d, e, f
Grady, D. E.: Length scales and size distributions in dynamic fragmentation, Int. J. Fracture, 163, 85–99, https://doi.org/10.1007/s10704-009-9418-4, 2010. a
Greeley, R. and Iversen, J. D.: Wind as a geological process: on Earth, Mars, Venus and Titan, vol. 4, CUP Archive, Cambridge University Press, Cambridge, UK, 1987. a
Hovius, N., Stark, C. P., and Allen, P. A.: Sediment flux from a mountain belt derived by landslide mapping, Geology, 25, 231–234, 1997. a
Hovius, N., Stark, C. P., Hao-Tsu, C., and Jiun-Chuan, L.: Supply and removal of sediment in a landslide-dominated mountain belt: Central Range, Taiwan, J. Geol., 108, 73–89, 2000. a
Jerolmack, D. J. and Brzinski, T. A.: Equivalence of abrupt grain-size transitions in alluvial rivers and eolian sand seas: A hypothesis, Geology, 38, 716–722, https://doi.org/10.1130/G30922.1, 2010. a
Johnson, J. P. and Whipple, K. X.: Feedbacks between erosion and sediment transport in experimental bedrock channels, Earth Surf. Proc. Land., 32, 1048–1062, https://doi.org/10.1002/esp.1471, 2007. a
Kim, H. S.: Prediction of SN curves at various stress ratios for structural materials, Procedia Structural Integrity, 19, 472–481, 2019. a, b
Kodama, Y.: Experimental study of abrasion and its role in producing downstream fining in gravel-bed rivers, J. Sediment Res., A64, 76–85, 1994. a
Krumbein, W. C.: Measurement and geological significance of shape and roundness of sedimentary particles, J. Sediment Petrol., 11, 64–72, 1941. a
Kuenen, P. H.: Experimental abrasion of pebbles: rolling by current, J. Geol., 64, 336–368, 1956. a
Kun, F. and Herrmann, H. J.: A study of fragmentation processes using a discrete element method, Comput. Method. Appl. M., 138, 3–18, 1996. a
Kun, F. and Herrmann, H. J.: Transition from damage to fragmentation in collision of solids, Phys. Rev. E, 59, 2623, https://doi.org/10.1103/PhysRevE.59.2623, 1999. a
Kun, F., Carmona, H., Andrade Jr., J. S., and Herrmann, H. J.: Universality behind Basquin's law of fatigue, Phys. Rev. Lett., 100, 094301, 2008. a, b, c
Lamb, M. P., Finnegan, N. J., Scheingross, J. S., and Sklar, L. S.: New insights into the mechanics of fluvial bedrock erosion through flume experiments and theory, Geomorphology, 244, 33–55, 2015. a, b, c
Lan, H., Martin, C. D., and Hu, B.: Effect of heterogeneity of brittle rock on micromechanical extensile behavior during compression and loading, J. Geophys. Res., 115, B01202, https://doi.org/10.1029/2009JB006496, 2010. a, b
Lewin, J. and Brewer, P. A.: Laboratory simulation of clast abrasion, Earth. Surf. Proc. Land., 27, 145–164, https://doi.org/10.1002/esp.306, 2002. a
Litwin Miller, K. and Jerolmack, D.: Controls on the rates and products of particle attrition by bed-load collisions, Earth Surf. Dynam., 9, 755–770, https://doi.org/10.5194/esurf-9-755-2021, 2021. a, b, c, d, e, f, g, h, i, j, k, l, m, n, o, p, q
Miller, K. L., Szabó, T., Jerolmack, D. J., and Domokos, G.: Quantifying the significance of abrasion and size selective transport for downstream fluvial grain size evolution, J. Geophys. Res.-Earth, 119, 2412–2429, https://doi.org/10.1002/2014JF003156, 2014. a, b, c
Mohajerani, A. and Spelt, J.: Edge chipping of borosilicate glass by blunt indentation, Mech. Mater., 42, 1064–1080, 2010. a
Moss, A. J., Walker, P. H., and Hutka, J.: Fragmentation of granitic quartz in water, Sedimentology, 20, 489–511, https://doi.org/10.1111/j.1365-3091.1973.tb01627.x, 1973. a, b
Novák-Szabó, T., Sipos, A. Á., Shaw, S., Bertoni, D., Pozzebon, A., Grotolli, E., Sarti, G., Ciavola, P., Domokos, G., and Jerolmack, D. J.: Universal characteristics of particle shape evolution by bed-load chipping, Sci. Adv., 4, eaao4946, https://doi.org/10.1126/sciadv.aao4946, 2018. a, b, c, d, e, f, g, h, i, j, k, l
Oddershede, L., Dimon, P., and Bohr, J.: Self-organized criticality in fragmenting, Phys. Rev. Lett., 71, 3107–3110, https://doi.org/10.1103/PhysRevLett.71.3107, 1993. a, b
Okumura, S.: Weathering process of Nabari gabbroic body (1) Zoning of weathering crust, The Journal of the Japanese Association of Mineralogists, Petrologists and Economic Geologists, 77, 191–202, 1982. a
Ollier, C.: Spheroidal weathering, exfoliation and constant volume alteration, Z. Geomorphol., 11, 103–108, 1967. a
Pál, G., Domokos, G., and Kun, F.: Curvature flows, scaling laws and the geometry of attrition under impacts, Sci. Rep., 11, 20661, https://doi.org/10.1038/s41598-021-00030-1, 2021. a, b, c, d, e, f, g, h, i, j, k, l, m, n, o, p, q
Paris, P. C. and Erdogan, F.: A Critical Analysis of Crack Propagation Laws, J. Basic. Eng.-T. ASME, 85, 528–533, 1963. a, b
Perfect, E.: Fractal models for the fragmentation of rocks and soils: a review, Eng. Geol., 48, 185–198, https://doi.org/10.1016/S0013-7952(97)00040-9, 1997. a
Perras, M. A. and Diederichs, M. S.: A review of the tensile strength of rock: concepts and testing, Geotechnical and Geological Engineering, 32, 525–546, 2014. a
Pugno, N., Ciavarella, M., Cornetti, P., and Carpinteri, A.: A generalized Paris' law for fatigue crack growth, J. Mech. Phys. Solids, 54, 1333–1349, 2006. a, b
Rhee, Y.-W., Kim, H.-W., Deng, Y., and Lawn, B. R.: Brittle fracture versus quasi plasticity in ceramics: a simple predictive index, J. Am. Ceram. Soc., 84, 561–565, 2001. a
Rogers, J. J. W. and Schubert, C.: Size distributions of sedimentary populations, Science, 141, 801–802, https://doi.org/10.1126/science.141.3583.801, 1963. a, b
Sak, P. B., Navarre-Sitchler, A. K., Miller, C. E., Daniel, C. C., Gaillardet, J., Buss, H. L., Lebedeva, M. I., and Brantley, S. L.: Controls on rind thickness on basaltic andesite clasts weathering in Guadeloupe, Chem. Geol., 276, 129–143, 2010. a
Salman, A., Reynolds, G., Fu, J., Cheong, Y., Biggs, C., Adams, M., Gorham, D., Lukenics, J., and Hounslow, M.: Descriptive classification of the impact failure modes of spherical particles, Powder Technol., 143, 19–30, 2004a. a, b, c, d
Salman, A. D., Reynolds, G. K., Fu, J. S., Cheong, Y. S., Biggs, C. A., Adams, M. J., Gorham, D. A., Lukenics, J., and Hounslow, M. J.: Descriptive classification of the impact failure modes of spherical particles, Powder Technol., 143–144, 19–30, https://doi.org/10.1016/j.powtec.2004.04.005, 2004b. a, b
Simpson, D. R.: Exfoliation in the Upper Pocahontas Sandstone, Mercer County, West Virginia, Am. J. Sci., 262, 545–551, 1964. a
Sipos, A. Á., Domokos, G., Wilson, A., and Hovius, N.: A discrete random model describing bedrock profile abrasion, Math. Geosci., 43, 583–591, 2011. a
Sklar, L. S. and Dietrich, W. E.: Sediment and rick strength controls on river incision into bedrock, Geology, 29, 1087–1090, https://doi.org/10.1130/0091-7613(2001)029<1087:SARSCO>2.0.CO;2, 2001. a, b, c
Sklar, L. S. and Dietrich, W. E.: A mechanistic model for river incision into bedrock by saltating bed load, Water Resour. Res., 40, W06301, https://doi.org/10.1029/2003WR002496, 2004. a, b, c, d, e
Sternberg, H.: Untersuchungen über längen- und Querprofil geschiebeführender Flüsse, Zeitschrift für Bauwesen, 25, 486–506, 1875. a, b, c
Szabó, T., Fityus, S., and Domokos, G.: Abrasion model of downstream changes in grain shape and size along the Williams River, Australia, J. Geophys. Res.-Earth, 118, 2059–2071, https://doi.org/10.1002/jgrf.20142, 2013. a, b, c
Szabó, T., Domokos, G., Grotzinger, J. P., and Jerolmack, D. J.: Reconstructing the transport history of pebbles on Mars, Nat. Commun., 6, 8366, https://doi.org/10.1038/ncomms9366, 2015. a, b, c, d, e
Tavares, L. M. and das Neves, P. B.: Microstructure of quarry rocks and relationships to particle breakage and crushing, Int. J. Miner. Process., 87, 28–41, https://doi.org/10.1016/j.minpro.2008.01.007, 2008. a
Tavares, L. M. and King, R. P.: Single-particle fracture under impact loading, Int. J. Miner. Process., 54, 1–28, https://doi.org/10.1016/S0301-7516(98)00005-2, 1998. a
van Steijn, H.: Debris-flow magnitude–frequency relationships for mountainous regions of Central and Northwest Europe, Geomorphology, 15, 259–273, 1996. a
Várkonyi, P. L. and Domokos, G.: A general model for collision-based abrasion processes, IMA J. Appl. Math., 76, 47–56, https://doi.org/10.1093/imamat/hxq066, 2011. a
Vasconcelos, G. and Lourenço, P. B.: Experimental characterization of stone masonry in shear and compression, Constr. Build. Mater., 23, 3337–3345, https://doi.org/10.1016/j.conbuildmat.2009.06.045, 2009. a
Verdian, J. P., Sklar, L. S., Riebe, C. S., and Moore, J. R.: Sediment size on talus slopes correlates with fracture spacing on bedrock cliffs: implications for predicting initial sediment size distributions on hillslopes, Earth Surf. Dynam., 9, 1073–1090, https://doi.org/10.5194/esurf-9-1073-2021, 2021. a
Wang, X.-E., Yang, J., Liu, Q.-F., Zhang, Y.-M., and Zhao, C.: A comparative study of numerical modelling techniques for the fracture of brittle materials with specific reference to glass, Eng. Struct., 152, 493–505, 2017. a
Wang, Z.-T., Wang, H.-T., Niu, Q.-H., Dong, Z.-B., and Wang, T.: Abrasion of yardangs, Phys. Rev. E, 84, 031304, https://doi.org/10.1103/PhysRevE.84.031304, 2011. a, b
Wilshaw, T.: The Hertzian fracture test, J. Phys. D, 4, 1567–1581, https://doi.org/10.1088/0022-3727/4/10/316, 1971. a, b, c, d
Yashima, S., Kanda, Y., and Sano, S.: Relationships between particle size and fracture energy or impact velocity required to fracture as estimated from single particle crushing, Powder Technol., 51, 277–282, https://doi.org/10.1016/0032-5910(87)80030-X, 1987. a
Zhang, Z. and Ghadiri, M.: Impact attrition of particulate solids. Part 2: Experimental work, Chem. Eng. Sci., 57, 3671–3686, 2002. a


