the Creative Commons Attribution 4.0 License.
the Creative Commons Attribution 4.0 License.
 | 17 Aug 2021
Identification of rock and fracture kinematics in high alpine rockwalls under the influence of elevation
Daniel Draebing
In alpine environments, tectonic processes, past glaciation and weathering processes fracture rock and prepare or trigger rockfalls, which are important processes of rock slope evolution and natural hazards. In this study, I quantify thermally and ice-induced rock and fracture kinematics and place these in the context of their role in producing rockfall and climate change. I conducted laboratory measurements on intact rock samples and installed temperature loggers and crackmeters at four rockwalls reaching from 2585 to 2935 m in elevation in the Hungerli Valley, Swiss Alps. My laboratory data show that thermal expansion followed three phases of rock kinematics, which resulted in a hysteresis effect. In the field, control crackmeters on intact rock reflected these temperature phases, and based on thermal expansion coefficients of these observed phases, I modelled thermal stress. Model results show that thermal stress magnitudes were predominantly below rock strengths. Crackmeters across fractures revealed fracture opening during cooling and reverse closing behaviour during warming on daily timescales. Elevation-dependent snow cover controlled the number of daily temperature changes and thermal stresses affecting both intact and fractured rock, while the magnitude is controlled by topographic factors influencing insolation. On a seasonal scale, slow ice-segregation-induced fracture opening can occur within lithology-dependent temperature regimes called frost cracking windows. Shear plane dipping controlled whether fractures opened or closed irreversibly with time due to thermally induced block crawling on an annual scale. Climate change will shorten snow duration and increase temperature extremes and will, therefore, affect the number and the magnitude of thermal changes and associated stresses. Earlier snowmelt in combination with temperature increase will shift the ice-induced kinematic processes to higher elevations. In conclusion, climate change will affect and change rock and fracture kinematics and, therefore, change rockfall patterns in alpine environments. Future work should quantify rockfall patterns and link these patterns to climatic drivers.
- Article
(15224 KB) - Full-text XML
-
Supplement
(999 KB) - BibTeX
- EndNote


Alpine environments are characterized by high relief due to the interaction of tectonic uplift, climate and erosion (e.g. Schmidt and Montgomery, 1995; Whipple et al., 1999; Egholm et al., 2009). Tectonics result in the fracturing of rock (Molnar et al., 2007), which promotes erosion. Glaciers eroded deep alpine valleys (Harbor et al., 1988; Herman et al., 2015; Prasicek et al., 2018) and amplify fracturing by thermo-hydro-mechanical rock slope damage during glacial cycles (Grämiger et al., 2017; Grämiger et al., 2018, 2020) and internal stress changes following glacier retreat (Leith et al., 2014a, b). Fracturing can be increased by mechanical (e.g. Eppes and Keanini, 2017), chemical (e.g. Dixon and Thorn, 2005) and biological weathering (e.g. Viles, 2012) as well as synergies between weathering processes (Viles, 2013b). Therefore, glacial erosion preconditions and paraglacial processes including weathering prepare and trigger rock slope failures (McColl, 2012; McColl and Draebing, 2019), which are common and hazardous processes (Oppikofer et al., 2008; Krautblatter and Moore, 2014) and key agents of alpine landscape evolution (Moore et al., 2009; Krautblatter et al., 2012).
Current research highlights the role of mechanical weathering (Eppes and Keanini, 2017). Diurnal and seasonal ambient meteorological changes causing cyclic heating and cooling (Gunzburger and Merrien-Soukatchoff, 2011; Collins and Stock, 2016), wet–dry cycles (Zhang et al., 2015), freeze–thaw cycles (Matsuoka, 2001, 2008) or active-layer thaw (Draebing et al., 2014, 2017a) produce critical and subcritical stresses that propagate micro-fractures (Eppes et al., 2018; Draebing and Krautblatter, 2019). Several studies investigated the influence of thermal changes on rockwalls and demonstrated that sudden erosion by thermal shock (Collins et al., 2018, 2019) and slow thermally induced propagation of fractures in alpine rockwalls (Hasler et al., 2012; Collins and Stock, 2016; Weber et al., 2017) continuously weakens rock and can trigger rockfall (Ishikawa et al., 2004; Collins and Stock, 2016). Several studies suggest that thermal changes can induce sliding or creeping of rock blocks (Gunzburger et al., 2005; do Amaral Vargas et al., 2013). This mechanism can be amplified by rock wedges that fill fractures during cooling phases and thermally expand during warming phases (Bakun-Mazor et al., 2013, 2020). However, there is no field validation of rock creeping processes yet.
Freezing of water can cause ice-induced fracture mechanics. Volumetric expansion is a rapid process that occurs when water freezes to ice and increases in volume by 9 % (e.g. Matsuoka and Murton, 2008). Matsuoka (2001, 2008) observed volumetric expansion-induced fracture opening during sudden cooling events in autumn and due to refreezing of meltwater in late spring and early summer. Draebing and Krautblatter (2019) recently simulated this process in the laboratory and showed that volumetric expansion due to refreezing causes subcritical stresses and that freezing of saturated fractures is rare but can develop critical stresses. In contrast, ice segregation causes stresses by a thermally induced suction that result in water migration to the freezing front (Matsuoka and Murton, 2008). This process operates on seasonal scales, can crack intact rocks (Murton et al., 2006), or widen existing fractures (Draebing et al., 2017b; Draebing and Krautblatter, 2019) and cause subcritical stresses (Draebing and Krautblatter, 2019). Several studies suggest that ice segregation or fracture ice plays a role in deep-seated rock slope deformation and rockfall (Blikra and Christiansen, 2014; Phillips et al., 2016b).
While an increased number of studies investigated the kinematics resulting from individual weathering processes, there is still a poor understanding of the spatial variation in these processes. Thermal and ice processes in alpine environments are influenced by rock temperature and snow cover that shows high spatial variation due to elevation and topographic effects (e.g. Gruber et al., 2004b; Morán-Tejeda et al., 2013; Draebing et al., 2017a). In this study, I collected three rock samples representing different lithologies of alpine rockwalls in the Hungerli Valley, Swiss Alps, and conducted laboratory tests to investigate the influence of thermal changes on rock kinematics. Furthermore, I installed control crackmeters and rock temperature loggers on intact rocks at four rockwalls reaching from 2585 to 2935 m in elevation to validate laboratory-derived rock deformation behaviour and to model thermal stresses. I installed crackmeters across fractured rock to quantify thermally and ice-induced fracture kinematics and to identify their spatial variation along elevation. I analyse my observations in a geomorphic context and discuss the role of rock and fracture kinematics for preparing and triggering rockfall.
The Hungerli Valley is a hanging valley located in the Turtmann Valley, Valais Alps, Switzerland (Fig. 1a). The geology is predominantly paragneiss, consisting of schistose quartz slate (Bearth, 1980). At the Rothorn (RH) the schistose quartz slate is intersected by aplite and at the Hungerlihorli (HH) by amphibolite (Bearth, 1980). The valley was shaped by past glaciations, and regional ice sheet models suggest an ice cover up to 2800 m during the Last Glacial Maximum (LGM; Kelly et al., 2004). In addition, cirque glaciation was abundant during LGM at the Rothorn (RH), Furggwanghorn (FH), and between Hungerlihorli (HH) and Brändjispitz (BS; Fig. 1c and d). During the Little Ice Age, only the Rothorn cirque was ice-covered and is currently occupied by the remnants of the Rothorn Glacier (RG) that possessed a surface area of 0.053 km2 and a length of 405 m in 2011 (Fischer et al., 2014). Rockwalls occur at elevations that range from 2500 up to 3300 m (Fig. 1b). The hanging valley (Fig. 1d) is occupied by several rock glaciers (Nyenhuis et al., 2005) and talus slopes (Otto et al., 2009). A sediment budget analysis showed that one-fifth of all stored deposits is derived from rockfall indicating a high rockfall activity (Otto et al., 2009).
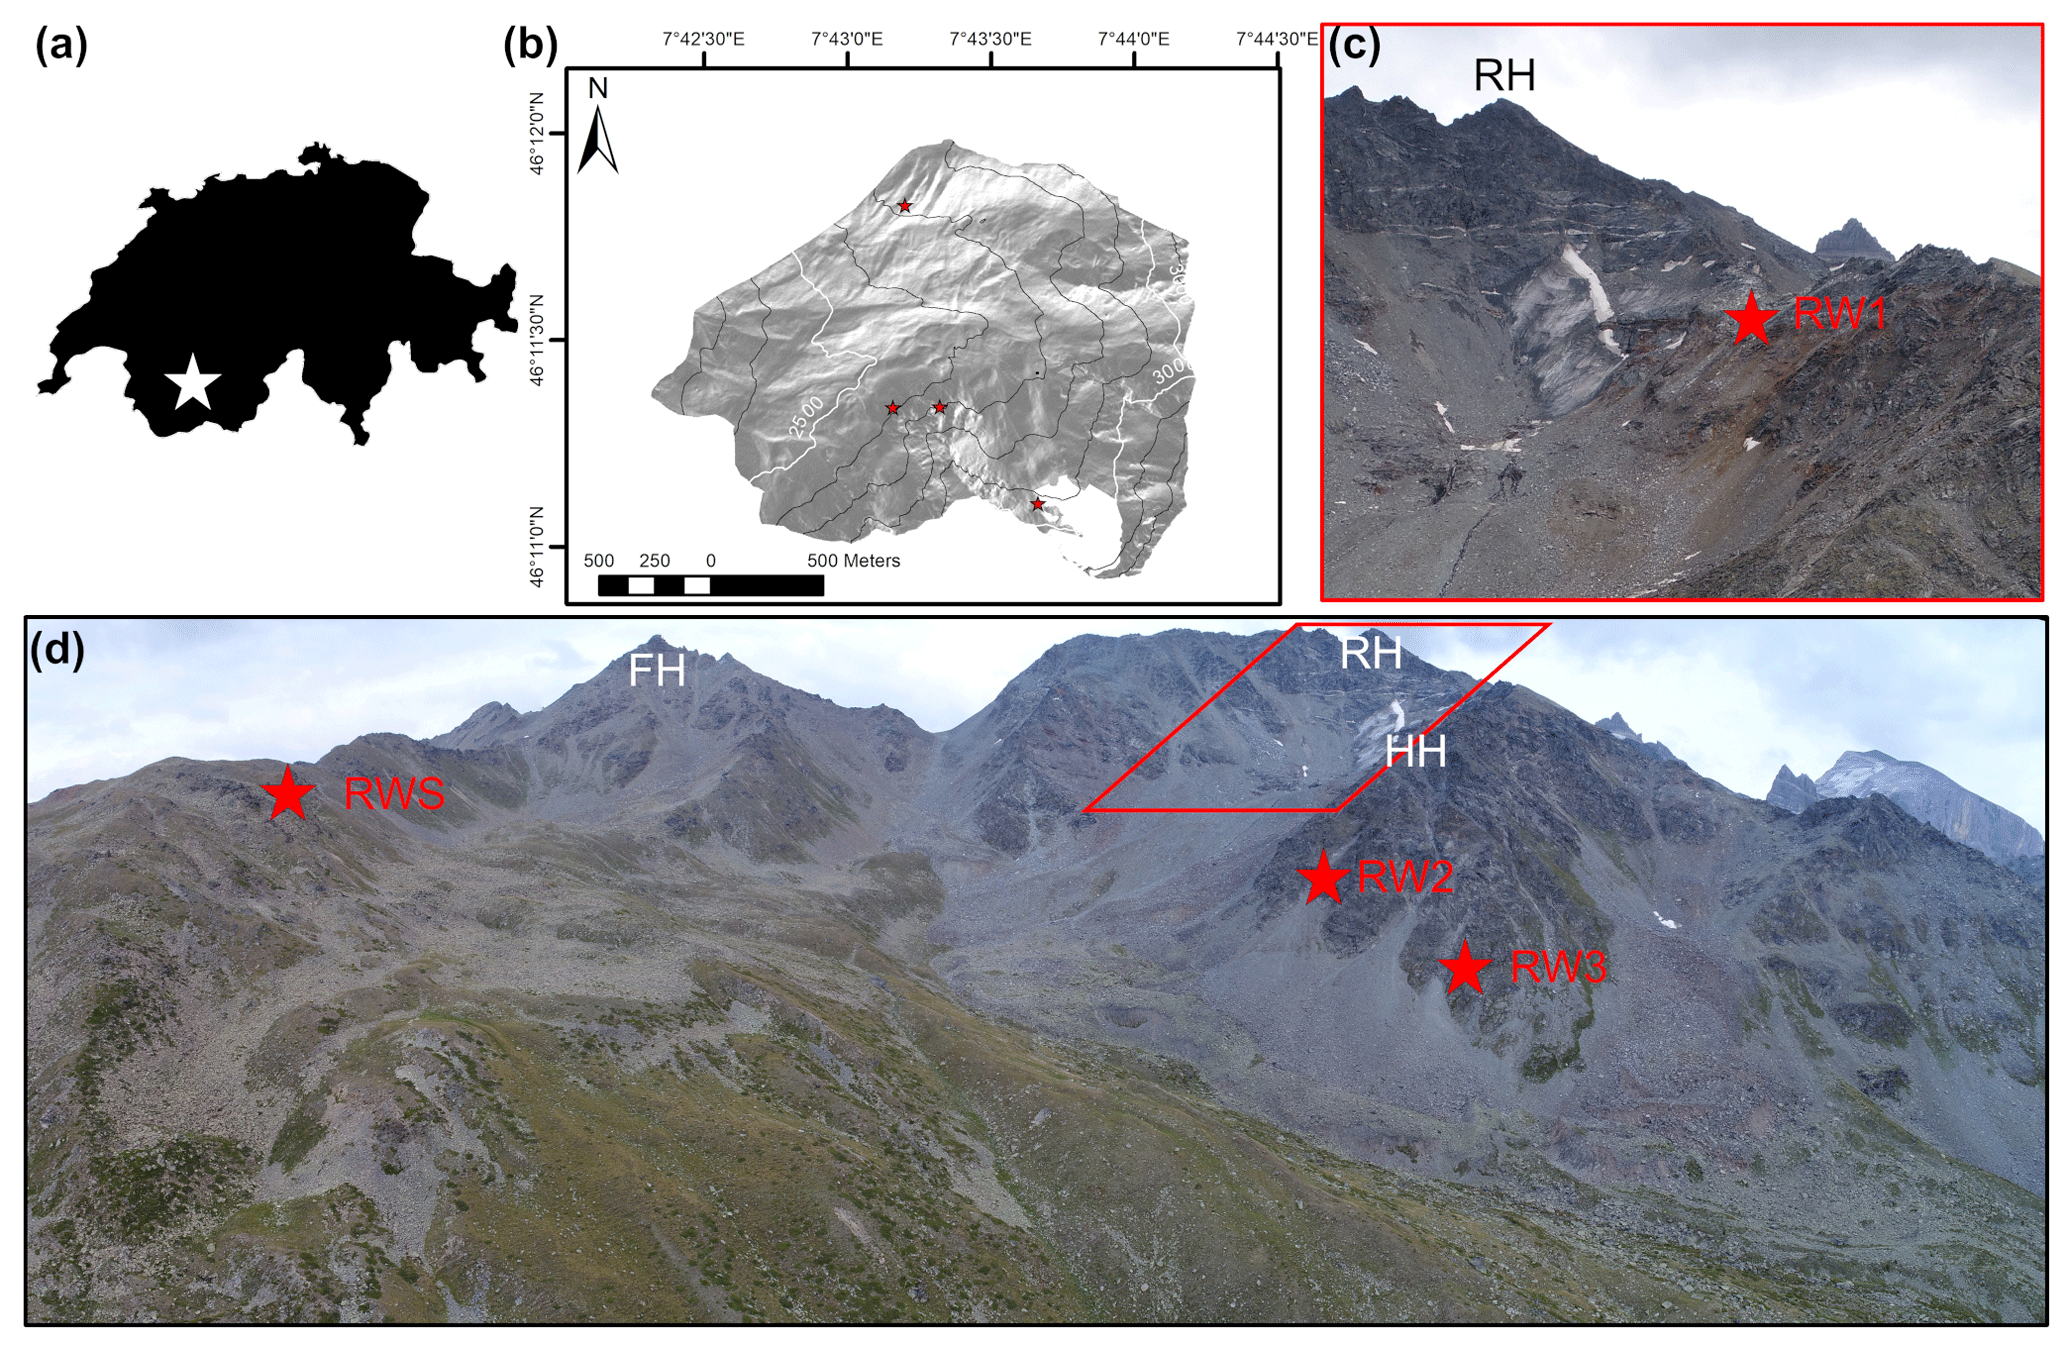
Figure 1(a) Location of the Hungerli Valley in Switzerland. (b) Hillshade model with highlighted crackmeter locations (red stars; Swiss Alti3D 2 m provided by the Federal Office of Topography, swisstopo). (c) Drone photo of the Rothorn cirque with the location of RW1. (d) Drone photo of the Hungerli Valley with locations of RW2, RW3 and RWS. The red parallelogram highlights the photo extent of (c). Initials show the location of mountain peaks Furggwanghorn (FH, 3161 m), Rothorn (RH, 3277 m), Hungerlihorli (HH, 3007 m) and Brändjispitz (BS, 2852 m) in the area.
3.1 Laboratory measurements
To understand controlling factors of rock kinematics, I conducted laboratory measurements on air-dried rock samples in a freezing chamber. For this purpose, I collected three approximately 0.4 m long, 0.15 m wide and 0.2 m high rock samples without visible evidence of weathering from talus slopes below rockwalls with lithologies ranging from aplite (AP, RW1) and amphibolite (AM, RW2) to schistose quartz slate (QS, RW3). I assume that the rock samples are representative of the rockwall. On each rock sample (Fig. 2), two crackmeters were installed at the top (RD1) and at one side of the sample (RD2) to monitor rock deformation (RD) and rock-top temperature (RTT) at 1 min intervals. The two Geokon crackmeters 4420-3 measured RD and automatically corrected thermal expansion of the instrument. After temperature correction, the resolution of RD is below 0.00075 mm with an accuracy below 0.003 mm, while RTT is measured with an accuracy of ±0.5 ∘C. Two high-precision Greisinger thermistors connected to a Pt 100 temperature sensor (0.03 ∘C accuracy) were used to monitor rock temperature in the centre of the rock sample at 5 cm depth (RT5cm) and at 2 cm depth (RT2 cm). To keep room temperature constant at low levels, the freezing chamber is located in a fridge that keeps the surrounding temperature at 8 to 10 ∘C. The freezing chamber itself consists of a custom-made Fryka cooler with a temperature-controlled (0.1 ∘C accuracy) ventilation system to enable cooling of samples without thermal layering. The rock samples were cooled down from 10–14 to −8/9 ∘C RT2 cm in 7–9 h. Then, I stopped cooling and enhanced a “natural” warming for 15 to 17 h until 8 ∘C RT2 cm was reached. Based on the linear correlation, I derived the thermal expansion coefficient α:
with L being crackmeter length, ΔRD being rock deformation change and ΔRT being rock temperature change.
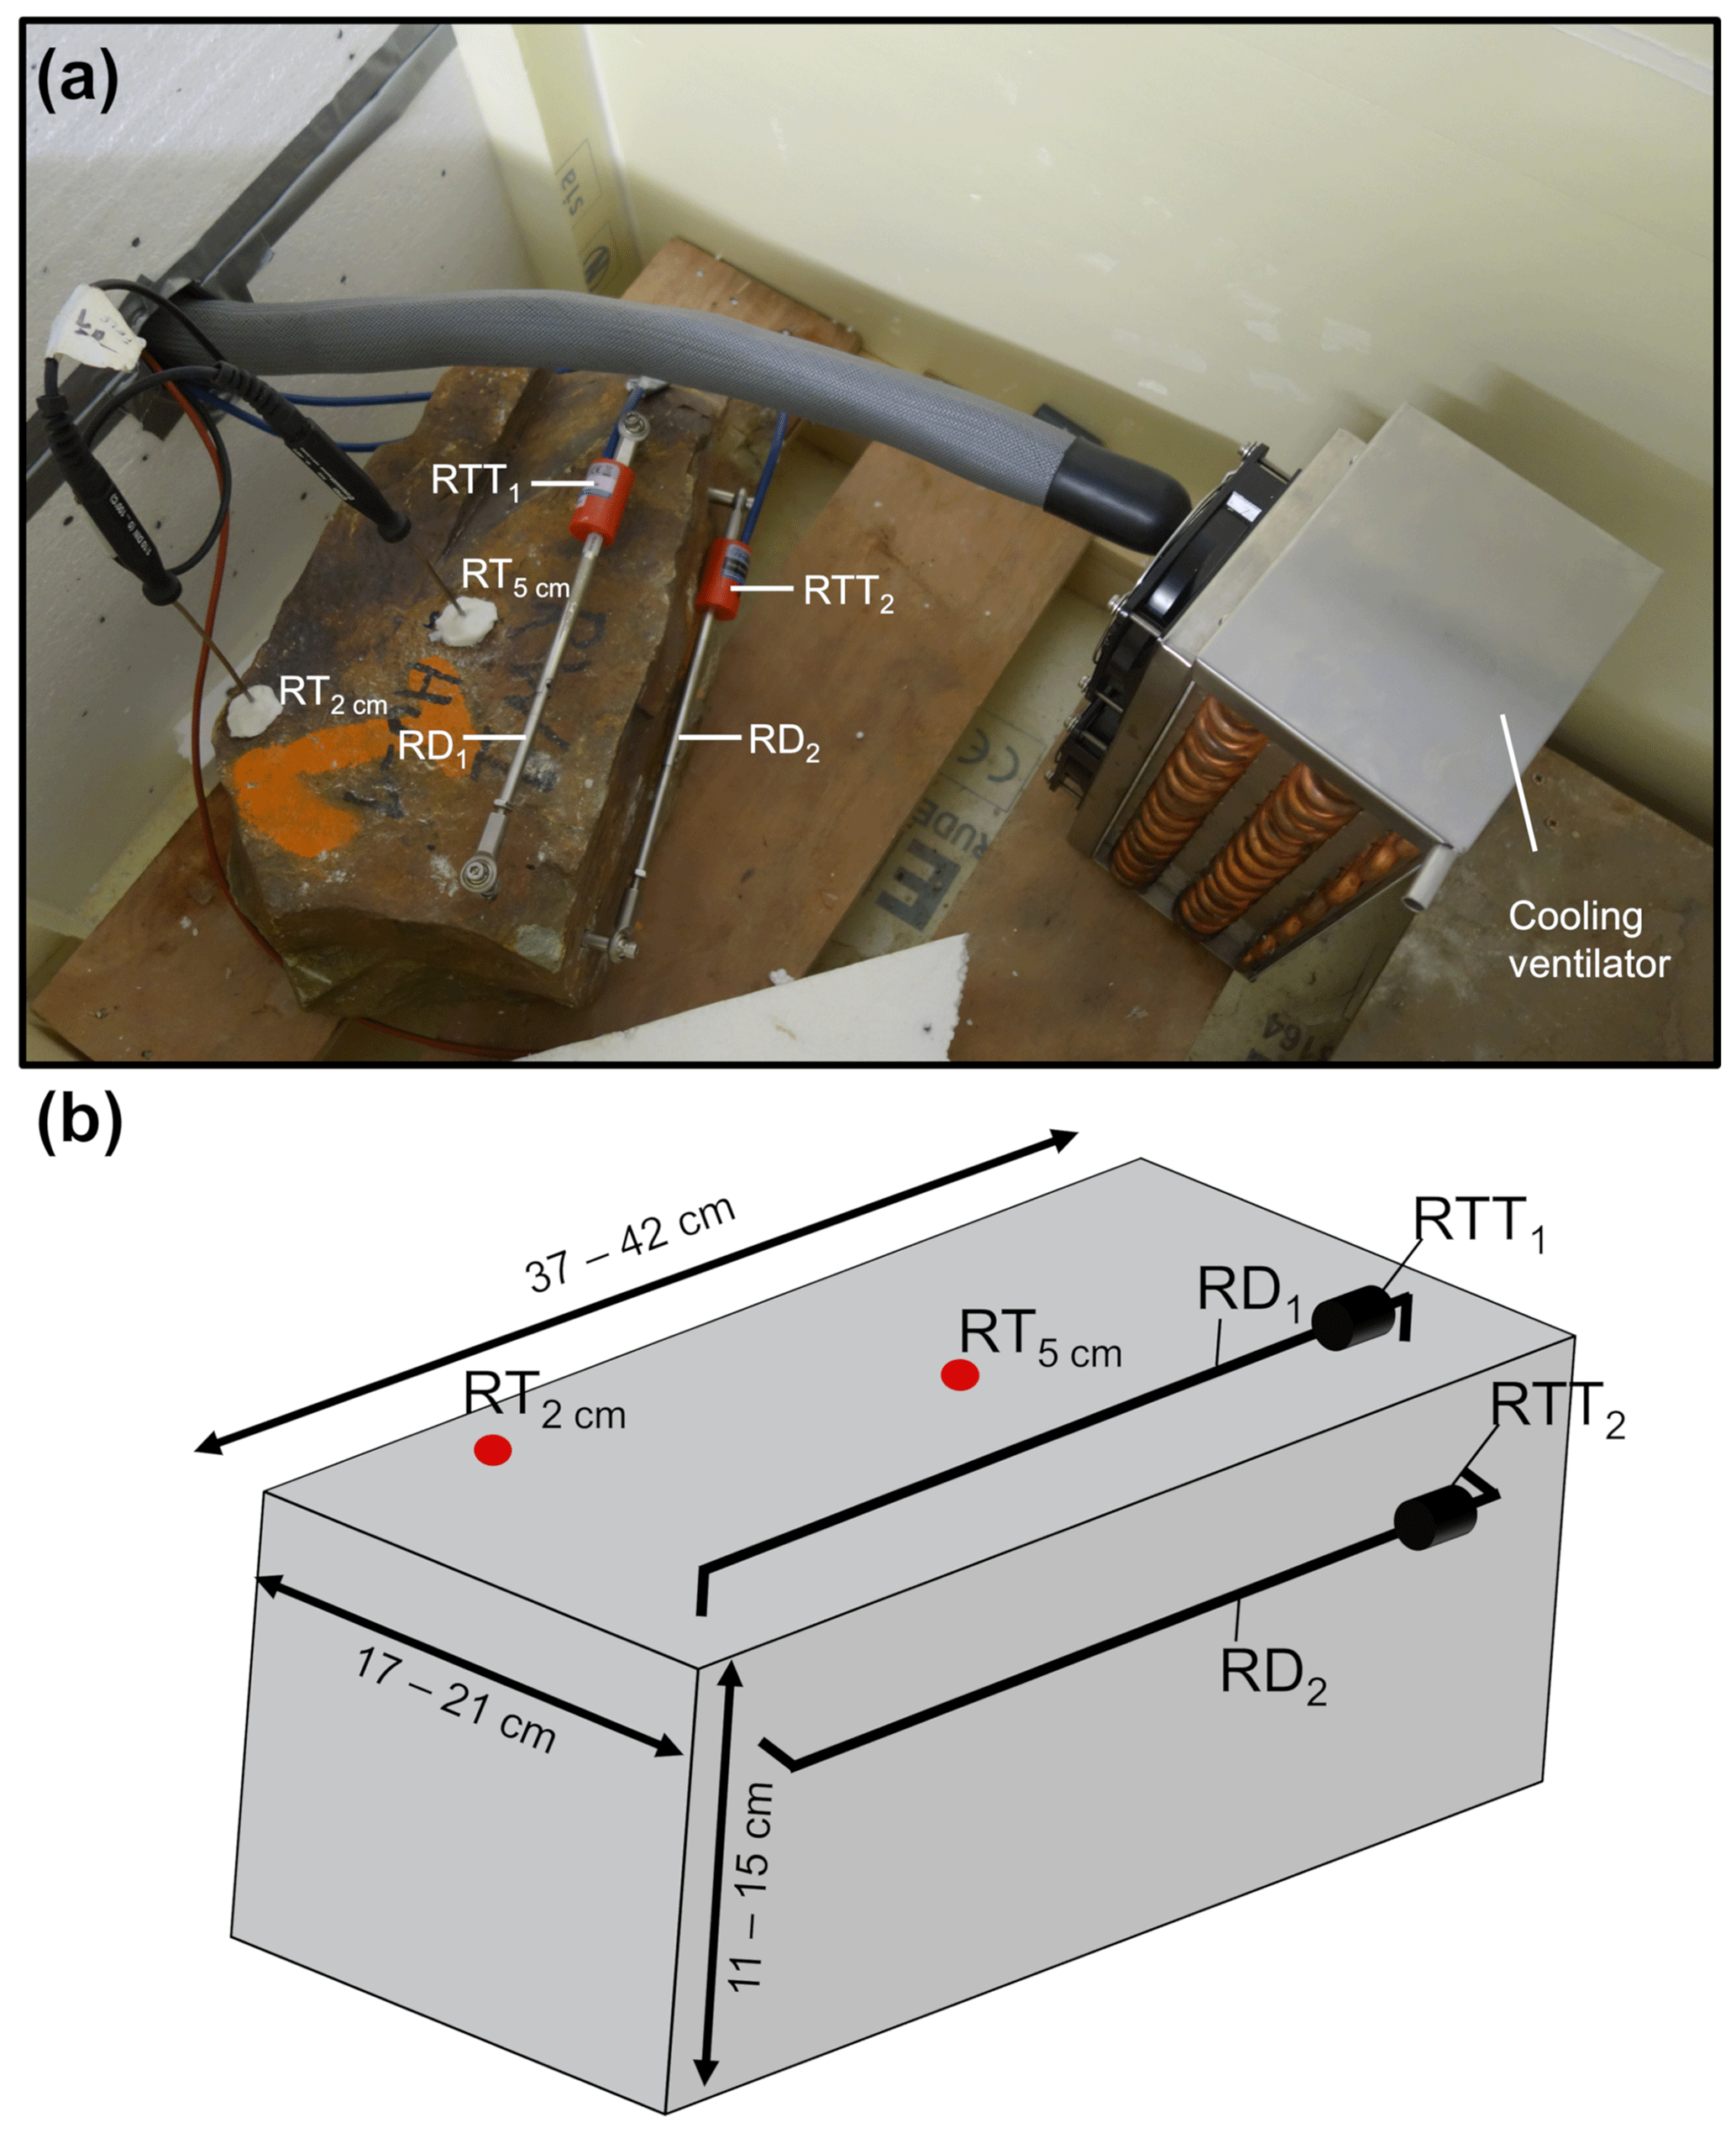
Figure 2(a) Cooling chamber with aplite sample from RW1. (b) Schematic illustration of the sensors at the rock samples. Rock deformation (RD) was measured by two crackmeters. Thermistors record rock-top temperature (RTT) for temperature correction of RD. Two temperature sensors measured rock temperature at 2 cm (RT2 cm) and 5 cm (RT5 cm) depth.
Table 1Seismic, mechanical and thermal properties of aplite, amphibolite and schistose quartz slate. Seismic properties include Young modulus E and Poisson ratio υ; mechanical properties include uniaxial compressive strength σu and tensile strength σt and thermal expansion coefficients for the cooling αcool and warming cycle αwarm.

Young modulus E and Poisson's ratio υ were derived using a Geotron ultrasonic generator USG40 in combination with Geotron preamplifier VV51 and 20 kHz sensors (Table 1). Seismic signals were recorded using a Pico oscilloscope and data analysed using the software Geotron Lighthouse DW. Uniaxial compressive strength σu and tensile strength σt was measured (Table 1) in accordance with norms of the German Geotechnical Society by Mutschler (2004) and Lepique (2008). For a more detailed description of the seismic and mechanical tests, see Draebing and Krautblatter (2019).
3.2 Field measurements
To monitor fracture movement in the field, I installed three 0.4 m long Geokon Vibrating-Wire Crackmeters 4420-1-50 with a resolution of 0.0125 mm and an accuracy of 0.05 mm at RW1 to RW3 in 2016 (Fig. 3a–c). Instrumented rockwalls range from 2585 (RW3) and 2672 (RW2) to 2935 m (RW1) and are exposed in northwest (NW) to northeast (NE) direction (Fig. 1; Table 2). The rock strength of each rockwall was measured using an N-type Schmidt hammer following Selby (1980, Table 3). At RW1, a 3.5 m long, 1.9 m wide and 2.1 m high aplite block was monitored (Fig. 3a). A slickenslide on top of the block indicates former movement of a previously overlying block. The monitored block slides into the valley on a 20 to 40∘ inclined shear plane (J3 in Fig. 3a) with an identical angle to the slickenslide. The block is separated from a second 2.5 m long and 2.6 m high block by a 10 to 70 mm wide crack of joint set 1 (J1). At RW2, three blocks were monitored, which are incorporated into a heavily fractured rockwall consisting of amphibolite. All monitored cracks possess an aperture between 1 and 2 mm (Table 2) and dips out of the rockwall (J2) at 50∘; however, the blocks are buttressed by adjacent blocks and the talus slope (Fig. 3b). RW3 consists of schistose quartz slate and blocks are 0.3 to 1.5 m wide (Fig. 3c). Blocks are separated by 81∘ inclined and 30 to 50 mm wide cracks (J2), which were monitored. The schist cleavage dips into the rockwall at 22∘.
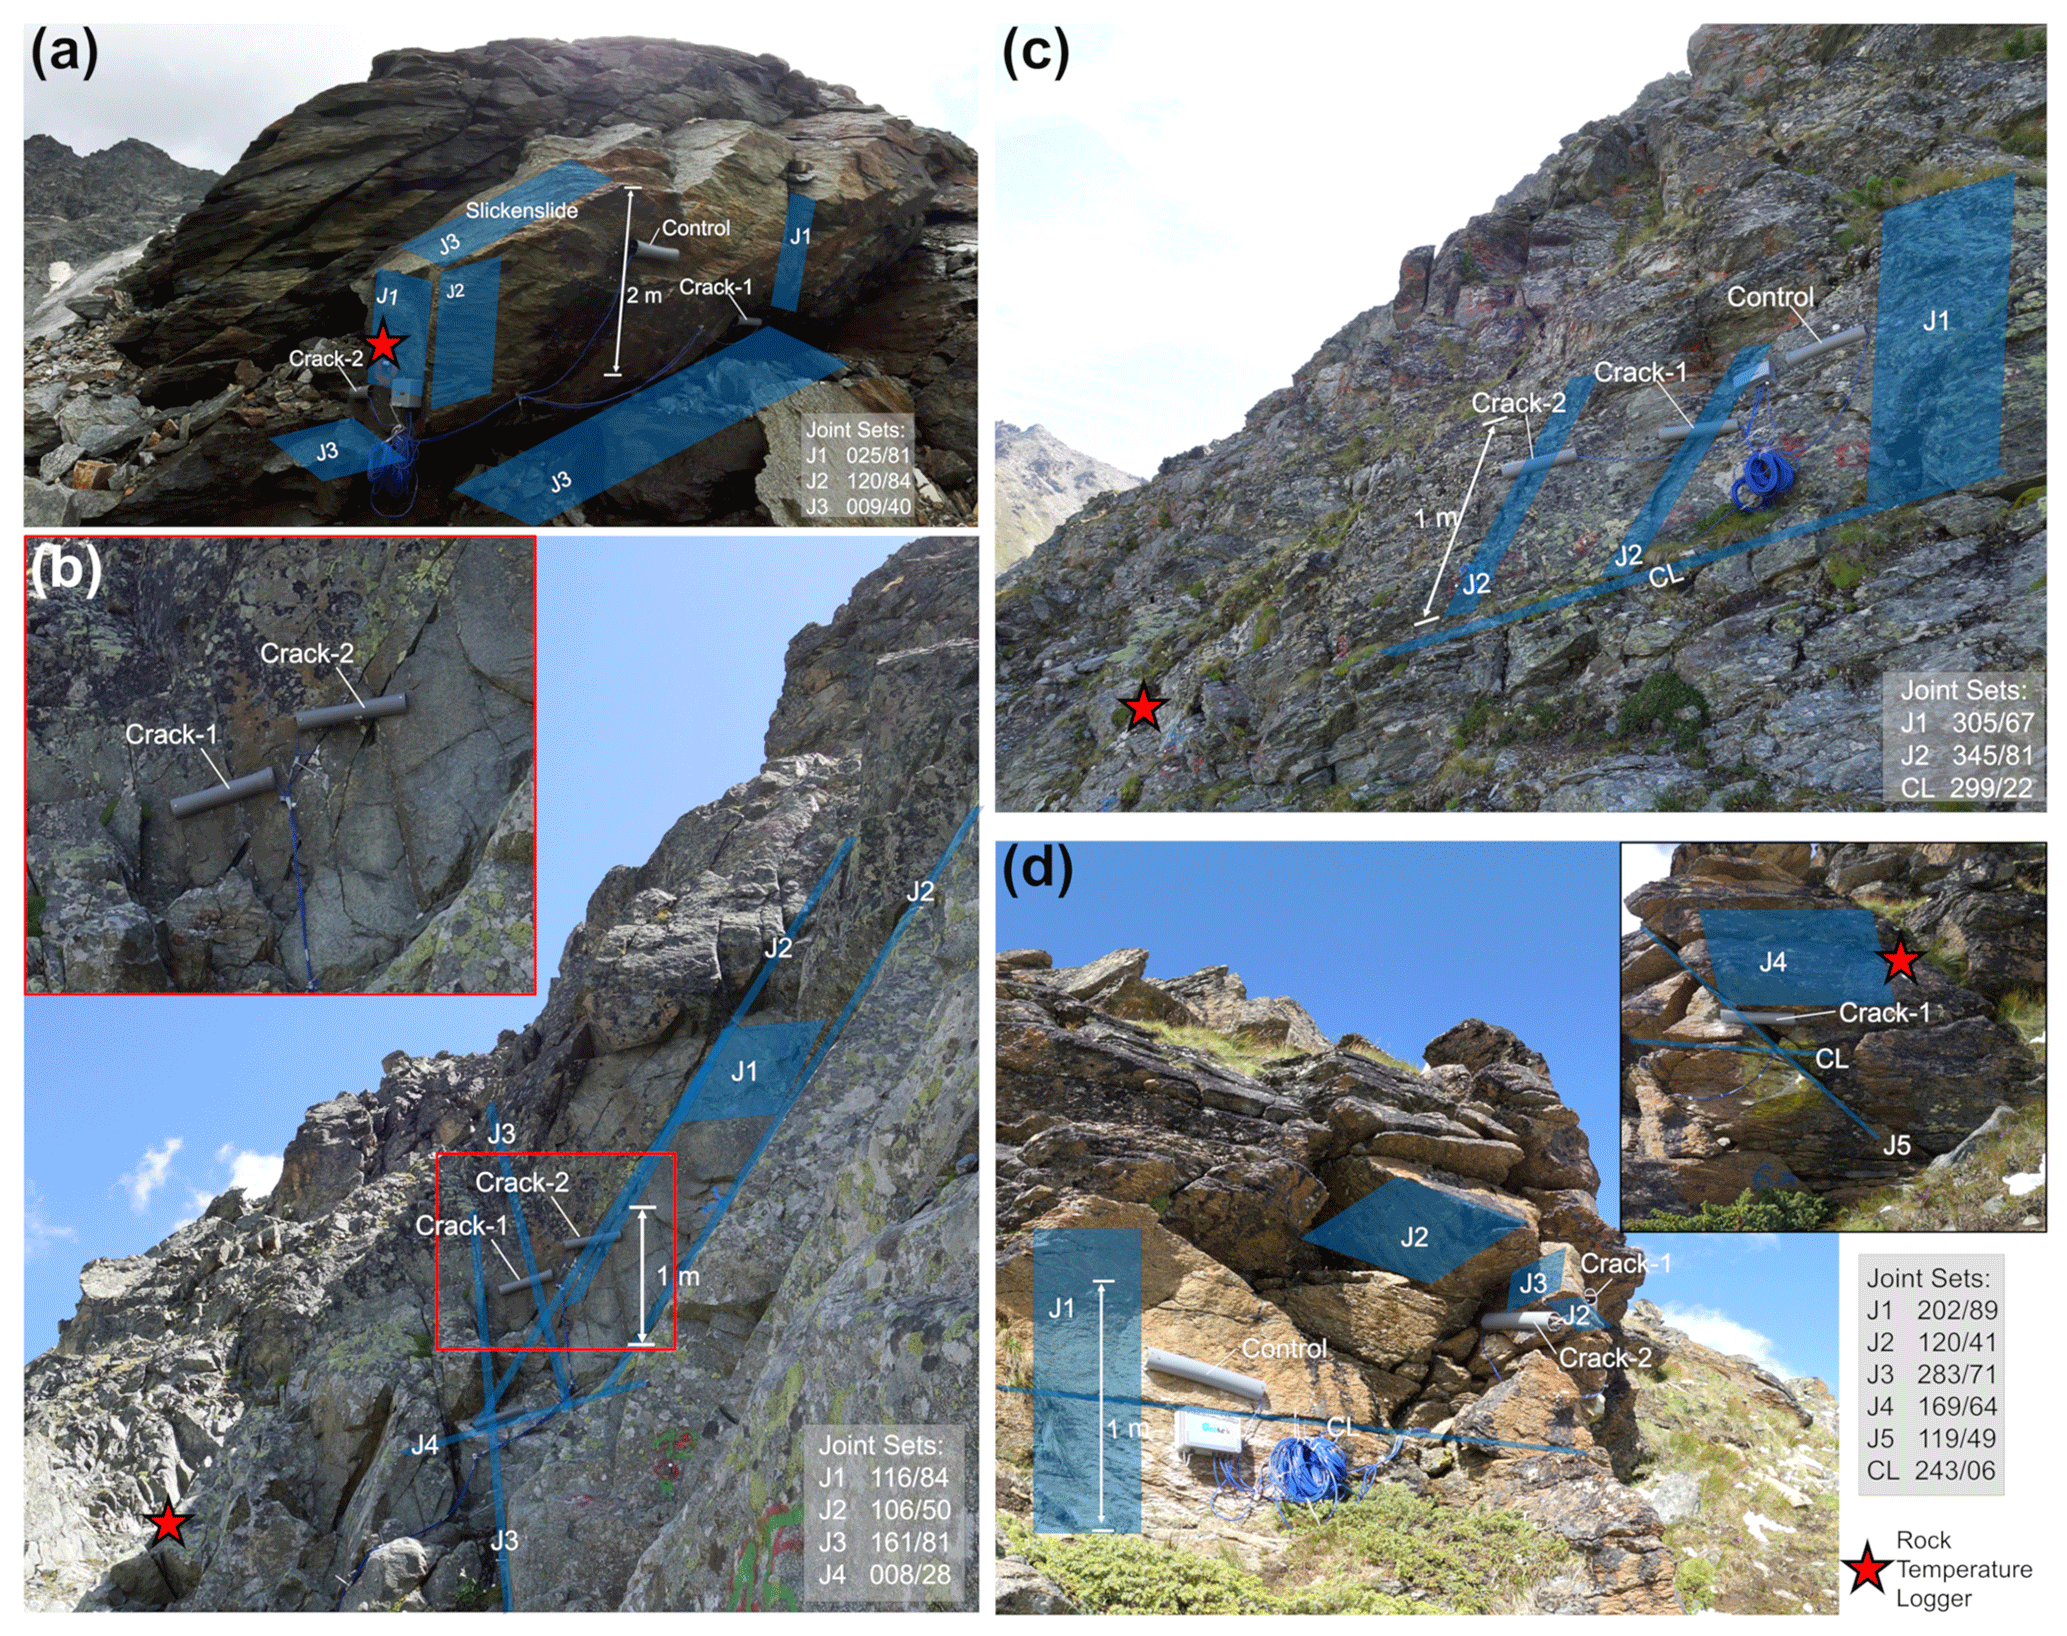
Figure 3(a) Three crackmeters were attached to two large (>2 m) aplite blocks at RW1 at 2935 m. (b) At RW2 at 2672 m, two crackmeters were installed on densely fractured amphibolite blocks. crackmeters monitor CD and RD of schistose quartz slate (c) at RW3 at 2585 and (d) at RWS at 2723 m.
Table 2Properties of instrumented fractures and observed snow duration at each crackmeter.

* Incomplete data set due to snow load damage.
Table 3Schmidt hammer rebound values R, aspect of installed iButtons and calculated snow duration at each rock surface temperature logger.

To identify the effects of different exposition, three more crackmeters were installed at a south-facing rockwall (RWS) in 2017 (Fig. 3d) at 2723 m. RWS is heavily fractured, which results in the occurrence of a high number of joint sets (Fig. 3d). The monitored blocks dip into the rockwall (H2) at an angle of 41∘, and the crack apertures range from 7.5 to 20 mm at Crack-2 to 45 to 135 mm at Crack-1 (Table 2).
All crackmeters were fixed by groutable anchors, and half tubes protected the devices from snow load (Draebing et al., 2017a, b). At each rockwall, two crackmeters spanned cracks to monitor crack deformation (CD) and crack-top temperature (CTT). To validate rock deformation (RD) observed in the laboratory, one crackmeter was used as a control crackmeter and was fixed on intact bedrock without any cracks (Fig. 3). Due to snow load damage or technical failures, crackmeters had a different life span and the control crackmeter at RW2 failed to record data completely. A four-channel Geokon data logger Lc2x4 recorded all data at each rockwall at 3 h intervals between 1 September 2016 and mid-August 2017 and at 1 h intervals from mid-August 2017 to 31 August 2019. Crackmeter data were temperature-corrected, residual uncertainty was quantified and the existence of snow cover was deviated using the daily standard deviation of CTT or RTT following the technique by Schmid et al. (2012). To analyse the overall fracture movement pattern (Bakun-Mazor et al., 2013), a monthly moving average of CD, RD, CTT and RTT was calculated. The thermal expansion coefficient of the control crackmeters was calculated based on Eq. (1).
3.3 Meteo station, rock surface temperature and thermal stress modelling
Air temperature and snow depth data were derived from the meteo station Oberer Stelligletscher (2910 m) located 2.5 km SE of the research area in the Matter Valley (MeteoSwiss, 2019a). Probably due to snow cover above 3.5 m, there is a data gap from mid-January to the end of February 2018. The temperature data gap was filled using air temperature adapted from near-by meteo station Grächen at 1605 m (MeteoSwiss, 2019b) by applying a linear correlation (r2=0.85). To monitor rock surface temperature (RST), I installed four Maxim iButton DS1922 L temperature loggers with a nominal accuracy of ±0.5 ∘C in 10 cm deep boreholes following the measurement method used in previous studies (e.g. Haberkorn et al., 2015; Draebing et al., 2017a). The loggers recorded RST at 3 h intervals between 1 September 2016 and 31 August 2019 (RW1-3) or between 1 September 2017 and 31 August 2019 (RWS). Due to the logger location at 10 cm depth, I determined snow cover duration using the uniform standard deviation threshold of <0.5 K for positive and negative RST in accordance with Haberkorn et al. (2015). I calculated daily rock temperature warming and cooling cycles ΔRT and applied the equation from Anderson and Anderson (2012) to model thermal stress σth:
4.1 Meteorological conditions and rock surface temperatures
At the meteo station at 2910 m, mean annual air temperature (MAAT) ranged from −0.6 ∘C in 2016/17 to −1.0 ∘C in 2017/18 and −1.1 ∘C in 2018/19. Daily air temperatures fluctuated between −20 and 12 ∘C (Fig. 4a). After a short period of snow cover with snow depths of up to 75 cm between November and December 2016, a second period of snow cover with snow depths of up to 150 cm started in mid-January 2017 and lasted until mid-July 2017. Snow onset in the following year was delayed and started at the end of December 2017. Snow depths reached more than 350 cm and lasted until mid-August 2018. After approximately 2 months without snow, the snow cover period started at the end of October 2018 and lasted until the end of July 2019 with snow depths of up to 250 cm. Cooling periods lasted from mid-August to mid-January 2017, April 2018 or mid-February 2019, and the mean monthly air temperature dropped to −12 ∘C. The warming period lasted 4.5 to 7 months and reached a mean monthly air temperature of 6 ∘C in mid-August.
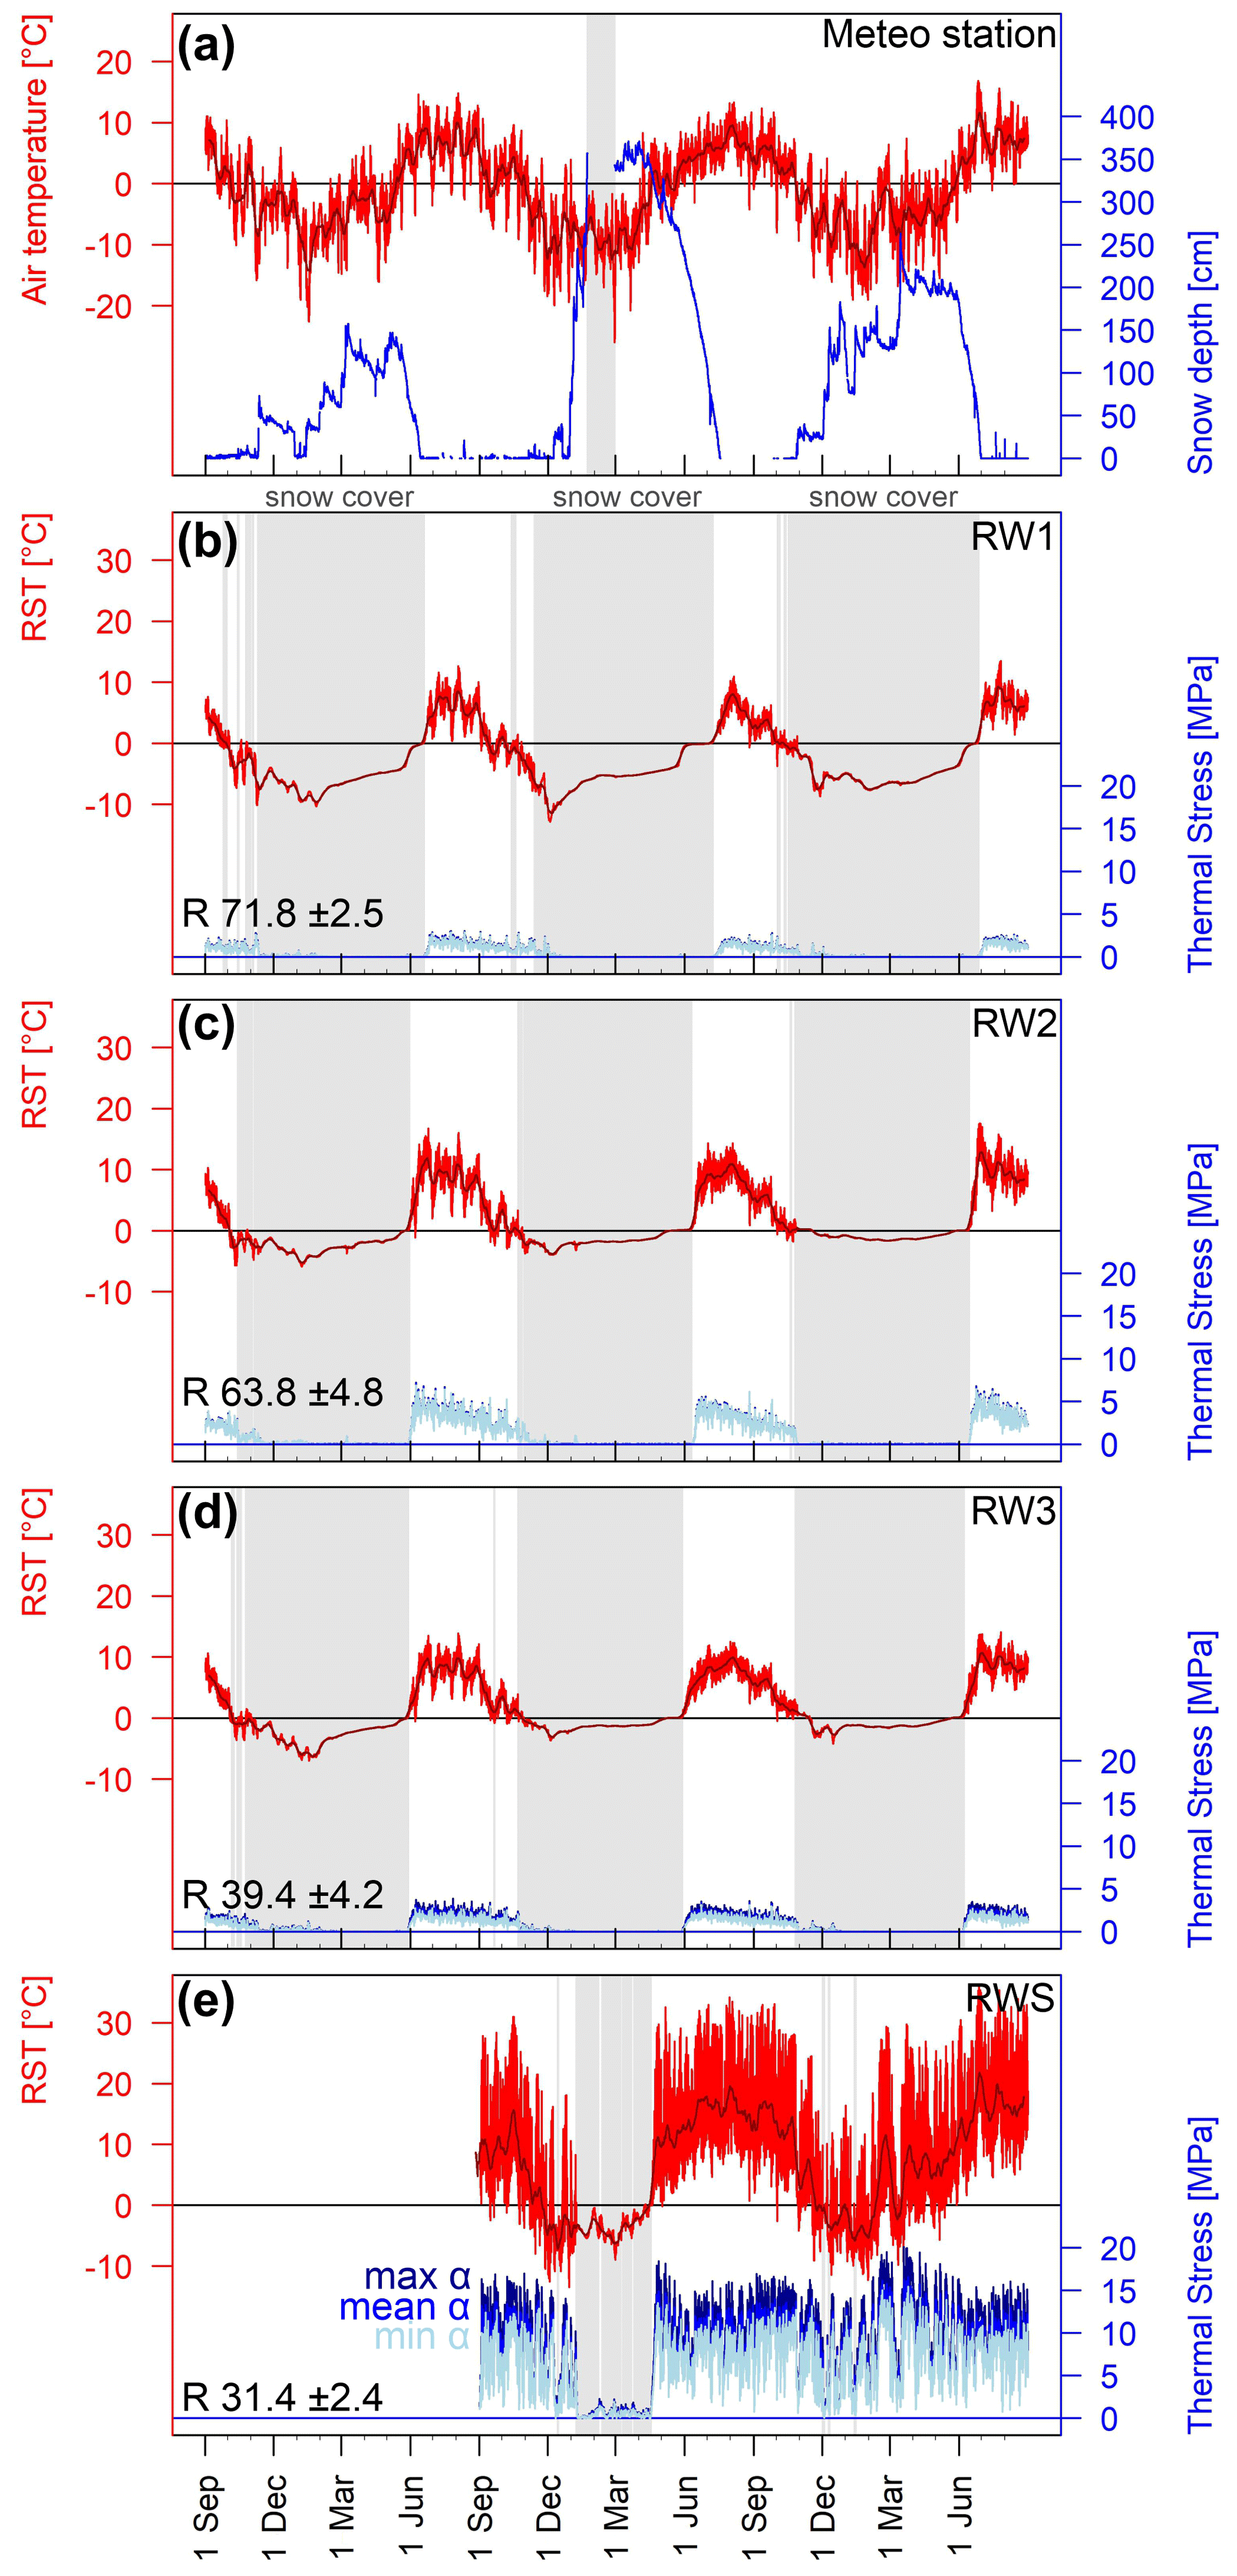
Figure 4(a) Air temperature and snow depth from meteo station Oberer Stelligletscher plotted for the period from September 2016 to August 2019. Rock surface temperatures (red lines) and mean 10 d RST (dark red line) recorded by iButtons installed at (b) RW1, (c) RW2, (d) RW3 and (e) RWS. Thermal stress was modelled using minimum α (light blue lines), mean α (blue lines) and maximum α (dark blue lines). Grey rectangles highlight the data gap filled with modelled air temperatures in (a) and snow cover (b–e). Numbers represent measured Schmidt hammer rebound values R.
Rock surface temperatures (RSTs) followed the annual and daily oscillation of air temperatures. At an annual scale, RSTs of north-exposed rockwalls ranged from −12.9 up to 13.4 ∘C for RW1, −5.6 up to 17.6 ∘C for RW2 and −7.0 up to 13.9 ∘C for RW3 (Fig. 4b–d). In contrast, the south-exposed logger at RWS recorded higher RST variations of between −12 and 32 ∘C (Fig. 4e). At a daily scale, the north-facing loggers measured small daily temperature variations of up to 4 ∘C, whereas the south-exposed logger recorded variations up to 16.5 ∘C. Snow cover attenuated daily temperature oscillations with expected high deviation between north- and south-exposed rockwalls. At north-facing rockwalls, snow cover onset was between October and November and lasted between 220 and 251 d with only minor differences between RW1 to RW3 and individual years (Fig. 4b–d, Table 3). In contrast, snow onset was delayed to mid-February 2018 or snow cover was only sporadic in 2019 at RWS; therefore, snow cover duration was reduced to 5 to 81 d (Fig. 4e).
4.2 Laboratory and field rock deformation and resulting stresses
Directly after the start of cooling, several crackmeters revealed a rock expansion, which lasted for a few minutes (initial transition phase; Figs. 5a and S1 in the Supplement). Rock samples were cooled down to an RTT of between −13.2 and −18.4 ∘C, and all crackmeters experienced a negative RD (Figs. 5a and b, S1 and S2 in the Supplement). Rock temperature in 2 to 5 cm depth was up to 5 to 7 ∘C higher than RTT during the cooling phase (Figs. 5, S1 and S2). Based on RT5 cm measurements using Eq. (1), thermal coefficients ranged from for AM (r2=1) to (r2=0.99) for AP and (r2=1) for QS during cooling. Several crackmeters at all rock samples (AP RD2, AM RD2, QS RD1 and RD2) experienced a sudden rock deformation 9 to 23 min after stopping cooling which ranged from +0.004 to +0.0135 mm (transition phase; Figs. 5b and S2). Despite an increase in RTT from −7.3 to −5 ∘C, the QS sample and AP RD1 and AM RD1 showed a further rock contraction of between −0.0016 and −0.0032 mm. The closing behaviour corresponded to the decrease in RT5 cm from −8.2 to −9.3 ∘C (Fig. 5b). Subsequent warming of up to 7.7 or 8 ∘C RTT resulted in rock expansion (warming phase, Figs. 5a and b, S1 and S2). This warming phase induced a thermal expansion that corresponds to a thermal expansion coefficient of (r2=1) for AP, (r2=1) for AM and (r2=0.99) for QS. All samples showed a hysteresis effect during warming and cooling cycles (Figs. 5b and S2), which was amplified using RTT and decreased with further rock temperature depth from RT2 cm to RT5 cm.
Control crackmeters were installed in the field to validate laboratory-observed rock deformation. RTT fluctuated between −15 and 10 ∘C at RW1 in 2017/18, between −20 and 25 ∘C at RW3 from 2016 to 2019 and from −15 to 25 ∘C at RWS from 2017 to 2019 (Figs. 5c and S3 in the Supplement). All control crackmeters showed small daily fluctuations of rock deformation that were even reduced when snow cover occurred. Similar to laboratory experiments, control crackmeters recorded cyclic rock expansion during warming and contrary rock contraction during cooling periods (Figs. 5d and S3). The thermal expansion coefficients for cooling and warming based on monthly mean RD and RTT were for RW1 (r2=0.43), for RW3 (r2=0.94) and for RWS (r2=0.9). All control crackmeters showed a hysteresis effect, which was amplified at RW1.
Applying laboratory-derived thermal expansion coefficients (Table 1) for warming and cooling to Eq. (2) provides the daily thermal stresses within a rockwall. Daily thermal stresses reflected RST and were increased during snow-free periods in summer and decreased or absent during snow cover periods. Maximum stresses reached up to 2.9–3.0 MPa at RW1, 6.8–7.2 MPa at RW2, 3.1–3.9 MPa at RW3 and 15.4–20.1 MPa at RWS (Fig. 4b–e).
4.3 Rockwall fracture kinematics
Crackmeters showed a decrease in snow duration with decreasing elevation. Crackmeters at RW1 located at 2935 m experienced 192 to 223 d of snow cover per year (Fig. 6). The number of snow-covered days was reduced to 69 and 73 d in 2016/17 at RW2 at 2672 m. Snow load damaged the equipment in the following years, which resulted in a data gap and incomplete measurement of snow cover duration. RW3 at 2585 m showed between 0 and 9 d of snow cover, and snow cover was limited to 2 d at Crack-2 in 2017/18 at the south-facing rockwall RWS.
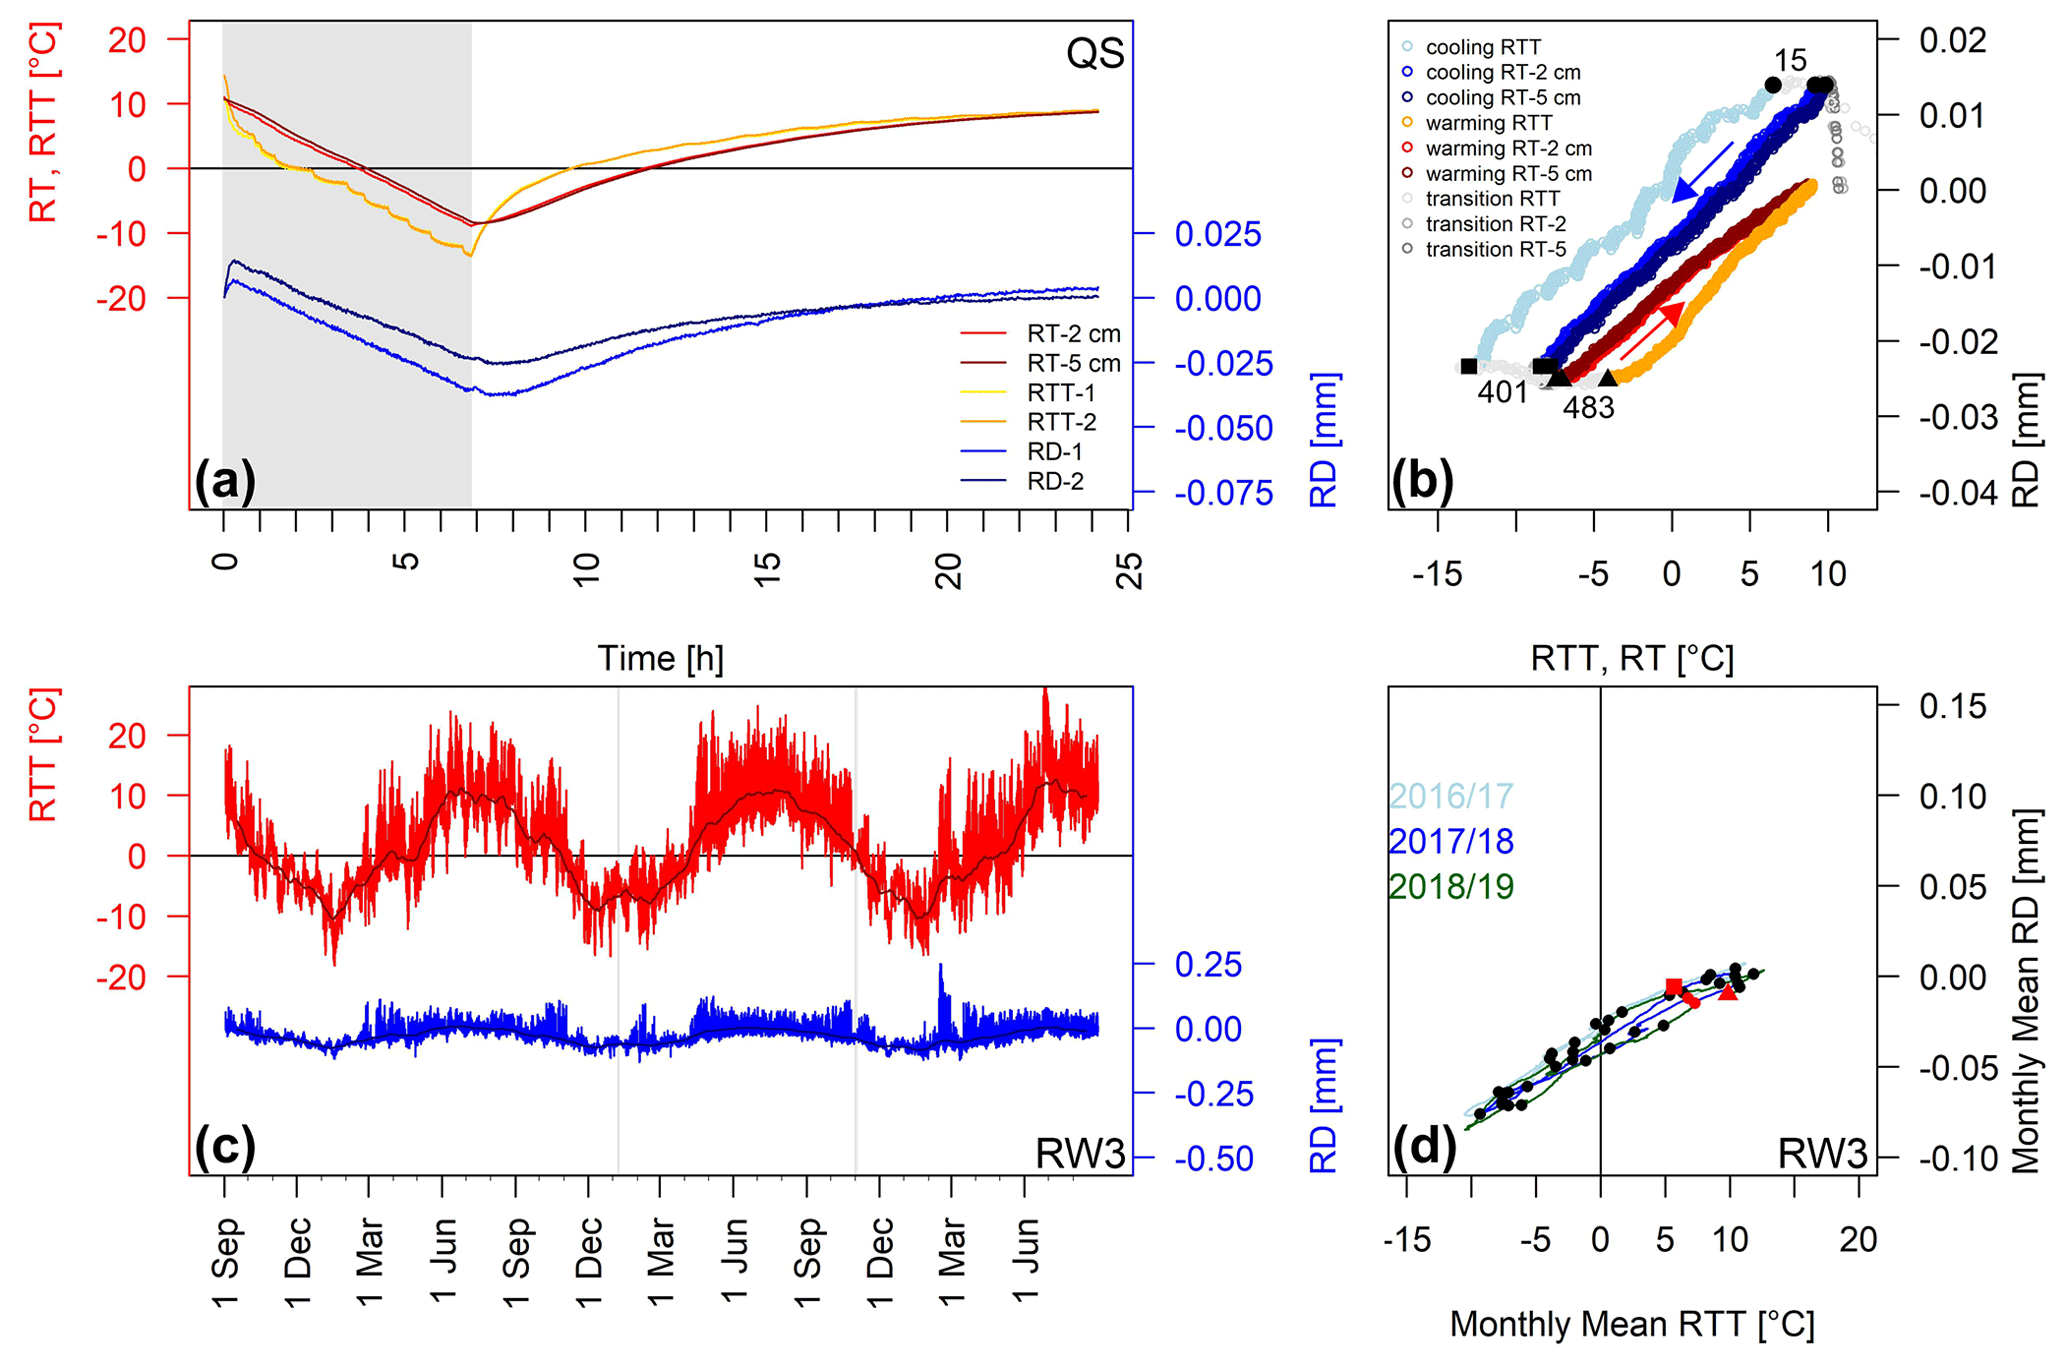
Figure 5Laboratory crackmeter measurements of rock samples. (a) Rock-top temperature (RTT), rock temperature (RT) and rock deformation (RD) of crackmeters 1 and 2 plotted versus time for the schistose quartz slate sample (QS). (b) Rock deformation plotted versus rock-top temperature or rock temperature for crackmeter 2 of QS. Numbers indicate the timing of the beginning of the cooling period (black dot), end of the cooling period (black rectangle) and beginning of the warming period (black triangle). Arrows highlight the temporal trajectory of cooling (blue) and warming (red). Results of all laboratory measurements are shown in Figs. S1 and S2. Field measurements of the control crackmeter at RW3. (c) RTT (red line) and monthly mean RTT (dark red line), RD (blue line) and monthly mean RD (dark blue line) plotted versus time for the period from 1 September 2016 to 31 August 2019. Grey rectangles highlight the occurrence of snow cover. (d) Monthly mean rock deformation plotted versus monthly mean RTT. Red rectangles indicate the start, black dots the first day of a month, red dots the beginning of the new measurement period and red triangles the end of measurements. Colours of graphs indicate data from 2016/17 (light blue), 2017/18 (blue) and 2018/19 (green). For results of RW1 and RWS, see Fig. S3.
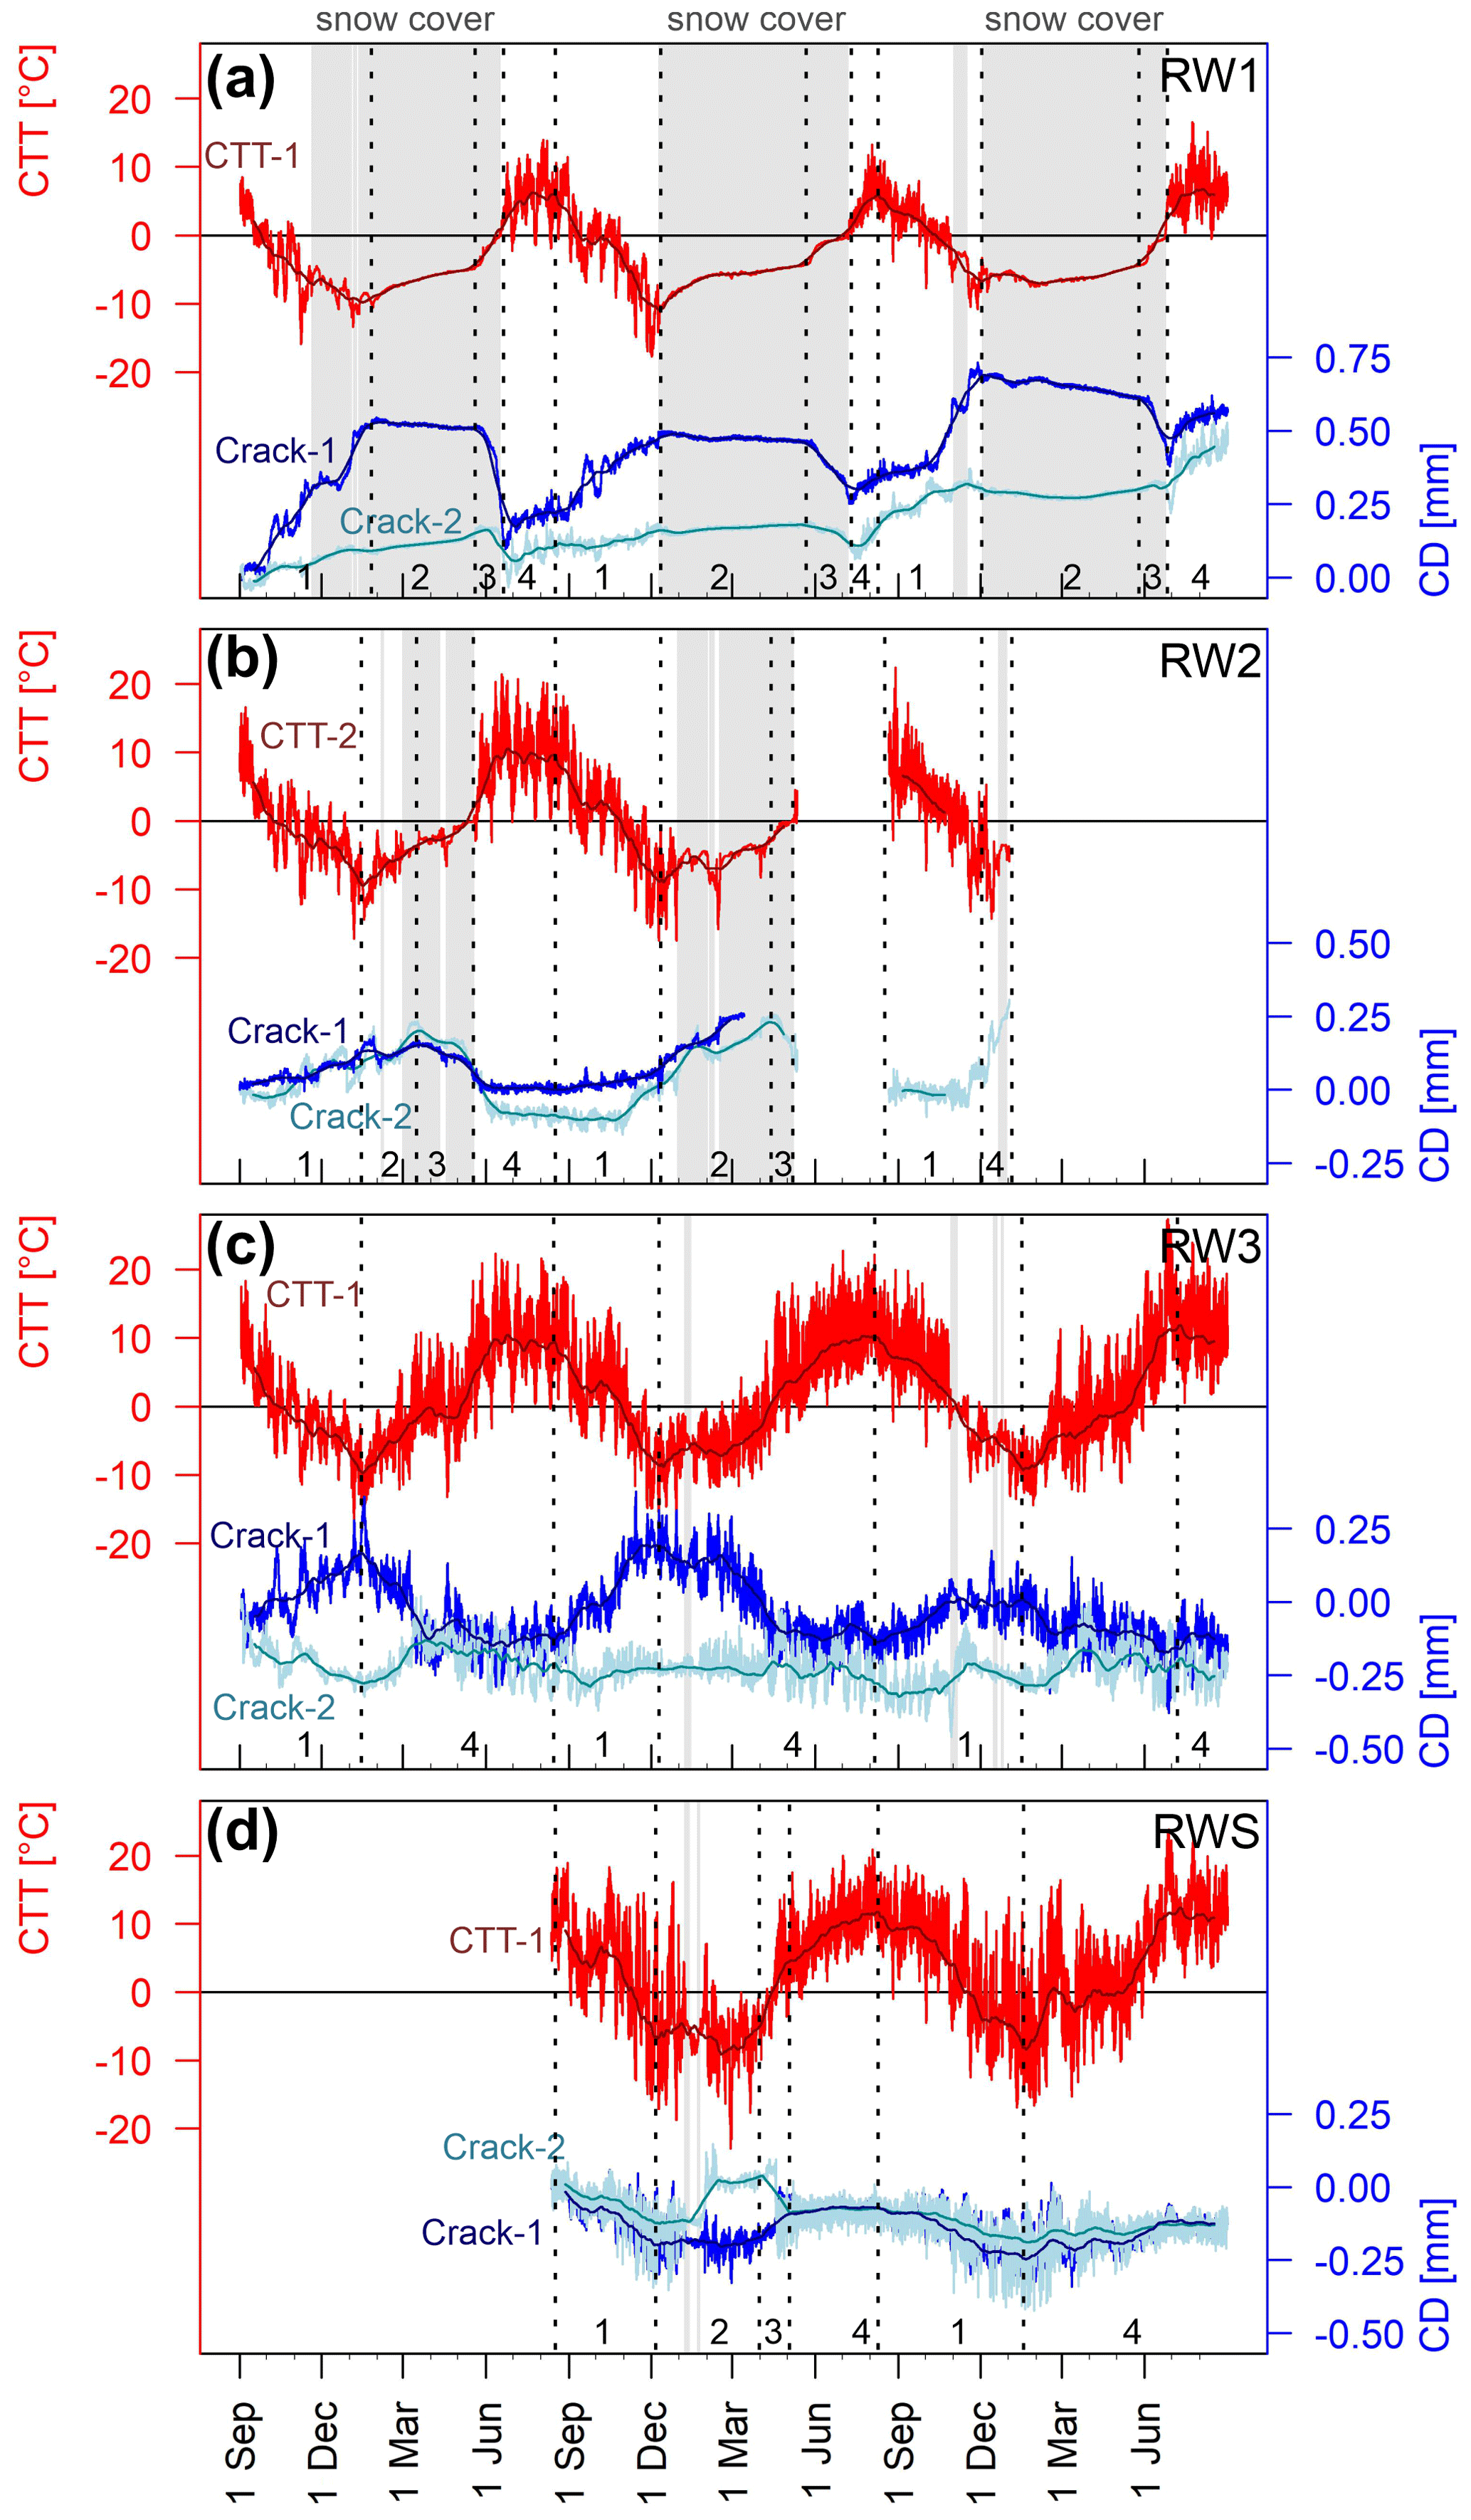
Figure 6Crack-top temperature, monthly mean crack-top temperature, crack deformation and monthly mean crack deformation for the crackmeters at (a) RW1, (b) RW2, (c) RW3 and (d) RWS for the period 1 September 2016 to 31 August 2019. Grey rectangles highlight the snow cover period, while numbers indicate the interpreted phases (see Table 4).
Table 4Quantified rock fracture kinematic phases, annual and overall crack deformation in millimetres. Crack deformation (CD) is differentiated into crack closing (−), crack opening (+) and no CD (±).
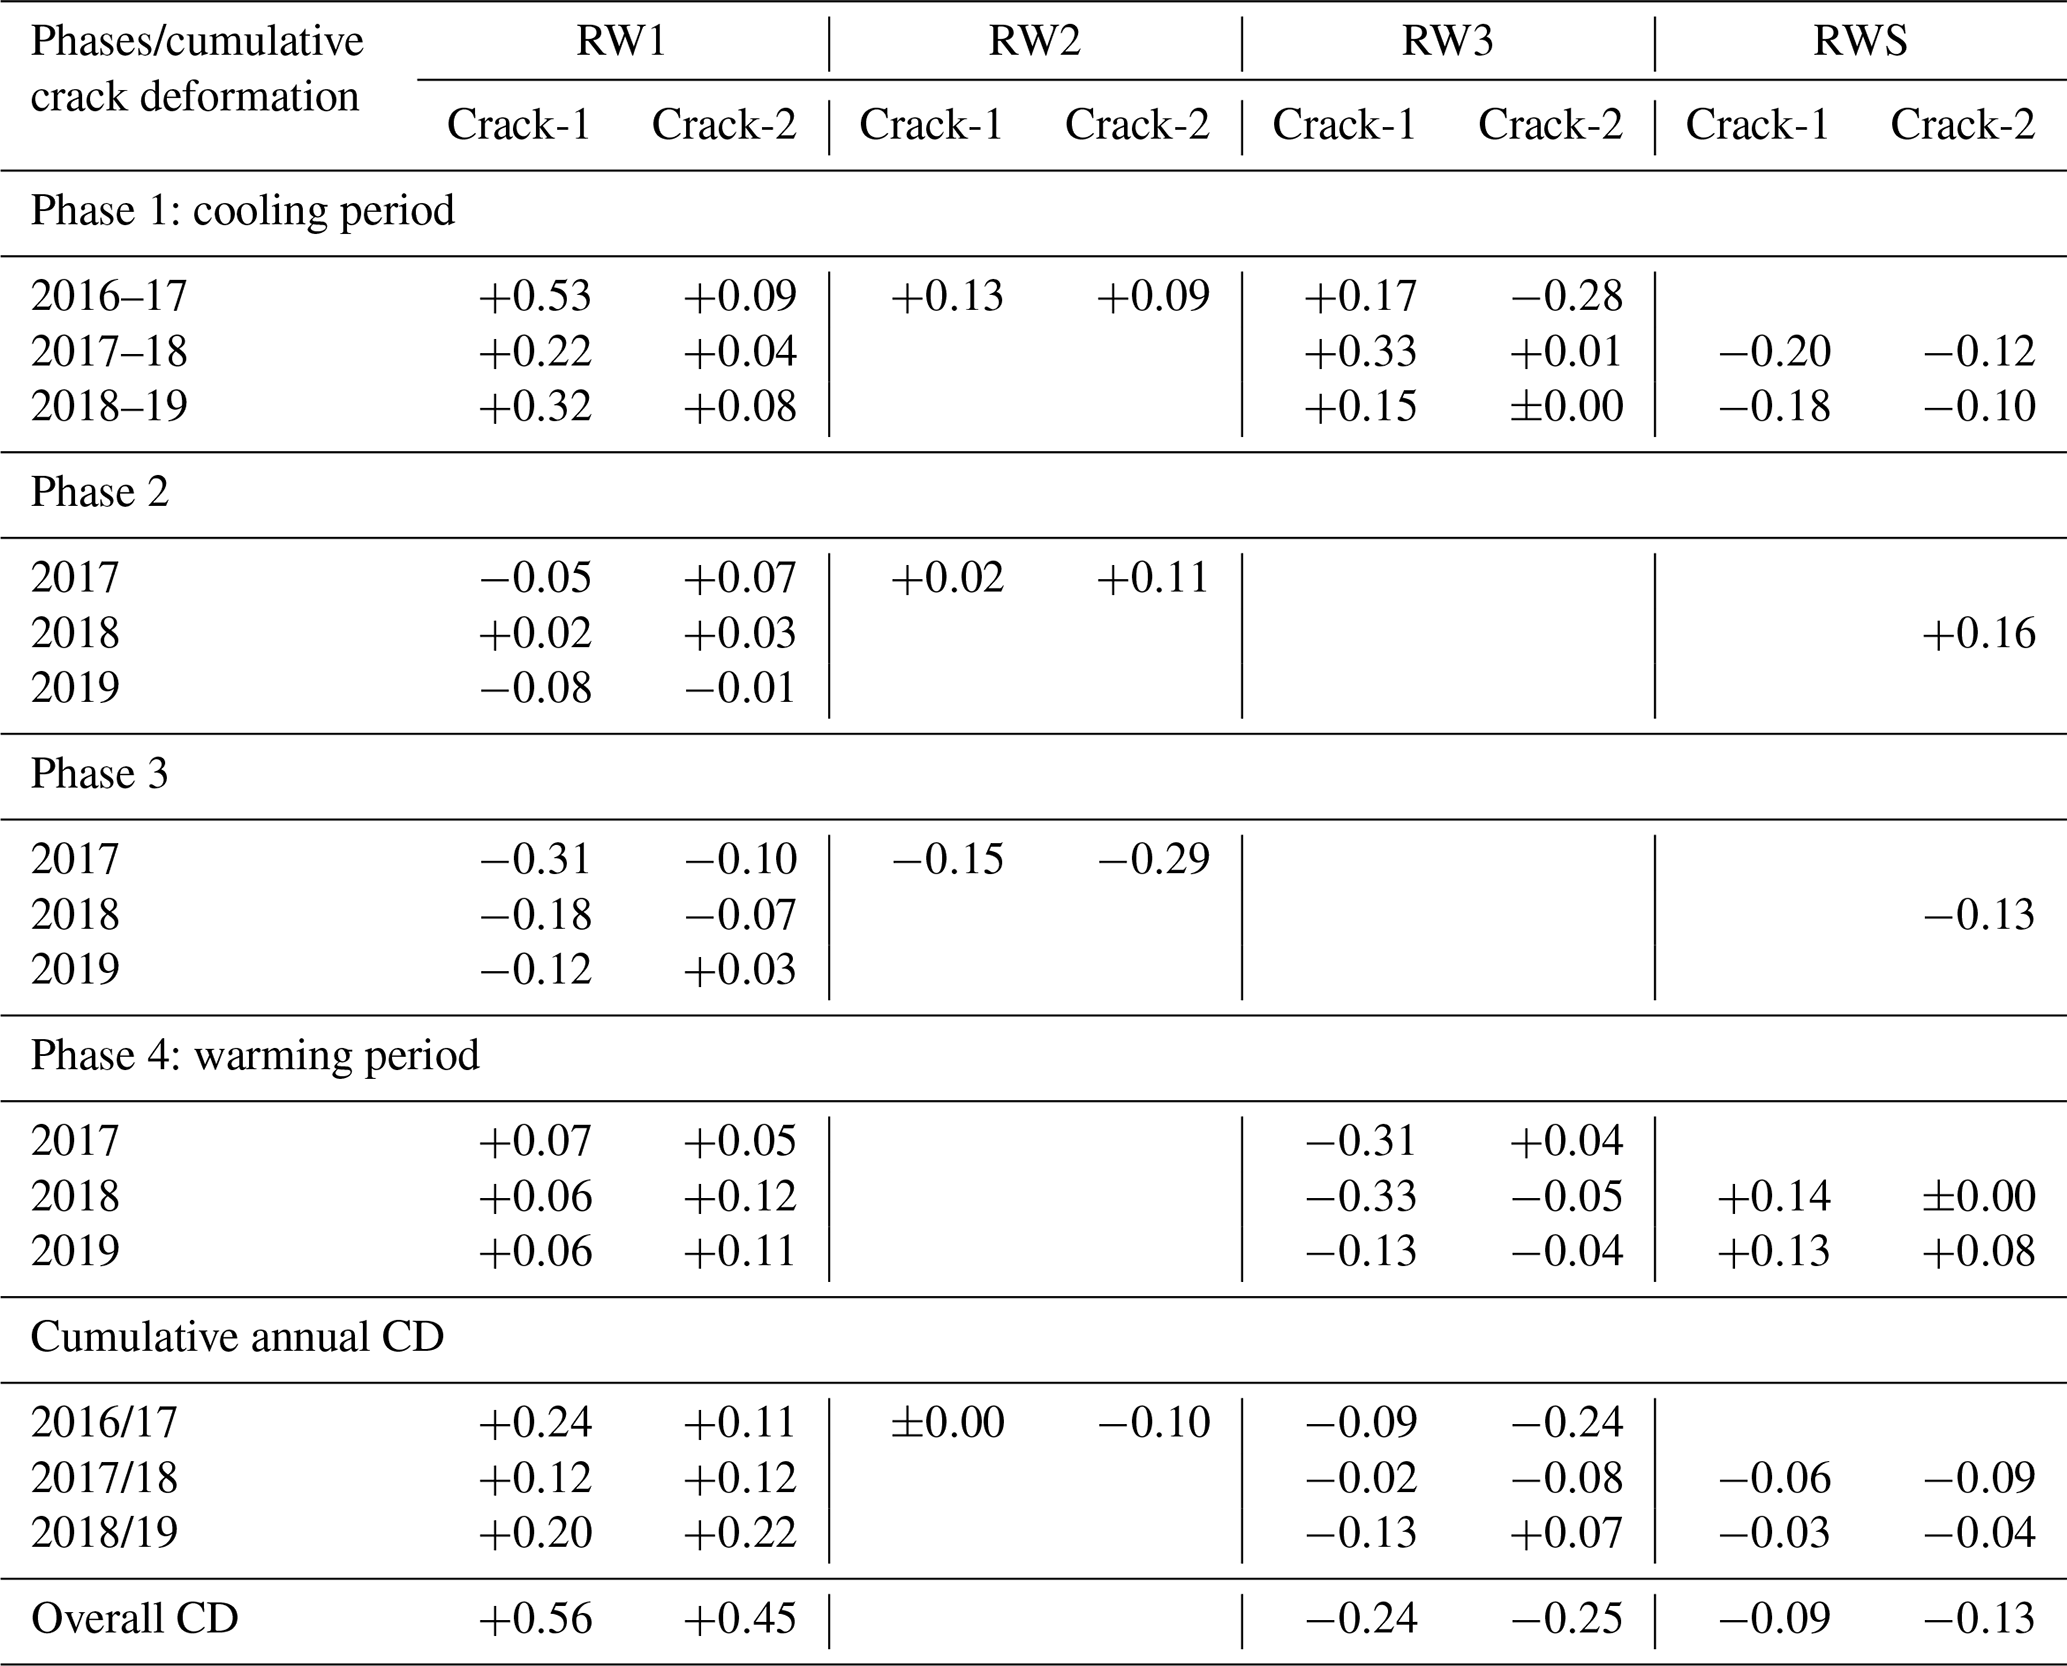
All crackmeters experienced a cooling period (Phase 1 in Fig. 6) that ranged from September until mid-December to mid-February. At RW1, the onset of snow cover controlled the end of the cooling period; only in 2016/17 did cooling continue under snow cover. The cooling period was characterized by a crack opening (Table 4), which was between 0.22 and 0.53 mm at Crack-1 and between 0.04 and 0.09 mm at Crack-2 at RW1. At RW2, cracks opened between 0.09 mm at Crack-2 and 0.13 mm at Crack-1, while Crack-1 at RW3 revealed a crack opening of between 0.15 and 0.33 mm. In contrast, Crack-2 at RW3 experienced a diverse crack deformation ranging from a crack closing of between 0.28 to 0.01 mm crack opening. At RWS, the cooling period was characterized by a crack closing of between 0.18 and 0.20 mm at Crack-1 and between 0.1 and 0.12 mm at Crack-2.
At RW1 and RW2, crackmeters experienced a slow warming below snow cover (Phase 2 in Fig. 6), which resulted in either crack opening or crack closing (Table 4). Crackmeters at RW1 experienced a crack deformation ranging from a closing of 0.08 mm to a crack opening of 0.07 mm. At RW2, cracks experienced a crack opening of between 0.02 and 0.11 mm. At RWS, snow cover was absent during warming; however, Crack-2 experienced an opening of 0.16 mm, which was reversed by 0.13 mm during enhanced warming in 2017. RW1 and RW2 showed a period of predominantly crack closing during enhanced warming until snow cover completely melted (Phase 3 in Fig. 6). Crack-1 at RW1 experienced between 0.12 to 0.31 mm crack closing, while Crack-2 showed a diverse crack deformation ranging between 0.03 mm opening and 0.10 mm closing. At RW2, the crackmeters revealed a crack closing of between 0.15 and 0.29 mm.
All crackmeters experienced a warming period (Phase 4 in Fig. 6), which is characterized by both crack closing and crack opening (Table 4). At RW1, crackmeters revealed a crack opening of between 0.05 and 0.12 mm. In contrast, RW3 showed a crack closing of between 0.13 and 0.33 mm at Crack-1 and a crack deformation behaviour ranging from 0.07 crack opening to 0.24 mm crack closing at Crack-2. At RWS, the warming period is associated with a crack opening of between 0.00 and 0.14 mm. In the 3-year period, RW1 experienced a crack opening of between 0.45 and 0.51 mm. In contrast, RW3 showed an overall crack closing of between 0.24 and 0.25 mm. Data at RW2 were limited to 2016/17 and cracks experienced no change or 0.1 mm closing. RWS was characterized by crack closing in each year with a cumulative closing of between 0.03 and 0.09 mm.
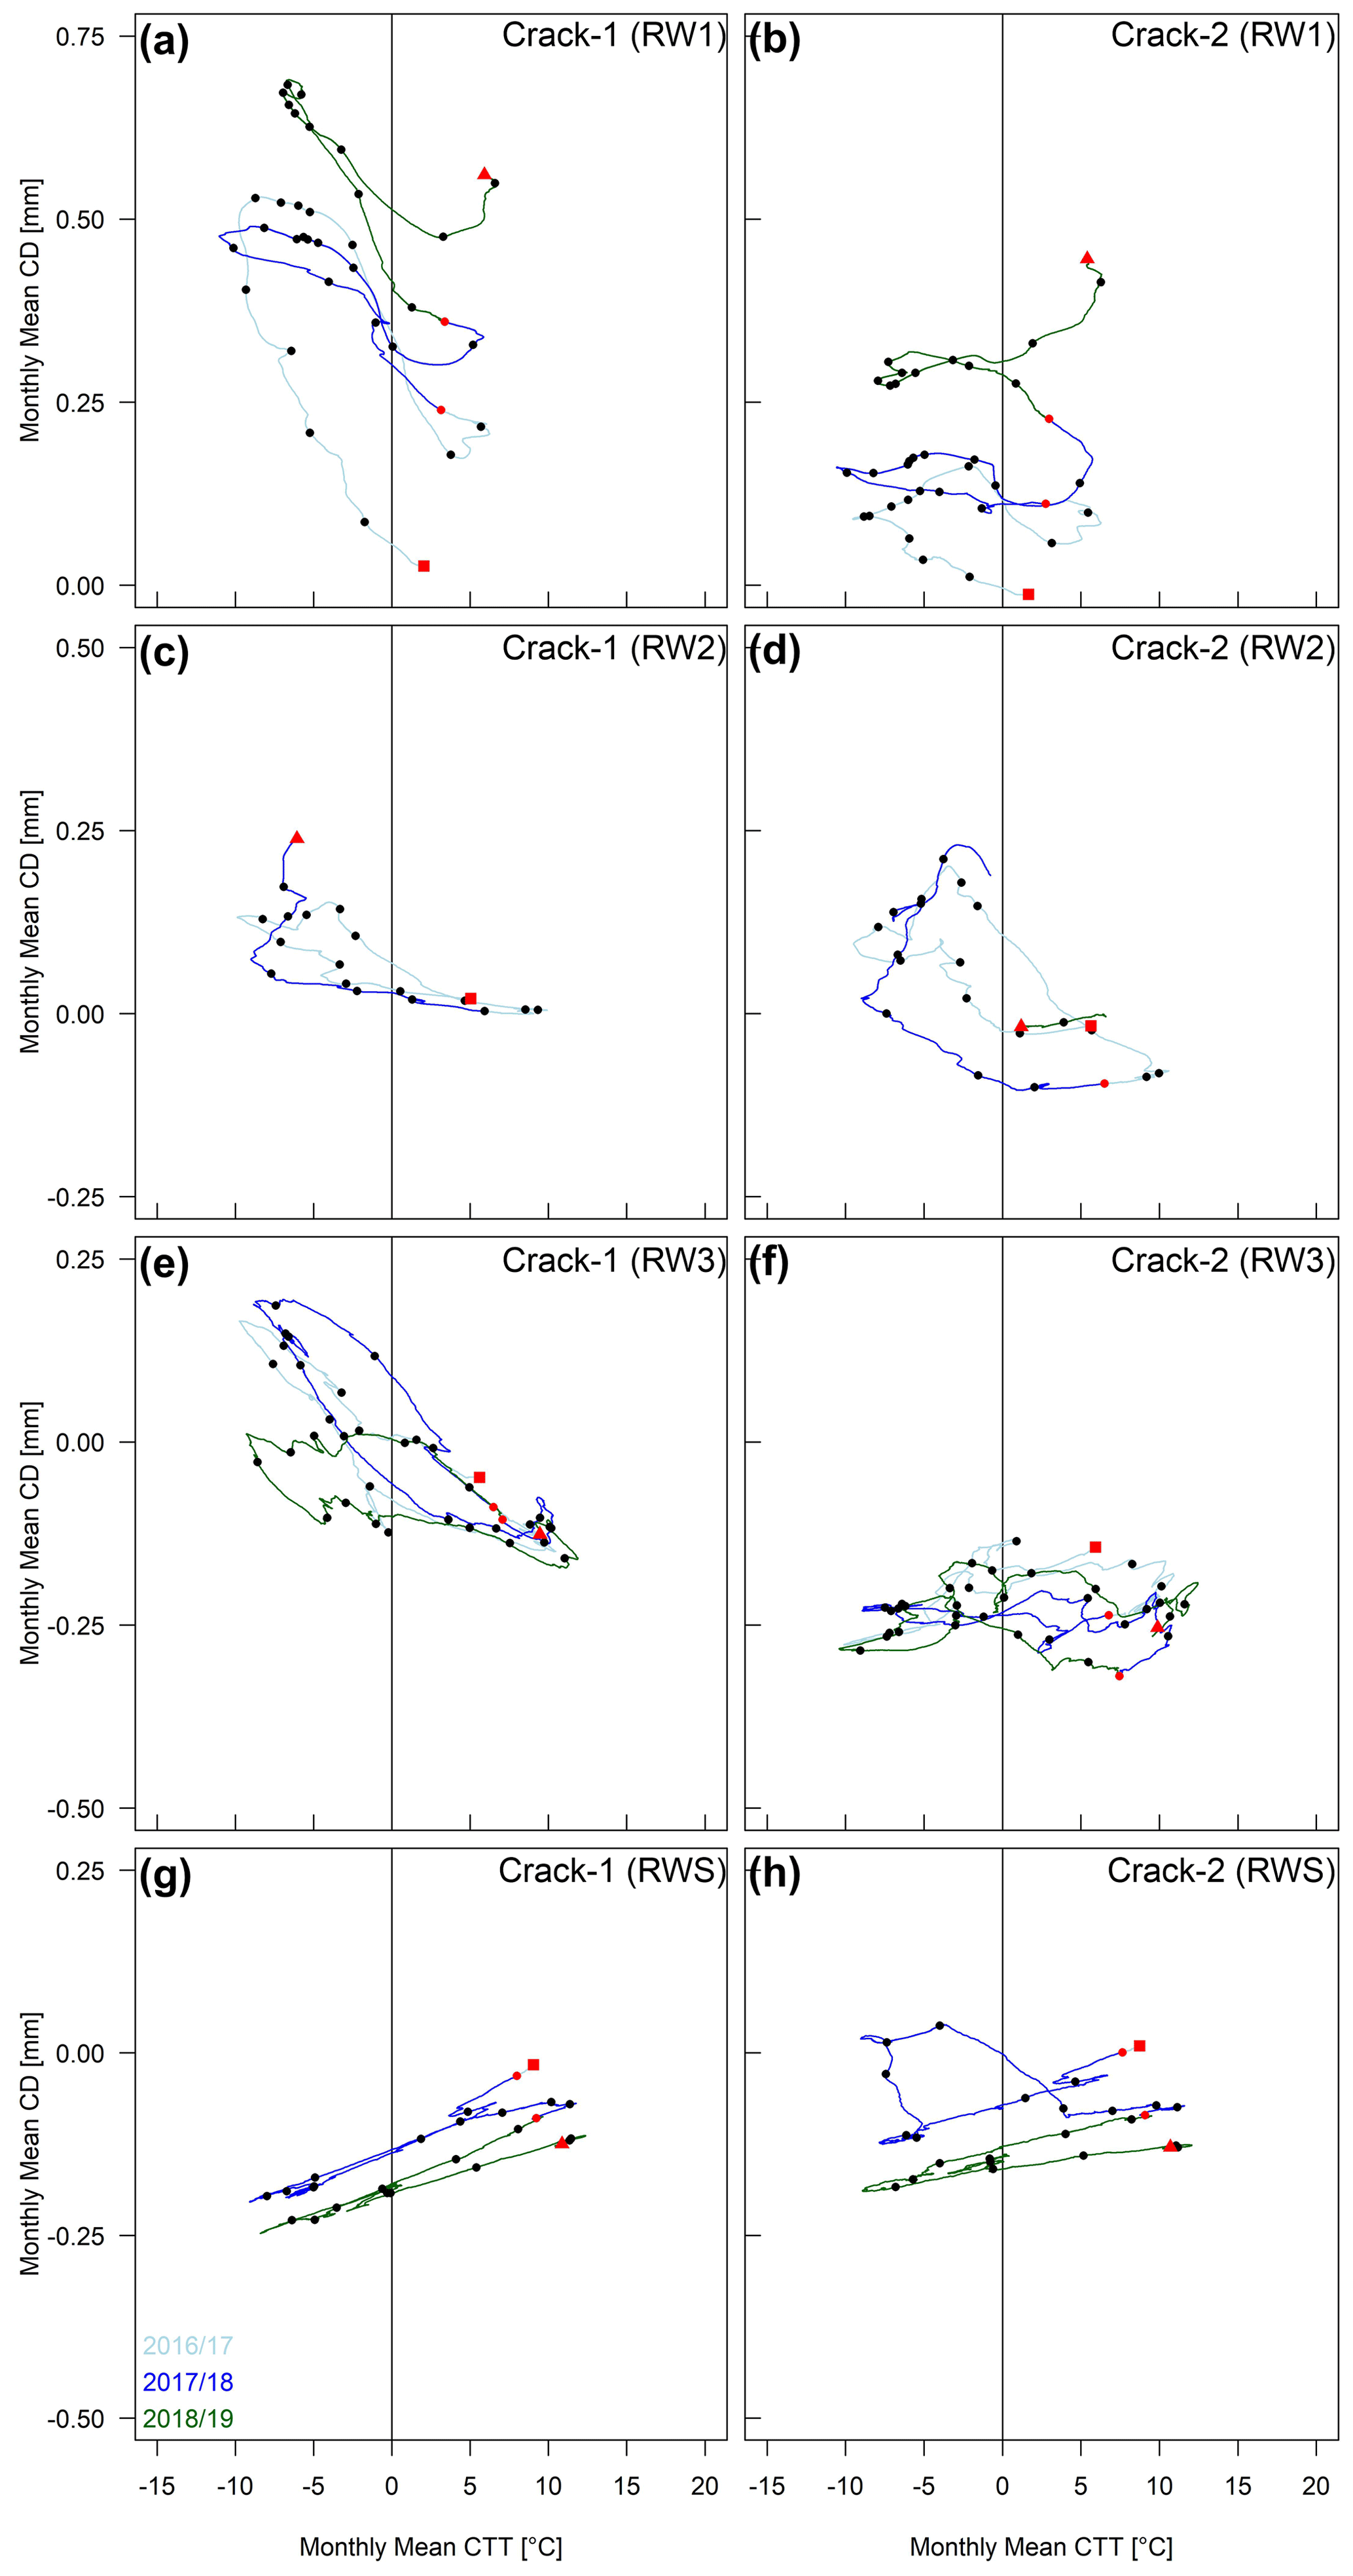
Figure 7Monthly mean crack deformation plotted versus monthly mean crack-top temperature for individual crackmeters. Red rectangles indicate the start, black dots the first day of a month, red dots the beginning of the new measurement period and red triangles the end of measurements. Colours of graphs indicate data from 2016/17 (light blue), 2017/18 (blue) and 2018/19 (green).
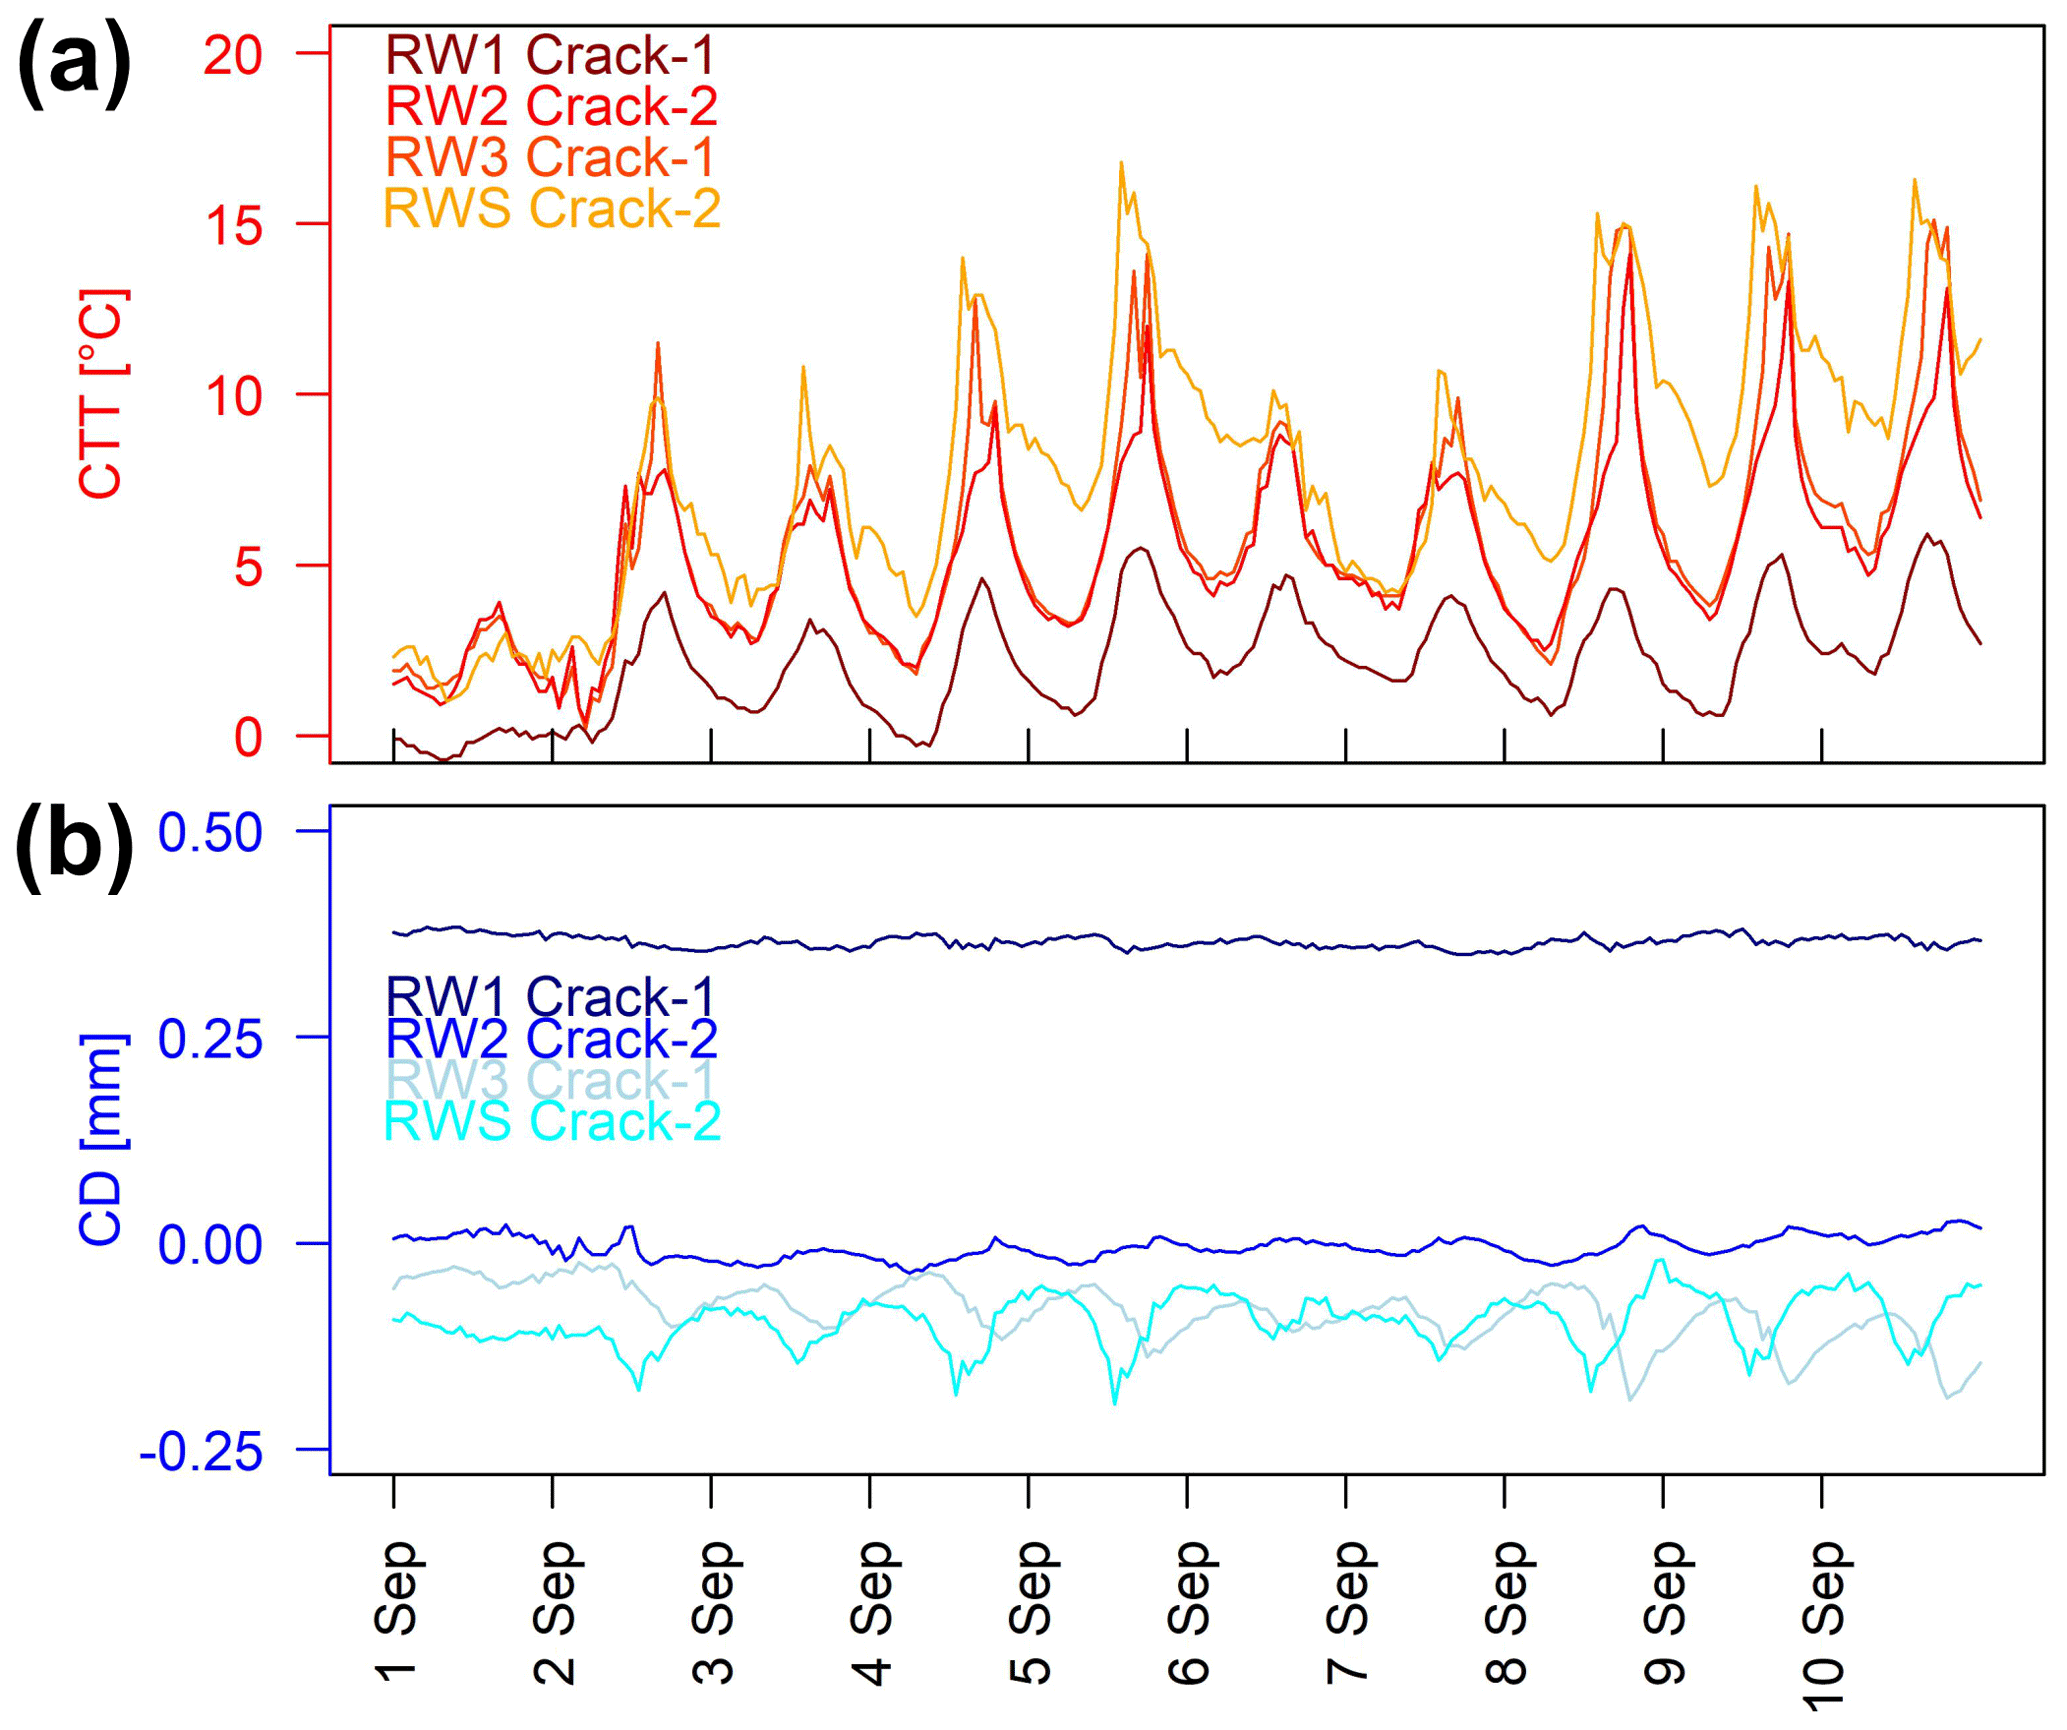
Figure 8(a) Crack-top temperature and (b) crack deformation for selected crackmeters of RW1, RW2, RW3 and RWS between 1 September 2018 and 10 September 2018.
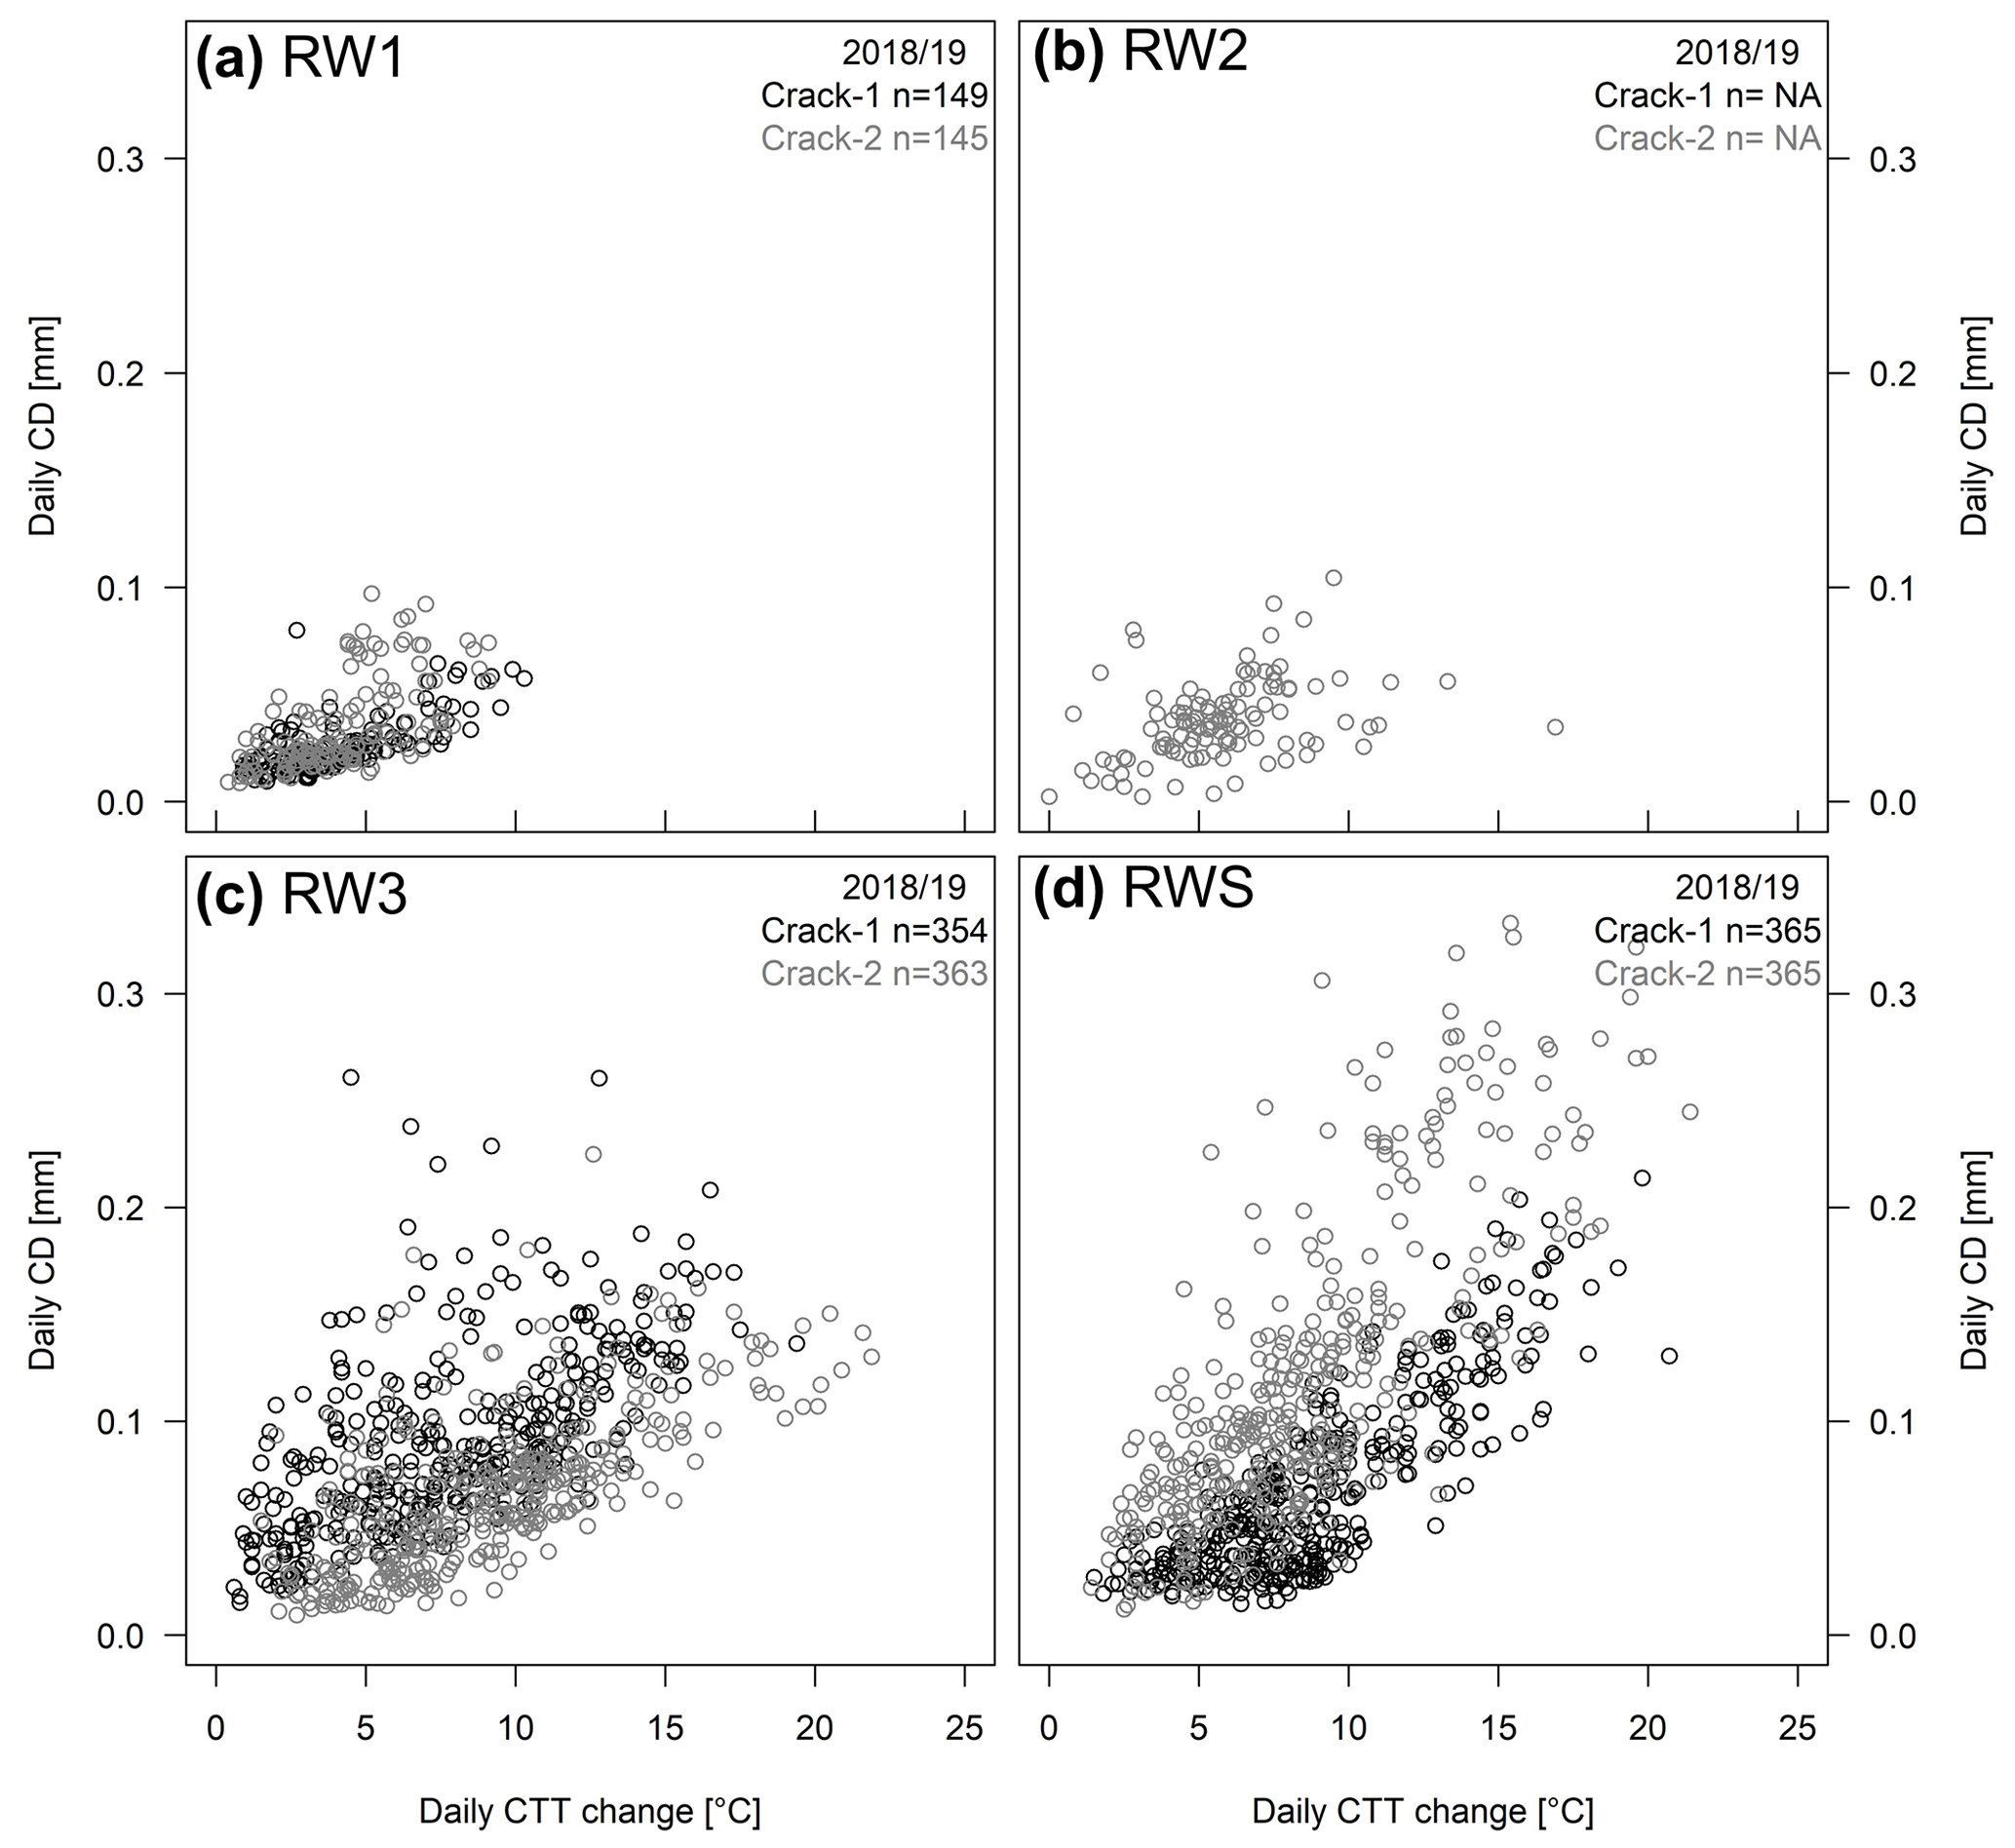
Figure 9Daily crack deformation plotted versus daily crack-top temperature for (a) RW1, (b) RW2, (c) RW3 and (d) RWS in 2018/19. Numbers n indicate the number of daily cycles; NA highlights incomplete measurements during the period due to instrument failure. For the results of all periods, see Fig. S5 in the Supplement.
On a daily scale, cooling resulted in crack opening due to the contraction of two rock blocks and warming in crack closing due to the expansion of two rocks (Fig. 8). The peak of opening and closing between individual crackmeters can be different. Crackmeters at RW1 experienced daily CTT fluctuations in the range below 10 ∘C and daily CD below 0.1 mm (Fig. 9) during snow-free periods. The fluctuations were increased up to 16 ∘C and 0.11 mm at RW2, 23 ∘C and 0.26 mm at RW3, and 21 ∘C and 0.32 mm at RWS.
5.1 Cyclic thermal rock deformation
Cyclic thermal stresses can result in thermal fatigue that break down rock and are an important component of mechanical weathering (Fig. 10a). In my laboratory tests, I can differentiate thermal cycles into three phases: (1) cooling phase, (2) transition phase and (3) warming phase. The cooling phase (1) was characterized by rock contraction with thermal coefficients α (Table 1), which are in the order of previous thermal expansion coefficients for quartz minerals (Siegesmund et al., 2008) or rock samples (Skinner, 1966; Ruedrich et al., 2011). After stopping cooling and enhancing a natural warming of the rock samples, the transition phase (2) started (Fig. 5a and b). Some crackmeters experienced a sudden rock deformation due to a rapid rock response to warming, while other crackmeters showed further rock contraction even on the same rock sample (Figs. S1 and S2). The contraction behaviour corresponded to decreasing RT5 cm, while RTT was already increasing as a response to warmer air temperature. Therefore, the transition phase is characterized by a temperature difference between rock surface (RTT) and rock depth (RT5 cm), which is a result of the slow speed of heat conduction. While the rock surface (RTT) was warming and rock was expanding, the overall rock kinematics was still controlled by cooling of the rock interior and associated contraction. The warming phase (3) was characterized by rock expansion (Figs. 5, S1 and S2) with thermal expansion coefficients that are slightly different from the cooling phase (Table 1). Therefore, thermal cycles showed a hysteresis effect, which was previously observed on other lithologies (Ruedrich et al., 2011).
The control crackmeters demonstrated that snow cover controls the occurrence of daily temperature cycles and the associated rock expansion during warming and contrasting rock contraction during cooling. Daily temperature changes affected the upper 0.21 to 0.42 m assuming a 12 h temperature cycle and a thermal diffusivity of between 1 and 2 mm s−2 typical for metamorphic rocks (Cermák and Rybach, 1982; Vosteen and Schellschmidt, 2003). These rock depths correspond to daily temperature cycles in rockwalls observed in previous studies (Anderson, 1998; Gunzburger and Merrien-Soukatchoff, 2011). On an annual scale, thermal changes affected 4 to 8 m, and, therefore, the entire instrumented rock blocks assuming a half-year cycle and thermal diffusivities typical for metamorphic rocks. Rock temperature boreholes in the Alps suggest heat propagation to similar depths (Phillips et al., 2016a; PERMOS, 2019). Control crackmeters revealed identical phases of thermally induced rock deformation as laboratory measurements including hysteresis effects. The hysteresis effect was amplified at RW1, where rock blocks are between 2 and 4 times larger than rock blocks at the other rockwalls (Fig. 3). A larger rock block size results in a longer heat transfer by conduction and increases the transition phase; therefore, I interpret the increase in the hysteresis effect as a result from block size and an effect of scale. The observed differential thermal expansion in combination with a different response during the transition phase results in mechanical stresses able to break down rock that will be discussed in Sect. 5.3.
5.2 Progressive irreversible rock movement
In overhanging steep rock cliffs, thermal stresses can propagate fractures and trigger rockfall (Stock et al., 2012; Collins and Stock, 2016). Exfoliation joints warm differentially (Guerin et al., 2019), and thermal bowing results in fracture propagation parallel to the rockwall (Collins and Stock, 2016). In fractured rock, daily and annual thermal cycles result in rock contraction with fracture widening during cooling and rock expansion with fracture closing during warming (Fig. 10b; Cooper and Simmons, 1977; Draebing et al., 2017b). My data showed that crack opening and closing occurred on a daily scale (Fig. 8). The magnitude of this crack deformation depends on the magnitude of temperature change and was increased at RWS and RW3, which experienced much higher daily temperature changes (Fig. 9). The data demonstrated that the number of daily temperature changes per year (Figs. 9 and S5) is controlled by the duration of snow cover. Snow cover insulates the ground (Zhang, 2005) and decreases daily thermal changes (Luetschg and Haeberli, 2005; Draebing et al., 2017b); therefore, rockwalls at lower elevations (e.g. RW3) or south-exposed rockwalls (e.g. RWS) experienced a shorter snow cover duration (Tables 2 and 3) and a higher frequency of thermal cycles than higher-elevated rockwalls with longer snow cover (e.g. RW2-3).
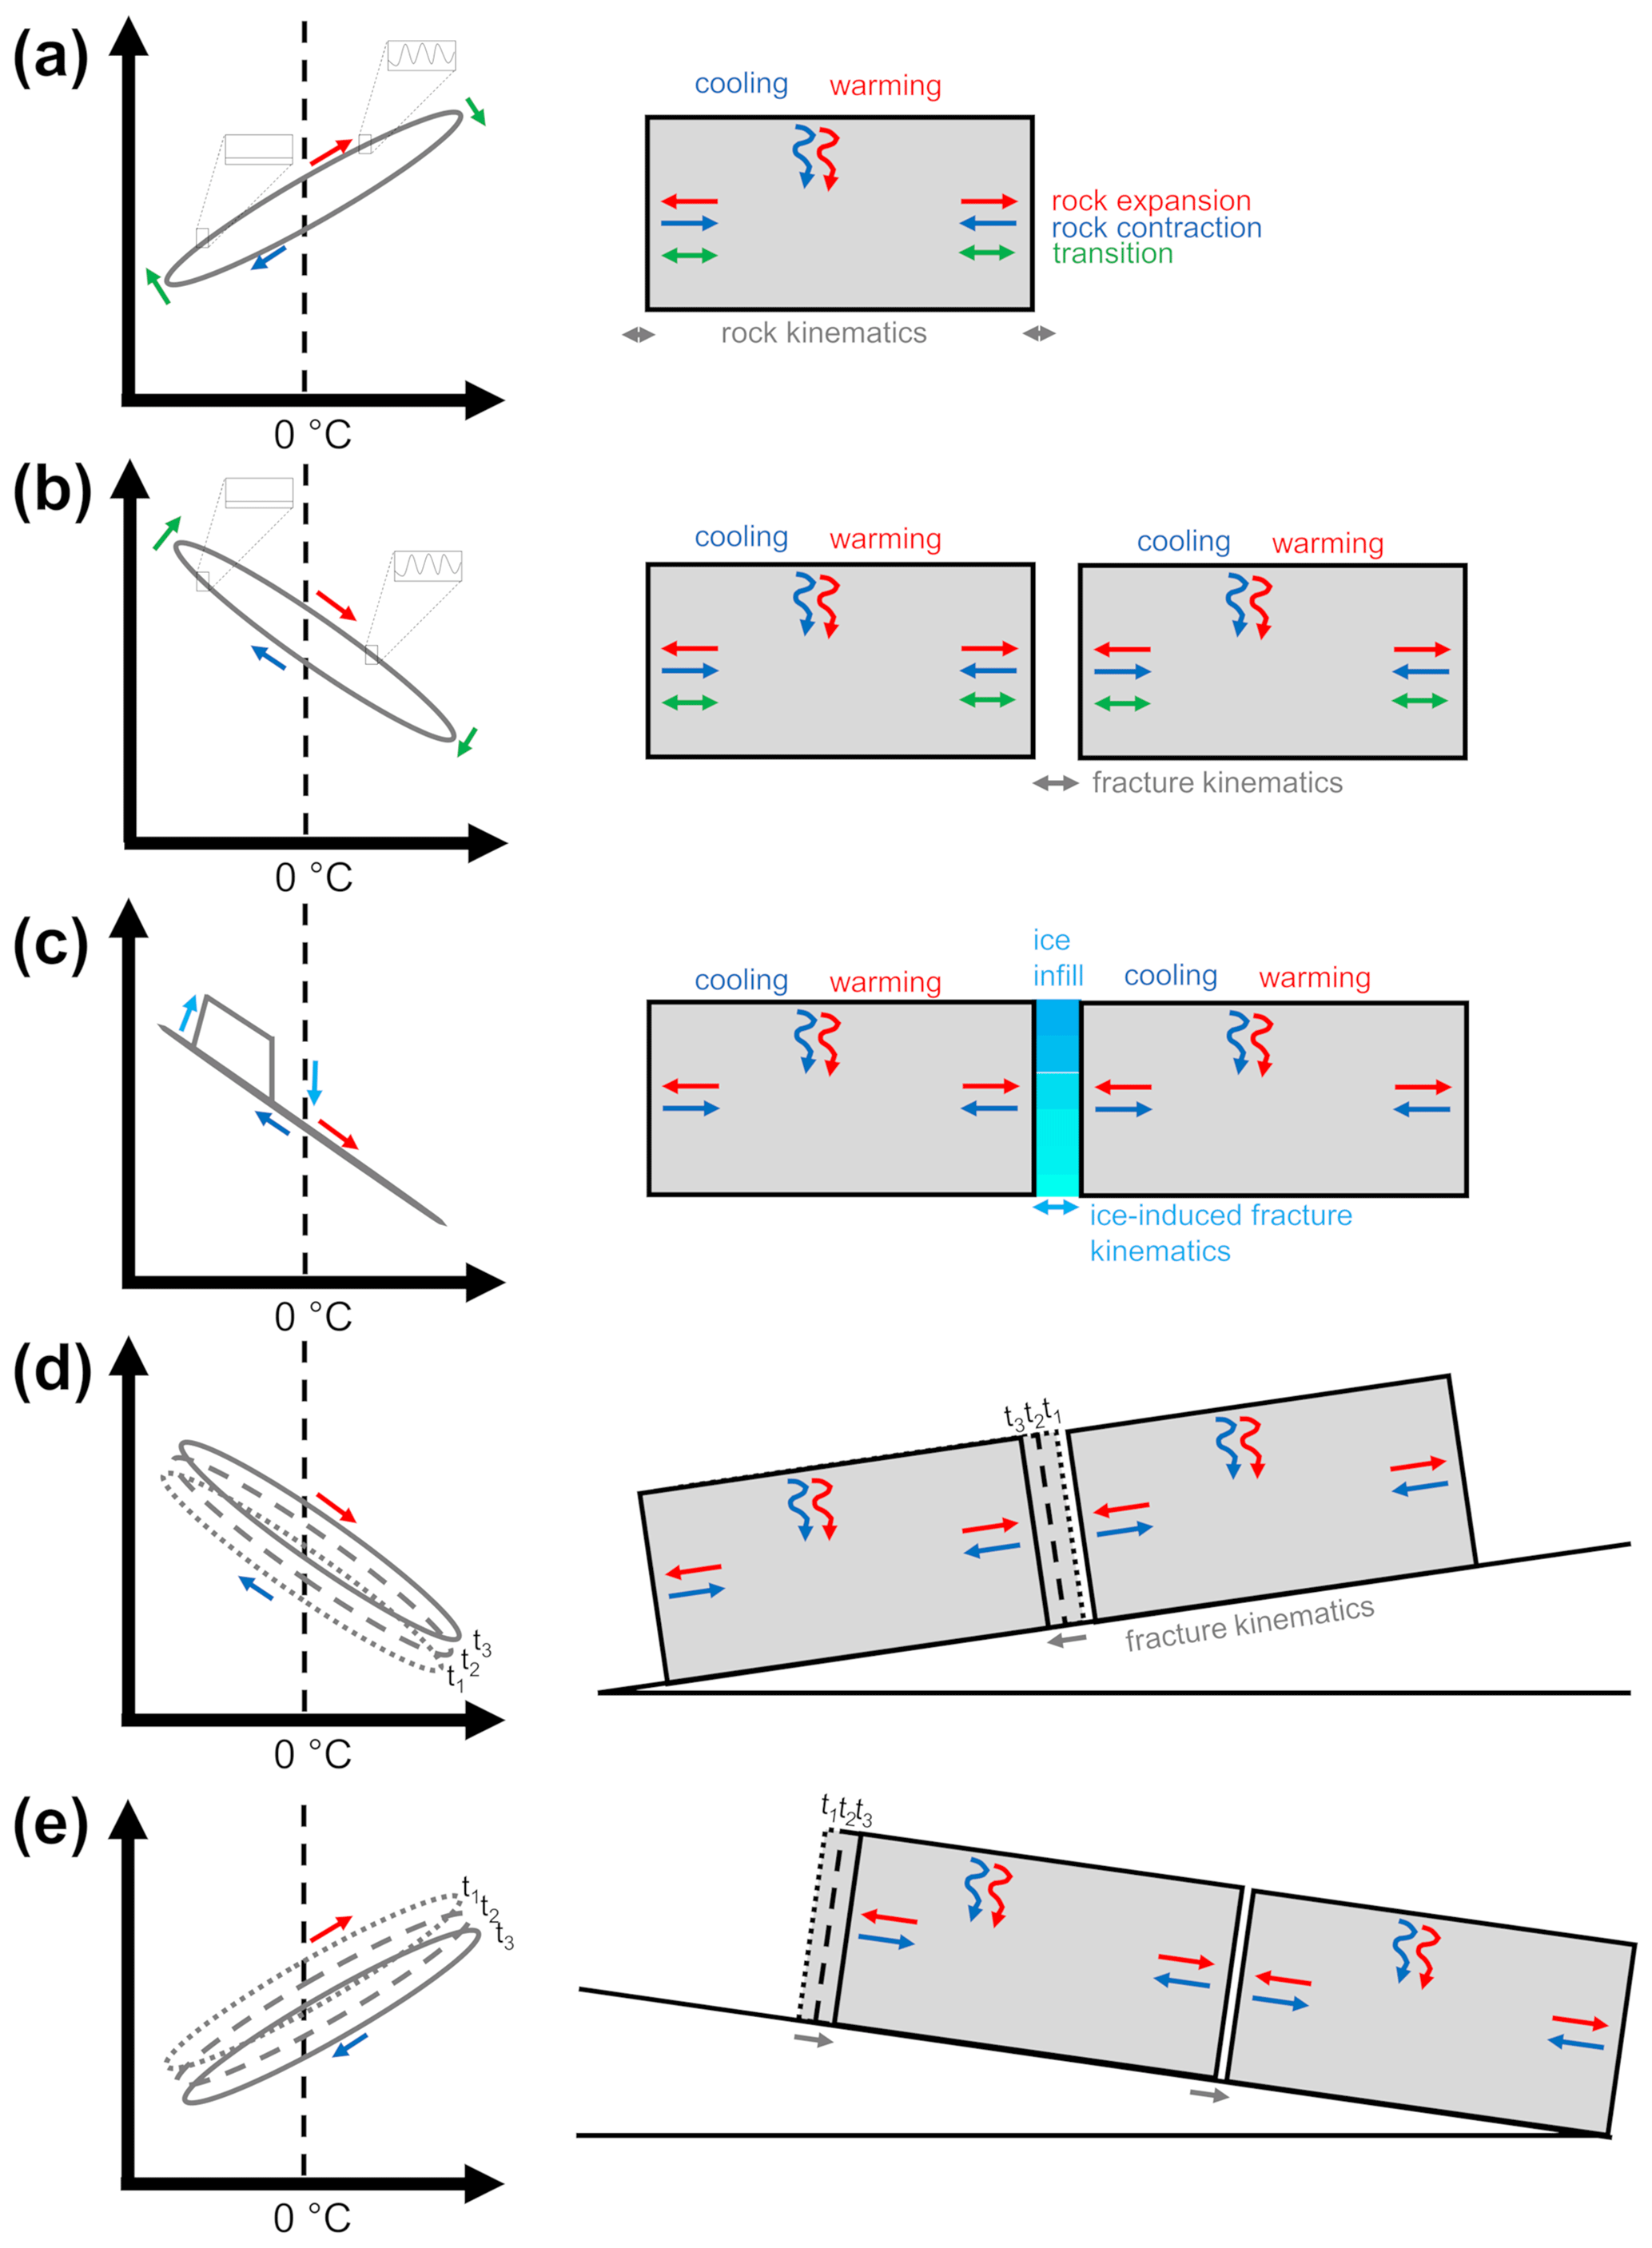
Figure 10Conceptual illustration of (a) thermally induced rock kinematics, (b) thermally induced fracture kinematics, (c) ice-induced fracture kinematics, (d) thermally induced rock creeping on a shear plane dipping out of the rockwall and (e) thermally induced rock kinematics on a shear plane dipping into the slope. Insets in (a) and (b) show daily temperature oscillation below snow cover and without snow cover.
On a seasonal scale, several crackmeters experienced a slow crack opening during negative CTT that suggest the influence of ice (Fig. 10c). Matsuoka (2001, 2008) observed rapid crack opening during freeze–thaw cycles in spring or autumn that suggest volumetric expansion as the trigger of crack opening. In contrast, I observed a slow crack opening lasting between 1.5 to 2 months at RW2 in 2017 (Figs. 6b and 7c and d), 3 to 3.5 months at Crack-2 at RWS in 2018 (Figs. 6d and 7h), and 5 to 5.5 months at Crack-2 at RW1 in 2017 and 2019 (Figs. 6a and 7b). The opening occurred in a CTT range of between −5 and −3.3 ∘C at RW2, between −8 and −3.6 ∘C at RWS, and −9 and −1 ∘C at RW1. These temperature ranges are within the frost cracking window from −8 to −3 ∘C suggested by Anderson (1998) or in the range of laboratory-observed frost cracking windows of aplite, amphibolite and schistose quartz slate (Draebing and Krautblatter, 2019). The temporal trajectories of the affected cracks showed that crack opening occurred during warming within the negative temperature range (Fig. 7b–d and h); therefore, a purely thermal response of the rock would result in rock expansion and crack closing. In addition, a transition phase as observed in the laboratory or at control crackmeters can be excluded; thus, the transition phase is associated with temperature changes from warming to cooling or the reverse, which were absent during these crack opening phases. Therefore, I interpret the observed crack opening as a result of ice segregation and the subsequent closing because of ice relaxation. Cracks can infill with ice by the refreezing of meltwater; ice infill growth can occur slowly with time by cryosuction (Draebing et al., 2017b; Weber et al., 2018) and build up ice pressure and stresses in a subcritical range (Draebing and Krautblatter, 2019), which induce slow fracture opening (Draebing et al., 2017b; Draebing and Krautblatter, 2019).
On an annual timescale, thermally induced crack opening and closing can be reinforced by cryogenic processes (Hasler et al., 2012), can propagate fractures (Ishikawa et al., 2004) and can result in irreversible rock movement (Weber et al., 2017). Previous studies focussed on toppling rock blocks (Ishikawa et al., 2004) or provided no information on the failure type (Hasler et al., 2012; Weber et al., 2017). Due to the tectonic setting, the observed blocks are located on a shear plane dipping out of the slope (RW1-2, Fig. 3a–b) or dipping into the slope (RW3, RWS; Fig. 3c–d). Gunzburger et al. (2005) observed daily non-permanent block movement and suggested that thermal changes can induce rock creep along shear planes. On non-buttressed blocks located on shear planes dipping out of the slope (RW1; Fig. 10d), crackmeters recorded annual and overall crack opening, indicating that the lower located block in Fig. 3a is creeping slope downwards with an annual rate of 0.11 to 0.24 mm a−1 (Table 4). The majority of the creeping occurred during the cooling phase (Phase 1 in Fig. 6a), which was characterized by 0.22 to 0.53 mm opening of Crack-1 at RW1. This opening was slightly reversed at Crack-1 and extended at Crack-2 by ice segregation during Phase 2. In Phase 3, the closing pattern reversed most of the previous crack opening. The warming Phase 4 induced a crack opening, which is contrary to expected crack closing. Bakun-Mazor et al. (2020) identified thermally induced wedging as a cause of crack opening during warming. The rock contracts during cooling, and a wedge within the fracture sinks into the cooling-induced gap and causes a crack opening during warming-induced thermal expansion. A wedge was not visible at Crack-1 and the annual opening exceeded the crack opening during the warming Phase 4. Therefore, I interpret the crack opening as irreversible thermally induced block movement.
In contrast to RW1, all other blocks are located on shear planes dipping into the rockwall or buttressed by other blocks (Fig. 3b–d). The cooling phase resulted in crack opening at RW2 and Crack-1 at RW3, and the opening was reversed during the warming Phase 4 resulting in an irreversible annual (RW3) and overall closing (RW3). Crack closing at Crack-2 at RW3 and RWS occurred during the cooling period and was not completely reversed during the warming period resulting in an annual and overall crack closing (Table 4). In summary, thermally induced crack deformation caused an irreversible block movement along the shear plane into the rockwall (Fig. 10e).
5.3 Altitudinal effects on rock and fracture kinematics and implications for rock stability
Thermal changes are an important climatic factor inducing stresses responsible for mechanical weathering (Eppes and Keanini, 2017). Thermal stresses cause subcritical cracking (Eppes et al., 2016) and propagate fractures (Eppes et al., 2010; Eppes and Keanini, 2017). In alpine rockwalls, thermal changes result in deformation of rocks (Collins and Stock, 2016; Guerin et al., 2020), and induced stresses can decrease the strength of stability-relevant rock bridges (Guerin et al., 2019) and can trigger rockfall (Stock et al., 2012; Collins and Stock, 2016). Applying the observed thermal coefficients and recorded RST at 10 cm depth to the thermal stress model by Anderson and Anderson (2012) demonstrated that thermal stresses occurred during snow-free periods and during periods of thin snow cover before snow achieved sufficient height to insulate the rock surface (Phillips, 2000; Luetschg and Haeberli, 2005). Modelled thermal stresses represent maximum values; thus, Eq. (2) assumes isotropic material and an equal volumetric expansion in every direction. Occurring rock types possess cracks and schist planes, which results in anisotropy ranging between 0.05 for amphibolite, 0.06 for aplite and 0.55 for schistose quartz slate (Draebing and Krautblatter, 2019). Therefore, modelled stresses for schistose quartz slate are potentially overestimated. Stresses will concentrate at crack tips and widen cracks (Eppes and Keanini, 2017); however, stress calculation requires knowledge of crack geometry which is not available. The applied model provides a quantitative measure of stress levels and demonstrates that stresses occurring at RW1-3 are below tensile strengths and compressive strengths of in situ rock (Table 1). Thermal stresses are not exceeding rock strength and are subcritical in sensu Eppes and Keanini (2017); however, the cyclicity of thermal stresses progressively weakens rock (Eppes et al., 2016). Schmidt hammer values showed high values between 63±4.8 and 71.8±2.5 for RW1-2, which consist of high-strength aplite and amphibolite (Table 3); therefore, these values suggest minor weathering near the surface. In contrast, rockwalls with schistose quartz slate revealing lower rebound values with RWS had lower (31.4±2.4) values than RW3 (39.4±4.2). This could be a result of higher modelled thermal stresses at RWS compared to RW3 (Fig. 4). However, thermal processes do not act in isolation and other weathering processes including mechanical, chemical and biological weathering can be responsible for the observed decrease in rock strength (Viles, 2013a; Eppes and Keanini, 2017). As soon as cracks exist, daily thermal changes induce fracture kinematics that can widen cracks (Fig. 10b). My data demonstrated that snow cover controls the number of daily crack deformations (Figs. 8 and S5). According to Bender et al. (2020), the changes in snow duration are elevation dependent, and locations in Valais above to 2500 m will experience a shortening of the snow season of approximately 10 % by 2035, 17 % by 2060 % and 25 % by 2085. Temperature extremes and variability (Schär et al., 2004; Gobiet et al., 2014) will increase in the future. Therefore, the number and the magnitude of thermal stresses will increase in the future, which could be amplified if climate becomes wetter (Eppes et al., 2020). Consequently, thermal stresses will play a more important role in preparing and triggering rockfall in the future. Future work should quantify rockfall and link rockfall patterns to modelled or measured thermal stresses.
Cryogenic processes can cause fracture movement (Draebing et al., 2017b) and produce subcritical stresses that are below tensile strengths of rocks (Draebing and Krautblatter, 2019). These stresses occur in a wide temperature range between −15 and −1 ∘C according to field measurements (Amitrano et al., 2012; Girard et al., 2013), numerical models (Walder and Hallet, 1985; Draebing and Mayer, 2021) and laboratory tests (Draebing and Krautblatter, 2019). My data showed the occurrence of cryogenically induced opening and closing at several crackmeters (Fig. 7b–d and h). The slow opening in combination with the temperature regime suggests that ice segregation is the driving process behind the observed crack opening. This opening can progressively weaken rockwall strength and potentially triggers rock slope failure as observed at Piz Kesch in winter 2014 (Phillips et al., 2016b). The length of the temperature window enabling ice segregation increases with elevation but is modulated by insulating snow cover. Climate change will shorten the snow duration by an earlier meltout date (Bender et al., 2020) and increase air and ground temperatures (Gobiet et al., 2014; Bender et al., 2020); therefore, the time period of temperature windows enabling ice segregation will decrease. This will affect especially rockwalls located at lower elevations; therefore, cryogenic processes and triggered rockfall will be shifted to higher elevations. At higher elevations, the climate-change-induced changes in the temperature regime will also affect permafrost rockwalls, decrease rockwall stability (Krautblatter et al., 2013; Draebing et al., 2014) and increase rockfall activity due to increased thawing (Ravanel et al., 2010; Ravanel and Deline, 2010) amplified by temperature extremes (Gruber et al., 2004a; Ravanel et al., 2017). Rockfall should be quantified and linked to climatic drivers to predict the effects of climate change on rockfall more accurately.
Plastic deformation of fractures contributes to the preparation of rockfalls (Gunzburger et al., 2005). Previous studies demonstrated that thermally induced crack deformation causes irreversible displacement of rock blocks (Hasler et al., 2012; Weber et al., 2017). Gunzburger et al. (2005) and do Amaral Vargas et al. (2013) suggested that thermal changes can cause rock creep along shear planes. My data demonstrate that rock blocks creep with a direction depending on shear plane dipping. Dipping out of the rockwall results in creeping that increases fracture opening (RW1, Fig. 10d) and can trigger rockslide processes. In contrast, dipping into the rockwall causes fracture closing (RW3, RWS; Fig. 10e). My observed blocks will not be released as rockfall; however, the observed mechanism can trigger a wedge failure in steeper and more overhanging rockwalls that are more susceptible to rockfall (Matasci et al., 2017). Several studies indicated that thermally induced stresses can affect rock slopes up to 100 m depth (Gischig et al., 2011b) and affect deep-seated gravitational slope deformations (Watson et al., 2004; Gischig et al., 2011a; Rouyet et al., 2017). Therefore, thermal changes can decrease rock slope stability with time (preparatory factor) and potentially cause landsliding (triggering factor).
Thermally induced rock deformation can cause fracture movement and thermal stresses able to break down rock. Cyclic thermal rock deformation follows a cooling and warming phase with different thermal expansion coefficients. The transition between these phases is characterized by both rock contraction and expansion, and thermal cycles show a hysteresis effect observed in the laboratory and the field. Snow cover controls the number of daily temperature changes, while topographic factors influencing insolation (e.g. aspect) control the magnitude of temperature changes. Months-long slow crack opening occurred within a temperature range between −9 and −1 ∘C and suggests that ice segregation caused slow fracture opening, which was reversed by ice relaxation. Depending on the dipping of shear planes, thermal changes on an annual scale cause rock creeping that widens or shortens fracture aperture. Cycles of thermally and ice-induced crack opening and closing can progressively weaken rockwalls and trigger rockfall. Climate change will shorten snow duration and increase temperature extremes and, therefore, will affect the number and the magnitude of thermal changes and associated stresses. However, an earlier snowmelt in combination with temperature increase will decrease the occurrence of ice segregation and will shift the frost-favouring temperature regime to higher elevations. Therefore, climate change will change the frequency, magnitude and the location of thermally and ice-induced stresses and will change the spatial variation in rockfall in alpine environments in the future. Quantifying rockfall patterns and linking rockfall patterns to climatic drivers should be the objective of future work.
All data are available at https://doi.org/10.6084/m9.figshare.14909934 (Draebing, 2021).
The supplement related to this article is available online at: https://doi.org/10.5194/esurf-9-977-2021-supplement.
The author declares that there is no conflict of interest.
Publisher's note: Copernicus Publications remains neutral with regard to jurisdictional claims in published maps and institutional affiliations.
This study was funded by the German Research Foundation (DR1070/1-1). Laboratory and fieldwork support by Till Mayer was highly acknowledged. Furthermore, the author thanks Samuel McColl, Arne Brandschwede, Florian Strohmaier, Simon Schäffler, Arne Thiemann, Ann-Kathrin Baßler, Alexandra Weber, Veronika Stiller and Helle Nannestad for fieldwork support, Fritz Ettl, Heiko Käsling, and Georg Stockinger for laboratory work support, and Michael Krautblatter and Maarten Kleinhans for hospitality. The author acknowledges the valuable comments of three anonymous reviewers that helped to revise the paper.
This research has been supported by the Deutsche Forschungsgemeinschaft (grant no. DR 1070/1-1).
This open-access publication was funded by the University of Bayreuth.
This paper was edited by Tom Coulthard and reviewed by three anonymous referees.
Amitrano, D., Gruber, S., and Girard, L.: Evidence of frost-cracking inferred from acoustic emissions in a high-alpine rock-wall, Earth Planet. Sc. Lett., 341, 86–93, https://doi.org/10.1016/j.epsl.2012.06.014, 2012.
Anderson, R. S.: Near-surface thermal profiles in alpine bedrock: Implications for the frost weathering of rock, Arctic Alpine Res., 30, 362–372, https://doi.org/10.2307/1552008, 1998.
Anderson, R. S. and Anderson, S. P.: Geomorphology. The Mechanics and Chemistry of Landscapes, 3rd ed., Cambridge University Press, Cambridge, 2012.
Bakun-Mazor, D., Hatzor, Y. H., Glaser, S. D., and Carlos Santamarina, J.: Thermally vs. seismically induced block displacements in Masada rock slopes, Int. J. Rock Mech. Min., 61, 196–211, https://doi.org/10.1016/j.ijrmms.2013.03.005, 2013.
Bakun-Mazor, D., Keissar, Y., Feldheim, A., Detournay, C., and Hatzor, Y. H.: Thermally-Induced Wedging–Ratcheting Failure Mechanism in Rock Slopes, Rock Mech. Rock Eng., 53, 2521–2538, https://doi.org/10.1007/s00603-020-02075-6, 2020.
Bearth, P.: Geologischer Atlas der Schweiz 1:25000, Erläuterungen zum Atlasblatt 71 (1308 St. Niklaus), Schweizer Geologische Kommission, Basel, 1980.
Bender, E., Lehning, M., and Fiddes, J.: Changes in Climatology, Snow Cover, and Ground Temperatures at High Alpine Locations, Front. Earth Sci., 8, 100, https://doi.org/10.3389/feart.2020.00100, 2020.
Blikra, L. H. and Christiansen, H. H.: A field-based model of permafrost-controlled rockslide deformation in northern Norway, Geomorphology, 208, 34–49, https://doi.org/10.1016/j.geomorph.2013.11.014, 2014.
Cermák, V. and Rybach, L.: Thermal conductivity and specific heat of minerals and rocks, in: Landolt–Börnstein Zahlenwerte and Funktionen aus Naturwissenschaften und Technik, Neue Serie, Physikalische Eigenschaften der Gesteine (V/1a), edited by: Angeneister, G., Springer, Berlin, 305–343, 1982.
Collins, B. D. and Stock, G. M.: Rockfall triggering by cyclic thermal stressing of exfoliation fractures, Nat. Geosci., 9, 395–400, https://doi.org/10.1038/ngeo2686, 2016.
Collins, B. D., Stock, G. M., Eppes, M.-C., Lewis, S. W., Corbett, S. C., and Smith, J. B.: Thermal influences on spontaneous rock dome exfoliation, Nat. Commun., 9, 762, https://doi.org/10.1038/s41467-017-02728-1, 2018.
Collins, B. D., Stock, G. M., and Eppes, M. C.: Relaxation Response of Critically Stressed Macroscale Surficial Rock Sheets, Rock Mech. Rock Eng., 52, 5013–5023, https://doi.org/10.1007/s00603-019-01832-6, 2019.
Cooper, H. W. and Simmons, G.: The effect of cracks on the thermal expansion of rocks, Earth Planet. Sc. Lett., 36, 404–412, https://doi.org/10.1016/0012-821X(77)90065-6, 1977.
Dixon, J. C. and Thorn, C. E.: Chemical weathering and landscape development in mid-latitude alpine environments, Geomorphology, 67, 127–145, https://doi.org/10.1016/j.geomorph.2004.07.009, 2005.
do Amaral Vargas, E., Velloso, R. Q., Chávez, L. E., Gusmão, L., and do Amaral, C. P.: On the Effect of Thermally Induced Stresses in Failures of Some Rock Slopes in Rio de Janeiro, Brazil, Rock Mech. Rock Eng., 46, 123–134, https://doi.org/10.1007/s00603-012-0247-9, 2013.
Draebing, D.: Identification of rock and fracture kinaematics in high Alpine rockwalls under the influence of elevation, figshare [data set], https://doi.org/10.6084/m9.figshare.14909934, 2021.
Draebing, D. and Krautblatter, M.: The Efficacy of Frost Weathering Processes in Alpine Rockwalls, Geophys. Res. Lett., 46, 6516–6524, https://doi.org/10.1029/2019gl081981, 2019.
Draebing, D. and Mayer, T.: Topographic and geologic controls on frost cracking in Alpine rockwalls, J. Geophys. Res.-Earth, 126, e2021JF006163, https://doi.org/10.1029/2021JF006163, 2021.
Draebing, D., Krautblatter, M., and Dikau, R.: Interaction of thermal and mechanical processes in steep permafrost rock walls: A conceptual approach, Geomorphology, 226, 226–235, https://doi.org/10.1016/j.geomorph.2014.08.009, 2014.
Draebing, D., Haberkorn, A., Krautblatter, M., Kenner, R., and Phillips, M.: Thermal and Mechanical Responses Resulting From Spatial and Temporal Snow Cover Variability in Permafrost Rock Slopes, Steintaelli, Swiss Alps, Permafrost Periglac., 28, 140–157, https://doi.org/10.1002/ppp.1921, 2017a.
Draebing, D., Krautblatter, M., and Hoffmann, T.: Thermo-cryogenic controls of fracture kinematics in permafrost rockwalls, Geophys. Res. Lett., 44, 3535–3544, https://doi.org/10.1002/2016GL072050, 2017b.
Egholm, D. L., Nielsen, S. B., Pedersen, V. K., and Lesemann, J. E.: Glacial effects limiting mountain height, Nature, 460, 884–887, https://doi.org/10.1038/nature08263, 2009.
Eppes, M.-C. and Keanini, R.: Mechanical weathering and rock erosion by climate-dependent subcritical cracking, Rev. Geophys., 55, 470–508, https://doi.org/10.1002/2017RG000557, 2017.
Eppes, M. C., McFadden, L. D., Wegmann, K. W., and Scuderi, L. A.: Cracks in desert pavement rocks: Further insights into mechanical weathering by directional insolation, Geomorphology, 123, 97–108, https://doi.org/10.1016/j.geomorph.2010.07.003, 2010.
Eppes, M. C., Magi, B., Hallet, B., Delmelle, E., Mackenzie-Helnwein, P., Warren, K., and Swami, S.: Deciphering the role of solar-induced thermal stresses in rock weathering, Geol. Soc. Am. Bull., 128, 1315–1338, https://doi.org/10.1130/b31422.1, 2016.
Eppes, M. C., Hancock, G. S., Chen, X., Arey, J., Dewers, T., Huettenmoser, J., Kiessling, S., Moser, F., Tannu, N., Weiserbs, B., and Whitten, J.: Rates of subcritical cracking and long-term rock erosion, Geology, 46, 951–954, https://doi.org/10.1130/G45256.1, 2018.
Eppes, M. C., Magi, B., Scheff, J., Warren, K., Ching, S., and Feng, T.: Warmer, Wetter Climates Accelerate Mechanical Weathering in Field Data, Independent of Stress-Loading, Geophys. Res. Lett., 47, 2020GL089062, https://doi.org/10.1029/2020GL089062, 2020.
Fischer, M., Huss, M., Barboux, C., and Hoelzle, M.: The new Swiss Glacier Inventory SGI2010: relevance of using high-resolution source data in areas dominated by very small glaciers, Arct. Antarct. Alp. Res., 46, 933–945, https://doi.org/10.1657/1938-4246-46.4.933, 2014.
Girard, L., Gruber, S., Weber, S., and Beutel, J.: Environmental controls of frost cracking revealed through in situ acoustic emission measurements in steep bedrock, Geophys. Res. Lett., 40, 1748–1753, https://doi.org/10.1002/grl.50384, 2013.
Gischig, V. S., Moore, J. R., Evans, K. F., Amann, F., and Loew, S.: Thermomechanical forcing of deep rock slope deformation: 2. The Randa rock slope instability, J. Geophys. Res.-Earth Surf., 116, F04011, https://doi.org/10.1029/2011jf002007, 2011a.
Gischig, V. S., Moore, J. R., Evans, K. F., Amann, F., and Loew, S.: Thermomechanical forcing of deep rock slope deformation: 1. Conceptual study of a simplified slope, J. Geophys. Res.-Earth Surf., 116, F04010, https://doi.org/10.1029/2011jf002006, 2011b.
Gobiet, A., Kotlarski, S., Beniston, M., Heinrich, G., Rajczak, J., and Stoffel, M.: 21st century climate change in the European Alps – A review, Sci. Total Environ., 493, 1138–1151, https://doi.org/10.1016/j.scitotenv.2013.07.050, 2014.
Grämiger, L. M., Moore, J. R., Gischig, V. S., Ivy-Ochs, S., and Loew, S.: Beyond debuttressing: Mechanics of paraglacial rock slope damage during repeat glacial cycles, J. Geophys. Res.-Earth, 122, 1004–1036, https://doi.org/10.1002/2016JF003967, 2017.
Grämiger, L. M., Moore, J. R., Gischig, V. S., and Loew, S.: Thermo-mechanical stresses drive damage of Alpine valley rock walls during repeat glacial cycles, J. Geophys. Res.-Earth, 123, 2620–2646, https://doi.org/10.1029/2018JF004626, 2018.
Grämiger, L. M., Moore, J. R., Gischig, V. S., Loew, S., Funk, M., and Limpach, P.: Hydromechanical rock slope damage during Late Pleistocene and Holocene glacial cycles in an Alpine valley, J. Geophys. Res.-Earth, 125, e2019JF005494, https://doi.org/10.1029/2019jf005494, 2020.
Gruber, S., Hoelzle, M., and Haeberli, W.: Permafrost thaw and destabilization of Alpine rock walls in the hot summer of 2003, Geophys. Res. Lett., 31, 1–4, https://doi.org/10.1029/2004GL020051, 2004a.
Gruber, S., Hoelzle, M., and Haeberli, W.: Rock-wall Temperatures in the Alps: Modelling their Topographic Distribution and Regional Differences, Permafrost Periglac., 15, 299–307, https://doi.org/10.1002/ppp.501, 2004b.
Guerin, A., Jaboyedoff, M., Collins, B. D., Derron, M.-H., Stock, G. M., Matasci, B., Boesiger, M., Lefeuvre, C., and Podladchikov, Y. Y.: Detection of rock bridges by infrared thermal imaging and modeling, Sci. Rep., 9, 13138, https://doi.org/10.1038/s41598-019-49336-1, 2019.
Guerin, A., Jaboyedoff, M., Collins, B. D., Stock, G. M., Derron, M.-H., Abellán, A., and Matasci, B.: Remote thermal detection of exfoliation sheet deformation, Landslides, 18, 865–879, https://doi.org/10.1007/s10346-020-01524-1, 2020.
Gunzburger, Y. and Merrien-Soukatchoff, V.: Near-surface temperatures and heat balance of bare outcrops exposed to solar radiation, Earth Surf. Proc. Land., 36, 1577–1589, https://doi.org/10.1002/esp.2167, 2011.
Gunzburger, Y., Merrien-Soukatchoff, V., and Guglielmi, Y.: Influence of daily surface temperature fluctuations on rock slope stability: case study of the Rochers de Valabres slope (France), Int. J. Rock Mech. Min., 42, 331–349, https://doi.org/10.1016/j.ijrmms.2004.11.003, 2005.
Haberkorn, A., Phillips, M., Kenner, R., Rhyner, H., Bavay, M., Galos, S. P., and Hoelzle, M.: Thermal regime of rock and its relation to snow cover in steep alpine rock walls: Gemsstock, Central Swiss Alps, Geogr. Ann. A, 97, 579–597, https://doi.org/10.1111/geoa.12101, 2015.
Harbor, J. M., Hallet, B., and Raymond, C. F.: A numerical model of landform development by glacial erosion, Nature, 333, 347, https://doi.org/10.1038/333347a0, 1988.
Hasler, A., Gruber, S., and Beutel, J.: Kinematics of steep bedrock permafrost, J. Geophys. Res.-Earth, 117, F01016, https://doi.org/10.1029/2011jf001981, 2012.
Herman, F., Beyssac, O., Brughelli, M., Lane, S. N., Leprince, S., Adatte, T., Lin, J. Y. Y., Avouac, J.-P., and Cox, S. C.: Erosion by an Alpine glacier, Science, 350, 193–195, https://doi.org/10.1126/science.aab2386, 2015.
Ishikawa, M., Kurashige, Y., and Hirakawa, K.: Analysis of crack movements observed in an alpine bedrock cliff, Earth Surf. Proc. Land., 29, 883–891, https://doi.org/10.1002/esp.1076, 2004.
Kelly, M. A., Buoncristiani, J. F., and Schlüchter, C.: A reconstruction of the last glacial maximum (LGM) ice-surface geometry in the western Swiss Alps and contiguous Alpine regions in Italy and France, Eclogae Geol. Helv., 97, 57–75, https://doi.org/10.1007/s00015-004-1109-6, 2004.
Krautblatter, M. and Moore, J. M.: Rock slope instability and erosion: toward improved process understanding, Earth Surf. Proc. Land., 39, 1273–1278, https://doi.org/10.1002/esp.3578, 2014.
Krautblatter, M., Moser, M., Schrott, L., Wolf, J., and Morche, D.: Significance of rockfall magnitude and carbonate dissolution for rock slope erosion and geomorphic work on Alpine limestone cliffs (Reintal, German Alps), Geomorphology, 167, 21–34, https://doi.org/10.1016/j.geomorph.2012.04.007, 2012.
Krautblatter, M., Funk, D., and Günzel, F. K.: Why permafrost rocks become unstable: a rock–ice-mechanical model in time and space, Earth Surf. Proc. Land., 38, 876–887, https://doi.org/10.1002/esp.3374, 2013.
Leith, K., Moore, J. R., Amann, F., and Loew, S.: In situ stress control on microcrack generation and macroscopic extensional fracture in exhuming bedrock, J. Geophys. Res.-Sol. Ea., 119, 594–615, https://doi.org/10.1002/2012jb009801, 2014a.
Leith, K., Moore, J. R., Amann, F., and Loew, S.: Subglacial extensional fracture development and implications for Alpine Valley evolution, J. Geophys. Res.-Earth Surf., 119, 62–81, https://doi.org/10.1002/2012jf002691, 2014b.
Lepique, M.: Empfehlung Nr. 10 des Arbeitskreises 3.3 “Versuchstechnik Fels” der Deutschen Gesellschaft für Geotechnik e. V.: Indirekter Zugversuch an Gesteinsproben – Spaltzugversuch, Bautechnik, 85, 623–627, https://doi.org/10.1002/bate.200810048, 2008.
Luetschg, M. and Haeberli, W.: Permafrost evolution in the Swiss Alps in a changing climate and the role of the snow cover, Norsk Geogr. Tidsskr., 59, 78–83, https://doi.org/10.1080/00291950510020583, 2005.
Matasci, B., Stock, G. M., Jaboyedoff, M., Carrea, D., Collins, B. D., Guérin, A., Matasci, G., and Ravanel, L.: Assessing rockfall susceptibility in steep and overhanging slopes using three-dimensional analysis of failure mechanisms, Landslides, 15, 859–878, https://doi.org/10.1007/s10346-017-0911-y, 2017.
Matsuoka, N.: Direct observation of frost wedging in alpine bedrock, Earth Surf. Proc. Land., 26, 601–614, https://doi.org/10.1002/esp.208, 2001.
Matsuoka, N.: Frost weathering and rockwall erosion in the southeastern Swiss Alps: Long-term (1994–2006) observations, Geomorphology, 99, 353–368, https://doi.org/10.1016/j.geomorph.2007.11.013, 2008.
Matsuoka, N. and Murton, J.: Frost weathering: Recent advances and future directions, Permafrost Periglac., 19, 195–210, https://doi.org/10.1002/ppp.620, 2008.
McColl, S. T.: Paraglacial rock-slope stability, Geomorphology, 153–154, 1–16, https://doi.org/10.1016/j.geomorph.2012.02.015, 2012.
McColl, S. T. and Draebing, D.: Rock slope instability in the proglacial zone: State of the Art, in: Geomorphology of proglacial systems – Landform and sediment dynamics in recently deglaciated alpine landscapes, edited by: Heckmann, T. and Morche, D., Springer, Heidelberg, 119–141, https://doi.org/10.1007/978-3-319-94184-4_8, 2019.
MeteoSwiss: Climate data station Oberer Stelligletscher 2016–2019, MeteoSwiss, the Swiss Federal Office of Meteorology and Climatology [data set], 2019a.
MeteoSwiss: Climate data station Grächen 2016–2019, MeteoSwiss, the Swiss Federal Office of Meteorology and Climatology [data set], 2019b.
Molnar, P., Anderson, R. S., and Anderson, S. P.: Tectonics, fracturing of rock, and erosion, J. Geophys. Res.-Earth, 112, F03014, https://doi.org/10.1029/2005JF000433, 2007.
Moore, J. R., Sanders, J. W., Dietrich, W. E., and Glaser, S. D.: Influence of rock mass strength on the erosion rate of alpine cliffs, Earth Surf. Proc. Land., 34, 1339–1352, https://doi.org/10.1002/esp.1821, 2009.
Morán-Tejeda, E., López-Moreno, J. I., and Beniston, M.: The changing roles of temperature and precipitation on snowpack variability in Switzerland as a function of altitude, Geophys. Res. Lett., 40, 2131–2136, https://doi.org/10.1002/grl.50463, 2013.
Murton, J. B., Peterson, R., and Ozouf, J. C.: Bedrock fracture by ice segregation in cold regions, Science, 314, 1127–1129, https://doi.org/10.1126/science.1132127, 2006.
Mutschler, T.: Neufassung der Empfehlung Nr. 1 des Arbeitskreises “Versuchstechnik Fels” der Deutschen Gesellschaft für Geotechnik e. V.: Einaxiale Druckversuche an zylindrischen Gesteinsprüfkörpern, Bautechnik, 81, 825–834, https://doi.org/10.1002/bate.200490194, 2004.
Nyenhuis, M., Hoelzle, M., and Dikau, R.: Rock glacier mapping and permafrost distribution modelling in the Turtmanntal, Valais, Switzerland, Z. Geomorphol., 49, 275–292, 2005.
Oppikofer, T., Jaboyedoff, M., and Keusen, H.-R.: Collapse at the eastern Eiger flank in the Swiss Alps, Nat. Geosci., 1, 531–535, https://doi.org/10.1038/ngeo258, 2008.
Otto, J. C., Schrott, L., Jaboyedoff, M., and Dikau, R.: Quantifying sediment storage in a high alpine valley (Turtmanntal, Switzerland), Earth Surf. Proc. Land., 34, 1726–1742, https://doi.org/10.1002/esp.1856, 2009.
PERMOS: Permafrost in Switzerland 2014/2015 to 2017/2018, Glaciological Report Permafrost No. 16–19, edited by: Noetzli, J., Pellet, C., and Staub, B., Cryospheric Commission of the Swiss Academy of Sciences, Fribourg, https://doi.org/10.13093/permos-rep-2019-16-19, 2019.
Phillips, M.: Influences of snow supporting structures on the thermal regime of the ground in alpine permafrost terrain, Eidgenössisches Institut für Schnee- und Lawinenforschung, Davos, 2000.
Phillips, M., Haberkorn, A., Draebing, D., Krautblatter, M., Rhyner, H., and Kenner, R.: Seasonally intermittent water flow through deep fractures in an Alpine rock ridge: Gemsstock, central Swiss Alps, Cold Reg. Sci. Technol., 125, 117–127, https://doi.org/10.1016/j.coldregions.2016.02.010, 2016a.
Phillips, M., Wolter, A., Lüthi, R., Amann, F., Kenner, R., and Bühler, Y.: Rock slope failure in a recently deglaciated permafrost rock wall at Piz Kesch (Eastern Swiss Alps), February 2014, Earth Surf. Proc. Land., 42, 426–438, https://doi.org/10.1002/esp.3992, 2016b.
Prasicek, G., Herman, F., Robl, J., and Braun, J.: Glacial Steady State Topography Controlled by the Coupled Influence of Tectonics and Climate, J. Geophys. Res.-Earth, 123, 1344–1362, https://doi.org/10.1029/2017jf004559, 2018.
Ravanel, L. and Deline, P.: Climate influence on rockfalls in high-Alpine steep rockwalls: The north side of the Aiguilles de Chamonix (Mont Blanc massif) since the end of the “Little Ice Age”, Holocene, 21, 357–365, https://doi.org/10.1177/0959683610374887, 2010.
Ravanel, L., Allignol, F., Deline, P., Gruber, S., and Ravello, M.: Rock falls in the Mont Blanc Massif in 2007 and 2008, Landslides, 7, 493–501, https://doi.org/10.1007/s10346-010-0206-z, 2010.
Ravanel, L., Magnin, F., and Deline, P.: Impacts of the 2003 and 2015 summer heatwaves on permafrost-affected rock-walls in the Mont Blanc massif, Sci. Total Environ., 609, 132–143, https://doi.org/10.1016/j.scitotenv.2017.07.055, 2017.
Rouyet, L., Kristensen, L., Derron, M.-H., Michoud, C., Blikra, L. H., Jaboyedoff, M., and Lauknes, T. R.: Evidence of rock slope breathing using ground-based InSAR, Geomorphology, 289, 152–169, https://doi.org/10.1016/j.geomorph.2016.07.005, 2017.
Ruedrich, J., Kirchner, D., and Siegesmund, S.: Physical weathering of building stones induced by freeze–thaw action: a laboratory long-term study, Environ. Earth Sci., 63, 1573–1586, https://doi.org/10.1007/s12665-010-0826-6, 2011.
Schär, C., Vidale, P. L., Lüthi, D., Frei, C., Häberli, C., Liniger, M. A., and Appenzeller, C.: The role of increasing temperature variability in European summer heatwaves, Nature, 427, 332–336, https://doi.org/10.1038/nature02300, 2004.
Schmid, M.-O., Gubler, S., Fiddes, J., and Gruber, S.: Inferring snowpack ripening and melt-out from distributed measurements of near-surface ground temperatures, The Cryosphere, 6, 1127–1139, https://doi.org/10.5194/tc-6-1127-2012, 2012.
Schmidt, K. M. and Montgomery, D. R.: Limits to Relief, Science, 270, 617–620, https://doi.org/10.1126/science.270.5236.617, 1995.
Selby, M. J.: A rock mass strength classification for geomorphic purposes: with tests from Antarctica and New Zealand, Z. Geomorphol., 24, 31–51, 1980.
Siegesmund, S., Mosch, S., Scheffzuk, C., and Nikolayev, D. I.: The bowing potential of granitic rocks: rock fabrics, thermal properties and residual strain, Environ. Geol., 55, 1437–1448, https://doi.org/10.1007/s00254-007-1094-y, 2008.
Skinner, B. J.: Section 6: Thermal expansion, in: Handbook of Physical Constants, edited by: Clark, J. S. P., Geological Society of America, New York, 1966.
Stock, G. M., Martel, S. J., Collins, B. D., and Harp, E. L.: Progressive failure of sheeted rock slopes: the 2009–2010 Rhombus Wall rock falls in Yosemite Valley, California, USA, Earth Surf. Proc. Land., 37, 546–561, https://doi.org/10.1002/esp.3192, 2012.
Viles, H. A.: Microbial geomorphology: A neglected link between life and landscape, Geomorphology, 157–158, 6–16, https://doi.org/10.1016/j.geomorph.2011.03.021, 2012.
Viles, H. A.: Linking weathering and rock slope instability: non-linear perspectives, Earth Surf. Proc. Land., 38, 62–70, https://doi.org/10.1002/esp.3294, 2013a.
Viles, H. A.: 4.2 Synergistic Weathering Processes, in: Treatise on Geomorphology, edited by: Shroder, J. F., Academic Press, San Diego, 12–26, https://doi.org/10.1016/B978-0-12-374739-6.00057-9, 2013b.
Vosteen, H. D. and Schellschmidt, R.: Influence of temperature on thermal conductivity, thermal capacity and thermal diffusivity for different types of rock, Phys. Chem. Earth, 28, 499–509, https://doi.org/10.1016/s1474-7065(03)00069-x, 2003.
Walder, J. and Hallet, B.: A Theoretical-Model of the Fracture of Rock During Freezing, Geol. Soc. Am. Bull., 96, 336–346, https://doi.org/10.1130/0016-7606(1985)96<336:ATMOTF>2.0.CO;2, 1985.
Watson, A. D., Moore, D. P., and Stewart, T. W.: Temperature influence on rock slope movements at Checkerboard Creek, in: Landslides: Evaluation and Stabilization, Proceedings of the 9th International Symposium on Landslides, A. A. Balkema Publ., Exton, PA, 1293–1298 2004.
Weber, S., Beutel, J., Faillettaz, J., Hasler, A., Krautblatter, M., and Vieli, A.: Quantifying irreversible movement in steep, fractured bedrock permafrost on Matterhorn (CH), The Cryosphere, 11, 567–583, https://doi.org/10.5194/tc-11-567-2017, 2017.
Weber, S., Fäh, D., Beutel, J., Faillettaz, J., Gruber, S., and Vieli, A.: Ambient seismic vibrations in steep bedrock permafrost used to infer variations of ice-fill in fractures, Earth Planet. Sc. Lett., 501, 119–127, https://doi.org/10.1016/j.epsl.2018.08.042, 2018.
Whipple, K. X., Kirby, E., and Brocklehurst, S. H.: Geomorphic limits to climate-induced increases in topographic relief, Nature, 401, 39–43, https://doi.org/10.1038/43375, 1999.
Zhang, D., Chen, A., Wang, X., and Liu, G.: Quantitative determination of the effect of temperature on mudstone decay during wet–dry cycles: A case study of “purple mudstone” from south-western China, Geomorphology, 246, 1–6, https://doi.org/10.1016/j.geomorph.2015.06.011, 2015.
Zhang, T. J.: Influence of the seasonal snow cover on the ground thermal regime: An overview, Rev. Geophys., 43, RG4002, https://doi.org/10.1029/2004RG000157, 2005.