the Creative Commons Attribution 4.0 License.
the Creative Commons Attribution 4.0 License.
 | 22 Dec 2022
Modeling deadwood for rockfall mitigation assessments in windthrow areas
Adrian Ringenbach
Peter Bebi
Perry Bartelt
Andreas Rigling
Marc Christen
Yves Bühler
Andreas Stoffel
Andrin Caviezel
Studying how deadwood mitigates the rockfall hazard in mountain forests is key to understanding the influence of climate-induced disturbances on the protective capacity of mountain forests. Both experimental quantification and numerical process modeling are needed to address this question. Modeling provides detailed insights into the rock–deadwood interaction and can therefore be used to develop effective forest management strategies. Here, we introduce an automatic deadwood generator (ADG) for assessing the impact of fresh woody storm debris on the protective capacity of a forest stand against rockfall. The creation of various deadwood scenarios allows us to directly quantify the mitigation potential of deadwood. To demonstrate the functionality of the proposed ADG method, we compare deadwood log patterns, deadwood effective height, and mesoscale surface ruggedness observed in field surveys in a natural windthrow area with their simulated counterparts. Specifically, we consider two sites near Lake Klöntal, Switzerland, where a major windthrow event occurred in 2019. We perform rockfall simulations for the time (a) before, (b) directly after, and (c) 10 years after the windthrow event. We further compare the results with (d) a simulation with complete clearing of the thrown wood: in other words, a scenario with no standing forest remaining. We showcase an integration of deadwood into rockfall simulations with realistic deadwood configurations alongside a diameter at breast height (DBH)- and rot-fungi-dependent maximum deadwood breaking energy. Our results confirm the mitigation effect of deadwood, which significantly reduces the jump heights and velocities of 400 kg rocks. Our modeling results suggest that, even a decade after the windthrow event, deadwood has a stronger protective effect against rockfall than that provided by standing trees. We conclude that an ADG can contribute to the decision-making involved in forest and deadwood management after disturbances.
- Article
(17297 KB) - Full-text XML
- BibTeX
- EndNote


An improved understanding of how natural disturbances affect the protective role of mountain forests against rockfall is urgently needed in geohazard research. Rock impacts against trees provide a helpful braking effect, as successive impacts can significantly reduce rock speed (Dorren and Berger, 2005). Because rockfall transit and deposition zones are often forested, the rockfall–forest interaction has already received considerable attention (e.g., Jahn, 1988; Dorren et al., 2005; Kalberer et al., 2007). Nonetheless, it remains unclear how changes in the amount of deadwood, resulting from shifts in climate, natural disturbance patterns, and management, will impact the protective effect of mountain forests. While accelerated tree growth and forest expansion near the treeline (Harsch et al., 2009) may contribute to increased protection by forests, this positive change could be offset by increasing rates of natural disturbance and drought-related mortality under climate change (Seidl et al., 2017).
Increasing frequency and intensity of natural disturbances are particularly likely for forest fires (Mozny et al., 2021; Jain et al., 2020) and bark beetle calamities (Jönsson et al., 2009) but has also been reported for windthrow events in Europe (Seidl et al., 2017) (Fig. 1). The influence of climate change on storm intensities and frequencies is presently not clear for the Alps, as neither historical data (CH2018, 2018) nor the results among different numerical models and ensembles (Feser et al., 2015; Seidl et al., 2017; Moemken et al., 2018; Catto et al., 2019) show robust signals regarding long-term wind speed trends for central Europe. Nevertheless, a higher windthrow susceptibility is probable even under unaltered storm conditions. Tree anchorage is directly related to soil wetness (Seidl et al., 2017), and a lower soil-overturning resistance during the winter storm season is therefore possible under the expected higher winter temperatures and thus fewer days with frozen soil conditions (CH2018, 2018). Higher windthrow susceptibility, which has already been reported in lower regions (Stritih et al., 2021), may therefore rise as temperatures increase. In addition, the larger growing stocks and expanding forest areas due to land use changes since the mid-19th century are contributing to an increasing frequency and size of disturbances in the Alps, as windthrow events are more likely in younger (i.e., established after 1920) than in older forests (i.e., established before 1880) (Stritih et al., 2021). Clearly, rockfall hazard engineers must be prepared for more frequent large-scale disturbances in the future and need to understand how this change will affect the protective capacity of mountain forests.
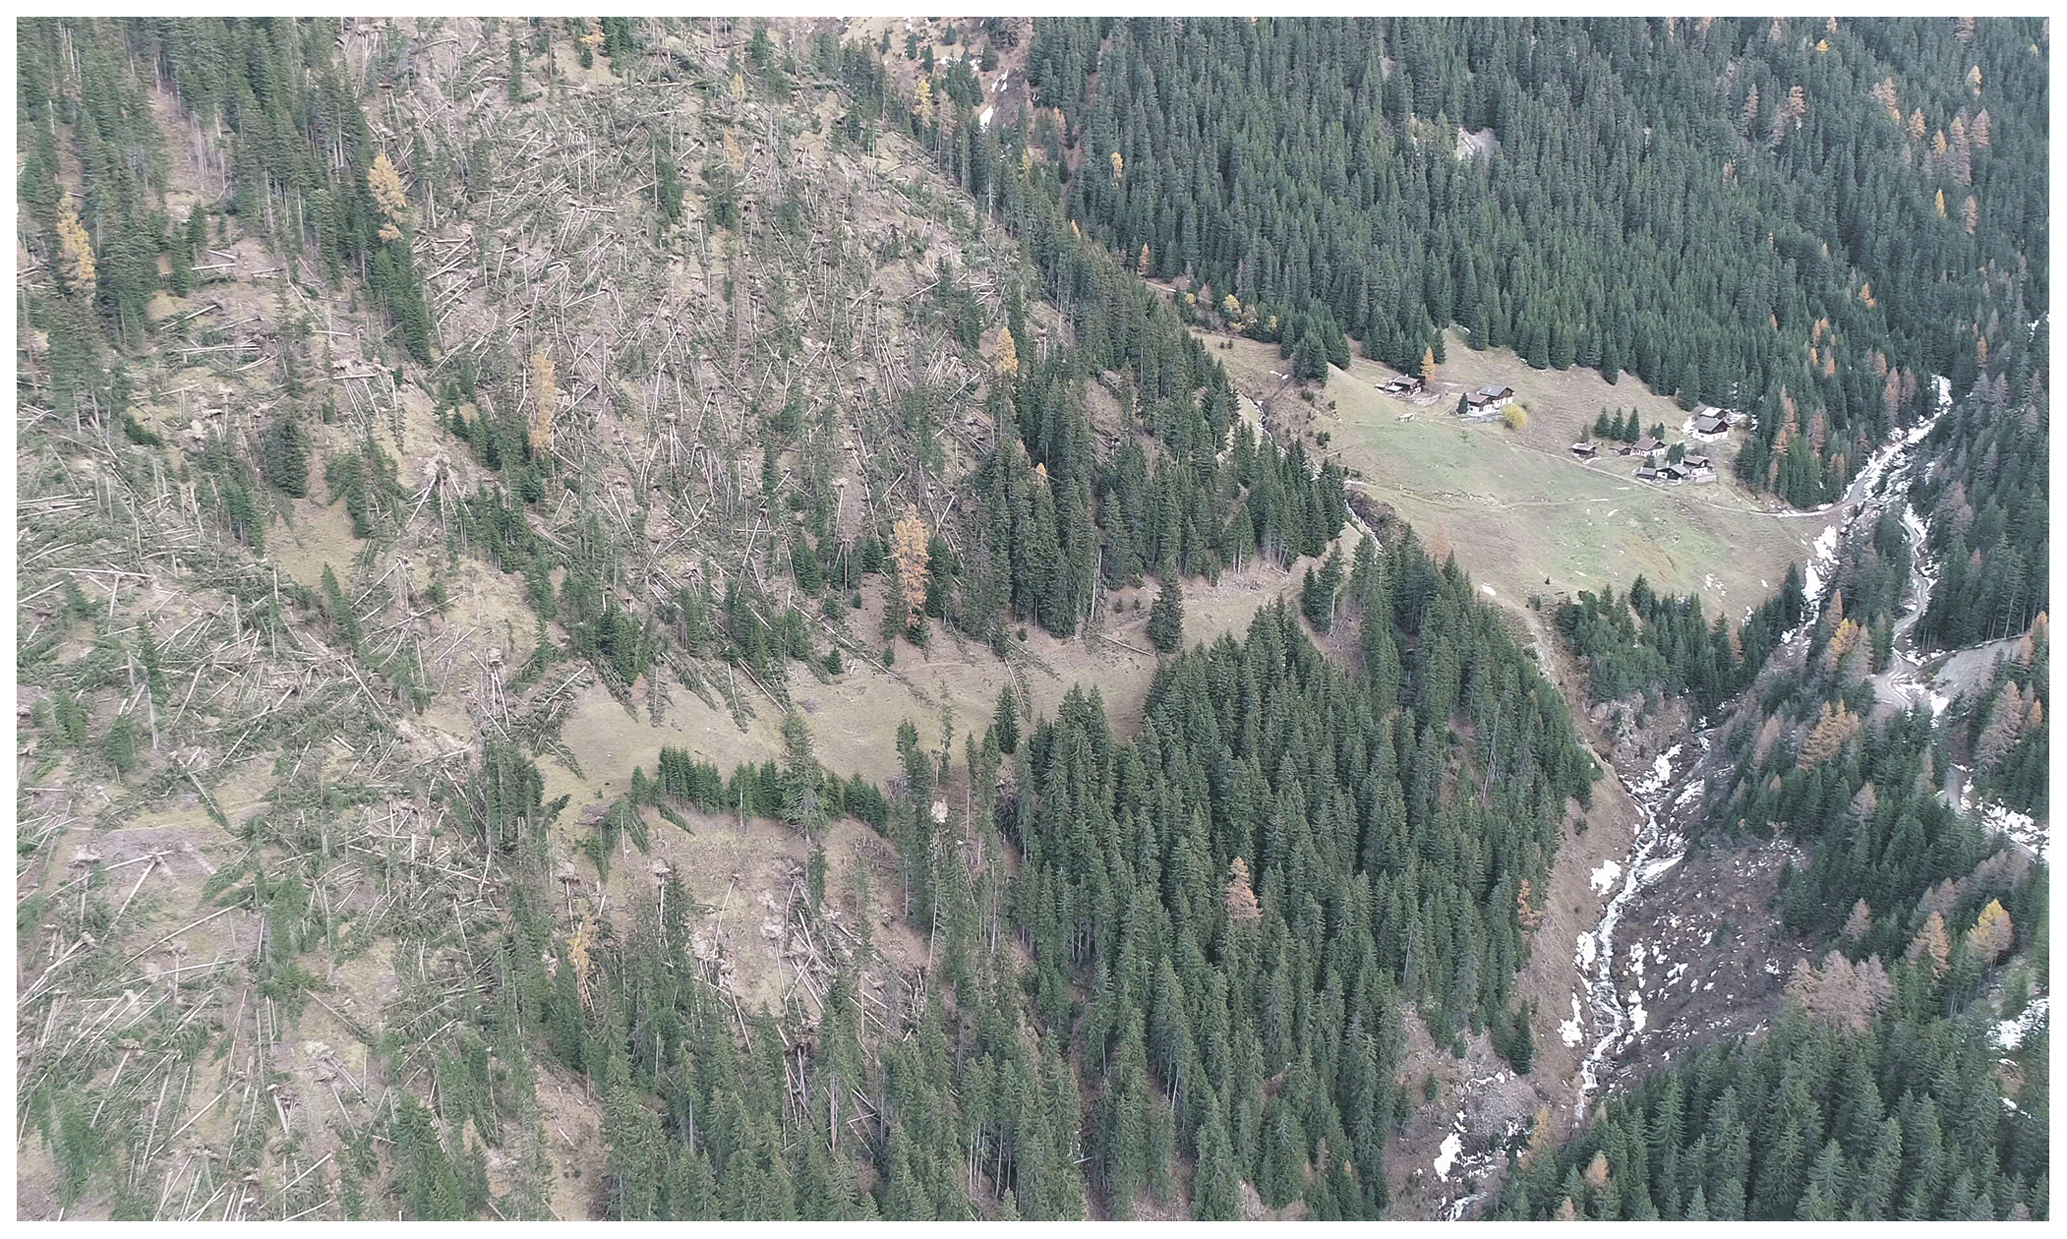
Figure 1The remains of the mountain forest in the Val Tuors, Switzerland, roughly 1 week after the windthrow event Vaia in 2018. Large areas of the Norway-spruce-dominated forest suffered windthrow damage. Lying deadwood logs are partly stacked in places due to the slightly different fall directions of the stems. Source: UAS photo SLF, DJI Phantom 4 RTK.
Researchers have investigated the protective effect of living mountain forests using single-tree experiments (Lundström et al., 2009) and forested slope-scale experiments (Dorren and Berger, 2005). A primary result of these tests was the determination of the maximum block energy reduction normalized by tree diameter. This led to improved rockfall simulation models considering single trees (Dorren, 2016; Liu and Li, 2019; Lu et al., 2020; Noël et al., 2021). In turn, the protective effect of living forests against rockfall could be simulated more accurately in terms of the intensity or risk reduction on a single slope (Stoffel et al., 2006; Monnet et al., 2017; Moos et al., 2019, 2020), as well as on regional (Dupire et al., 2016; Lanfranconi et al., 2020) or even Alps-wide (Dupire et al., 2020; Scheidl et al., 2020) scales. In these approaches the effect of deadwood is largely ignored, although recent experimental studies have quantitatively confirmed its ability to reduce rock velocity (Bourrier et al., 2012) or even stop rocks completely (Ringenbach et al., 2022b).
To address the key scientific questions concerning the role of deadwood in rockfall mitigation, disturbed mountain forests have been monitored for several decades. A significant observational result, based on repeated field surveys of a windthrow area in Disentis, Switzerland, is that the effective height of the deadwood steadily decreases over time (Wohlgemuth et al., 2017; Bebi et al., 2015; Marty, 2019). As branches decay, deadwood logs lose their support, resulting in compaction and loss of height. Declining effective heights have also been reported at the Gandberg site in eastern Switzerland. This site was additionally struck by a major bark beetle infestation, which caused even more damage than that resulting from the original storm event (Kupferschmid Albisetti et al., 2003; Caduff et al., 2022). A second important process observed in windthrow areas is the decay of the deadwood logs themselves and the associated decrease in load-bearing capacity over time. Studies of the load-bearing capacity of deadwood logs have focused on static creep-type loading from snow pressure (Frey and Thee, 2002; Bebi et al., 2015). The results from a study by Ammann (2006) are better suited to rockfall loading, however, as the maximum dynamic fracture impact energies of standing snags and their decrease over time were determined.
Discrete-element models have been applied to study the impact loading of rocks on wooden structures (Olmedo et al., 2016, 2020). Nevertheless, these models are too detailed to be integrated into slope-scale rockfall models. At present, the most practical method to incorporate deadwood into rockfall simulations is to adjust the local roughness, slope angle, or restitution coefficients to account for fallen tree stems (Fuhr et al., 2015; Costa et al., 2021). This approach may be adequate for debranched deadwood logs lying on the ground. It misses, however, the often observed situation that most deadwood logs have no direct ground contact (Kupferschmid Albisetti et al., 2003). This significantly affects the deadwood implementation in rockfall simulation programs in two fundamental ways. First, the models do not account for the ability of small rocks to roll underneath the deadwood. More importantly, the effective height of the deadwood in the models must be larger than the deadwood diameter, especially when several deadwood logs are stacked. Both geometrical challenges can be tackled successfully if three-dimensional truncated cones are introduced into rockfall codes, acting as virtual deadwood (Ringenbach et al., 2022b). Besides requiring the time-consuming manual specification of the coordinates of each deadwood log end, this method currently lacks a maximum deadwood energy threshold.
These two important eco-mechanical conditions that vary over time – the compression of effective deadwood height and the reduced absorbing impact energy due to decay – are not sufficiently taken into account in existing deadwood modeling approaches. In order to accurately model the future protective capacity of naturally disturbed forests, these effects must be included in rockfall simulation programs. To help to accomplish this task, we present an automatic deadwood generator (ADG), which makes it possible to generate spatial distributions of deadwood logs from the slope to regional scale. The proposed script generates windthrown tree configurations not only immediately after a storm event but also a decade later, including presumed decay processes and the collapse of the effective deadwood height. In combination with an ADG-compatible rockfall model, block propagation in different configurations with and without deadwood can be assessed. The precision of the model results depends on the level of exactness with respect to deadwood breakage, which in turn is influenced by the level of decay and the accuracy of the trajectory model. In this work, rockfall propagation was assessed using the rockfall module of the Rapid Mass Movement Simulation software package (RAMMS::ROCKFALL; Leine et al., 2014). Any method to model the distribution and configuration of deadwood in a mountain forest must be calibrated using detailed field observations. The conceptual design of the ADG and its performance were thus examined by applying it to model two areas of an existing windthrow region. The reconstruction capabilities of the ADG with respect to geometrical deadwood configurations, deadwood effective heights, and mesoscale surface roughness were compared with the deadwood clusters observed in field surveys.
2.1 Automatic deadwood generator
The automatic deadwood generator (ADG) integrates deadwood logs into rockfall simulation models. Here, we specifically coupled the Python-based, stand-alone script to the RAMMS::ROCKFALL model (Leine et al., 2014; Lu et al., 2019, 2020). The ADG writes the coordinates of the surface points of each overturned stem and root plate into a point cloud file (.pts; Fig. 2a). Input variables of the ADG are held in a so-called treefile containing x and y coordinates, height, and diameter at breast height (DBH) for each standing tree in the upright position. If exact forest surveys are missing, such a file for a specific, representative forest state can be generated in RAMMS::ROCKFALL via the input of forest stand parameters. Additional input parameters for the ADG are a digital elevation model (DEM), a given main wind azimuth α and its standard deviation αSD, the deadwood state (fresh, old), and the percentage of overturned trees with root plates (blue boxes in Fig. 2a).

Figure 2(a) Overview of the automatic deadwood generator (ADG) process, which, based on the input data (blue boxes) and the deadwood-state-dependent geometrical premises (green boxes), generates deadwood logs readable in RAMMS::ROCKFALL. The contact detection (brown boxes) is illustrated for cases in which a root plate is present (c) or absent (d). (b) Wind directions and maximum wind velocities of the Schwander Grat IMIS station, consolidated over 30 min periods during the 26 h duration of the storm event (based on Pereira, 2022). DW: deadwood, DBH: diameter at breast height, DEM: digital elevation model, DSM: digital surface model, RPϕ: root plate diameter.
The standard deviation parameter αSD is used to model the variability of the fall direction. When stems fall, they can overlap and become stacked. It is possible that logs lying on top of each other form barrier-like deadwood stem clusters. The individual directions of fall of the logs, α′, are a key element for achieving the real observable stacked logs within the ADG and are normally distributed . The occurrence of a root plate is subjected to a Bernoulli distribution ℬ(pW), with pW as the occurring root plate ratio (see Sect. 3.1 for a detailed description of the numerical values). These factors determine the pivot point, which is located in the fall direction from the former stem center. In cases in which a root plate is present, the pivot point is located at the edge of the root plate at a distance of 1.5 ⋅ DBH from the stem center (Fig. 2c). This yields an effective root plate diameter of 3 ⋅ DBH. In the absence of a root plate the stem base point acts as the pivot point, which is 0.65 ⋅ DBH apart, assuming that the stem base is slightly wider than the DBH (Fig. 2d). Around this pivot point, the treetop position is calculated for the different inclination angles θ according to Eqs. (1) to (3):
where x0, y0, and z0 are the coordinates of the pivot point and H is the tree height. The connecting vector between the treetop and the stem base – the lower trunk line – is discretized into 100 iso-spaced control points. In the case of root plate absence, the pivot point acts as the stem base point; otherwise, this point is the intercept of the lower trunk line with the root plate in the α′ direction (defined as in Fig. 2c and d). To simulate the tree fall, θ is inclined in 5∘ steps. A different minimum compaction height Hmin (green box in Fig. 2.a) depending on the modeled state (fresh vs. old deadwood) is subtracted from the lower trunk control points in order to accommodate branches in the falling process and the compaction of the logs over time. At each inclination step, the z values of the shifted control points are compared with their corresponding DEM z values, neglecting those from the lowest 10 % of the trunk due to the assumed overturning moment and those from the top 20 % of the trunk due to increasing flexibility of the trunk top, which hinders a stopping position. and are constants at 0.645 and 0.258 m, respectively, which is one-third of the reported effective heights of deadwood (Bebi et al., 2015), assuming that the trunk and the upward- and downward-directed branches contribute equally to the total effective height. As soon as the first z-value comparison is negative, that is , the final inclination angle is found and the remaining three-dimensional coordinates of the deadwood log and the root plate are calculated. Further, the resampled DEM (20 cm resolution) is updated with the new z values of the deadwood upper trunk line + Hmin. This alteration of the DEM results in the generation of a new digital surface model (DSMgen) and enables the stacking effect with the next deadwood log as it is iteratively updated. The process stops when the entire windthrown tree list has been processed. The relative coordinates with respect to the treetop are written in a .pts file, while the absolute coordinates of the treetop are written into a .txt file with the same name.
To directly assess deadwood effectiveness against larger rockfall energies, the fracture impact energy of large-scale laboratory test data is used. While the fracture impact energy is 239 kJ m−2 for fresh deadwood, the value for 8–10-year-old deadwood is reduced by 55 % (131 kJ m−2) or even 89 % (26 kJ m−2) depending on the occurrence of Fomitopsis pinicola, a rot fungus (Ammann, 2006). Therefore, the occurrence of the fungus is estimated according to a Bernoulli distribution, and the probability of occurrence in this study was set to 33 %. The technical implementation of the deadwood energy threshold is described in more detail in Sect. 2.3.
2.2 Klöntal case study areas
A comparative study with the windthrow event at Lake Klöntal, Glarus (Switzerland), was used to assess the performance of the ADG (Fig. 3). In this case study, a mixed Norway spruce (Picea abies (L.) H. Karst) and European beech (Fagus sylvatica L.) forest with a few silver fir (Abies alba Mill.) and sycamore maple (Acer pseudoplatanus L.) individuals suffered windthrow damage along the southeast-facing slopes of Lake Klöntal. A total of 33 ha of forest was heavily affected by the storm, which lasted 26 h from 14 to 15 November 2019. The nearby wind measurement station Schwander Grat (IMIS, 2022), located 4.5 km to the southeast, recorded maximum wind velocities of up to 25 m s−1 (Fig. 2b). At the station's ridge position the wind direction consolidated over 30 min was surprisingly stable as easterly, although the mean standard deviation of these values was large at ±39.8∘.
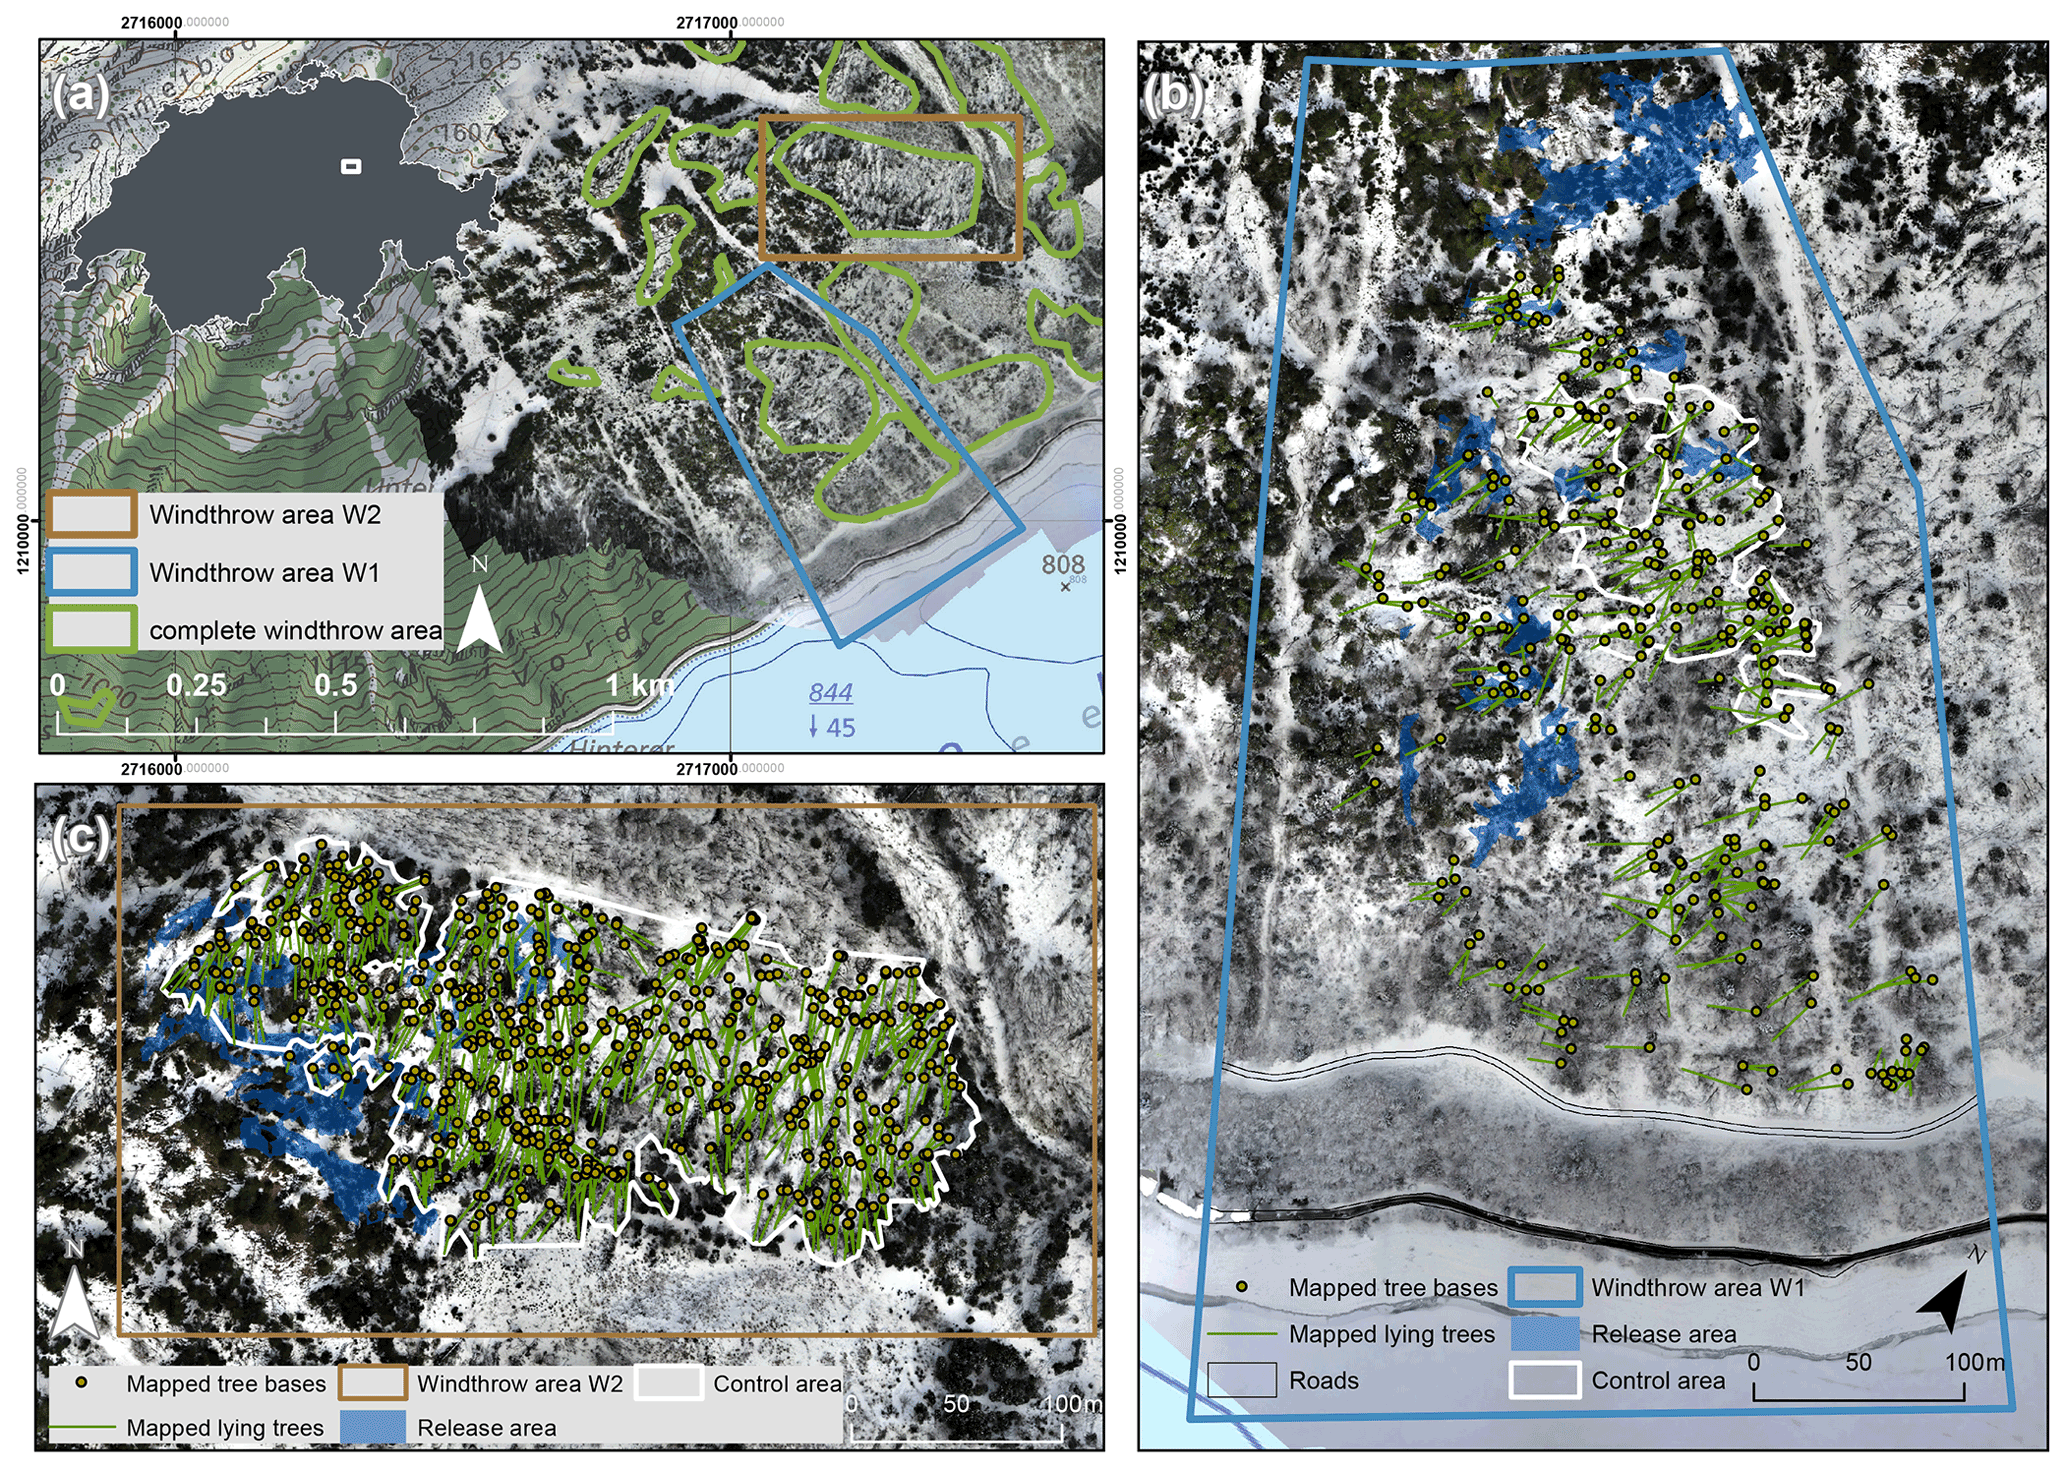
Figure 3(a) Overview map of the Klöntal case study areas based on the orthophoto from January 2020. Detail maps of (b) windthrow area W1 and (c) windthrow area W2 with the mapped lying trees, the control area without standing trees, and the release areas used in the rockfall simulations. Source of the topographical map: Federal Office of Topography.
We documented the state of the entire area twice with fixed-wing drone (unmanned aircraft system, UAS) surveys: after the windthrow event with the eBee + RTK (24 January 2020, average flight altitude 200 m above ground) and after the forest service operations with the WingtraOne PPK (25 November 2020, average flight altitude 290 m above ground). Orthophotos with a spatial resolution of 4 cm and DSMUAS with a spatial resolution of 10 cm were produced based on the photogrammetric workflow within the Agisoft software suite (Bühler et al., 2016).
Two windthrow areas were selected that differ greatly from each other in various aspects: (1) the southeast-to-south exposed windthrow area W1 (8.1 ha) is located directly above the road. Here, it is expected that the deadwood reduces the rockfall intensities on the road. Barely any clearing work was executed during the summer of 2020, and thus the influence of the snow load on the deadwood compaction between January 2020 and November 2020 could be assessed. The detailed mapping revealed a count of 293 logs, yielding a relatively low deadwood density of 36.2 logs per hectare. (2) The second windthrow area W2 (6.6 ha), with a total of 646 mapped overturned trees and 97.9 logs per hectare, has a deadwood density nearly 3 times that in W1. Converted into the more common unit used in forestry practice, this corresponds to 58 m3 ha−1 win W1 and 156 m3 ha−1in W2 based on the volume of the generated logs. W2 is about 400 m to the northeast of W1 but features predominantly east-to-southeast aspects and is located in a side valley, which is not directly above the road. In contrast to W1, almost all of the deadwood in W2 was cleared in the summer of 2020 to reduce possible bark beetle calamities, as the fallen logs were considered to have no direct protective effect for the road.
The overturned trees with DBH ≥ 20 cm were manually mapped based on the UAS orthophoto within the ArcGIS suite. The starting point of the deadwood line was determined as the trunk base and thus the original tree location. The deadwood length was assumed to be the original tree height. Consequently, each log was assigned a length and diameter, type (gymnosperm–conifer vs. angiosperm–deciduous), and falling direction in azimuth. Additionally, the presence of a root plate was evaluated, and, if detected, its diameter was assessed. The estimated accuracy of all the length measurements was ±10 cm. Further quantities of interest were the evaluated vector ruggedness measure (VRM) (Sappington et al., 2007) within a neighborhood of 6 m and the deadwood effective height (), i.e., the height difference between the DSMUAS and the official pre-event swissALTI3D DEMsA3D (original resolution 50 cm; swisstopo, 2018), both resampled to 20 cm. These remote sensing data were compared with the DSMgen, for which the effective height () and ruggedness measure (VRMgen) were both calculated. While the comparison of the azimuth direction of the detected trees and the generated deadwood over the whole area was valid without limitation, Heff and VRM of the DSMUAS were affected by the remaining standing trees. Therefore, control areas with barely any standing trees were defined: 1.1 ha for W1 and 4.5 ha for W2 (white lines in Fig. 3b and c). In order to focus on modified rather than matching areas, zero values were omitted from the evaluated density function. In other words, areas where the ADG left the input DEMsA3D unaltered were ignored, as the identical DEM was subtracted from the DSMgen to get .
The manual deadwood mapping provided all the necessary input data for the ADG, such as the treefile, the main wind direction α, its standard deviation αSD, and the root plate existence ratio. Hence, the ADG was executed to replicate the mapped scenario (scenario 0∘). Additional deadwood alignments were generated with α −90, −45, +45, and +90∘ while keeping αSD constant.
2.3 RAMMS::ROCKFALL simulations
Rockfall simulations were performed with RAMMS::ROCKFALL, a three-dimensional rockfall model based on a rigid-body approach (Leine et al., 2014, 2021). Compactible soils were integrated according to Lu et al. (2019) and Caviezel et al. (2019a). For the majority of the study area, the soil type forest with a mechanical soil strength of ME=1.8 was assumed. Together with the rock mass MΓ and the incoming rock velocity v, this ME value defines the maximum scarring depth per impact dmax according to Eq. (4).
The final dissipated energy during every soil impact is additionally dependent on the drag coefficient Cd, which is set at 1.4 for forest. Along with the soil density ρΣ, the squared velocity v, and the cross-sectional area of the penetration scar AΓ, Cd determines the acting scarring force according to Eq. (5).
Single standing trees (Lu et al., 2020) and three-dimensional cones as deadwood (Ringenbach et al., 2022b) are also included in the model. The contact detection between the convex polytope rocks and the truncated cones of the deadwood and trees is based on a separating axis test (SAT; Gottschalk et al., 1996, explained in detail by Lu et al., 2020). Energy thresholds are introduced to account for the obstacle breaking that can be observed in reality. We used the default energy threshold implemented in RAMMS::ROCKFALL for living trees from Dorren and Berger (2005) (Eq. 6), adapted by the factor m=2. This modification towards higher energies incorporates the effect of deflections and energy loss during tree impacts, even if tree breakage is expected.
For deadwood, a single threshold is derived from the reported impact energies in Sect. 2.1 and is defined per deadwood log based on its DBH as a standing tree. During an impact against an obstacle, the incoming kinetic energy of a block is compared with the threshold value. The interaction between a rock and trees–deadwood is considered a hard contact (Leine et al., 2014; Lu et al., 2019) if the rock's kinetic energy is lower than the threshold. Such a consideration prevents the rock from further penetrating the obstacle. When the rock's kinetic energy exceeds the energy threshold, the model neglects the obstacles completely for the rock propagation assessments.
We used the official swissALTI3D DEMSA3D in its initial resolution of 0.5 m (swisstopo, 2018). Roads, as depicted in Fig. 3b, with ME=75 and Cd=2.0, and the lake, with ME=0.1 and Cd=10 000, were assigned their own soil parameters.
To obtain realistic starting positions within the automated potential release area approach, we deployed a simplified slope angle distribution (SAD) analysis of the region (see blue marked areas in Fig. 3b and c). We abstained from decomposing the SAD into several Gaussian distributions representing different generalized slope classes (Loye et al., 2009) due to inconsistent results. The threshold angle was defined as the regional SAD's inflection point (43∘) as a lower bound for starting point areas. For a jitter suppression and reduction of starting points, a weighted focal analysis within a 5×5 cell focal neighborhood was performed for cells with a slope > 43∘. Only release areas that contribute to rockfall towards the deadwood area were considered. Ultimately, 378 starting points were used in W1 and 278 in W2, with an approximate distance between the starting points of 7.25 m (regular grid assumed).
One mass class of 400 kg or 0.15 m3 and two shape classes, platy and compact according to the Sneed and Folk (1958) classification, made up of perfectly symmetrical EOTA rock shapes (European Organisation for Technical Assessment, according to ETAG 027, 2013, as used in Caviezel et al., 2019b, 2021) were used for the simulations. Each rock was released with 10 different orientations, which led to a total of 7560 trajectories in W1 and 5560 trajectories in W2 for each azimuth scenario. Both deadwood states (fresh and old) for the five α-azimuth scenarios (abbreviated as, e.g., DW) were computed. Additionally, comparisons with the undisturbed original forest and with the scenario with the cleared area without trees were calculated for both areas, resulting in 24 RAMMS::ROCKFALL scenarios. RAMMS::ROCKFALL simulations for W2 for the four scenarios original forest, cleared, DW, and DW are visualized in Fig. 4 as an example. To evaluate the vast data set, the 95th percentile raster values of the kinetic energy EKIN, jump height jH, and velocity v within the colored frames in Fig. 3b and c were compared by evaluating each DEMsA3D raster cell for the given parameter. Overall changes in kinematic behavior were then deduced from this two-dimensional screening. Additionally, the deposition altitudes of the rocks were analyzed and the total reach probability (Pr) for the evaluation lines (yellow lines in Fig. 7) was calculated.
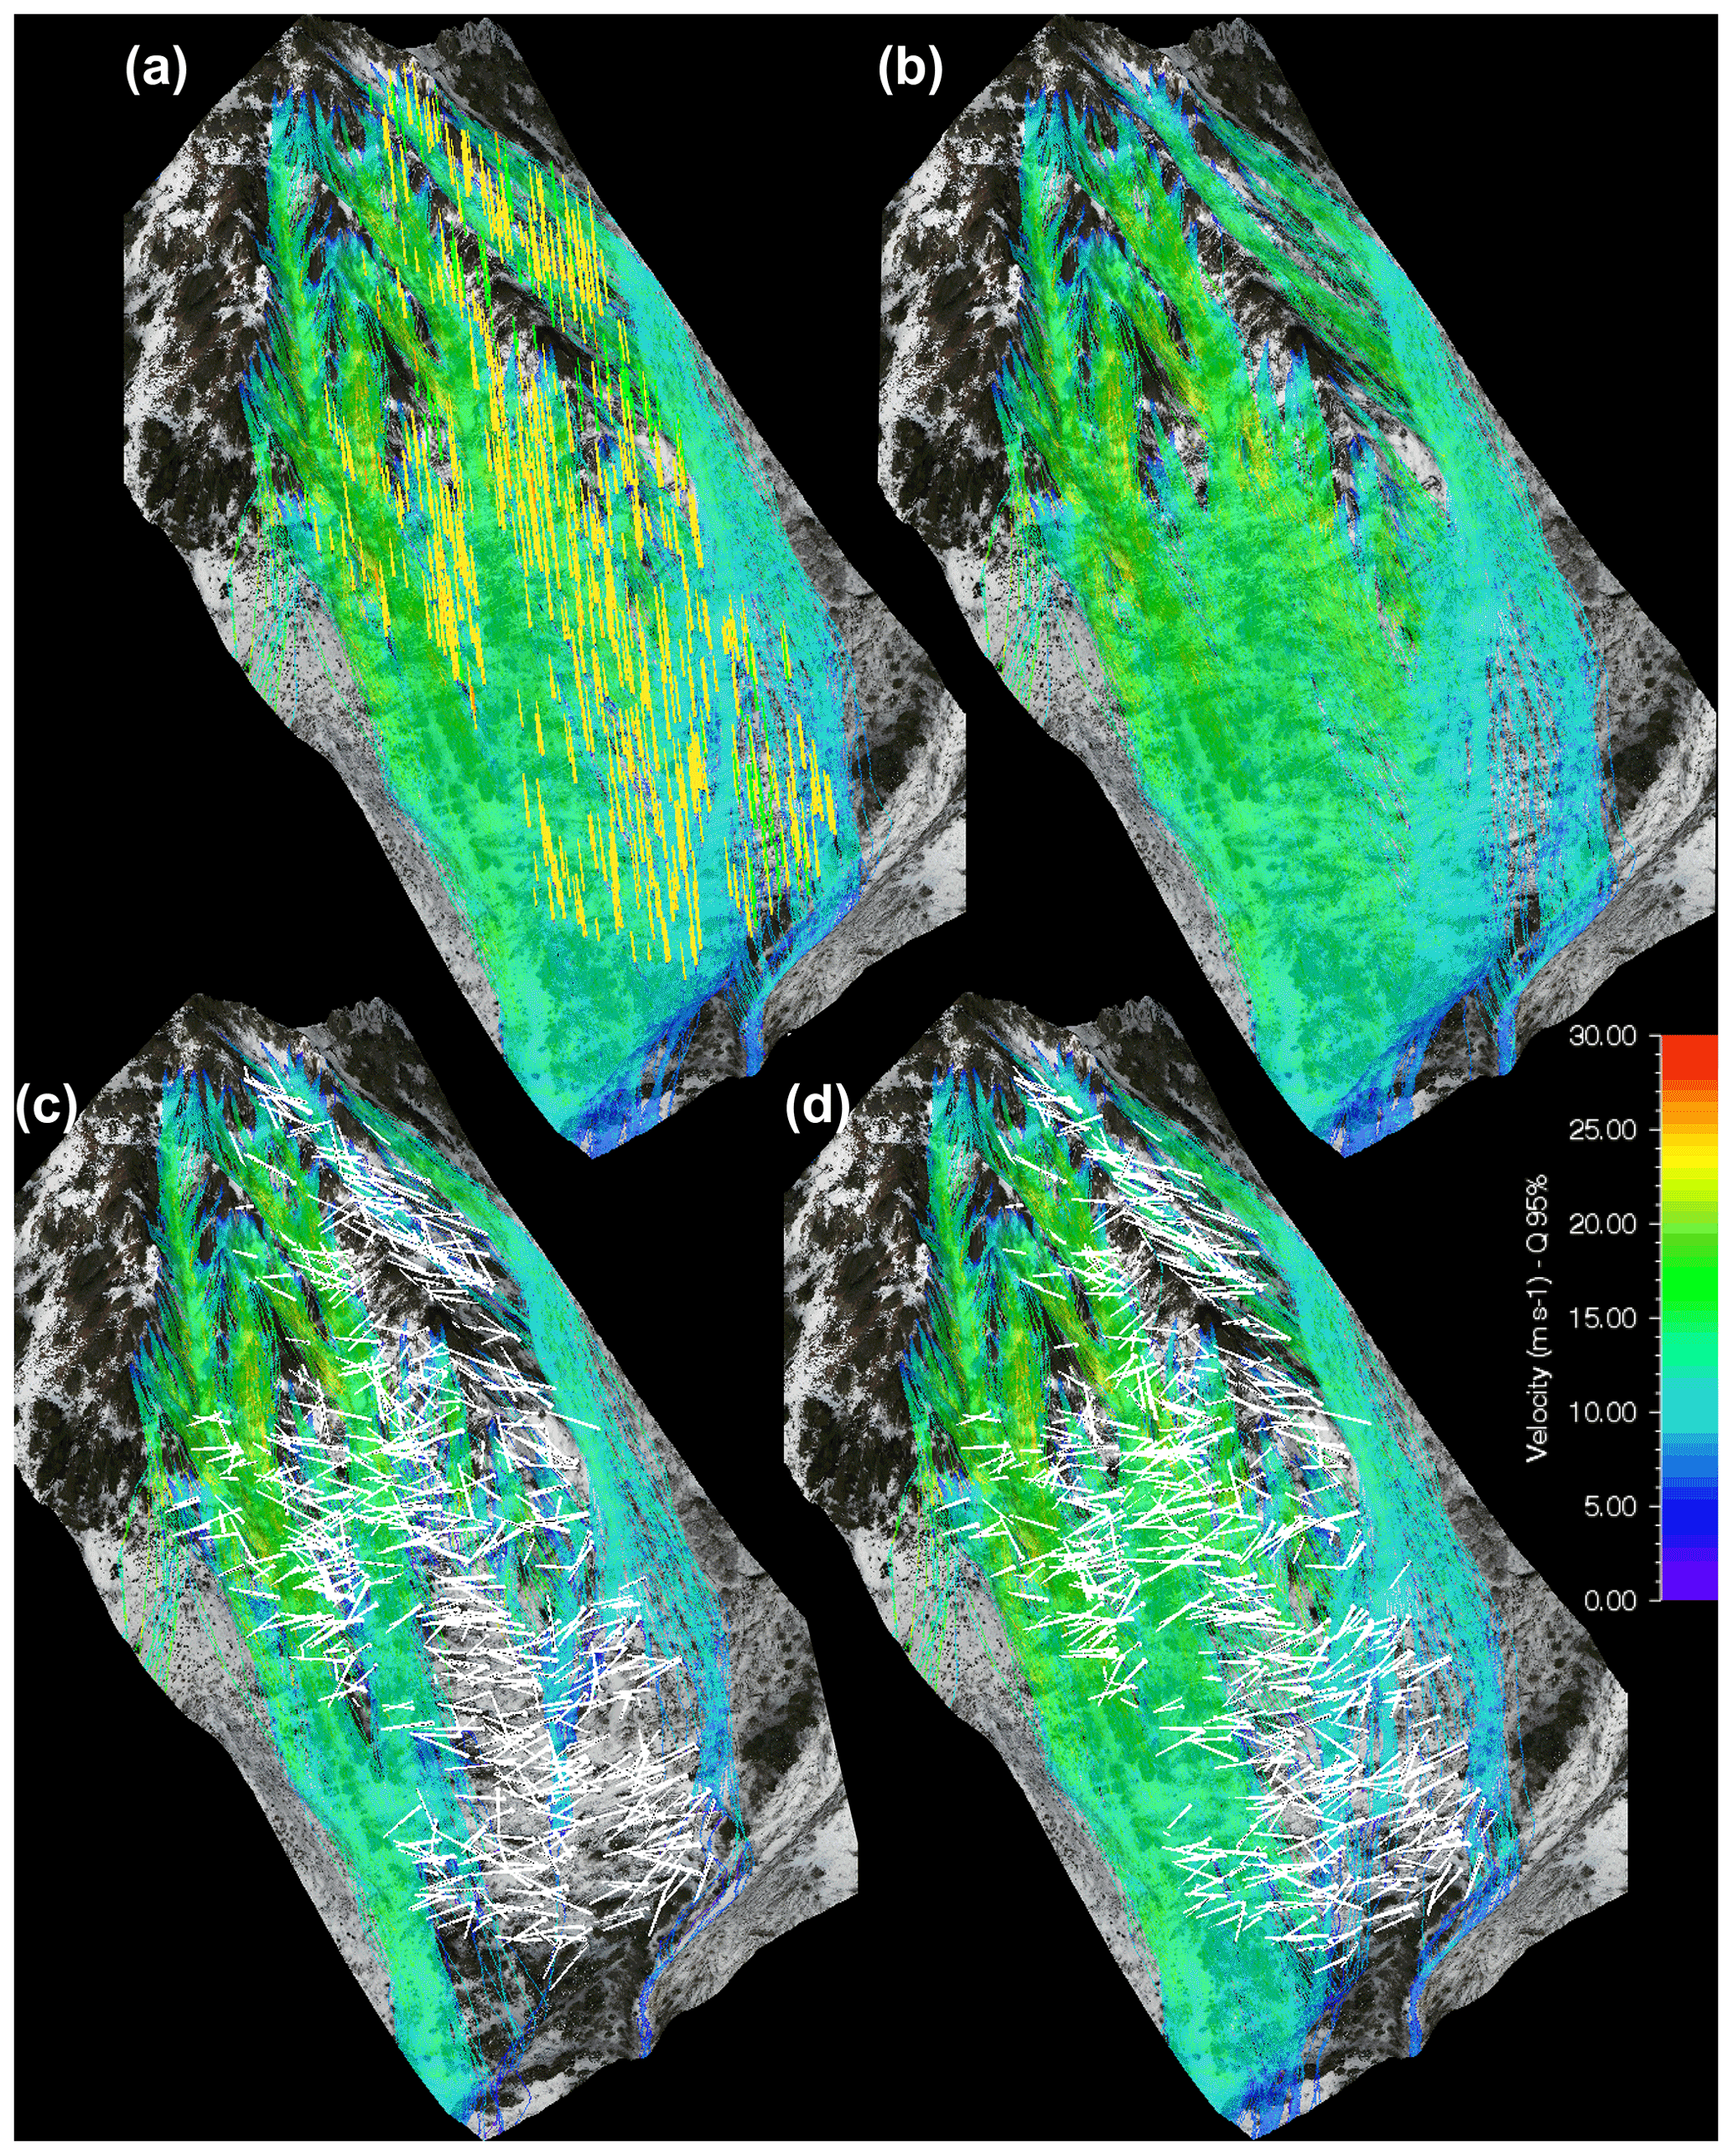
Figure 4Simulated velocities of the four main scenarios within windthrow area W2: (a) original forest, (b) cleared area, (c) the deadwood scenario with the greatest mitigation effect (DW), and (d) the corresponding DW scenario.
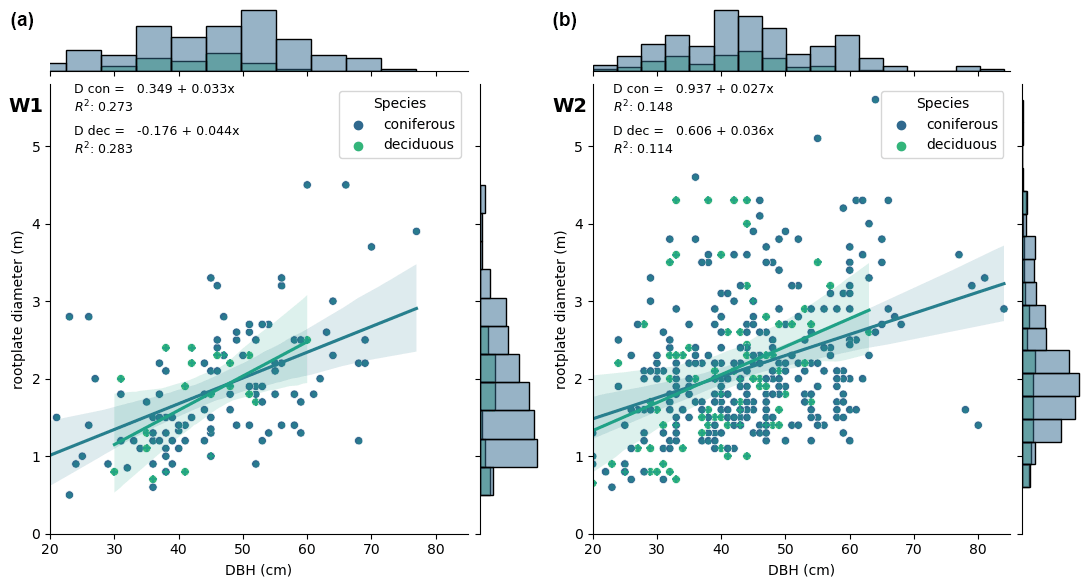
Figure 5DBH–root plate diameter ratio of the 512 lying logs with a visible overturned root plate that were mapped overall. The histograms show the distributions of coniferous and deciduous logs in different classes of DBH and root plate diameter. The ratio between coniferous and deciduous logs is in area W1 (a) and in W2 (b). Although the linear regressions between DBH and the root plate diameter have a poor descriptive value (), all the calculated slopes of the linear regressions for the two areas and two tree types are within the range of 2.7–4.4 ⋅ DBH. The regression slope is steeper for deciduous than for coniferous logs in both areas.
3.1 Mapped deadwood logs
Of the 939 manually mapped lying deadwood logs, a total of 512 trees had a visible overturned root plate: 44 % in W1 and 55 % in W2, yielding pW1=0.44 and pW2=0.55 for the applied Bernoulli distributions. Out of these logs, 411 were coniferous (W1: 111, W2: 300) and 101 deciduous (W1: 22, W2: 79). The slopes of the linear regressions between DBH and root plate diameter RPϕ in W1 and W2 for the two tree types were in the range of 0.027–0.044 ⋅ DBH, with a steeper slope for deciduous (0.036–0.044 ⋅ DBH) than for coniferous logs (0.027–0.038 ⋅ DBH) in both areas (Fig. 5). These allometric relationships are similar to the regression equation reported for root pits in the review by Robbins et al. (2014): , with R2=0.64. This review was based on a total of 676 field measurements worldwide, 70 of which were conducted in Austria, with the same tree species as in the present study except for a greater abundance of sycamore maples. The linear regression, however, has limited descriptive power (), which might be due to the presence of several large root plates formed by multiple trees and the difficulty attributing these root plate diameters to single trees. Additional inaccuracies may result from the difficulty measuring nearly vertical root plates in the orthophoto. When the values from the literature are combined with our own measurements, the assumed RP is at the lower limit of the observed correlation and does not overestimate the diameter of root plates, despite the large uncertainty. Nonetheless, a different, yet to be verified nonlinear RPϕ distribution function might be more suitable to describe the DBH–RPϕ correlation in future studies, judging by the wide variation in both our own data and the values from the literature.
Despite the proximity of W1 to W2, the measured fall directions of the deadwood differed considerably between the two areas, with main wind directions and . The topography clearly disturbed the wind systems and affected the main deadwood falling direction. In order to focus on the central part of the distribution (Fig. 6a and d), the standard deviations for the fall directions of the generated deadwood logs needed to be slightly reduced to and . This decision was based on the argument that the contributions at the extreme ends of the deviation scale are mainly due to chaotic boundary effects during the filling and stacking processes, which are not built into the ADG. In the future, the mapped deadwood data set might serve as machine learning training data, with the aim of achieving automatic deadwood log identification.

Figure 6Three descriptive indices used to compare the deadwood composition in the control areas (see Fig. 3) based on unmanned aircraft system (UAS) observations and simulated using the automatic deadwood generator (ADG). (a, d) Azimuth of the falling tree, (b, e) effective height Heff, and (c, f) vector ruggedness measure (VRM). Vertical gray lines indicate the locations of the comparisons detailed in Table 1. Values are shown for windthrow areas W1 (a–c) and W2 (d–f).
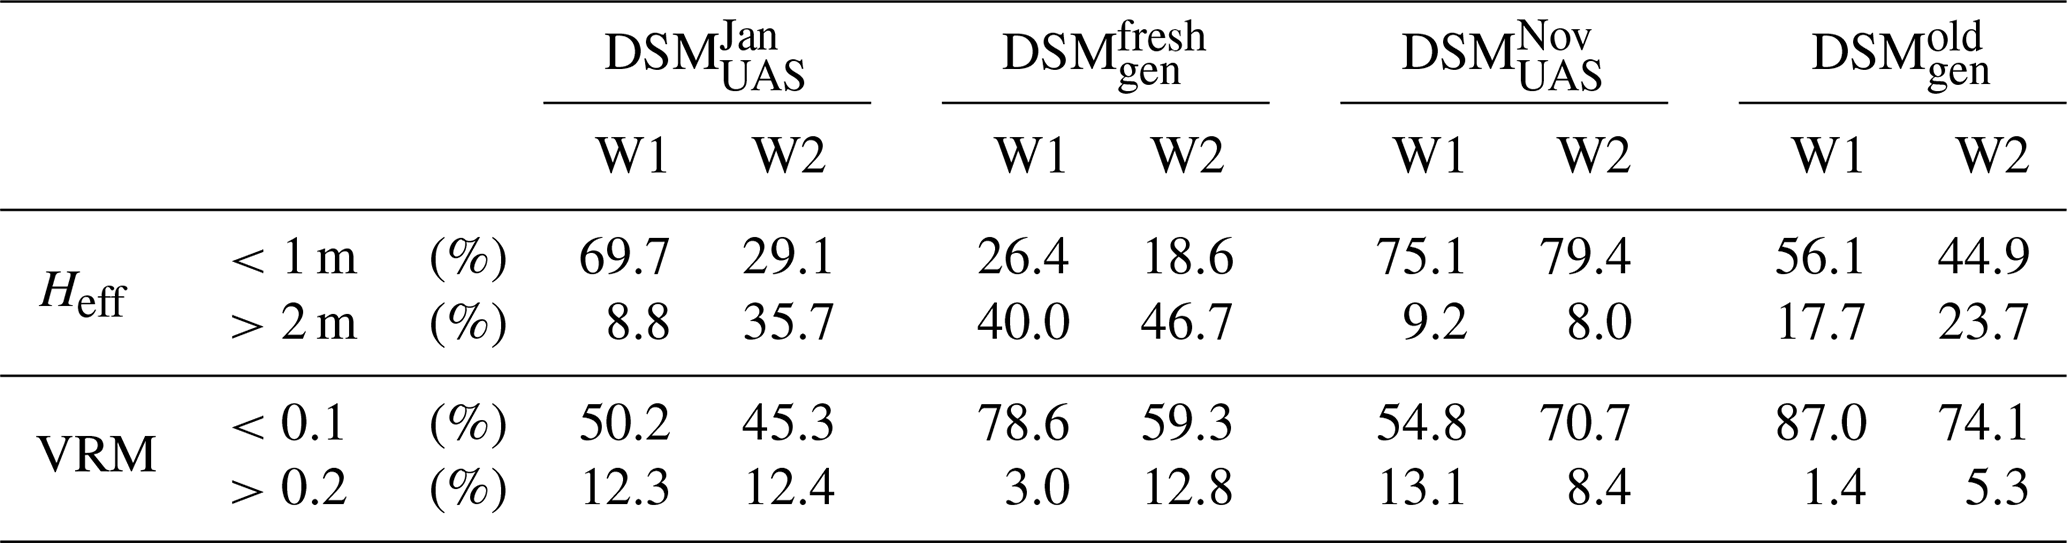
Table 1Percentages of low (Heff<1 m; VRM < 0.1) and high (Heff>2 m; VRM > 0.2) values of the two key comparison parameters, derived from the different digital elevation models for both windthrow areas W1 and W2.
3.2 Observed and generated effective heights Heff
In both areas, the observed Heff distributions deduced from the second UAS flight, DSM, show that over 75 % of all Heff values were rather low (<1 m; Fig. 6b and e, Table 1). For better readability, Heff based on a given DSM is labeled as follows.
The development of Heff over time differed between the areas W1 and W2. In W1, the percentage of low Heff values increased marginally by 5.4 %, from 69.7 % in January to 75.1 % in November 2020. In W2, the increase in this share was more pronounced at 50.4 %, from 29.1 % to 79.5 %. This trend was accompanied by an abrupt decrease by 27.7% in the amount of tall deadwood (Heff≥2 m) from 35.7 % to 8.0 %. In both areas, was more right-skewed, with generally higher Heff values, than . In W2, aligned well with the observed values, especially for values ≥2 m, as both distributions had at least 35.7 % tall deadwood. Similar agreement was not found in W1, where both and overestimated tall deadwood compared with both field observations of . While tall deadwood had a share of 40.0 % in and still made up 17.7 % of , only 8.8 % of all values were ≥2 m.
We attribute the discrepancy in the observed values ≥2 m between the two areas mainly to differences in the deadwood density. Higher densities, as in W2, are accompanied by more log stacking, which leads to greater effective heights. If the deadwood stems are too far apart, they do not become stacked and lie on the ground instead, which is associated with lower Heff values. The unification in observed with the second UAS flight mission is most likely due to the slight deadwood compaction in W1 and the extensive clearing in W2. The reduction between and confirms the expected influence of the minimum deadwood height Hmin on the resulting Heff, making it a decisive variable. With a resulting lying deadwood density of 363 logs per hectare (Bebi et al., 2015), the windthrow event, from which the default Hmin used in this study was adapted, exhibited an even higher deadwood density than observed here for W2. This explains the observed Heff overestimation in both areas. If forests with lower windthrow densities are modeled in the future, the Hmin variable should be modified and reduced.
3.3 Roughness evaluation based on a VRM comparison
Similar to the naming of the effective heights, the vector ruggedness measures are abbreviated based on their origin from the different DSMs.
Within W1, the density distributions of and remained nearly unchanged from January to November 2020 (Fig. 6c and Table 1). Only a peak shift in VRM from 0.07 to 0.06 was visible. In contrast, in W2 the two VUAS distributions differed distinctly: the initial bimodal distribution pattern of changed into the left-skewed pattern of . This effect can be explained by the removal of deadwood in W2 between the two DSM acquisition dates and is in line with the findings of Brožová et al. (2021) that deadwood increases the VRM. The deviations to the slightly higher deadwood VRM values (VRM = 0.17–0.30) can be explained by a different DSM resolution (1.0 m) and a larger moving window size (49 m2), and it matches the presented sensitivity analysis. The influence of the stand parameters in the windthrown Norway spruce–European larch forest cannot be assessed, since the study did not provide the deadwood density. In W1, both ADG-based DSMs were smoother than their corresponding UAS-based DSMs, as and underestimated high VRM values in comparison to their UAS counterparts (Table 1). In contrast, the generated VRM values in W2 were closer to the observed ones. In W1, the ADG-based underestimated the VRM in general compared with the UAS-derived , as low VRM values were overrepresented (78.6 % vs. 50.2 %) and high VRM values were underrepresented (3.0 %, vs. 12.3 %; Table 1). Ratios even farther apart were observed for and .
Three issues presumably play a central role in these discrepancies: (1) the simplified deadwood representation in DSMgen, which considers neither branches nor large stem diameters, is sufficient to represent the stacking effect but has shortcomings when assessing VRM in detail. (2) The harmonization of input data of varying quality can have a negative effect: despite the resampling to 0.2 m, there might be a difference in the level of detail between the coarsened DSM and the upsampled DEMsA3D – used as the basis for DSMgen – within the moving window size of 6 m2. (3) The lower the deadwood density, the more pronounced the effects of (1) and (2). We attribute the better match in W2 to the higher deadwood density in that area.
3.4 Deadwood influence on simulated rockfall dynamics
In both W1 and W2, the presence of deadwood resulted in a significant reduction in the area affected by rockfall (Fig. 7).
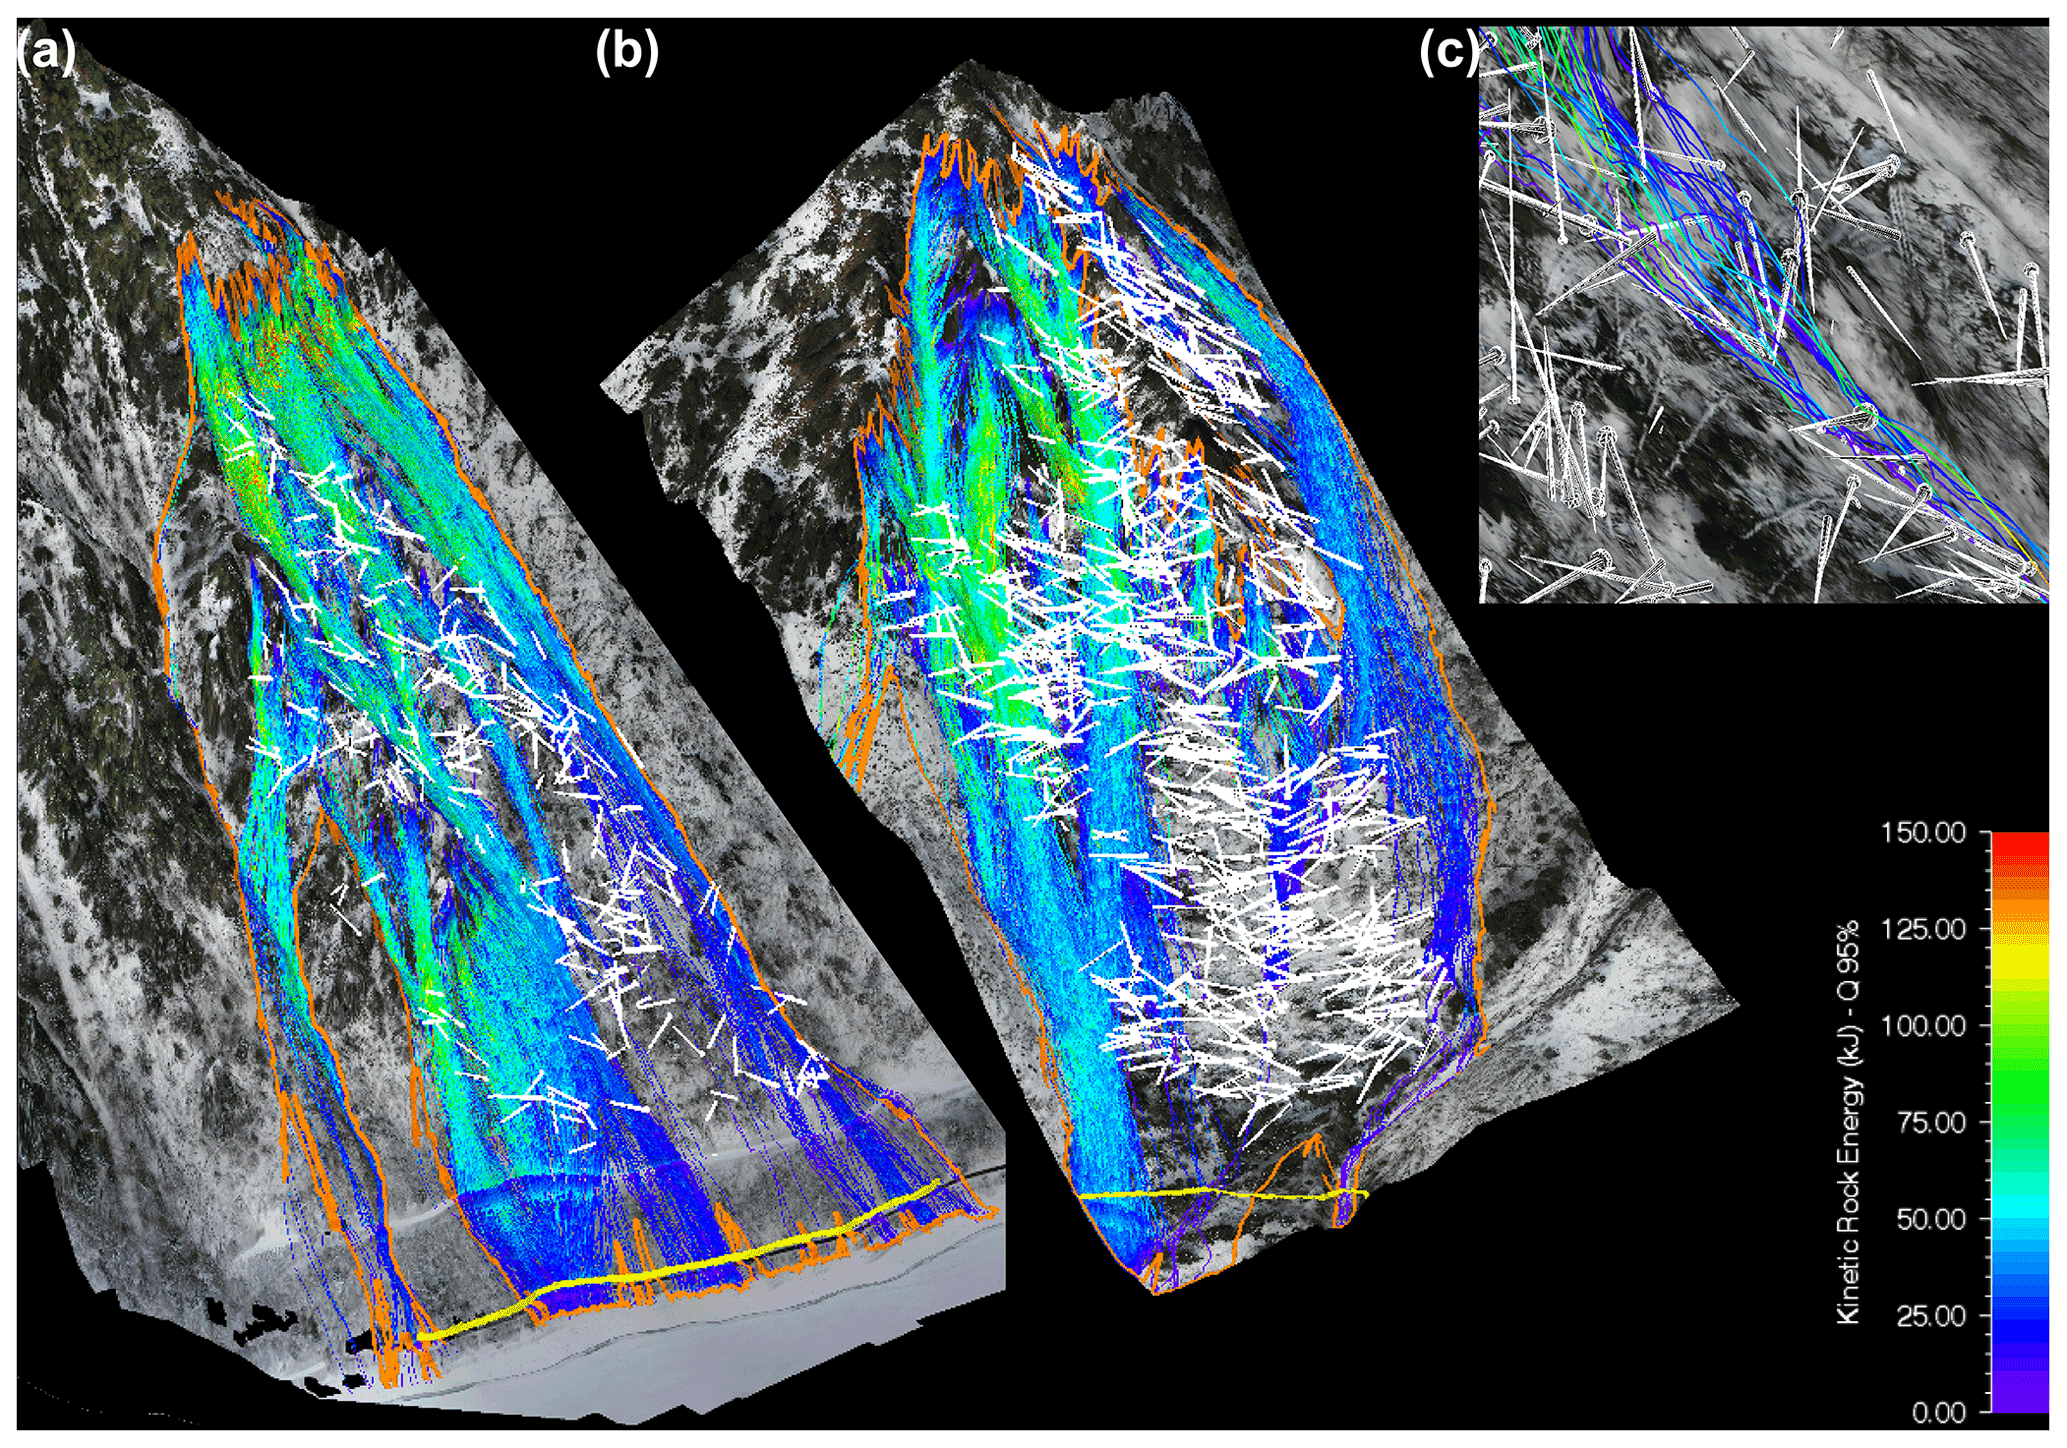
Figure 7Simulated kinetic rockfall energy for the deadwood scenario with the greatest mitigation effect (rainbow-colored area) compared with the cleared scenario (area outlined in orange). (a) Windthrow area W1 with DW and (b) windthrow area W2 with DW. The rockfall reach probability evaluation line is plotted in yellow. (c) Close-up of a subset of simulated trajectories visualized three-dimensionally, showing interactions with the uprooted, stacked deadwood logs and root plates.
To quantify the capacity of deadwood to stop rockfall, the total rockfall reach probabilities Pr at given evaluation levels (yellow lines in Fig. 7) were calculated (Table 2). The relative reduction in Pr () of the disturbed and undisturbed forest with respect to the cleared, no forest scenario serves as a generalized reduction performance index. In both areas the two deadwood states, fresh and old, obstructed more rocks than in the original, pre-windthrow forest, while the cleared scenario obstructed the fewest rocks. While the of the original forest was similar in the two areas, the mitigation effect of the deadwood was greater in W2, especially for fresh but also for old deadwood. The greatest mitigation effects were observed for DW in W1, with only 13.7 % of the rocks reaching the evaluation level, and for DW in W2, with 11.5 %. While under cleared conditions, with Pr(W1)=55.0 % and Pr(W2)=90.7 %, up to 9 out of 10 released rocks reached the base of the slope, the for the best-performing deadwood scenarios indicated that 75.1 % of those rocks were retained in W1 and even 87.3 % in W2. The elevations of the deposited rocks along the slope were evaluated to gather further insights into the deposition patterns (Fig. 8a and b). While W1 featured a rather uniform deposition pattern along the slope, in W2 the rocks were particularly deposited at 1300–1260 m and 1240–1140 m a.s.l. for the better-performing deadwood scenarios. The direction of fall of the deadwood logs thus has a certain influence on the rockfall retention capacity, as depositions at these elevations are only visible for the better-performing scenarios. The absence of these features in certain deadwood alignments is additional proof of the relevance of the direction of fall in the ADG.
Table 2Total reach probabilities Pr along the evaluation lines (see Fig. 7) for the scenarios original (ORG), cleared (CLR), fresh deadwood, and old deadwood. The relative Pr reduction () compared to the cleared scenario is also given. The values of the best-performing scenarios are highlighted (bold).

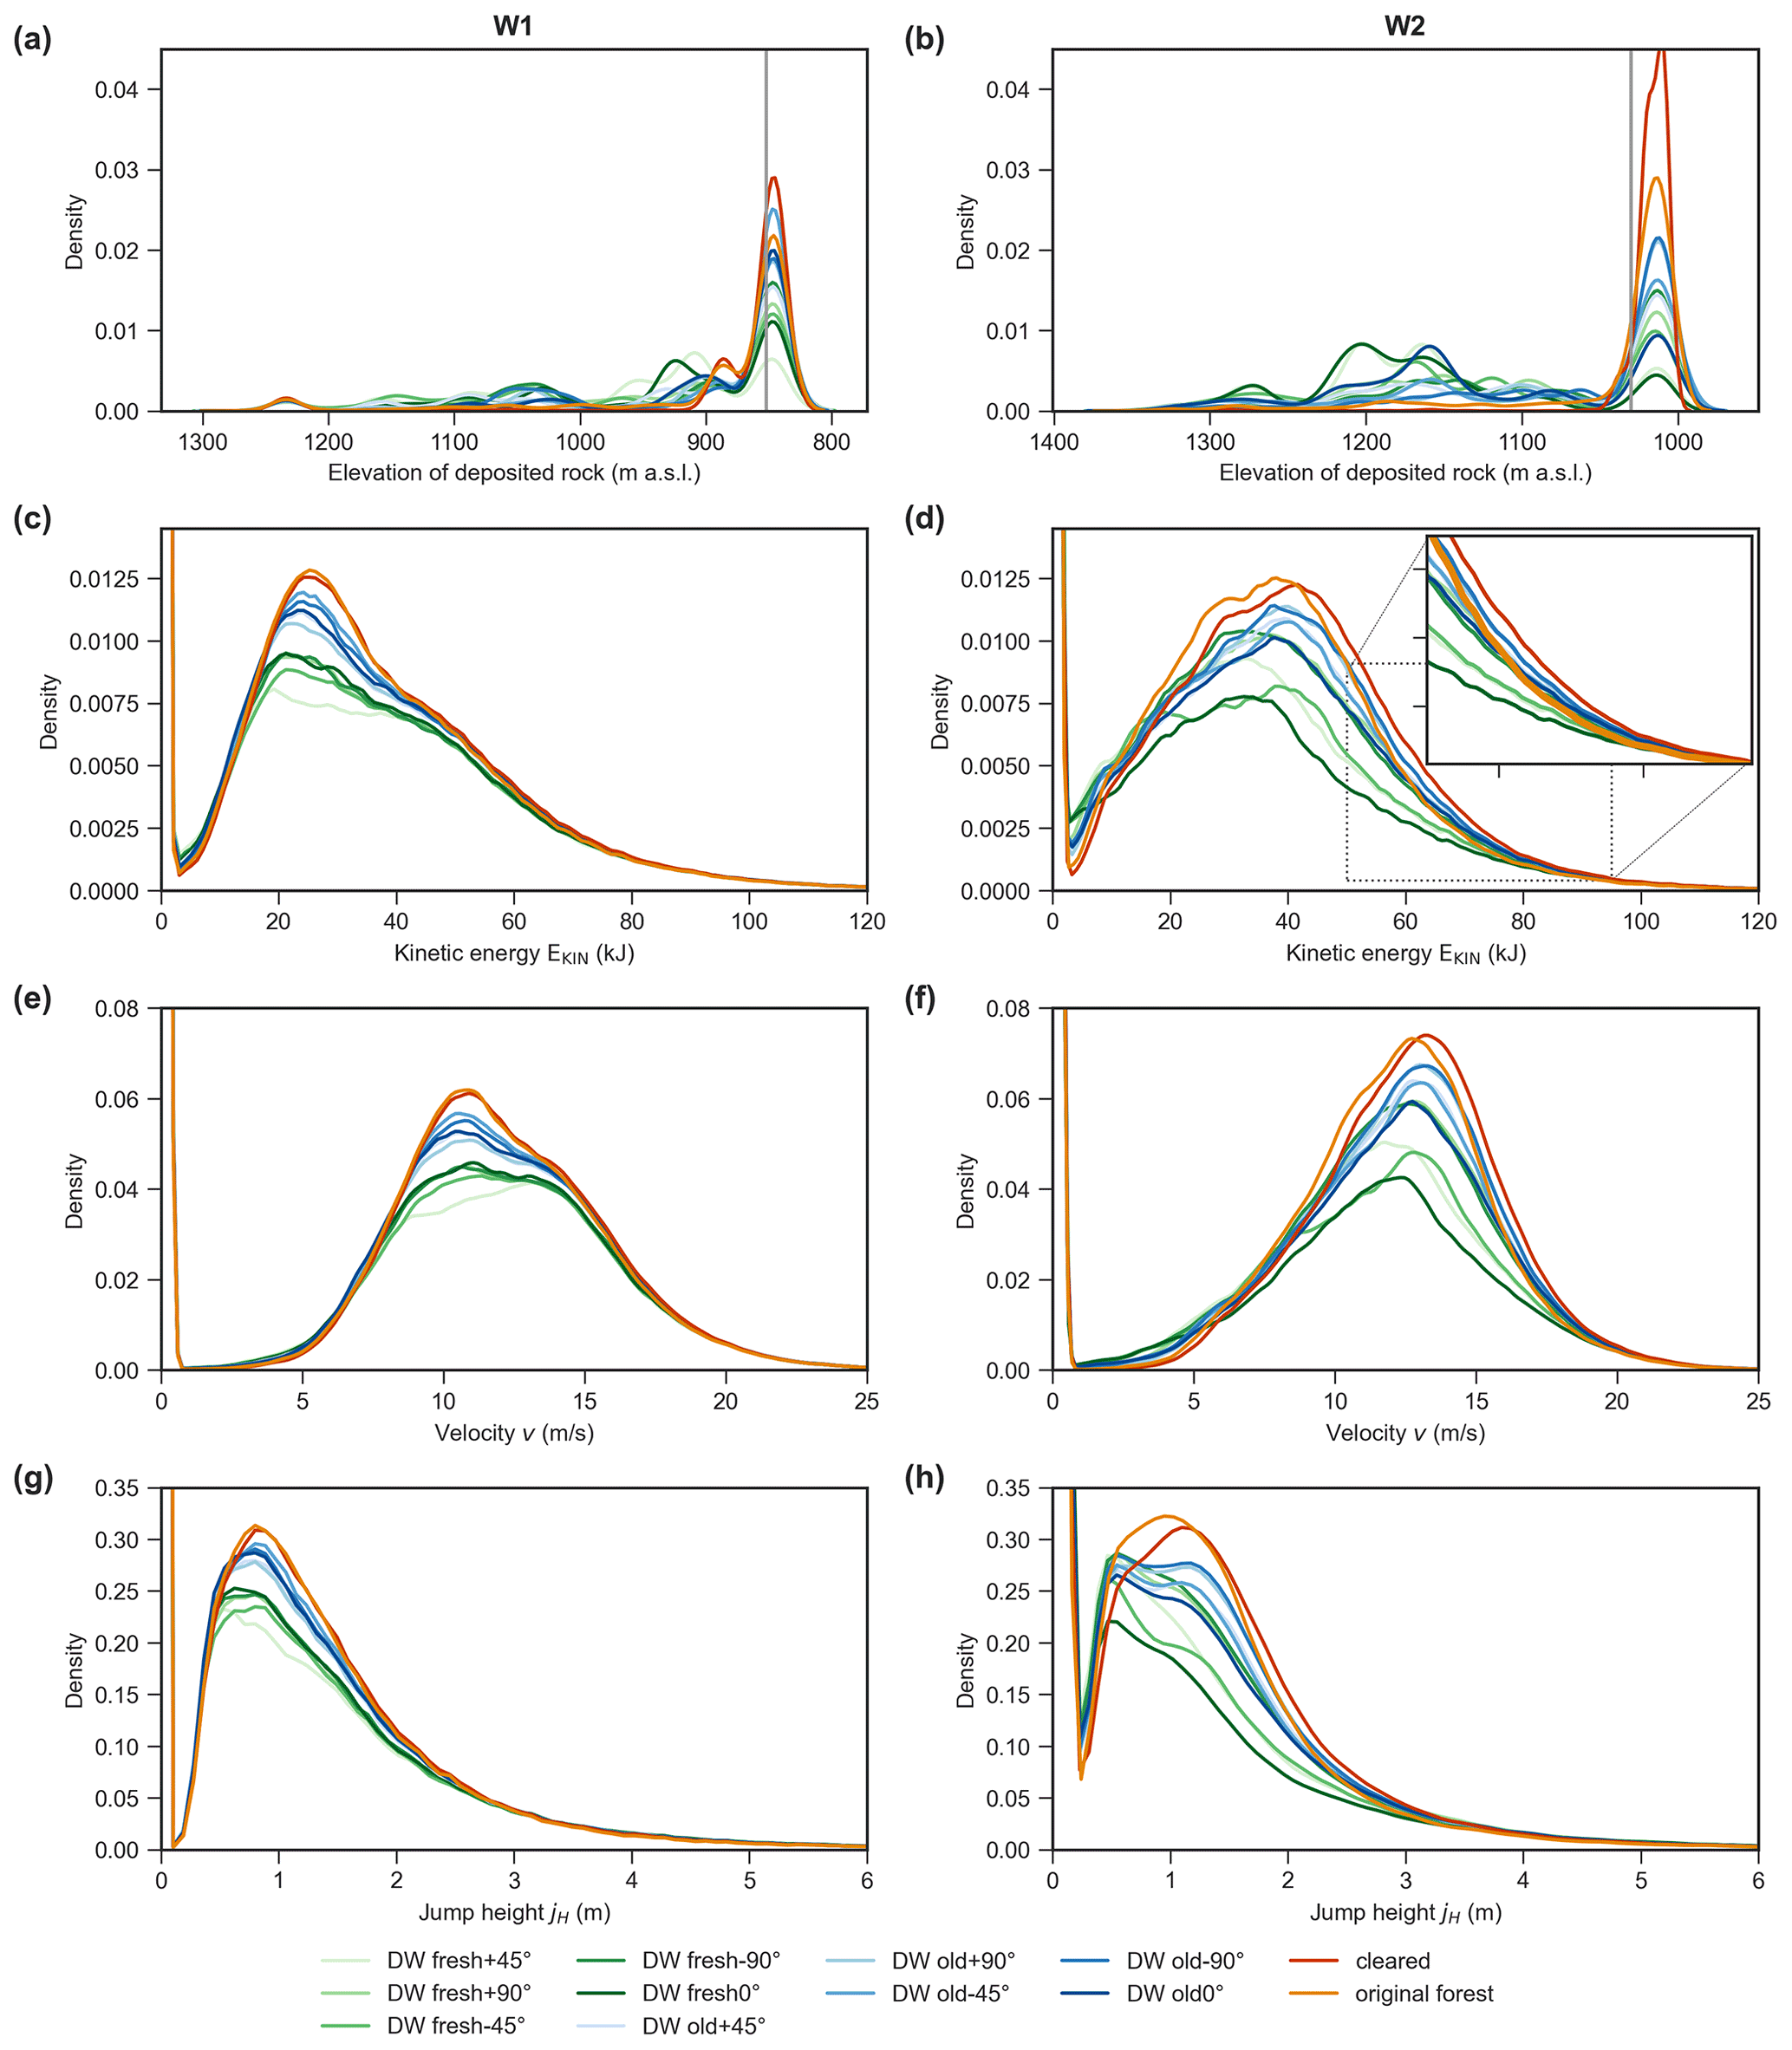
Figure 8Rockfall simulation results for windthrow areas W1 (left column a, c, e, g) and W2 (right column b, d, f, h) summarized in kernel density estimate plots. Comparisons among scenarios are given according to the elevation (m a.s.l.) of the rock deposition points (a, b), distribution of kinetic energy (c, d), velocity (e, f), and jump height within the colored frames in Fig. 3b and c. The zero point density overshoot in (c)–(h) arises from unimpaired raster cells within the evaluation areas, i.e., where no rockfall trajectory passes through. An exclusion would distort the differences between the scenarios since different numbers of raster cells are involved.
The kinetic energy, translational velocity, and jump height plots (Fig. 8c–h) all feature a density overshoot at the zero point. This arises from raster cells without rockfall trajectories passing through them. Their exclusion would introduce distortions between the scenarios, as a different number of cells is affected in each simulation. All these kernel density plots are characterized by the same general pattern: the intermediate value range of each parameter of interest is diminished, generally in the scenario order cleared, original, old deadwood, and fresh deadwood, with some subtle differences. The extreme parts of the parameter ranges are hardly affected by scenario choice. Differences between the original and old–fresh deadwood scenarios are governed mainly by two opposing trends: a lower impact probability of standing, living trees with a higher energy threshold vs. a higher impact probability but with a lower energy threshold in the presence of lying deadwood. This is illustrated well in the inset of Fig. 8d. While at low energies the original forest scenario is superior only to the cleared scenario in terms of mitigation effect, the effectiveness of the original forest relative to other scenarios increases at higher total kinetic energies EKIN until it finally becomes the superior state at EKIN>85–90 kJ. This transition fits the expected maximum energy absorption of 84 kJ well for a fresh Norway spruce deadwood log with a diameter of 67 cm (Ammann, 2006), which corresponds to the 99th DBH percentile in the observed mountain forest. In contrast, an equivalent living tree has an expected EKIN absorption of up to 618 kJ (Dorren and Berger, 2005). In order to assess the aged deadwood configuration, the same log is assigned a maximum kinetic energy absorption of 46 to 9 kJ, depending on Fomitopsis pinicola occurrence (Ammann, 2006). The comparison between old and cleared scenarios highlights the fact that the mitigation potential does not solely rely on the maximum possible deadwood energy absorption but rather involves additional complexity: DWold configurations generally feature greater mitigation effects by up to ∼55 kJ compared with the original forest. The reduction in the number of such high-energy grid cells is most likely due to stopping processes further up-slope at lower velocities, preventing many trajectories from reaching high-energy regimes. We omitted analysis of the model parameters ME and Cd, as it has been shown in previous studies that parameter values within a reasonable range yield stable results (Ringenbach et al., 2022b).
3.5 Linking rockfall mitigation to forest management
Our study confirms that deadwood plays a significant role in reducing the risk of rockfall during the first years after a windthrow event. It equally illustrates the complexity of the underlying processes and management of deadwood after such events. How the protective effect of deadwood develops over longer periods and is complemented by early successional stages of post-disturbance forests should be investigated in additional studies. Experiments and models considering more advanced stages of wood decay after disturbances and systematic observations of secondary rockfall releases behind decaying wood would be particularly valuable. Long-term observations and modeling of snow avalanches after natural disturbances suggest that the protective effect reaches a minimum at 10–15 years, followed by an increase due to the combined effect of post-disturbance regeneration and the remaining terrain roughness created by deadwood (Caduff et al., 2022). However, this effect may vary strongly according to site conditions, the initial stand structure, and species composition of a forest before the disturbance, as well as external management factors, such as partial removal of deadwood, planting of additional trees, or browsing (Bebi et al., 2015; Brožová et al., 2021; Caduff et al., 2022). An ADG that considers the initial stand structure of a forest, as well as other relevant drivers of post-disturbance development, may serve as a valuable tool to develop spatially explicit and locally adapted long-term scenarios of protection against rockfall after different disturbances and under different management scenarios. Especially with the advent of area-wide lidar data, initial forest conditions are being mapped more effectively, and more reliable outputs can thus be expected.
Our modeling results indicate a predominately positive effect of deadwood after a windthrow event without salvage logging for rock energies ≤ 85 kJ derived from rock masses of 400 kg. Due to the prevailing steep terrain in the study area, larger rock masses would result in higher rock energies and thus a lower expected influence of deadwood. In addition to the medium-term rockfall protection studied here, advanced decay stages of deadwood can be beneficial. They support biodiversity, in particular of saproxylic organisms (Lachat et al., 2013; Sandström et al., 2019), improve biogeochemical cycles and edaphic conditions, provide favorable conditions for tree regeneration, and result in greater heterogeneity and functional resilience at different spatial scales (Bače et al., 2012; Shorohova and Kapitsa, 2015; Kulakowski et al., 2017). For the conservation of saproxylic biodiversity, Lachat et al. (2013) recommend – based on a literature review – deadwood densities ≥ 30 m3 ha−1 for mixed mountain forests, but they highlight the fact that certain saproxylic species are only found with deadwood densities ≥ 100 m3 ha−1. While the windthrow area W1 meets this general recommendation, an opportunity was missed in W2 to leave habitat for more demanding saproxylic species and enhance, at the same time, the protective function against natural hazards, at least during the first few years after the disturbance. An integral view of the effects of deadwood would not be complete, however, without considering potential risks associated with leaving deadwood after natural disturbances, including subsequent bark beetle infestations (Stadelmann et al., 2014) and the secondary triggering of rockfall after advanced wood decay. Such risks highlight the need for caution in making general recommendations for deadwood management in protection forests and the need for further long-term studies. Nevertheless, our results provide additional evidence and arguments for leaving deadwood after natural disturbances in forests with a protective function against rockfall.
While the main programming focus here was on realistic geometric deadwood patterns, the two-step decay function could be expanded further in the future. Different decay rates due to different tree species, elevation (temperature), exposure, and slope (soil moisture), collected within the framework of national forest inventories (Hararuk et al., 2020), could be used to interpolate between the two impact-breaking energy states of fresh and roughly 10-year-old deadwood considered here (Ammann, 2006) and could serve to close the gap for simulations from a few decades after the disturbance up to the point when new post-disturbance trees dominate the forest.
In principle, the ADG could also be used for modeling rockfall in the context of other natural disturbances, such as bark beetle infestations and forest fires, with certain adaptations. In the case of a bark beetle infestation, considerably fewer root plates are expected, and the rot fungi ratio might be reduced if there are more persistent snags compared with lying deadwood. However, the actual fall direction α′ is not easily obtained, as it requires continuous monitoring as the process occurs over several years or even decades (Kupferschmid Albisetti et al., 2003; Caduff et al., 2022). Nonetheless, due to the presence of many snags, slope-parallel deadwood trunk arrangements are to be expected and could be used in an ADG scenario. Similar processes as for bark beetle infestations are expected for forest fire intensities with low severity and resulting in lying and standing charred trees. Together with future experimental studies to determine the necessary adjustment to the maximum energy absorption threshold, the ADG could be used to refine initial simulation results (Maringer et al., 2016). After forest fires of high severity, the amount of woody debris is strongly reduced, and rockfall simulations after such fires may even assume the cleared condition (Maringer et al., 2016). In addition, the DSMgen used here as an intermediate product only could serve as input for avalanche simulations (Brožová et al., 2021) and for the identification of their release areas in forested terrain (Bühler et al., 2018, 2022). Extending the ADG to other disturbance regimes and including additional time steps of deadwood protective effects would thus provide a more comprehensive basis for optimized deadwood management in forests with a protection function against rockfall.
3.6 Sampling ADG input
Meaningful input parameter sampling is essential if the ADG is to be used for further rockfall assessments after large windthrow events. The ADG requires a DEM, for which the accuracy and significance with respect to reality depend on the acquisition date and processing procedure. In addition, the input parameters of the ADG can be sampled via field excursions and orthophoto investigations. The treefile, another necessary input, can either be meticulously reconstructed on-site or generated inside RAMMS::ROCKFALL with the required forest stand information. The windthrow and root plate ratios are based on visual inspection and/or rely on previous studies. The question arises as to how many deadwood logs N need to be assessed for a robust estimate of the mean tree fall direction and its standard deviation. The different mean tree fall scenarios per deadwood state differed less in W1 than in W2 in our study (Fig. 8). The smaller influence of log orientation in W1 has two possible explanations: (a) the overall SD was larger in W1, which reduced the influence of the main fall direction, or (b) the overall deadwood density was lower in W1. The general statistical rule that a population with a larger SD requires a larger sample size should be questioned, as – based on these results – a larger margin of error e for a larger (assumed) SD is acceptable. The necessary sample size N for an assumed confidence interval of 95 % with a z score of 1.96 can be calculated according to Eq. (7), in which an infinite number of deadwood logs is assumed.
For example, a sample size of 40 logs and the SD from W1 (48.2) lead to an estimation of the main wind direction that is ±15∘ from the effective wind direction. Ideally, the general deadwood density and DBH distribution are assessed according to pre-storm data. If the DBH values are also assessed from the sample, the sample size has to be adapted accordingly.
Even if quasi-on-site measurements for input parameters are available – for example, the wind data in this study came from a ridge roughly 4.5 km away from the windthrow areas – local effects dominate the boundary conditions. Specifically, the recorded half-hourly averaged wind directions show an exclusively easterly direction (∘; Fig. 2b). In contrast, the mapped mean fall direction suggests local northerly (∘) and north-northeasterly winds (∘). Such major directional differences of 93∘ in W1 and 74∘ in W2 should not be neglected, as applying the IMIS station wind direction would lead to a reduction in of 14 %–33 % (Table 2).
The numerical rockfall simulations presented here, taking two natural deadwood log configurations after a storm event into account, highlight the influence of lying deadwood on rockfall events with rock masses of 400 kg resulting in energies < 85 kJ: run-out distances and affected areas were reduced considerably. Fresh deadwood was found to have the greatest stopping capacity. The simulations further indicate that even stacked 10-year-old deadwood has a higher protective capacity than the pre-storm forest stand. This is a surprising result, and it suggests that nature-based protection solutions against natural hazards may continue to gain importance in the overall economic, logistic, and ecological context. This might be accentuated if probabilistic approaches, including frequent but small rock sizes, become a new standard in rockfall hazard assessments.
In windthrow areas, stacked deadwood logs and uprooted root plates are frequently observed. The stacking effect is reproduced in the presented ADG by varying the fall direction of the trees, sampling from a normal distribution around the mean wind direction, and considering its standard deviation. Aging effects are incorporated via compaction and a reduction of the maximum absorbed kinetic energy. The created log pattern, its effective height above ground, and the added surface roughness due to the deadwood are validated with UAS-based field survey data. However, the compaction state depends on the deadwood density and needs to be adapted according to the respective observed or expected prevalent deadwood conditions.
The incorporation of realistic deadwood configurations into rockfall simulation models helps to address urgent questions arising in forestry practice. Automated procedures have been introduced to ease the specification of deadwood location and stacking configuration at the slope scale. The ADG approach presented here could serve as an effective tool in a post-event analysis. Specifically, it could be used to determine the amount of lying deadwood that is needed to replace the protective effect of the pre-storm forest, and, more importantly, it could facilitate the quantitative benchmarking of different silvicultural measures. Better fusion of modeling know-how, experimental knowledge of the deadwood stopping capacity and aging effects, and climate models would lead to more accurate forecasts of the future protective capacity of forests. For this, a future detailed calibration experiment is desirable, including higher energies than considered in previous studies and thus including the fracturing of deadwood.
The ADG script, the applied orthophoto, and the mapped trees are publicly available in the EnviDat repository: https://doi.org/10.16904/envidat.357 (Ringenbach et al., 2022a).
AdR conceived and developed the automatic deadwood generator based on the ADG–RAMMS interface and the introduced deadwood energy threshold defined by MC. YB and AS collected the UAS data. AdR digitized the UAS data, executed rockfall simulations, evaluated the data set, and wrote the initial paper draft, which was reviewed and edited by AC, PBe, AnR, PBa, and YB.
The contact author has declared that none of the authors has any competing interests.
Publisher's note: Copernicus Publications remains neutral with regard to jurisdictional claims in published maps and institutional affiliations.
This research was partially funded by the National Research Program “Sustainable Economy: resource-friendly, future-oriented, innovative” (NRP 73) of the Swiss National Science Foundation (grant number 407340-172399) and is part of the WSL research program Climate Change Impacts on Alpine Mass Movements (CCAMM). We thank the Forest and Natural Hazards Division of Canton Glarus for their collaboration and Melissa Dawes for the detailed proofreading of an earlier version of the paper.
This research has been supported by the Schweizerischer Nationalfonds zur Förderung der Wissenschaftlichen Forschung (grant no. 407340-172399) within the framework of the National Research Program “Sustainable Economy: resource-friendly, future-oriented, innovative” (NRP 73) (grant no. 407340-172399).
This paper was edited by Orencio Duran Vinent and reviewed by two anonymous referees.
Ammann, M.: Schutzwirkung abgestorbener Bäume gegen Naturgefahren, Eidg. Forschungsanstalt für Wald Schnee und Landschaft WSL, Birmensdorf, https://www.dora.lib4ri.ch/wsl/ islandora/object/wsl:10347 (last access: 14 December 2022), 2006. a, b, c, d, e
Bače, R., Svoboda, M., Pouska, V., Janda, P., and Červenka, J.: Natural regeneration in Central-European subalpine spruce forests: Which logs are suitable for seedling recruitment?, Forest Ecol. Manage., 266, 254–262, https://doi.org/10.1016/j.foreco.2011.11.025, 2012. a
Bebi, P., Putallaz, J.-M., Fankhauser, M., Schmid, U., Schwitter, R., and Gerber, W.: Die Schutzfunktion in Windwurfflächen, Schweiz. Z. Forstwesen, 166, 168–176, https://doi.org/10.3188/szf.2015.0168, 2015. a, b, c, d, e
Bourrier, F., Dorren, L. K. A., and Berger, F.: Full Scale Field Tests On Rockfall Impacting Trees Felled Transverse To The Slope, in: Conference proceedings/12th Congress Interpraevent, edited by: Koboltschnig, G. and Huebl, J., International Research Society INTERPRAEVENT, Klagenfurt, 643–650, http://www.interpraevent.at/palm-cms/upload_files/Publikationen/Tagungsbeitraege/2012_2_643.pdf (last access: 14 December 2022), 2012. a
Brožová, N., Baggio, T., D'Agostino, V., Bühler, Y., and Bebi, P.: Multiscale analysis of surface roughness for the improvement of natural hazard modelling, Nat. Hazards Earth Syst. Sci., 21, 3539–3562, https://doi.org/10.5194/nhess-21-3539-2021, 2021. a, b, c
Bühler, Y., Adams, M. S., Bösch, R., and Stoffel, A.: Mapping snow depth in alpine terrain with unmanned aerial systems (UASs): potential and limitations, The Cryosphere, 10, 1075–1088, https://doi.org/10.5194/tc-10-1075-2016, 2016. a
Bühler, Y., von Rickenbach, D., Stoffel, A., Margreth, S., Stoffel, L., and Christen, M.: Automated snow avalanche release area delineation – validation of existing algorithms and proposition of a new object-based approach for large-scale hazard indication mapping, Nat. Hazards Earth Syst. Sci., 18, 3235–3251, https://doi.org/10.5194/nhess-18-3235-2018, 2018. a
Bühler, Y., Bebi, P., Christen, M., Margreth, S., Stoffel, L., Stoffel, A., Marty, C., Schmucki, G., Caviezel, A., Kühne, R., Wohlwend, S., and Bartelt, P.: Automated avalanche hazard indication mapping on a statewide scale, Nat. Hazards Earth Syst. Sci., 22, 1825–1843, https://doi.org/10.5194/nhess-22-1825-2022, 2022. a
Caduff, M. E., Brožová, N., Kupferschmid, A. D., Krumm, F., and Bebi, P.: How large-scale bark beetle infestations influence the protective effects of forest stands against avalanches: A case study in the Swiss Alps, Foerst Ecol. Manage., 514, 120201, https://doi.org/10.1016/j.foreco.2022.120201, 2022. a, b, c, d
Catto, J. L., Ackerley, D., Booth, J. F., Champion, A. J., Colle, B. A., Pfahl, S., Pinto, J. G., Quinting, J. F., and Seiler, C.: The Future of Midlatitude Cyclones, Curr. Clim. Change Rep., 5, 407–420, https://doi.org/10.1007/s40641-019-00149-4, 2019. a
Caviezel, A., Lu, G., Demmel, S. E., Ringenbach, A., Bühler, Y., Christen, M., and Bartelt, P.: RAMMS::ROCKFALL – a modern 3-dimensional simulation tool calibrated on real world data, in: vol. 19-223, 53rd US rock mechanics/geomechanics symposium, American Rock Mechanics Association, https://www.dora.lib4ri.ch/wsl/islandora/object/wsl:22147 (last access: 14 December 2022), 2019a. a
Caviezel, A., Demmel, S. E., Ringenbach, A., Bühler, Y., Lu, G., Christen, M., Dinneen, C. E., Eberhard, L. A., von Rickenbach, D., and Bartelt, P.: Reconstruction of four-dimensional rockfall trajectories using remote sensing and rock-based accelerometers and gyroscopes, Earth Surf. Dynam., 7, 199–210, https://doi.org/10.5194/esurf-7-199-2019, 2019b. a
Caviezel, A., Ringenbach, A., Demmel, S. E., Dinneen, C. E., Krebs, N., Bühler, Y., Christen, M., Meyrat, G., Stoffel, A., Hafner, E., Eberhard, L. A., von Rickenbach, D., Simmler, K., Mayer, P., Niklaus, P. S., Birchler, T., Aebi, T., Cavigelli, L., Schaffner, M., Rickli, S., Schnetzler, C., Magno, M., Benini, L., and Bartelt, P.: The relevance of rock shape over mass–implications for rockfall hazard assessments, Nat. Commun., 12, 15, https://doi.org/10.1038/s41467-021-25794-y, 2021. a
CH2018: CH2018 – Climate Scenarios for Switzerland: Technical Report, https://www.nccs.admin.ch/nccs/en/home/climate-change-and-impacts/swiss-climate-change-scenarios/technical-report.html (last access: 14 December 2022), 2018. a, b
Costa, M., Marchi, N., Bettella, F., Bolzon, P., Berger, F., and Lingua, E.: Biological Legacies and Rockfall: The Protective Effect of a Windthrown Forest, Forests, 12, 1141, https://doi.org/10.3390/f12091141, 2021. a
Dorren, L. K. A.: Rockyfor3D: Description of the complete 3D rockfall model, https://www.ecorisq.org/docs/Rockyfor3D_v5_2_EN.pdf (last access: 14 December 2022), 2016. a
Dorren, L. K. A. and Berger, F.: Stem breakage of trees and energy dissipation during rockfall impacts, Tree Physiol., 26, 63–71, https://doi.org/10.1093/treephys/26.1.63, 2005. a, b, c, d
Dorren, L. K. A., Berger, F., Le Hir, C., Mermin, E., and Tardif, P.: Mechanisms, effects and management implications of rockfall in forests, Forest Ecol. Manage., 215, 183–195, https://doi.org/10.1016/j.foreco.2005.05.012, 2005. a
Dupire, S., Bourrier, F., Monnet, J.-M., Bigot, S., Borgniet, L., Berger, F., and Curt, T.: Novel quantitative indicators to characterize the protective effect of mountain forests against rockfall, Ecol. Indic., 67, 98–107, https://doi.org/10.1016/j.ecolind.2016.02.023, 2016. a
Dupire, S., Toe, D., Barré, J.-B., Bourrier, F., and Berger, F.: Harmonized mapping of forests with a protection function against rockfalls over European Alpine countries, Appl. Geogr., 120, 102221, https://doi.org/10.1016/j.apgeog.2020.102221, 2020. a
ETAG 027: Guidline for European Technical Approval of Falling Rock Protection Kits, https://www.eota.eu/en-GB/content/etags-used-as-ead/26/ (last access: 27 February 2018), 2013.
Feser, F., Barcikowska, M., Krueger, O., Schenk, F., Weisse, R., and Xia, L.: Storminess over the North Atlantic and northwestern Europe – A review, Q. J. Roy. Meteorol. Soc., 141, 350–382, https://doi.org/10.1002/qj.2364, 2015. a
Frey, W. and Thee, P.: Avalanche protection of windthrow areas: A ten year comparison of cleared and uncleared starting zones, For. Snow Landsc. Res., 77, 89–107, 2002. a
Fuhr, M., Bourrier, F., and Cordonnier, T.: Protection against rockfall along a maturity gradient in mountain forests, Forest Ecol. Manage., 354, 224–231, https://doi.org/10.1016/j.foreco.2015.06.012, 2015. a
Gottschalk, S., Lin, M. C., and Manocha, D.: OBBTree: A Hierarchical Structure for Rapid Interference Detection, in: Proceedings of 23rd International Conference on Computer Graphics and Interactive Techniques (SIGGRAPH'96), New Orleans, 171–180, https://dl.acm.org/doi/pdf/10.1145/237170.237244 (last access: 14 December 2022), 1996. a
Hararuk, O., Kurz, W. A., and Didion, M.: Dynamics of dead wood decay in Swiss forests, Forest Ecosyst., 7, 770, https://doi.org/10.1186/s40663-020-00248-x, 2020. a
Harsch, M. A., Hulme, P. E., McGlone, M. S., and Duncan, R. P.: Are treelines advancing? A global meta-analysis of treeline response to climate warming, Ecol. Lett., 12, 1040–1049, https://doi.org/10.1111/j.1461-0248.2009.01355.x, 2009. a
IMIS: IMIS-Windstation “Schwander Grat”, https://stationdocu.slf.ch/pdf/IMIS_GLA1_DE.pdf, last access: 26 February 2022. a
Jahn, J.: Entwaldung und Steinschlag, in: Schutz des Lebensraumes vor Hochwasser, Muren und Lawinen, Hochwasserbekämpfung Kärnten, Kärnten, 185–198, http://www.interpraevent.at/palm-cms/upload_files/Publikationen/Tagungsbeitraege/1988_1_185.pdf (last access: 20 December 2022), 1988. a
Jain, P., Tye, M. R., Paimazumder, D., and Flannigan, M.: Downscaling fire weather extremes from historical and projected climate models, Climatic Change, 163, 189–216, https://doi.org/10.1007/s10584-020-02865-5, 2020. a
Jönsson, A. M., Appelberg, G., Harding, S., and Bärring, L.: Spatio-temporal impact of climate change on the activity and voltinism of the spruce bark beetle, Ips typographus, Global Change Biol., 15, 486–499, https://doi.org/10.1111/j.1365-2486.2008.01742.x, 2009. a
Kalberer, M., Ammann, M., and Jonsson, M.: Mechanische Eigenschaften der Fichte: Experimente zur Analyse von Naturgefahren | Mechanical properties of Norway spruce: Experiments for the analysis of natural hazards, Schweiz. Z. Forstwesen, 158, 166–175, https://doi.org/10.3188/szf.2007.0166, 2007. a
Kulakowski, D., Seidl, R., Holeksa, J., Kuuluvainen, T., Nagel, T. A., Panayotov, M., Svoboda, M., Thorn, S., Vacchiano, G., Whitlock, C., Wohlgemuth, T., and Bebi, P.: A walk on the wild side: Disturbance dynamics and the conservation and management of European mountain forest ecosystems, Forest Ecol. Manage., 388, 120–131, https://doi.org/10.1016/j.foreco.2016.07.037, 2017. a
Kupferschmid Albisetti, A. D., Brang, P., Schönenberger, W., and Bugmann, H.: Decay of Picea abies snag stands on steep mountain slopes, Forest Chron., 79, 247–252, https://doi.org/10.5558/tfc79247-2, 2003. a, b, c
Lachat, T., Bouget, C., Bütler, R., and Müller, J.: Deadwood: quantitative and qualitative requirements for the conservation of saproxylic biodiversity, in: Integrative approaches as an opportunity for the conservation of forest biodiversity, edited by: Kraus, D. and Krumm, F., 92–103, ISBN 978-952-5980-06-6, 2013. a, b
Lanfranconi, C., Sala, G., Frattini, P., Crosta, G. B., and Valagussa, A.: Assessing the rockfall protection efficiency of forests at the regional scale, Landslides, 17, 2703–2721, https://doi.org/10.1007/s10346-020-01458-8, 2020. a
Leine, R. I., Schweizer, A., Christen, M., Glover, J., Bartelt, P., and Gerber, W.: Simulation of rockfall trajectories with consideration of rock shape, Multibody Syst. Dynam., 32, 241–271, https://doi.org/10.1007/s11044-013-9393-4, 2014. a, b, c, d
Leine, R. I., Capobianco, G., Bartelt, P., Christen, M., and Caviezel, A.: Stability of rigid body motion through an extended intermediate axis theorem: application to rockfall simulation, Multibody Syst. Dynam., 79, 444, https://doi.org/10.1007/s11044-021-09792-y, 2021. a
Liu, G. and Li, J.: Research on the Effect of Tree Barriers on Rockfall Using a Three-Dimensional Discontinuous Deformation Analysis Method, Int. J. Comput. Meth., 28, 1950046, https://doi.org/10.1142/S0219876219500464, 2019. a
Loye, A., Jaboyedoff, M., and Pedrazzini, A.: Identification of potential rockfall source areas at a regional scale using a DEM-based geomorphometric analysis, Nat. Hazards Earth Syst. Sci., 9, 1643–1653, https://doi.org/10.5194/nhess-9-1643-2009, 2009. a
Lu, G., Caviezel, A., Christen, M., Demmel, S. E., Ringenbach, A., Bühler, Y., Dinneen, C. E., Gerber, W., and Bartelt, P.: Modelling rockfall impact with scarring in compactable soils, Landslides, 64, 2353–2367, https://doi.org/10.1007/s10346-019-01238-z, 2019. a, b, c
Lu, G., Ringenbach, A., Caviezel, A., Sanchez, M., Christen, M., and Bartelt, P.: Mitigation effects of trees on rockfall hazards: does rock shape matter?, Landslides, 50, 1689, https://doi.org/10.1007/s10346-020-01418-2, 2020. a, b, c, d
Lundström, T., Jonsson, M. J., Volkwein, A., and Stoffel, M.: Reactions and energy absorption of trees subject to rockfall: a detailed assessment using a new experimental method, Tree Physiol., 29, 345–359, https://doi.org/10.1093/treephys/tpn030, 2009. a
Maringer, J., Ascoli, D., Dorren, L., Bebi, P., and Conedera, M.: Temporal trends in the protective capacity of burnt beech forests (Fagus sylvatica L.) against rockfall, Eur. J. Forest Res., 135, 657–673, https://doi.org/10.1007/s10342-016-0962-y, 2016. a, b
Marty, M.: Lawinenschutz und Waldentwicklung auf der Windwurffläche Disentis 29 Jahre nach Vivian, bachelor-thesis, ZHAW, Wädenswil, https://doi.org/10.21256/zhaw-19274, 2019. a
Moemken, J., Reyers, M., Feldmann, H., and Pinto, J. G.: Future Changes of Wind Speed and Wind Energy Potentials in EURO-CORDEX Ensemble Simulations, J. Geophys. Res.-Atmos., 123, 6373–6389, https://doi.org/10.1029/2018JD028473, 2018. a
Monnet, J.-M., Bourrier, F., Dupire, S., and Berger, F.: Suitability of airborne laser scanning for the assessment of forest protection effect against rockfall, Landslides, 14, 299–310, https://doi.org/10.1007/s10346-016-0687-5, 2017. a
Moos, C., Thomas, M., Pauli, B., Bergkamp, G., Stoffel, M., and Dorren, L.: Economic valuation of ecosystem-based rockfall risk reduction considering disturbances and comparison to structural measures, Sci. Total Environ., 697, 134077, https://doi.org/10.1016/j.scitotenv.2019.134077, 2019. a
Moos, C., Khelidj, N., Guisan, A., Lischke, H., and Randin, C. F.: A quantitative assessment of rockfall influence on forest structure in the Swiss Alps, Eur. J. Forest Res., 10, 578, https://doi.org/10.1007/s10342-020-01317-0, 2020. a
Mozny, M., Trnka, M., and Brázdil, R.: Climate change driven changes of vegetation fires in the Czech Republic, Theor. Appl. Climatol., 143, 691–699, https://doi.org/10.1007/s00704-020-03443-6, 2021. a
Noël, F., Cloutier, C., Jaboyedoff, M., and Locat, J.: Impact-Detection Algorithm That Uses Point Clouds as Topographic Inputs for 3D Rockfall Simulations, Geosci. J., 11, 188, https://doi.org/10.3390/geosciences11050188, 2021. a
Olmedo, I., Bourrier, F., Bertrand, D., Berger, F., and Limam, A.: Discrete element model of the dynamic response of fresh wood stems to impact, Eng. Struct., 120, 13–22, https://doi.org/10.1016/j.engstruct.2016.03.025, 2016. a
Olmedo, I., Bourrier, F., Bertrand, D., Berger, F., and Limam, A.: Dynamic analysis of wooden rockfall protection structures subjected to impact loading using a discrete element model, Eur. J. Environ. Civ. Eng., 24, 1430–1449, https://doi.org/10.1080/19648189.2018.1472042, 2020. a
Pereira, D.: Wind Rose: Graph and table for Direction-Intensity data, https://ch.mathworks.com/matlabcentral/fileexchange/47248-wind-rose, last access: 27 February 2022. a
Ringenbach, A., Bühler, Y., Stoffel, A., Kronenberg, M., Bebi, P., and Caviezel, A.: Deadwood Generator, EnviDat [data set], https://doi.org/10.16904/envidat.357, 2022a. a
Ringenbach, A., Stihl, E., Bühler, Y., Bebi, P., Bartelt, P., Rigling, A., Christen, M., Lu, G., Stoffel, A., Kistler, M., Degonda, S., Simmler, K., Mader, D., and Caviezel, A.: Full-scale experiments to examine the role of deadwood in rockfall dynamics in forests, Nat. Hazards Earth Syst. Sci., 22, 2433–2443, https://doi.org/10.5194/nhess-22-2433-2022, 2022b. a, b, c, d
Robbins, B. A., Wibowo, J. L., Holden, K. S., and Corcoran, M. K.: Development of Envelope Curves for Predicting Void Dimensions from Overturned Trees, https://erdc-library.erdc.dren.mil/jspui/bitstream/11681/10381/1/ERDC-GSL-TR-14-27.pdf (last access: 14 December 2022), 2014. a
Sandström, J., Bernes, C., Junninen, K., Lõhmus, A., Macdonald, E., Müller, J., and Jonsson, B. G.: Impacts of dead wood manipulation on the biodiversity of temperate and boreal forests. A systematic review, J. Appl. Ecol., 56, 1770–1781, https://doi.org/10.1111/1365-2664.13395, 2019. a
Sappington, J. M., Longshore, K. M., and Thomson, D. B.: Quantifying Landscape Ruggedness for Animal Habitat Analysis: A Case Study Using Bighorn Sheep in the Mojave Desert, J. Wildlife Manage., 71, 1419–1426, https://doi.org/10.2193/2005-723, 2007. a
Scheidl, C., Heiser, M., Vospernik, S., Lauss, E., Perzl, F., Kofler, A., Kleemayr, K., Bettella, F., Lingua, E., Garbarino, M., Skudnik, M., Trappmann, D., and Berger, F.: Assessing the protective role of alpine forests against rockfall at regional scale, Eur. J. Forest Res., 11, 969–980, https://doi.org/10.1007/s10342-020-01299-z, 2020. a
Seidl, R., Thom, D., Kautz, M., Martin-Benito, D., Peltoniemi, M., Vacchiano, G., Wild, J., Ascoli, D., Petr, M., Honkaniemi, J., Lexer, M. J., Trotsiuk, V., Mairota, P., Svoboda, M., Fabrika, M., Nagel, T. A., and Reyer, C. P. O.: Forest disturbances under climate change, Nat. Clim. Change, 7, 395–402, https://doi.org/10.1038/nclimate3303, 2017. a, b, c, d
Shorohova, E. and Kapitsa, E.: Stand and landscape scale variability in the amount and diversity of coarse woody debris in primeval European boreal forests, Forest Ecol. Manage., 356, 273–284, https://doi.org/10.1016/j.foreco.2015.07.005, 2015. a
Sneed, E. D. and Folk, R. L.: Pebbles in the lower Colorado River, Texas, study in particle morfogenesis, J. Geol., 66, 114–150, 1958. a
Stadelmann, G., Bugmann, H., Wermelinger, B., and Bigler, C.: Spatial interactions between storm damage and subsequent infestations by the European spruce bark beetle, Forest Ecol. Manage., 318, 167–174, https://doi.org/10.1016/j.foreco.2014.01.022, 2014. a
Stoffel, M., Wehrli, A., Kühne, R., Dorren, L. K. A., Perret, S., and Kienholz, H.: Assessing the protective effect of mountain forests against rockfall using a 3D simulation model, Forest Ecol. Manage., 225, 113–122, https://doi.org/10.1016/j.foreco.2005.12.030, 2006. a
Stritih, A., Senf, C., Seidl, R., Grêt-Regamey, A., and Bebi, P.: The impact of land-use legacies and recent management on natural disturbance susceptibility in mountain forests, Forest Ecol. Manage., 484, 118950, https://doi.org/10.1016/j.foreco.2021.118950, 2021. a, b
swisstopo: swissALTI3D: Das hoch aufgelöste Terrainmodell der Schweiz, https://www.swisstopo.admin.ch/content/swisstopo-internet/de/geodata/height/alti3d/_jcr_content/contentPar/tabs_copy/items/dokumente/tabPar/downloadlist/downloadItems/846_1464690554132.download/swissALTI3D_detaillierte Produktinfo_201802_DE.pdf (last access: 11 August 2021), 2018. a, b
Wohlgemuth, T., Schwitter, R., Bebi, P., Sutter, F., and Brang, P.: Post-windthrow management in protection forests of the Swiss Alps, Eur. J. Forest Res., 136, 1029–1040, https://doi.org/10.1007/s10342-017-1031-x, 2017. a