the Creative Commons Attribution 4.0 License.
the Creative Commons Attribution 4.0 License.
 | 21 Mar 2022
Morphodynamic styles: characterising the behaviour of gravel-bed rivers using a novel, quantitative index
William H. Booker
Brett C. Eaton
The assessment of river channels widely focusses on using channel form to identify channel character but fails to capture the more nuanced variations in morphodynamics without the analysis of process. This paper presents a method using an index of channel behaviour, the throughput ratio (ζ), which is calculated from morphologic change and sediment transport, and explores the viability of inferring process from channel form to act as an indicator of channel behaviour. Two experiments using the same initial width, slope, discharge, and grain size were used to demonstrate the effectiveness of this method in representing different morphodynamics. In one experiment the channel was allowed to laterally deform, whilst the other had inerodible elements placed at its boundaries. As a result the experiment with mobile banks widened and reduced sediment transport to zero, whereas the fixed-bank experiment – unable to decrease its shear stress – continued to output material. In both, the rate of morphologic change tended to zero despite their marked differences in sediment transport over time. The differences in evolution are due to the differences in process available to each channel despite an initial similarity in bed mobility and their gross similarity of a meandering planform. The throughput ratio allows new representations of the temporal and spatial patterns of the morphodynamics, providing additional measures with which to analyse the processes acting in river channels.
- Article
(4162 KB) - Full-text XML
- BibTeX
- EndNote


As technology has developed, data are now more readily available and in greater quality than they have ever previously been. Inspired by Strahler (1952), coupling this quantitative revolution with a shift toward process-based understanding, morphodynamic research has expanded in both its breadth and depth (e.g. Rust, 1972; Fenton and Abbott, 1977; Desloges and Church, 1989; Abrahams et al., 1995; Wheaton et al., 2013; Hardy et al., 2016). However, there has been a concomitant fragmentation of research themes and an increased focus on processes isolated from one another as dataset sizes increase. For example, the study of sediment transport without consideration of reach-scale morphodynamics (e.g. Wilcock, 1993; Ancey et al., 2006; Hassan et al., 2020) may not fully realise the feedbacks between sediment transport and channel morphologic units such as riffles, pools, and bars that mediate morphodynamics (Schumm, 1977, 1985; Church, 2002; MacKenzie and Eaton, 2017; Dhont and Ancey, 2018; Booker and Eaton, 2020). The coupling between form and process is an intrinsic characteristic of fluvial systems (Ancey, 2020) and determines the suite of morphodynamic behaviours that can arise. Therefore the absence of large-scale channel forms in most studies of sediment transport research makes the application of such studies to natural systems difficult.
A similar trend has emerged within riverine classification. From Strahler's call to arms emerged the first quantitative attempts at grouping channels according to their process domains (Leopold and Maddock, 1953; Lane, 1957). To date, many combinations of system-representing metrics have been employed in the differentiation of channel types (see Buffington and Montgomery, 2013). A major criticism of attempts to categorise channels in this manner is that they frequently do not explicitly consider process (Montgomery and Buffington, 1997). The hierarchical system of Rosgen (1994), for example, employs an organisation of channels by morphology for easier management and inference of behaviour using metrics derived from channel form such as fish habitat availability and flow resistance and has seen widespread use in river management. The emergence of feedbacks between form and process and the highly non-linear nature of sediment transport render such frameworks difficult to justify when their focus is on the state of the channel rather than the processes actively shaping it. Indeed, it is the patterns of sediment transport and bed deformation that form the morphodynamics of a channel (Church and Ferguson, 2015) and thus provide the key to analysing the behaviour of fluvial systems.
The primary axis of variation in river channel behaviour is the variety of processes available. For example, a scaled, physical model of sediment transport operating at one grain's width (e.g. Ancey et al., 2006) only has available to it the motions of the grains and their interactions with the bed. In contrast, highly complex systems such as forested mountainous streams may have vegetation (Vargas-Luna et al., 2015), jamming from sediment and wood (Montgomery et al., 1996; Zimmermann et al., 2010), and flow bifurcation (Ashmore, 1991) influencing the movement of sediment and the deformation of the channel boundary. This behaviour is also mediated by the specific life histories of the channel in question, a facet that static, form-based analyses may not capture.
Although process is often conveyed through form-based metrics such as sinuosity we contend that, in order to improve our understanding of rivers and their behaviour, new attempts must be made to explore channels within the context of process by adding new tools to the analytical arsenal of morphodynamics. Rhoads (2006) identified a need for a primacy of process within geomorphology, in place of the “mechanistic materialism” favoured by Strahler. Borrowing this focus on process, already seen as key in the description of channels (Montgomery and Buffington, 1993, 1997), we seek to develop a framework for analysing high-resolution data to more directly study and understand the behaviour of channels. Previous work has identified an association between morphologic change and sediment transport (Exner, 1925; Neill, 1971; Ashmore and Church, 1998; Church, 2006) that we will use to develop a suitable quantitative index of process.
This paper offers a conceptual framework designed to provide a quantitative representation of the processes affecting channel form that will complement existing indices of form itself. In particular, this paper develops a simple index relating sediment output to morphologic activity termed the “throughput ratio”. This index is then used to explain and track the evolution of two different experimental systems. This approach is then spatialised to provide an additional point of comparison between these styles of morphodynamics. Finally, the limitations of this proposed methodology are explored.
An intuitive relationship exists between the movement of material and the presence of bed forms. Whilst Popov (1962) is cited as the first formal presentation of the idea, Neill (1971) proposed a numeric association between transport lengths of sediment and morphology in a meandering stream. This formulation states that the erosion of material from banks is associated with the deposition of material at the next point bar and that the average transport distance of material corresponds to half the wavelength of the bar spacing (Fig. 1). The association of characteristic zones of erosion and deposition is, in the case of Neill (1971), based on the observations of patterns of sediment movement in laboratory meander models (Friedkin, 1945).

Figure 1Conceptual basis of the morphologic method. λ corresponds to the wavelength between successive zones of deposition, and thus corresponds to successive zones of deposition and erosion. Qbi and Qbo are the input and output discharges of sediment through this reach.
Neill's model acts as an end member for a system where sediment supply is derived solely from the deformation of the bed and banks comprises sequential cells and the path length of material is (half the wavelength of bar spacing). Whilst there is an association between morphology and particle transport length, the influence is stronger over longer downstream distances than shorter (Ganti et al., 2010), and this assumption neglects those events that cause non-wavelength-associated transport, which may emerge over the course of a constant discharge as transport paths evolve in response to changes in the bed state (Pyrce and Ashmore, 2005) or due to large-scale channel reworking (Kasprak et al., 2015). Furthermore, the assumption that a zone of erosion is followed by a sequential zone of deposition with the same volume of change precludes the occurrence of throughput and the transmission of sediment to other cells downstream; discharge exerts a natural influence on the travel distance of bed load as deposition of material likelihood decreases (Hassan et al., 1992; Booker and Eaton, 2020), further decoupling the direct relationship between morphologic change and output (Eaton and Lapointe, 2001).
For a reach with no net volumetric change (ΔV=0), the input and output of sediment into a reach of length Lr must also be equal to each other, free from non-fluvial additions of material. It follows that the volumes of erosion (Ve) and deposition (Vd) would also be compensatory to produce no net volumetric change. Therefore, one observes two different volumes of sediment transport: the transport volume, given by the product of transport rate and time; and the morphologic exchange volume (M), the absolute sum of the volumes of erosion and deposition. However, for a fixed transport volume there are myriad exchange volumes that may sum to ΔV=0, varying between extremely low and high values of M. Those channels of M=0 act as pipes through which supplied material is moved, but the boundary remains unchanged, whereas those with have highly active surfaces that greatly and rapidly change in elevation.
We define a ratio of sediment transport to morphologic change as the throughput ratio (ζ) over a period of time (Δt):
where
Qb is the average volumetric transport rate into (Qbi) and out of (Qbo) the study reach, and p is porosity – or put more simply,
where M is the absolute sum of volumetric channel change, corrected for porosity. This ratio produces a metric for the relative change in behaviour of morphodynamics due to changes in sediment transport and bed deformation and the spatial and temporal variation thereof. To provide a brief example, consider the transport and storage zones that characterise wandering rivers according to Desloges and Church (1989). The transport zones are thought to convey large volumes of supplied material but experience minimal bed deformation, resulting in low to zero values of M and high values of Qb. If this behaviour is present, the throughput ratio ζ must be high, indicating low levels of morphologic activity in relation to the transport rate. Storage zones, on the other hand, typically experience high rates of morphologic activity as they source material from their bed and banks during periods of instability. The active and high rates of the deformation of the boundary would cause compensating differences in M, reducing the ζ parameter. Using the throughput ratio ζ would provide the quantitative framework necessary to validate the inferred process–form relation in these two contrasting styles of morphodynamics.
In order to assess the style of morphodynamics exhibited by a system, both sediment input and output must be known alongside elevation data of the bed surface. Whilst field studies are capable of producing such data (Wheaton et al., 2013; Williams et al., 2015), quickly testing different conditions necessitates the use of laboratory-obtained data. Both of the following experimental datasets were conducted using the Adjustable Boundary Experimental System (A-BES) in the Geofluvial Lab at the University of British Columbia (UBC) as Froude-scaled models at a 2 % gradient. Two experiments were chosen as examples of different morphodynamics and subsequent styles of deformation. The first dataset was used to develop the methodology for this throughput ratio and comes from experiments with a fixed width and inerodible banks, henceforth known as the fixed-bank experiment. These experiments have been published elsewhere testing a multi-scalar roughness decomposition (Adams and Zampiron, 2020). The dataset used to test the applicability of the concept with differing boundary conditions came from experiments using deformable banks (MacKenzie, 2019), henceforth known as the mobile-bank experiment. Both sets of experiments were conducted using the same grain size distribution, with material ranging from 0.25 to 8 mm, a D50 of 1.6 mm, a D90 of 3.9 mm, and a D95 of 5.1 mm. In addition, both experiments were conducted using the same discharge (1 L s−1) and same initial channel width (0.3 m).
Data collection methods differed between the two experiments. The mobile-bank experiment collected elevation data with a laser scanner to produce 2 mm × 2 mm resolution digital elevation models (DEMs) of the bed surface (MacKenzie, 2019). In contrast, the fixed-bank experiment used structure from motion photogrammetry to produce 1 mm × 1 mm resolution DEMs (Adams and Zampiron, 2020). In both, flow was ceased and water drained from A-BES prior to scanning the exposed bed surface. These elevation data collection methods produce repeatable, fast, and reliable ways to capture the bed surface at high resolution. The scan schedule also differed between the mobile- and fixed-bank experiments. Scans in the mobile-bank experiments were conducted every 15 min, alongside measurement of sediment captured in the sediment trap, in order to consistently capture data through the experiment. In contrast, the scans in the fixed-bank experiments were run at four repetitions each of 5, 10, 15, 30, 60, and 120 min intervals designed to produce a saturation of observations during the initial perturbation and deformation stages. Sediment was emptied from the trap in accordance with the scans at 5 and 10 min intervals and 15 min intervals thereafter in phase with the scans at 15 min or greater intervals. Sediment output in both sets of experiments was recirculated as input over the next sediment collection cycle.
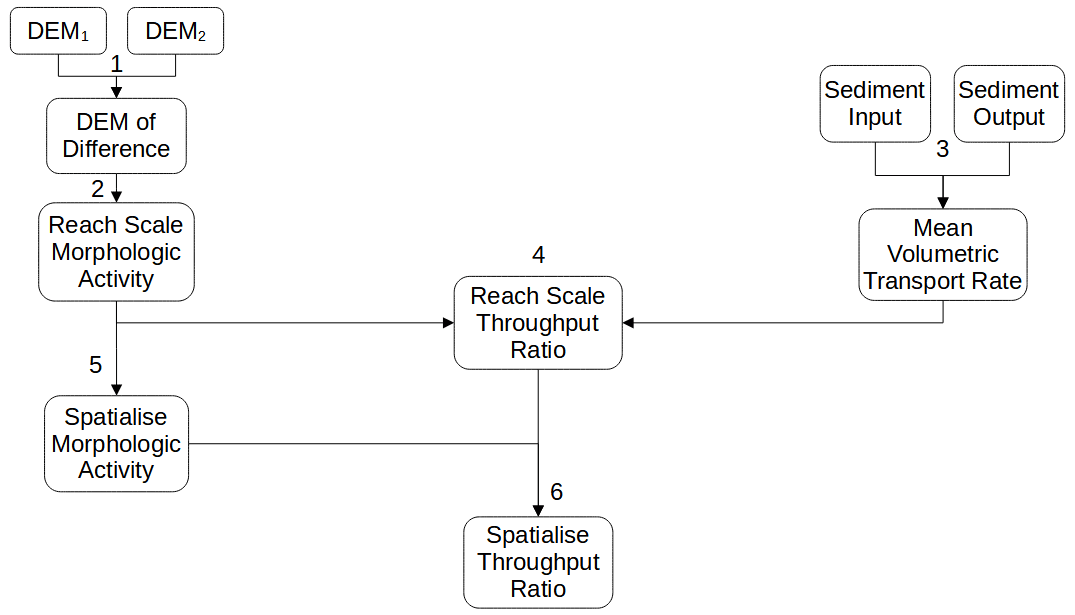
Figure 2Flowchart representing the methodology used to create ζ. Numbers represent processing stages: (1) surface differencing (Eq. 5a), (2) calculating absolute change at the reach scale (Eq. 5b), (3) volumetric conversion and averaging (Eq. 4), (4) calculating reach-scale ζ (Eq. 3), (5) spatialising M (see Fig. 8), and (6) spatialising ζ (Eq. 6).
We have provided sample code to calculate ζ for a DEM alongside the following general methodology (Fig. 2). In order to produce an estimate of ζ, four quantities are needed in addition to the surfaces of interest: total sediment input and output between the time steps, sediment density (ρ), and porosity. The average of the sediment input and output masses are taken and converted to a volume of transported material (Qbv) through division by the product of bulk density (ρ) and porosity:
The morphologic activity is calculated as the sum of the absolute change between the two surfaces given by their DEM of differences (DoD):
Following this, a value of ζ is estimated for the whole reach using Qbv and M. Given the high resolution of the data, we are also afforded the opportunity of investigating the fine-scale variation in morphologic change in the analysis of ζ. Analysing at the resolution of the DEMs produces a series of minimum-width cross sections of channel change whose number equals the number of pixels in the downstream direction. M is calculated for each channel cross section so that ζ may be spatialised under the assumption of an idealised, constant distribution of Qbv along the length of the channel. Using a ratio of this evenly expected distribution to the observed cross-sectional M values, we calculate a ratio-adjusted ζ (ζadj) value:
where n is the number of cross sections, Me and Mo are the expected and observed values of M, and ζr is the product of ζ and the ratio of Me and Mo.

Figure 3DEMs from the final scan of the fixed-bank (upper) and mobile-bank (lower) experiments. Panel (a) shows the full extent of the DEMs; differences in length result from data collection methodologies. Inset panels show enlarged sections of the (b) downstream, (c) middle, and (d) upstream sections of the bed surface. Flow is from right to left.
3.1 Uncertainty
Given the difference in data collection methods, the two experiments have substantially different sources of uncertainty. In order to estimate the uncertainty in the photogrammetry-derived DEMs in the fixed-bank experiment, we evaluated the variation in position of a fixed, common point throughout the series of DEMs. The variation in the x, y, and z dimensions of a single point thus provided an estimate of positional uncertainty of each DEM (i.e. potential x, y, and z offset due to data processing). By repeating this at the upstream, middle, and downstream extent of each DEM we can produce an estimate of the typical range of positional variance over a dataset. To estimate the uncertainty throughout the data, the average values of variation in the x (5 mm), y (2 mm), and z (0.5 mm) dimensions were used as offsets to calculate variation in M due to DEM positional variance for each DoD. That is, each DEM was translated by the variation in each dimension in both positive and negative directions. DoDs were calculated from the “potential” DEM surfaces to calculate the range of variation in M. The median value of these variations is used to characterise the uncertainty in DEM products and ranges from 1 % to 16 % with a median value of 6 %. Sediment uncertainty comprises ±0.1 kg per reported mass, resulting in 1.5 % to 10 % uncertainty.
The laser-scan-based elevation models generated in the mobile-bank experiment have a greater degree of precision with no variation in cross-stream or vertical position due to a fixed rail system. Hence, positional variation is only in the downstream direction at an uncertainty of 1 mm precision error sourced from the stepping motor. The resulting variation in M from positional uncertainty ranges from 0 % to 11 %, with a median of 3 %. Uncertainty in sediment output is far lower at ±0.0001 kg per reported mass, from a far higher precision scale, equivalent to a range of 0 % to 0.5 % uncertainty.
The two experiments produced greatly differing morphology and morphodynamics (Fig. 3). The fixed-bank experiment developed a series of alternate bars of the kind observed in Lisle et al. (1991), Dhont and Ancey (2018), and Redolfi et al. (2020). In this channel, pool–bar units were present throughout the experiment as material cycling through the system was transmitted along the thalweg with limited exchange with the bed. The morphology in the channel remained largely the same through the experiment, which deepened the pools and retained the pool–bar couplets established early during the experiment. There was some variation in the upstream and downstream extents of the pools and bars during the experiment, as they eroded and deposited in response to local variations in flow direction. In contrast, the mobile-bank experiment formed a mildly sinuous channel with comparatively topographically subdued pool–bar couplets with a greater sinuosity than those found in the fixed-bank experiment. Initially there was an overall widening of the channel and construction of a thalweg and deposition of bars with a slight preference for deposition at the mouth and erosion at the outlet. The recirculating feed deposited a large proportion of this load at the upstream end of the channel, causing substantial, local widening. The morphology continued on this trend during the course of the experiment, widening the channel further, depositing more material near the inlet, and eroding more material at the outlet. The middle 6 m or so of the channel remained relatively stable, with a lower extent of scour and widening in comparison to the upper and lower sections.
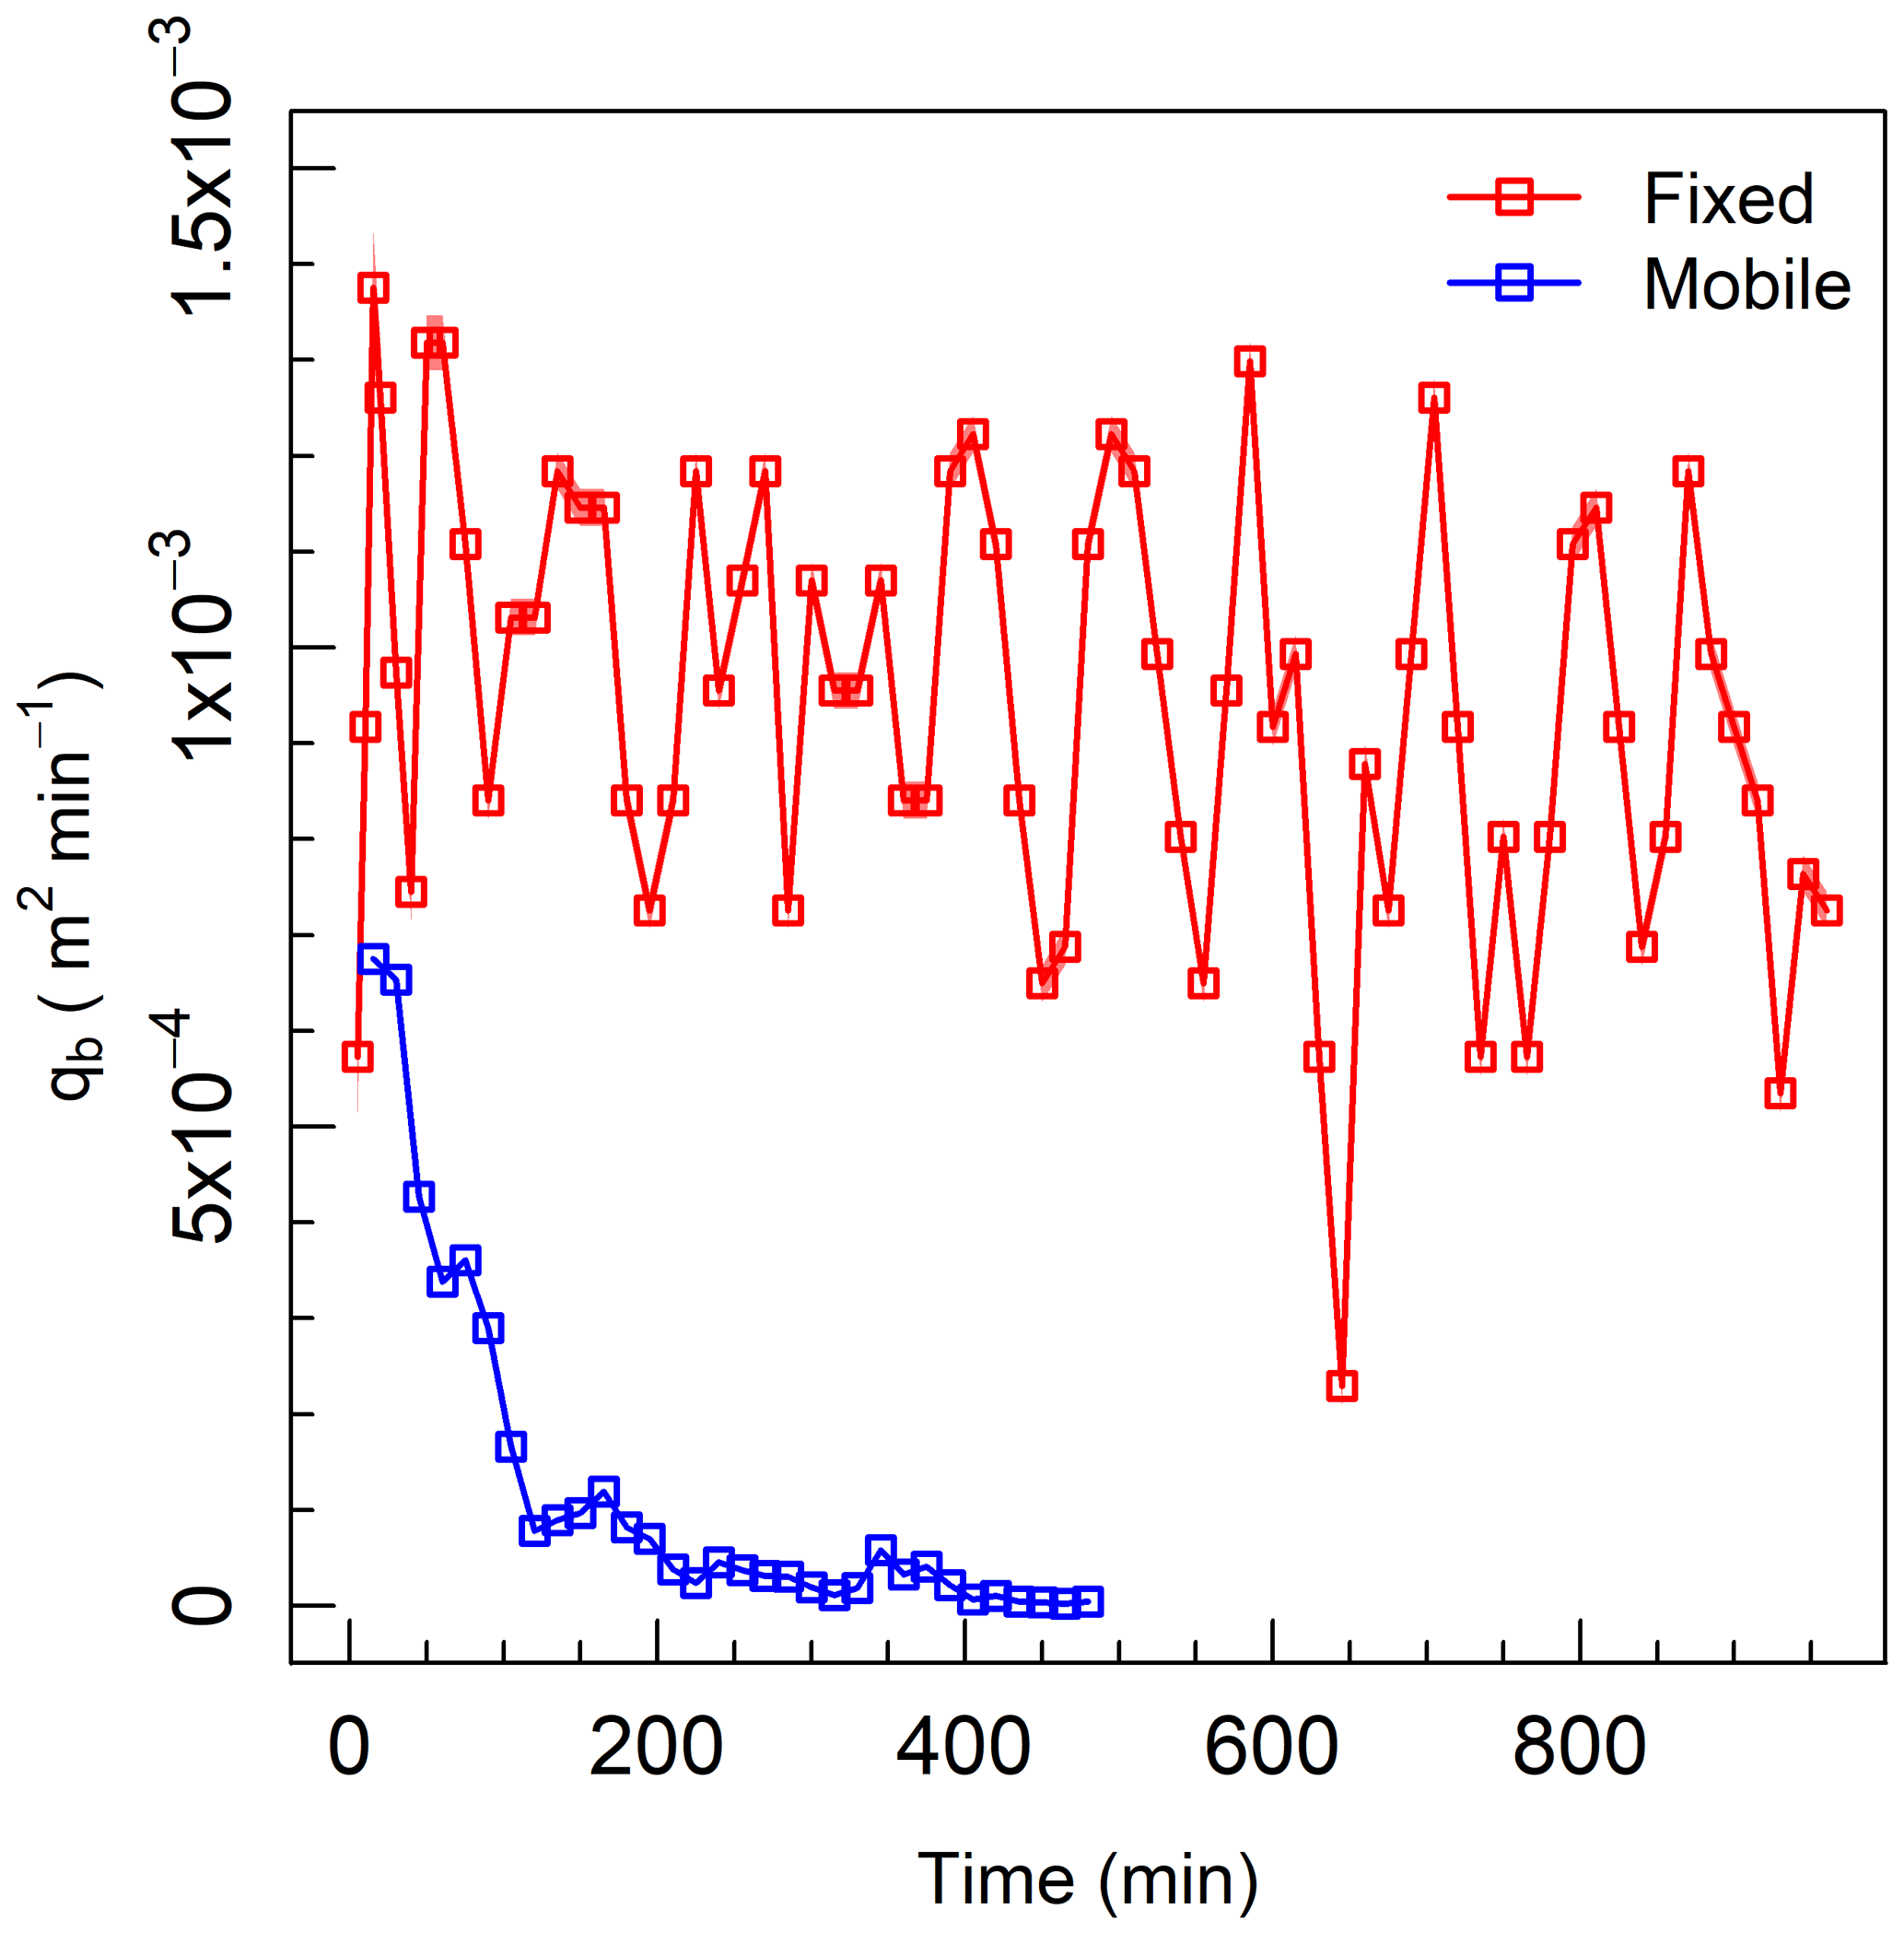
With the presence of confining elements, the unit sediment transport rate was higher for the fixed-bank experiment by a factor of between 2 and 25 (Fig. 4). The output of material was highly variable through the course of the fixed-bank experiment, with a slight reduction in its average value over time. The output for the fixed-bank experiments maintains a mean of m2 min−1 but had frequent variation around this value. In contrast, the sediment output of the mobile experiment followed a sharp decline over the initial 2 h of the experiment before stabilising around a mean of m2 min−1. That dramatic decrease in sediment output is mostly achieved through a reduction in erosion, as the channel widens, but is in part due to the lack of continued throughput as this material instead accumulates near the inlet.
However, the experiments showed a remarkable similarity in the patterns of volumetric change (Fig. 5). Apart from the first time step, where the mobile-bank exhibited extensive erosion, net volumetric change per unit width (Δv) exhibited the same relation with time. In both experiments, the magnitude of Δv reduced through the course of the experiment, stabilising around zero net change, with continued variation about this trend. In the same vein, both experiments showed the same gross trend in unit morphologic activity (m) over time. In both the mobile- and fixed-bank experiments, the maximum volume of morphologic activity occurred within 30 min of starting the run. As in net erosion, this initial peak is then relatively rapidly dampened and asymptotes towards zero, again with some variation about this trend.
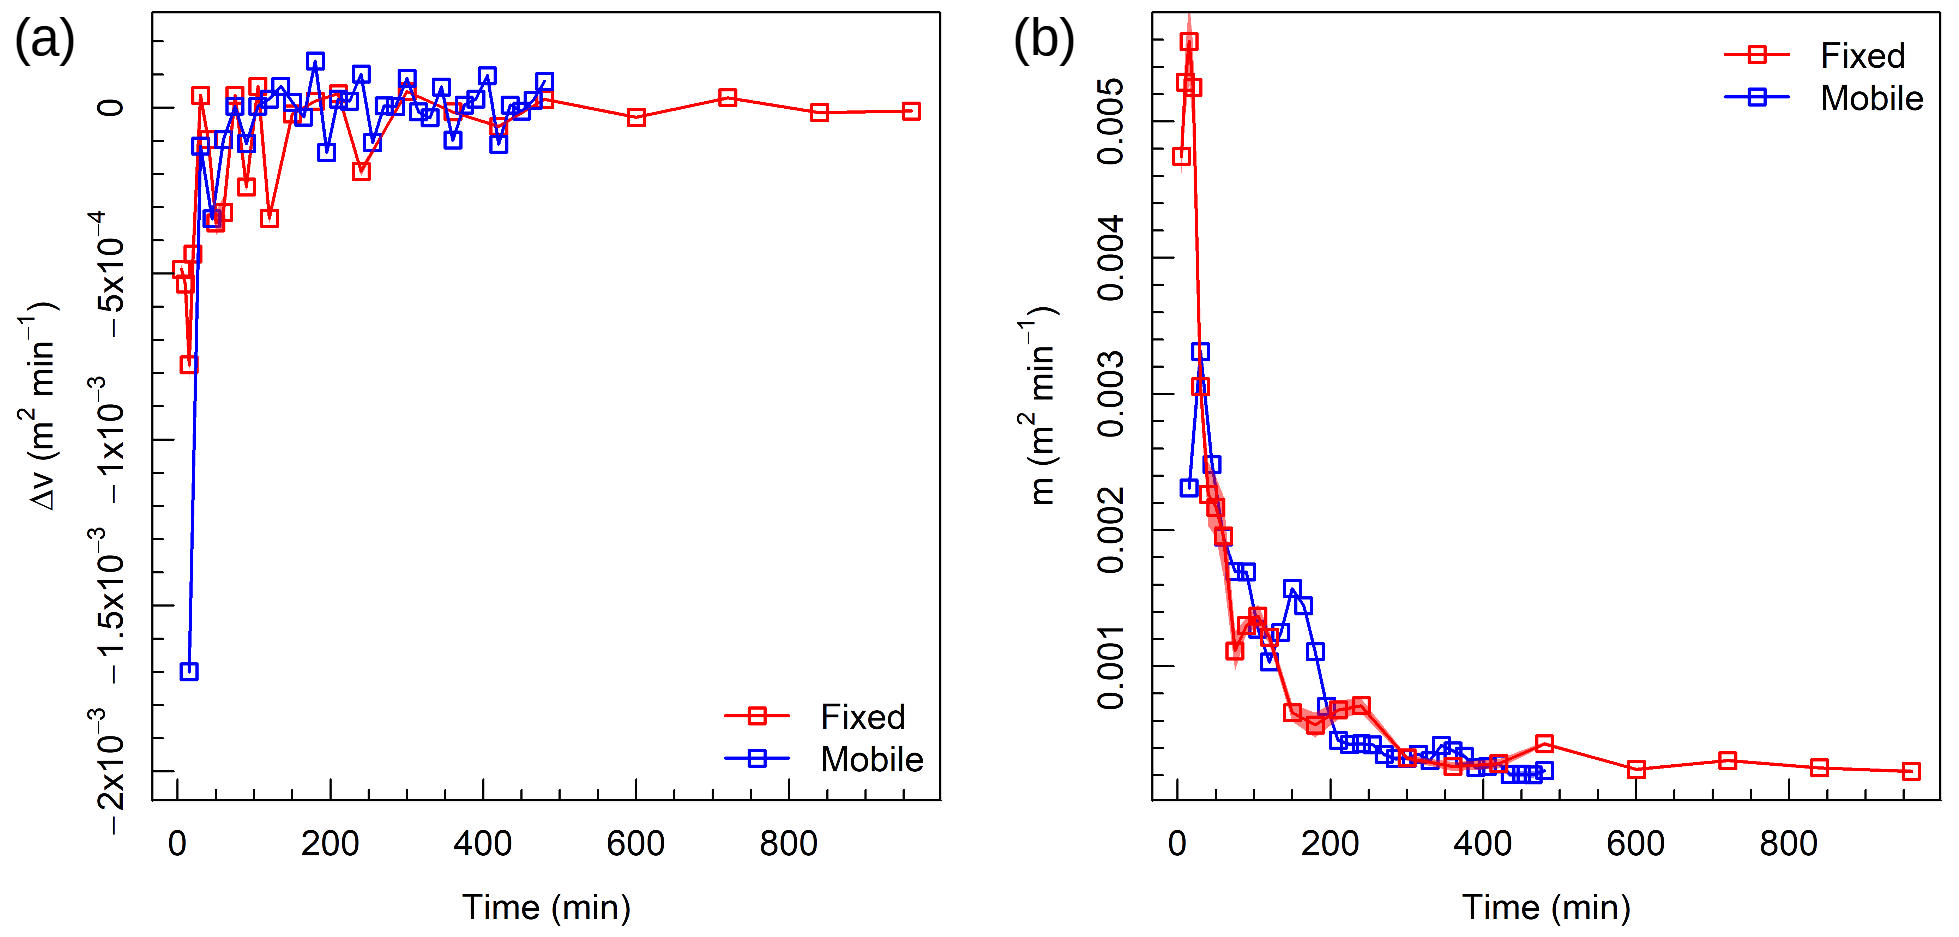
Figure 5Panel (a) shows the rates of net volumetric change per unit width. Net volumetric change is calculated as the difference between volumes of erosion and deposition between successive DEMs. Panel (b) shows the rates of morphologic activity per unit width. Morphologic activity is calculated as the sum of volumes of erosion and deposition between successive DEMs.
One can demonstrate the temporal evolution in behaviour using the calculation of ζ (Eq. 3), which reflects the disparity between two facets of morphodynamics: the material moving within (Qb) and the work done to a system (M) (Fig. 6). The values and evolution of ζ differ according to the style of bank present in each experiment. For the fixed banks, an initially low ζ value (<1) exhibited a sharp increase over the first 400 min of the experiment, followed by a more gently sloped increase over the rest of the experiment with occasionally substantial changes. The mobile-bank experiment instead followed a negative trend through the course of the experiment from a similar starting value as the fixed-bank experiment to approximately zero, diverging after 30 min.
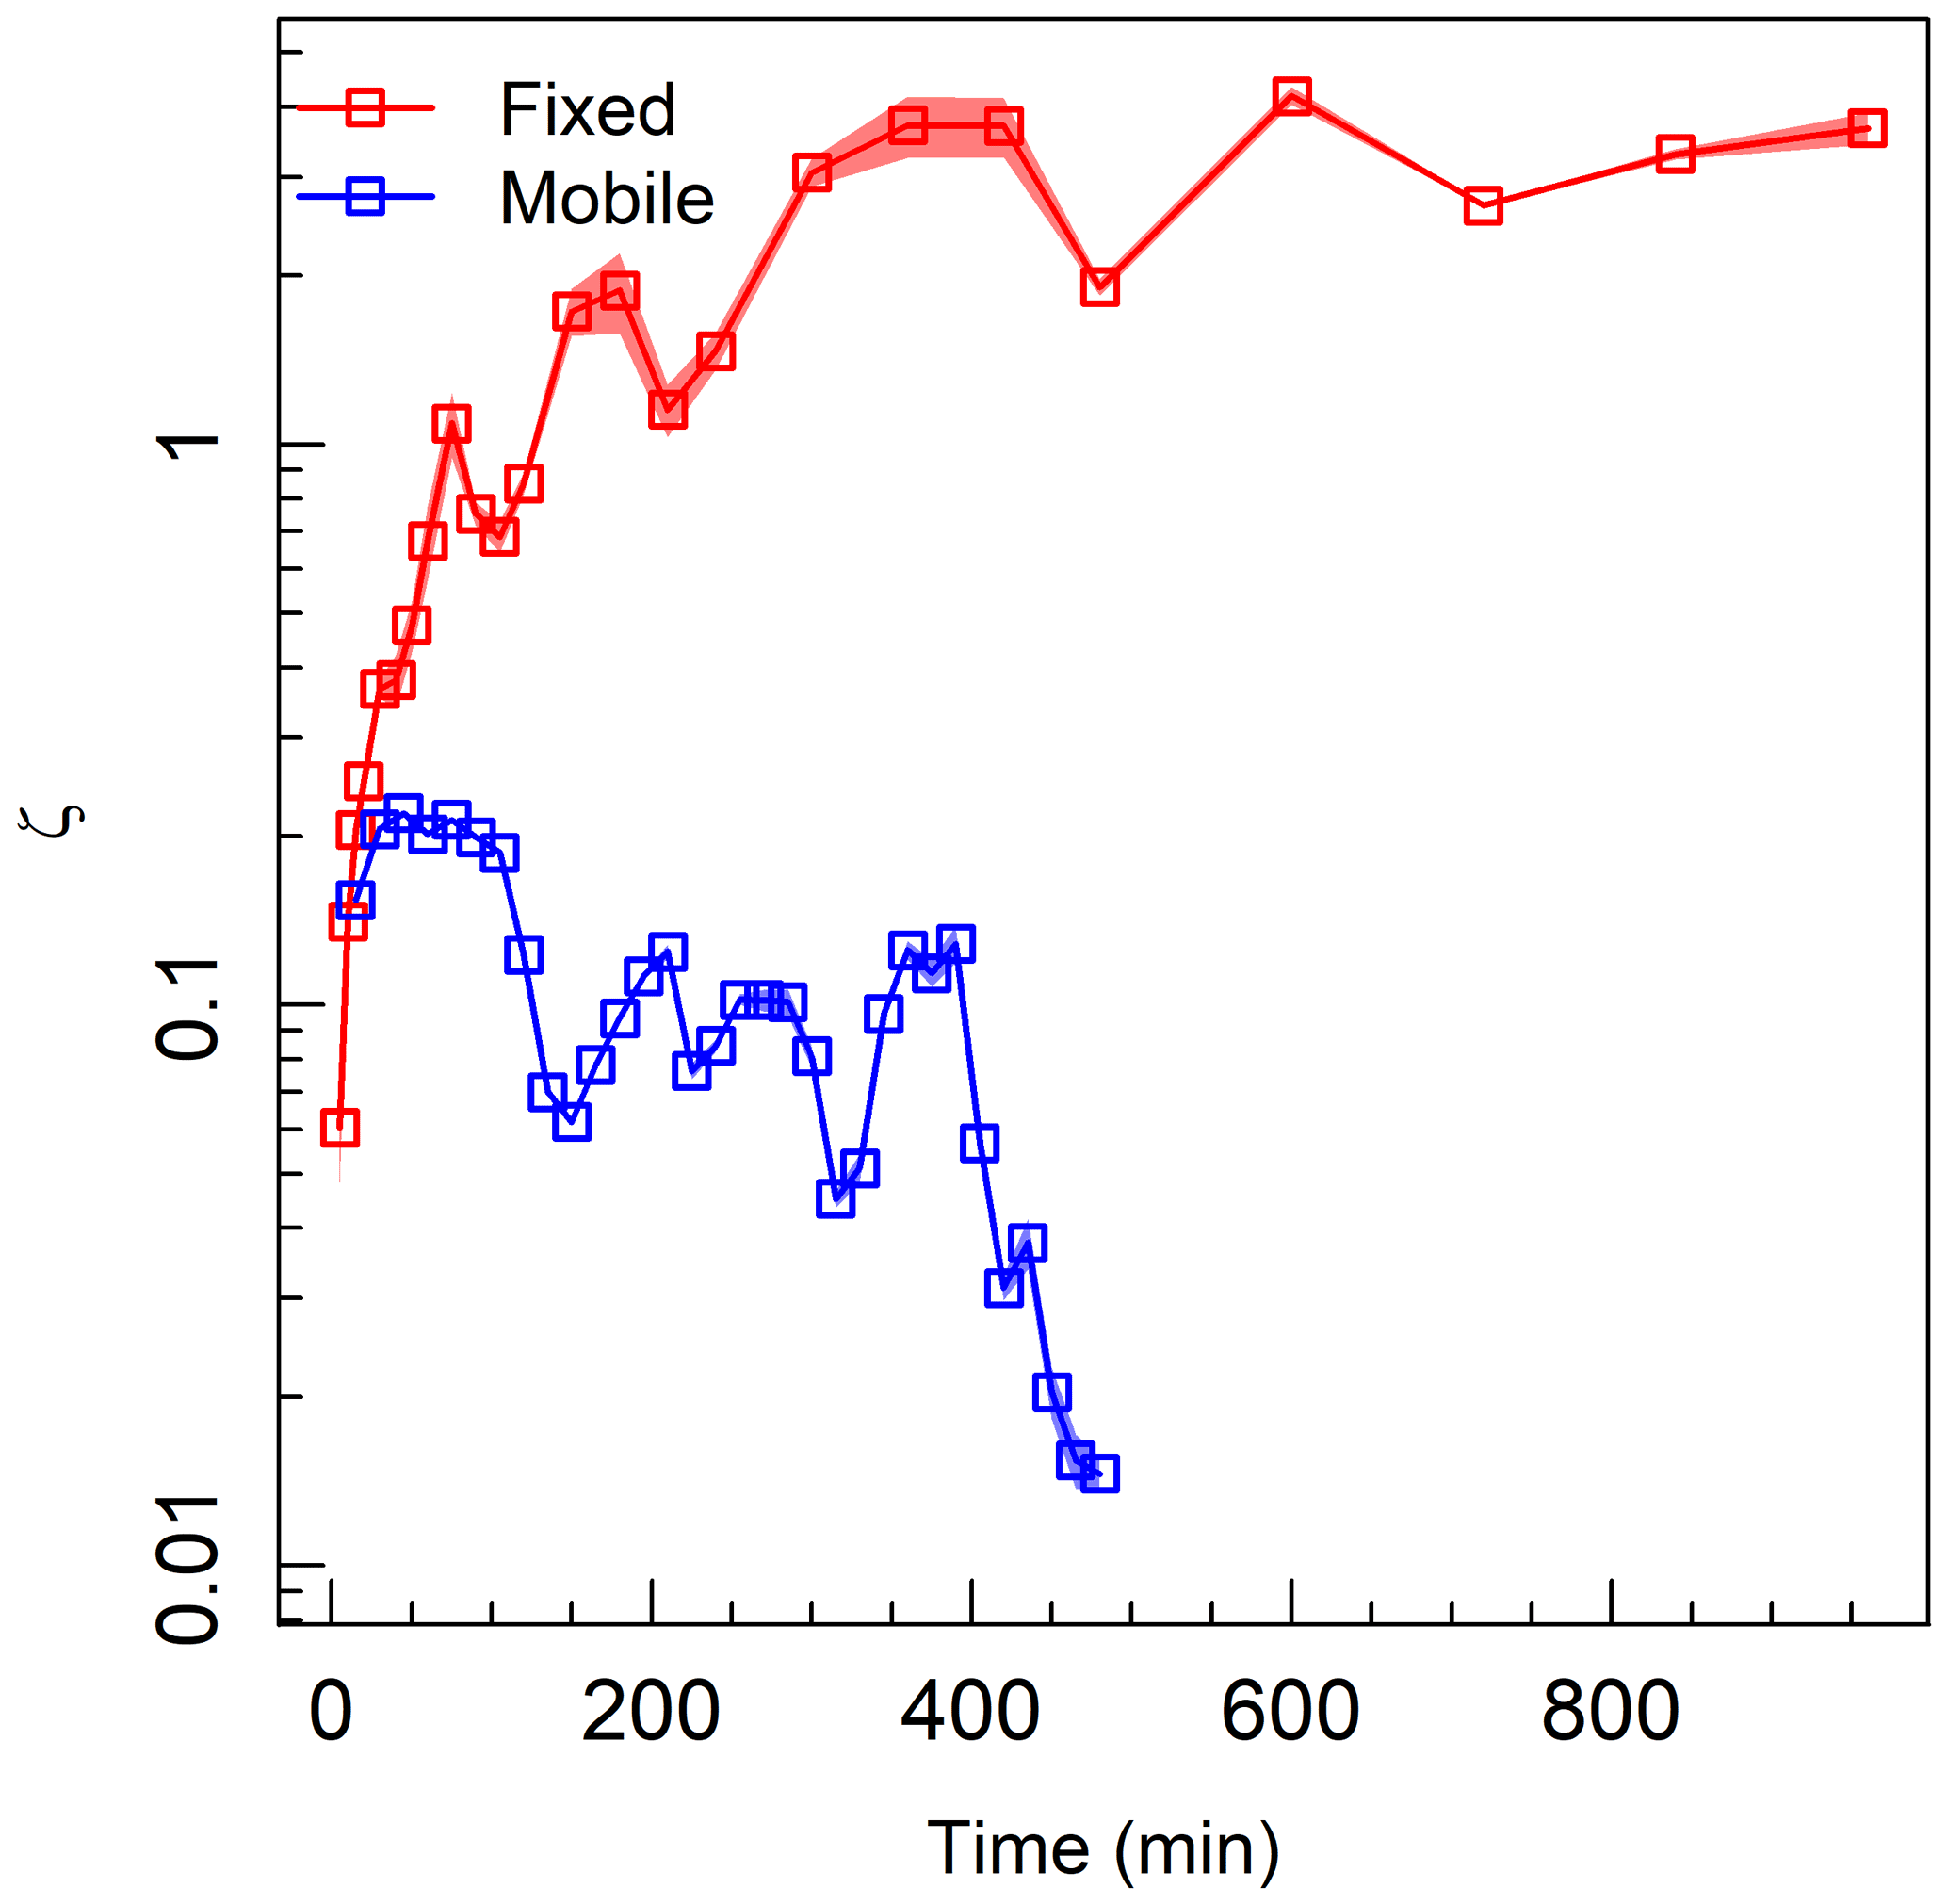
Figure 6Throughput ratio (ζ) calculated as the ratio of the volumes of sediment transport and morphologic activity.
With low values (≤1) ζ reflects a close association between bed deformation and sediment transport, as little is being output outside of the change occurring to the bed surface. When values are high (≥1), however, it represents a cycling of material through the system without commensurate change in the surface as material is simply throughput and decoupled from morphologic change. This difference is an accurate reflection of the difference in morphodynamics observed during each experiment. For the fixed-bank system, which stabilised its sediment transport rate around a mean rather than substantially reducing it, the commensurate reduction of morphologic activity produced an increasing ζ value as it maximised its throughput. For the mobile system that stabilised through a severe reduction in sediment transport rate, a negative relation with time is inevitable as morphologic change becomes progressively localised through time. In addition, the close proximity of the sediment transport values to morphologic change produce ratios that do not exceed 0.4 for the mobile-bank experiment, in comparison to the peak around 4 found in the fixed-bank experiment.
Given the inherent spatial component of morphologic change, there is an opportunity to spatialise Fig. 6 and demonstrate the variability of ζ along the length of the experimental channels. To conceptualise the variability, unit rate morphologic activity is calculated for each cross section along the length of each DEM (Fig. 2 and Eq. 6c) and their distribution shown in Fig. 7. The overall pattern of the fixed experiment is similar to Fig. 5b as the rate of m decreased over the course of the experiment; however, the median values of the first 60 min are much closer to the remainder of the experiment than implied by Fig. 5b. The median activity of the first 20 min is close to subsequent values but with far greater ranges of variation that also decreased over the course of the experiment and especially so after 30 min. That is, the magnitude and variation in m within each DEM decreased through the course of the experiment and overall morphologic change reduced and homogenised. There is a positive skew to most of the distributions; most time steps have substantial contributions from few cross sections that far outweigh the median value. Similar to the fixed-bank experiment, m in the mobile-bank experiment followed a decrease from an initially higher median and wider distribution. In contrast, this decrease is not monotonic and instead has two secondary peaks in activity (T=150 and 345 min). The mobile-bank experiment showed a similar difference to its rates of m in Fig. 5b as the fixed-bank experiment but with a relatively wider range of m values for the first 180 min. As in the fixed-bank experiment, there is a positive skew to the distribution of m values. The maintenance of skewed distributions shows a greater spatial localisation through the experiment, compared to the fixed-bank experiment.
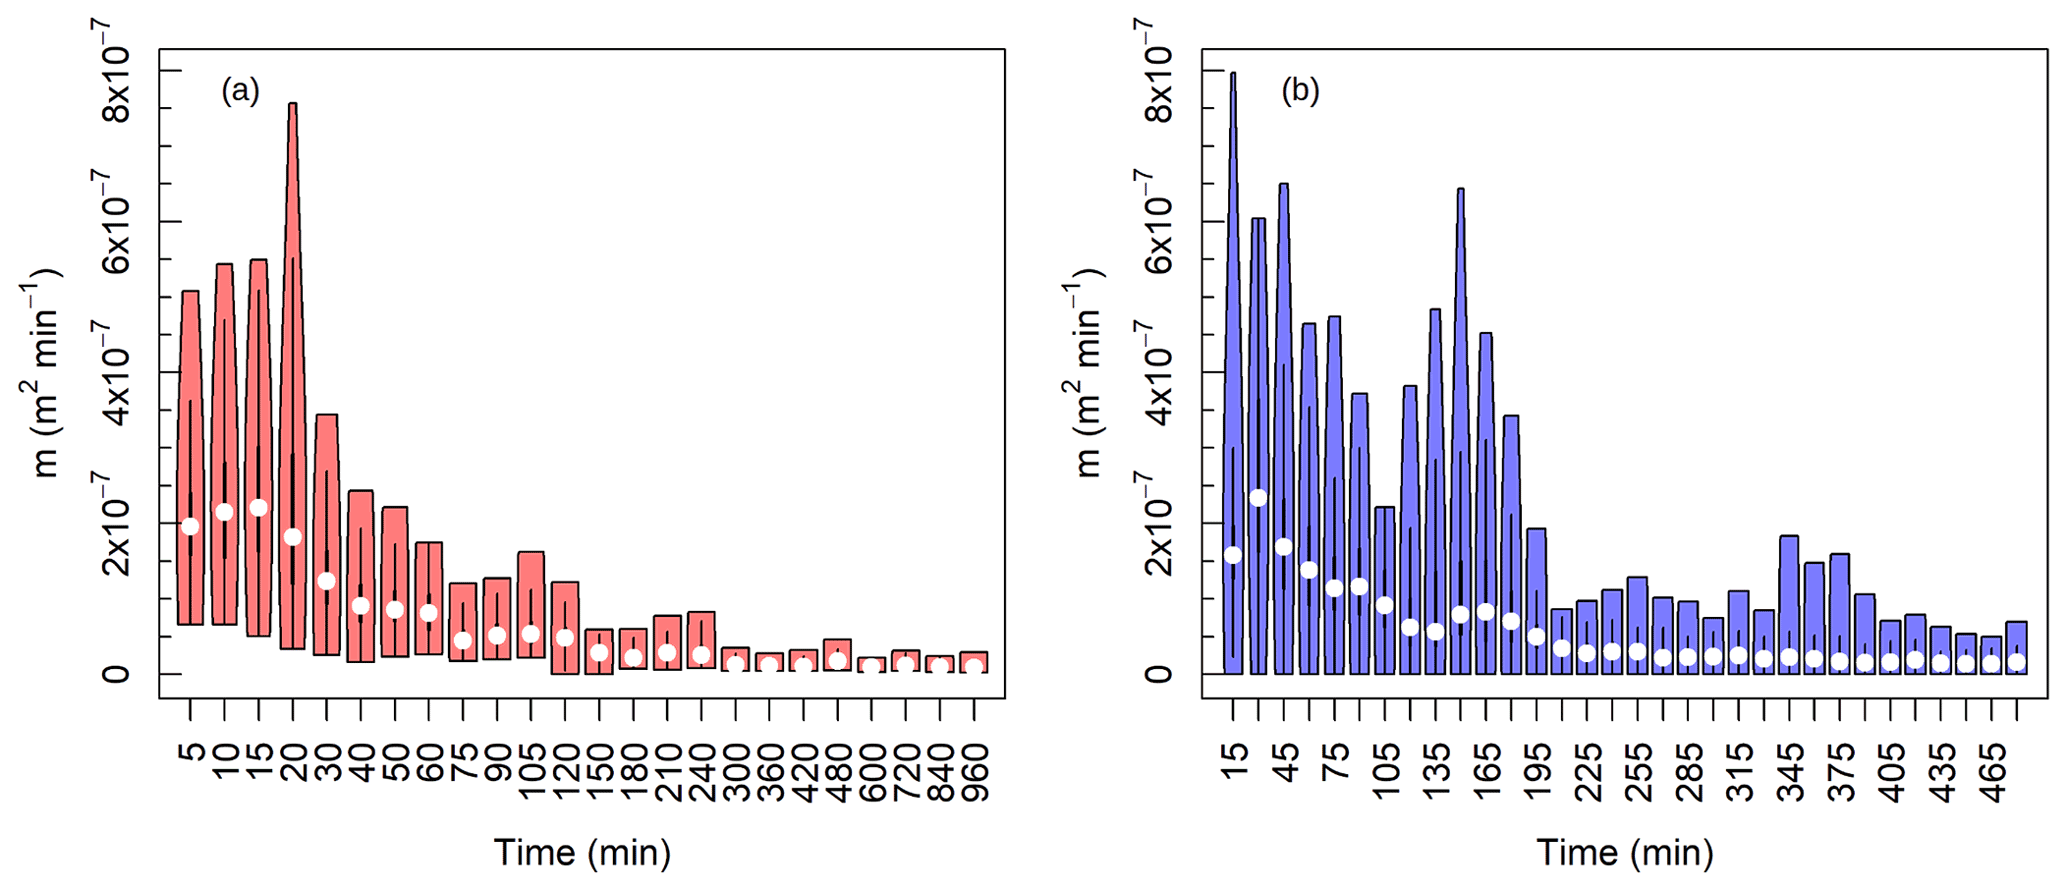
Figure 7Violin plots showing the distribution of every cross-sectional value of morphologic activity for the (a) fixed-bank and (b) mobile-bank experiments for each DoD. Median values are given by the white point, kernel density by the internal lines, and the total range of values by the coloured box.
Four example calculations have been provided in Figs. 8 to 11. The first of these (Fig. 8) shows the largest variation in m found in the fixed-bank experiment (T=20 min). Change is isolated within this time step to two discrete zones; the first being deposition downstream of the inlet () and the second being bar reorganisation in the lower middle section (–0.5). The pattern of changes in morphologic activity identified these same zones differently according to whether compensating activity has reduced the volumetric change (–0.8) or whether the surface change was low to begin with (–0.1), which has important implications for the calculation of ζ. For the majority of the length of the channel (–1) exchange zones dominated (i.e. a relatively larger volume of M than Qb) with changes in ζ due to the spatial disaggregation of change. Indeed, it is only around that ζ exceeded the throughput threshold and otherwise remains below unity on the whole. Thus, ζ identified this reach as primarily exchange driven, only briefly approaching a throughput state at the downstream limit.
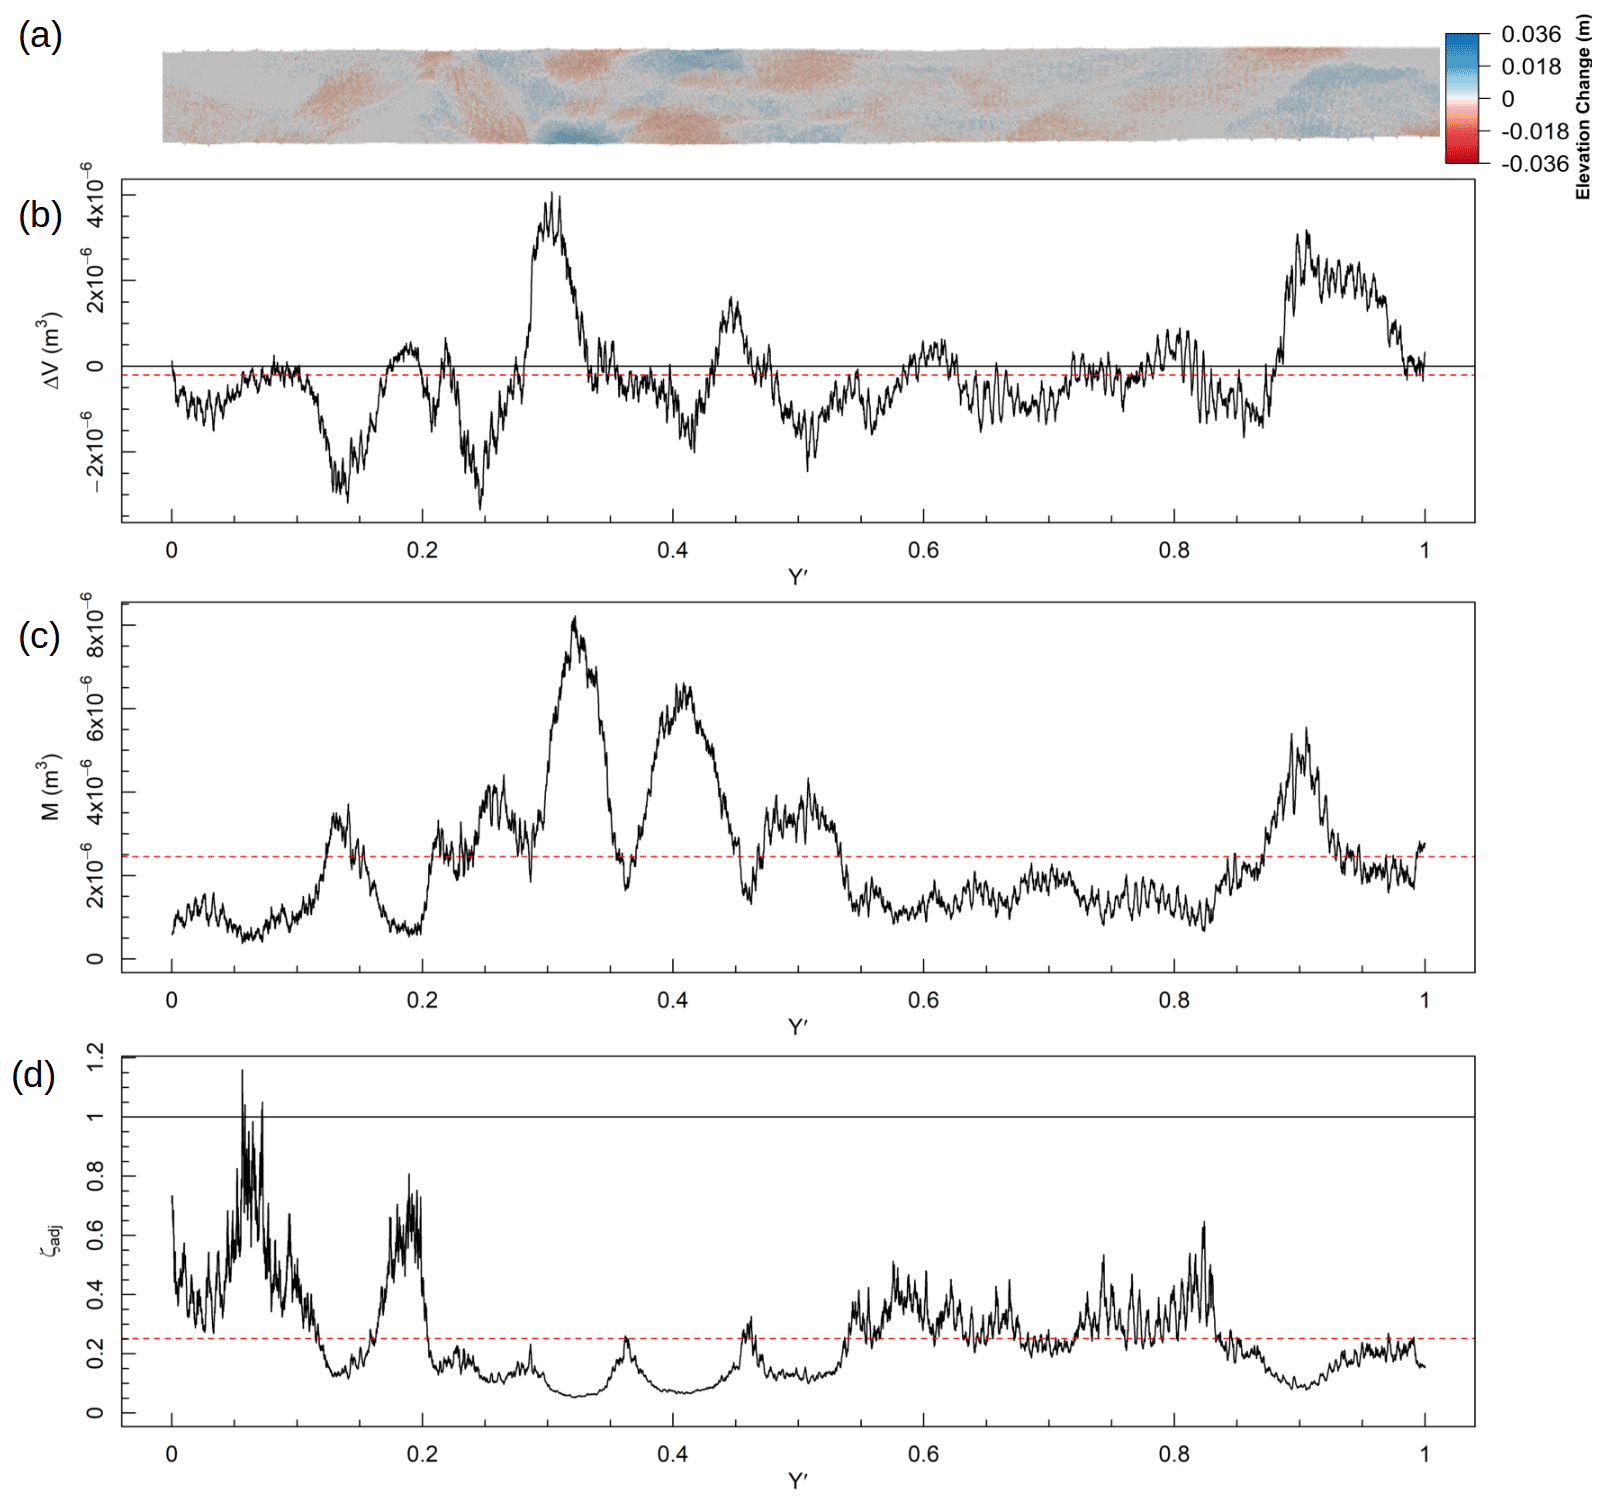
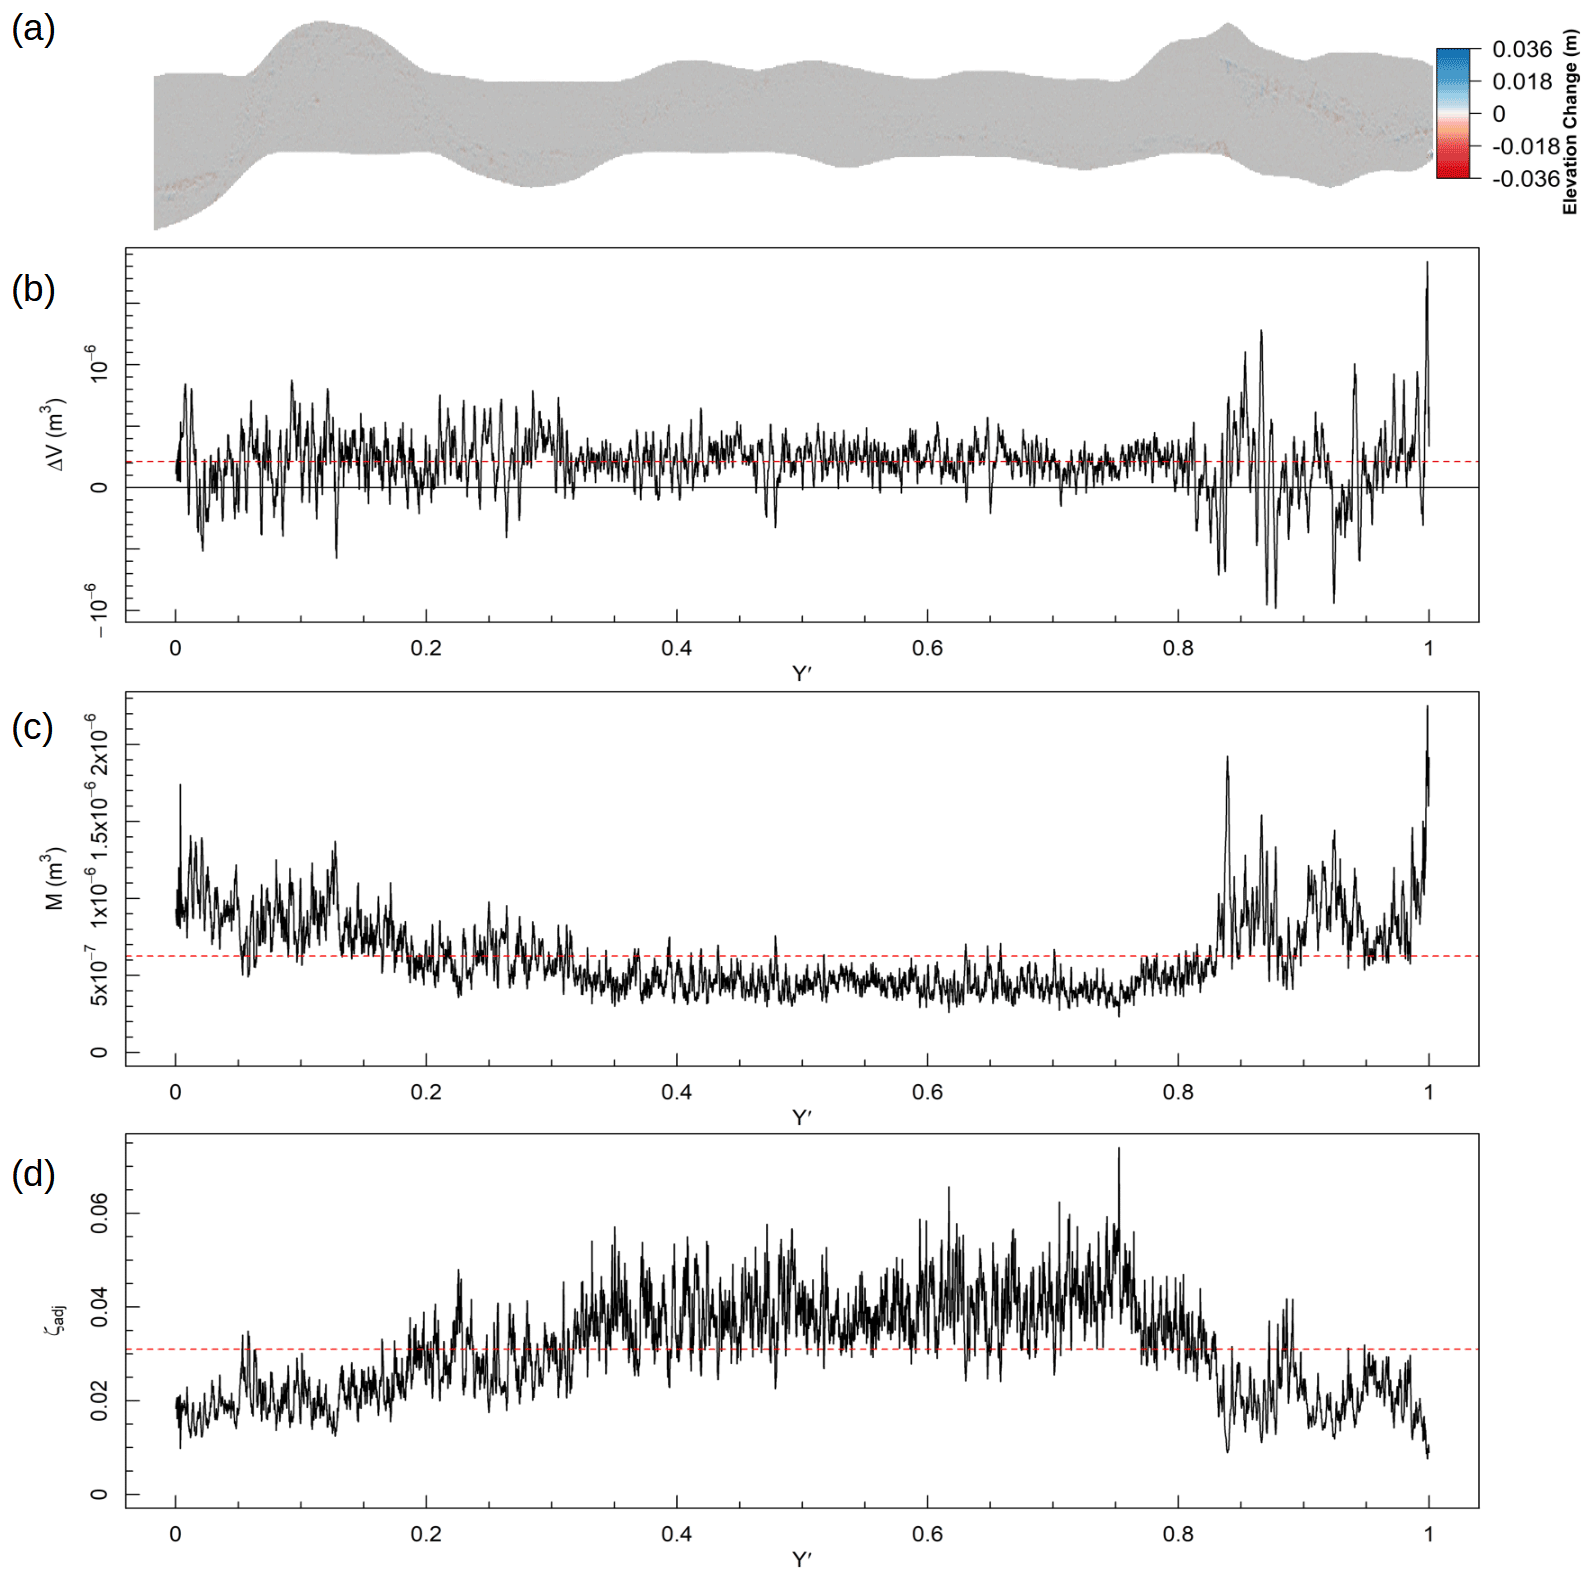
Figure 8Example calculation of ζ for T=15–20 min in the fixed-bank experiment. Flow is from the right and Y′ represents the normalised distance upstream from the outlet. Panel (a) shows the whole DoD. Panel (b) shows ΔV at each cross section, the black line shows ΔV=0, and the red dashed line shows mean ΔV. Panel (c) shows M at each cross section, and the red dashed line shows mean M. Panel (d) shows the adjusted throughput ratio (ζadj) calculated with Eq. (6c), the black line shows ζ=1, and the red dashed line shows mean ζ.
The time step with the highest total m value of the mobile-bank experiment is shown in Fig. 9. Here, ΔV varied about 0 with a preference for deposition just downstream of the inlet and erosion at the outlet. The pattern of M shows a strong association with the locations where the channel begins to meander, in particular the upstream-most and downstream-most expansions of the channel, and the formation of four bends between –0.7. Throughout the channel, however, the character was predominantly below a throughput ratio of 1, with peaks in this value corresponding to relatively unmodified sections separating these loci of erosion, i.e. cross-over riffles. It is only at these sites of limited activity that ζ exceeded unity and identifies hotspots of throughput behaviour. Otherwise the channel underwent predominantly exchange-based deformation between these two time steps as internal reorganisation outweighed sediment conveyance.
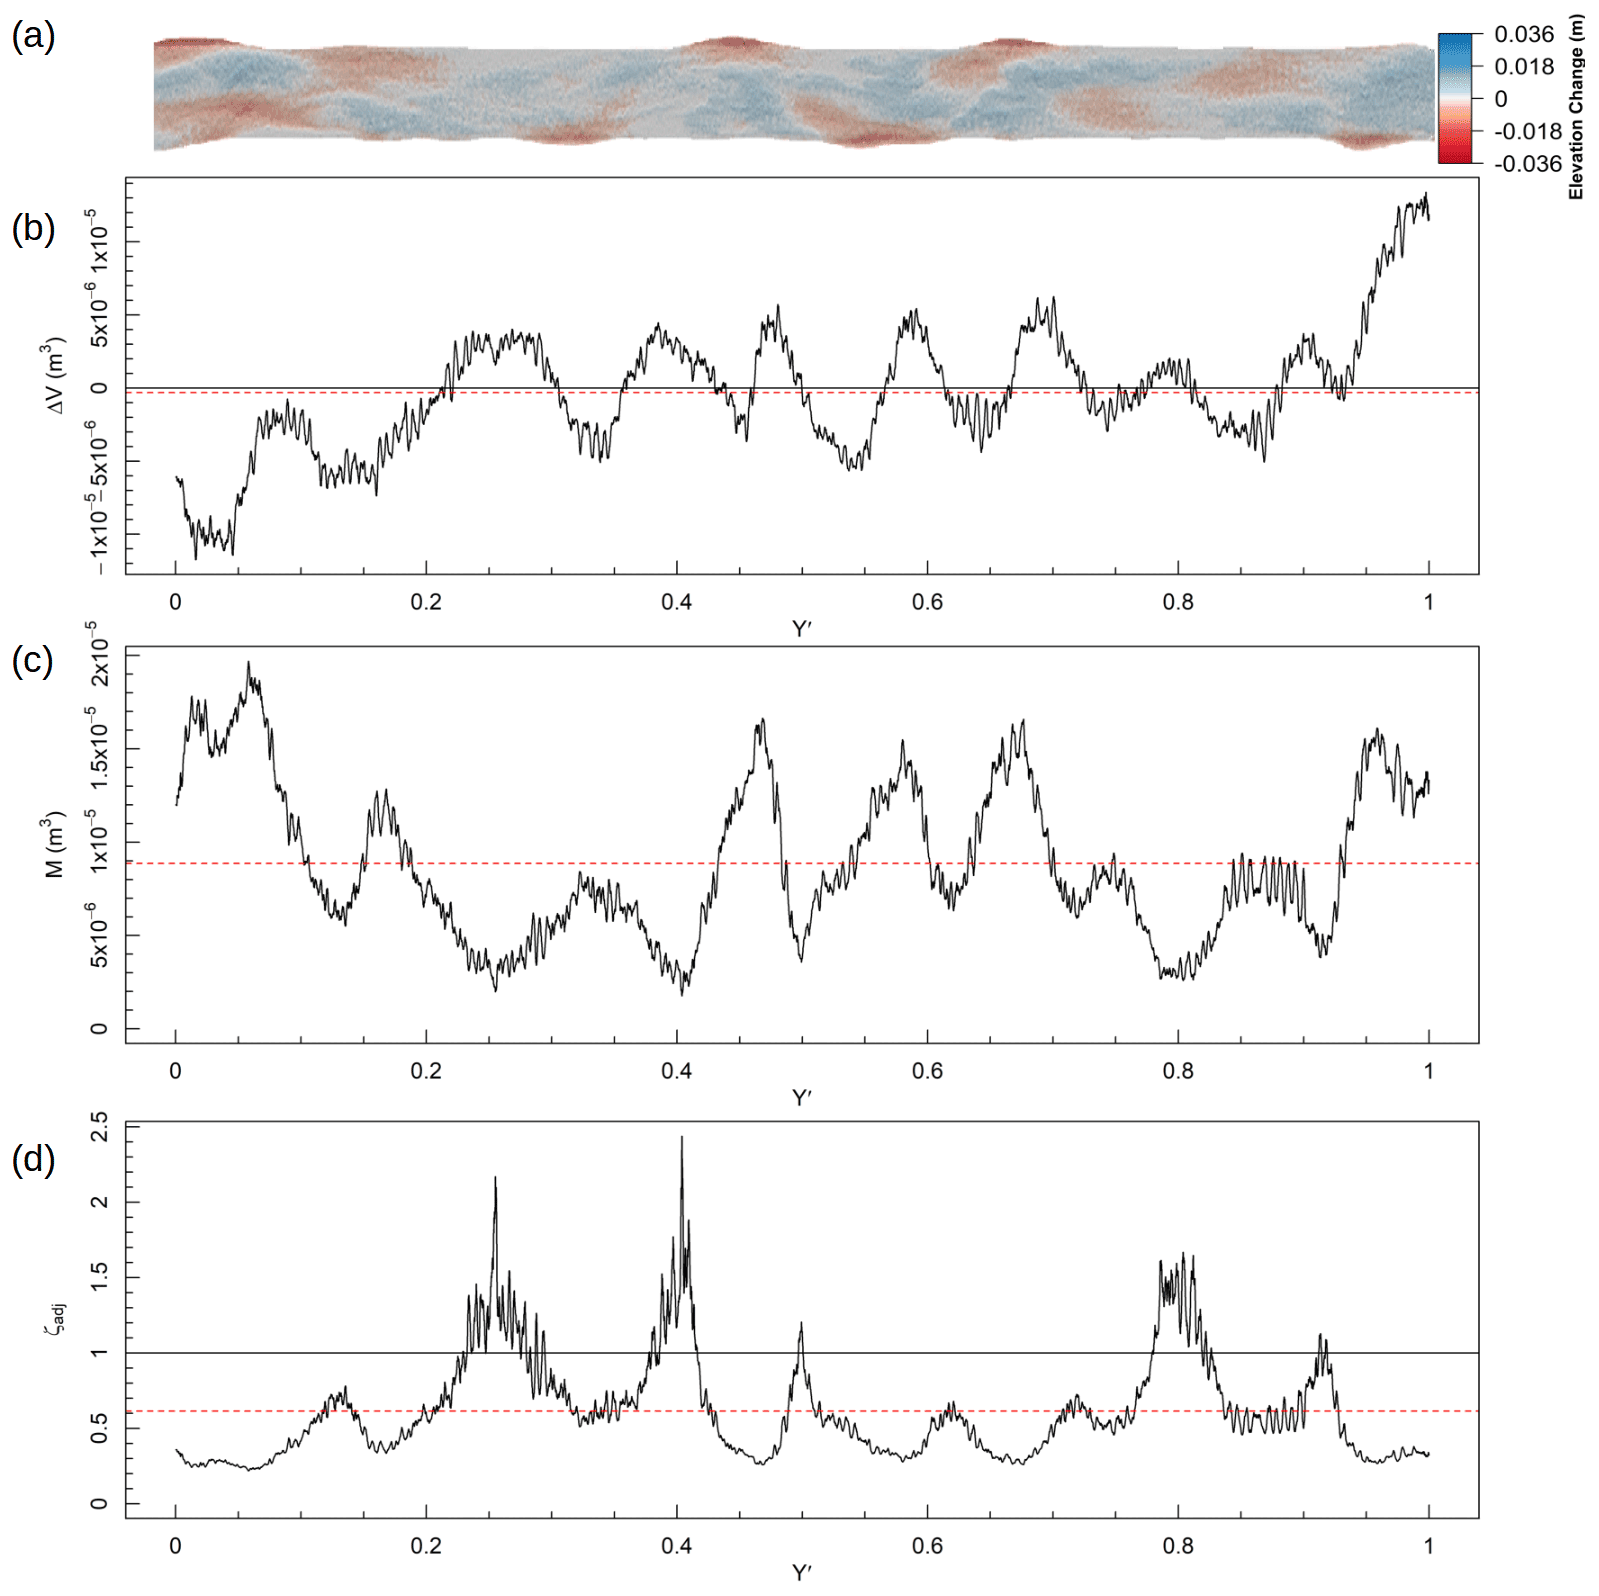
Figure 9Example calculation of ζ for T=15–30 min in the mobile-bank experiment. See Fig. 8 for explanation.
The time step with the smallest range of m values observed in the fixed-bank experiment is presented in Fig. 10. ΔV here showed a strong dependence on changes due to the position of the thalweg, with most change being located along the former and current position of the main flow path. This is localised as an upstream storage of material (–1) and erosion of the material in the midsection (–0.6) of the channel. Troughs in M are associated with ΔV values of 0, whilst peaks occurred alongside maxima and minima in ΔV. The corresponding threshold ratio shows a system clearly dominated by the throughput of material over the deformation of the bed surface, punctuated with zones of even higher than mean ζ where very low rates of M occurred.
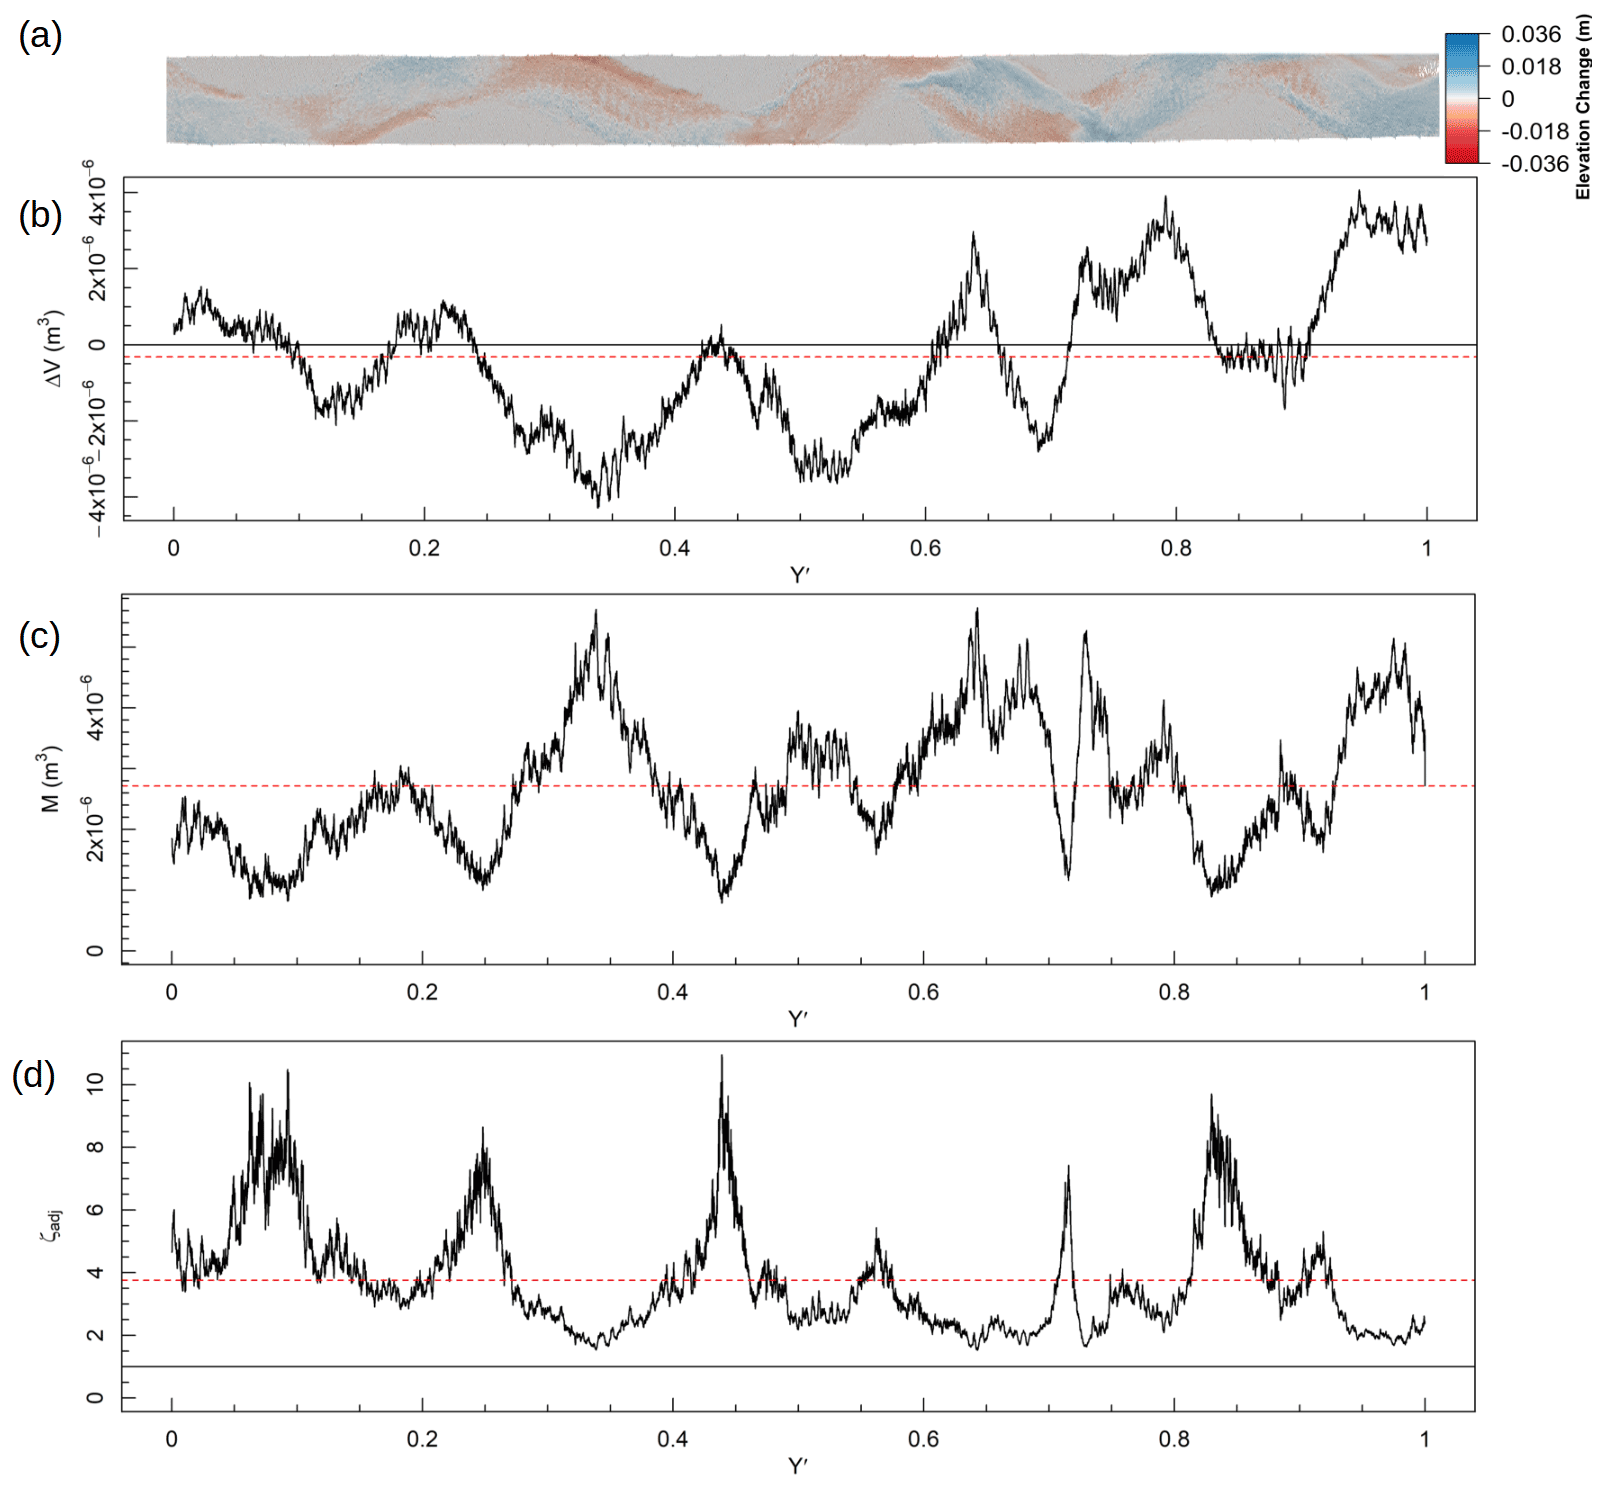
Figure 10Example calculation of ζ for T=480–600 min in the fixed-bank experiment. See Fig. 8 for explanation.
Finally, the time step with the most consistently low m values observed in the mobile-bank experiment is presented in Fig. 10. Sediment is stored over the length of the channel; however, the magnitude of this storage is low and relatively consistent; in particular, variation in ΔV is remarkably small between –0.8. The consistent nature of this section is highlighted in the distribution of M along the channel following a weak parabola for which –0.8 is the minimum; the upstream and downstream edges have approximately twice the mean value of the centre. The activity surrounding the inlet was of a higher value but a shorter length than that of the more extensive change found near the outlet. The resulting ζ values were low, given the very low Qb value, as almost all work done within this reach is representative of very small-scale bed deformation that did not lead to sediment output (and due to the prior time step did not result in sediment input).
The two experimental designs presented in this paper produced greatly differing morphodynamics and trajectories thereof in the response of a screeded bed to the imposition of flow. Through the constraint of the channel by inerodible elements, the fixed-bank system evolved into one that transmits its supplied sediment and lacks any ability to reduce its output of material. In contrast, their absence allowed the channel in the mobile-bank experiment to widen and greatly reduce the flow depths, enabling a reduction of both sediment transport and further change. This difference is not simply an appeal to the maximum friction factor hypothesis of Davies and Sutherland (1983) that being able to widen will necessarily increase the wetted perimeter as the mobile-bank channel converts to a less efficient shape but one that includes an appreciation for the role of expansion on shear reduction (Simon and Thorne, 1996). The potential range of flow depths is reduced and their average value lower when energy may be expended on channel widening and true thalweg meandering rather than concentrated on fixed banks and allowed to scour. As a result the final behaviour and physical assemblage of the bed elements represent the cumulative effect of process manifest upon the channel and its constituents.
This difference in morphodynamics is solidified when the analysis of the channel is focussed on process (i.e. sediment transport) and process from form (i.e. metrics derived from surfaces of change). River channels may share a great deal of similarity in given characteristics but may diverge in stable state, given the non-linear nature of their dynamics and feedback-based mediation of character (Phillips, 1992, 2003). This divergence in behaviour is a fundamental property of form–process interactions and one that is impossible to trace without an explicit analysis of process, especially so considering the myriad processes by which similar forms may emerge. Thus in the analysis of channel behaviour a focus on the form, or being, does not convey information without the inclusion of process, or becoming (Rhoads, 2006).
The final form of the channels' “being” in the experiments presented herein is simply a manifestation of the difference in becoming and processes available to the channel due to lateral deformation. When the channel is allowed to laterally widen, the initial phase of morphology formation is achieved but there is a tendency towards decreasing and eventually stabilising transport as the channel's ability to continue to do work is decreased. Concurrent with an increase in the width : depth ratio is a reduction in shear stress and the ability to entrain material. The same impulse of energy spread out over a larger area causes any further deformation of the boundary to occur at a slower rate. This change in channel shape removes two sources of perturbation from the system. Primarily, an inability to entrain material through a reduction of shear stress reduces the channel's ability to do further work, having adjusted to a lower state of change for this specific impulse of energy. Secondarily, the reduction of sediment entrainment reduces the supply of sediment to sequential time steps. Ordinarily the supply of sediment provides a source of channel deformation through deposition as bars or interaction with bed material; however, in the mobile-bank experiment supply was instead rendered useless through localised deposition near the inlet. In contrast, although further deformation was also reduced in the fixed-bank experiment the continued transmission of sediment due to a lack of shear stress reduction below a disentrainment threshold (Reitz and Jerolmack, 2012) caused a transition into a purely throughput-dominated system. Thus the potential for continued change is removed by the deformation achieved during lateral expansion of the channel boundary.
The use of these analyses presented here is meant as supplementary to existing methods in order to develop a full picture of morphodynamics. Given their calculation using commonly collected data (sediment transport and surface elevations), this suite of tools offers an insight into the processes happening within a channel. Centring the study on what is happening at a large scale (Fig. 6) allows for a general analysis of the pattern of change, whilst a finer degree of classification is achievable through a spatialisation of this method (Figs. 8–11), providing a quantitative lens through which one may view the inherently qualitative process of surface change. In identifying patterns of change we may assign classifiers, such as the throughput and storage zones of Desloges and Church (1989), according to the interaction between net and absolute volumetric change. For example, in Fig. 9 areas of compensating activity result in zero (or near-zero) net change that varies above and below the throughput or exchange threshold as riffles acted to route sediment between the active erosional and depositional areas. In doing so, additional explanatory power is given to more traditional views of process, such as the grounding of geomorphology in the principles of mechanics (e.g. Strahler, 1952).
The strength of this process-driven approach (sensu Whitehead, 1929) is the assignment of behaviour to an action rather than the outcome of the action. In doing so, there is a more direct linkage between the processes available to a channel and a classification according to those processes. Successful incorporations of process improve the efficacy and dynamism of classificatory systems. For example, the identification of threshold behaviour in conjunction with an association of certain forms with process informed much of Schumm's work on channel classification (e.g. Schumm, 1977, 1979, 1985). An appreciation for these nuances of process between and within channel types can inform management of rivers as well as their study.
Whilst data are perhaps this method's greatest strength, they may act also as its greatest barrier to application. Although sediment transport data and surface elevations are commonly collected, each of these are associated with numerous issues namely the difficulty with which one must collect these data during the periods with the highest rates of morphologic activity. In addition to which, tracking the evolution of the morphodynamic styles benefits from high-frequency data, potentially limiting application in infrequently surveyed areas. This methodology thrives on the regular capture of both sediment transport and elevation data in concert, enabled here through the use of an experimental abstraction. Certainly then, this is limited in application to heavily instrumented or frequently visited field sites. However, the improvement in data collection is beginning to offset the elevation data requirements. The advancement of photogrammetry and the proliferation of small UAV-based lidar has already improved data collection in both experimental and field studies (Williams et al., 2015; Morgan et al., 2017; Kellner et al., 2019; Leduc et al., 2019; Resop et al., 2019). Thus the data gap between what is feasible and what is necessary for this approach in the field is closing and has already closed within a laboratory context.
This paper presents a new metric to represent morphodynamics that is calculated from the volumes of change and sediment transport of a given reach. This methodology is rooted in the apparent relationship between morphology and sediment transport, proposed in works such as Exner (1925), Neill (1971), and Ashmore and Church (1998). An explicit path length relation is avoided here, but a relation is instead inferred between the sediment transport behaviour and deformation as representative of the extent of active layer deformation. Employing this technique in the analysis of morphodynamics, ζ is presented as holistically representing form-derived process (morphologic change) and the product of said process (sediment transport). This methodology produces a quantitative separation between two types of morphodynamics that may be used to aid the often qualitative assessment of morphodynamics and channel behaviour. This suite of tools can provide additional support when classifying channels, given the inherent difficulty in the analysis of process in channels.
Sample data and code are available at https://doi.org/10.5281/zenodo.6237686 (Booker, 2022).
WHB collected the data, wrote the code for analysis, and produced the majority of the paper. BCE provided editorial feedback to improve the structure and flow of the paper.
The contact author has declared that neither they nor their co-author has any competing interests.
Publisher's note: Copernicus Publications remains neutral with regard to jurisdictional claims in published maps and institutional affiliations.
Thanks to our colleagues who provided feedback on this paper, in particular David Adams, Lucy MacKenzie, and Conor McDowell. In addition we would like to thank the work of the referees and editorial team, whose comments greatly improved the paper. This work was supported by a scholarship provided by the government of Canada.
This paper was edited by Lina Polvi Sjöberg and reviewed by two anonymous referees.
Abrahams, A. D., Li, G., and Atkinson, J. F.: Step-Pool Streams: Adjustment to Maximum Flow Resistance, Water Resour. Res., 31, 2593–2602, https://doi.org/10.1029/95WR01957, 1995. a
Adams, D. L. and Zampiron, A.: Short Communication: Multiscalar Roughness Length Decomposition in Fluvial Systems Using a Transform-Roughness Correlation (TRC) Approach, Earth Surf. Dynam., 8, 1039–1051, https://doi.org/10.5194/esurf-8-1039-2020, 2020. a, b
Ancey, C.: Bedload Transport: A Walk between Randomness and Determinism. Part 1. The State of the Art, J. Hydraul. Res., 58, 1–17, https://doi.org/10.1080/00221686.2019.1702594, 2020. a
Ancey, C., Böhm, T., Jodeau, M., and Frey, P.: Statistical Description of Sediment Transport Experiments, Phys. Rev. E, 74, 011302, https://doi.org/10.1103/PhysRevE.74.011302, 2006. a, b
Ashmore, P. E.: How Do Gravel-Bed Rivers Braid?, Can. J. Earth Sci., 28, 326–341, https://doi.org/10.1139/e91-030, 1991. a
Ashmore, P. E. and Church, M.: Sediment Transport and River Morphology; a Paradigm for Study, in: Gravel-Bed Rivers in the Environment, edited by: Klingeman, P. C., Beschta, R. L., Komar, P. D., and Bradley, J., Water Resources Publications, Oregon, 115–139, ISBN 9781887201131, 1998. a, b
Booker, W. H.: WillBooker/WB_BC_ESurf_2021: Updated for Publication (Version V1.1), Zenodo [data set, code], https://doi.org/10.5281/zenodo.6237686, 2022. a
Booker, W. H. and Eaton, B. C.: Stabilising Large Grains in Self-Forming Steep Channels, Earth Surf. Dynam., 8, 51–67, https://doi.org/10.5194/esurf-8-51-2020, 2020. a, b
Buffington, J. M. and Montgomery, D. R.: 9.36 Geomorphic Classification of Rivers, in: Treatise on Geomorphology, edited by: Shroder, J. F., Academic Press, San Diego, 730–767, https://doi.org/10.1016/B978-0-12-374739-6.00263-3, 2013. a
Church, M.: Geomorphic Thresholds in Riverine Landscapes, Freshwater Biol., 47, 541–557, https://doi.org/10.1046/j.1365-2427.2002.00919.x, 2002. a
Church, M.: Bed Material Transport and the Morphology of Alluvial River Channels, Annu. Rev. Earth Planet. Sci., 34, 325–354, https://doi.org/10.1146/annurev.earth.33.092203.122721, 2006. a
Church, M. and Ferguson, R. I.: Morphodynamics: Rivers beyond Steady State, Water Resour. Res., 51, 1883–1897, https://doi.org/10.1002/2014WR016862, 2015. a
Davies, T. R. H. and Sutherland, A. J.: Extremal Hypotheses for River Behavior, Water Resour. Res., 19, 141–148, https://doi.org/10.1029/WR019i001p00141, 1983. a
Desloges, J. R. and Church, M. A.: Wandering Gravel-Bed Rivers, The Canadian Geographer/Le Géographe canadien, 33, 360–364, https://doi.org/10.1111/j.1541-0064.1989.tb00922.x, 1989. a, b, c
Dhont, B. and Ancey, C.: Are Bedload Transport Pulses in Gravel Bed Rivers Created by Bar Migration or Sediment Waves?, Geophys. Res. Lett., 45, 5501–5508, https://doi.org/10.1029/2018GL077792, 2018. a, b
Eaton, B. C. and Lapointe, M. F.: Effects of Large Floods on Sediment Transport and Reach Morphology in the Cobble-Bed Sainte Marguerite River, Geomorphology, 40, 291–309, https://doi.org/10.1016/S0169-555X(01)00056-3, 2001. a
Exner, F. M.: Über Die Wechselwirkung Zwichen Wasser Und Gescibe in Flüssen, Sitzungber. Acad. Wissenscaften Wien Math. Naturwiss. Abt. 2a, 134, 165–180, 1925. a, b
Fenton, J. D. and Abbott, J. E.: Initial Movement of Grains on a Stream Bed: The Effect of Relative Protrusion, P. Roy. Soc. Lond. A, 352, 523–537, https://doi.org/10.1098/rspa.1977.0014, 1977. a
Friedkin, J. F.: Laboratory Study of the Meandering of Alluvial Rivers, US Army Engineer Waterways Experiment Station, Vicksburg, Mississippi, https://hdl.handle.net/11681/2955 (last access: 17 March 2022), 1945. a
Ganti, V., Meerschaert, M. M., Foufoula-Georgiou, E., Viparelli, E., and Parker, G.: Normal and Anomalous Diffusion of Gravel Tracer Particles in Rivers, J. Geophys. Res.-Earth, 115, F00A12, https://doi.org/10.1029/2008JF001222, 2010. a
Hardy, R. J., Best, J. L., Parsons, D. R., and Marjoribanks, T. I.: On the Evolution and Form of Coherent Flow Structures over a Gravel Bed: Insights from Whole Flow Field Visualization and Measurement, J. Geophys. Res.-Earth, 121, 1472–1493, https://doi.org/10.1002/2015JF003753, 2016. a
Hassan, M. A., Church, M., and Ashworth, P. J.: Virtual Rate and Mean Distance of Travel of Individual Clasts in Gravel-Bed Channels, Earth Surf. Proc. Land., 17, 617–627, https://doi.org/10.1002/esp.3290170607, 1992. a
Hassan, M. A., Saletti, M., Johnson, J. P. L., Ferrer-Boix, C., Venditti, J. G., and Church, M.: Experimental Insights Into the Threshold of Motion in Alluvial Channels: Sediment Supply and Streambed State, J. Geophys. Res.-Earth, 125, e2020JF005736, https://doi.org/10.1029/2020JF005736, 2020. a
Kasprak, A., Wheaton, J. M., Ashmore, P. E., Hensleigh, J. W., and Peirce, S.: The Relationship between Particle Travel Distance and Channel Morphology: Results from Physical Models of Braided Rivers, J. Geophys. Res.-Earth, 120, 55–74, https://doi.org/10.1002/2014JF003310, 2015. a
Kellner, J. R., Armston, J., Birrer, M., Cushman, K. C., Duncanson, L., Eck, C., Falleger, C., Imbach, B., Král, K., Krůček, M., Trochta, J., Vrška, T., and Zgraggen, C.: New Opportunities for Forest Remote Sensing Through Ultra-High-Density Drone Lidar, Surv. Geophys., 40, 959–977, https://doi.org/10.1007/s10712-019-09529-9, 2019. a
Lane, E. W.: A Study of the Shape of Channels Formed by Natural Streams Flowing in Erodible Material, Missouri River Division Sediment Series No. 9, US Army Corps of Engineers Missouri River Division, Omaha, Nebraska, https://hdl.handle.net/11681/8944 (last access: 17 March 2022), 1957. a
Leduc, P., Peirce, S., and Ashmore, P.: Short Communication: Challenges and Applications of Structure-from-Motion Photogrammetry in a Physical Model of a Braided River, Earth Surf. Dynam., 7, 97–106, https://doi.org/10.5194/esurf-7-97-2019, 2019. a
Leopold, L. B. and Maddock, T.: The Hydraulic Geometry of Stream Channels and Some Physiographic Implications, USGS Numbered Series 252, US Government Printing Office, Washington, DC, https://doi.org/10.3133/pp252, 1953. a
Lisle, T. E., Ikeda, H., and Iseya, F.: Formation of Stationary Alternate Bars in a Steep Channel with Mixed-Size Sediment: A Flume Experiment, Earth Surf. Proc. Land., 16, 463–469, https://doi.org/10.1002/esp.3290160507, 1991. a
MacKenzie, L.: Channel Stability in Alluvial Gravel-Bed Streams, PhD thesis, University of British Columbia, Vancouver, Canada, 171 pp., https://doi.org/10.14288/1.0379863, 2019. a, b
MacKenzie, L. G. and Eaton, B. C.: Large Grains Matter: Contrasting Bed Stability and Morphodynamics during Two Nearly Identical Experiments, Earth Surf. Proc. Land., 42, 1287–1295, https://doi.org/10.1002/esp.4122, 2017. a
Montgomery, D. R. and Buffington, J. M.: Channel Classification, Prediction of Channel Response, and Assessment of Channel Condition, Tech. Rep. TFW-SH10-93-002, Washington State Department of Natural Resources, Olympia, Washington, 1993. a
Montgomery, D. R. and Buffington, J. M.: Channel-Reach Morphology in Mountain Drainage Basins, Geol. Soc. Am. Bull., 109, 596–611, https://doi.org/10.1130/0016-7606(1997)109<0596:CRMIMD>2.3.CO;2, 1997. a, b
Montgomery, D. R., Abbe, T. B., Buffington, J. M., Peterson, N. P., Schmidt, K. M., and Stock, J. D.: Distribution of Bedrock and Alluvial Channels in Forested Mountain Drainage Basins, Nature, 381, 587–589, https://doi.org/10.1038/381587a0, 1996. a
Morgan, J. A., Brogan, D. J., and Nelson, P. A.: Application of Structure-from-Motion Photogrammetry in Laboratory Flumes, Geomorphology, 276, 125–143, https://doi.org/10.1016/j.geomorph.2016.10.021, 2017. a
Neill, C. R.: River Bed Transport Related to Meander Migration Rates, J. Waterway. Harbor. Coast. Eng. Div., 97, 783–786, 1971. a, b, c, d
Phillips, J.: Nonlinear Dynamical Systems in Geomorphology: Revolution or Evolution?, Geomorphology, 5, 219–229, https://doi.org/10.1016/0169-555X(92)90005-9, 1992. a
Phillips, J. D.: Sources of Nonlinearity and Complexity in Geomorphic Systems, Prog. Phys. Geogr., 27, 1–23, https://doi.org/10.1191/0309133303pp340ra, 2003. a
Popov, I. V.: Application of Morphological Analysis to the Evaluation of the General Channel Deformations of the River Ob, Soviet Hydrol., 3, 267–324, 1962. a
Pyrce, R. S. and Ashmore, P. E.: Bedload Path Length and Point Bar Development in Gravel-Bed River Models, Sedimentology, 52, 839–857, https://doi.org/10.1111/j.1365-3091.2005.00714.x, 2005. a
Redolfi, M., Welber, M., Carlin, M., Tubino, M., and Bertoldi, W.: Morphometric Properties of Alternate Bars and Water Discharge: A Laboratory Investigation, Earth Surface Dynamics, 8, 789–808, https://doi.org/10.5194/esurf-8-789-2020, 2020. a
Reitz, M. D. and Jerolmack, D. J.: Experimental Alluvial Fan Evolution: Channel Dynamics, Slope Controls, and Shoreline Growth, J. Geophys. Res.-Earth, 117, F02021, https://doi.org/10.1029/2011JF002261, 2012. a
Resop, J. P., Lehmann, L., and Hession, W. C.: Drone Laser Scanning for Modeling Riverscape Topography and Vegetation: Comparison with Traditional Aerial Lidar, Drones, 3, 35, https://doi.org/10.3390/drones3020035, 2019. a
Rhoads, B. L.: The Dynamic Basis of Geomorphology Reenvisioned, Ann. Assoc. Am. Geogr., 96, 14–30, https://doi.org/10.1111/j.1467-8306.2006.00496.x, 2006. a, b
Rosgen, D. L.: A Classification of Natural Rivers, Catena, 22, 169–199, 1994. a
Rust, B. R.: Structure and Process in a Braided River, Sedimentology, 18, 221–245, https://doi.org/10.1111/j.1365-3091.1972.tb00013.x, 1972. a
Schumm, S. A.: The Fluvial System, John Wiley & Sons, New York, ISBN 9780471019015, 1977. a, b
Schumm, S. A.: Geomorphic Thresholds: The Concept and Its Applications, T. Inst. Brit. Geogr., 4, 485–515, 1979. a
Schumm, S. A.: Patterns of Alluvial Rivers, Annu. Rev. Earth Planet. Sci., 13, 5–27, 1985. a, b
Simon, A. and Thorne, C. R.: Channel Adjustment of an Unstable Coarse-Grained Stream: Opposing Trends of Boundary and Critical Shear Stress, and the Applicability of Extremal Hypotheses, Earth Surf. Proc. Land., 21, 155–180, https://doi.org/10.1002/(SICI)1096-9837(199602)21:2<155::AID-ESP610>3.0.CO;2-5, 1996. a
Strahler, A. N.: Dynamic Basis of Geomorphology, Geol. Soc. Am. Bull., 63, 923–938, https://doi.org/10.1130/0016-7606(1952)63[923:DBOG]2.0.CO;2, 1952. a, b
Vargas-Luna, A., Crosato, A., and Uijttewaal, W. S. J.: Effects of Vegetation on Flow and Sediment Transport: Comparative Analyses and Validation of Predicting Models, Earth Surf. Proc. Land., 40, 157–176, https://doi.org/10.1002/esp.3633, 2015. a
Wheaton, J. M., Brasington, J., Darby, S. E., Kasprak, A., Sear, D., and Vericat, D.: Morphodynamic Signatures of Braiding Mechanisms as Expressed through Change in Sediment Storage in a Gravel-Bed River, J. Geophys. Res.-Earth, 118, 759–779, https://doi.org/10.1002/jgrf.20060, 2013. a, b
Whitehead, A. N.: Process and Reality: An Essay in Cosmology, Macmillan, New York, ISBN 0029345804, 1929. a
Wilcock, P. R.: Critical Shear Stress of Natural Sediments, J. Hydraul. Eng., 119, 491–505, 1993. a
Williams, R. D., Rennie, C. D., Brasington, J., Hicks, D. M., and Vericat, D.: Linking the Spatial Distribution of Bed Load Transport to Morphological Change during High-Flow Events in a Shallow Braided River: Spatially Distributed Bedload Transport, J. Geophys. Res.-Earth, 120, 604–622, https://doi.org/10.1002/2014JF003346, 2015. a, b
Zimmermann, A., Church, M., and Hassan, M. A.: Step-Pool Stability: Testing the Jammed State Hypothesis, J. Geophys. Res.-Earth, 115, F02008, https://doi.org/10.1029/2009JF001365, 2010. a