the Creative Commons Attribution 4.0 License.
the Creative Commons Attribution 4.0 License.
 | 03 Jun 2022
Spatio-temporal variability and controlling factors for postglacial denudation rates in the Dora Baltea catchment (western Italian Alps)
Pierre G. Valla
Romain Delunel
Natacha Gribenski
Marcus Christl
Naki Akçar
Disentangling the influence of lithology from the respective roles of climate, topography and tectonic forcing on catchment denudation is often challenging in mountainous landscapes due to the diversity of geomorphic processes in action and of spatial and temporal scales involved. The Dora Baltea catchment (western Italian Alps) is an ideal setting for such investigation, since its large drainage system, extending from the Mont Blanc Massif to the Po Plain, cuts across different major lithotectonic units of the western Alps, whereas this region has experienced relatively homogeneous climatic conditions and glacial history throughout the Quaternary. We acquired new 10Be-derived catchment-wide denudation rates from 18 river-sand samples collected both along the main Dora Baltea river and at the outlet of its main tributaries. The inferred denudation rates vary between 0.2 and 0.9 mm yr−1, consistent with previously published values across the European Alps. Spatial variability in denudation rates was statistically compared with topographic, environmental and geological metrics. 10Be-derived denudation rates do not correlate with modern precipitation and rock geodetic uplift. We find, rather, that catchment topography, in turn conditioned by bedrock structures and erodibility (lithotectonic origin) and glacial overprint, is the main driver of 10Be-derived denudation patterns. We calculated the highest denudation rate for the Mont Blanc Massif, whose granitoid rocks and long-term tectonic uplift support high elevations, steep slopes and high relief and thus favour intense glacial and periglacial processes and recurring rockfall events. Finally, our results, in agreement with modern sediment budgets, demonstrate that the high sediment input from the Mont Blanc catchment dominates the Dora Baltea sediment flux, explaining the constant low 10Be concentrations measured along the Dora Baltea course even downstream the multiple junctions with tributary catchments.
- Article
(5286 KB) - Full-text XML
-
Supplement
(583 KB) - BibTeX
- EndNote


The use of in situ 10Be concentrations measured in river sediments to quantify catchment-wide denudation rates over centennial to millennial timescale is now well-established (e.g. Brown et al., 1995; Granger et al., 1996; Bierman and Steig, 1996; Granger and Schaller, 2014). 10Be concentrations are measured at the outlet of the studied basin and are inversely correlated with mean catchment denudation rate (von Blanckenburg, 2005). Widespread research has used this technique to estimate catchment denudation around the globe (see reviews in Portenga and Bierman, 2011; Willenbring et al., 2013; Codilean et al., 2018) and specifically in mountain belts such as the European Alps (Delunel et al., 2020, and references therein), with the aim of illustrating the controlling mechanisms on recent (102–105 years) denudation dynamics and assessing the respective roles of climate and tectonics forcing.
In mountainous areas, the climatic imprint on the Earth's surface denudation has been recognized over both long and short timescales. Over the Late Cenozoic to Quaternary, temperature fluctuations, increased precipitation and glaciations have participated in a worldwide increase in erosion rates(e.g. Peizhen et al., 2001; Herman et al., 2013). In the European Alps, climate forcing has led to significant topographic modification through increased slope steepness and relief (e.g. Valla et al., 2011, 2021), which in turn triggered a postglacial erosional response (Norton et al., 2010; Valla et al., 2010; Glotzbach et al., 2013; Dixon et al., 2016). Over recent timescales (102–103 years), climate has exerted a control on denudation rates through precipitation and associated runoff (Moon et al., 2011; Bookhagen and Strecker, 2012) and by governing temperature- and precipitation-dependent glacial and periglacial erosion processes (e.g. Delunel et al., 2010). Alternatively, other studies have shown a dominant lithotectonic control on denudation rates (e.g. Cruz Nunes et al., 2015). Rock-uplift and denudation rates are strongly coupled, with (1) erosional unloading driving uplift through isostatic rebound (Wittmann et al., 2007; Champagnac et al., 2009) and (2) tectonic rock uplift itself conditioning denudation rate by building new topographic gradient and increasing channel incision (e.g. Burbank et al., 1996; Montgomery and Brandon, 2002; Binnie et al., 2007; Godard et al., 2014). In transient landscapes such as recently deglaciated alpine settings, the topographic relief has not reached a steady state equilibrium between rock uplift and denudation (e.g. Schlunegger and Hinderer, 2003; Delunel et al., 2020) and bedrock lithology may exert a significant control on millennial catchment denudation rates through its structure and erosional resistance (erodibility, Kühni and Pfiffner, 2001). More resistant lithologies have contrasting potential controls on denudation, (1) either decreasing denudation rates because of rock-mechanical strength (Scharf et al., 2013) or (2) promoting higher denudation rates by sustaining steep topography (Norton et al., 2011).
In the European Alps, the large-scale compilation of catchment-wide denudation rates by Delunel et al. (2020) highlighted (1) the first-order correlation between denudation rate and mean catchment slope (derived from glacial imprint on Alpine topography), (2) the absence of relationship between modern climate and denudation patterns and (3) a significant correlation between rock uplift and denudation for >100 km2 catchments. This compilation also pointed at a rather weak control of bedrock lithology on denudation, with the lowest rates in the low-elevation foreland areas (with clastic sedimentary lithologies) and highest rates in the high-elevation crystalline parts (with gneissic, granitic or metamorphic lithologies) within the core of the Alps. This trend, however, was not investigated further, since, at the scale of the European Alps, it appeared difficult to disentangle the relative influence of bedrock erodibility, topography and tectonic forcing on denudation rate as these are closely interrelated. Our study thereby aims to further explore the potential links and controls between climatically driven topography, tectonic uplift and bedrock erodibility on the efficiency of denudation processes by investigating spatial variability of 10Be-derived denudation rates within the Dora Baltea (DB) catchment (western Italian Alps; Fig. 1). The DB catchment appears the ideal setting for this investigation, since its large drainage system, extending from the Mont Blanc Massif (4808 m a.s.l.) to the Po Plain (around 200 m a.s.l.), cuts across the main lithotectonic units of the western Alps (Fig. 2). Relatively similar climatic gradients and glacial history but variable bedrock lithology and geodetic uplift within the DB catchment and its tributaries allow us to assess how spatial variability in bedrock erodibility between lithotectonic units may participate in controlling catchment topography and 10Be-derived denudation rates.
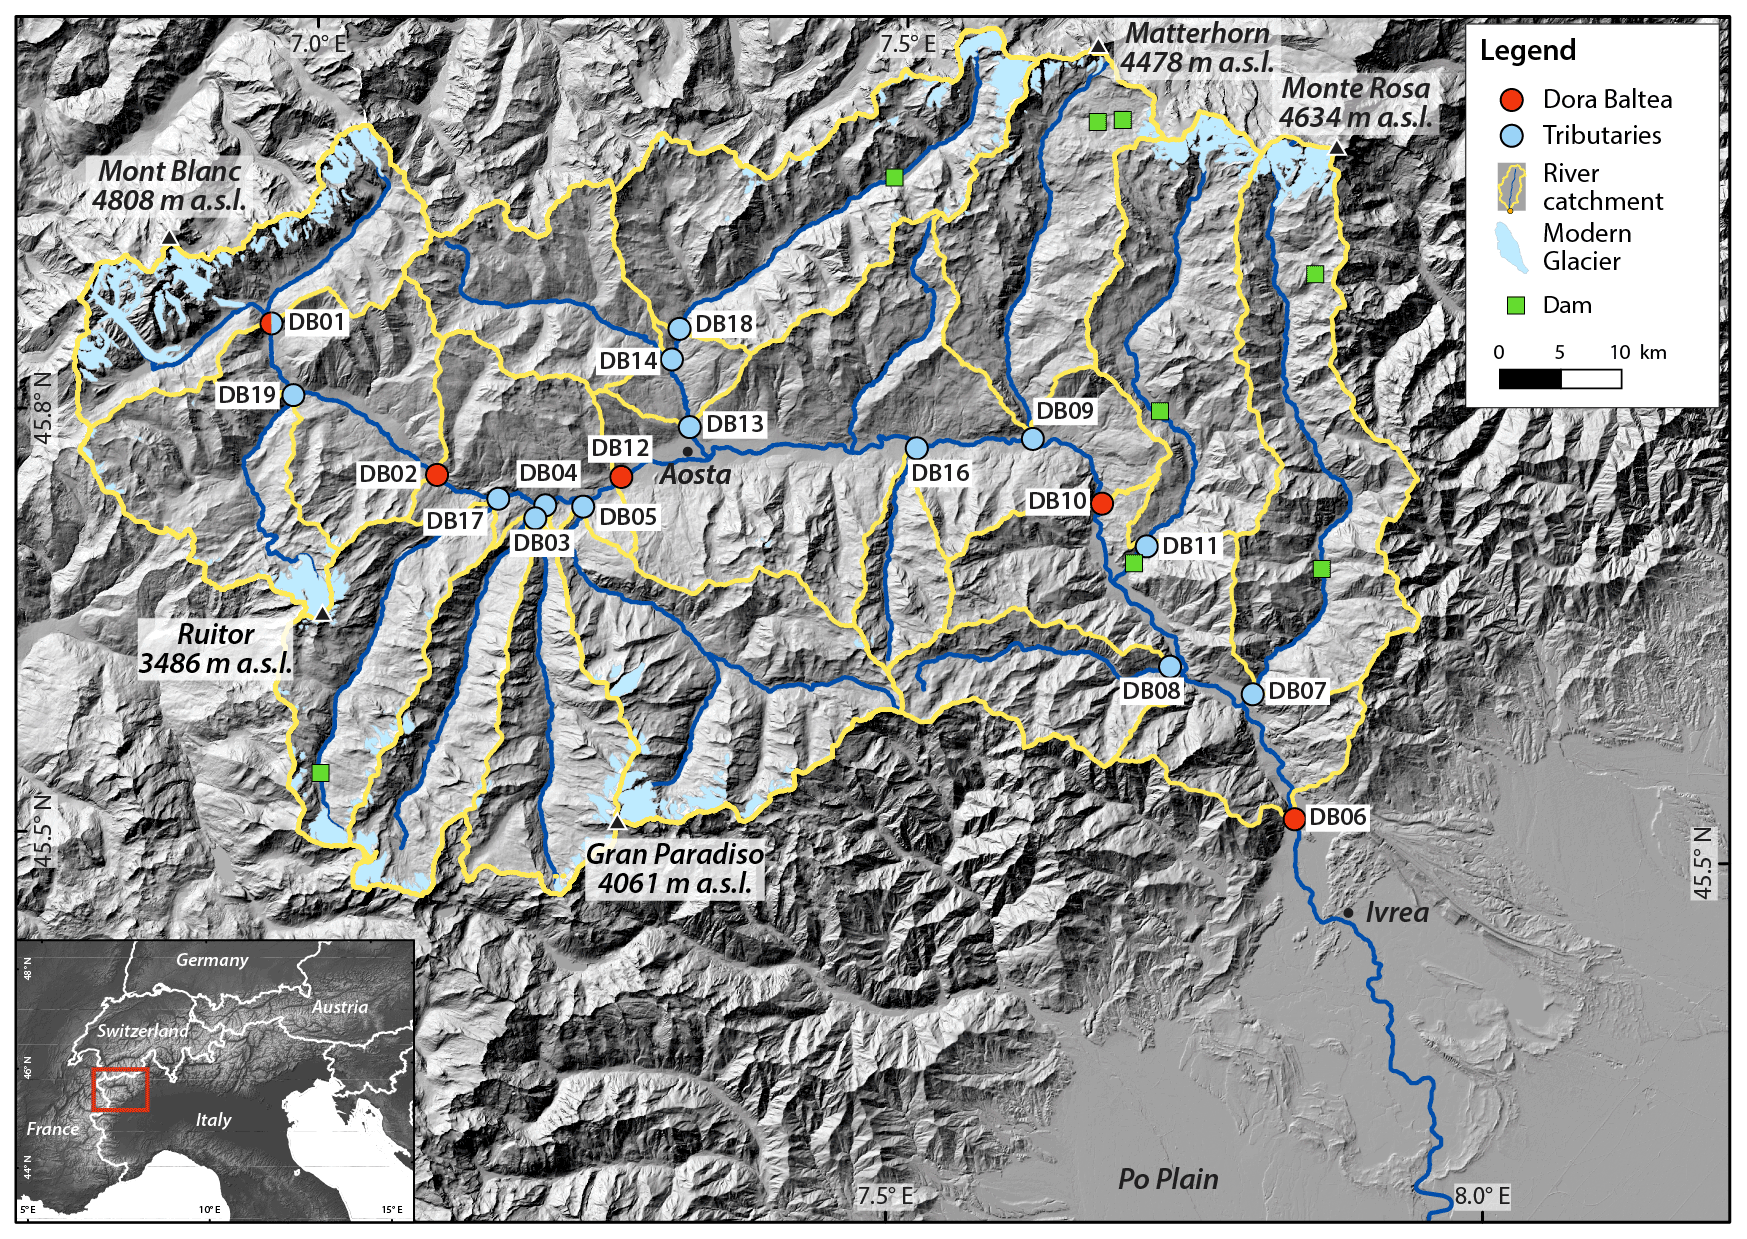
Figure 1Study area with investigated Dora Baltea and main tributary river catchments (mosaic DEM from Regione Autonoma Valle d'Aosta, Regione Piemonte, swisstopo and Institut Géographique National). Red and light blue circles indicate locations of river-sediment samples collected along the Dora Baltea river and at the outlet of the main river tributaries, respectively (for DB01, red–light blue circle as the sample is located along the Dora Baltea, but it is considered to be an individual tributary). Solid yellow lines delimit the catchments upstream of each sampling location (sample names indicated in the white box). Present-day glaciers (GlaRiskAlp Project, http://www.glariskalp.eu, last access: November 2021), main topographic peaks and dams are indicated. Inset shows location of the DB catchment (open red box) within the European Alps.
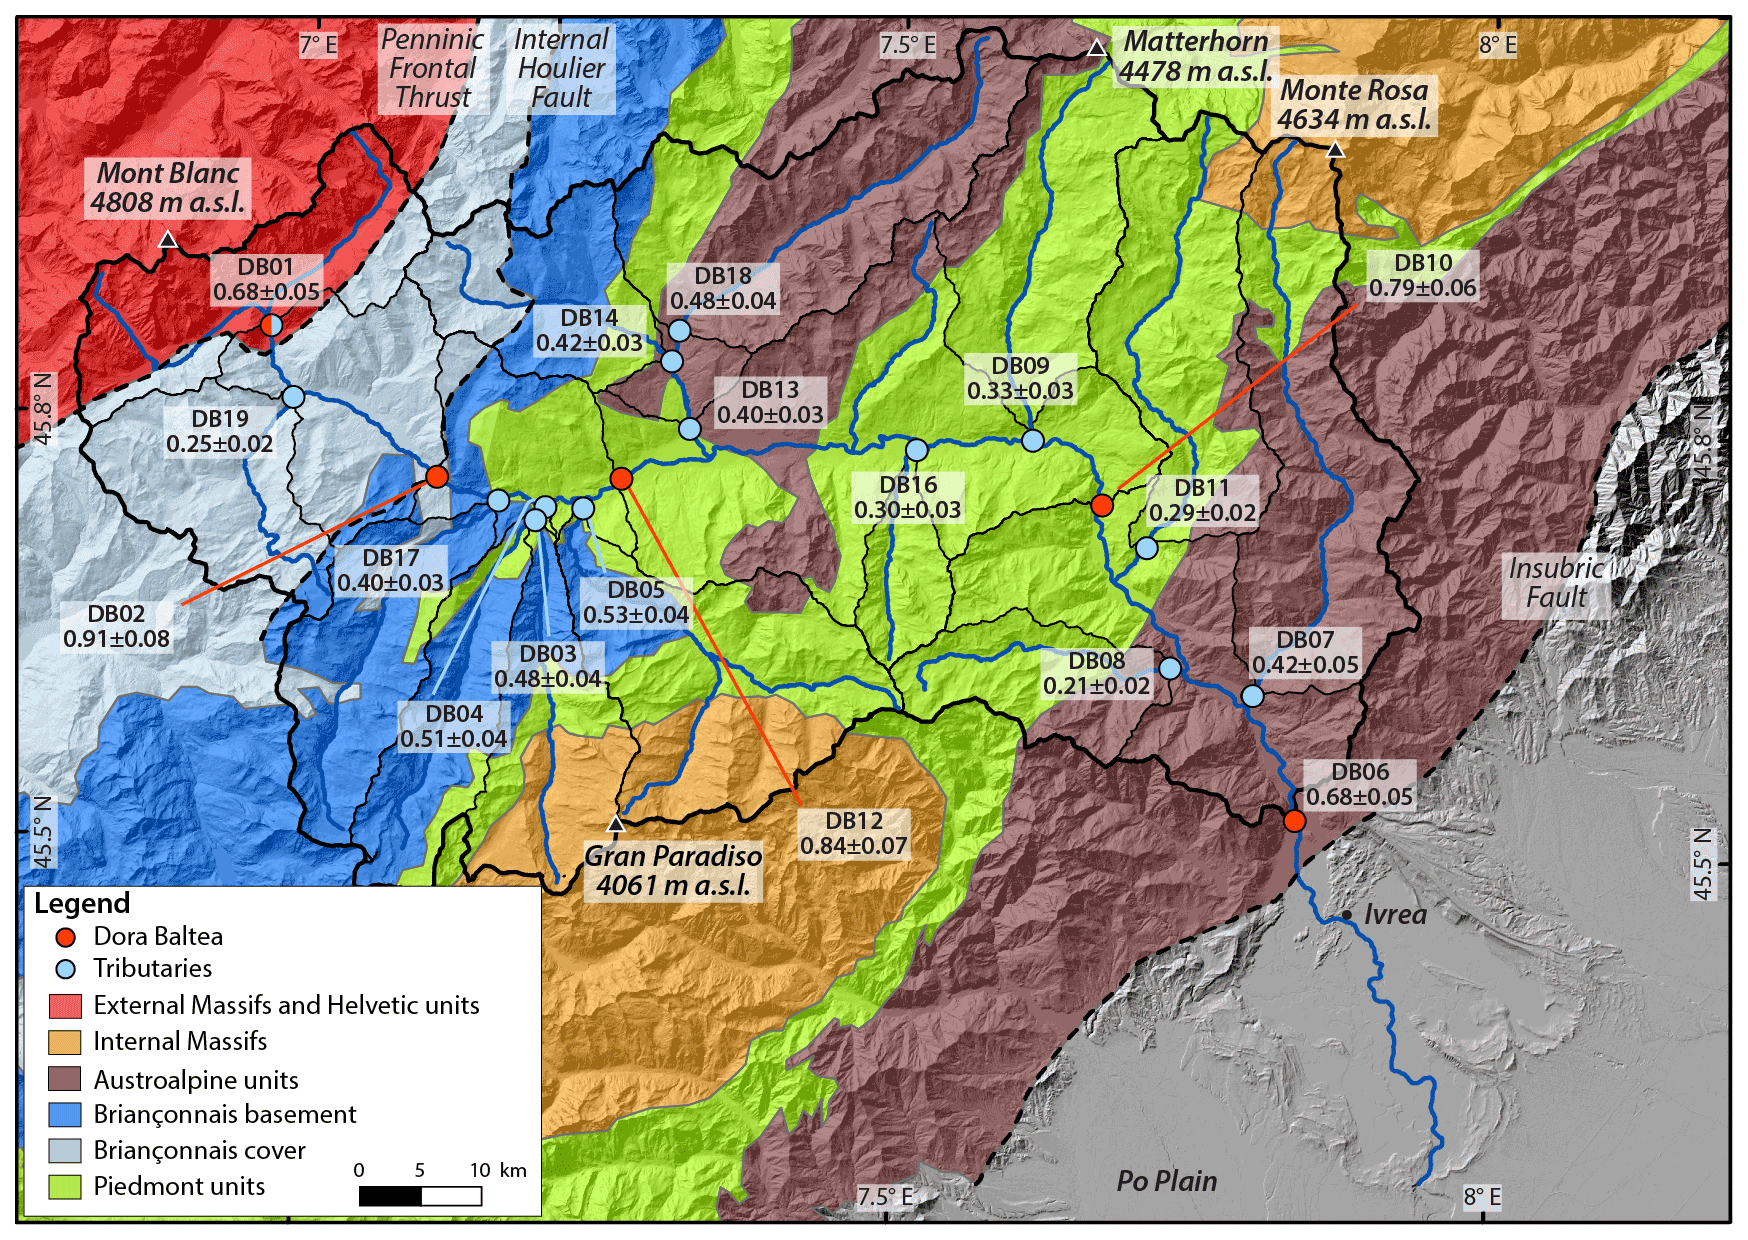
Figure 2Simplified lithotectonic map of the study area with output catchment-wide denudation rates (±1σ, mm yr−1) reported at sampling locations (catchment boundaries in solid black lines). Major lithotectonic domains and structural features (dashed lines) of the western European Alps are shown (modified map after Resentini and Malusà, 2012). Output catchment-wide denudation rates are corrected for topographic, LIA glacier and snow shielding, as well as for quartz content (see text and Table 1 for details).
Table 1River-sediment sample locations, measured 10Be concentrations, calculated mean catchment 10Be production rates, and output denudation rates and apparent ages. Sample coordinates are given in decimal degrees (dd), and sample names collected along the main DB river are written in italics. Production rate estimates (and derived denudation rates and apparent ages) are provided for (1) topographic shielding correction (column labelled “Uncor.”) and (2) including corrections for topographic shielding, snow and LIA glacier shielding and for quartz content (column labelled “Cor.”). Mean catchment 10Be production rates (and derived catchment denudation rates) obtained by applying each individual correction are reported in Table S2.

The Dora Baltea (DB) catchment is a large drainage system of ∼3900 km2 located in the western Italian Alps (Fig. 1). Over a 170 km long distance, the DB river flows NW–SE from the Mont Blanc Massif to the Po Plain and drains several tributaries connected to major >4000 m Alpine peaks (e.g. Mont Blanc, Monte Rosa, Matterhorn and Gran Paradiso; Fig. 1). Present-day mean annual temperatures range from −10 ∘C in high-elevation zones to 15 ∘C at valley bottoms (Regione Autonoma Valle d'Aosta, 2009). Precipitation varies between the semi-arid conditions prevailing at low elevations in the central part of the DB valley (mean annual precipitation of 400–500 mm yr−1) and the wet conditions in the high-elevation internal valleys (Isotta et al., 2014). Higher mean annual precipitation values are observed in the Mont Blanc Massif (around 1800 mm yr−1) compared to the northwestern and southern sectors of the DB catchment (around 1400 mm yr−1 for the Matterhorn and Monte Rosa area, and around 1150 mm yr−1 in the Grand Paradiso; Isotta et al., 2014). Present-day glaciers cover 3.6 % of the total DB area and are distributed within the upstream high-elevation parts of DB tributary catchments (Fig. 1), with terminus glacier elevations ranging from 2601 to 2800 m a.s.l. (data from 2005; Diolaiuti et al., 2012).
The geology of the DB catchment is complex, since its drainage network cuts across the main lithotectonic units of the western Alps, recording the long-term collisional history between the European and Adriatic plates (e.g. Dal Piaz et al., 2008; Perello et al., 2008; Polino et al., 2008; Fig. 2). West of the Penninic Frontal Thrust, the European basement is exposed in the granitoid of the Mont Blanc external massif and its Helvetic sedimentary cover. Bedrock units belonging to the thinned European crust (gneisses and schists of the Briançonnais basement and its terrigenous to carbonate metasedimentary cover, high-pressure gneisses of the internal massifs), the Tethyan oceanic crust (meta-ophiolite and calcschists of the Piedmont units) and the Adriatic margin (Austroalpine gneisses and eclogitic micaschists) are exposed roughly from NW to SE across the axial belt, delimited by the Penninic Frontal Thrust to the NW and the Insubric Fault to the SE (Fig. 2). Long-term (106–107 years) exhumation rates from bedrock apatite fission-track data are higher in the western sector of the DB catchment (0.4–0.7 km Myr−1 for the external zones, west of Internal Houiller Fault; Fig. 2) than in the east (0.1–0.3 km Myr−1 for the internal zones, i.e. between the Internal Houiller and the Insubric faults, Malusà et al., 2005; Fig. 2). A similar pattern has been illustrated by short-term sediment budgets inferred from detrital apatite fission-track (Resentini and Malusà, 2012) and sediment gauge (Bartolini et al., 1996; Vezzoli, 2004; Bartolini and Fontanelli, 2009) data. Modern geodetic rock uplift also appears spatially variable within the DB catchment, with rates up to 1–1.6 mm yr−1 in the Monte Rosa, Mont Blanc and Ruitor areas, around 0.6–0.7 mm yr−1 in the axial belt and in the Gran Paradiso Massif, while decreasing to 0.2 mm yr−1 in the Po Plain (Sternai et al., 2019). For the entire DB catchment, a 10Be-derived denudation rate of 0.6 mm yr−1 was obtained by Wittmann et al. (2016, sample T12).
The DB catchment was repeatedly glaciated during the Quaternary, with major glaciers covering most of the catchment with the exception of the highest peaks (∼3000 km2, >1000 m thick; Serra et al., 2022) and extending into the Po Plain during the Last Glacial Maximum (LGM, ca. 26–19 ka; Clark et al., 2009). The tributary glaciers already retreated in their upper valley catchments during the Lateglacial climatic oscillations (14–12 ka; Baroni et al., 2021; Serra et al., 2022). As shown by the present-day topography (Fig. 1), postglacial fluvial dissection and hillslope processes have locally re-shaped the glacial landscape, with the development of V-shaped valley profiles and the deposition of large alluvial fans and infills along the main valleys.
3.1 10Be-derived catchment-wide denudation rates
A total of 18 river-sand samples were collected within the DB catchment, 5 along the main DB river and 13 at the outlet of the main tributaries (Fig. 1). One sample (DB06) was collected at the same location as sample T12 from Wittmann et al. (2016) to assess for the possible temporal variability of the in situ 10Be signal exported by the DB river. Around 20–50 g of pure quartz were extracted from the 250–400 µm grain-size fraction, following sieving, magnetic separation and leaching in diluted HCl, H3PO4 and HF (detailed protocol reported in Akçar et al., 2017). The purified quartz was dissolved in concentrated HF after addition of around 200 µg of 9Be carrier (Table S1), and Be extraction was performed through anion and cation exchange column chemistry (Akçar et al., 2017). Measurements of 10Be 9Be ratios were performed at ETH Zürich with the MILEA AMS system (Maxeiner et al., 2019) and normalized to the ETH in-house standards S2007N and S2010N (isotope ratios and , respectively; Christl et al., 2013). Calculated 10Be concentrations (Table 1) were corrected using a full process blank 10Be 9Be ratio of .
Spatially averaged 10Be production rates were derived from pixel-based calculations conducted with the Basinga “Production rates” GIS tool (Charreau et al., 2019), using a 35 m resolution DEM from Regione Autonoma Valle d'Aosta and Regione Piemonte as input for catchment topography. For production rate calculations, we used the Lal–Stone time-dependent scaling model (Lal, 1991; Stone, 2000), which integrates corrections for atmospheric pressure and geomagnetic field fluctuations according to the ERA-40 reanalysis database (Uppala et al., 2005) and the Muscheler's VDM database (Muscheler et al., 2005), respectively. The total 10Be surface production rate at each DEM cell of the studied catchments was calculated based on a 10Be production rate at sea-level and high-latitude (SLHL) of 4.18±0.26 at g−1 yr−1 (Martin et al., 2017) considering relative contributions of 98.86 %, 0.87 % and 0.27 % by neutrons, slow muons and fast muons, respectively (Charreau et al., 2019, after Braucher et al., 2011, and Martin et al., 2017). Attenuation length values of 160, 1500 and 4320 g cm−2 were used for neutrons, slow muons and fast muons, respectively (Charreau et al., 2019, after Braucher et al., 2011), and a rock density of 2.7 g cm−3 was assumed. Denudation-rate uncertainties (1σ external) were estimated only based on values and relative errors of 10Be concentrations and cosmogenic production rates from neutron and muons (Eq. 5 in Charreau et al., 2019). Integration times associated with the denudation rates (i.e. the time needed to erode the uppermost ∼0.6 m of bedrock and ∼1 m of soil; von Blanckenburg, 2005) were calculated as mean estimates (no uncertainty propagated).
Catchment-averaged production rates were corrected for (1) topographic shielding, (2) quartz content, (3) Little Ice Age (LIA, 1250–1860 CE) glacier cover and (4) snow shielding (Charreau et al., 2019). Catchment topographic shielding was computed with the “toposhielding” TopoToolbox function (Schwanghart and Scherler, 2014), following the method of Dunne et al. (1999) and Codilean (2006). We acknowledge the recent publication by DiBiase (2018) suggesting no need to correct for topographic shielding when calculating catchment-wide 10Be denudation rates. Our 10Be production rates were however corrected for topographic shielding to follow a conservative approach similar to the recent Alpine compilation study by Delunel et al. (2020). As reported in Table 1, mean topographic shielding values obtained within the DB catchment are all very similar (∼0.95), implying that neglecting the topographic-shielding correction would result in similar output rates generally within error estimates.
Based on the - and -scale digital geological maps from Regione Autonoma Valle d'Aosta and Regione Piemonte, respectively, we mapped and excluded from the 10Be production-rate calculation the catchment areas covered by mafic and non-siliceous sedimentary (carbonate) bedrock (Fig. S1), based on the assumption that they do not provide (or to a minor extent) quartz grains to the fluvial routing system. Crystalline bedrock and Quaternary deposits (Fig. S1) were instead considered as quartz-bearing lithologies in our approach. In addition, we excluded areas with slope <3∘, assuming that they are likely not linked to the stream network or act as storage and/or transfer areas and therefore do not reflect catchment denudation (Fig. S1; Delunel et al., 2010). In order to estimate shielding correction due to glacier cover, 10Be production rates were set to null for areas covered by LIA glaciers (GlaRiskAlp Project, http://www.glariskalp.eu, last access: November 2021; Fig. S1). This conservative approach assumes sufficient ice thickness for complete cosmic-ray shielding (e.g. Delunel et al., 2010; Wittmann et al., 2007). Shielding correction factors for snow cover were calculated as function of the average elevation for each individual catchment, by applying an empirical model reported in Delunel et al. (2020) and predicting snow-shielding factors as a function of elevation for the European Alps. The obtained average snow-shielding correction factors vary between 0.82 and 0.87 and were combined to the topographic-shielding corrections as scaling factors for each sub-catchment. Catchment-wide denudation rates were then obtained using the previously calculated catchment-averaged 10Be production rates and the measured 10Be concentrations (Table 1), with the Basinga “Denudation rates” GIS tool (Charreau et al., 2019).
3.2 Topographic, environmental and geological metrics
We investigated potential drivers conditioning the observed spatial variability in DB catchment-wide denudation rates, and to this aim we performed topographic analyses and extracted environmental and geological variables of the quartz-bearing areas (Fig. S1) for each investigated catchment through an ArcGIS-MATLAB routine (Delunel et al., 2020).
Topographic analyses were conducted using a 35 m resolution DEM (Regione Autonoma Valle d'Aosta and Regione Piemonte). We calculated drainage area, mean elevation, mean slope, percentage of slopes steeper than 40∘, geophysical relief and hypsometric integral for the quartz-bearing areas of the individual catchments (Table 2). For slope analyses, the “gradient8” TopoToolbox function was used (Schwanghart and Scherler, 2014), returning the steepest downward gradient of the 8-connected neighbouring cells of the DEM. The percentage of catchment slope steeper than 40∘ was calculated as indicative of the areal proportion of oversteepened threshold landscape (DiBiase et al., 2012). The geophysical relief (i.e. averaged elevation differences between a surface connecting highest topographic points and the current topography; Small and Anderson, 1998) was calculated in ArcGIS using a 5 km radius sampling window and can be used as an indicator of past landscape change or potential for locally increased erosion (see Champagnac et al., 2014, for discussion). The hypsometric integral was computed based on Eq. (1) from Brocklehurst and Whipple (2004) and is inversely related to the stage of landscape evolution (i.e. more evolved landscapes, whose high-elevation areas have been eroded, present low hypsometric integrals).
Table 2Topographic, environmental and geological metrics extracted for the studied catchments (upstream of sampling river locations for 10Be analysis). Names of sample collected along the main DB river are given in italics. With the exception of the total drainage area, all the metrics were calculated using the quartz-bearing area of each catchment. See text for details.

In addition, we extracted average values of the following environmental variables for the quartz-bearing areas of each individual catchment. Average annual precipitation was obtained from the 5 km resolution grid of mean annual Alpine precipitation from Isotta et al. (2014), in order to investigate the potential influence of modern precipitation and runoff on denudation dynamics. Percentage of bare-rock area was estimated from the extent of class 30 (“bare bedrock”) of the 100 m resolution CORINE Land Cover Inventory (2018, https://land.copernicus.eu/pan-european/corine-land-cover/clc2018, last access: November 2021), to consider if catchment areas with null to low soil and vegetation cover have higher denudation rates. LIA glacier areal cover was calculated based on the LIA glacier extent mapped within the GlaRiskAlp Project (http://www.glariskalp.eu, last access: November 2021), to assess the influence of modern to historical glacial and periglacial processes on output 10Be-derived denudation rates (Delunel et al., 2010). Mean LGM ice thickness and areal percentage of each catchment above the LGM equilibrium line altitude (ELA) were estimated using the LGM paleo-glacier reconstruction of the DB system (70 m resolution, LGM ELA at 2103 m a.s.l.; Serra et al., 2022). Both metrics give an indication on the LGM glacial imprint on topography and subsequent potential for postglacial erosion response (Norton et al., 2010; Salcher et al., 2014; Delunel et al., 2020). Catchment average temperature was not estimated since, at the relatively constant latitude of the investigated catchments, temperature variability directly follows catchment hypsometric distribution and thus relates to catchment elevation, which is one of the metrics analysed in our study.
Lastly, we extracted geological variables for the studied catchments. Based on the simplified lithotectonic map of the DB catchment (Fig. 2), modified after Resentini and Malusà (2012), we estimated the relative proportion of the different lithotectonic units within the quartz-bearing areas of each catchment. Catchment-average geodetic uplift rates were considered using the 30 km resolution interpolation grid from Sternai et al. (2019), here downscaled to 600 m resolution grid (Delunel et al., 2020).
4.1 Spatial variability in catchment-wide denudation rates
Calculated catchment-wide denudation rates vary according to the applied production-rate correction factors (Table S2). Uncorrected denudation rates (i.e. including only mean catchment topographic shielding and excluding areas with slope <3∘) range between 0.27±0.02 and 1.49±0.13 mm yr−1, while rates obtained by applying all corrections vary between 0.21±0.02 and 0.91±0.08 mm yr−1 (Table 1 and Fig. 2). Significant production-rate corrections were obtained when taking into account snow shielding and LIA glacier cover (up to 17 % and 42 % reduction compared to uncorrected 10Be production and denudation rates, respectively), especially for catchments with high mean elevations and associated large LIA glacier coverage (DB01 in particular; Table 2). Lower corrections were obtained when considering quartz-bearing areas (maximum 10 % reduction in output 10Be production and denudation for catchments DB08 and 11, where relatively abundant sedimentary and mafic bedrock occurs; Fig. S1). All corrections combined together lead to reduction in 10Be production and denudation rates of 16 %–53 % compared to the uncorrected estimates (Table S2). Hereafter, we consider 10Be production and denudation rates obtained by applying all corrections (Table 1 and Fig. 2), in order to maintain a conservative approach as in the recent Alpine compilation study (Delunel et al., 2020) and we acknowledge that our corrected catchment-averaged 10Be production and denudation rates should be considered as minimum estimates.
10Be concentrations measured in the riverine samples collected along the main DB river (DB01, 02, 12, 10, 06) are the lowest and homogeneous along the DB course (1.1–1.5 ×10⁴ at g−1; Fig. 3). A slightly increasing trend in 10Be concentrations with the river distance can be observed, thereby illustrating a progressive supply of more concentrated sediments by the tributaries. The only exception to this top-down trend along the DB is observed between DB01 and DB02 where the sediment 10Be concentration is diluted by ∼16 %. A possible explanation for such a dilution may arise from shielded materials supplied by the incision of a bedrock gorge located between samples DB01 and DB02 sampling sites (and upstream of the tributary junction with catchment DB19). Samples DB01, 02, 12, 10, 06 yield the highest and almost constant denudation rates (0.7–0.9 mm yr−1), showing a slightly decreasing trend with the river distance, excluding sample DB01 (Fig. 2). Because of its generally higher elevation and steeper topography, catchment DB01 shows the maximum production rate corrections for topographic, snow shielding and LIA glacier cover (Table S2) and consequently yield a lower output denudation rate compared to the other sampling locations downstream along the main DB river (DB02, 12, 10; Fig. 2), despite similar 10Be concentrations (Fig. 3). This suggested overcorrection of the 10Be production rate for the DB01 catchment is reflected by the large difference between uncorrected and corrected denudation rates (1.45 and 0.68 mm yr−1, respectively, Table 1). Within tributary catchments, with the exception of sample DB01, 10Be concentrations are higher (2.0–4.9×10⁴ at g−1; Fig. 3), and calculated denudation rates are lower, generally within 0.4–0.5 mm yr−1 and down to 0.2–0.3 mm yr−1 for some catchments (DB08, 09, 11, 16 and 19; Fig. 2).
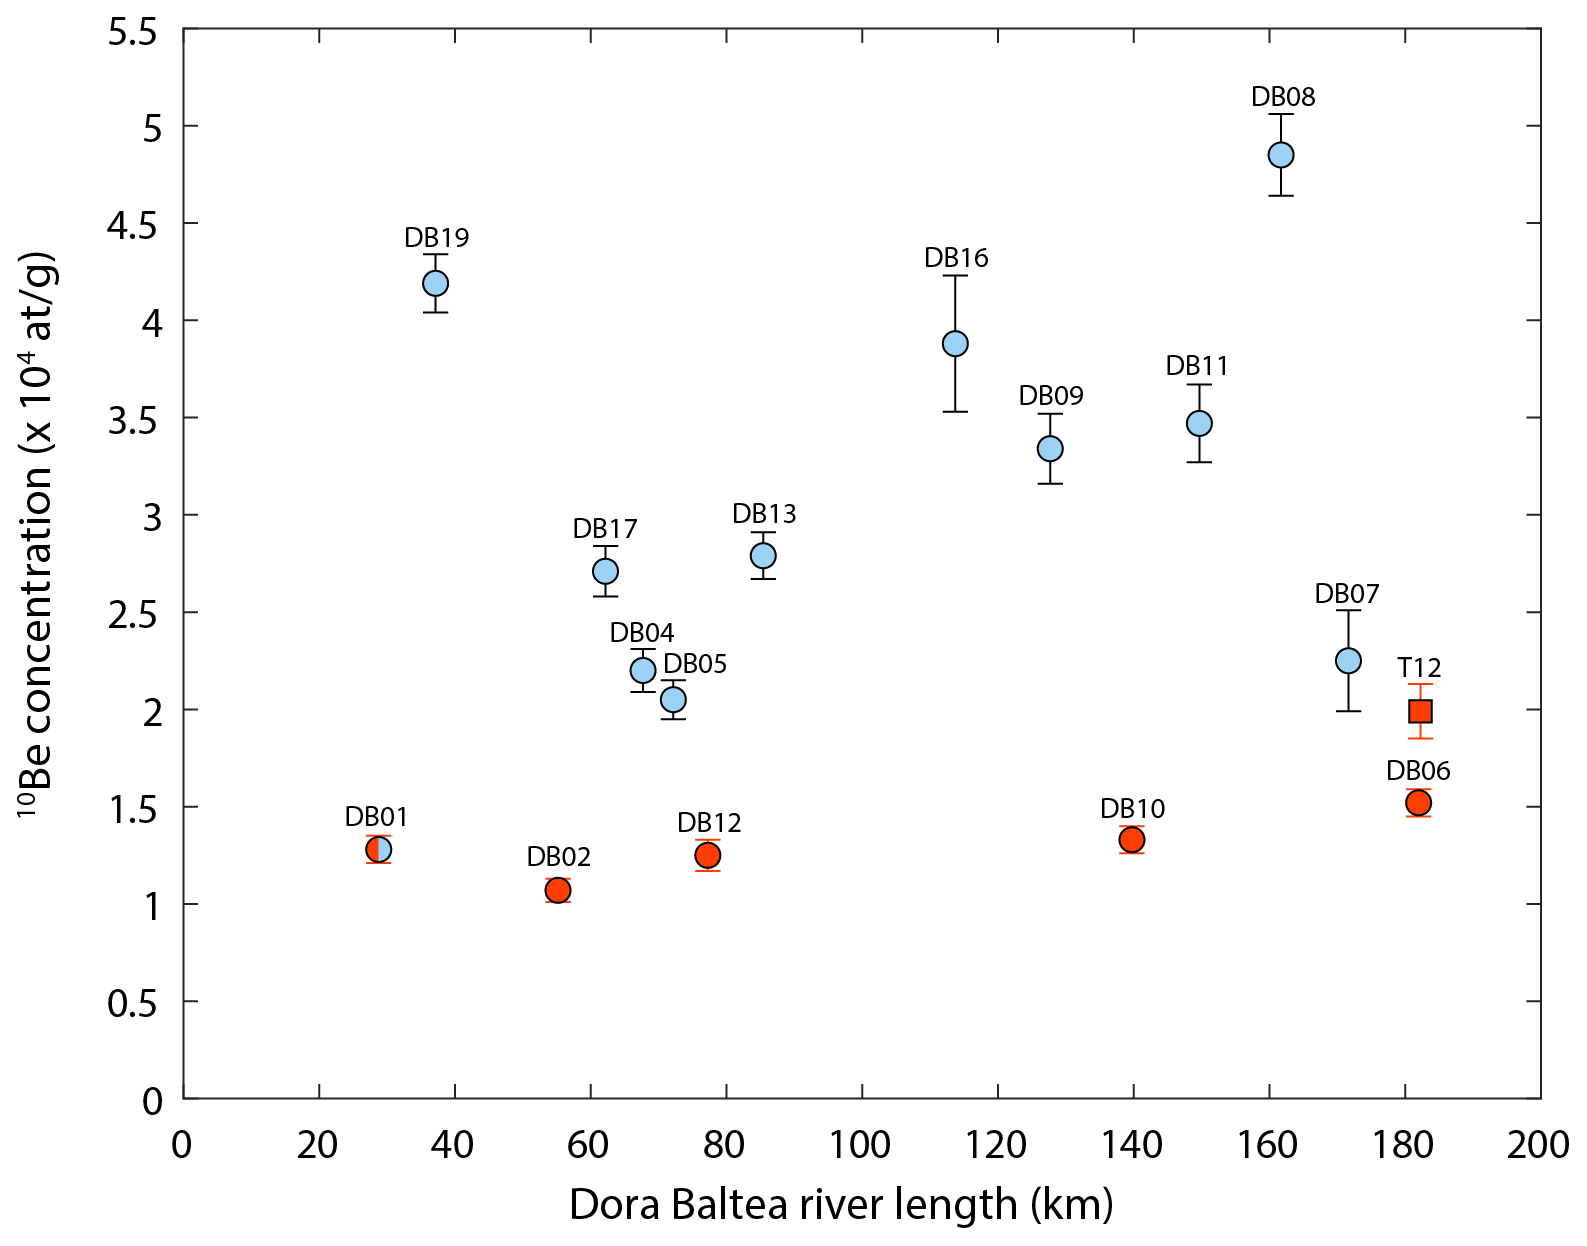
Figure 3Downstream evolution of river-sand 10Be concentrations in the Dora Baltea (DB) catchment. Data are plotted versus distance from the main DB source (upper Val Veny, right tributary upstream DB01). In red are samples collected along the main DB river; in light blue are samples at the outlet of tributaries (Fig. 1 for locations). 10Be concentration of sample T12 (red square) from Wittmann et al. (2016) is also shown for discussion. Samples DB03, 14 and 18 are omitted since they do not directly connect to the main DR river, but note that their 10Be concentrations are similar to those of the tributaries into which they drain (DB04 and DB13, respectively; Fig. 2 and Table 1).
To quantify at first order the relative contribution of the Mont Blanc Massif to the 10Be signal measured along the DB river, we followed the approach reported in Delunel et al. (2014), where relative contributions of different sediment sources can be estimated based on their respective 10Be concentrations. Although other approaches can be used, which consider nested catchments for quantification of sub-catchments denudation rates (Mudd et al., 2016), we adopted a first-order approach in this study based only on relative contributions in 10Be concentrations between different (sub-)catchments. We based our model on sample DB02 (lowest 10Be concentration) which provides a more conservative estimate of the contribution of the Mont Blanc Massif to the 10Be signal measured along the DB river (i.e. the potential contributions of the tributaries are maximized). River-sediment 10Be concentrations from tributaries and along the DB river have been first normalized to the SLHL 10Be production rate (i.e. 4.18±0.26 at g−1 yr−1), implying that variations in normalized 10Be concentrations represent the variability in denudation rates only. We then estimated the respective river-sediment contributions of the Mont Blanc Massif and different tributaries through the mixing model of Delunel et al. (2014; , ) considering (a) the normalized 10Be concentration for river materials exported from the Mont Blanc catchment (upstream catchment DB02), (b) the averaged normalized 10Be concentration from the upstream tributaries contributing to each sampling points along the main DB river and (c) the normalized 10Be concentration at the sampling points along the main DB river (DB12, 10, 06). By applying this simple model, we find that the Mont Blanc Massif contributes to 90 %, 87 % and 77 % of the river-sediment 10Be signal measured, respectively, at locations DB12, 10 and 06, in line with overall constant 10Be concentrations measured along the DB course (Fig. 3).
4.2 Catchment metrics and denudation rates
Results of catchment topographic analyses, along with estimates of environmental and geological metrics, are reported in Table 2. As for calculated catchment-wide denudation rates, DB01 (Mont Blanc Massif) also appears as an end-member with maximum values in most of the reported metrics (Table 2).
We compared the 10Be-derived catchment denudation rates against topographic, environmental and geological metrics and evaluated the statistical significance of linear correlations (p value and r2; Figs. 4 and 5, Table S3). Samples along the main DB river (downstream of DB01, i.e. DB02, 12, 10, 06; Fig. 2) were excluded from the investigated correlations since their apparent denudation rates are potentially affected by cumulative drainage and sediment mixing along the DB course. Correlations were calculated both including and excluding sample DB01. Cook's distance values were also calculated in order to assess whether DB01 strongly influences the derived correlations as a potential outlier. Sample DB01 was regarded as an outlier when its Cook's distance was more than 3 times the data mean Cook's distance. As a consequence, DB01 appears as an outlier in different investigated correlations between catchment denudation rates and topographic, environmental or geological metrics (Table S3). Nevertheless, significant linear correlations (i.e. p value <0.05) both with and without DB01 were obtained between catchment denudation rates and mean elevation (Fig. 4a), 5 km geophysical relief (Fig. 4c), the relative abundance of bare bedrock (Fig. 5b) and the percentage of area above the LGM ELA (Fig. 5d). Significant linear correlations between catchment denudation rates and mean slopes (Fig. 4b), proportions of oversteepened slopes (Table S3) and relative area covered by LIA glaciers (Fig. 5c) were instead only found when including DB01. Non-significant correlations (p value ≥0.05) were observed between catchment denudation rates and drainage areas (Table S3), hypsometric integrals (Table S3), mean annual precipitation values (Fig. 5a), mean geodetic uplift rates (Fig. 4d) and mean LGM ice thickness (Table S3).
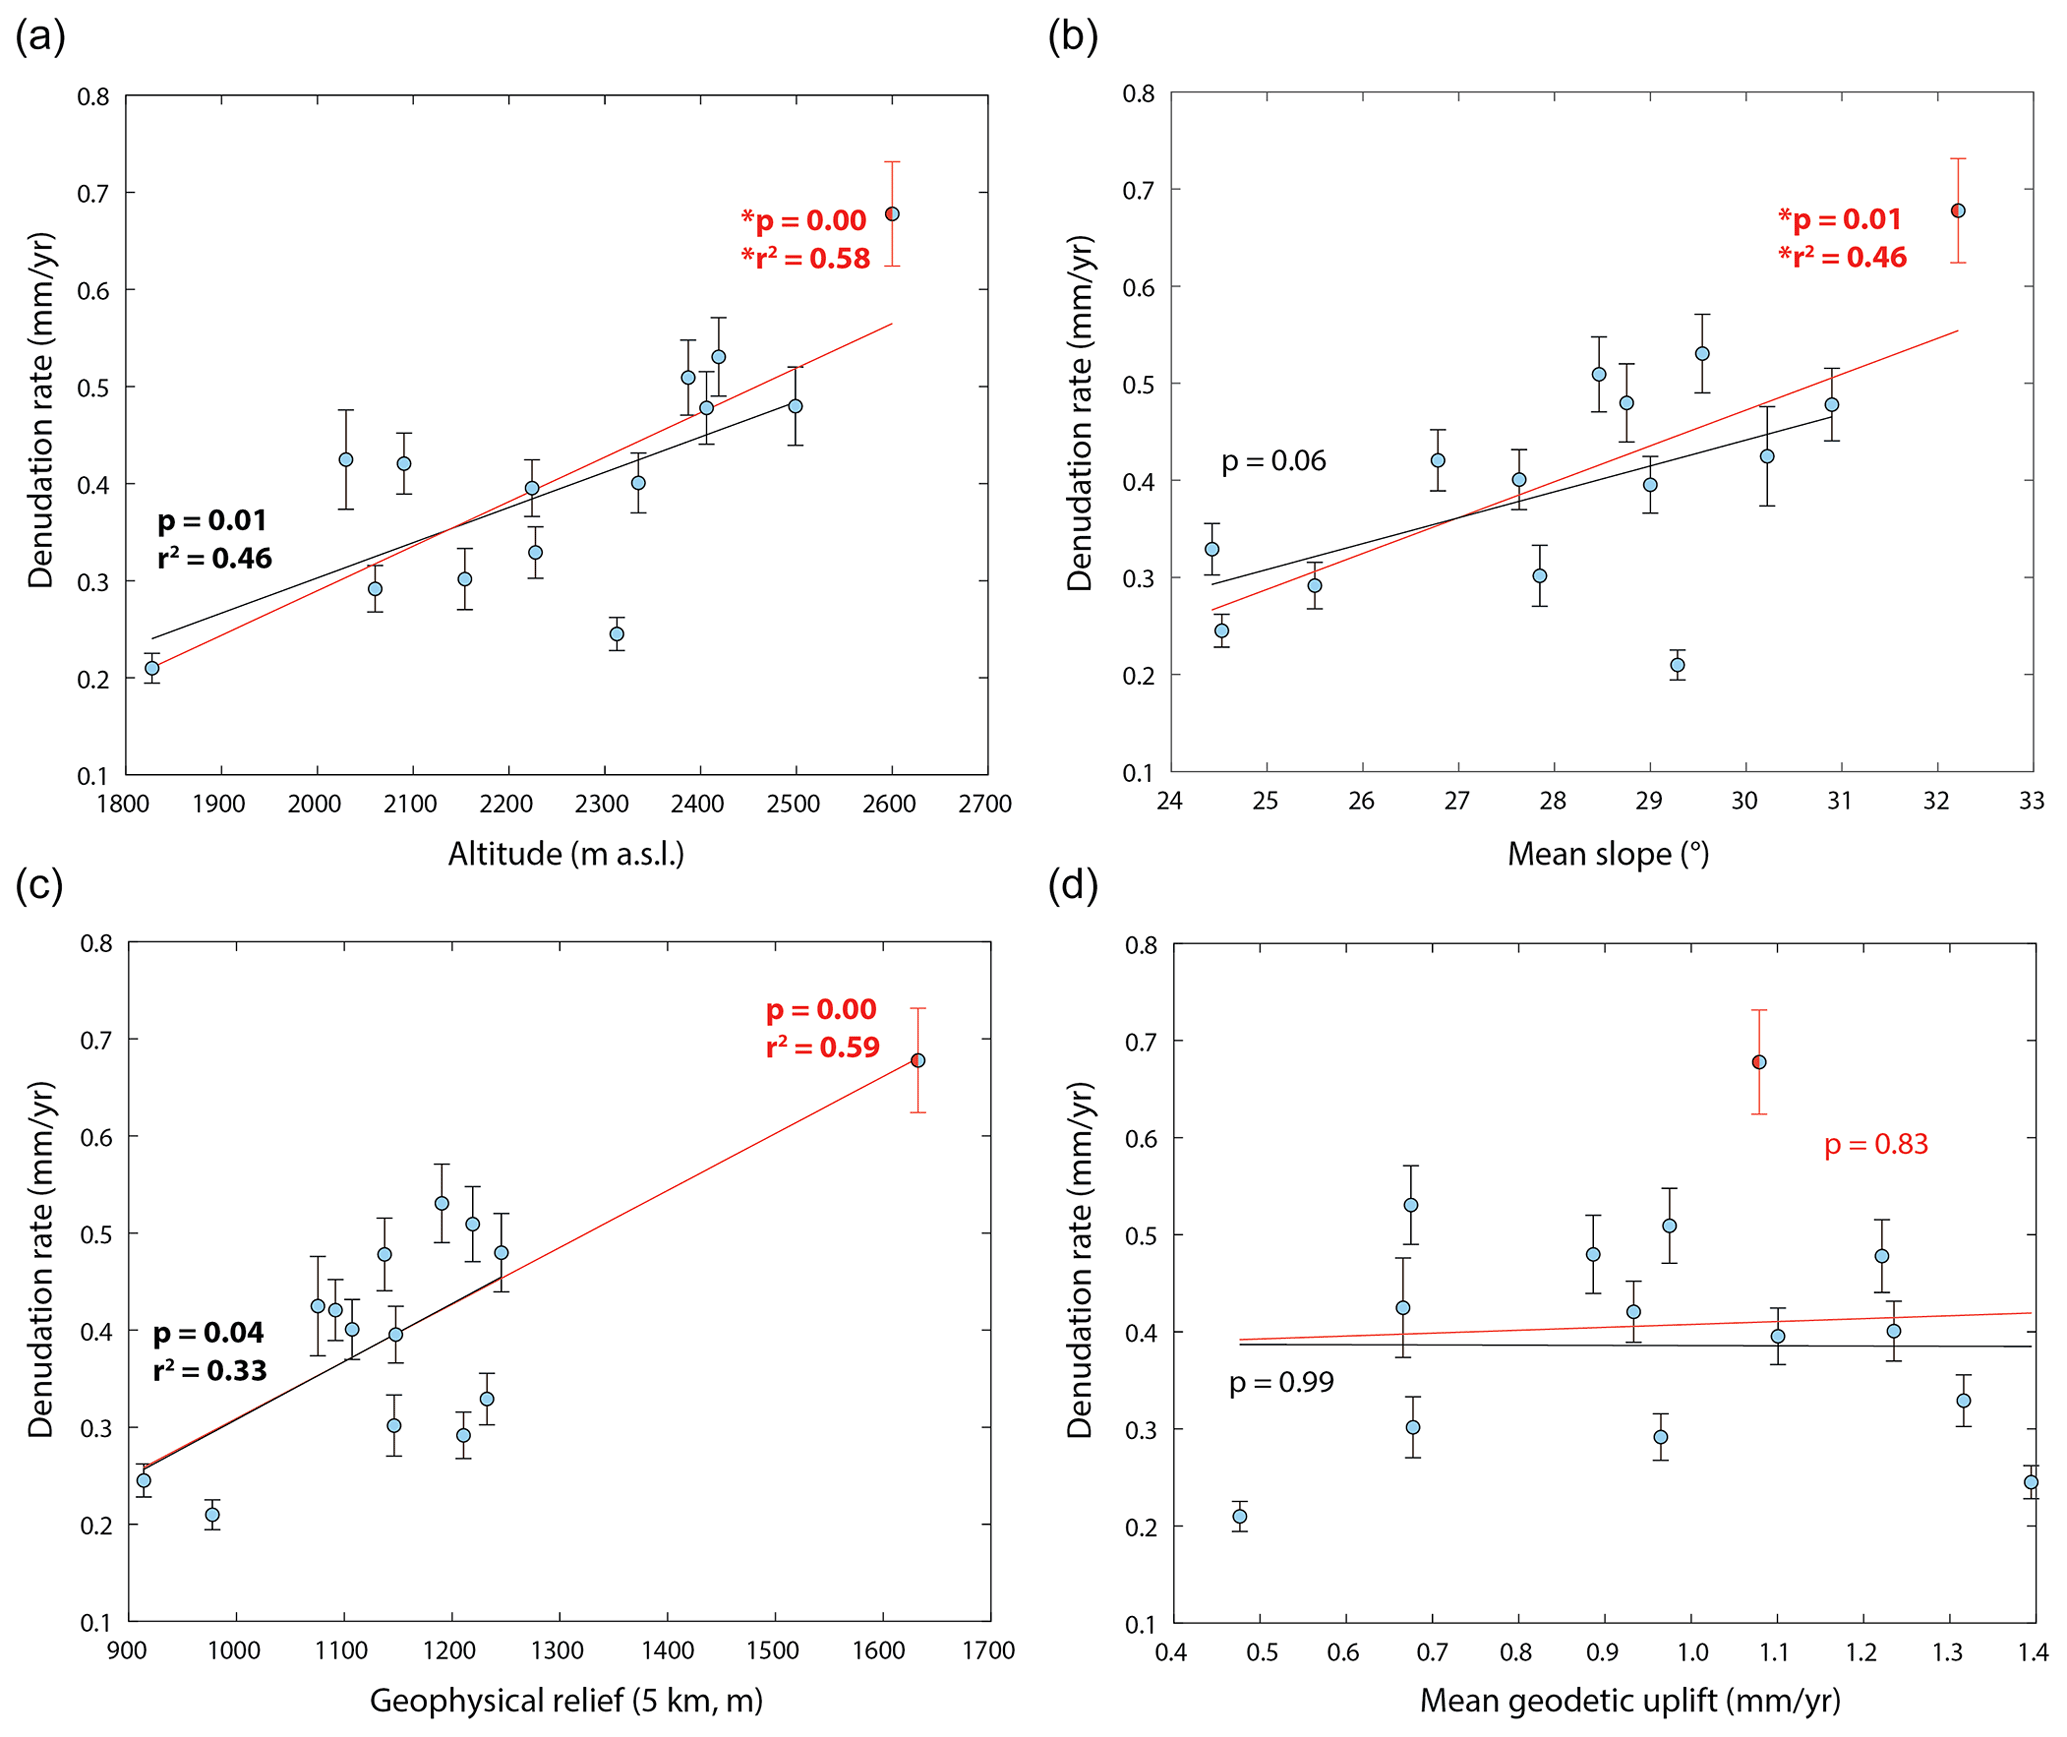
Figure 4Relationships between tributary–catchment denudation rates and mean catchment (a) elevation, (b) slope, (c) 5 km geophysical relief and (d) geodetic uplift. Linear correlations have been calculated including or not sample DB01 (red and black lines, respectively; see main text for discussion). Correlation coefficients (p value and r2) are reported for each linear regression with statistical significance (p value <0.05). r2 is not reported for non-significant correlations (p value >0.05). Asterisks indicate linear correlations for which DB01 has been considered as an outlier (based on Cook's distance, Table S3).

Figure 5Relationships between tributary–catchment denudation rates and catchment (a) mean annual precipitation, (b) relative bare-bedrock area, (c) relative area covered by LIA glaciers and (d) relative area above LGM ELA (2103 m a.s.l.). Correlations have been calculated including or not sample DB01 (red and black lines, respectively; see text for discussion). Correlation coefficients (p value and r2) are reported for each linear regression with statistical significance (p value <0.05). r2 is not reported for non-significant correlations (p value >0.05). Asterisks indicate linear correlations for which DB01 has been considered as an outlier (based on Cook's distance, Table S3).
4.3 Lithotectonic units and denudation rates
In addition to catchment metrics, we explored the potential influence of bedrock properties on the postglacial evolution of the DB catchment by analysing the correlation between tributary–catchment denudation rates and the spatial distribution of lithotectonic units (Figs. 2 and 6; only quartz-bearing areas considered, Fig. S1). The highest denudation rates are observed for tributaries with widespread bedrock exposure of granites of the Mont Blanc external massif and its Helvetic terrigenous to carbonate sedimentary cover (85 %; DB01: 0.68±0.05 mm yr−1). Moderate denudation rates around 0.4–0.5 mm yr−1 are observed for catchments with abundant gneisses of the Gran Paradiso internal massif (41 %–73 %; DB03, 04, 05: average denudation rate of 0.51±0.02 mm yr−1), with dominant Austroalpine gneisses and eclogitic micaschists (58 %–85 %; DB07, 13, 18: average denudation rate of 0.43±0.03 mm yr−1, with the exception of DB08 at 0.21±0.02 mm yr−1) or with abundant gneisses and schists of the Briançonnais basement (63 %–89 %; DB14, 17: average denudation rate of 0.41±0.01 mm yr−1). The lowest denudation rates were obtained for tributaries dominated by meta-ophiolites and calcschists of the Piedmont units (73 %–100 %; DB09, 11, 16: average denudation rate of 0.31±0.02 mm yr−1) and by the terrigenous to carbonate Briançonnais metasedimentary cover (87 %; DB19: 0.25±0.02 mm yr−1). It is however to be noted that for these tributaries (DB09, 11 and 16), the quartz-bearing areas considered in our calculations and analysis mainly consist of Quaternary deposits rather than exposed bedrock (Figs. 2 and S1).
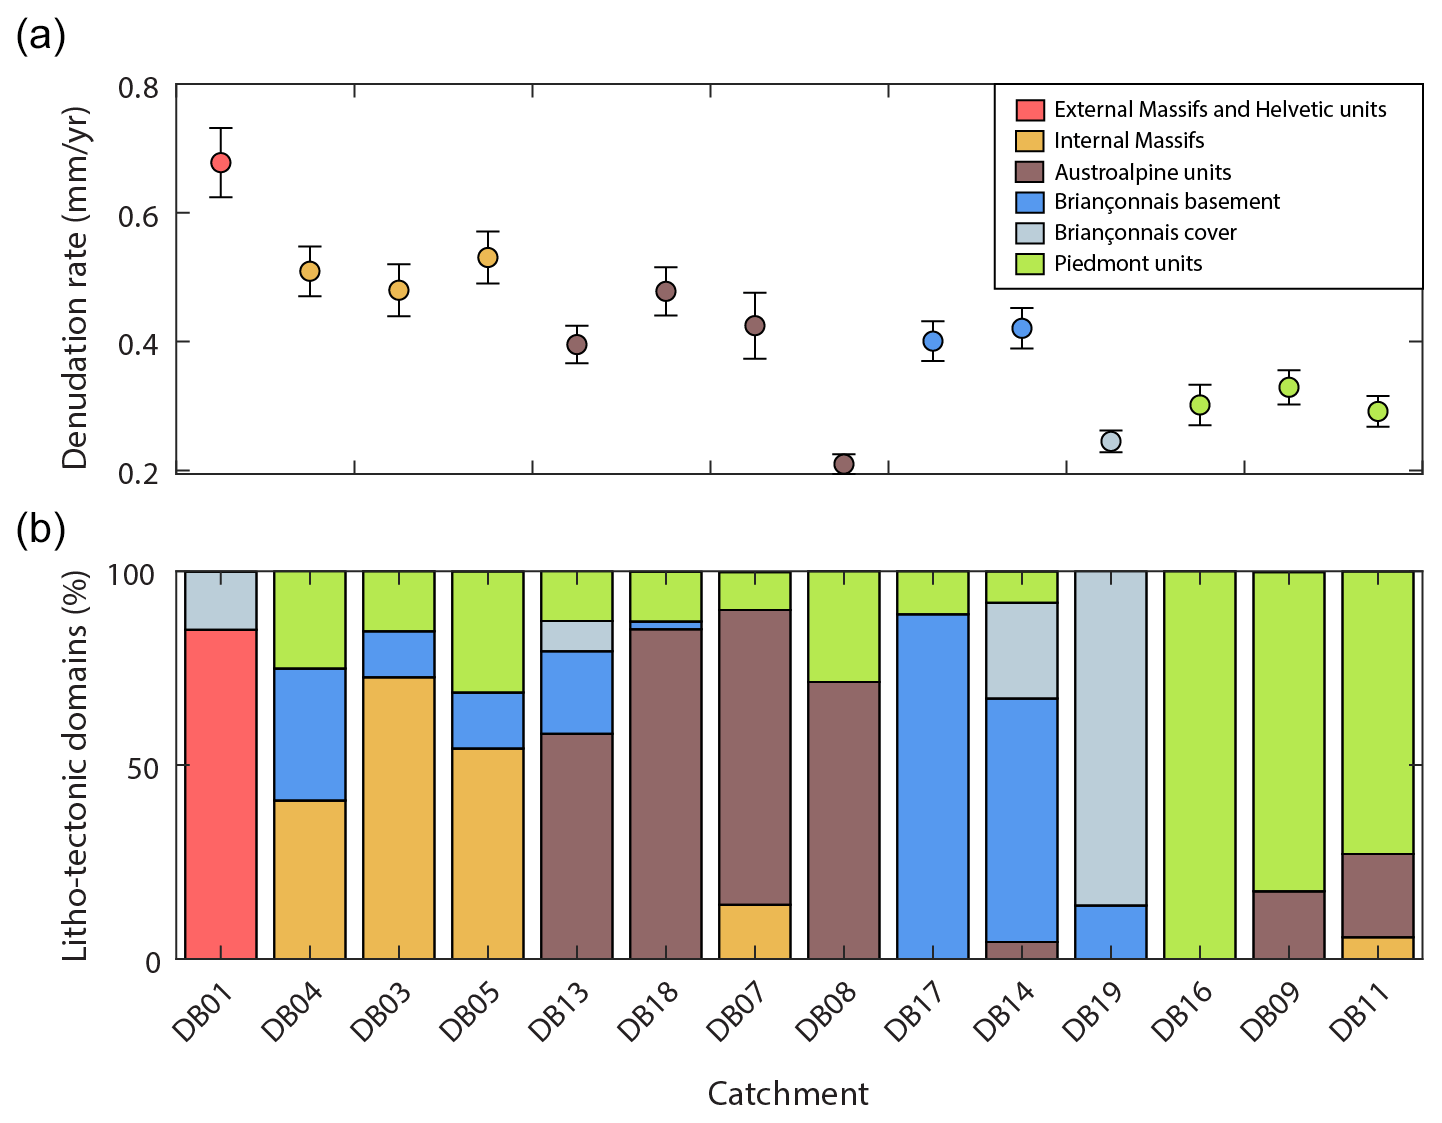
Figure 6Tributary–catchment denudation rates (a) and relative proportion of lithotectonic units within the quartz-bearing areas of the individual catchments (b). Colour code in panel (a) refers to the most abundant lithotectonic unit in each individual catchment (see Fig. 2 for spatial distribution of the different lithotectonic units).
Finally, we assessed the potential influence of bedrock lithological properties on catchment morphometry, by evaluating the distribution of elevation, slope and 5 km geophysical relief for the quartz-bearing areas of each individual lithotectonic unit (Fig. 7). Higher elevations are observed for the external and internal massifs (median of 2500–2700 m a.s.l.) compared to the other lithotectonic units (median of 1900–2200 m a.s.l.; Fig. 7a). The slope distributions appear slightly higher for the external massif, the Austroalpine units and the Briançonnais basement (median of 31–32∘) than for the other units (median of 23–26∘; Fig. 7b). The external massif present the highest geophysical reliefs (median of 1700 m), while all the other lithotectonic units have similar geophysical reliefs with medians varying between 1000 and 1300 m (Fig. 7c). We also evaluated the distribution of the mean geodetic uplift rates in the different lithotectonic domains (Fig. 7d). The highest rock uplift rates are observed for the Briançonnais basement and cover and for the external massif (median of 1.0–1.2 mm yr−1), while the other lithotectonic units have rock uplift rates with median of 0.8–0.9 mm yr−1.
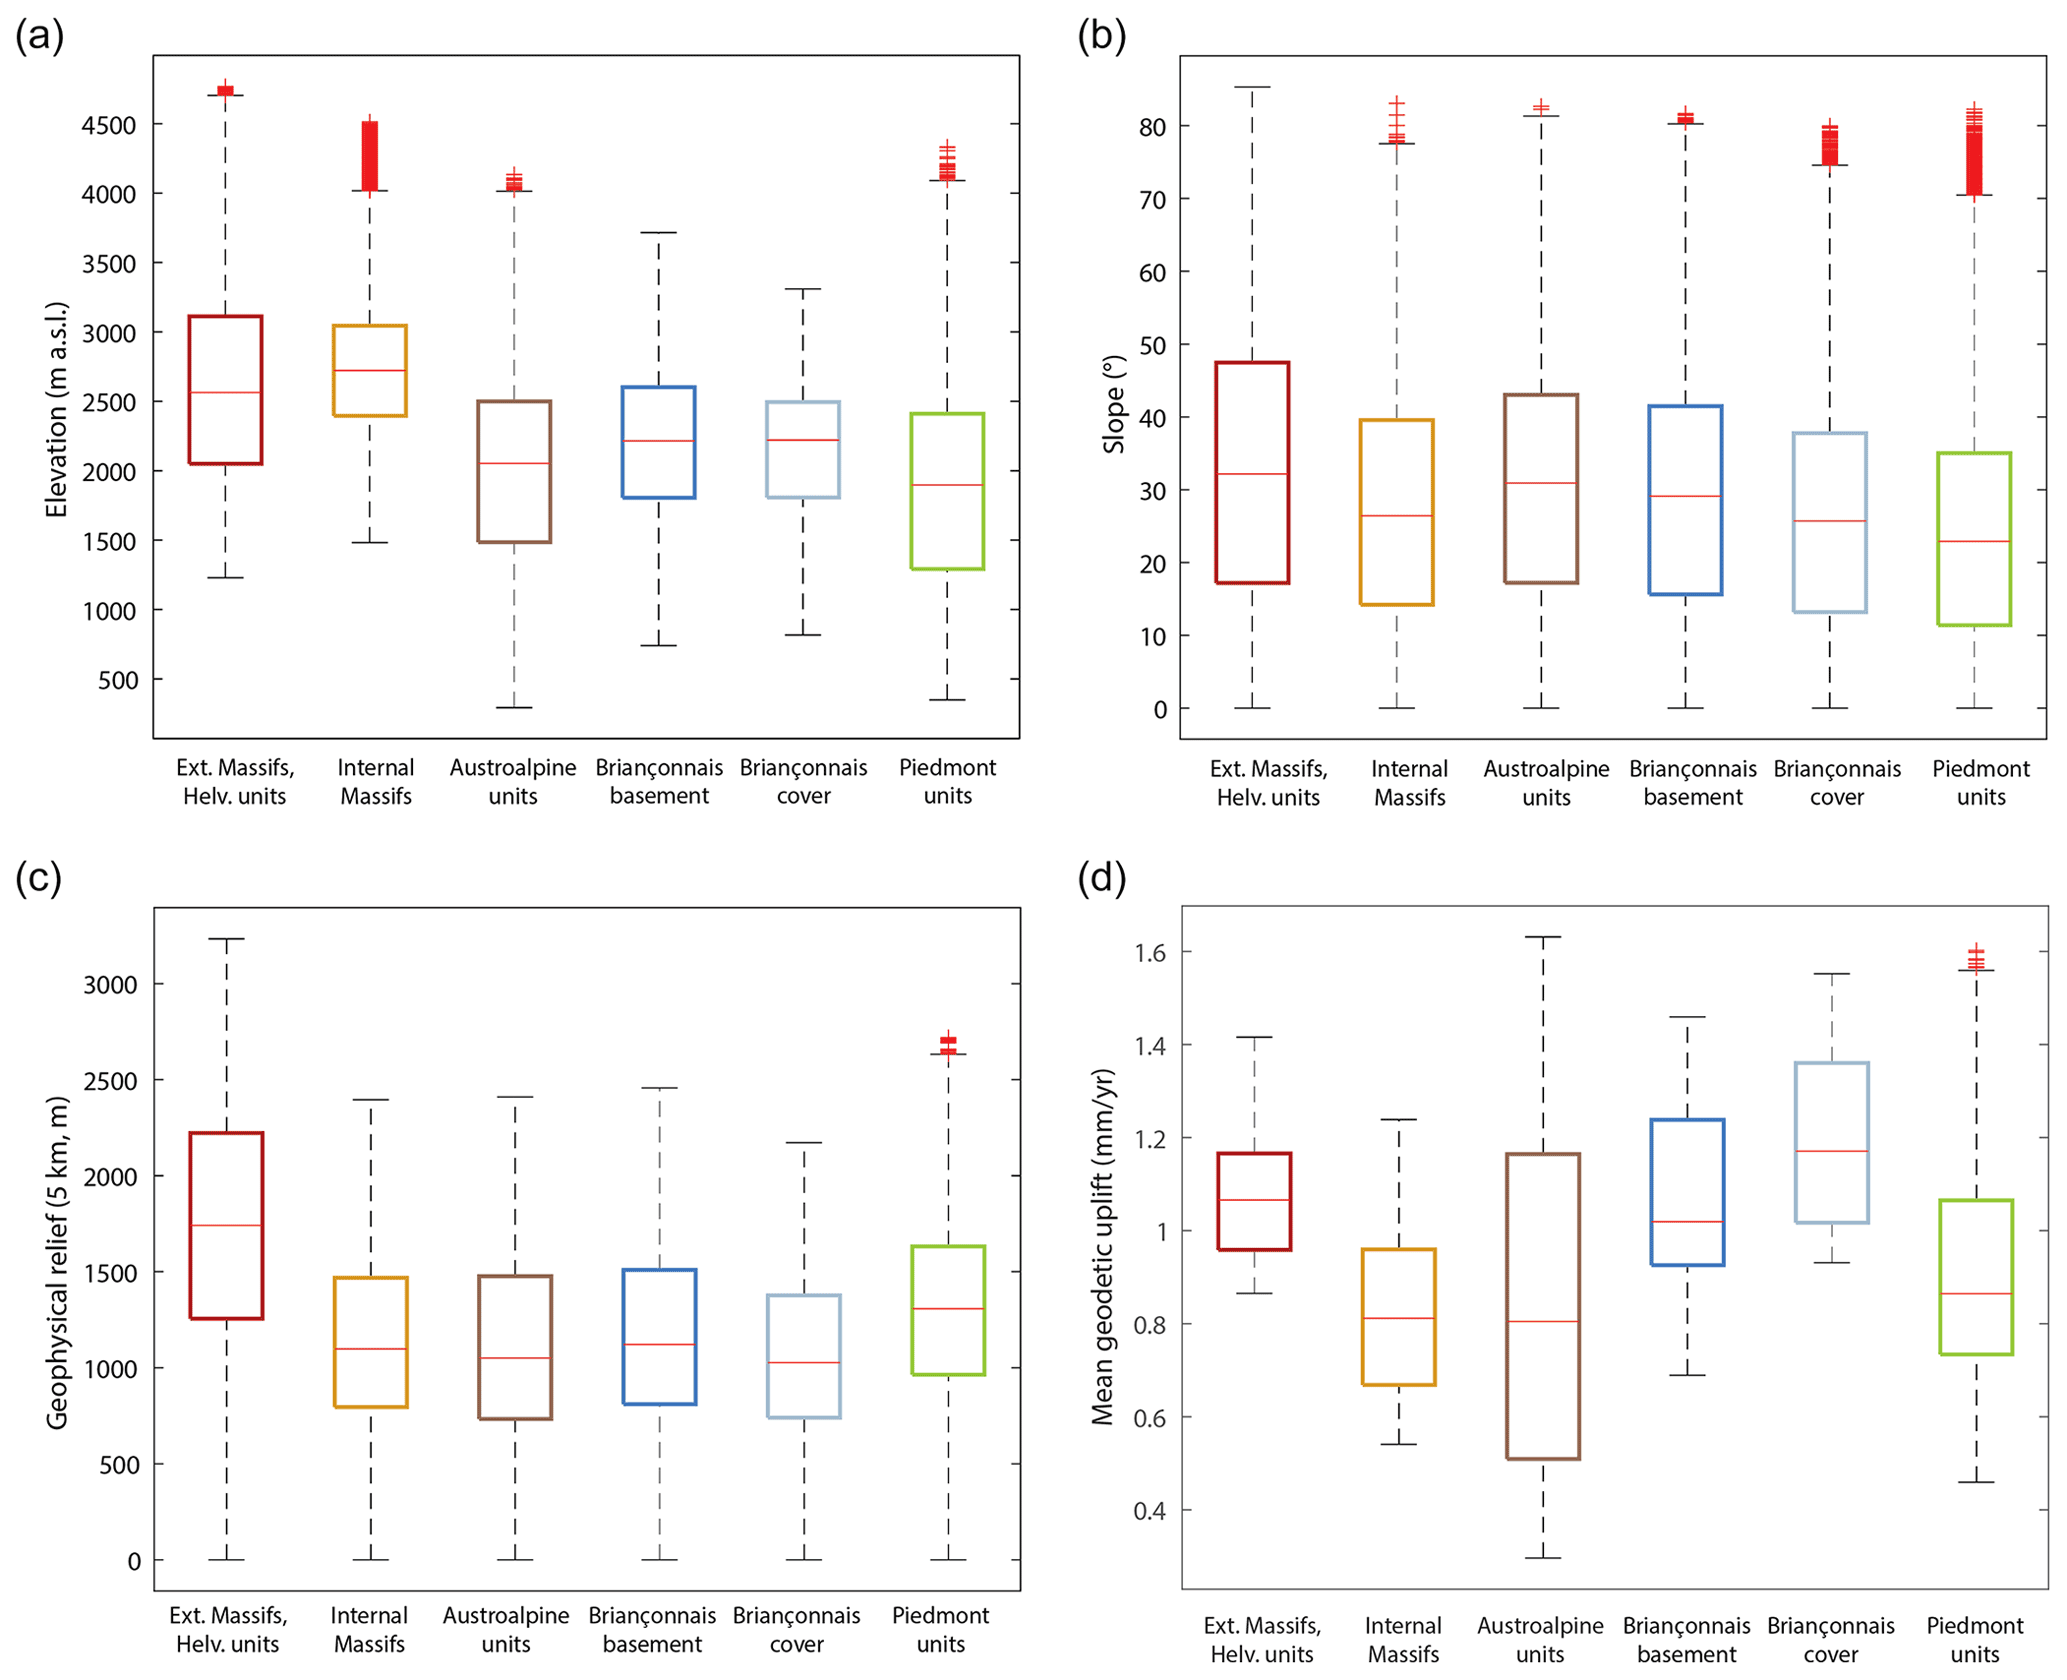
Figure 7Box-and-whisker plots for the spatial distribution of elevation (a), slope (b), 5 km geophysical relief (d) and mean geodetic uplift (d) within the entire DB catchment, classified by individual lithotectonic unit. The horizontal red line represents the median of each distribution; bottom and top of each box are the 25th and 75th percentiles. Whiskers extend up to 1.5 times the interquartile range; outliers (red crosses) are observations beyond the whiskers.
5.1 Correction factors for catchment-wide 10Be production and denudation rates
As reported in Table S2, the different correction factors for quartz content, LIA glacier cover and snow shielding lead to a 16 %–53 % decrease in catchment 10Be production and inferred denudation rates compared to uncorrected estimates (i.e. including only catchment-averaged topographic shielding and excluding areas with slope <3∘). Such correction factors build on several assumptions and have different implications for our catchment-wide denudation rate results that are discussed hereafter. However, we should also note that the investigated correlations between denudation rates and topographic, environmental and geological metrics (Figs. 4–5) remain similar when using non-corrected denudation rates.
First, assuming Quaternary deposits as quartz-bearing lithologies is a first-order approximation, since deposits derived from mafic and carbonate–sedimentary bedrock would bring no or minor quartz to the sediment routing system. For some tributaries dominated by these lithologies (DB09, 11 and 16, as reported in Sect. 4.3), we nevertheless considered that Quaternary deposits may bear quartz given than the upper part of their catchments drain crystalline bedrock (Fig. S1). However, distinguishing deposit lithology and provenance in this Alpine environment, with complex glacial and periglacial systems, would require detailed field investigation and mapping, which is beyond the scope of this work. Moreover, our calculations show that correction for quartz-bearing area has only a minimal effect on catchment-averaged 10Be production and denudation rates, with only up to 10 % difference between uncorrected and corrected results thus overlapping within uncertainties (Table S2).
Second, correction factors for LIA glacier cover and snow shielding lead instead to significant decrease in catchment-averaged 10Be production and thus denudation rates (up to 42 % and 17 %, respectively). Since sediments in subglacial and proglacial environments can derive from periglacial erosion from bedrock walls and peaks and/or re-mobilization of previously exposed material (with non-zero 10Be concentration, e.g. moraine deposits; Wittmann et al., 2007; Delunel et al., 2014; Guillon et al., 2015), assuming null 10Be concentration input from areas covered by LIA glaciers might lead to overcorrections of our denudation rate estimates. Uncertainties are related also to the snow-shielding correction approach. The snow-shielding vs. elevation model reported by Delunel et al. (2020) has been calibrated on snow-water equivalent records of the Swiss and French Alps, which are wetter regions compared to the DB catchment (Isotta et al., 2014). Therefore, LIA glacier cover and snow-shielding corrections may be overestimated for the DB catchments, especially for high-elevation tributaries. In particular, as stated in Sect. 4.1, catchment DB01 shows the maximum corrections for both LIA glacier cover and snow shielding (42 % and 17 %, respectively; Table S2) and consequently a relatively low output denudation rate compared to estimates obtained for catchments downstream along the main DB river (DB02, 12, 10; Fig. 2), despite similar 10Be concentrations (Fig. 3). We therefore acknowledge that our corrected catchment-averaged 10Be production and denudation rates for DB01 (Table 1 and Fig. 2) should be considered as minimum estimates, given the correction factors for LIA glacier cover and snow shielding, in line with the recent compilation over the entire European Alps (Delunel et al., 2020).
Finally, we need to estimate the impact of LGM glacial erosion on our 10Be-derived denudation rates (Glotzbach et al., 2014; Dixon et al., 2016), since our study area has been largely glaciated during the LGM (Serra et al., 2022). Deep glacial erosion may have largely to completely zeroed 10Be concentration on bedrock surfaces, with non-steady-state 10Be concentration depth profiles during postglacial surface exposure leading to apparent overestimate in denudation rates from river-sand 10Be concentrations (Glotzbach et al., 2014). However, given the deglaciation history of the DB catchment (i.e. largely deglaciated by 14–12 ka; Baroni et al., 2021; Serra et al., 2022) and the range of our 10Be-derived denudation rates (0.2–0.9 mm yr−1, Table 1 and Fig. 2), we can assess an overestimate of our 10Be-derived denudation rates by maximum 10 %–15 %, similar to the proposed estimate of Dixon et al. (2016) in the Eastern Alps, with a maximum 9 % overestimate for slower 10Be-derived denudation rates (∼0.2 mm yr−1). We thus are confident in the validity of our 10Be-derived denudation rates (Table 1) and can exclude any potential strong bias influencing the spatial pattern (Fig. 2) and interpretation with regards to topographic, environmental and geological metrics (Figs. 4–5).
5.2 Propagation of 10Be signal along the DB course
Our results highlight the strong 10Be-dominance of the Mont Blanc Massif (represented by sample DB02, see Sect. 4.1 for discussion) on downstream sediment samples collected along the DB course, below the tributary junctions (Fig. 3, Table 1). The relatively constant low 10Be concentrations measured for samples DB01, 02, 12, 10, 06 (1.1–1.5×10⁴ at g−1, Fig. 3) compared to the tributaries (2.0–4.9×10⁴ at g−1), and the outcomes of our mixing model indicate unequal sediment contribution (non-balanced sediment budget; Savi et al., 2014) between the main DB stream and its tributaries. The Mont Blanc Massif appears to govern the sediment yield along the main DB river, contributing to >77 % of the river-sediment 10Be signal carried all along the DB river.
A key factor governing the mixing and flux balance of 10Be concentrations between river streams is the quartz flux from each stream, which is in turn influenced by (1) catchment denudation rate, (2) drainage area, (3) catchment quartz content (Carretier et al., 2015), (4) sediment storage (e.g. dams, lakes, floodplains reducing mass flux but not changing the 10Be concentration; Wittmann et al., 2016). Our results show significantly higher denudation rate for catchment DB01 compared to other DB tributaries (Fig. 2, Table 1). While the Mont Blanc Massif (upstream DB02 catchment) represents only a minor fraction of the total DB catchment area (∼18 %), its quartz-bearing surface area appear 5 %–90 % larger than for other tributaries (Table 2). Likewise, the sediment-provenance studies of Vezzoli et al. (2004) and the sediment-yield estimates of Vezzoli (2004) highlighted that river sands from the Mont Blanc catchment (analogous catchment to DB02) have up to ∼20 % higher quartz content compared to some other DB tributaries (analogous to DB09, 11, 16; Table S4) and contribute to ∼62 % of the quartz flux of the entire DB catchment (analogous to DB06; Table S4). Since the occurrence of dams is limited to tributary few catchments (Fig. 1), the high quartz flux and 10Be-signal dominance of the Mont Blanc Massif along the DB course could derive from (1) its high denudation rate (Fig. 2 and Table 1), (2) its large quartz-bearing drainage area and (3) the high quartz content of the Mont Blanc granitoid (Vezzoli, 2004). Between these three potential causes, we propose that the 10Be-signal dominance of the Mont Blanc Massif along the DB course is mainly driven by its high denudation rather than quartz fertility or area coverage, as illustrated by the similar trend of modern denudation rates derived from sediment gauging (Hinderer et al., 2013; see also discussion in Sect. 5.4). The high rock-slope instability and glaciogenic sediment production in the Mont Blanc Massif supply abundant low 10Be concentration quartz to the river system, being therefore efficient in diluting the 10Be concentration in the downstream course of the DB river. Controlling factors explaining the high denudation rate of the Mont Blanc Massif are further discussed below (Sect. 5.3).
For the entire DB catchment, we can note that the 10Be concentration is ∼30 % higher for sample T12 ( at g−1; Wittmann et al., 2016) compared to DB06 ( at g−1; Fig. 3), both collected at the same location (DB catchment outlet, Fig. 1) but at different time periods. The observed difference is probably related to a stochastic change in sediment sources (Lupker et al., 2012), with potentially a temporary dominant sediment input from a DB tributary catchment with higher 10Be concentration (e.g. DB07, close location and similar 10Be concentration as T12; Fig. 3) than from the Mont Blanc catchment. By comparing our results to the Po catchment (Wittmann et al., 2016), which drains several main river systems from the southwestern Alps in addition to the DB river basin, it emerges that the low 10Be concentration signal deriving from the Mont Blanc Massif, only slightly increasing along the DB course (from 1.1 to 1.5×10⁴ at g−1, Fig. 3), increases significantly soon after the DB flows into the Po River. The high 10Be concentrations measured by Wittmann et al. (2016) in Po river-sediment samples, immediately downstream the DB confluence (samples P1 and P3: around 3.6×10⁴ at g−1), show that the Po River is dominated in its initial lowland flow by the high 10Be concentration inputs from other southwestern Alpine catchments (Wittmann et al., 2016).
5.3 Controlling factors and processes on 10Be-derived catchment denudation rates
Our 10Be-derived denudation rates, varying between 0.2 and 0.9 mm yr−1, fit within the values obtained over the European Alps, where 95 % of the considered catchments yield denudation rate values <1.2 mm yr−1 and rates for the western European Alps range between 0.1 and 1.2 mm yr−1 (Delunel et al., 2020). Correlations with topographic, environmental and geological metrics allowed us to identify and discuss potential controlling mechanisms for denudation-rate variability within the DB catchment that we present here in comparison with studies conducted in other Alpine sectors.
While precipitation and rock uplift have been recognized as main drivers for Alpine denudation rates, especially for the Central Alps (e.g. Chittenden et al., 2014; Wittmann et al., 2007, respectively), their respective influence on denudation-rate variability within the DB catchment is not significant (Figs. 5a and 4d). Interestingly, it can be observed that catchment geodetic rock uplift rate is higher (20 %–80 %) than 10Be denudation in all the investigated tributary catchments, suggesting a net surface uplift of the DB area for recent timescales, in line with other observations across the European Alps (Norton et al., 2011; Delunel et al., 2020).
Catchment topography appears instead to have a major role in controlling the observed spatial variability in DB denudation rates. First, denudation rates are positively correlated with catchment-averaged elevation (Fig. 4a). Elevation influences denudation rates through periglacial (i.e. frost cracking; Delunel et al., 2010) and glacial erosive processes, both increasing with altitude due to their temperature dependency, as well as by modifying soil and vegetation cover, with bare-rock exposure being positively correlated with denudation rates (Fig. 5b). Second, correlations with slope and geophysical relief need to be considered (Fig. 4b and c). It has been previously proposed that topographic slope and geophysical relief are positively correlated to catchment denudation until a threshold slope angle of 25–30∘ (Montgomery and Brandon, 2002; Champagnac et al., 2014; Delunel et al., 2020). Below this threshold, denudation was shown to respond to a slope-dependent equilibrium between regolith cover production through weathering and its downslope diffusion. In oversteepened catchments, denudation rates are instead controlled by mass wasting processes (i.e. rockfalls, debris flows, landslides) which stochastically influence river-sediment 10Be concentrations. While the potential effect of slope alone is here challenging to evaluate as all the tributaries exhibit similar averaged slope values, between ∼ 25–30∘ (with the exception of DB01 with average slope of ∼ 32∘, Fig. 4b), denudation rate exhibits a clear correlation with geophysical relief (Fig. 4c), which is function of both slope and elevation difference (Small and Anderson, 1998; Champagnac et al., 2014). We suggest that slope differences between the investigated catchments, while not significant, are nevertheless still close to threshold values (Fig. 4b; Delunel et al., 2020), which, when combined with elevation differences between catchments, would explain the significant relationship observed between geophysical relief and denudation rates (Fig. 4c).
Our results also show a correlation between catchment denudation rates and bedrock lithotectonic classification (Fig. 6), which has been proposed to drive denudation through rock mechanical strength (erodibility; Kühni and Pfiffner, 2001). Similar to what has been suggested based on DB modern sediment provenance (Vezzoli et al., 2004), we observe a general trend with the highest denudation rates in catchments dominated by apparent “low-erodibility” bedrock (granite and gneiss) and the lowest rates in catchments with apparent “high-erodibility” bedrock (sedimentary and terrigenous rocks; erodibility classes according to Kühni and Pfiffner, 2001). This trend has already been observed locally in the Eastern and Southern Alps (Norton et al., 2011), as well as at the scale of the entire European Alps (Delunel et al., 2020). Such observations were interpreted to be related to the influence of bedrock resistance on catchments morphometry (in turn connected to denudation dynamics), with the most resistant lithologies located at highest elevations and sustaining the steepest slopes and/or highest reliefs (Kühni and Pfiffner, 2001; Stutenbecker et al., 2016). Our results are in line with this interpretation, with the “low-erodibility” granite of the Mont Blanc external massif supporting the highest elevation and reliefs and slightly steeper slopes (Fig. 7), where efficient geomorphic processes promote the highest catchment denudation rate (Fig. 6). On the other hand, the “high-erodibility” rocks of the Briançonnais cover and of the Piedmont units present low elevation, relief and slope values, and are associated with low denudation rates. High elevation sustained by gneisses and granite of the internal massifs (2700 m a.s.l.; Fig. 7a) and slightly steeper slopes supported by gneisses and micaschists of the Austroalpine units and of the Briançonnais basement (30–31∘; Fig. 7b) would also drive the moderate denudation rates observed in these three lithotectonic domains (Fig. 6). Moreover, the different long-term tectonic histories between the lithotectonic domains could also explain some of the observed variability in catchment denudation between areas west and east of the Penninic Frontal Thrust (Fig. 2). Bedrock tectonic fracturing (Molnar et al., 2007) may influence subsequent erodibility and denudation, facilitated by the exhumation of more fractured bedrock units such as the crystalline units of the Mont Blanc external massif and its Helvetic sedimentary cover (no deep Eocene subduction during Alpine orogeny), compared to deeply exhumed rocks of the internal massifs and Piedmont units (Schmid et al., 2004). No correlation appears instead between the mean geodetic uplift and the denudation rates of the different lithotectonic units, with the highest uplift rates observed both for the fast eroding external massif and the slow-eroding Briançonnais units (Fig. 7d). This further excludes the role of geodetic uplift in controlling denudation rate variability within the DB catchment (Fig. 4d), while further supporting the dominant influence of bedrock resistance. However, the long-term (late Miocene) high uplift rates in the Mont Blanc Massif compared to the rest of the DB catchment (Malusà et al., 2005) could be one of the causes of the high denudation rate of the Mont Blanc massif, by sustaining high elevations and in turn promoting efficient geomorphic processes.
Lastly, we consider the potential connection between landscape glacial imprint and catchment denudation rates. Statistically significant correlation between catchment denudation rates and catchment area proportion above LGM ELA (Fig. 5d) suggests an impact of LGM and large Quaternary glaciations on 10Be-derived denudation rates. Most of the catchments have >50 % of their area above the LGM ELA, indicating that large glaciers persisted during the LGM (and potentially older Quaternary glacial stages), with a significant impact on catchment topography characterized by steep slopes and high reliefs (Fig. 4a–c, Pedersen and Egholm, 2013). We hence tentatively interpret the significant correlation between denudation rates and high elevation/pronounced geophysical relief (Fig. 4b and c) to be indicative of a long-term glacial topographic control on the postglacial erosional response, as suggested by previous studies (Norton et al., 2010; Glotzbach et al., 2013; Dixon et al., 2016). The glacial pre-conditioning of the topography has been also enhanced during postglacial times with coupled fluvial incision and hillslope processes increasing Alpine valley slopes and reliefs locally (Korup and Schlunegger, 2007; Valla et al., 2010; van den Berg et al., 2012). Over a shorter term, the positive correlation between catchment denudation rates and LIA glacier cover (only when including DB01, Fig. 5c) suggests also an important role of Holocene to modern glacial processes in influencing catchment denudation, by contributing to high-sediment delivery (Stutenbecker et al., 2018).
By considering the above-mentioned controlling mechanisms for catchment denudation, we propose the following interpretation for the high denudation rate obtained for catchment DB01 compared to other DB tributaries (Figs. 2 and 4–5). Catchment DB01 has maximum values for most of the investigated metrics (Figs. 4 and 5, Table 2). Its location in the high-elevation core of the Alps (Mont Blanc Massif, long- and short-term high uplift rates) was the site of intense Quaternary glaciations (large catchment area above the LGM ELA), which deeply modified the landscape as illustrated by the high geophysical relief of this catchment. Thanks to the highly resistant granitoid lithology, steep slopes and high reliefs deriving from glacial and periglacial erosion could be maintained, in turn promoting high millennial to present-day denudation rates in this catchment. Finally, the supply of sediments by retreating glaciers and active periglacial processes, and the contribution of frequent rockfall events triggered by abundant precipitation (Fig. 5a) and present-day permafrost degradation (Ravanel et al., 2010; Akçar et al., 2012; Deline et al., 2015) contribute to the significant sediment yield in the DB01 catchment. Catchment DB01 thus supplies material with highly depleted 10Be concentrations to the river system, which is in turn able to significantly dilute the 10Be signal along the DB course (Fig. 3).
5.4 Long- and short-term DB denudation rates
Our 10Be-derived denudation rates show a general trend of higher millennial denudation rates in the Mont Blanc Massif compared to other DB tributaries (Fig. 2), which is overall in agreement, albeit with different absolute values, with denudation rate estimates on different timescales.
Long-term (106–107 years) exhumation rates estimated from bedrock apatite fission-track data (Malusà et al., 2005) show higher values (0.4–0.7 km Myr−1) in the western sector of the DB catchment (west of Internal Houiller Fault, Fig. 2) than in the east (around 0.2 km Myr−1, between the Internal Houiller and the Insubric faults, Fig. 2). Likewise, results from detrital apatite fission tracks (Resentini and Malusà, 2012) indicate that short-term (102–105 years) denudation rates are higher (around 0.5 mm yr−1) in the Mont Blanc external massif and its sedimentary cover (west of the Penninic Frontal Thrust) than in the axial belt, east of the Penninic Frontal Thrust (around 0.1 mm yr−1; Fig. 2). Similarly to what has been shown by Glotzbach et al. (2013), the external Alps catchments (west of the Penninic Frontal Thrust; Fig. 2) appear to have equivalent long-term (apatite fission-track-derived) and short-term (10Be-derived) denudation rates, while the internal Alps catchments (east of the Penninic Frontal Thrust; Fig. 2) show higher short-term than long-term denudation rates. This has been tentatively explained by potential differences in driver mechanisms of denudation before and during the Quaternary (Glotzbach et al., 2013). Tectonic forcing dominated Neogene denudation rates, with fast-exhuming external massifs having steeper rivers and higher reliefs and therefore eroding faster than the slowly exhuming internal Alpine massifs. During the Quaternary, instead, climate fluctuations and associated glaciations modified both the internal and external Alps morphology and topographic reliefs, also resulting in increased denudation rates for the internal Alps. Our 10Be-derived catchment denudation rates for the DB catchment are therefore not totally reflecting long-term exhumation rates over Myr timescales but most probably highlight Quaternary erosion dynamics.
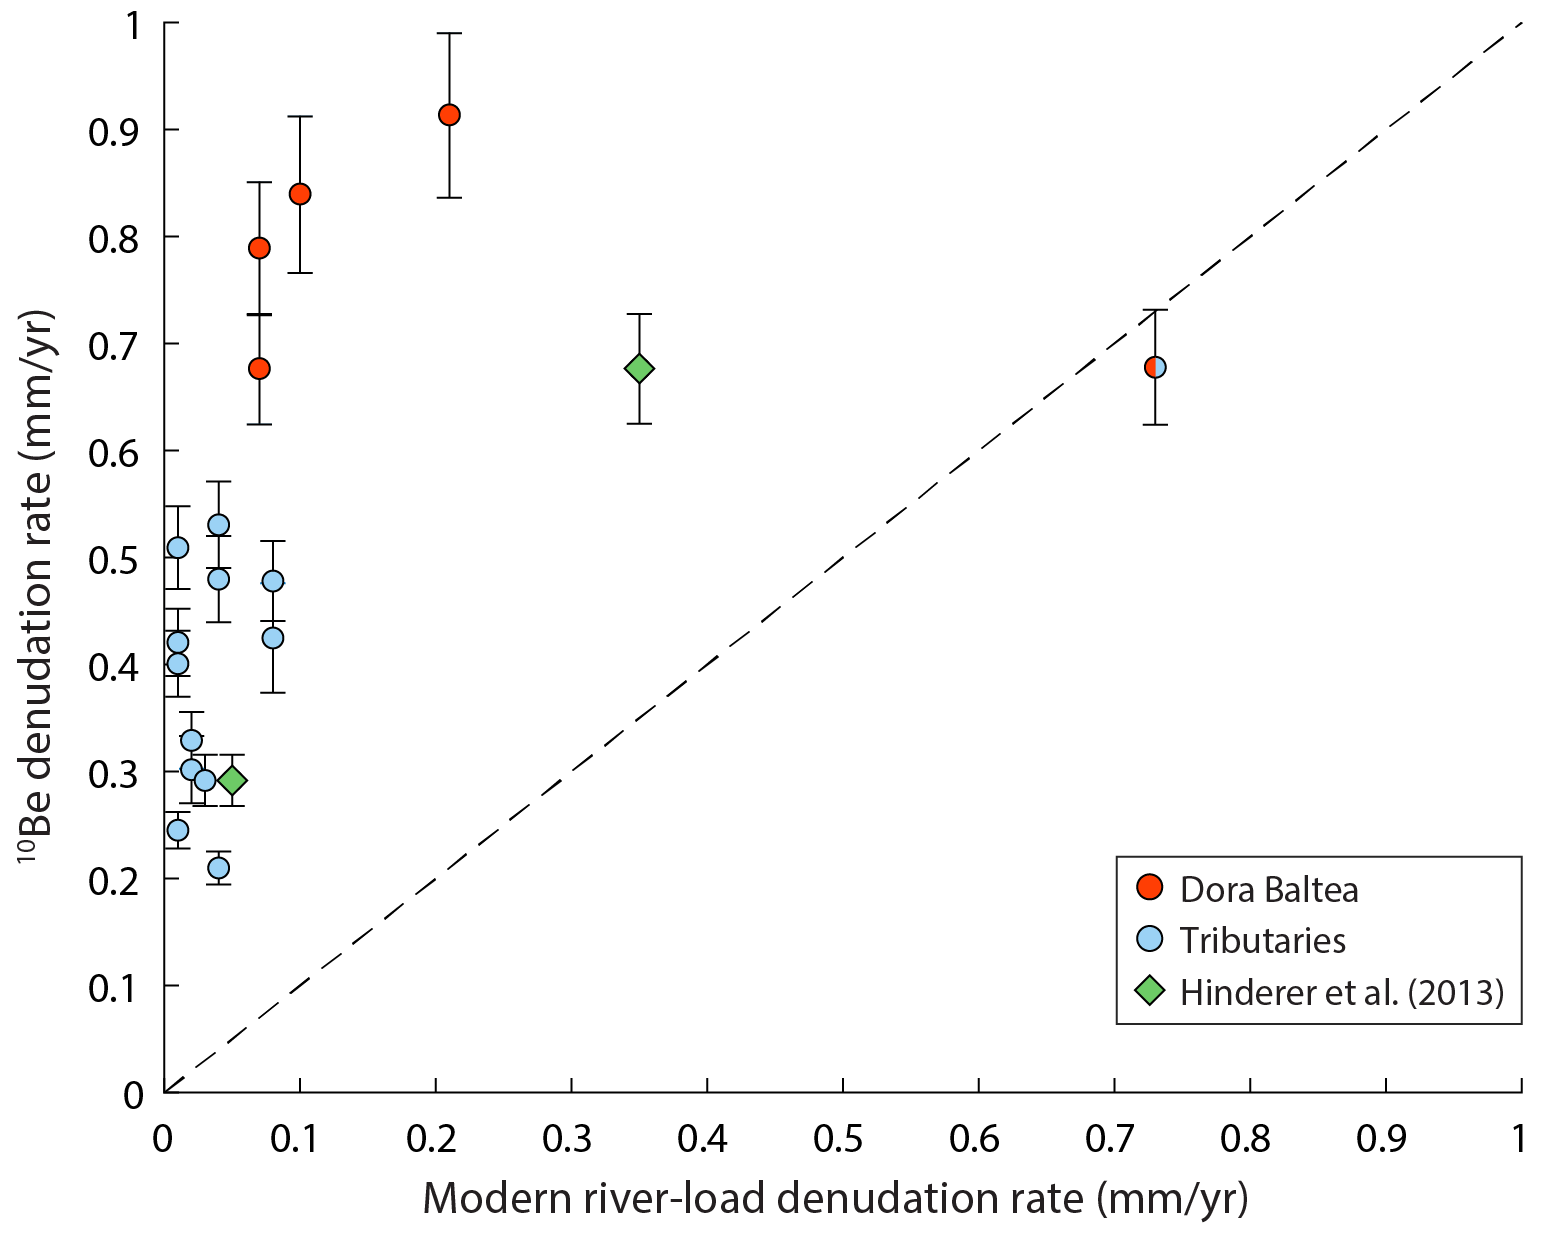
Figure 8Comparison of 10Be- and modern river yield-derived catchment-wide denudation rates. For all tributary catchments and DB locations, modern denudation rates are derived from river–bedload empirical estimates (Vezzoli et al., 2004; red and light blue dots are for DB and tributary catchments, respectively). For catchments DB06 and DB011, also modern denudation rates derived respectively from sediment gauging and sediment trapping are plotted with green diamonds (Hinderer et al., 2013, after Bartolini et al., 1996, and Bartolini and Fontanelli, 2009). Errors are represented only for 10Be-derived denudation rates, since they are not reported for the modern rates.
Modern denudation rates, obtained from sediment-yield estimates (all DB catchments; Vezzoli et al., 2004; based on Gavrilovic empirical formula, Gavrilovic, 1976) and measurements (sediment gauging for DB06 and sediment trapping for DB11; Hinderer et al., 2013, after Bartolini et al., 1996 and Bartolini and Fontanelli, 2009), display higher values for samples along the DB (0.07–0.73 mm yr−1) compared to DB tributaries (0.01–0.08 mm yr−1). While such a pattern is consistent with our 10Be-derived records, millennial denudation rates are 2 to 50 times greater than modern denudation estimates, with the exception of sample DB01 for which modern and 10Be-derived denudation rates are roughly similar (Fig. 8). Equivalent order of discrepancy between modern sediment-yield and 10Be-derived denudation rates has been observed by several studies (e.g. Kirchner et al., 2001; Schaller et al., 2001; Wittmann et al., 2007, 2016; Stutenbecker et al., 2018; Pitlick et al., 2021). Among other factors (including the exclusion of non quartz-bearing areas for 10Be denudation rates; see Table 2 and discussion in Sect. 5.1), this discrepancy was interpreted to point to the separate or combined effects of (1) incorporation of high-magnitude low-frequency erosion events in the 10Be-derived but not in the sediment-yield denudation rates, (2) contribution of bedload and chemical weathering to 10Be-derived but not to sediment-yield denudation rates, (3) preferential postglacial erosion of material with low 10Be concentration, increasing 10Be-derived denudation rates, through fluvial linear dissection of the landscape and subglacial sediment export, (4) sediment traps (e.g. lakes, dams), changing the flux measured by sediment gauging but less probably the 10Be concentrations which are averaged over longer timescales. The first and third hypotheses could be the most plausible for our results. Modern denudation rates are potentially not capturing the occurrence of large sporadic erosional events (Kirchner et al., 2001; Schaller et al., 2001), with the exception of catchment DB01 (and therefore DB02, 06, 10, 12 along the main DB course), where major erosional events have been occurring during the Holocene towards the present day (i.e. rockfall events; Deline et al., 2012, 2015) and therefore potentially included in the 101–102 years integration time of the modern denudation rates. Alternatively, low 10Be-concentration sediment input in the river system, coming from linear fluvial incision and subglacial sediment export, could explain the mismatch between modern and millennial denudation rates, with 10Be-derived denudation rates being potentially overestimated (Stutenbecker et al., 2018).
Our 10Be-derived catchment-wide denudation rates obtained in the Dora Baltea (DB) catchment (western Italian Alps) vary between 0.2 and 0.9 mm yr−1 and fit within literature values across the European Alps (Delunel et al., 2020). Correlation of output denudation rates with topographic, environmental and geological metrics excludes any significant control of precipitation and rock uplift on the observed variability in denudation rates within the DB catchment. Our results instead highlight the main influence of catchment bedrock structuration and erodibility (lithotectonic origin) and resulting topographic metrics on denudation rate variability among the 13 main tributaries. As previously supposed for some other parts of the Alps, our study shows that the most resistant lithologies (granite and gneiss) support high-elevation and high-relief catchments where glacial and slope processes are more intense and denudation rates are higher than in low-elevation/relief catchments, dominated by “high-erodibility” bedrock (carbonate and terrigenous rocks).
This lithotectonic control on catchment denudation is exemplified by the tributary catchment draining the Mont Blanc Massif, which has the highest 10Be-derived denudation rate from our dataset and appears as an end-member for most of the investigated metrics. Located in the long-term actively uplifting core of the European Alps, the Mont Blanc Massif also experienced intense Quaternary glaciations which deeply modified the landscape. Steep slopes and high reliefs could be supported by the highly resistant granitoid lithology, which in turn have been influencing the millennial to present-day high denudation of the catchment, governed by intense glacial and periglacial processes as well as recurring rockfall events. In addition, our results also show that the high sediment input from the Mont Blanc catchment dominates the DB sediment flux, contributing to >77 % of the 10Be signal carried by river sediments along the DB main river, even downstream of multiple tributary junctions. This suggests unequal sediment contribution between tributary fluxes along the DB catchment.
Finally, our 10Be-derived denudation rates allow for comparison with long-term (106–107 years, from thermochronology) and modern (101–102 years, from sediment budget) denudation rates, showing that, albeit with different absolute values, the spatial trend in catchment denudation is overall in agreement over different timescales, with higher millennial denudation rates in the Mont Blanc Massif compared to the rest of the DB catchment.
The data used in this study are available upon request.
The supplement related to this article is available online at: https://doi.org/10.5194/esurf-10-493-2022-supplement.
ES, PGV and RD designed the study. ES, PGV and NG performed field investigations and sample collection. ES performed 10Be cosmogenic sample preparation (under the supervision of NA), 10Be production and denudation rate calculation, and analyses. MC performed 10Be measurements. RD performed 10Be-derived sediment budget calculations. ES wrote the paper with input from all co-authors.
The contact author has declared that neither they nor their co-authors have any competing interests.
Publisher's note: Copernicus Publications remains neutral with regard to jurisdictional claims in published maps and institutional affiliations.
The authors warmly thank Fabio Magrani for the help during fieldwork. Julijana Gajic is thanked for support with 10Be sample preparation. This study was supported by the Swiss National Science Foundation SNSF (grant no. PP00P2_170559) and the French ANR-PIA programme (ANR-18-MPGA-0006). We thank three anonymous reviewers and the associate editor Simon Mudd for insightful comments that helped to improve the paper.
This research has been supported by the Schweizerischer Nationalfonds zur Förderung der Wissenschaftlichen Forschung (grant no. PP00P2_170559) and the Agence Nationale de la Recherche (grant no. ANR-18-MPGA-0006).
This paper was edited by Simon Mudd and reviewed by three anonymous referees.
Akçar, N., Deline, P., Ivy-Ochs, S., Alfimov, V., Hajdas, I., Kubik, P. W., Christl, M., and Schlüchter, C.: The AD 1717 rock avalanche deposits in the upper Ferret Valley (Italy): A dating approach with cosmogenic 10Be, J. Quat. Sci., 27, 383–392, https://doi.org/10.1002/jqs.1558, 2012.
Akçar N., Ivy-Ochs S., Alfimov V., Schlunegger F., Claude A., Reber R., Christl M., Vockenhuber C., Dehnert A., Meinert R., and Schlüchter C.: Isochron-burial dating of glaciofluvial deposits: primary results from the Alps, Earth Surf. Proc. Land., 42, 2414–2425, https://doi.org/10.1002/esp.4201, 2017.
Baroni, C., Gennaro, S., Cristina, M., Ivy-ochs, S., Christl, M., Cerrato, R., and Orombelli, G.: Last Lateglacial glacier advance in the Gran Paradiso Group reveals relatively drier climatic conditions established in the Western Alps since at least the Younger Dryas, Quat. Sci. Rev., 255, 106815, https://doi.org/10.1016/j.quascirev.2021.106815, 2021.
Bartolini, C. and Fontanelli, K.: Present versus long term sediment yield to the Adriatic Sea and the reliability of gauging stations data, B. Soc. Geol. Ital., 128, 655–667, https://doi.org/10.3301/IJG.2009.128.3.655, 2009.
Bartolini, C., Caputo, R., and Pieri, M.: Pliocene-Quaternary sedimentation in the Northern Apennine foredeep and related denudation, Geol. Mag., 133, 255–273, https://doi.org/10.1017/s0016756800009006, 1996.
Bierman, P. and Steig, E. J.: Estimating rates of denudation using cosmogenic isotope abundances in sediment, Earth Surf. Proc. Land., 21, 125–139, https://doi.org/10.1002/(SICI)1096-9837(199602)21:2<125::AID-ESP511>3.0.CO;2-8, 1996.
Binnie, S. A., Phillips, W. M., Summerfield, M. A., and Fifield, L. K.: Tectonic uplift, threshold hillslopes, and denudation rates in a developing mountain range, Geology, 35, 743–746, https://doi.org/10.1130/G23641A.1, 2007.
Bookhagen, B. and Strecker, M. R.: Spatiotemporal trends in erosion rates across a pronounced rainfall gradient: Examples from the southern Central Andes, Earth Planet. Sci. Lett., 327–328, 97–110, https://doi.org/10.1016/j.epsl.2012.02.005, 2012.
Braucher, R., Merchel, S., Borgomano, J., and Bourlès, D. L.: Production of cosmogenic radionuclides at great depth: a multi element approach, Earth Planet. Sci. Lett., 309, 1–9, https://doi.org/10.1016/j.epsl.2011.06.036, 2011.
Brocklehurst, S. H. and Whipple, K. X.: Hypsometry of glaciated landscapes, Earth Surf. Proc. Land., 29, 907–926, https://doi.org/10.1002/esp.1083, 2004.
Brown, E. T., Stallard, R. F., Larsen, M. C., Raisbeck, G. M., and Yiou, F.: Denudation rates determined from the accumulation of in situ-produced 10Be in the Luquillo Experimental Forest, Puerto Rico, Earth Planet. Sci. Lett., 129, 193–202, https://doi.org/10.1016/0012-821X(94)00249-X, 1995.
Burbank, D. W., Leland, J., Fielding, E., Anderson, R. S., Brozovic, N., Reid, M. R., and Duncan, C.: Bedrock incision, rock uplift and threshold hillslopes in the northwestern Himalayas, Nature, 379, 505–510, https://doi.org/10.1038/379505a0, 1996.
Carretier, S., Regard, V., Vassallo, R., Martinod, J., Christophoul, F., Gayer, E., Audin, L., and Lagane, C.: A note on 10Be-derived mean erosion rates in catchments with heterogeneous lithology: Examples from the western Central Andes, Earth Surf. Proc. Land., 40, 1719–1729, https://doi.org/10.1002/esp.3748, 2015.
Champagnac, J. D., Schlunegger, F., Norton, K., von Blanckenburg, F., Abbühl, L. M., and Schwab, M.: Erosion-driven uplift of the modern Central Alps, Tectonophysics, 474, 236–249, https://doi.org/10.1016/j.tecto.2009.02.024, 2009.
Champagnac, J. D., Valla, P. G., and Herman, F.: Late-Cenozoic relief evolution under evolving climate: A review, Tectonophysics, 614, 44–65, https://doi.org/10.1016/j.tecto.2013.11.037, 2014.
Charreau, J., Blard, P. H., Zumaque, J., Martin, L. C. P., Delobel, T., and Szafran, L.: Basinga: A cell-by-cell GIS toolbox for computing basin average scaling factors, cosmogenic production rates and denudation rates, Earth Surf. Proc. Land., 44, 2349–2365, https://doi.org/10.1002/esp.4649, 2019.
Chittenden, H., Delunel, R., Schlunegger, F., Akçar, N., and Kubik, P.: The influence of bedrock orientation on the landscape evolution, surface morphology and denudation (10Be) at the Niesen, Switzerland, Earth Surf. Proc. Land., 39, 1153–1166, https://doi.org/10.1002/esp.3511, 2014.
Christl, M., Vockenhuber, C., Kubik, P. W., Wacker, L., Lachner, J., Alfimov, V., and Synal, H. A.: The ETH Zurich AMS facilities: Performance parameters and reference materials, Nucl. Instruments Methods Phys. Res. Sect. B Beam Interact. with Mater. Atoms, 294, 29–38, https://doi.org/10.1016/j.nimb.2012.03.004, 2013.
Clark, P. U., Dyke, A. S., Shakun, J. D., Carlson, A. E., Clark, J., Wohlfarth, B., Mitrovica, J. X., Hostetler, S. W., and McCabe, A. M.: The Last Glacial Maximum, Science 325, 710–714, https://doi.org/10.1126/science.1172873, 2009.
Codilean, A. T.: Calculation of the cosmogenic nuclide production topographic shielding scaling factor for large areas using DEMs, Earth Surf. Proc. Land., 31, 785–794, https://doi.org/10.1002/esp.1336, 2006.
Codilean, A. T., Munack, H., Cohen, T. J., Saktura, W. M., Gray, A., and Mudd, S. M.: OCTOPUS: an open cosmogenic isotope and luminescence database, Earth Syst. Sci. Data, 10, 2123–2139, https://https://doi.org/10.5194/essd-10-2123-2018, 2018.
Cruz Nunes, F., Delunel, R., Schlunegger, F., Akçar, N., and Kubik, P. W.: Bedrock bedding, landsliding and erosional budgets in the Central European Alps, Terra Nova, 27, 370–378, https://doi.org/10.1111/ter.12169, 2015.
Dal Piaz, G. V., Gianotti, F., Monopoli, B., Pennacchioni, G., Tartarotti, P., and Schiavo, A.: Carta Geologica d'Italia – Foglio 091, Chatillon, Regione Autonoma Valle d'Aosta, 1–152, 2008.
Deline, P., Gardent, M., Magnin, F., and Ravanel, L.: The morphodynamics of the Mont Blanc massif in a changing cryosphere: a comprehensive review, Geogr. Ann. A., 94, 265–283, https://doi.org/10.1111/j.1468-0459.2012.00467.x, 2012.
Deline, P., Akçar, N., Ivy-Ochs, S., and Kubik, P. W.: Repeated Holocene rock avalanches onto the Brenva Glacier, Mont Blanc massif, Italy: A chronology, Quat. Sci. Rev., 126, 186–200, https://doi.org/10.1016/j.quascirev.2015.09.004, 2015.
Delunel, R., van der Beek, P. A., Carcaillet, J., Bourlès, D. L., and Valla, P. G.: Frost-cracking control on catchment denudation rates: Insights from in situ produced 10Be concentrations in stream sediments (Ecrins-Pelvoux massif, French Western Alps), Earth Planet. Sci. Lett., 293, 72–83, https://doi.org/10.1016/j.epsl.2010.02.020, 2010.
Delunel, R., Van der Beek, P. A., Bourlès, D. L., Carcaillet, J., and Schlunegger, F.: Transient sediment supply in a high-altitude Alpine environment evidenced through a 10Be budget of the Etages catchment (French Western Alps), Earth Surf. Proc. Land., 39, 890–899, https://doi.org/10.1002/esp.3494, 2014.
Delunel, R., Schlunegger, F., Valla, P. G., Dixon, J., Glotzbach, C., Hippe, K., Kober, F., Molliex, S., Norton, K. P., Salcher, B., Wittmann, H., Akçar, N., and Christl, M.: Late-Pleistocene catchment-wide denudation patterns across the European Alps, Earth-Sci. Rev., 211, 103407, https://doi.org/10.1016/j.earscirev.2020.103407, 2020.
DiBiase, R. A.: Short communication: Increasing vertical attenuation length of cosmogenic nuclide production on steep slopes negates topographic shielding corrections for catchment erosion rates, Earth Surf. Dynam., 6, 923–931, https://doi.org/10.5194/esurf-6-923-2018, 2018.
DiBiase, R. A., Heimsath, A. M., and Whipple, K. X.: Hillslope response to tectonic forcing in threshold landscapes, Earth Surf. Proc. Land., 37, 855–865, https://doi.org/10.1002/esp.3205, 2012.
Diolaiuti, G. A., Bocchiola, D., Vagliasindi, M., D'Agata, C., and Smiraglia, C.: The 1975–2005 glacier changes in Aosta Valley (Italy) and the relations with climate evolution, Prog. Phys. Geogr., 36, 764–785, https://doi.org/10.1177/0309133312456413, 2012.
Dixon, J. L., von Blanckenburg, F., Stüwe, K., and Christl, M.: Glaciation's topographic control on Holocene erosion at the eastern edge of the Alps, Earth Surf. Dynam., 4, 895–909, https://https://doi.org/10.5194/esurf-4-895-2016, 2016.
Dunne, J., Elmore, D., and Muzikar, P.: Scaling factors for the rates of production of cosmogenic nuclides for geometric shielding and attenuation at depth on sloped surfaces, Geomorphology, 27, 3–11, https://doi.org/10.1016/S0169-555X(98)00086-5, 1999.
Gavrilovic, S.: Bujicni tokovi i erozija (Torrents and erosion), Beograd, Serbia, Gradevinski Kalendar, 1976.
Glotzbach, C., Van Der Beek, P., Carcaillet, J., and Delunel, R.: Deciphering the driving forces of erosion rates on millennial to million-year timescales in glacially impacted landscapes: An example from the Western Alps, J. Geophys. Res.-Earth, 118, 1491–1515, https://doi.org/10.1002/jgrf.20107, 2013.
Glotzbach, C., Röttjer, M., Hampel, A., Hetzel, R., and Kubik, P.W.: Quantifying the impact of former glaciation on catchment‐wide denudation rates derived from cosmogenic 10Be, Terra Nova, 26, 186–194, https://doi.org/10.1111/ter.12085, 2014.
Godard, V., Bourlès, D. L., Spinabella, F., Burbank, D. W., Bookhagen, B., Fisher, G. B., Moulin, A., and Léanni, L.: Dominance of tectonics over climate in Himalayan denudation, Geology, 42, 243–246, https://doi.org/10.1130/G35342.1, 2014.
Granger, D. E., Kirchner, J. W., and Finkel, R.: Spatially averaged long-term erosion rates measured from in situ-produced cosmogenic nuclides in alluvial sediment, J. Geol., 104, 249–257, https://doi.org/10.1086/629823, 1996.
Granger, D. E. and Schaller, M.: Cosmogenic nuclides and erosion at the watershed scale, Elements, 10, 369–373, https://doi.org/10.2113/gselements.10.5.369, 2014.
Guillon, H., Mugnier, J. L., Buoncristiani, J. F., Carcaillet, J., Godon, C., Prud'Homme, C., Van der Beek, P., and Vassallo, R.: Improved discrimination of subglacial and periglacial erosion using 10Be concentration measurements in subglacial and supraglacial sediment load of the Bossons glacier (Mont Blanc massif, France), Earth Surf. Process. Landf., 40, 1202–1215, https://doi.org/10.1002/esp.3713, 2015.
Herman, F., Seward, D., Valla, P. G., Carter, A., Kohn, B., Willett, S. D., and Ehlers, T. A.: Worldwide acceleration of mountain erosion under a cooling climate, Nature, 504, 423–426, https://doi.org/10.1038/nature12877, 2013.
Hinderer, M., Kastowski, M., Kamelger, A., Bartolini, C., and Schlunegger, F.: River loads and modern denudation of the Alps – A review, Earth Sci. Rev., 118, 11–44, https://doi.org/10.1016/j.earscirev.2013.01.001, 2013.
Isotta, F. A., Frei, C., Weilguni, V., Perčec Tadić, M., Lassègues, P., Rudolf, B., Pavan, V., Cacciamani, C., Antolini, G., Ratto, S. M., Munari, M., Micheletti, S., Bonati, V., Lussana, C., Ronchi, C., Panettieri, E., Marigo, G., and Vertačnik, G.: The climate of daily precipitation in the Alps: Development and analysis of a high-resolution grid dataset from pan-Alpine rain-gauge data, Int. J. Climatol., 34, 1657–1675, https://doi.org/10.1002/joc.3794, 2014.
Kirchner, J. W., Finkel, R. C., Riebe, C. S., Granger, D. E., Clayton, J. L., King, J. G., and Megahan, W. F.: Mountain erosion over 10 yr, 10 k.y., and 10 m.y. time scales, Geology, 29, 591–594, https://doi.org/10.1130/0091-7613(2001)029<0591:MEOYKY>2.0.CO;2, 2001.
Korup, O. and Schlunegger, F.: Bedrock landsliding, river incision, and transience of geomorphic hillslope-channel coupling: Evidence from inner gorges in the Swiss Alps. J. Geophys. Res.-Earth, 112, F0302, https://doi.org/10.1029/2006JF000710, 2007.
Kühni, A. and Pfiffner, O. A.: The relief of the Swiss Alps and adjacent areas and its relation to lithology and structure: Topographic analysis from a 250 m DEM, Geomorphology, 41, 285–307, https://doi.org/10.1016/S0169-555X(01)00060-5, 2001.
Lal, D.: Cosmic ray labeling of erosion surfaces: in situ nuclide production rates and erosion models, Earth Planet. Sci. Lett., 104, 424–43, https://doi.org/10.1016/0012-821X(91)90220-C, 1991.
Lupker, M., Blard, P. H., Lavé, J., France-Lanord, C., Leanni, L., Puchol, N., Charreau, J., and Bourlès, D.: 10Be-derived Himalayan denudation rates and sediment budgets in the Ganga basin, Earth Planet. Sci. Lett., 333–334, 146–156, https://doi.org/10.1016/j.epsl.2012.04.020, 2012.
Malusà, M. G., Polino, R., Zattin, M., Bigazzi, G., Martin, S., and Piana, F.: Miocene to Present differential exhumation in the Western Alps: Insights from fission track thermochronology, Tectonics, 24, 1–23, https://doi.org/10.1029/2004TC001782, 2005.
Martin, L. C. P., Blard, P.-H., Balco, G., Lavé, J., Delunel, R., Lifton, N., and Laurent, V.: The CREp program and the ICE-D production rate calibration database: A fully parameterizable and updated online tool to compute cosmic-ray exposure ages, Quat. Geochronol., 38, 25–49, https://doi.org/10.1016/J.QUAGEO.2016.11.006, 2017.
Maxeiner, S., Synal, H. A., Christl, M., Suter, M., Müller, A., and Vockenhuber, C.: Proof-of-principle of a compact 300 kV multi-isotope AMS facility, Nucl. Instruments Methods Phys. Res. Sect. B Beam Interact. with Mater. Atoms, 439, 84–89, https://doi.org/10.1016/j.nimb.2018.11.028, 2019.
Molnar, P., Anderson, R. S., and Anderson, S. P.: Tectonics, fracturing of rock, and erosion, J. Geophys. Res., 112, https://doi.org/10.1029/2005JF000433, 2007.
Montgomery, D. R. and Brandon, M. T.: Topographic controls on erosion rates in tectonically active mountain ranges, Earth Planet. Sci. Lett., 201, 481–489, https://doi.org/10.1016/S0012-821X(02)00725-2, 2002.
Moon, S., Page Chamberlain, C., Blisniuk, K., Levine, N., Rood, D. H., and Hilley, G. E.: Climatic control of denudation in the deglaciated landscape of the Washington Cascades, Nat. Geosci., 4, 469–473, https://doi.org/10.1038/ngeo1159, 2011.
Muscheler, R., Beer, J., Kubik, P. W., and Synal, H. A.: Geomagnetic field intensity during the last 60,000 years based on 10Be and 36Cl from the Summit ice cores and 14C, Quat. Sci. Rev., 24, 1849–1860, https://doi.org/10.1016/j.quascirev.2005.01.012, 2005.
Mudd, S. M., Harel, M.-A., Hurst, M. D., Grieve, S. W. D., and Marrero, S. M.: The CAIRN method: automated, reproducible calculation of catchment-averaged denudation rates from cosmogenic nuclide concentrations, Earth Surf. Dynam., 4, 655–674, https://doi.org/10.5194/esurf-4-655-2016, 2016.
Norton, K. P., Abbühl, L. M., and Schlunegger, F.: Glacial conditioning as an erosional driving force in the Central Alps, Geology, 38, 655–658, https://doi.org/10.1130/G31102.1, 2010.
Norton, K. P., von Blanckenburg, F., DiBiase, R., Schlunegger, F., and Kubik, P. W.: Cosmogenic 10Be-derived denudation rates of the Eastern and Southern European Alps, Int. J. Earth Sci., 100, 1163–1179, https://doi.org/10.1007/s00531-010-0626-y, 2011.
Pedersen, V. K. and Egholm, D. L.: Glaciations in response to climate variations preconditioned by evolving topography, Nature, 493, 206–210, https://doi.org/10.1038/nature11786, 2013.
Peizhen, Z., Molnar, P., and Downs, W. R.: Increased sedimentation rates and grain sizes 2–4 Myr ago due to the influence of climate change on erosion rates, Nature, 410, 891–897, https://doi.org/10.1038/35073504, 2001.
Perello, P., Gianotti, F., and Monopoli, B.: Carta Geologica d'Italia – Foglio 089, Courmayeur, Regione Autonoma Valle d'Aosta, 2008.
Polino, R., Malusà, M. G., Martin, S., Carraro, F., Gianotti, F., and Bonetto, F.: Carta Geologica d'Italia – Foglio 090, Aosta, 3, Regione Autonoma Valle d'Aosta, 2008.
Pitlick, J., Recking, A., Liebault, F., Misset, C., Piton, G., and Vazquez-Tarrio, D.: Sediment production in French Alpine rivers, Water Resour. Res., 57, e2021WR030470. https://doi.org/10.1029/2021WR030470, 2021.
Portenga, E. W. and Bierman, P. R.: Understanding earth's eroding surface with 10Be, GSA Today, 21, 4–10, https://doi.org/10.1130/G111A.1, 2011.
Ravanel, L., Allignol, F., Deline, P., Gruber, S., and Ravello, M.: Rock falls in the Mont Blanc Massif in 2007 and 2008, Landslides, 7, 493–501, https://doi.org/10.1007/s10346-010-0206-z, 2010.
Resentini, A. and Malusà, M. G.: Sediment budgets by detrital apatite fi ssion-Track dating (Rivers Dora Baltea and Arc, Western Alps), Spec. Pap. Geol. Soc. Am., 487, 125–140, https://doi.org/10.1130/2012.2487(08), 2012.
Salcher, B. C., Kober, F., Kissling, E., and Willett, S. D.: Glacial impact on short- wavelength topography and long-lasting effects on the denudation of a deglaciated mountain range, Glob. Planet. Chang., 115, 59–70, https://doi.org/10.1016/j.gloplacha.2014.01.002, 2014.
Savi, S., Norton, K., Picotti, V., Brardinoni, F., Akçar, N., Kubik, P. W., Delunel, R., and Schlunegger, F.: Effects of sediment mixing on 10Be concentrations in the Zielbach catchment, central-eastern Italian Alps, Quat. Geochronol., 19, 148–162, https://doi.org/10.1016/j.quageo.2013.01.006, 2014.
Schaller, M., Von Blanckenburg, F., Hovius, N., and Kubik, P. W.: Large-scale erosion rates from in situ-produced cosmogenic nuclides in European river sediments, Earth Planet. Sci. Lett., 188, 441–458, https://doi.org/10.1016/S0012-821X(01)00320-X, 2001.
Scharf, T. E., Codilean, A. T., De Wit, M., Jansen, J. D., and Kubik, P. W.: Strong rocks sustain ancient postorogenic topography in southern Africa. Geology, 41, 331-334, https://doi.org/10.1130/G33806.1, 2013.
Schlunegger, F. and Hinderer, M.: Pleistocene/Holocene climate change, reestablishment of fluvial drainage network and increase in relief in the Swiss Alps, Terra Nova, 15, 88–95, https://doi.org/10.1046/j.1365-3121.2003.00469.x, 2003.
Schmid, S. M., Fügenschuh, B., Kissling, E., and Schuster, R.: Tectonic map and overall architecture of the Alpine orogen, Eclogae Geol. Helv., 97, 93–117, https://doi.org/10.1007/s00015-004-1113-x, 2004.
Schwanghart, W. and Scherler, D.: Short Communication: TopoToolbox 2 – MATLAB-based software for topographic analysis and modeling in Earth surface sciences, Earth Surf. Dynam., 2, 1–7, https://doi.org/10.5194/esurf-2-1-2014, 2014.
Serra, E., Valla, P. G., Gribenski, N., Carcaillet, and Deline, P.: Post-LGM glacial and geomorphic evolution of the Dora Baltea valley (western Italian Alps), Quat. Sci. Rev., 282, 107446, https://doi.org/10.1016/j.quascirev.2022.107446, 2022.
Small, E. E. and Anderson, R. S.: Pleistocene relief production in Laramide mountain ranges, western United States, Geology, 26, 123–126, https://doi.org/10.1130/0091-7613(1998)026<1150:PRPILM>2.3.CO;2, 1998.
Sternai, P., Sue, C., Husson, L., Serpelloni, E., Becker, T. W., Willett, S. D., Faccenna, C., Di Giulio, A., Spada, G., Jolivet, L., Valla, P., Petit, C., Nocquet, J. M., Walpersdorf, A., and Castelltort, S.: Present-day uplift of the European Alps: Evaluating mechanisms and models of their relative contributions, Earth Sci. Rev., 190, 589–604, https://doi.org/10.1016/j.earscirev.2019.01.005, 2019.
Stone, J. O.: Air pressure and cosmogenic isotope production, J. Geophys. Res.-Sol. Ea., 105, 23753–23759, https://doi.org/10.1029/2000JB900181, 2000.
Stutenbecker, L., Costa, A., and Schlunegger, F.: Lithological control on the landscape form of the upper Rhône Basin, Central Swiss Alps, Earth Surf. Dynam., 4, 253–272, https://doi.org/10.5194/esurf-4-253-2016, 2016.
Stutenbecker, L., Delunel, R., Schlunegger, F., Silva, T. A., Šegvić, B., Girardclos, S., Bakker, M., Costa, A., Lane, S. N., Loizeau, J. L., Molnar, P., Akçar, N., and Christl, M.: Reduced sediment supply in a fast eroding landscape? A multi-proxy sediment budget of the upper Rhône basin, Central Alps, Sediment. Geol., 375, 105–119, https://doi.org/10.1016/j.sedgeo.2017.12.013, 2018.
Uppala, S. M., Kållberg, P. W., Simmons, A. J., Andrae, U., da Costa Bechtold, V., Fiorino, M., Gibson, J. K., Haseler, J., Hernandez, A., Kelly, G. A., Li, X., Onogi, K., Saarinen, S., Sokka, N., Allan, R. P., Andersson, E., Arpe, K., Balmaseda, M. A., Beljaars, A. C. M., van de Berg, L., Bidlot, J., Bormann, N., Caires, S., Chevallier, F., Dethof, A., Dragosavac, M., Fisher, M., Fuentes, M., Hagemann, S., Hólm, E., Hoskins, B. J., Isaksen, L., Janssen, P. A. E. M., Jenne, R., McNally, A. P., Mahfouf, J. F., Morcrette, J. J., Rayner, N. A., Saunders, R. W., Simon, P., Sterl, A., Trenberth, K. E., Untch, A., Vasiljevic, D., Viterbo, P., and Woollen, J.: The ERA-40 re-analysis, Q. J. Roy. Meteor. Soc., 131, 2961–3012, https://doi.org/10.1256/qj.04.176, 2005.
Valla, P. G., van der Beek, P. A., and Carcaillet, J.: Dating bedrock gorge incision in the French Western Alps (Ecrins-Pelvoux massif) using cosmogenic 10Be, Terra Nov., 22, 18–25, https://doi.org/10.1111/j.1365-3121.2009.00911.x, 2010.
Valla, P. G., Shuster, D. L., and Van Der Beek, P. A.: Significant increase in relief of the European Alps during mid-Pleistocene glaciations, Nat. Geosci., 4, 688–692, https://doi.org/10.1038/ngeo1242, 2011.
Valla, P. G., Sternai, P., and Fox, M.: How Climate, Uplift and Erosion Shaped the Alpine Topography, Elements, 17, 41–46, https://doi.org/10.2138/gselements.17.1.41, 2021.
Van den Berg, F., Schlunegger, F., Akçar, N., and Kubik, P. 10Be-derived assessment of accelerated erosion in a glacially conditioned inner gorge, Entlebuch, Central Alps of Switzerland, Earth Surf. Proc. Land., 37, 1176–1188, https://doi.org/10.1002/esp.3237, 2012.
Vezzoli, G.: Erosion in the Western Alps (Dora Baltea Basin): 2. Quantifying sediment yield, Sediment. Geol., 171, 247–259, https://doi.org/10.1016/j.sedgeo.2004.05.018, 2004.
Vezzoli, G., Garzanti, E., and Monguzzi, S. Erosion in the western Alps (Dora Baltea basin): 1. Quantifying sediment provenance, Sediment. Geol., 171, 227–246, https://doi.org/10.1016/j.sedgeo.2004.05.017, 2004.
von Blanckenburg, F.: The control mechanisms of erosion and weathering at basin scale from cosmogenic nuclides in river sediment, Earth Planet. Sci. Lett., 237, 462–479, https://doi.org/10.1016/j.epsl.2005.06.030, 2005.
Willenbring, J. K., Codilean, A. T., and Mcelroy, B.: Earth is (mostly) flat: apportionment of the flux of continental sediment over millennial time scales, Geology, 41, 343–346, https://doi.org/10.1130/G33918.1, 2013.
Wittmann, H., von Blanckenburg, F., Kruesmann, T., Norton, K. P., and Kubik, P. W.: Relation between rock uplift and denudation from cosmogenic nuclides in river sediment in the Central Alps of Switzerland, J. Geophys. Res.-Earth, 112, 1–20, https://doi.org/10.1029/2006JF000729, 2007.
Wittmann, H., Malusà, M. G., Resentini, A., Garzanti, E., and Niedermann, S.: The cosmogenic record of mountain erosion transmitted across a foreland basin: Source-to-sink analysis of in situ 10Be, 26Al and 21Ne in sediment of the Po river catchment, Earth Planet. Sci. Lett., 452, 258–271, https://doi.org/10.1016/j.epsl.2016.07.017, 2016.