the Creative Commons Attribution 4.0 License.
the Creative Commons Attribution 4.0 License.
 | 17 Jan 2022
The role of geological mouth islands on the morphodynamics of back-barrier tidal basins
Yizhang Wei
Yining Chen
Jufei Qiu
Peng Yao
Qin Jiang
Zheng Gong
Giovanni Coco
Ian Townend
Changkuan Zhang
Researchers have extensively investigated the back-barrier islands morphodynamics using numerical methods. However, the influence of rocky mouth islands, which may be submerged by sea-level rise, has been rarely explored. Using the Dongshan Bay in southern China as a reference, this study numerically explores the long-term morphodynamic effect of geological constraints (e.g. rocky islands) for back-barrier basins. Model results indicate that the spatial configuration of mouth islands can considerably affect the morphological development of tidal basins. The presence of mouth islands narrows the inlet cross-sectional area, increasing flow velocity and residual current, resulting in more sediment suspension and transport. Meanwhile, mouth islands tend to increase erosion in the tidal basin and sedimentation in the ebb-delta area. Furthermore, the spatial distribution of mouth islands can also affect tidal basin evolution: the basin-side mouth islands tend to cause more basin erosion with higher tidal currents and more sediment transport. In contrast, the delta-side ones may increase relative sediment deposition in the basin. Finally, larger tidal prisms are observed with more mouth islands and with basin-side mouth islands, suggesting that the number and location of islands can affect the relationship between the tidal prism and inlet cross-sectional area. This modelling study furthers the understanding of barrier basin morphodynamics affected by rocky mouth islands and informs management strategies under a changing environment.
- Article
(15066 KB) - Full-text XML
- BibTeX
- EndNote


During the post-glacial sea-level rise, many low-lying basins and valleys were submerged, forming various embayed coasts and mouth islands, accounting for 10 %–15 % of the world's coastline (de Swart and Zimmerman, 2009; FitzGerald and Miner, 2013). Back-barrier systems are easily found around the world, such as the Wadden Sea (Wang et al., 2012), the Venice Lagoon (Feola et al., 2005) and the Massachusetts Bay (Rosen and Leach, 1987). Knowledge of the morphodynamic processes and the evolution of barrier systems is of great significance for better protection and management of this type of coastal zone.
Morphodynamics of back-barrier systems is affected by the interaction of various factors, including hydrodynamic processes (e.g. tides and waves), biological activities (e.g. presence of mangroves and salt marshes), climate change (e.g. global warming and sea-level rise) and anthropogenic activities (e.g. land reclamation and artificial construction) (Murray et al., 2008). These processes result in an ever-changing morphology of tidal channels, tidal flats and flood/ebb deltas (Wang et al., 2012). Coastal morphodynamics is characterized by the two-way feedback between hydrodynamics and topography. Hydrodynamics can shape the geomorphic characteristics of coastal landforms through sediment transport, while the landforms can also feedback to hydrodynamics, forming a morphodynamic loop that eventually drives the system to some sort of dynamic equilibrium state (Coco et al., 2013; Zhou et al., 2017).
In the last decades, many studies have been carried out on the morphodynamics of tidal barrier systems. Using laboratory experiments, Stefanon et al. (2010) showed that the experimental tidal channels and tidal flats generated were comparable with natural back-barrier systems, and sea-level variations can leave morphological signatures in terms of channel network incision and retreat. Numerical modelling is another effective tool compared with laboratory experiments (Zhou et al., 2014b). Their results suggested that the initial bathymetry and geometric characteristics of barrier basins greatly influence the development of tidal channels. Marciano (2005) numerically simulated the branching channel patterns observed in the Wadden Sea basins, results indicated that tidal channel patterns were governed by the morphological characteristics (e.g. the bottom slope and the water depth) and the Shields parameters (e.g. flow strength and sediment properties). Using a similar model type, Dastgheib et al. (2008) explored channel network formation in a multi-inlet tidal system, and the results qualitatively followed the empirical equilibrium equations, indicating that initial bathymetry and the adjacent basins can affect the evolution of barrier basins. In their study, van Maanen et al. (2013a) developed a 2-D morphodynamic model and explored the effects of both tidal range and initial bathymetry on producing different patterns. Several studies highlighted the importance of wave action on the morphodynamics of back-barrier systems. For instance, Herrling and Winter (2014) simulated the sediment dynamics in the mixed energy tidal inlet systems and demonstrated that the pathway and sediment distribution are different under fair weather and storm conditions, indicating that waves significantly influence sediment transport pattern and morphological evolution of the back-barrier systems (see also Nahon et al., 2012). Concerning the effect of sea-level rise on back-barrier basins, Dissanayake et al. (2012) and van Maanen et al. (2013b) designed schematized models to explore long-term evolution, and results suggested that sea-level rise can change the sediment transport from seaward to landward and the intertidal area can reduce considerably. For river-influenced barrier systems, Zhou et al. (2014a) applied a barrier basin model to simulate the effects of different landscape conditions (e.g. basin shape and river inflow location), suggesting that the river presence influences sediment budget and morphological evolution.
The above modelling studies have significantly advanced our understanding of the influenced factors on back-barrier tidal basins, but few studies consider the role of rocky islands which are very common landforms at the inlet mouth. It remains unclear how back-barrier basins evolve with and without mouth islands. For example, Fig. 1 shows two sets of neighbouring barrier basins: the Massachusetts Bay and the Plymouth Bay along the eastern coast of the US, and the Zhao'an Bay and the Jiuzhen Bay along the southern coast of China. All of them are embayed and drowned basins, probably formed by topographic drowning due to sea-level rise in the post-glacial period (FitzGerald, 1993; Jagoutz and Behn, 2013). Furthermore, the tidal basins in these examples have relatively close distances (about 30–40 km) with similar geomorphic shapes and tidal currents (Jiang and Meng, 2008) but with different morphological patterns due to the various geological constraints (e.g. rocky islands) at the inlet mouth. As shown in Fig. 1, shallow areas with dendritic channel networks are present in Plymouth Bay and Jiuzhen Bay. In contrast, several islands are observed in Massachusetts Bay and Zhao'an Bay where tidal flats and tidal channels developed very limitedly. Although all of these four barrier systems are semi-closed tidal basins, the existence of rocky islands may be one of the main contributors to their different morphologies.
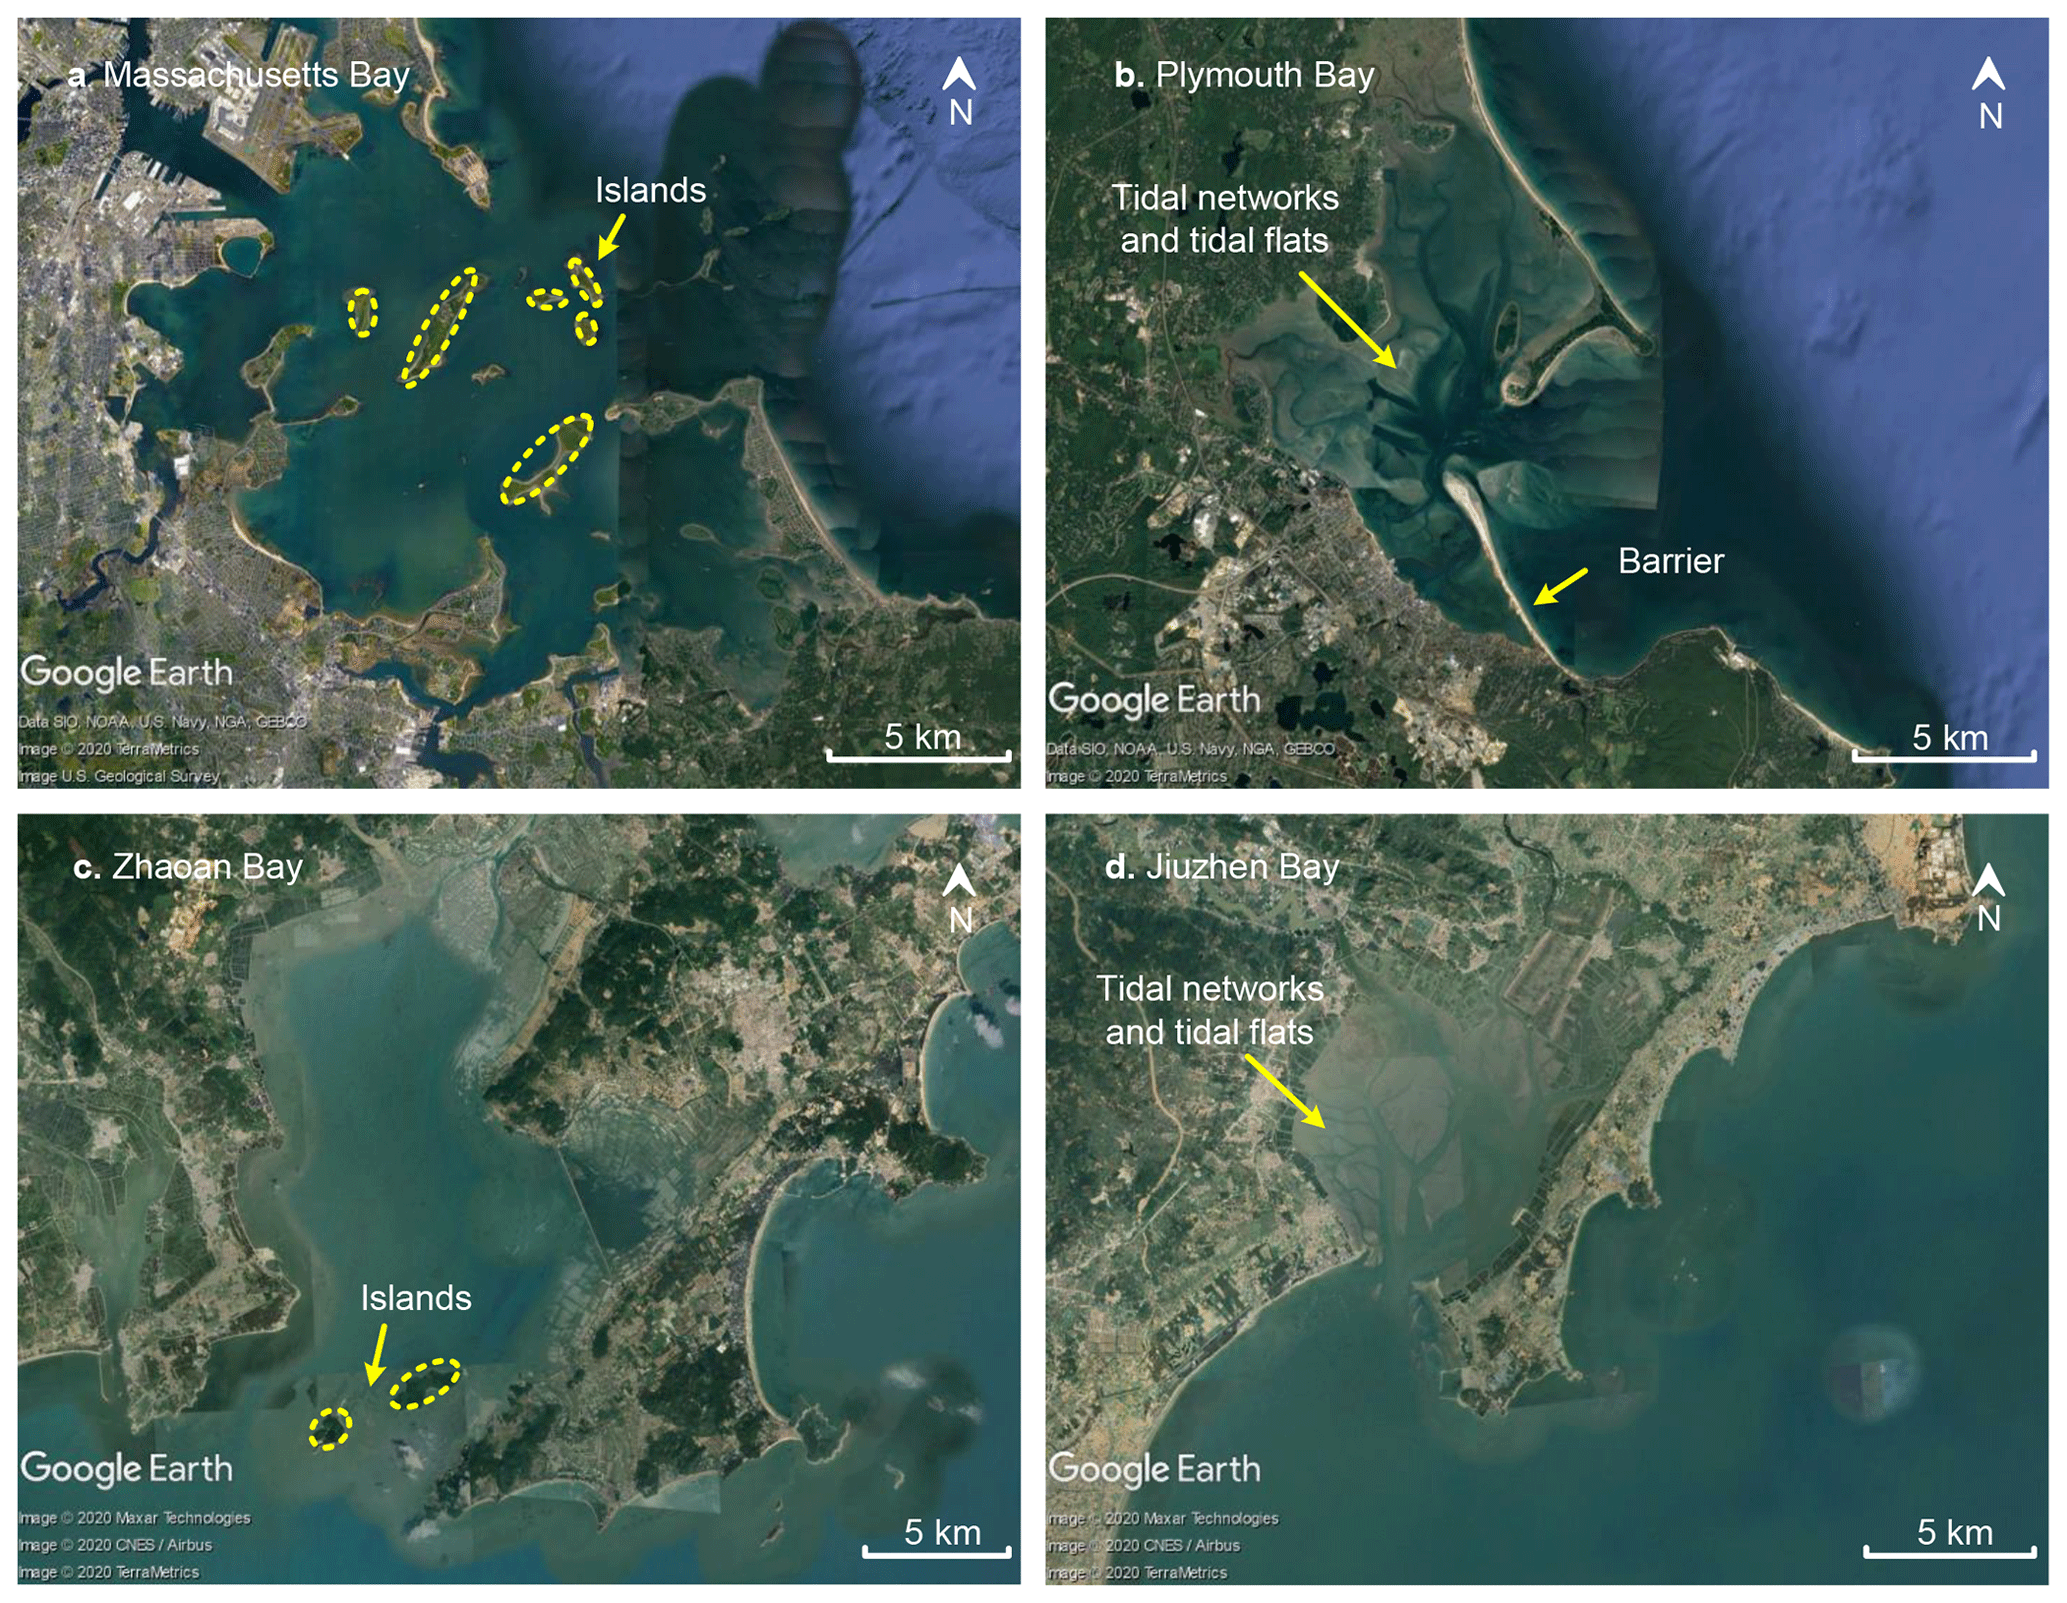
Figure 1Aerial view of two sets of tidal barrier basins (about 30–40 km from each other) along the eastern coast of the US and the southern coast of China. (a) Massachusetts Bay (42∘18′36′′ N, 70∘58′12′′ W); (b) Plymouth Bay (42∘00′18′′ N, 70∘39′18′′ W); (c) Zhao'an Bay (23∘40′12′′ N, 117∘18′36′′ E); (d) Jiuzhen Bay (23∘59′6′′ N, 117∘42′36′′ E). Image © Google Earth 2020, TerraMetrics.
This study aims to gain insight into the presence of rocky mouth islands that lead to the observed different morphologies from the comparison. Specific research questions are as follows: (1) what is the morphodynamic behaviour of tidal basins with a varying number of mouth islands? (2) How does island location impact the basin's morphological evolution? To answer these questions, an idealized morphodynamic model is established, with the Dongshan Bay, China, as a reference basin size. The outcome of this study can assist coastal managers and policymakers to improve management strategies for reclamation and artificial island construction.
2.1 Model description
Based on the Delft3D open-source software, a 2-D morphodynamic model is set up, which solves the coupled equations governing tidal flow, sediment transport and bed-level updating (Lesser et al., 2004; Marciano, 2005; van der Wegen and Roelvink, 2008). The alternative direction implicit method is used to solve the shallow water equations. The result describes a detailed flow field that is used in the calculation of sediment transport. Then the morphological change caused by the sediment transport is also fed back to the hydrodynamics at each time step. In this study, the widely adopted Engelund and Hansen formulation for sediment transport is considered (Engelund and Hansen, 1967):
where S is the total sediment transport (m2/s), U is the depth-averaged flow velocity (m/s), g is the gravity constant (m/s2), C is the Chézy friction coefficient (m s−1), Δ is the relative density, , and D50 is the median grain size (m).
In order to speed up morphodynamic calculations, a “morphological factor” (MF) is applied following Roelvink (2006). In this approach, the sediment erosion and deposition fluxes scale up by a constant factor (MF) at each hydrodynamic time step to mimic morphological changes over a longer duration. This approach has been extensively used, including schematic cases (Roelvink, 2006; van der Wegen and Roelvink, 2008) and real-world situations (Dastgheib et al., 2008; van der Wegen and Roelvink, 2012). The value of MF should be determined via sensitivity experiments (Zhou et al., 2014a; van der Wegen and Roelvink, 2012). Some sensitivity tests with varying MF values are performed to select the MF value. Specifically, it is necessary to ensure that the increased bed elevation in each time step is small enough relative to the water depth so that the hydrodynamic results in the next time step are not significantly different from an MF of 1 (Ranasinghe et al., 2011). In this way, to ensure the calculation accuracy, an MF of 50 is selected.
2.2 Model configurations
In this numerical experiment, an idealized model is set up with a comparable dimension as the Dongshan Bay, China, a typical barrier basin with mouth islands near the inlet (Fig. 2). The schematic model consists of a “stomach” shaped basin and a semi-circular open sea area with a radius of approximately 30 km (Fig. 2a). For the initial basin bathymetry, an idealized central channel is defined as −5 m at the landward head and linearly varying to −10 m near the inlet. The bottom of the outer sea is linearly sloped with an elevation of −10 m near the inlet to −40 m at the sea boundary, mimicking a shallow continental shelf. The idealized bathymetry in this study intends to investigate the effect of mouth islands on the long-term morphodynamic processes and the formation of tidal channels from a flat topography. Since this study mainly focuses on the morphology inside the basin, the grid size is smaller in the basin (cell size of 100 m) and larger in the open sea area (cell size of 400 m).
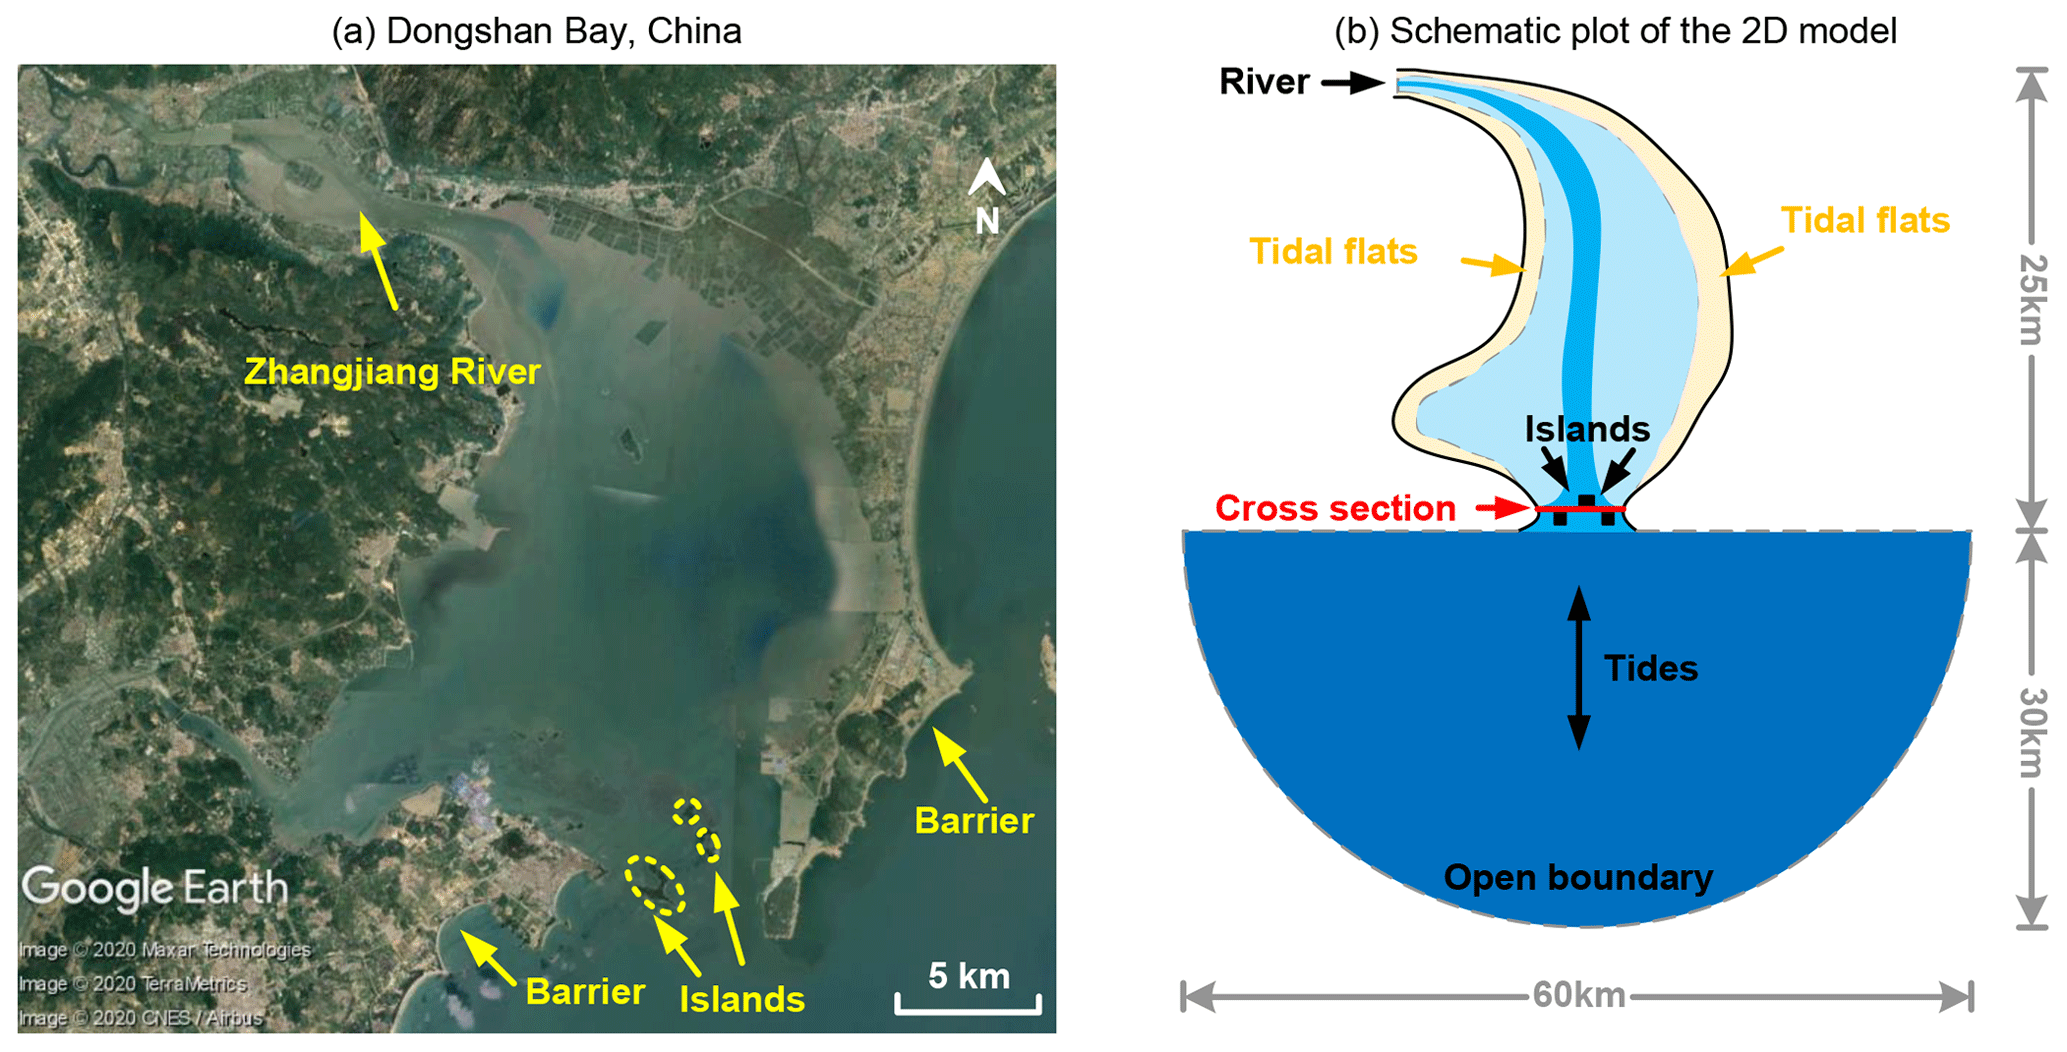
Figure 2(a) The reference barrier basin with three mouth islands near the inlet, Dongshan Bay (23∘49′48′′ N, 117∘31′18′′ E; Image © Google Earth 2020, Maxar Technologies). (b) The schematized model domain used in this study.
The hydrodynamic processes considered in this model include tides and riverine inflow because the emphasis is on the inner basin morphology. The mouth islands limit the waves inside the basin and hence are neglected. The landward end has a rived inflow with a constant discharge of 50 m3/s. A semidiurnal harmonic tide with a tidal range of 2.4 m is specified at the southern semi-circular sea boundary following Chen et al. (1993). The sediment fraction considered in this study is non-cohesive sand only, which is the most abundant component in the Dongshan Bay with a mean grain size of 135 µm (Chen et al., 1993). Sediment transport conditions at the river and sea boundaries are in equilibrium. This means the sediment input through the inflow boundaries can be immediately adapted to the local flow condition, ensuring the bed level near the model boundaries is almost unchanged. Sensitivity tests have been carried out to determine some other model parameters, such as the Chézy friction coefficient (65 m/s−1), horizontal eddy viscosity (1 m2/s) and hydrodynamic time step (60 s).
2.3 Sensitivity scenarios
Islands can potentially be submerged or even disappear due to projected sea-level rise and human activities (Webb and Kench, 2010). Thus, the number and location of mouth islands can be changed accordingly. However, the effect of varying numbers and locations of mouth islands on basin morphodynamics is yet to be well understood. Two sets of simulations are set up to explore the effects on basin morphologies. The model configurations are shown in Fig. 3. Cases in Fig. 3a–d investigate the effect of island numbers, zero to three islands, and for simplicity, they are indicated as “0i”, “1i”, “2i” and “3i”, respectively. The cases in Fig. 3e–g explore the role of island locations which are indicated as “IL”, “BS” and “DS”, respectively. All cases adopt the same initial bathymetry so that model results can be compared. Additionally, the islands in this initial study are non-erodible (rocky) and square (1 km × 1 km). In the future, different sizes and shapes of islands will be investigated to determine how these parameters impact morphological outcomes.
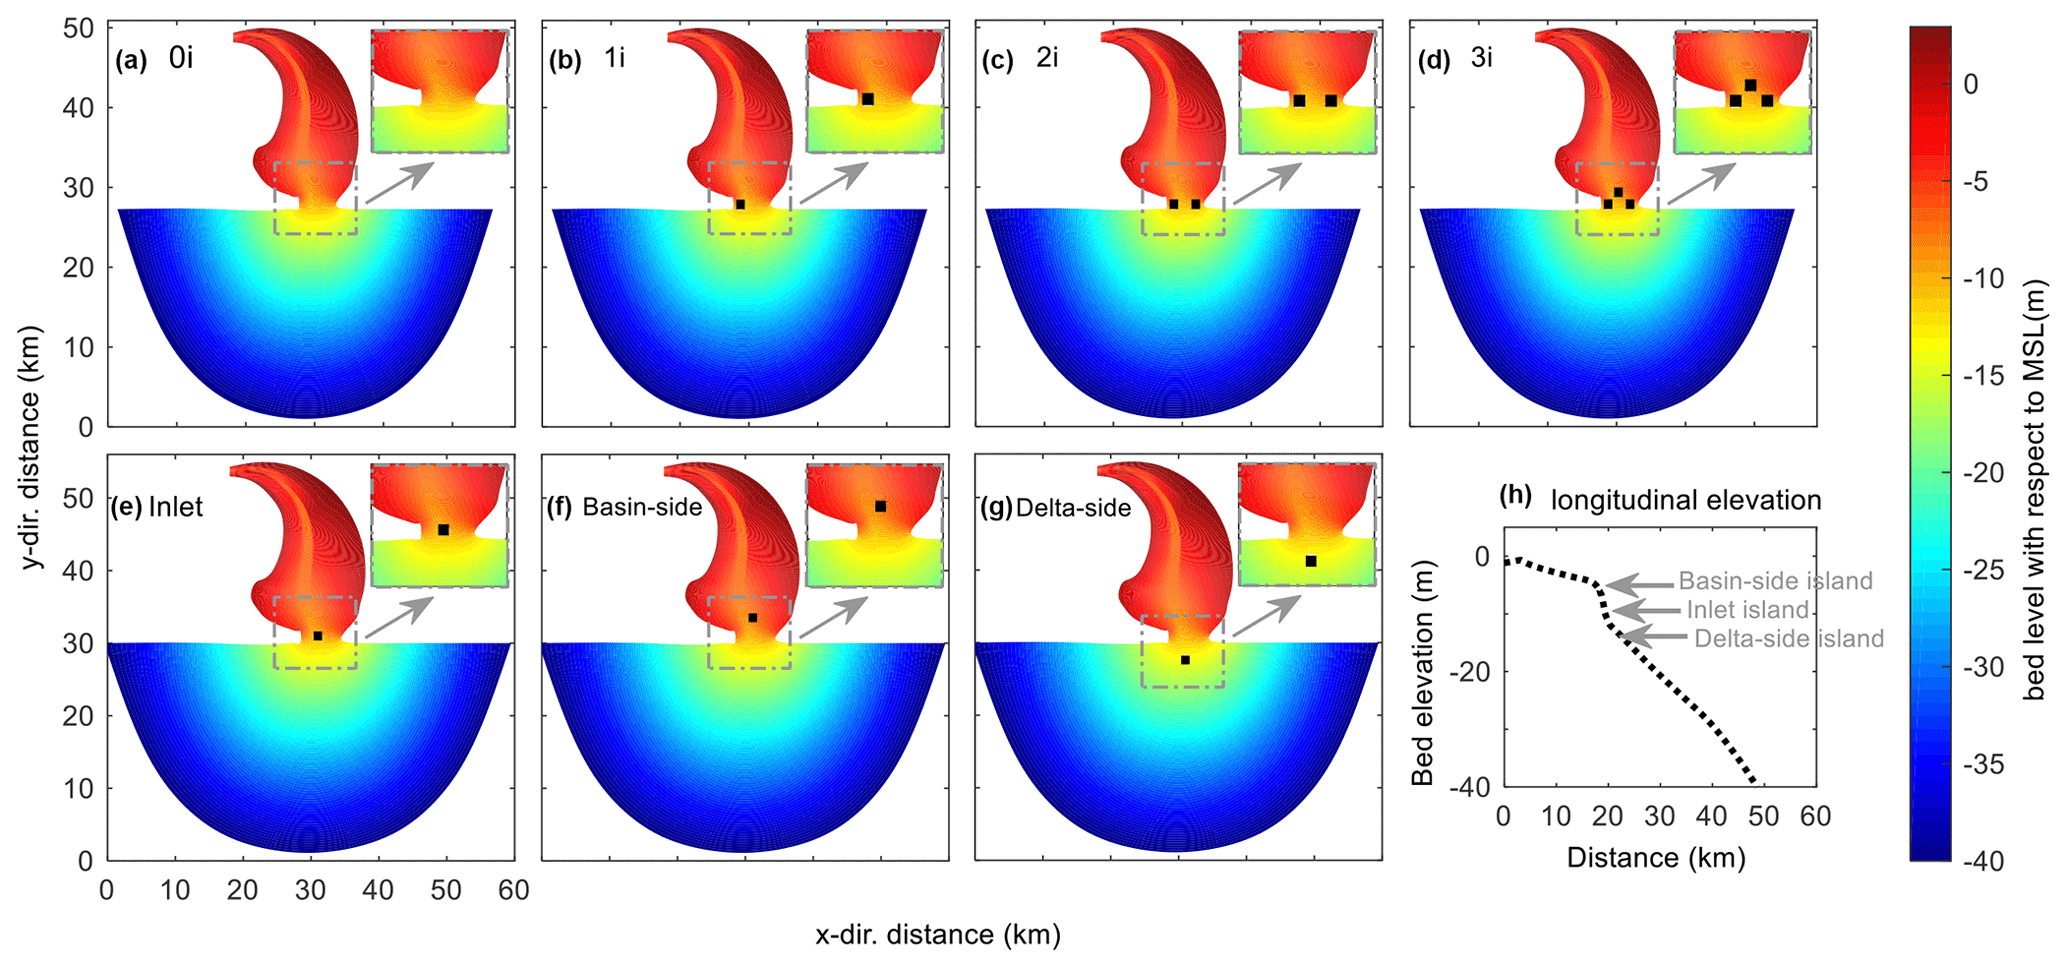
Figure 3Initial mode domain shape and bathymetry: (a) basin without an island (“0i”); (b) basin with one island (“1i”); (c) basin with two islands (“2i”); (d) basin with three islands (“3i”); (e) the mouth island is at the inlet (“IL”); (f) the mouth island is at the basin side near the inlet (“BS”); (g) the mouth island is at the delta side near the inlet (“DS”); (h) longitudinal profile of the initial bed elevation and the location of mouth islands. In panels (a)–(g), the solid black area in each plot represents the mouth islands, and we zoom in part of the model domain where there are different island settings. The arrows indicate locations of the mouth islands in the longitudinal profile.
3.1 Influence of the number of mouth islands
Morphological evolution firstly occurs in the mouth zone where tidal currents are strongest, as well as the river input zone due to fluvial input. The initial morphodynamic development is characterized by large bathymetric changes and rapid development of tidal channels (Fig. 5). In the subsequent morphological evolution, the tidal channels dissect the shallow basin through headward growth (D'Alpaos, 2005). This process of channel branching and elongation ultimately leads to the formation of a dendritic channel network and many scattered sand bars. Finally, the tidal basin gradually becomes stable in shape, and only minor bathymetric changes occur (Fig. 4).
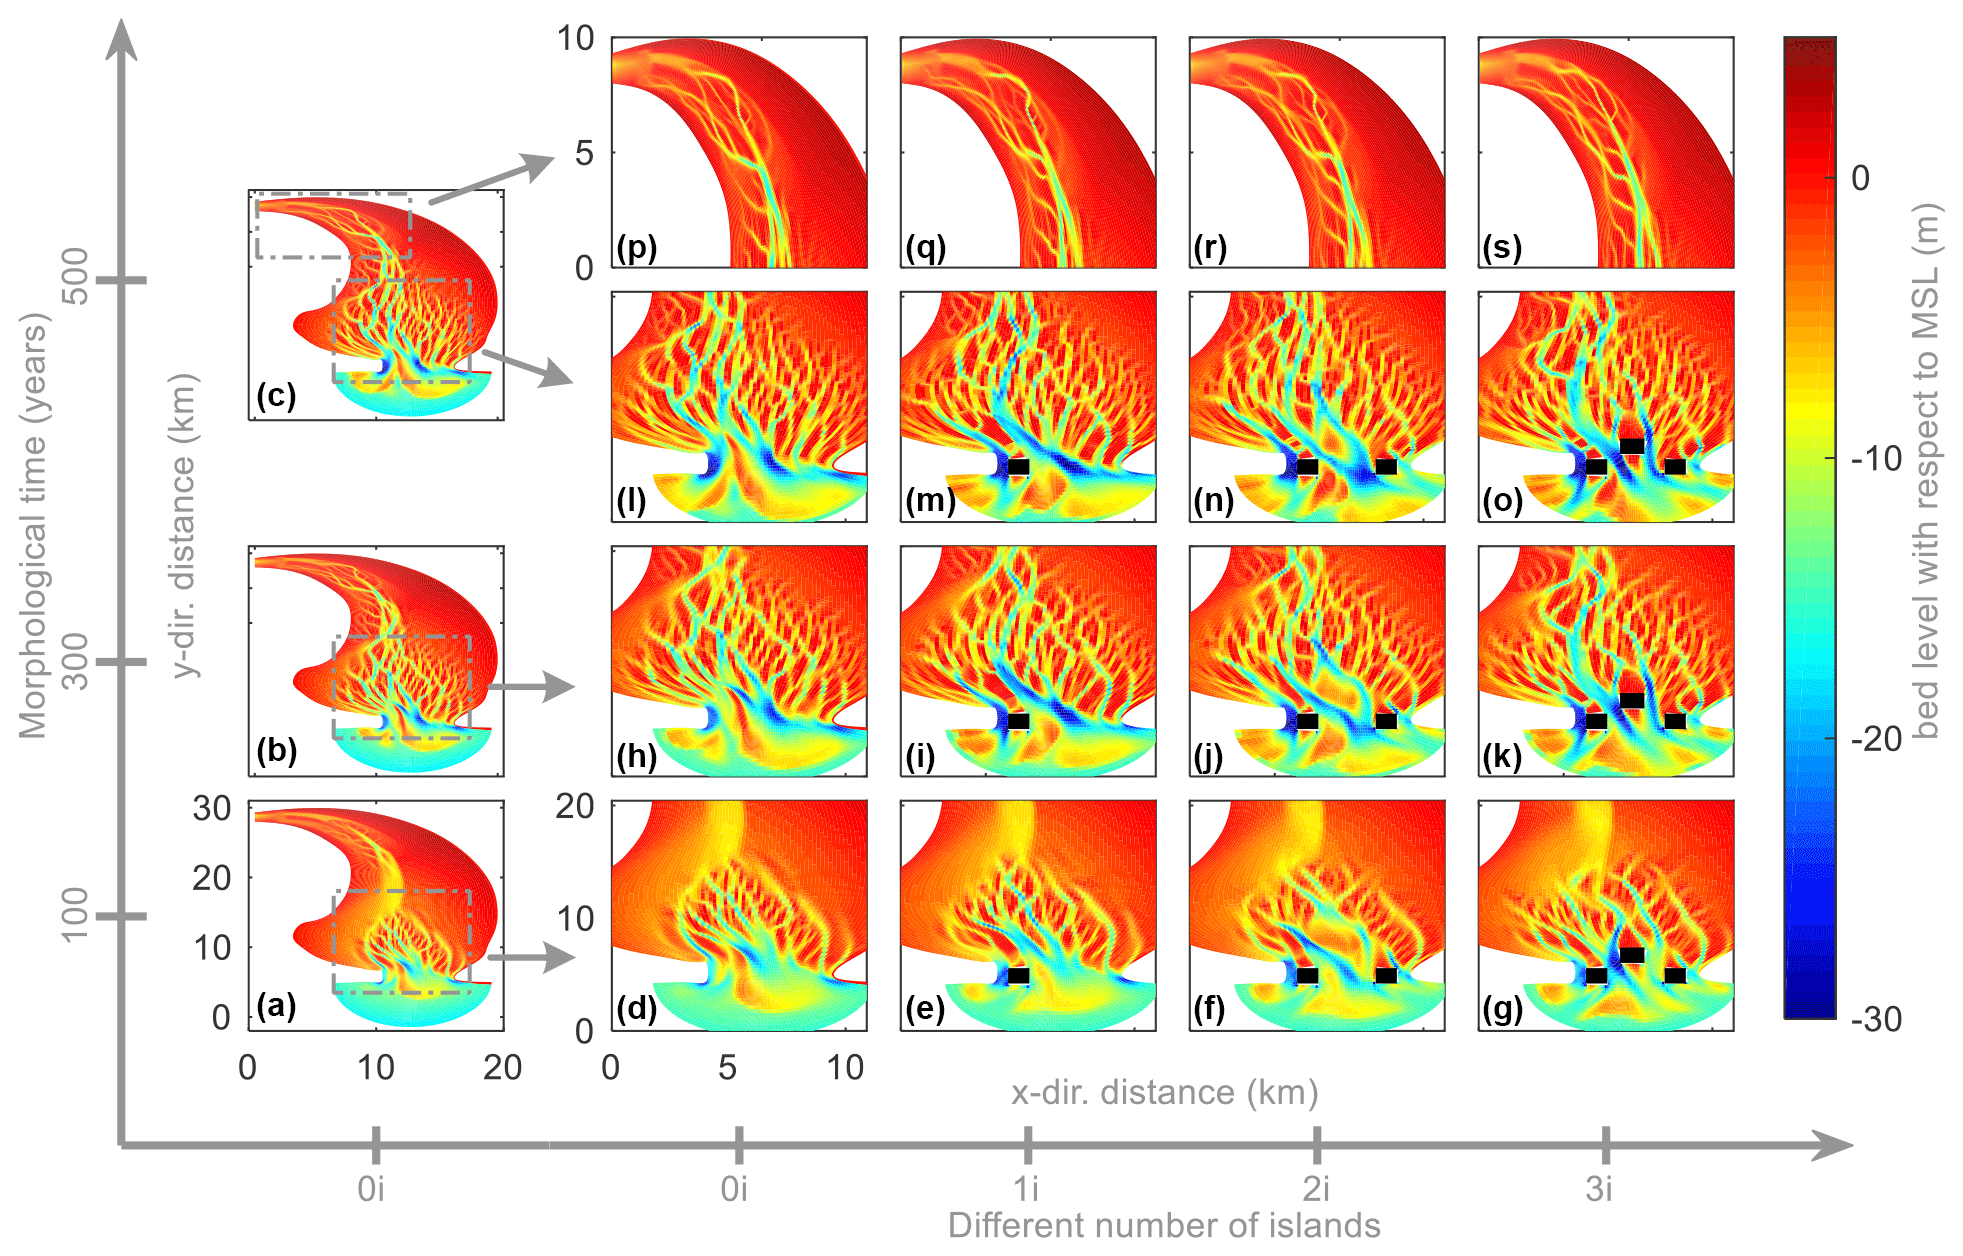
Figure 4Morphological evolution after 100 years (a, d–g), 300 years (b, h–k) and 500 years (c, l–s) of a basin without an island (“0i”), basin with one island (“1i”), basin with two islands (“2i”) and basin with three islands (“3i”), respectively. Here, we only plot part of the model domain, where the bed-level changes. The solid black rectangles in panels (m), (n), (o), (i), (j), (k), (e), (f) and (g) represent mouth islands.
The presence of different numbers of mouth islands causes local differences in morphodynamic patterns near the inlet. For the 0i case, extensive erosion rapidly occurs near the inlet mouth because of strong tidal currents therein, and a small-scale channel network is formed in the first 100 years (Fig. 4d). After 300 years of development, the tidal network has further developed. A large amount of sediment has been transported to the open sea, forming a complex channel network in the tidal basin (Fig. 4h). After 500 years, the horizontal channel's distribution has few morphological differences, and they become deeper, indicating that the basin has reached a stable state (Fig. 41). When a mouth island is added at the left side of the inlet, a large area of back-barrier deposition is observed behind the island, and the water depth at the sides of the island is relatively larger. In addition, the tidal network on the left side is developed into a higher intertidal area compared with the 0i scenario (Fig. 4e, i, m). The same happens if an island is added to the right side of the inlet. The addition of islands narrows the inlet, and the tidal current increases; as result, a larger spatial scale tidal network is observed in the first 100 years (Fig. 4f, j, n). By increasing the number of mouth islands, more erosion occurs in the tidal inlet mouth, indicating that the hydrodynamic conditions are even stronger (Fig. 4g, k, o). Meanwhile, in the upstream zone, minor differences are observed between cases 0i–3i, indicating that hydrodynamic effects on this area are relatively limited (Fig. 4p–s).
The presence of mouth islands leads to stronger tidal currents at the inlet mouth. The initial flow field near the inlet at flood tide and ebb tide is shown in Fig. 5. With one island, the inlet is divided into two narrow tidal inlets, forming a dual-channel system. The narrower cross section of the inlet also causes the increases of current velocity both at flood tide and ebb tide (Fig. 5), leading to more suspended sediment transport and forming deeper inlet channels. On the other hand, due to the sheltering of the non-erodible island, a large back-barrier deposition is observed behind the island, where the tidal current velocity is relatively small (Fig. 5). When another island is added at the right side of the inlet, the cross-sectional area of the inlet is further narrowed, making the current velocity further increase at the inlet (Fig. 5c, g). For the three-island case (“3i”), an even larger flow velocity is observed both at flood tide and ebb tide (Fig. 5d, h).
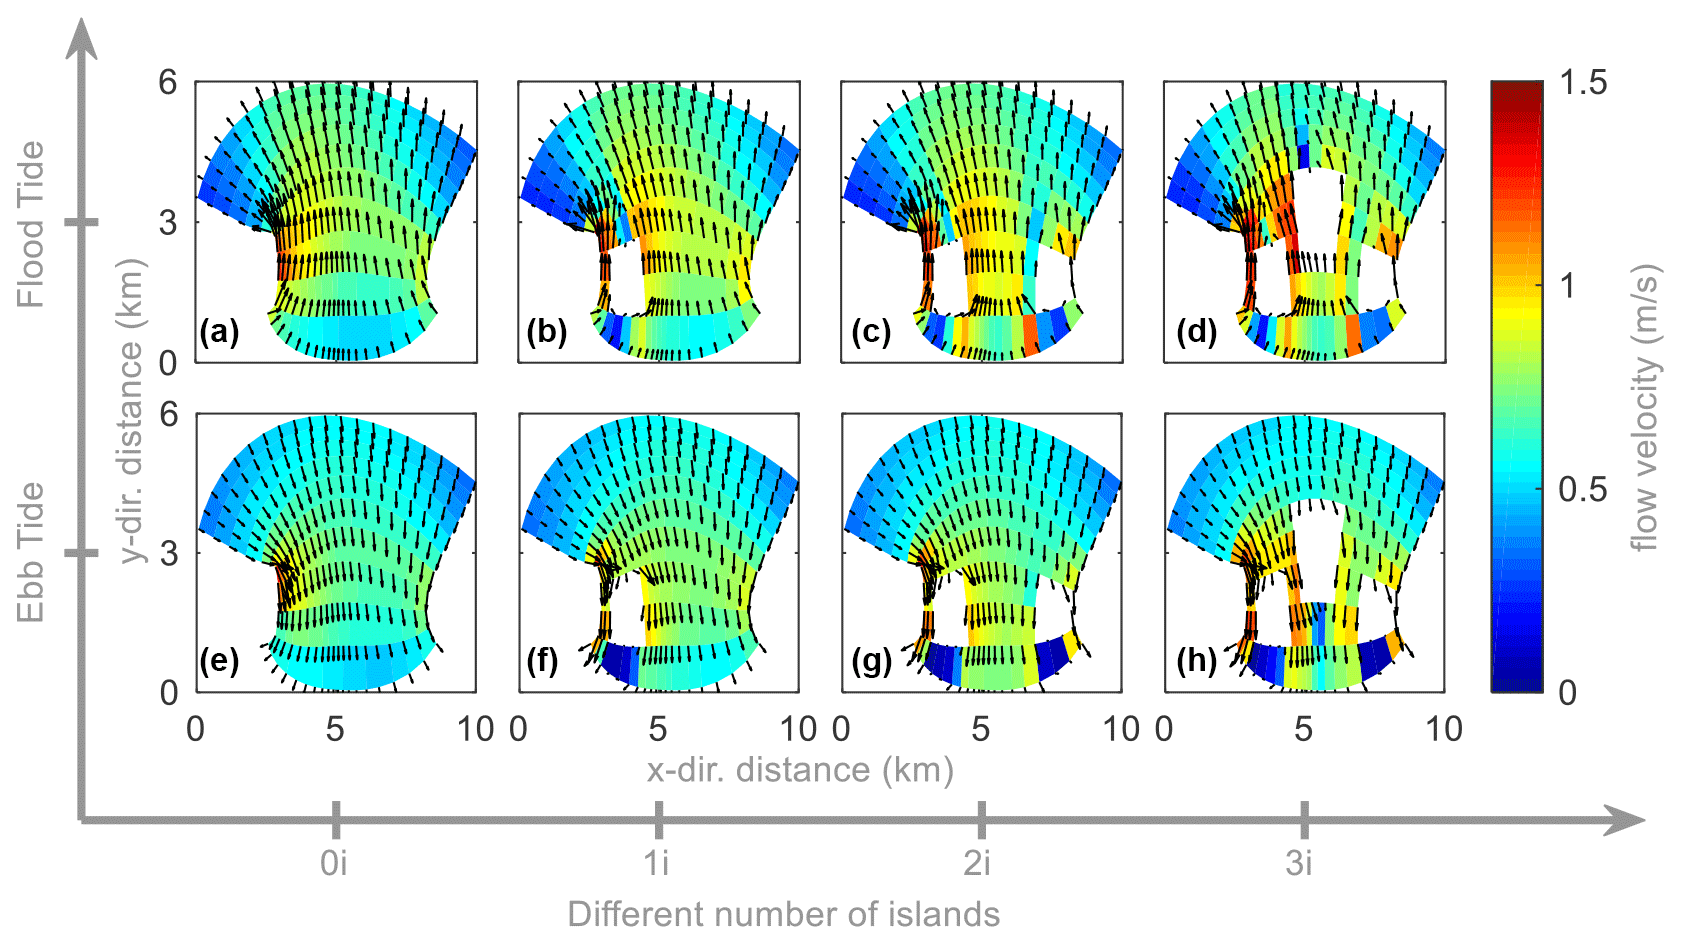
Figure 5Flow field near the inlet: panels (a–d) represent at the time of flood tide of a basin without an island (“0i”), basin with one island (“1i”), basin with two islands (“2i”) and basin with three islands (“3i”), and panels (e–h) represent at the time of ebb tide, respectively. Arrows for flow direction and colour for depth-averaged flow velocity (m/s).
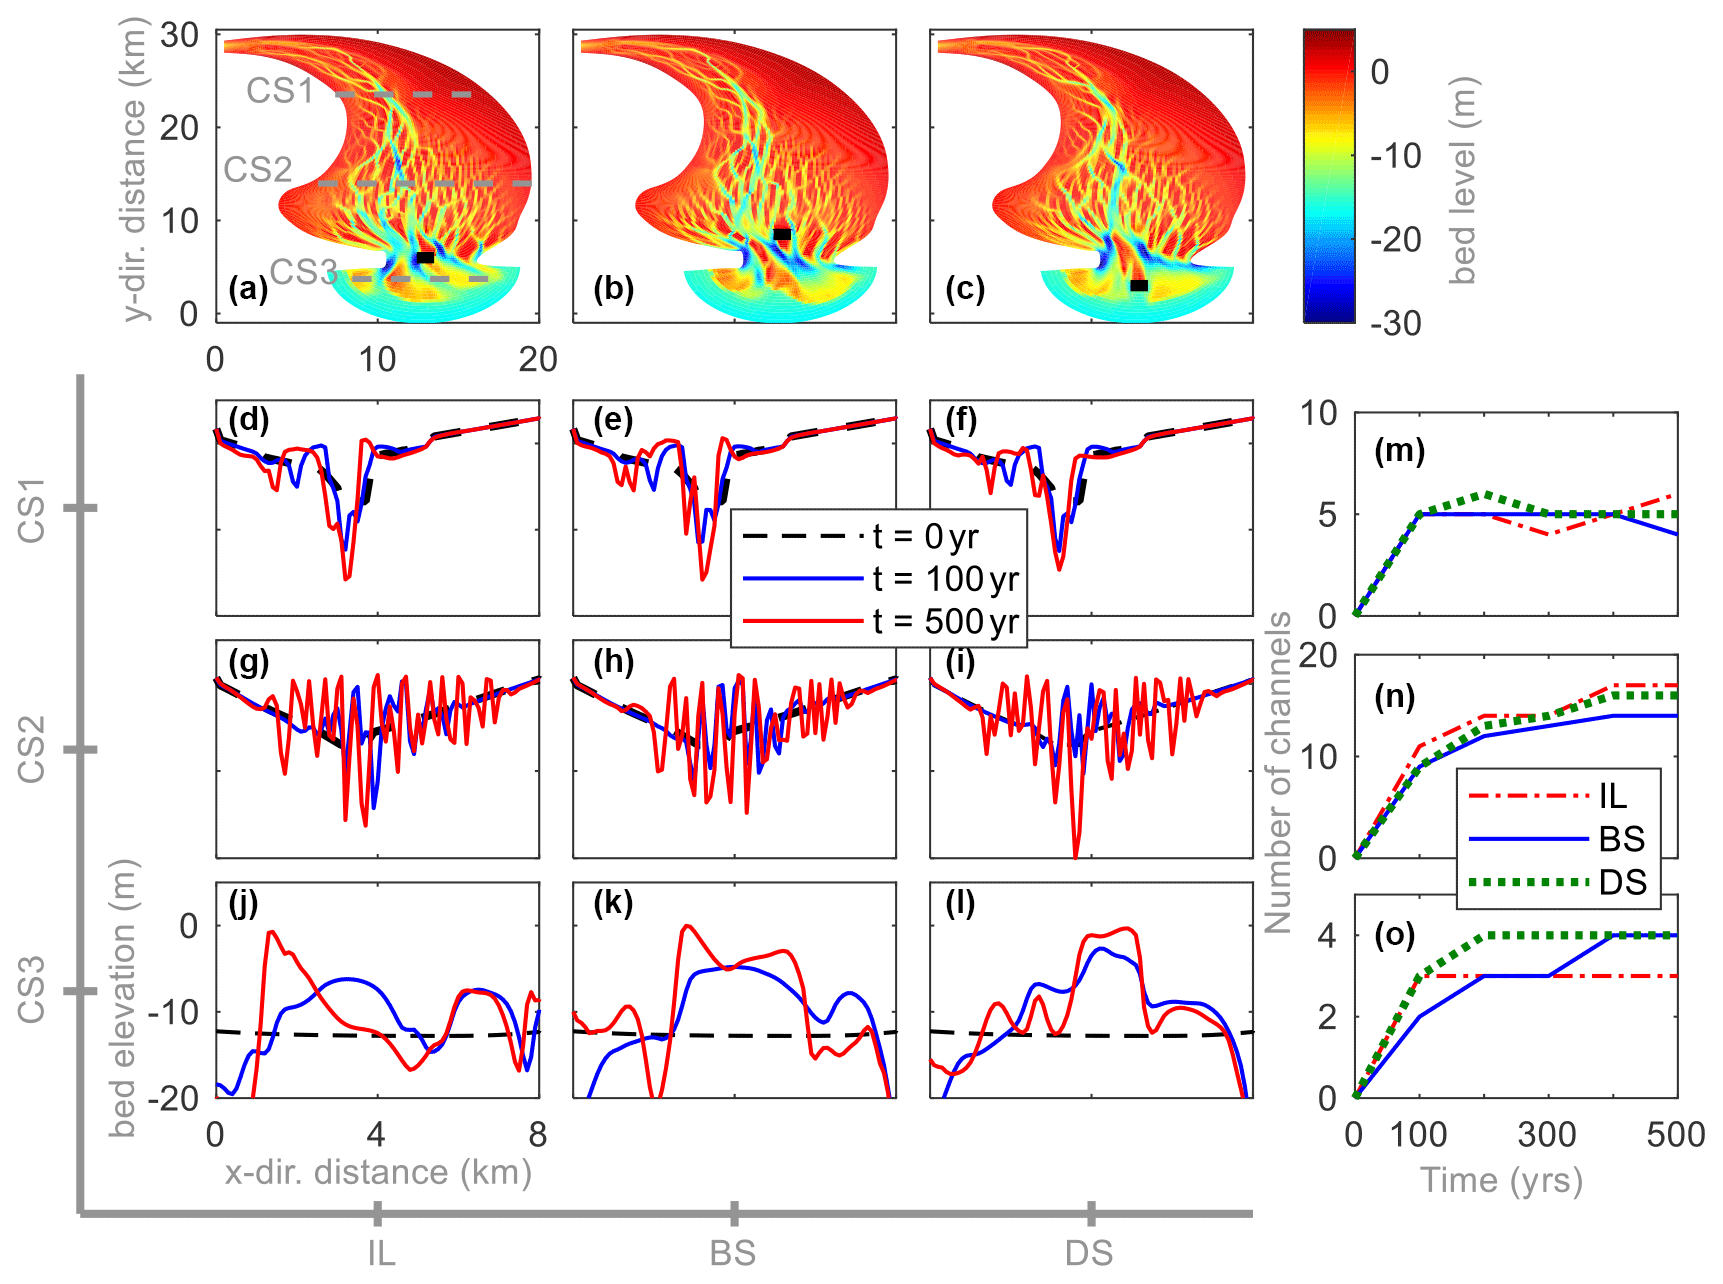
Figure 6Morphological evolution after 500 years (a–c) of a basin with a mouth island at the inlet (“IL”), at the basin side (“BS”) and the delta side (“DS”), respectively. Panels (d)–(l) represent the temporal cross-sectional bed elevation of different cases: (d)–(f) cross section 1; (g)–(i) cross section 2 and (j)–(l) cross section 3. Panels (m)–(o) represent the number of channels of different cross sections, respectively. In some subplots, the black rectangular area represents the mouth island and the dotted grey lines represent the cross-section position.
3.2 Influence of the location of mouth islands
The morphological evolution of cases with different mouth island locations is shown in Fig. 6. Tidal channel networks quickly develop in the first 100 years and gradually become stable after 300 years. However, tidal basins with different mouth island locations show quite different morphological patterns near the inlet but a similar pattern in the upstream estuary zone. Initially, an idealized bed elevation is defined as shown by the dotted black line in Fig. 6d–l. Three cross sections are selected along the estuary to show the detailed morphological differences between different cases. Cross section 1 (CS1) is far away from the tidal inlet and the river discharge is relatively small; thus, the effect of hydrodynamics on morphologies at this cross section is limited. Hence, all cases show small bed-level changes and develop a similar cross-sectional bed elevation after 500 years (Fig. 6d–f, m). While near the tidal inlet (CS2), the tidal channels develop quickly in the first 100 years showed by large bed-level changes. As the morphological evolution continues, the channels gradually develop into the upper intertidal area and form a complex channel network. For the inlet island scenarios (“IL”), it develops a larger number of tidal channels compared with the other two cases (Fig. 6g, n), indicating that this type of mouth island can lead to tidal currents dispersing into the basin. For the basin-side island case (“BS”), a better-developed channel network is found on the left side of the tidal basin and the tidal channels are gradually merged, showing a wider but smaller number of channels (Fig. 6h, n). The tidal channels in the delta-side island scenarios (“DS”) are relatively shallow but there is a main channel developed in the middle of the basin (Fig. 6i). That is because the presence of this type of mouth island leads to stronger currents beside the island but weaker currents behind the island, thus leading to the convergence of tidal currents entering the basin creating larger erosion in the middle of the tidal basin. In terms of ebb-delta area (CS3), the morphology is also significantly influenced by the longitudinal placement of the island. The inlet island scenario (“IL”) develops several tidal channels in the ebb-delta area due to the diversion created by the inlet island (Fig. 6a). In the BS and DS cases, the ebb-delta area has a similar morphology, with extensive deposition developing in the middle of the ebb delta. However, larger sedimentation occurs in the BS case, suggesting that it produces more significant sediment transport (Fig. 6k, l).
3.3 Patterns of residual currents and residual sediment transport
The above morphological evolution characterized by shoals and channels is highly linked to the variation in residual tidal current and sediment transport patterns. This section compares residual currents in the beginning and after 300 years to illustrate the mechanisms of this type of basin evolution (Fig. 7). The residual currents are calculated by averaging the flow field over a tidal cycle, which produces residual sediment transport, leading to the morphological evolution of the basin (Leonardi et al., 2013).
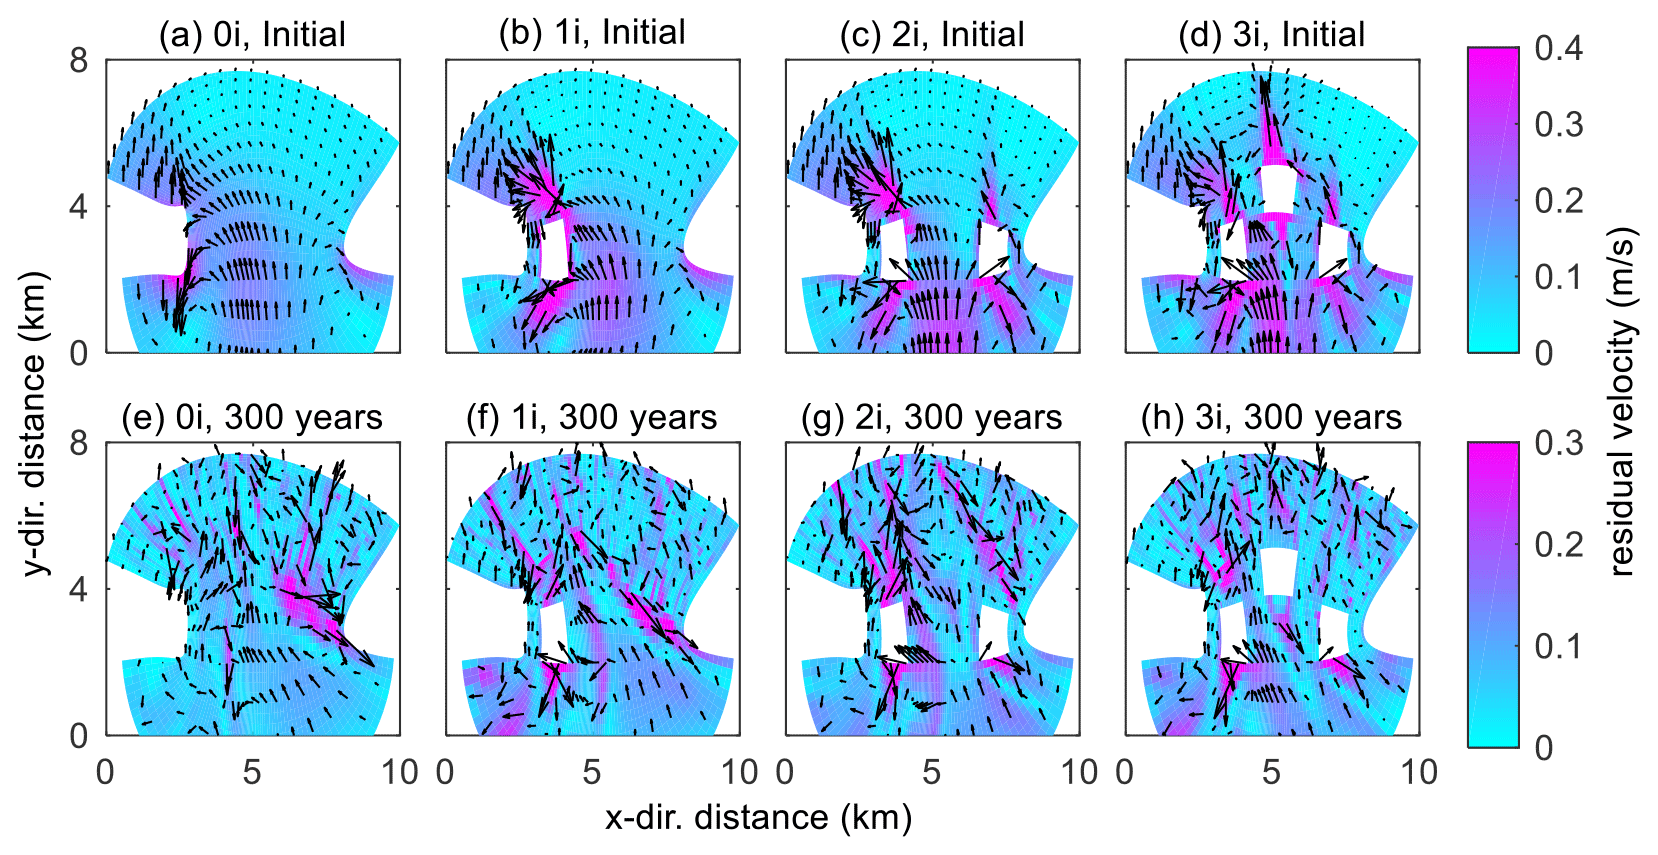
Figure 7Spatial distribution of the residual current (arrow vectors indicate the direction) near the tidal inlet of four different scenarios: panels (a)–(d) represent scenarios without an island (“0i”), one island (“1i”), two islands (“2i”) and three islands (“3i”) at the beginning, respectively; (e)–(h) after 300 years. The white area in the plot represents the mouth islands, and the background colour represents the magnitude of residual velocity.
The presence of mouth islands leads to a higher residual current. Initially, the residual currents near the inlet are mostly landward, and circulating residual currents are found outside the basin (Fig. 7a). When a mouth island is added, some of the tidal residual currents are directly reflected into the sea, while others enter the inner basin through the narrowed inlets with a stronger current velocity (Fig. 7b). If another island is added at the right side of the inlet, the spatial distribution of residual currents is approximately symmetric, and two circulating residual currents are formed behind the island (Fig. 7c). As the inlet becomes much narrower, the landward residual currents become much stronger. For the three-island case (“3i”), the residual currents are larger than the other cases, leading to stronger residual sediment transport in the basin. In the beginning, the residual currents are relatively large with the tidal basin being morphodynamically active, so tidal flats and channels develop rapidly in the first decades. After 300 years, the residual currents decrease and the basin morphology tends to be stable (Fig. 4). The formation of tidal channels and sand bars significantly impacts the spatial distribution of residual currents (Fig. 7e–h). The residual currents decrease to the magnitude of approximately 0.3 m/s after 300 years, indicating that hydrodynamics gradually adapt to basin morphology and a relative equilibrium state.
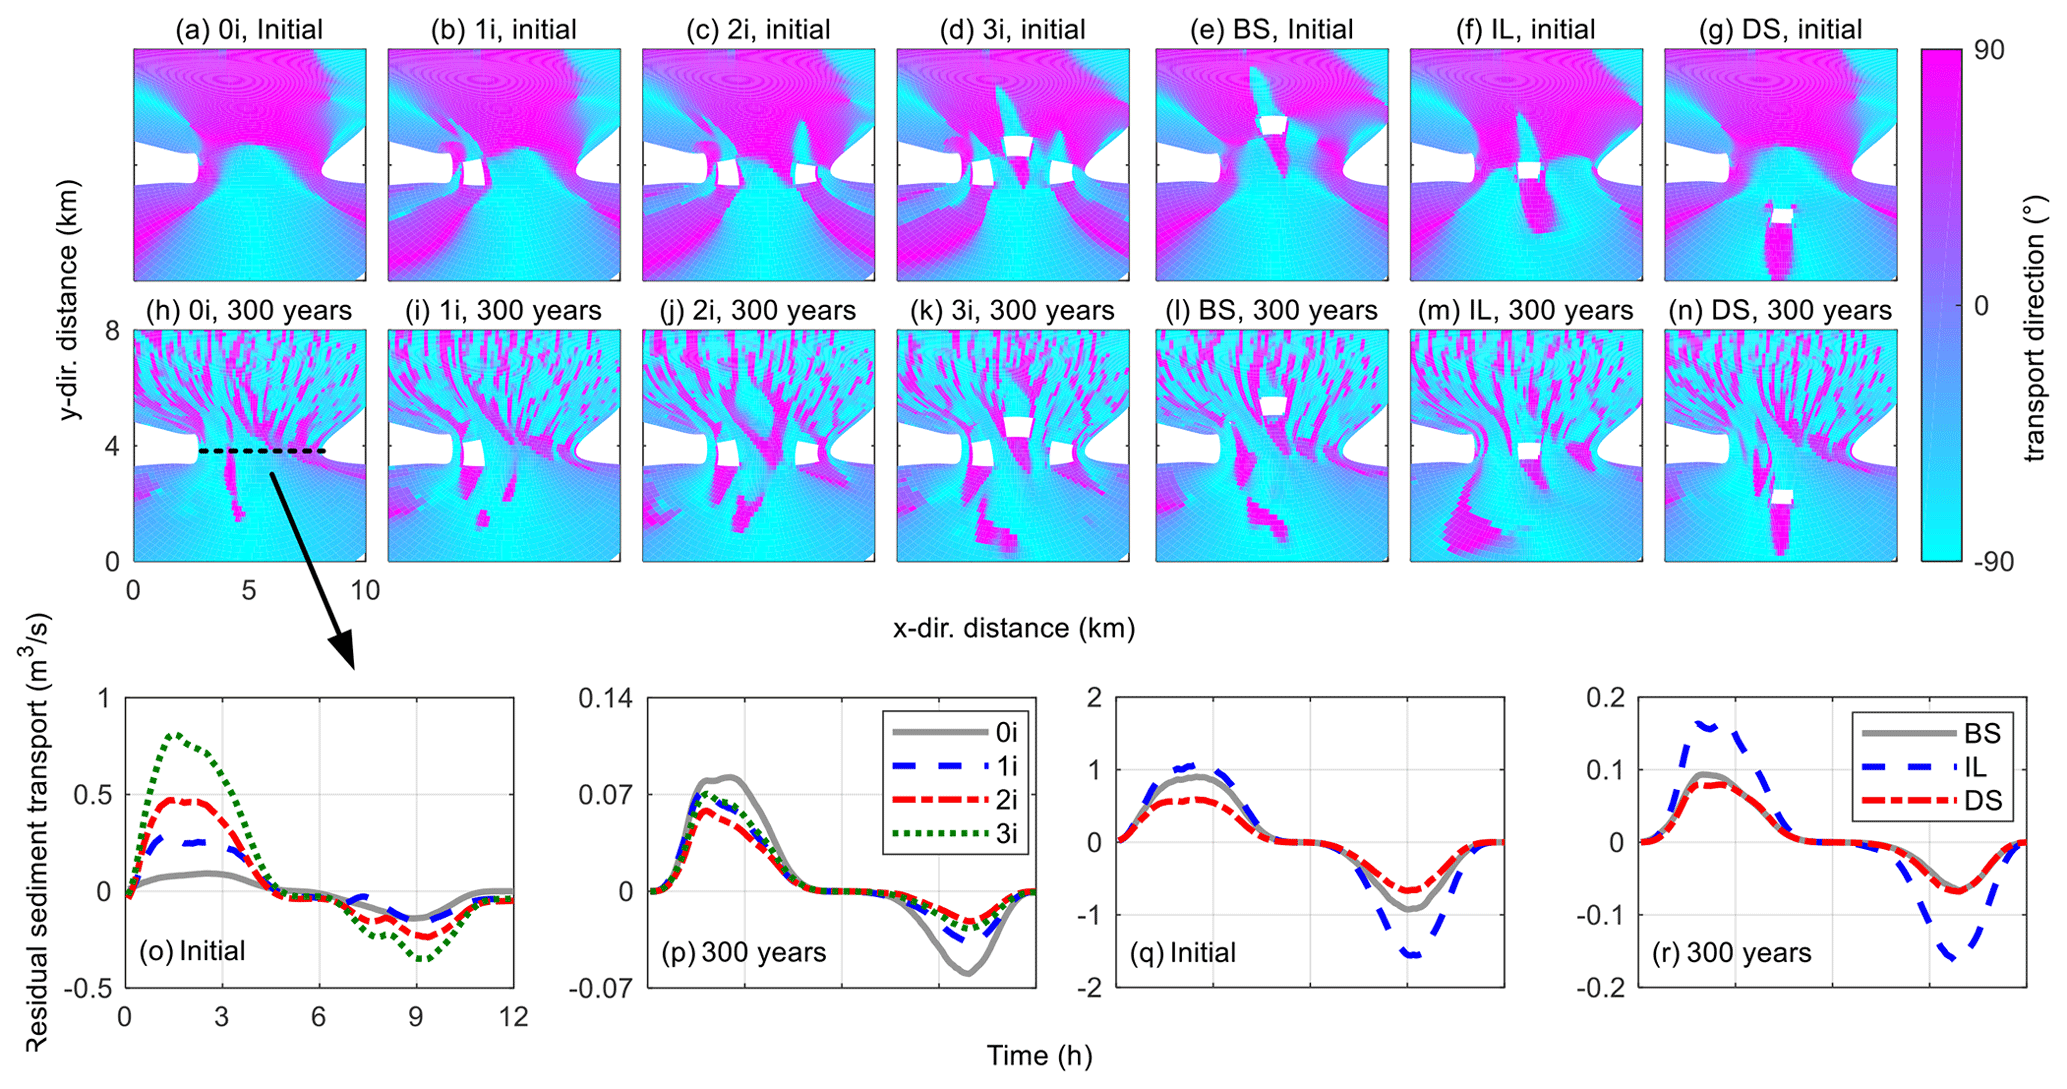
Figure 8Residual sediment transport near the tidal inlet for different numbers of mouth islands (a–d, h–k) and different locations (e–g, l–n) at the beginning and after 300 years, respectively. The white area in the plot represents the mouth islands, and the background colour represents the direction of residual sediment transport (90∘ indicates landward transport while −90∘ indicates seaward transport). Tidal residual sediment transport via a cross section of different scenarios at 0 (o, q) and 300 years (p, r), respectively. In panels (o)–(r), a positive value indicates seaward transport, while a negative value indicates landward transport.
The presence of mouth islands enhances seaward residual sediment transport. The temporal evolution of the residual sediment pattern near the tidal inlet is shown in Fig. 8. The cross section is placed on the delta side near the tidal inlet and ensures that the initial cross-sectional area is the same for all cases (Fig. 8h). At the beginning of morphological evolution, residual currents are landward (Fig. 7a–d), but a seaward net sediment transport is observed in the middle of the tidal inlet, forming a two-way transport (Fig. 8a). When a mouth island is added, seaward residual sediment transport is observed behind the mouth island (Fig. 8b). Further increase in the number of mouth islands increases the magnitude of seaward residual sediment transport (Fig. 8b–d), and the maximum magnitude in the 3i case reaches about 0.8 m3/s (Fig. 8o). The residual sediment transport patterns control the morphological evolution of tidal basins and estuaries, and the magnitude of residual sediment transport determines the rate of morphological changes (Guo et al., 2015). As shown in Fig. 8o, the 3i case has a relatively higher residual sediment transport; thus, the tidal system may develop and evolve more rapidly than the scenarios with fewer mouth islands. In the cases with different island locations, when the mouth island is moved further into the basin, the seaward residual sediment transport is larger (Fig. 8e–g). Model results indicate that the basin-side island results in a more extensive residual sediment transport than the delta-side island (Fig. 8q–r). After 300 years, the residual sediment transport pattern is highly affected by the developing channels and shoals and the sediment transport has decreased significantly, only 0.1–0.2 m3/s (Fig. 8p, r). As the morphological evolution continues, the residual sediment transport further decreases, and the final stage for sediment transport is similar for all cases. (Fig. 8h–k), indicating that the evolving basin morphologies adapt to the tidal hydrodynamics towards a morphodynamic equilibrium. However, the residual sediment transport gradually decreases over time, it is never close to zero over the whole tidal cycle, and a dynamic equilibrium state is reached (Zhou et al., 2017).
3.4 Hypsometry curves and “P–A” relation
One useful metric that links the morphology to the hydrodynamics of tidal basins is hypsometry, which can provide information on the percentage of shoal area and channel area (Townend, 2008; Vivoni et al., 2008). Figure 9 shows the hypsometry of the inner basin for different scenarios after 100 and 500 years, and the intertidal zone and subtidal zone is divided according to the tidal amplitude (1.2 m). The initial profile decreases linearly towards the sea; thus, the hypsometry appears to be linear (dotted grey line in Fig. 9a). In the first 100 years, all cases show a rapid development of channels and tidal flats, indicating vertical redistribution of sediments. Case 3i shows a more pronounced development after increasing the number of mouth islands (solid green line in Fig. 9a). After 500 years, hypsometric curves become noticeably convex, which indicates that shallower tidal flats and accreted shoals are developed in the basins (dotted lines in Fig. 9a). For the cases of different island locations, the area of tidal flats grows slightly slower under the delta-side scenario and slightly faster under the basin-side scenario (solid line in Fig. 9b). After 500 years, the magnitudes of shoals and flats developed under all cases are similar (dotted lines in Fig. 9b).
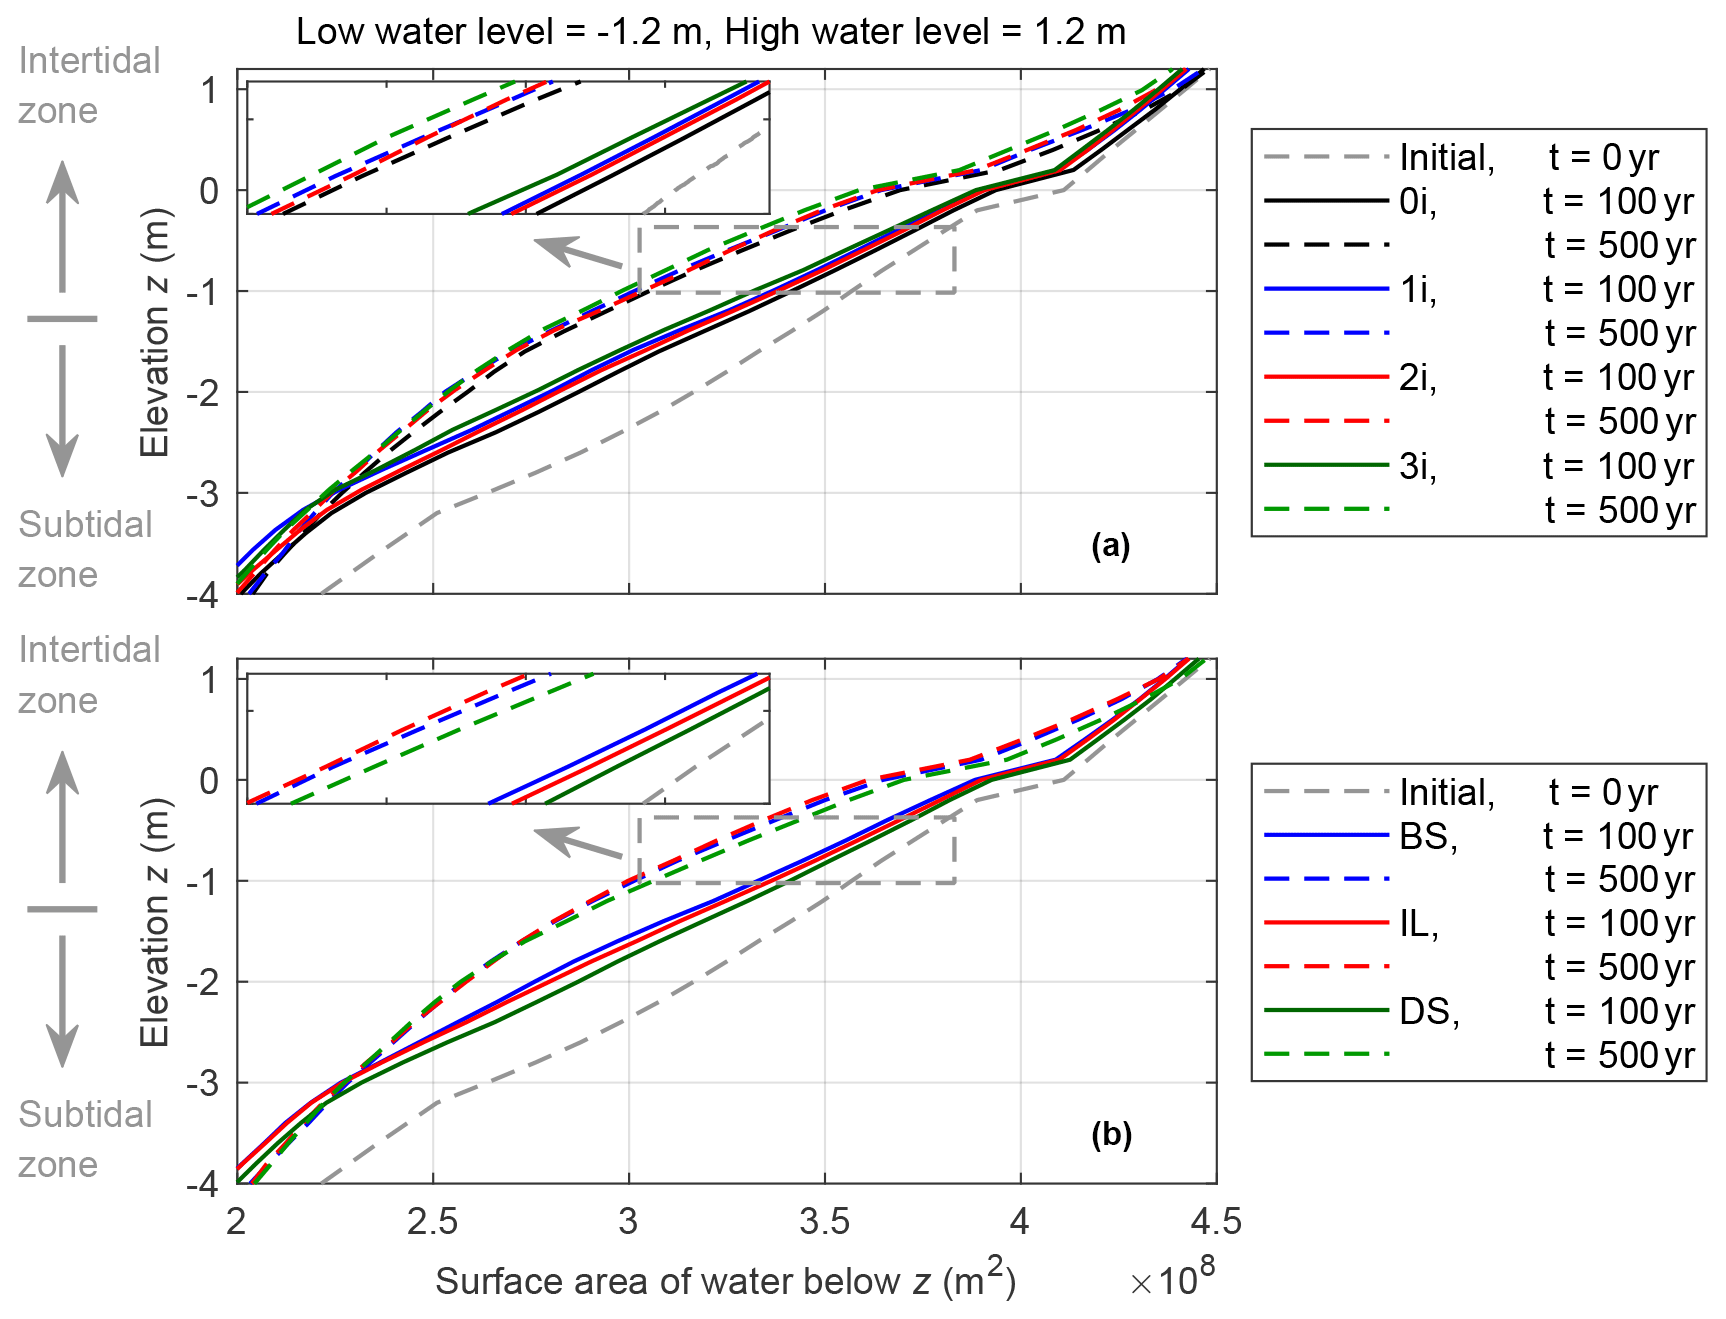
Figure 9Hypsometry of the tidal basin for the simulations of different scenarios: (a) the scenarios of the different mouth island numbers; (b) the scenarios of different mouth island locations after 100 and 500 years, respectively. The tidal amplitude in all cases is 1.2 m.
Another useful analysis connecting the geomorphic characteristics and hydrodynamic forces is the relationship between the cross-sectional area and the tidal prism (P–A relation) (O'Brien, 1931; Jarrett, 1976; Friedrichs, 1995; Townend, 2005). The P–A relation is as follows:
where A is the cross-sectional area (m2), P is tidal prism (m3), K and n are fitted coefficients. The evolution of the P–A relation is related to several factors, such as the hydrodynamic forces, sediment transport and geological landform. In recent decades, many numerical studies explored the P–A relation of estuaries (Lanzoni and Seminara, 2002; van der Wegen et al., 2010) and tidal inlets (Powell et al., 2006; D'Alpaos et al., 2010). However, few studies consider the effect of mouth islands on the morphology of basins, and our knowledge of the P–A relation of mouth basins is limited. Since islands are common landforms in the mouth of tidal basins, it is of great significance to explore their influence on the P–A relation. In this study, a widely used method is adopted to calculate the tidal prism, following the work of Savenije (2012) and Zhou et al. (2014a). Specifically, the tidal prism is calculated by the flow flux volume through a defined cross section during the flood and ebb. This study uses the minimum width cross section, as shown by the dotted black line in Fig. 8h.
where n is the number of grids in the cross section, v is the velocity component along the inlet, h is the water depth, Δy is the grid size of the cross section, and Δt is the hydrodynamic time step. Figure 10 shows the variation of the tidal prisms and the inlet cross-sectional area for different mouth island scenarios. For the scenarios of different mouth island numbers, the existence of islands reduces the cross-sectional area of the inlet and increases the tidal current velocity, so the initial tidal prism in cases 1i, 2i and 3i is larger than that in case 0i (Fig. 10a). In the first 100 years, the tidal prism and cross-sectional area increase rapidly because the tidal basin is not in the equilibrium state. This stage is characterized by the development of tidal flats and channels. Regarding the scenarios with the different mouth island numbers, the 3i case develops the largest tidal prism (Fig. 10a). However, after 100 years, the tidal prism decreases gradually, while the cross-sectional area tends to stabilize (Fig. 10b). This is because the developed shoals directly reduce the water accommodation space, leading to a decrease in the tidal prism. For the scenarios of different mouth island locations, model results also show a sharp increase in the tidal prism and the cross-sectional area in the first 100 years (Fig. 10c–d). The cases with a basin-side mouth island have a relatively larger tidal prism and cross-sectional area than cases IL and DS. Although they have the same inlet cross-sectional area, the basin-side island can further increase the current velocity entering the tidal basin. Similarly, there is a decrease in tidal prism in all cases after 100 years, but the cross-sectional area is still evolving, which is characterized by the deepening of water depth. After 300 years, the tidal basin tends to be stable, as shown by an increasingly stable tidal prism (Fig. 10c).
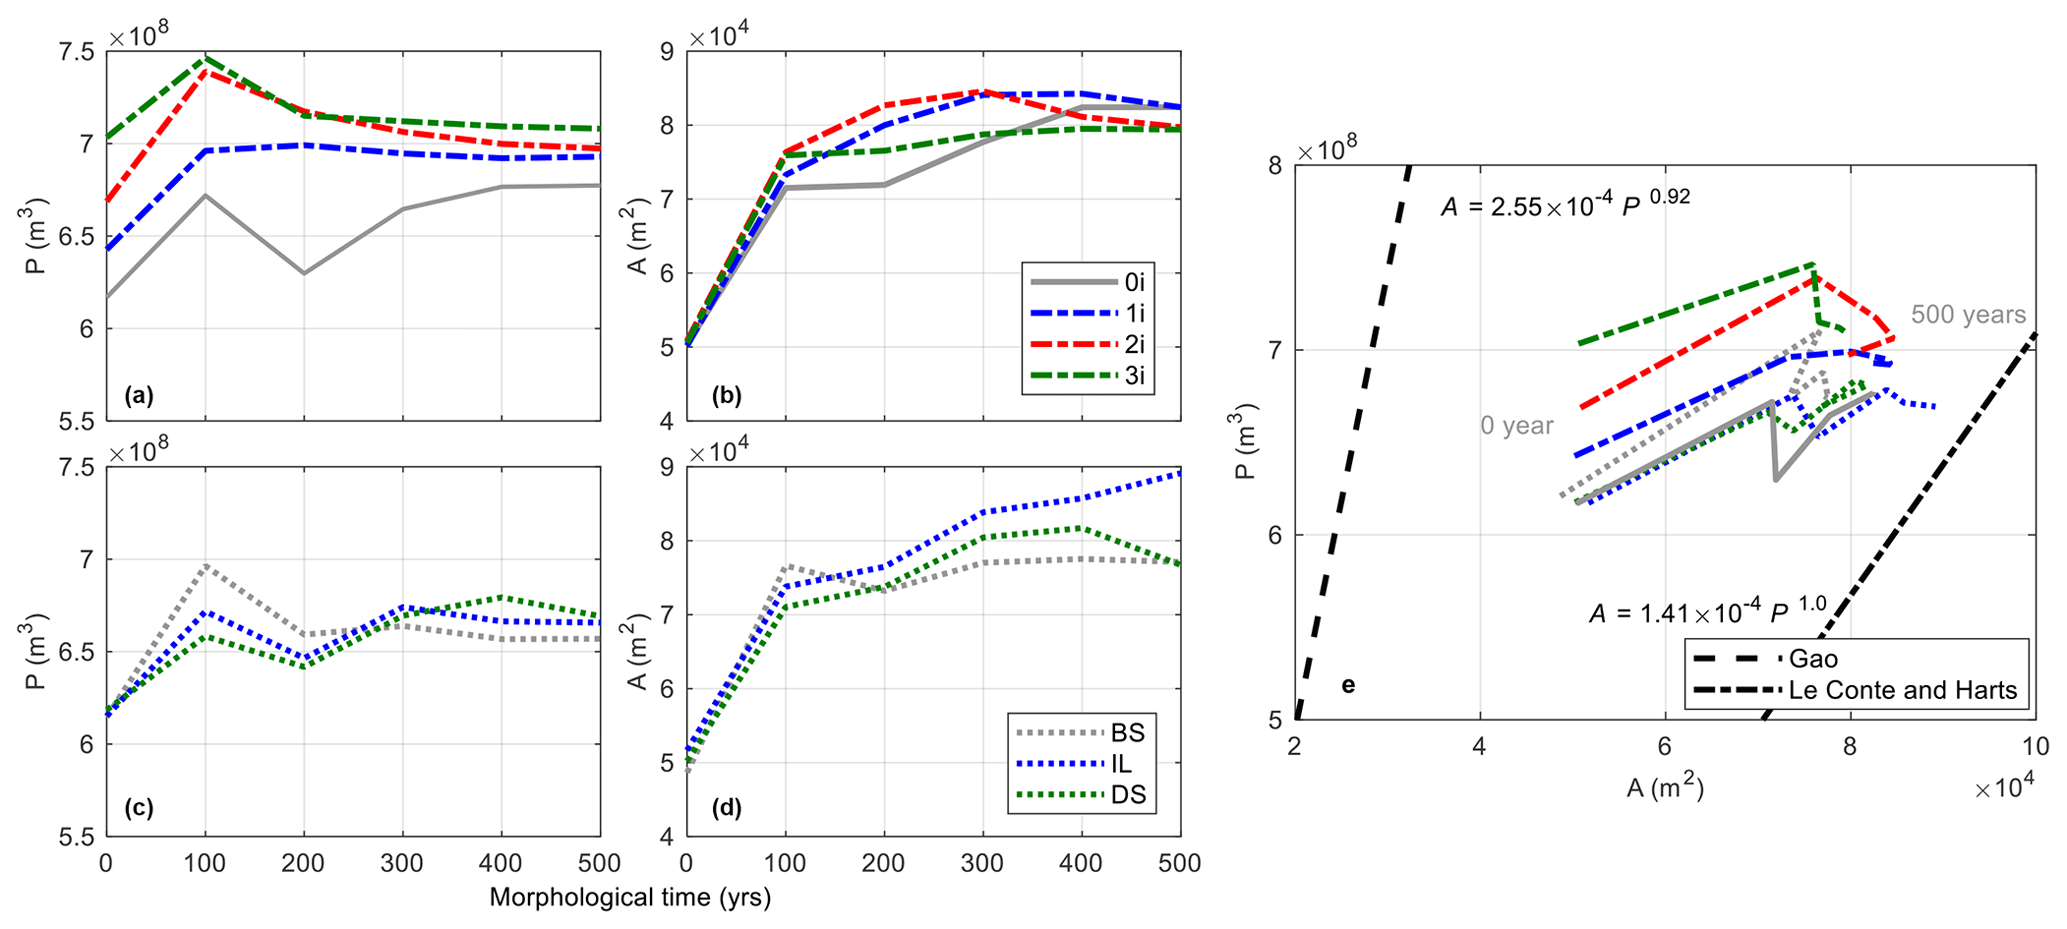
Figure 10The evolution of tidal prism, inlet cross-sectional area and P–A relation for the different mouth island scenarios over 500 years. Panels (a, b) show the scenarios of different mouth island numbers: (c, d) show the scenarios of different mouth island locations.
The cases with different mouth island scenarios gradually evolved to stable morphologies (Fig. 4), characterized by the decrease of residual current and sediment transport flux (Fig. 8). Similarly, in the scenarios in Fig. 10a–d, the tidal prism and inlet cross-sectional area tend to equilibrium. Model results show that the number and location of mouth islands affect the P–A relationship. For example, if the number of mouth islands increases, the tidal prism increments gradually, but the cross-sectional area evolves quite differently. Figure 10e shows the simulated trajectories of P–A points at different times and is compared with existing empirical P–A relationships (e.g. Le Conte and Harts, 1905 and Gao, 1988). These scattered P–A points of different mouth island basins tend to evolve towards an equilibrium state and the tidal basins with mouth islands may take a shorter time to reach equilibrium. Model results suggest that the tidal basins with mouth islands appear to develop a larger tidal prism and cross-sectional area. As indicated by previous studies, the P–A relationship is highly affected by many factors, including site-specific and scale-dependent factors (D'Alpaos et al., 2010), hydrodynamic and sediment properties (Townend, 2005), river discharge and initial basin bathymetry (van Maanen et al., 2013a; Zhou et al., 2014a). This study suggests that the number and location of mouth islands as geological constraints near the tidal inlet can also play an important role in the evolutionary trends of basin morphology, affecting the P–A relationship.
3.5 Distances affected by mouth islands
In this section, the 0i case is used as a reference to quantify the impact of mouth islands at different locations and explore the size of the area affected by the islands. Figure 11 shows the cross-sectionally averaged flow velocity and sediment transport variations compared to the 0i case in the longitudinal direction.
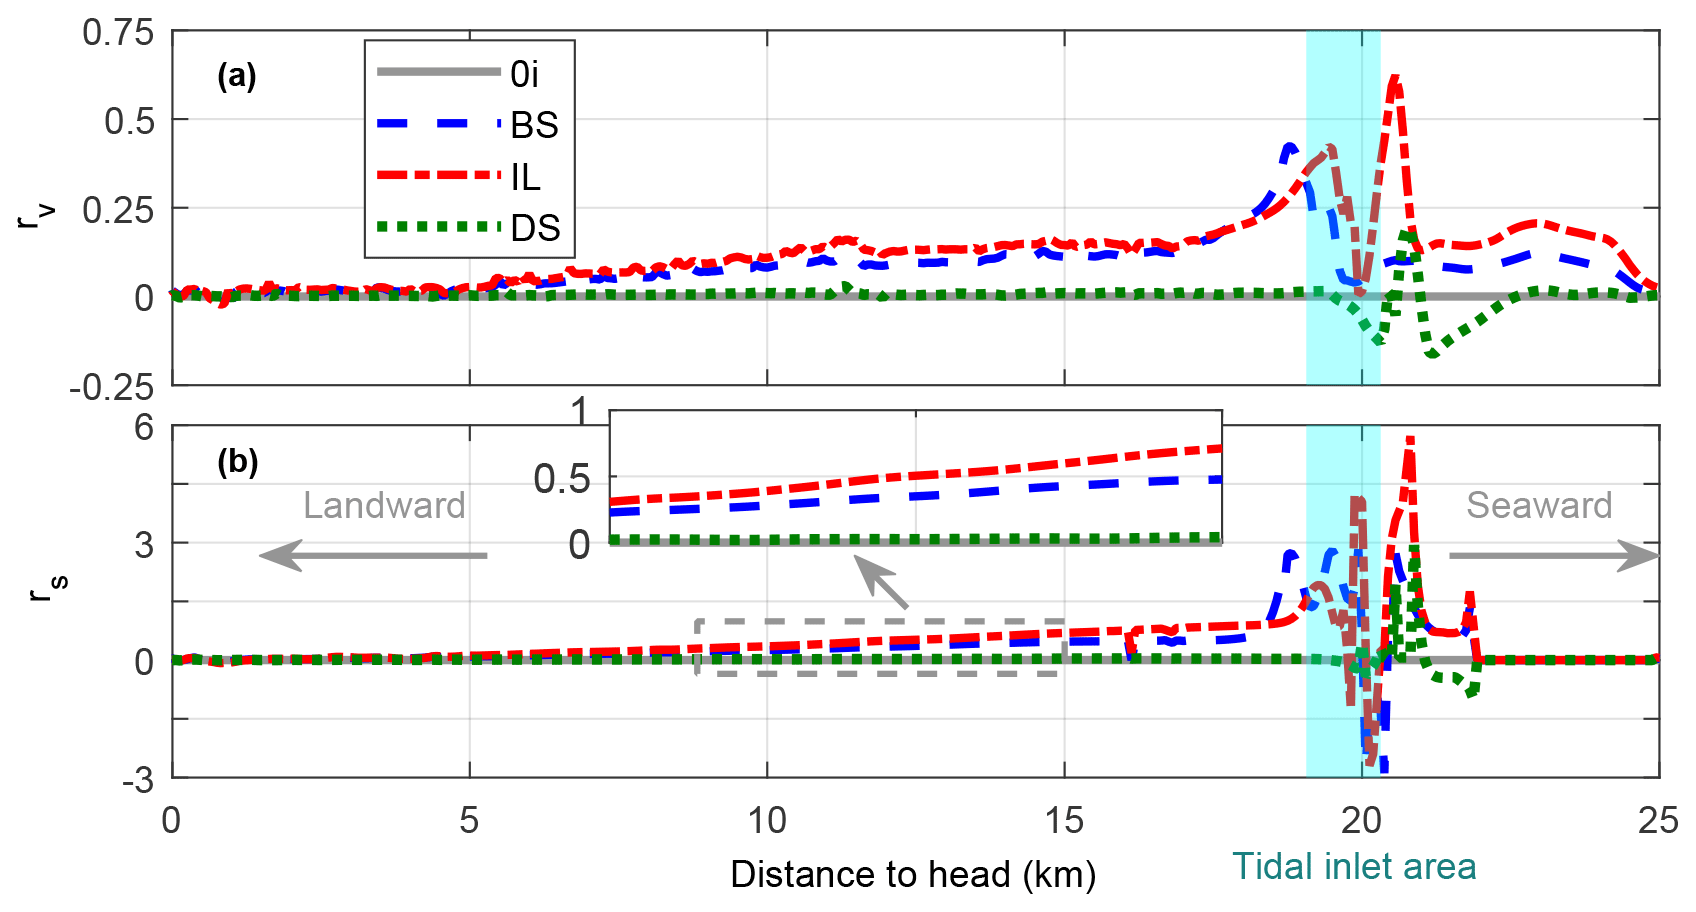
Figure 11Longitudinal variations of cross-sectionally averaged flow velocity (a) and sediment transport (b) compared to the 0i case at the high tide of the first year.
The mouth island greatly influences the hydrodynamic and sediment transport in local areas (e.g. tidal inlet), but the variations in the whole tidal basin are relatively small. In terms of flow velocity, the variations are calculated between other cases and the 0i case.
where v is the velocity in other cases (m/s), v0i is the velocity of the reference case. As shown in Fig. 11a, the variations mainly concentrate near the tidal inlet and gradually decrease in the landward and seaward directions. When the mouth island location is at the delta side, velocity in front and back of the island decreases while it increases on the sides. The velocity in other areas is almost the same as the reference case (dotted green line in Fig. 11a), indicating that this type of island has little impact on the flow velocity inside the basin. If the mouth island is located at the tidal inlet, a greater increase of 70 % is observed near the tidal inlet, but the velocity decreases drastically inside the basin. At 5 km from the tidal inlet (landwards), it is reduced by 30 % (dotted red line in Fig. 11a). When the mouth island is located at the basin-side of the inlet, a greater increase of 60 % is observed near the island and then gradually decreases in the landward direction (dotted blue line in Fig. 11a). Similarly, variations are highly concentrated near the tidal inlet in terms of cross-sectional sediment transport. A coefficient (rs) is also used to quantify the differences between cases.
where s is the sediment transport in other cases (m/s), s0i is the sediment transport of the reference case. Comparing the different curves, we can see that where the islands exist can lead to more significant sediment transport. Moreover, sediment transport more than 3 times that of the reference case is found in the IL case. However, other areas show minimal variations in the inner and outer basins (Fig. 11b). It is worth noting that due to the non-linear relationship between sediment transport and velocity, island-induced relative differences in sediment transport are much greater than flow velocity (Fig. 11).
4.1 How does the mouth island affect basin morphology?
The mouth islands affect the local hydrodynamics near the inlet and the sediment transport patterns, hence the long-term morphological evolution of tidal basins. Figure 12 shows the cross-sectional average velocity at the tidal inlet over one tidal cycle. Initially, the maximum flood and ebb velocity in the 0i case is nearly the same (about 0.58 m/s). When a mouth island is added, the tidal current velocity increases during the flood and the ebb. Tidal velocity increases with the increase in the number of islands (Fig. 12a). Concerning the different island locations, a larger flood and ebb velocity is observed in the BS case (Fig. 12a). After 300 years, tidal velocity in the 0i case decreases to about 0.5 m/s, while other cases show a more significant decrease. The tidal basin with larger numbers of islands also has a higher velocity (Fig. 12b). After 500 years, the tidal velocity shows a slight decrease in all cases, indicating that the systems are approaching morphodynamic equilibrium. The islands' role is similar to that of the bridge piles: they constrict the inlet and generate flow convergence; nevertheless this effect is dominant at the inlet.
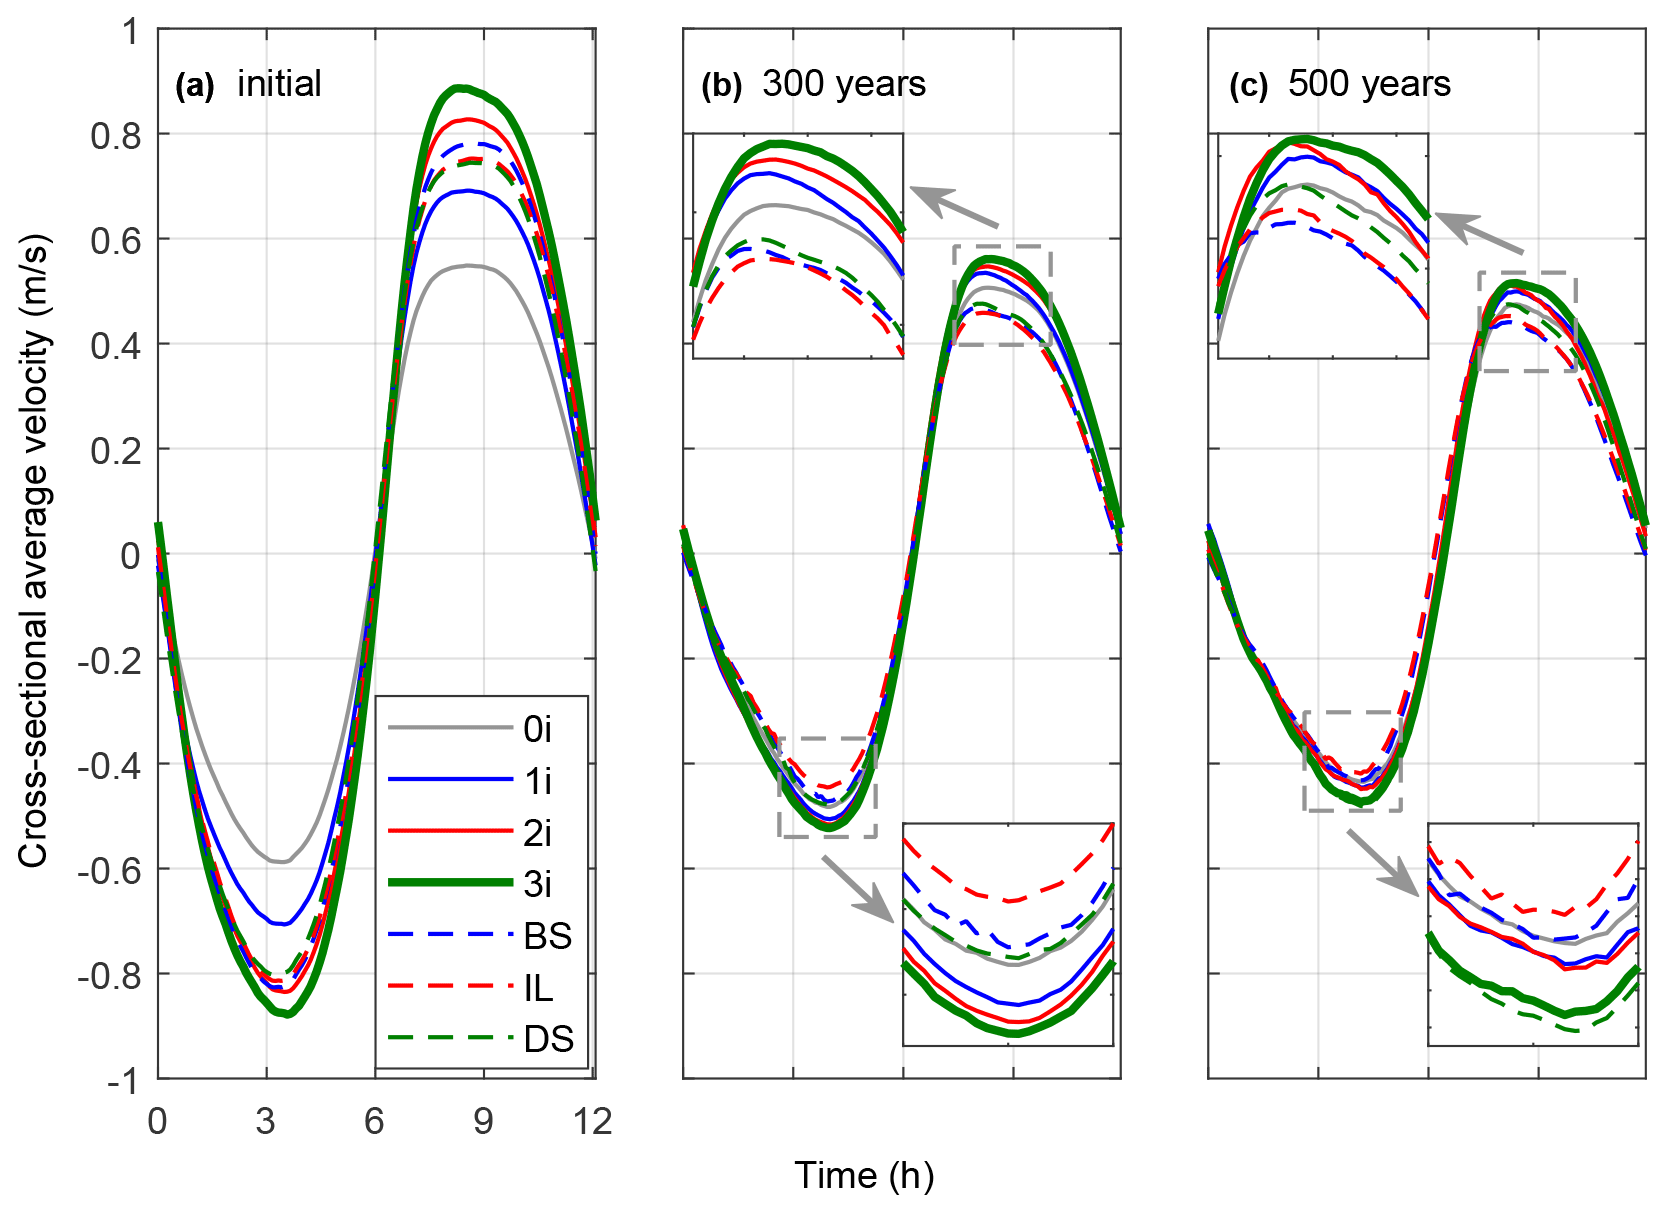
Figure 12The cross-sectional average velocity over a tidal cycle of different scenarios after (a) 0 years, (b) 300 years and (c) 500 years. The flood tidal velocity is positive.
The flow velocity at the inlet is affected by the various locations of mouth islands, thus affecting the sediment dynamics, and plays an essential role in morphological evolution. Figure 13 shows the development of different geological conditions in the tidal flat: intertidal storage volume (Vs), channel volume (Vc), the ratio of and a h. In this study, the tidal flat area is defined as the area between mean high water (MHW) and mean low water (MLW), Vs is defined as the water volume in the intertidal area, and Vc is defined as the water below MLW (Friedrichs and Aubrey, 1988). Regarding the tidal flat area, it is found that the tidal flat develops rapidly in the first 300 years (Fig. 13a). For case BS, the basin-side island contributes to the development of more tidal flats, which has the fastest development rate. After 300 years, the development of tidal flat slows down, and the tidal basin tends to become stable gradually (see also Fig. 4). But this does not mean that morphodynamic equilibrium is reached at the end of 300 years, because the intertidal storage volume and the channel volume are still developing and evolving (Fig. 13b–c). In terms of intertidal storage volume, a gradual decrease after 300 years, indicating the tidal flat is still developing (Fig. 13b). In contrast, the channel volume (Vc) shows a drastic decrease in the first 100 years and then continuously increases. Likely, the horizontal redistribution of sediment was mainly driven by the morphological evolution in the first 100 years, while the deepening of channels led to the continuous development of tidal flats and channel networks. The ratio of and a h indicates the tidal asymmetry condition of a tide-dominated system (Friedrichs and Aubrey, 1988). Overall, the a h ratio is small (< 0.3) for the three cases (Fig. 13d) and the ratio between and a h increases in the first 100 years and then gradually decreases. Following Friedrichs and Aubrey (1988), several modelling efforts suggest that the tidal systems were flood dominant (a h > 0.3) or ebb dominant (a h < 0.2), while the other key parameter Vs/Vc became crucial (0.2 < a h < 0.3). The a h value of the three cases is about 0.2–0.3 and the parameter is about 0.15–0.23, which suggests that the tidal basins are an ebb-dominated system. Model results also indicate that the effect of mouth islands is limited on the tidal asymmetry.
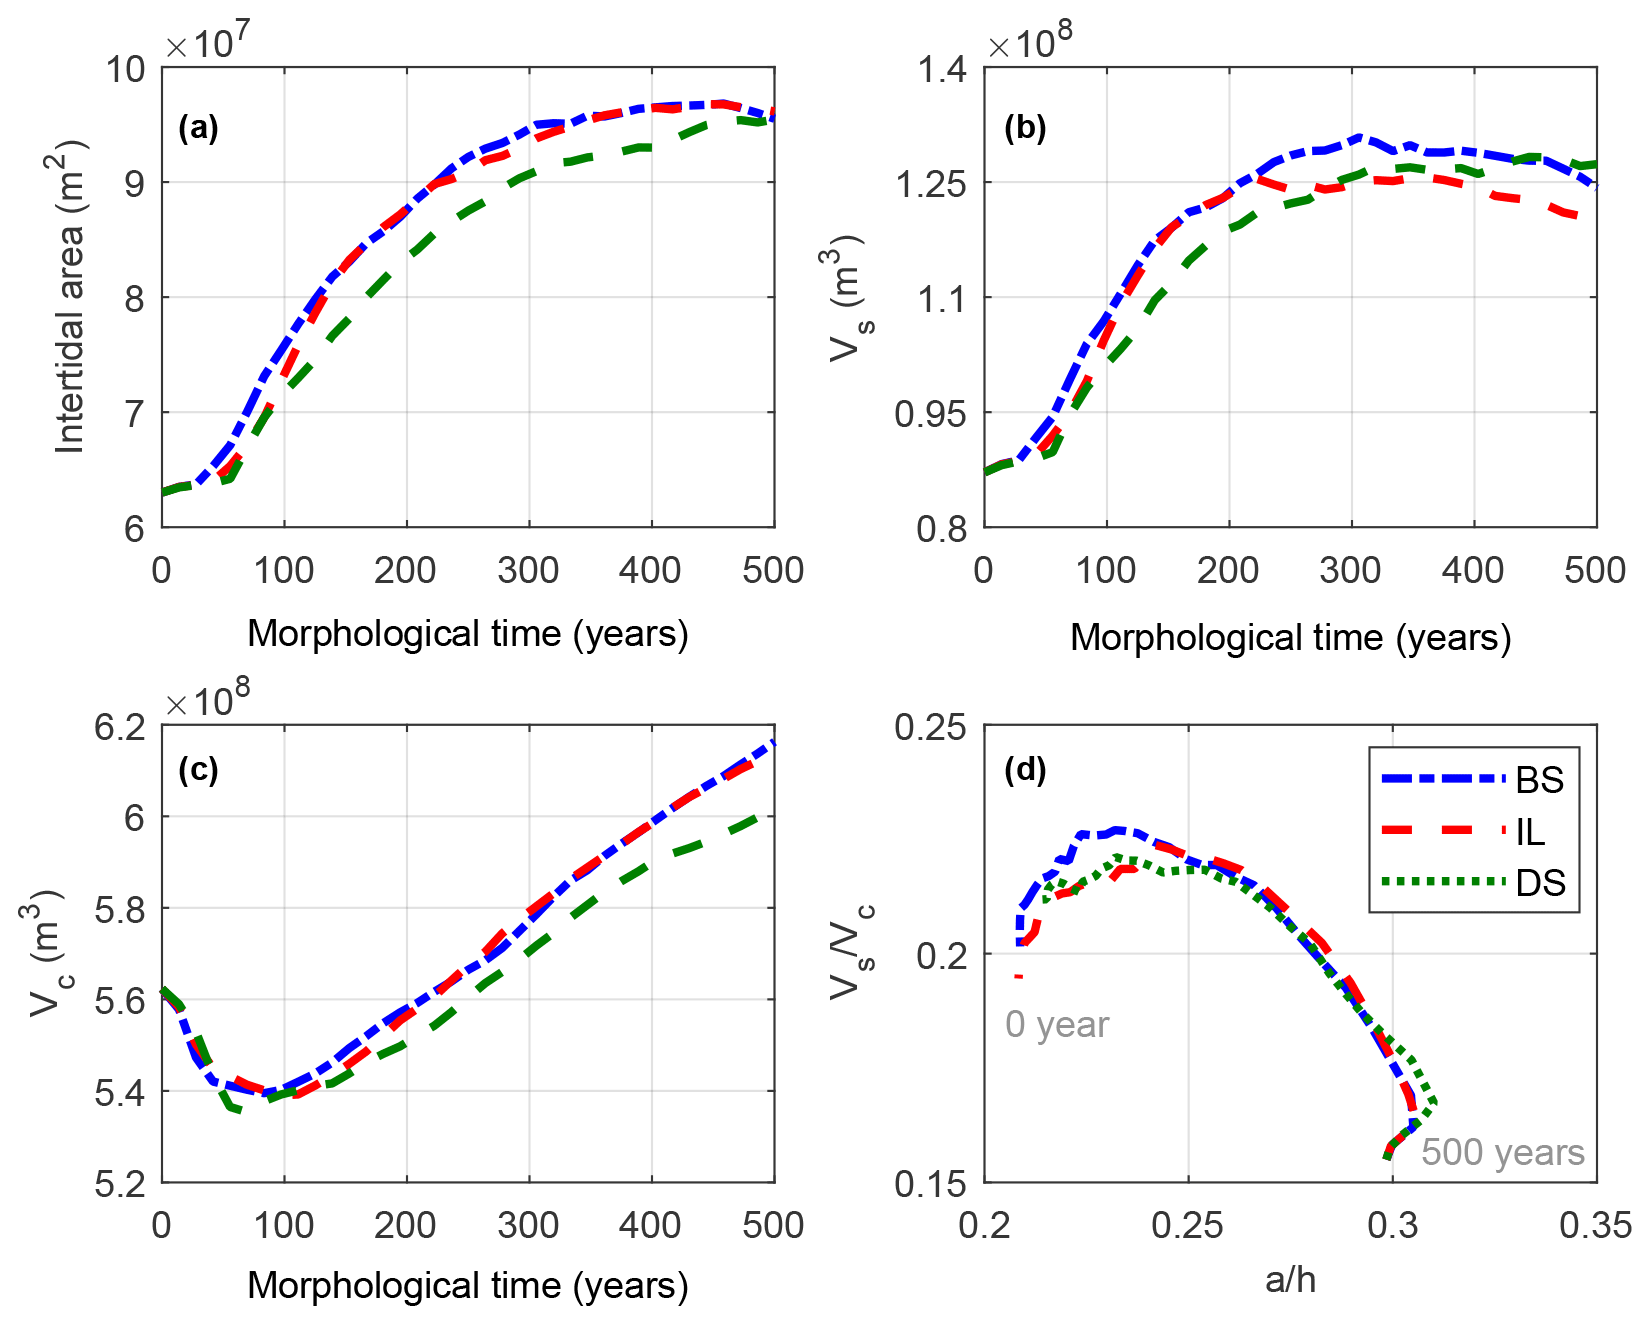
Figure 13Temporal variation of intertidal flat area (a), intertidal storage volume (b), channel volume (c) and the ratio of in the inner basin of different island locations.
The mouth islands also affect the sediment transport process and distribution. Figure 14 shows the results for cumulative erosion and sedimentation. All cases experience sedimentation in the ebb delta and erosion in the tidal basin (Fig. 14). If mouth islands are added, the inner basins face more significant erosion, because the islands produce larger flow velocities, resulting in more sediment transport. Consequently, the delta shows sediment deposition and the sedimentation volume increases continuously with the increase of mouth islands (Fig. 14a).
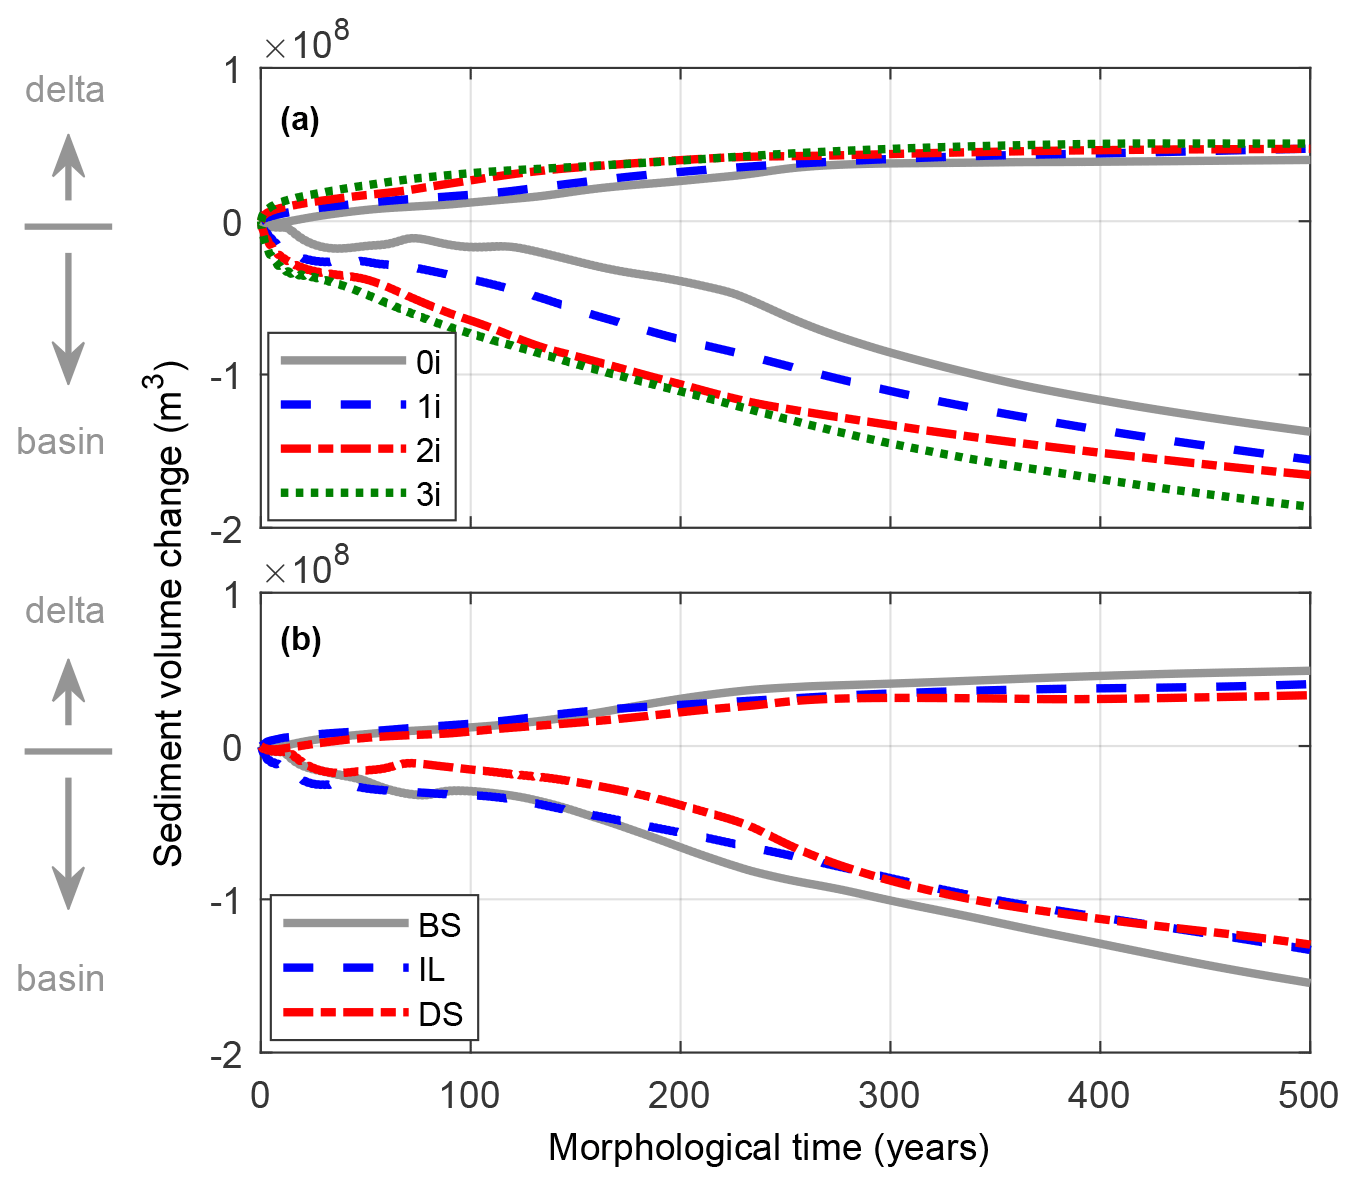
Figure 14Cumulative sediment volume change over time of different scenarios: (a) scenarios of the different mouth island numbers and (b) scenarios of different mouth island locations.
Regarding the cases that investigate the role of mouth island locations, results show that erosion occurs in the inner basin and sedimentation occurs in the delta (Fig. 14b). The case with a basin-side mouth island has a larger magnitude of erosion or sedimentation, indicating greater sediment suspension and transport in the basin. That is probably due to the fact that the mouth island at this location can facilitate and increase tidal flow into the basin, which plays a determining role in sediment transport and morphological evolution. For the delta-side island case, the sediment volume change is relatively small (Fig. 14b).
This study shows that although the residual currents have a landward direction in the initial bathymetry, the net sediment transport is seaward (Fig. 14). The river discharge is relatively small (50 m3/s), and the impact on residual current and residual sediment transport is therefore limited. A possible explanation can be provided in terms of the Stokes return flow that interacts with the tidal current generating larger residual sediment transport than residual current (Guo et al., 2014). A phase lag between the water levels and velocities induces a landward Stokes drift that causes a landward accumulation of water and momentum, resulting in a water level gradient (negative seaward) (van der Wegen and Roelvink, 2008; van der Wegen et al., 2008). This water level gradient induces a seaward return flow (Stokes return flow), enhancing the basin's ebb-dominant and exporting character.
4.2 Implications for realistic tidal basins
This study is inspired by the observations of two adjacent tidal basins (Massachusetts Bay and Plymouth Bay), but it has been highly simplified to gain direct knowledge of the mouth islands role. Numerical experiments demonstrate that the presence of mouth islands can significantly affect the local hydrodynamics and residual sediment transport, and thus influence channel–shoal morphology. However, in this work, all simulations result in the development of a dendritic channel network that does not seem to be able to capture the dichotomy shown in the comparison. It is suggested that mouth islands are only one of the determinative factors contributing to the basin morphology. It is therefore worth noting other potential effects that possibly lead to the different morphology. From a morphodynamic standpoint, initial bathymetry and tidal range play a significant role in channel network and intertidal area development (Dastgheib et al., 2008; Zhou et al., 2014a). Initial bathymetry influences the overall sediment availability, while tidal range affects the bed-level change by determining the amount of sediment that can be redistributed (van Maanen et al., 2013a). The average bathymetry in Massachusetts Bay is about 6 m (Signell and Butman, 1992), which is larger than 2 m in Plymouth Bay (Gontz et al., 2013). This shows that different amounts of sediment can be redistributed in the basins, which is one of the possible reasons accounting for the differences in morphology. Besides, the sedimentary environment is also different. Massachusetts Bay is a muddy environment, while Plymouth Bay is sandy (Ford, 2010). The sediment properties influence the final profile shape and vertical sediment distribution (Zhou et al., 2016), thus affecting the overall morphology. Also, Massachusetts Bay is an ebb-dominated system with stronger tidal currents (Knebel et al., 1991; Tubman, 2007), which may also result in the suspension and export of fine sediment. Finally, human activities have a major impact on basin morphology; for instance, waterway dredging in Massachusetts Bay can be one of the main factors attributed to the deeper watershed and over-deepened channel.
Regarding the role of mouth islands, some assumptions and simplifications were inevitably made in our numerical modelling, so the results are easier to interpret and gain insights. However, further research effort is needed to clarify some of the neglected mechanisms. (1) In this model, mouth islands are considered non-erodible and rectangular, while natural systems are erodible with irregular shapes. The erosion rate varies between different types of islands. Sandy islands can be completely destroyed and reformed over decadal timescales (Vousdoukas et al., 2020). Rocky islands can be eroded in a range of 0.01–0.1 Myr−1, which largely depends on mechanical wave action and rock strength (Andriani and Walsh, 2007). (2) While the model neglects the wave action, it may significantly influence the morphodynamic evolution of tidal basins, especially in the ebb delta. Nearshore waves can enhance alongshore sediment resuspension and drift, increasing seaward sediment transport, forming larger ebb deltas (Hayes, 1980; Fagherazzi and Wiberg, 2009). (3) Sea-level change is not considered, while it may play a remarkable role in the morphological evolution at the centennial and millennial timescales. Notably, some of the low islands may be submerged with sea-level rise. Existing studies suggest that the sediment transport pattern may shift from exporting to importing forced by sea-level rise (Dronkers et al., 1990; van der Wegen, 2013; van Maanen et al., 2013b). (4) Salt-tolerant vegetation (e.g. salt marshes and mangroves) play an important role in basin morphological evolution, which is not considered in this model. Several studies have indicated that vegetation can trap and stabilize sediment by decreasing the flow velocity (Townend et al., 2016; Chen et al., 2018). On the other hand, the sedimentary environment can also help vegetation grow, forming positive feedback between morphology and vegetation.
This experiment numerically investigates the long-term effects of the distribution and amount of mouth islands in a back-barrier tidal system. Results indicate that the flow velocity and residual currents increase with the number of islands, enhancing the sediment transport and bed-level change near the inlet. The basin tends to erode, while the ebb delta shows sedimentation, and the erosion/sedimentation volume increases with the number of mouth islands. The spatial distribution of mouth islands is also essential to determine the local channel–shoal morphology of the basin and the ebb delta. If a mouth island is located towards the inlet side, it enhances the ebb dominance of tidal currents and promotes erosion at the basin and deposition at the ebb delta. If a mouth island is located at the delta side near the inlet, it can directly hinder and divert the landward tidal current and decreases the basin morphological development. Results also suggest that the number and location of mouth islands can affect the empirical relation between the tidal prism and inlet cross-sectional area (the so-called P–A relation): the basin tidal prism increases with the number of islands; a basin-side island near the inlet also leads to larger tidal prisms than a delta-side island. The influence of mouth islands on local areas (e.g. tidal inlet) is solid but weak on the upstream estuary where river influence is dominant. Aspects that are not well reproduced appear to relate to processes that have been omitted (e.g. initial bathymetry and sediment composition) and would merit further investigation. Overall, this study shed light on the long-term morphodynamic effect of mouth islands, providing new insights into the evolution of this system.
The results are simulated using the open-source Delft3D software package (Delft3D-flow version 4.03.01) and the code is accessible through https://doi.org/10.5281/zenodo.5817721 (Deltares, 2013). The input files of the default model are available at Zenodo: https://doi.org/10.5281/zenodo.5508801 (Wei, 2021).
YW, ZZ and YC proposed the idea for this study. ZZ, QJ, ZG and CZ acquired the funding. YW built the numerical model, processed and analysed the data, and wrote the manuscript. ZZ, YC, PY, JQ, IT and GC provided logistical support and revised the manuscript. All authors were involved in reviewing and editing the manuscript, and gave final approval of the version to be published.
The contact author has declared that neither they nor their co-authors have any competing interests.
Publisher’s note: Copernicus Publications remains neutral with regard to jurisdictional claims in published maps and institutional affiliations.
The authors thank the reviewers for providing detailed and constructive feedback.
This research has been supported by the National Natural Science Foundation of China (NSFC, grant nos. 41976156, 51620105005, and 51925905), the Natural Science Foundation of Jiangsu Province (grant no. BK20200077), and the Fundamental Research Funds for the Central Universities (grant no. B210204022).
This paper was edited by Orencio Duran Vinent and reviewed by Zheng Bing Wang and two anonymous referees.
Andriani, G. F. and Walsh, N.: Rocky coast geomorphology and erosional processes: a case study along the Murgia coastline South of Bari, Apulia–SE Italy, Geomorphology, 87, 224–238, 2007.
Chen, F., Liu, W., Chen, R., Lin, R., Xu, Q., Chen, Y., Qiu, H., and Zhou, D.: Gulf records of China, Volume 8, Ocean Press, 310–343, ISBN 7502725954, 1993.
Chen, Y., Li, Y., Thompson, C., Wang, X., Cai, T., and Chang, Y.: Differential sediment trapping abilities of mangrove and saltmarsh vegetation in a subtropical estuary, Geomorphology, 318, 270–282, https://doi.org/10.1016/j.geomorph.2018.06.018, 2018.
Coco, G., Zhou, Z., van Maanen, B., Olabarrieta, M., Tinoco, R., and Townend, I.: Morphodynamics of tidal networks: Advances and challenges, Mar. Geol., 346, 1–16, https://doi.org/10.1016/j.margeo.2013.08.005, 2013.
D'Alpaos, A.: Tidal network ontogeny: Channel initiation and early development, J. Geophys. Res., 110, F02001, https://doi.org/10.1029/2004jf000182, 2005.
D'Alpaos, A., Lanzoni, S., Marani, M., and Rinaldo, A.: On the tidal prism–channel area relations, J. Geophys. Res., 115, F01003, https://doi.org/10.1029/2008jf001243, 2010.
Dastgheib, A., Roelvink, J. A., and Wang, Z. B.: Long-term process-based morphological modeling of the Marsdiep Tidal Basin, Mar. Geol., 256, 90–100, https://doi.org/10.1016/j.margeo.2008.10.003, 2008.
Deltares: Delft3D Source Code 5169, Zenodo [code], https://doi.org/10.5281/zenodo.5817721, 2013.
de Swart, H. E. and Zimmerman, J. T. F.: Morphodynamics of Tidal Inlet Systems, Annu. Rev. Fluid. Mech., 41, 203–229, https://doi.org/10.1146/annurev.fluid.010908.165159, 2009.
Dissanayake, D. M. P. K., Ranasinghe, R., and Roelvink, J. A.: The morphological response of large tidal inlet/basin systems to relative sea level rise, Climatic Change, 113, 253–276, https://doi.org/10.1007/s10584-012-0402-z, 2012.
Dronkers, J. J., Misdorp, R., and Spradley, J.: Strategies for adaptation to sea level rise, Technical Report, Intergovernmental Panel on Climate Change, available at: http://papers.risingsea.net/IPCC-1990-Strategies-for-Adaption-to-Sea-Level-Rise.html (last access: 22 September 2021), 1990.
Engelund, F. and Hansen, E.: A monograph on sediment transport in alluvial streams, Technical Report, Teknisk Forlag, available at: http://resolver.tudelft.nl/uuid:81101b08-04b5-4082-9121-861949c336c9 (last access: 30 September 2020), 1967.
Fagherazzi, S. and Wiberg, P. L.: Importance of wind conditions, fetch, and water levels on wave-generated shear stresses in shallow intertidal basins, J. Geophys. Res., 114, F03022, https://doi.org/10.1029/2008jf001139, 2009.
Feola, A., Belluco, E., D'Alpaos, A., Lanzoni, S., Marani, M., and Rinaldo, A.: A geomorphic study of lagoonal landforms, Water. Resour. Res., 41, W06019, https://doi.org/10.1029/2004wr003811, 2005.
FitzGerald, D. M.: Origin and Stability of Tidal Inlets in Massachusetts, edited by: Aubrey, D. G. and Giese, G. S., American Geophysical Union, 1–61, https://doi.org/10.1029/CE044p0001, 1993.
FitzGerald, D. M. and Miner, M. D.: Tidal Inlets and Lagoons along Siliciclastic Barrier Coasts, edited by: Shroder, J. F. and Sherman, D. J., Academic Press, 149–165, https://doi.org/10.1016/B978-0-12-374739-6.00278-5, 2013.
Ford, K. H.: Seafloor Sediment Composition in Massachusetts Determined Using Point Data, Technical Report, Massachusetts Division of Marine Fisheries, https://doi.org/10.13140/RG.2.2.23565.33766, 2010.
Friedrichs, C. T.: Stability shear stress and equilibrium cross-sectional geometry of sheltered tidal channels, J. Coastal. Res., 11, 1062–1074, 1995.
Friedrichs, C. T. and Aubrey, D. G.: Non-linear tidal distortion in shallow well-mixed estuaries: a synthesis, Estuar. Coast. Shelf. S., 27, 521–545, https://doi.org/10.1016/0272-7714(88)90082-0, 1988.
Gao, S.: P–A relationships of tidal inlets along the east china sea coast, Marine Sciences, 1, 15–19, 1988.
Gontz, A. M., Maio, C. V., and Rueda, L.: The Duxbury Sunken Forest-Constraints for Local, Late Holocene Environmental Changes Resulting from Marine Transgression, Duxbury Bay, Eastern Massachusetts, USA, J. Coastal Res., 29, 168–176, https://doi.org/10.2112/JCOASTRES-D-12-00183.1, 2013.
Guo, L., van der Wegen, M., Roelvink, J. A., and He, Q.: The role of river flow and tidal asymmetry on 1-D estuarine morphodynamics, J. Geophys. Res.-Earth, 119, 2315–2334, https://doi.org/10.1002/2014jf003110, 2014.
Guo, L., van der Wegen, M., Roelvink, D. J. A., Wang, Z. B., and He, Q.: Long-term, process-based morphodynamic modeling of a fluvio-deltaic system, part I: The role of river discharge, Cont. Shelf. Res., 109, 95–111, https://doi.org/10.1016/j.csr.2015.09.002, 2015.
Hayes, M. O.: General morphology and sediment patterns in tidal inlets, Sediment. Geol., 26, 139–156, https://doi.org/10.1016/0037-0738(80)90009-3, 1980.
Herrling, G. and Winter, C.: Morphological and sedimentological response of a mixed-energy barrier island tidal inlet to storm and fair-weather conditions, Earth Surf. Dynam., 2, 363–382, https://doi.org/10.5194/esurf-2-363-2014, 2014.
Jagoutz, O. and Behn, M. D.: Foundering of lower island-arc crust as an explanation for the origin of the continental Moho, Nature, 504, 131–134, https://doi.org/10.1038/nature12758, 2013.
Jarrett, J. T.: Tidal Prism – Inlet Area Relationships, GITI Report 3, U.S. Army Coastal Engineering Research Center and U.S. Army Waterways Experiment Station, available at: https://hdl.handle.net/11681/3226 (last access: 10 October 2020), 1976.
Jiang, M. and Meng, Z.: The Massachusetts Bay Hydrodynamic Model: 2005 Simulation, Technical Report, Massachusetts Water Resources Authority, available at: https://www.mwra.com/harbor/enquad/pdf/2008-12.pdf (last access: 25 September 2021), 2008.
Knebel, H. J., Rendigs, R. R., and Bothner, M. H.: Modern sedimentary environments in Boston Harbor, Massachusetts, J. Sediment. Petrol., 61, 791–804, https://doi.org/10.1306/D42677D5-2B26-11D7-8648000102C1865D, 1991.
Lanzoni, S. and Seminara, G.: Long-term evolution and morphodynamic equilibrium of tidal channels, J. Geophys. Res., 107, 3001–3001, https://doi.org/10.1029/2000jc000468, 2002.
Leonardi, N., Canestrelli, A., Sun, T., and Fagherazzi, S.: Effect of tides on mouth bar morphology and hydrodynamics, J. Geophys. Res.-Oceans., 118, 4169–4183, https://doi.org/10.1002/jgrc.20302, 2013.
Le Conte, L. J. and Harts, W. W.: Discussion of “Notes On the Improvement of River and Harbor Outlets In The United States”, T. Am. Soc. Civ. Eng., 55, 306–317, 1905.
Lesser, G. R., Roelvink, J. A., van Kester, J. A. T. M., and Stelling, G. S.: Development and validation of a three-dimensional morphological model, Coast. Eng., 51, 883–915, https://doi.org/10.1016/j.coastaleng.2004.07.014, 2004.
Marciano, R.: Modeling of channel patterns in short tidal basins, J. Geophys. Res., 110, F01001, https://doi.org/10.1029/2003jf000092, 2005.
Murray, A. B., Knaapen, M. A. F., Tal, M., and Kirwan, M. L.: Biomorphodynamics: Physical-biological feedbacks that shape landscapes, Water. Resour. Res., 44, W11301, https://doi.org/10.1029/2007wr006410, 2008.
Nahon, A., Bertin, X., Fortunato, A. B., and Oliveira, A.: Process-based 2DH morphodynamic modeling of tidal inlets: A comparison with empirical classifications and theories, Mar. Geol., 291–294, 1–11, https://doi.org/10.1016/j.margeo.2011.10.001, 2012.
O'Brien, M. P.: Estuary tidal prisms related to entrance areas, Civil. Eng., 1, 738–739, 1931.
Powell, M. A., Thieke, R. J., and Mehta, A. J.: Morphodynamic relationships for ebb and flood delta volumes at Florida's tidal entrances, Ocean Dynam., 56, 295–307, https://doi.org/10.1007/s10236-006-0064-3, 2006.
Ranasinghe, R., Swinkels, C., Luijendijk, A., Roelvink, D., Bosboom, J., Stive, M., and Walstra, D. J. C. E.: Morphodynamic upscaling with the MORFAC approach: Dependencies and sensitivities, Coast. Eng., 58, 806–811, https://doi.org/10.1016/j.coastaleng.2011.03.010, 2011.
Roelvink, J. A.: Coastal morphodynamic evolution techniques, Coast. Eng., 53, 277–287, https://doi.org/10.1016/j.coastaleng.2005.10.015, 2006.
Rosen, P. S. and Leach, K.: Sediment Accumulation Forms, Thompson Island, Boston Harbor, Massachusetts, in: Glaciated Coasts, edited by: Fitzgerald, D. M. and Rosen, P. S., Harcourt Brace Jovanovich, 233–250, 1987.
Savenije, H. H. G.: Salt intrusion in alluvial estuaries, in: Salinity and Tides in Alluvial Estuaries, edited by: Savenije, H. H. G, EIsevier, 137–184, https://doi.org/10.1016/B978-0-444-52107-1.X5000-X, 2005.
Signell, R. P. and Butman, B.: Modeling tidal exchange and dispersion in Boston Harbor, J. Geophys. Res.-Oceans, 97, 15591–15606, https://doi.org/10.1029/92JC01429, 1992.
Stefanon, L., Carniello, L., D Alpaos, A., and Lanzoni, S.: Experimental analysis of tidal network growth and development, Cont. Shelf. Res., 30, 950–962, https://doi.org/10.1016/j.csr.2009.08.018, 2010.
Townend, I.: An Examination of Empirical Stability Relationships for UK Estuaries, J. Coastal. Res., 215, 1042–1053, https://doi.org/10.2112/03-0066r.1, 2005.
Townend, I., Wang, Z. B., Stive, M., and Zhou, Z.: Development and Extension of An Aggregated Scale Model: Part 2-Extensions to ASMITA, China Ocean Engineering, 30, 651–670, https://doi.org/10.1007/s13344-016-0042-6, 2016.
Townend, I. H.: Hypsometry of estuaries, creeks and breached sea wall sites, P. I. Civil. Eng.-Mar. En., 161, 23–32, https://doi.org/10.1680/maen.2008.161.1.23, 2008.
Tubman, M. W.: Boston Harbor navigation channel improvement project, field data collection program final report, Technical Report, Coastal and Hydraulics Laboratory (U.S.), available at: https://hdl.handle.net/11681/7692 (last access: 25 September 2021), 2007.
van der Wegen, M.: Numerical modeling of the impact of sea level rise on tidal basin morphodynamics, J. Geophys. Res.-Earth., 118, 447–460, https://doi.org/10.1002/jgrf.20034, 2013.
van der Wegen, M. and Roelvink, J. A.: Long-term morphodynamic evolution of a tidal embayment using a two-dimensional, process-based model, J. Geophys. Res., 113, p. 16, https://doi.org/10.1029/2006jc003983, 2008.
van der Wegen, M. and Roelvink, J. A.: Reproduction of estuarine bathymetry by means of a process-based model: Western Scheldt case study, the Netherlands, Geomorphology, 179, 152–167, https://doi.org/10.1016/j.geomorph.2012.08.007, 2012.
van der Wegen, M., Wang, Z. B., Savenije, H. H. G., and Roelvink, J. A.: Long-term morphodynamic evolution and energy dissipation in a coastal plain, tidal embayment, J. Geophys. Res., 113, F03001, https://doi.org/10.1029/2007jf000898, 2008.
van der Wegen, M., Dastgheib, A., and Roelvink, J. A.: Morphodynamic modeling of tidal channel evolution in comparison to empirical PA relationship, Coast. Eng., 57, 827–837, https://doi.org/10.1016/j.coastaleng.2010.04.003, 2010.
van Maanen, B., Coco, G., and Bryan, K. R.: Modelling the effects of tidal range and initial bathymetry on the morphological evolution of tidal embayments, Geomorphology, 191, 23–34, https://doi.org/10.1016/j.geomorph.2013.02.023, 2013a.
van Maanen, B., Coco, G., Bryan, K. R., and Friedrichs, C. T.: Modeling the morphodynamic response of tidal embayments to sea-level rise, Ocean. Dynam., 63, 1249–1262, https://doi.org/10.1007/s10236-013-0649-6, 2013b.
Vivoni, E. R., Di Benedetto, F., Grimaldi, S., and Eltahir, E. A. B.: Hypsometric control on surface and subsurface runoff, Water. Resour. Res., 44, 181–198, https://doi.org/10.1029/2008wr006931, 2008.
Vousdoukas, M. I., Ranasinghe, R., Mentaschi, L., Plomaritis, T. A., Athanasiou, P., Luijendijk, A., and Feyen, L.: Sandy coastlines under threat of erosion, Nat. Clim. Change, 10, 260–263, https://doi.org/10.1038/s41558-020-0697-0, 2020.
Wang, Z. B., Hoekstra, P., Burchard, H., Ridderinkhof, H., De Swart, H. E., and Stive, M. J. F.: Morphodynamics of the Wadden Sea and its barrier island system, Ocean. Coast. Manage., 68, 39–57, https://doi.org/10.1016/j.ocecoaman.2011.12.022, 2012.
Webb, A. P. and Kench, P. S.: The dynamic response of reef islands to sea-level rise: Evidence from multi-decadal analysis of island change in the Central Pacific, Global. Planet. Change, 72, 234–246, https://doi.org/10.1016/j.gloplacha.2010.05.003, 2010.
Wei, Y.: The role of geological mouth islands on the morphodynamics of back-barrier tidal basins, Zenodo [data set], https://doi.org/10.5281/zenodo.5508801, 2021.
Zhou, Z., Coco, G., Jiménez, M., Olabarrieta, M., van der Wegen, M., and Townend, I.: Morphodynamics of river-influenced back-barrier tidal basins: The role of landscape and hydrodynamic settings, Water. Resour. Res., 50, 9514–9535, https://doi.org/10.1002/2014wr015891, 2014a.
Zhou, Z., Olabarrieta, M., Stefanon, L., D'Alpaos, A., Carniello, L., and Coco, G.: A comparative study of physical and numerical modeling of tidal network ontogeny, J. Geophys. Res.-Earth., 119, 892–912, https://doi.org/10.1002/2014jf003092, 2014b.
Zhou, Z., van der Wegen, M., Jagers, B., and Coco, G.: Modelling the role of self-weight consolidation on the morphodynamics of accretional mudflats, Environ. Modell. Softw., 76, 167–181, https://doi.org/10.1016/j.envsoft.2015.11.002, 2016.
Zhou, Z., Coco, G., Townend, I., Olabarrieta, M., van der Wegen, M., Gong, Z., D Alpaos, A., Gao, S., Jaffe, B. E., Gelfenbaum, G., He, Q., Wang, Y., Lanzoni, S., Wang, Z., Winterwerp, H., and Zhang, C.: Is “Morphodynamic Equilibrium” an oxymoron?, Earth-Sci. Rev., 165, 257–267, https://doi.org/10.1016/j.earscirev.2016.12.002, 2017.